fluorocarbon refrigerant management in selected asean...
TRANSCRIPT

Fluorocarbon Refrigerant Management in Selected ASEAN Countries: A
case study on refrigerant leakage and recovery potential rate
Shazwin Mat Taib1, Fatin Asyikin Alias2, Nurul Nazleatul Najiha M.N2, Mohd. Fadhil Md
Din1, Nurfarhain Mohamed Rusli3
1Department of Water and Environmental Engineering, School of Civil Engineering, Faculty
of Engineering, Universiti Teknologi Malaysia, 81310 Johor Bahru, Malaysia 2Postgraduate Student, School of Civil Engineering, Faculty of Engineering, Universiti
Teknologi Malaysia, 81310 Johor Bahru, Malaysia 3Centre of Lipids Engineering and Applied Research (CLEAR), Universiti Teknologi
Malaysia, 81310 Johor Bahru,
Corresponding Author’s
Email: [email protected], Tel: +60197090698 (mobile) Fax: +6075566157
ABSTRACT
In most ASEAN countries the focus of managing fluorinated gases is still lack compared to
other greenhouse gases (GHGs). Even though fluorinated gases share small amount of total
greenhouse gases (GHGs) emission, its potent and referred to as high global warming potential
(GWP) gases. As a basis for discussion, this study analysed trend of fluorocarbon refrigerant
management at regional level by cross-country analysis in Malaysia compared to neighbouring
Indonesia, Thailand and Vietnam. Focus group discussion and expert interview were conducted
with selected stakeholders. For case study, research scope assessing condition at consumption
level by monitoring refrigerant leakage rate during operation. The leakage rate and greenhouse
effect was determined by experimental evaluation on the Total Equivalent Warming Impact
(TEWI) for split-unit air conditioning systems. As on-site disposal handling option, estimation
for recovery potential rate was also conducted. Sample of R123 (HCFC) was collected from a
chiller unit and undergo reclamation process for reuse purpose hence reducing the possibilities
of improper wastage and leakage. At regional level, it can be concluded that these countries
shared common issue of low awareness level, no regulation imposed, less cross ministerial
among regulator, no proper collection and disposal facilities, lack financial support as well as
cost competitiveness. Meanwhile, from a case study shown that total direct and indirect
emission is predicted to release 350,473.52 t eq CO2/year. From the impurity test, results
indicated that 79.21% of R123 sample was reclaimable, which could reduce the negative
impact on the environment if being recovered accordingly.
Keywords: Ozone Depletion Substances (ODS), Global Warming Potential (GWP),
Refrigerant Leakage, Direct and Indirect Carbon Released, Cross-Country Analysis

Introduction
Fluorinated gases chlorofluorocarbons (CFCs) and hydro chlorofluorocarbons
(HCFCs) is a key role in ozone layer depletion and global warming (Wang, C et al., 2014).
This compound act as ozone depleting substance (ODS) due to the releasing free chlorine atom
into atmosphere and initiate catalytic cycles (Wu et al., 2013). Nowadays, HCFC-22 (R22)
which act as substituted of CFC, is widely use as refrigerant in air conditioners, industrial and
commercial refrigeration, fire extinguishing, manufacturing of foams and cleaning solvents
(Aggarwal et al., 2013). However, this refrigerant contained an ozone depletion potential
(ODP) 0.04 and also global warming potential (GWP) 1780 for 100 years (Li et al., 2016)
hence highly important to manage it in sound manner. The abundance of fluorocarbons in
atmosphere are control under the Montreal Protocol through phasing out ozone depleting
substances (ODS) that caused CFCs usage were banned, HCFCs consumption being control
and substitution cooling refrigerants for hydrofluorocarbon (HFCs) as well as natural gases.
The Montreal Protocol has been hailed as successful environmental convention that led to
regeneration of ozone layer and resulted significant reduction in GHGs emission. Thus moving
forward, important future milestones are the 10% reduction of HCFC consumption in 2015 and
the 35% reduction target in 2020. The GWP of greenhouse gases (GHG) that have a very long
atmospheric lifetime is the index describing its relative ability to collect radiant energy in
comparison to CO2, ozone depletion potential (ODP) will be zero if the refrigerants are selected
with reduced GWP (Sarbu, 2014). Therefore, in order to determine the suitability of refrigerant,
the estimation, and calculation of the relative GHG emissions are considered to be important
and can serve to be an as important reference (Zhao et al., 2015).
Figure 1 Market using HFCs, % of tonnes CO2e in 2012 (UNEP Ozone Secretariat., 2015)
Fluorinated gases are very heterogeneous category with large difference in growth rates
and often very large uncertainties in emission thus lead to share of fluorinated gases emission
is about 3% globally, and show the highest growth rate in 2016 (3.8%) with largest sub-
categories are HFC-134a from refrigeration and air conditioning (about 19%), HFC-125 and
HFC-143a from consumption (17% and 19%) and HFC-23 which is by-product of the
production of HCFC-22 (19%) (J.G.J Olivier et al., 2017). Main end uses of HFCs shown in
Figure 1. High domination usage in air conditioning sector (56%), where 45% of global HFC
emission in 2012 were dominated by air-to-air air conditioning system. While in developing
countries demand for refrigerant and blowing agents is expected to increase three times by

2030 due to economic growth (Zeiger et al., 2014, The Linde Group, 2015). Table 1 shows that
summarizes on the demands of air conditioners in Malaysia, Indonesia, Thailand and Vietnam.
All of these countries are referred under A5 Parties - Group 1 subjected under Kigali
Amendment to the Montreal Protocol. As a sign of supporting the implementation of HPMPs
at the national level which to accelerate the HCFCs to be phase-out, the country under the A5
Parties - Group 1 received assistance from UN Environment, the United Nations Development
Programme (UNDP), the United Nations Industrial Development Organization (UNIDO), the
World Bank, and the Multilateral Fund (MLF) in various areas.
Table 1: Details of room AC demand and refrigerant used in 2015 (Shah et al., 2017)
Country
Room AC Demand (thousand
units) Refrigerant
2010 2015
World Total 73,420 79,389 R-22 dominant
(Other Asia Total)
Malaysia 751 789 R-22 dominant,
R-32 (starting)
Indonesia 1493 2109 R-22, R-410A,
R-32 (~33%)
Thailand 957 1268 R-22,
R-32 (~50%)
Vietnam 670 1546 R-22 (~60%),
R-32 (~20%)
In Malaysia, consumption of HCFCs are expected to be completely phase-out by 2030
as required by the Malaysian Government (DOE, 2012). An outlines the overall framework
and strategies of implementation from the national HPMP has set up to achieve the objective
of the plan and the plan details actions to be taken to phase-out the use of HCFCs in all sectors,
namely in refrigeration, foam, air conditioning, fire-fighting and solvents (Vitooraporn, 2009).
The production and consumption of HCFCs are under the Government plan to be freeze from
January 1, 2013 to achieve a 10 percent gas reduction by 2015 with zero consumption in CFCs
by 2010 (DOE, 2012). To provide technical assistance to locally manufacturing companies has
been viewed as a necessity by the Government of Malaysia to ensure that they are adequately
supported in managing HCFC and non-HCFC technologies (DOE, 2018a). Meanwhile in
Indonesia, to use R-32 (HFC) as an alternative to R-22 (HCFC) is a decision made by the
Government of Indonesia with the support from United Nations Development Program
(UNDP), the government also plans to promote the use of R-32 (HFC) for refrigerant
conversion (Harman and A. Hamarung, 2017). Referring to the Indonesia Government’s Plan,
a policy of phasing out R-22 (HCFC) in air-conditioning and refrigeration by the year 2015
will see Indonesia completely convert to R-32 (HFC) by the year 2015. As for this reason,

regulatory measures are being strategies. Approach taken by Thailand lead by The Royal Thai
Government by Department of Industrial Work (DIW) has establish Control ODSs as
Hazardous Substance and set up ODS Phase-out guidelines for industrial sectors to comply
with the Montreal Protocol. DIW has announced the guideline for importing HCFC in the year
2012 by stating that any import activity of R-22 (HCFC) will be controlled in the year 2013-
2014. However, in Vietnam, no regulation on air conditioners using HCFCs has been
implemented yet, and starting with the Decree 80/2006 in 2006 until various Decrees in 2011,
Vietnam has put in place a legal framework to promote energy efficiency with mandatory
minimum energy performance standards (MEPS) MEPS for residential ACs.
There is potential in using traceable collection of refrigerants in the process of reducing
resources consumption which would in turn reduces the environmental impacts and results due
to climate change. Hence this would also allow us to handle used refrigerant effectively without
harming the environment. Many research has focused on the rapidly increasing GHG emissions
resulting from the leakage of refrigerants globally (Yuan et al., 2018). Leakage is essentially
defined as any unwanted or unwanted opening in any closed medium that contains some fluid
and allows the opening to escape (Mehboob et al., 2018). The leakage happens mainly at the
point of joints, welded or brazed joints and cracked surfaces (Elbel and Lawrence, 2018).
Figure 2: Controlling refrigerant leakage by phases and GHG effects
Leakage also has a significant environmental impact as shown in Figure 2. Refrigerants
contribute to GHG emission during various product flow handling, maintenance and disposal.
There are two key environmental impact areas which is direct leakage means emission into the
atmosphere of refrigerant gasses that can cause ozone depletion and contribute to global
warming; and indirect leakage when refrigeration and air conditioning systems consume energy

that increases emissions of CO2 and contributes to global warming (The Linde Group, 2019).
Refrigerant losses contribute to global warming both directly and indirectly through inefficient
system operation, increased energy consumption and greenhouse gas emissions, and
significantly increased maintenance costs (Tassou and Grace, 2005).
The method of handling fluorocarbons (FCs) substance is also crucial because improper
handling will certainly lead to leakage, breakdown of ACs and release of carbon into the
atmosphere. The proper handling method includes the collection of disposed e-waste, which
contains FCs such as refrigerator, chiller system, vending machine, including the refrigerant
extraction process from the air-conditioning system. Traditionally, e-waste is collected and
being stored in a facility to be dismantled and precious metal is extracted from the waste. This
process, however, does not include proper extraction of FCs and are usually being released by
the contractor into the atmosphere. The extracted FCs are stored in a container by some
contractors and being left without proper management. The container would decay in the long
run due to rust formation and will cause leakage. Through reclamation, the substance can be
reused onto the chiller system, hence reducing the possibilities of improper wastage and
leakage (UNEP, 2015). This can minimize direct and indirect emissions during the disposal of
refrigerants and also the production of new refrigerants, thus reducing energy usage during the
production, which can slightly improve energy consumption during recycling and disposal
operations (Zhao et al., 2015).
2. Materials and Methods
2.1 Fluorocarbon refrigerant management at regional level
The focus of the initial discussion was to obtain an overview of the common practices
and availability of the data needed for this study. The individual approach and focus group
discussion (FGD) practices was carried out in 2016, in series of visit from August to November
2016. The objectives of this study and way forward are then being explained to all stakeholders.
This includes measures to accelerate both the technology diffusion of energy-efficient
equipment using low-GWP/natural refrigerants and proper treatment system of FCs from used
refrigerants prior to disposal including regulation required to comply and future plans in
accordance to each country plan and requirements. All these stakeholders are an expert group
which is particularly good and expert with knowledge related to this research, as summarised
in Table 2. This method used in this studies was interviewing and documents review to ensure
respondents understand on related issues and it provides better access for exploring sensitive
issues.
Table 2: Respondents from cross-country analysis
Stakeholders Numbers Details
Government
Officers
19
(Departments/Offices)
National ozone units and their supervisory
authorities, energy efficiency-related
departments, waste regulators, standards
department, training institute

Academia 8 Universities Specialists in policies and technologies for
refrigerants and wastes
Association &
Institutes
14 entities Equipment manufacturers,
servicing/maintenance technicians, waste
operators, green buildings
Private
Companies
11 companies Equipment manufacturers, gas traders, waste
handlers, recycling and transportation
companies, FCs destruction (industrial waste
treatment) operators
Others 5 entities UNEP, UNDP, JICA
2.2 Direct and indirect emission during operation at consumption level
As case study, data collection is being carried out in one of Higher Education Institutes
(HEIs) in Malaysia, Universiti Teknologi Malaysia. Main secondary data was provided by
Universiti Teknologi Malaysia Office of Asset and Development (UTM OAD) for the year
2016. UTM OAD appoints contractors in order to provide air-conditioning systems and
refrigerants for refilling existing air-conditioning system. To cover 1,177 hectares of UTM,
UTM OAD has divided four zone and divided each zone with a different contractor responsible
for doing work and recording maintenance work. In addition, contractors who have been
appointed by UTM are responsible to install air-conditioning unit, change or transfer air-
conditioning, and recharge refrigerant into air-conditioning. Therefore, maintenance of
monthly work records is vital for this study because the intake reflects the amount of refrigerant
being purchased and also used. Related data was collected focused on the usage of R-22
(HCFC) and R-410A (HFC) refrigerants on four different maintenance zoning areas inside the
campus. Data amount of refrigerant purchased and recharged into the split unit air-conditioning
system were obtained from appointed contractors to refill existing air-conditioning system.
Accordingly, basic inventory information needed is a type of air-conditioning, the model of
each air-conditioning, capacity, quantity, air-conditioning life span and type of refrigerant used.
Figure 3 shows complete data required, it makes it easier to take the next step of direct and
indirect carbon emission calculations.
Total Equivalent Warming Impact (TEWI) is a standardised method of calculating
global warming impact of refrigeration equipment and system that focusing on the total related
emissions of greenhouse gases during the operation of the equipment and disposal of the
operating fluids at end-of-life. This method of calculating TEWI is dedicated for new air
conditioning system and stationary refrigeration systems that operate using vapour
compression principles and powered using main electricity connected to the grid. The main
aim of this method is to provide predictive estimation for TEWI values on new systems.
However, sensitivity analysis is recommended to calculate lower and upper threshold TEWI
values. Method of calculating TEWI is provided as in Equation 1.

Figure 3: Inventory data for direct and indirect emission
2.2.1 Direct emission
The is four main types of direct emissions from air-conditioning system where it is due
to losses during plant service and maintenance, gradual leaks during normal operation,
catastrophic losses during normal operation and losses at the end of plant life. Global Warming
Potential (GWP) values for refrigerant used was adapted from the assessment report has been
published by The Intergovernmental Panel on Climate Change (IPCC) that review current
climate science and assess impacts on the human and natural landscape published in 2013.
Table 3, includes the 100-year time horizon GWP relative to CO2. This table is adapted from
the IPCC. The AR5 values are the most recent, but other values are also listed because
sometimes used for inventory and reporting purposes (Drouet et al., 2015).
The class of equipment, refrigerant type, equipment design, operating condition and
workmanship during installation vary the annual leak rates (Andersen et al., 2013). The annual
leak rate is considered as catastrophic losses amortized over life of the equipment, the sum of
gradual leakage and losses during service and maintenance expressed as a percentage of initial
charge per annum (AIRAH, 2012). Annual emission rates are estimated between 7% and 12%
in most of the A5 countries based on UNEP, the Technology and Economic Assessment Panel
(TEAP) throughout report in 2010. The original refrigerant charge of the system. For stable
unit operation, the charge existing in the refrigeration system is fulfilling the required charge
for stable operation for unit and all possible operating conditions. The minimum charge
required for the refrigeration system is not only depending on the design of the unit, but also
on the operating conditions (IPCC, 2014). The operating system of life for refrigerant is the
useful life expectancy for a refrigeration (capital) equipment. The period of use in service is
consider a product's system operating life which in this case focusing on a refrigeration system.
It is constantly defined as the period if any particular product being used from the point of
purchase or assembled to the point of discard.

Table 3: Global Warming Potential (GWP) values relative to CO2
Substance GWP Values for 100-year time horizon
Chemical
Formula
Second
Assessment
Report (SAR)
Fourth
Assessment
Report (AR4)
Fifth
Assessment
Report (AR5)
Carbon dioxide CO2 1 1 1
Methane CH4 21 25 28
HCFC- 22 (R-22) CHCLF2 1500 1810 1760
HFC-32 (R-32) CH2F2 650 675 677
*AR – Assessment Report (IPCC, 2013)
2.2.2 Indirect Emission
The emission factor of CO2 or sometimes referred to as an indirect emission is referred
to as average emission intensity of total electric sector generation for the region. The quantity
of carbon release per kWh of electricity supplied is based on the fuel mix in electric generation.
If it is generated from a coal fired power station, the figure would be higher compared to gas-
fired stations, hydroelectric, wind power or solar. For the calculation of data indirect emission,
GWP, refrigerant charge, recovery / recycling factor, energy consumption per year, indirect
emission factor, and system operating life are required. Removal of refrigerant from a system
and its storage in an external container. Refrigerant recovery refers to the process of extracting
used refrigerant from a refrigeration system and undergo specific process to enable the
refrigerant to be useable hence allowing the recovered refrigerant to be reusable by inserting
back into the same refrigerating system. In specific, the term refrigerant recovery rates bring
the definition of the percentage of refrigerant that could be recovered from a system which has
not been contaminated after undergoing the recovery process. According to IPCC, the best
practice guidelines for refrigerant recovery rate from a system with a refrigerant charge greater
than 100 kg would be expected to be 90% to 95% of the remaining charge, and around 70%
for equipment with smaller charges. Guideline recommends the use of a refrigerant recovery
rate of 70% of the original charge for systems with a refrigerant charge. Energy consumption
of the system per annum refer to the amount of energy consumption by a certain system to
ensure that the system is able to function efficiently throughout a year. This energy focuses on
electrical energy as it is the main source of energy for any refrigeration system. The indirect
emission factor of CO2 is defined as the mass of CO2 emitted by the power generation per kWh
of electrical power supplied to the refrigeration installation that losses of efficiency in
generation and distribution (Units: kg CO2/kWh). For Malaysia, the global average emission
factor for grid electricity is around 0.73 kg CO2/kWh (H. Clark, 2013).
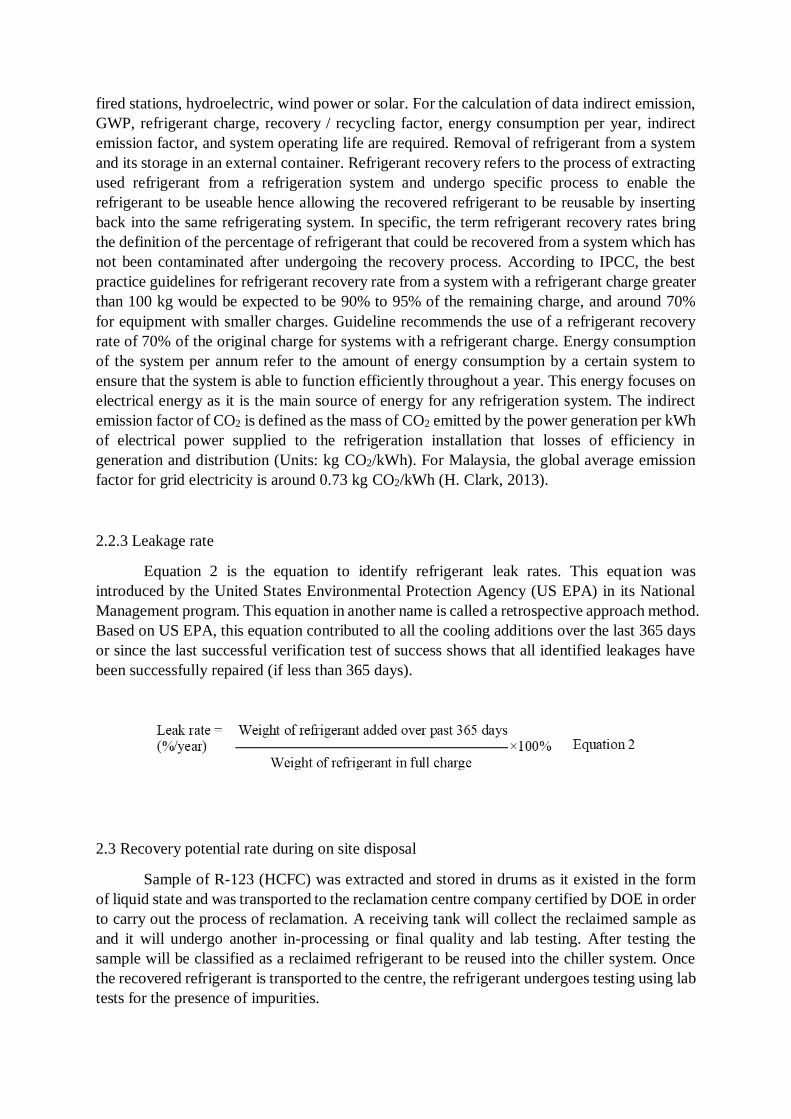
2.2.3 Leakage rate
Equation 2 is the equation to identify refrigerant leak rates. This equation was
introduced by the United States Environmental Protection Agency (US EPA) in its National
Management program. This equation in another name is called a retrospective approach method.
Based on US EPA, this equation contributed to all the cooling additions over the last 365 days
or since the last successful verification test of success shows that all identified leakages have
been successfully repaired (if less than 365 days).
2.3 Recovery potential rate during on site disposal
Sample of R-123 (HCFC) was extracted and stored in drums as it existed in the form
of liquid state and was transported to the reclamation centre company certified by DOE in order
to carry out the process of reclamation. A receiving tank will collect the reclaimed sample as
and it will undergo another in-processing or final quality and lab testing. After testing the
sample will be classified as a reclaimed refrigerant to be reused into the chiller system. Once
the recovered refrigerant is transported to the centre, the refrigerant undergoes testing using lab
tests for the presence of impurities.

2.3.1 Reclamation process
Chemical analysis will be required to determine that appropriate product specification
are met. The reclamation process is involving the recovery and substantial reprocessing of
refrigerant to virgin specifications as standardised by industry because specialised machinery
is required because reclamation does not occur on-site (AHRI, 2016). The contamination
includes the presence of solids, high boiling residues, moisture, acidity, chlorine and non-
condensable gases. There is an estimated loss of recoverable gases whereby it is estimated only
70% of the recovered gas can be regenerated by filtering and distillation. This is due to the 30%
degradation of fluid characteristic that is not allowable for reuse. It is also proving that 1% of
the fluid is emitted to the atmosphere during the reclamation procedure, 1% is comprised of
impurities (Cascini et al., 2016)
Table 4: The refrigerant testing according to AHRI Standard 700
No. Item for analysis Specification
1 Water content, ppm by weight 20 ppm max
2 High boiling point residue, wt % 0.01% max
3 Impurities, wt% 0.5% max
4 Acidity, ppm 1 ppm max
5 Chloride No visible turbidity
6 Particulate /solids Visually clean
The used refrigerants should be tested as to verify that it has attained AHRI 700 or ISO
12810, or equivalent specification prior to resale as required by the U.S. Environmental
Protection Agency (EPA) (Damodaran and Donahue, 2010). The specification listed in Table
4 is compulsory under AHRI 700 standards and it must be taken into account to determine if
the sample could be reclaimable. Non-reclaimable refrigerants must be disposed in sustainable
way for environment and in accordance with the applicable regulations (Baxter et al., 2016).
3. Results & Discussion
3.1 Fluorocarbon refrigerant management at regional level
The data collected concluded that there are seven main common issues among all four
assessed countries Malaysia, Indonesia, Thailand and Vietnam. Level of awareness among
users and relevant sectors are still very low. Households, commercial and industrial users are
not aware of the importance of proper treatment of FCs. Energy sector people are not aware
that GHG emission reduction achieved from energy savings may become net GHG emissions
with FC leakage; while very few companies treat their used FCs due to lack of regulations
specifically requiring the proper management of the FCS. There is also no regulation yet to be
introduced to mandate the FC recovery from used equipment contained FCs in all four

countries even though they have already introduced or to be put into effect a ban for
manufacturing or importing new equipment using R22 refrigerant or importing R22 refrigerant
with an exception for serving existing equipment. Another important point of governance is
less cross-ministerial and departmental discussion among regulators that can be a platform to
raise the issue of proper treatment of FCs. At operation level, similar trend was observed in
collection and transportation issues of FCs for used equipment of home appliances.
Commercial and industrial sectors can voluntarily request their servicing/maintenance
companies to collect the refrigerants, but not household users. For the household sector,
managing and monitoring collection and proper treatment of FCs become challenging due to
the presence of informal sector. These countries also facing difficulty in reclaiming recovered
FCs due to illegal mixing of refrigerants that may affect the purity of used FCs. Meanwhile,
from economic aspect observation, there is lack in financial support available for installing
destruction facilities. Only one destruction facility exists in each country, but the countries may
need more to reduce overall costs (destruction cost + transportation cost). The Montreal
Protocol’s fund covers costs for purchasing recovery machines and reclamation equipment, but
not covering the installation cost for a destruction facility. Issues on cost arise when there is no
clear mechanism on payer responsibility for collection and transportation costs due to lack of
regulations. High transportation cost of used FCs as many countries classify them as hazardous
wastes (except for Malaysia). Less competitive on virgin FCs cost that are too cheap make it
difficult to have consensus framework to cover handling cost of used FCs in near future if no
incentive on reclaimed FCs being imposed.
3.2 Usage of refrigerant type and emission comparison by zone
Referring to Table 5, it shows the 6,651 total of split unit air conditioning system inside
Universiti Teknologi Malaysia (UTM). There is about 4,261 units (64.1%) are using R-22
(HCFC) and 2,390 (35.9%) are using R-410A (HFC). The number of percentages still using R-
22 (HCFC) are big. As could be observed, Zone 1 contained the highest number of R-22
(HCFC) and R-410A (HFC) which total in 2,399 split unit system. Zone 2 703 unit (55.4%)
using R-22 (HCFC) 566 unit (44.6%) using R-410A (HFC). Zone 3 1,380 unit (71.9%) using
R-22 (HCFC) 538 unit (28.1%) using R-410A (HFC). The lease total amounts of split unit air-
conditioning system are located at Zone 4 with the total of 1,065 comprising of 766 units
(71.9%) and 299 units (28.1%) using R-22 (HCFC) and R-410A (HFC) respectively.
Table 5 Split unit air-conditioning by zone in Universiti Teknologi Malaysia
R-22 (HCFC) R-410A (HFC) TOTAL
Zone 1 1,412 987 2,399
Zone 2 703 566 1,269
Zone 3 1,380 538 1,918
Zone 4 766 299 1,065
TOTAL 4,261 2,390 6,651

The different between Zone 1 and Zone 4 are the usage and number of offices in that area. Zone
1 is denser in terms of air conditioning system and Zone 4 is located in a more recent
development phase. Table 5 shows the calculated direct and indirect carbon emission from both
R-22 (HCFC) and R-410A (HFC) for all four zones. Due to the high usage of refrigerant at
Zone 1, hence it contributes to a higher amount of indirect and direct carbon release. As for R-
410A (HFC), it is known that this refrigerant contribute to a much higher direct carbon release.
Table 6 Comparison of the for two type of refrigerants
Zone 1 Zone 2
R-22 R-410A R-22 R-410A
Direct emission (t eq CO2/year) 1,789.0 38,987.5 893.7 22,357.6
Indirect emission (t eq CO2/year) 55,484.0 33,796.7 27,550.1 19,601.9
Zone 3 Zone 4
R-22 R-410A R-22 R-410A
Direct emission (t eq CO2/year) 1,748.5 21,251.5 1,552.8 11,228.5
Indirect emission (t eq CO2/year) 54,128.5 15,291.4 29,297.5 15,514.3
3.2.1 Direct emission
Table 6 also shows that Zone 1 has a high direct emission compared to Zone 2, Zone 3
and Zone 4. This is also closely related to the number of air-conditioning units available in
each zone. Table 6 shows that Zone 1 has a high number of air-conditioning units. For units
using refrigerant R-22 (HCFC) are 1,412 units while those using R-410A (HFC) are 987 units.
Although the number using refrigerant R-22 (HCFC) is higher, the direct emission amount is
lower than the unit that used the R-410A (HFC) unit which is 1,789.0 t eq CO2/year. As seen
in Zone 1 has 987 units of air-conditioning and the amount of direct emission is 38,987.5 t eq
CO2/year. Zone 2 has 566 units of air-conditioning, Zone 3 has 538 units while Zone 4 has 299
units and it shows direct emissions 22,357.6 t eq CO2/year, 21,251.5 t eq CO2/year and 11,228.5
t eq CO2/year respectively. In Zone 2, Zone 3 and Zone 4 can also be seen value direct emission
for R-22 (HCFC) lower than R-410A (HFC). This is cause by the GWP for R-410A (HFC) is
higher compared to R-22 (HCFC) which is 2,090 and 1,810 respectively. R-410A (HFC) does
not contain the ozone depleting potential. In addition, it was calculated that the total direct
emissions for R-22 (HCFC) was 5,984 t eq CO2/year and for R-410A (HFC) was 93,825.1 t eq
CO2/year. Then, the total overall in the UTM was 99,809.1 t eq CO2/year. This means that the
air-conditioning systems that contribute direct high emission is R-410A (HFC) which is about
94% and R-22 (HCFC) only contribute 6%.
3.2.2 Indirect emission
In Table 6 shows that Zone 1 has a high indirect emission compared to Zone 2, Zone 3
and Zone 4 as Zone 1 has a high number of air-conditioning units. In UTM the total amount of
indirect emission is 250,664.4 t eq CO2/year with 6,651 units of air-conditioning. For

refrigerant using R-22 (HCFC) are 4,261 units while R-410A (HFC) are 2,390 units which
contribute 166,460.1 t eq CO2/year, 84,204.3 t eq CO2/year respectively. For indirect emission
is related to emission of greenhouse gases associated with the electricity usage (Islam et al.,
2017). Therefore, the TEWI will be greatly influenced by the performance of the cooling
system energy consumption data, influenced by the efficiency of the system. Hence, the less
energy required to produce each cooling kW, less will affect global warming.
3.2.3 Total Equivalent Warming Impact (TEWI)
TEWI provides a measure of the environmental impact of greenhouse gases from operation,
services and final disposal of equipment (R. Sand et al., 1997). Direct emission and indirect
emission have been combined to obtain the TEWI illustrated in Figure 4.
Figure 4: TEWI for various zone inside UTM
Evidently, Figure 4 shows the Total Equivalent Warming Impact (TEWI) in respective zoning
area combining both direct and indirect release of R-22 (HCFC) and R-410A (HFC). For all
four zoning area, indirect carbon emission contributes the most in carbon emission compared
to direct carbon emission. In the graph in Figure 4, the total number of TEWI shows the largest
value is in Zone 1 of 130,057.14 t eq CO2/year followed by Zone 3, Zone 2 and Zone 4 of
92,419.94 t eq CO2/year, 70,403.32 t eq CO2/year and 57,593.12 t eq CO2/year respectively.
Hence, the total direct and indirect emission in UTM is 350,473.52 t eq CO2/year.

3.2.4 Leakage rate
As could be observe in Table 7, the air-conditioning unit that uses R-22 (HCFC), the
percentage of refrigerant leaks is over 100% in all zones inside UTM. Zone has the highest
percentage of refrigerant leakage is in Zone 4, which is 473.79% for the use of R-22 (HCFC),
while 87.43% are using R-410A (HFC). Even tough Zone 4 is at a more recent project
compared to other zone, refrigerant could also leak during installation and maintenance. As for
Zone 1, Zone 2 and Zone 3, the leakage rate is at 9.36%, 3.69% and 7.96% respectively which
using R-410A (HFC) is lower comparative to its R-22 (HCFC) leakage rate for the same zoning
area. For R-22 (HCFC) most of the zones having a high percentage of leakage is because most
of the units that use the R-22 (HCFC) are old units and most of them are almost 10 years old.
When the unit is used too long, the efficiency of the system for an air-conditioning unit has
decreased. Refrigerant leakage happened are usually due to installation fault, poor services
procedures, and inadequate maintenance. Even it become worst if there is existing problems
by keep adding refrigerant to a unit system that is already full. If there is a leaks, the solution
is not simply adding the refrigerant. The qualified technician should fix any leaking that
happened in that units, test the repair, and lastly adding refrigerant into the unit system with
the correct amount of refrigerant.
Table 7 Leakage Rate
Leakage Rate (%)
R-22 (HCFC) R-410A (HFC)
Zone 1 365.78 9.36
Zone 2 428.84 3.69
Zone 3 325.67 7.96
Zone 4 473.79 87.43
3.3 Recovery potential rate during on site disposal
This study also looks at the potential of how to treat refrigerant from dismantle chiller
unit. For this objective, the sample only on HCFC which is R-123. In order to be part of the
study, R-123 (HCFC) are collected from a chiller unit in Block C12, UTM which focus on
recoverable phased-out refrigerant. Data on the refrigerant is collected from the sample to
determine the recoverable potential of the collected refrigerant. The Figure 5 below is the
following improvement suggested for refrigerant management in the context for UTM to trace
FCs collection.
3.3.1 Sample extraction
The refrigerant that needed to be extracted from the system was found to be 311.5 kg
in 4 drums. The sample received from Block C12 was focused in determining the impurities
that were present. The possibility of impurities may be due to the contamination of foreign
substances or because of the accidental exposure. The contaminant present in the refrigerant
would reduce the cooling performance as it distorts the density and volume. If impurities are
existing, it will be extracted and filtered. The process would normally take up to two weeks.

This helps in better handling and extraction, also prevents most of the unintended FCs to be
released into the atmosphere.
Figure 5: Refrigerant Handling Flow in UTM
3.3.2 Reclamation Process
The used refrigerants should be tested as to verify that it has attained AHRI 700 or ISO
12810, or equivalent specification prior to resale as required by the U.S. Environmental
Protection Agency (EPA) (Damodaran and Donahue, 2010). The specification is compulsory
under AHRI 700 standards and it must be taken into account to determine if the sample could
be reclaimable. Non-reclaimable refrigerants must be disposed in an environmentally
acceptable manner, and in accordance with the applicable regulations (Baxter et al., 2016).
Chiller in Block C12 is one of targeted unit for phase-out HCFC to HFC. In order, to install
new unit of HFC, the existing unit that use HCFC will be disposed. As for the Block C12
building, chiller system was converted to R-134A (HFC). R-134A (HFC) was selected to
replace R-123 (HCFC) because HCFCs have been designed to phase-out by the Montreal
Protocol and this means that R-123 (HCFC) will phase-out for HVAC she is just starting 1
January 2020. In the same time, R-123 (HCFC) have little ODP and to R-134A (HFC) have no
ODP. In the present, R-134A (HFC) is the best choice for use in positive pressure equipment.
Table 8: The results of impurity testing
Drum Weight (kg) Impurity, % by Weight Impurity Test Result
1 96.5 0.47 <0.5% Pass
2 74.5 0.49 <0.5% Pass
3 90.5 0.49 <0.5% Pass
4 50.0 0.48 <0.5% Pass
The contamination present in all of the samples is shown in Table 8 which indicates that the
sample is not contaminated by other factors and only shows the presence of trace amount of
impurities during the testing of the sample. It was found that all of the sample passed the AHRI-
700 specification standard, which is a good indicator for the sample to be reclaimable. The
sample can be reuse into the chiller system and will reduce the need of introducing a new batch

of R-123 (HCFC) into the system. If there is no need of new batch for R-123 (HCFC) in the
existing installed system, it will help in reducing the R-123 (HCFC) manufacturing and reduces
carbon emission because R-123 (HCFC) also consist of a carbon compound. The chiller air
conditioning system can accept the reclaimed refrigerant only after it is being approved under
the AHRI Standard. The refrigerant that undergoes reclaim process must be used in the same
system. As shown in Table 8, the sample collected from Block C12, passed all of the impurity
testing, it can undergo the process of reclamation.
3.3.3 Recovery rate
As shown in Table 9, initially transported weight was found to be 311.5 kg, whereas
the process weight got reduced to 202.0 kg, minus the drum weight and extraction of
impurities. The final weight after recoverable process was 160.0 kg and now it is considered
to be ready for reuse in the chiller system. The total percentage loss after the process is found
to be 20.79%. The loss of weight differing from one system to another system is due to the
occurrence of contamination during the servicing and transportation of the sample. The other
factors, which contributed to contamination is during the maintenance, whereby the system
would be infiltrated due to improper services and accidental exposure.
Table 9: Reclaimed amount and percentage loss
No Reclaimed Amount Amount
1 Transported weight (kg) 311.5
2 Processed weight (kg) 202.0
3 Final net weight (kg) 160.0
Total percentages loss (%) 20.79
Recoverable R-123 (HCFC) (%) 79.21
In order to determine, whether the processed refrigerant meets or exceeds the product
specifications, the processed refrigerant was required to be compared the new refrigerant
after the process of reclamation. There is an estimated loss of recoverable gases whereby it is
estimated only 70% of the recovered gas can be regenerated by filtering and distillation. This
is due to the 30% degradation of fluid characteristic that is not allowable for reuse. It is also
hypothesized that 1% of the fluid is emitted in the atmosphere because of the reclamation
procedure, 1 % is composed of impurities (Cascini et al., 2016). As in this study, the amount
of R-123 (HCFC) recoverable refrigerant is 79.21%.
4. Conclusions
Managing fluorocarbon refrigerant gases initiatives would support Sustainable Development
Goals (SDGs) Goal 1End Poverty, Goal 2 End Hunger, Goal 3 Health and Well Being, Goal 7
Affordable Energy, Goal 9 Innovation and Infrastructure, Goal 12 Responsible Consumption
and Production and Goal 13 Climate Action (UNDP,2014). Sound management of

fluorocarbons from life cycle perspective is important and have high urgency to its
implementation. Direct benefits from fluorocarbons management brings multiple effects for
environmental conservation which is recovery of ozone layers, climate benefits, promotion of
energy efficiency and realization of proper disposal of e-waste; while maximization of these
initiatives are expected to lead to co- benefit in protecting health, driven industry innovation,
creating job opportunities as well as more-efficient energy usage. Therefore, having immediate
and long term fluorocarbon refrigerant management plan that considering involvement of
stakeholders at policy level, controlling leakage at consumption level, and environmentally
sound waste management options at post consumption level is crucial. Hence, it is important
to implement effective awareness raisings through collaborations with existing measures such
as climate change, energy efficiency and e-waste management to get end-users attentions on
co-benefits value of it.
Acknowledgements
This work was carried out with collaboration from project partner in selected ASEAN countries
under coordination by Mitsubishi UFJ Morgan Stanley and E&E Solutions Inc, supported by
The Ministry of the Environment, Japan (MOEJ) under project ‘Feasibility study on promotion
of energy saving equipment and environmentally sound management of used fluorocarbons in
Indonesia, Thailand, Malaysia and Vietnam” (registered under UTM contract research grant
4B242 and 4C205). The authors would like to acknowledge the efforts and contribution of
Universiti Teknologi Malaysia Office of Asset and Development (UTM OAD), Office of Vice
Chancellor and Office of Deputy Vice Chancellor (Development).
References
Aggarwal, A., Kumari, R., Mehla, N., nbsp, Deepali, Singh, Rathi, B. , 2013. Depletion of the
Ozone Layer and Its Consequences: A Review. American JOurnal of Plant Sciences,
Vol.04No.10, 8. doi:10.4236/ajps.2013.410247
AHRI (2016) AHRI Project 8018 Final Report : Review of Refrigerant Management Programs.
Burlington, MA.
AIRAH (2012) Methods of calculating Total Equivalent Warming Impact Methods of
calculating Total Equivalent Warming Impact ( TEWI ) 2012.
Andersen, S. O., Halberstadt, M. L. and Borgford-Parnell, N. (2013) ‘Stratospheric ozone,
global warming, and the principle of unintended consequences—An ongoing science
and policy success story’, Journal of the Air & Waste Management Association, 63(6),
pp. 607–647.
Baxter, J., Lyng, K., Askham, C. and Hanssen, O. J. (2016) ‘High-quality collection and
disposal of WEEE Environmental impacts and resultant issues’, Waste Management.

Cascini, A., Gamberi, M., Mora, C., Rosano, M. and Bortolini, M. (2016) ‘Comparative Carbon
Footprint Assessment of commercial walk-in refrigeration systems under different use
configurations’, Journal of Cleaner Production. Elsevier Ltd, 112, pp. 3998–4011.
Damodaran, N. and Donahue, J. (2010) Analysis of Equipment and Practices Analysis of
Equipment and Practices in the.
DOE (2012) Malaysia HCFC Phase-Out Management Plan (HPMP Stage-1) For Compliance
With The 2013 And 2015 Control Targets For Annex-C, Group-1 Substances.
DOE (2018) Buku-HPMP-Stage-2_Part1.pdf.
Drouet, L., Bosetti, V. and Tavoni, M. (2015) ‘Selection of climate policies under the
uncertainties in the Fifth Assessment Report of the IPCC’, Nature Climate Change,
5(10), pp. 937–943.
Elbel, S. and Lawrence, N. (2018) ‘Leakage Rate Measurement and Durability Testing of
Field-made Mechanical Joints for Systems with Flammable Refrigerants ( ASHRAE
RP-1808 )’.
H. Clark, D. (2013) Appendix B CO2e emission factors.
Harman and A. Hamarung, M. (2017) ‘Analisis Eksperimen Penggunaan Refrijeran R22 , R32
, Dan Campuran R502-R407c Untuk Mengetahui Kinerja Ac Split’, 9(1), pp. 1–5.
Intergovernmental Organization fot the Development of Refrigeration (2014) Refrigerant
Charge Reduction in Refrigerating Systems.
IPCC (2013) IPCC, 2013: Annex II: Climate System Scenario Tables, Climate Change 2013:
The Physical Science Basis. Contribution of Working Group I to the Fifth Assessment
Report of the Intergovernmental Panel on Climate Change.
J.G.J. Olivier, K. M. Schure and J.A.H.W Peters, Trends in Global CO2 and Total Greenhouse
Gas Emissions: 2017 Report (The Hague: PBL Netherlands Environmental Assessment
Agency, December 2017)
Li, Z., Bie, P., Wang, Z., Zhang, Z., Jiang, H., Xu, W., . . . Hu, J., 2016. Estimated HCFC-22
emissions for 1990–2050 in China and the increasing contribution to global emissions.

Atmospheric Environment, 132, 77-84.
doi:https://doi.org/10.1016/j.atmosenv.2016.02.038
Mehboob, M. R., Raza, S. and Nazir, M. U. (2018) Selection of a Suitable Refrigerant by
Experimental Analysis of Refrigerants (R134a , R600a & R290).
R. Sand, J., K. Fischer, S. and D. Baxter, V. (1997) Energy and Global Warming Impacts of
HFC Refrigerants and Emerging Technologies.
Sarbu, I. (2014) ‘A review on substitution strategy of non-ecological refrigerants from vapour
compression-based refrigeration, air-conditioning and heat pump systems’,
International Journal of Refrigeration. Elsevier Ltd and IIR, 46, pp. 123–141.
Shah, N., Khanna, N., Karali, N., Park, W., Qu, Y. and Zhou, N. (2017) Opportunities for
Simultaneous Efficiency Improvement and Refrigerant Transition in Air Conditioning.
Tassou, S. A. and Grace, I. N. (2005) ‘Fault diagnosis and refrigerant leak detection in vapour
compression refrigeration systems’, International Journal of Refrigeration, 28(5), pp.
680–688.
The Linde Group (2015) ‘HCFC phase-out has started.’
The Linde Group (2019) Minimising environmental impact, The linde Group.
United Nation Development Program (UNDP) The Sustainable Development Goals (SDGs)
and the Montreal Protocol on Substances that Deplete the Ozone Layer, 2014.
http://www.undp.org/content/undp/en/home/librarypage/environment-
energy/ozone_and_climate/protecting-the-ozone-layer-and-reducing-global-warming/
UNEP (2015) Good Servicing Practices : Phasing out HCFCs in the Refrigeration and Air-
Conditioning Servicing Sector.
Vitooraporn, C. (2009) Study On Current Situation Of Hfc-32 Refrigerant Technology And
Application Asean Countries.
Wang, C., Shao, M., Huang, D., Lu, S., Zeng, L., Hu, M., & Zhang, Q. ,2014. Estimating
halocarbon emissions using measured ratio relative to tracers in China. Atmospheric
Environment, 89, 816-826. doi:https://doi.org/10.1016/j.atmosenv.2014.03.025

Wu, X., Hu, S. and Mo, S. (2013) ‘Carbon footprint model for evaluating the global warming
impact of food transport refrigeration systems’, Journal of Cleaner Production.
Elsevier Ltd, 54, pp. 115–124.
Yuan, Z., Ou, X., Peng, T. and Yan, X. (2018) ‘Development and application of a life cycle
greenhouse gas emission analysis model for mobile air conditioning systems’, Applied
Energy. Elsevier, 221(March), pp. 161–179.
Zeiger, B., Gschrey, B. and Schwarz, W. (2014) ‘Alternatives to HCFCs / HFCs in developing
countries with a focus on high ambient temperatures’, Applied Thermal Engineering,
29(8–9), pp. 1–6.
Zhao, L., Zeng, W. and Yuan, Z. (2015) ‘Reduction of potential greenhouse gas emissions of
room air-conditioner refrigerants: a life cycle carbon footprint analysis’, Journal of
Cleaner Production. Elsevier Ltd, pp. 1–7.