focus on the role of the calcium-sensing receptor …bib_c687949d44ea... · 2016-11-16 · 1...
TRANSCRIPT
1
UNIVERSITY OF LAUSANNE
MASTER'S DEGREE IN MEDICINE
FOCUS ON THE ROLE OF THE CALCIUM-SENSING
RECEPTOR (CASR) GENE IN BLOOD PRESSURE CONTROL IN
HUMANS
STEPHANIE BORNET, 2009-2010
Presented 28th May 2010
Tutor
Bochud Murielle ([email protected])
Expert
Bonny Olivier ([email protected])

2
Table of contents
List of tables………………………………………………………………………………………… 4
List of figures……………………………………………………………………………………….. 4
List of abbreviations………………………………………………………………………………… 5
Abstract……………………………………………………………………………………………... 6
I) Review of the literature…………………………………………………………………............... 7
1. Introduction…………………………………………………………………………………… 7
2. Methodology.…………………………………………………………………………………. 7
3. Hypertension………………………………………………………………………………….. 8
3.1. Epidemiology……………………………………………………………………………. 8
3.2. Definition………………………………………………………………………………... 8
3.3. Hypertension as a cardiovascular risk factor……………………………………………. 9
3.4. Etiology…………………………………………………………………………………. 9
4. Monogenic forms of hypertension and hypotension………………………………………… 10
4.1. Monogenic forms of hypertension………………………………………………………. 10
4.1.1. Glucocorticoid-remediable hypertension (GRA)………………………………… 10
4.1.2. Apparent mineralocorticoid excess (AME)……………………………………… 11
4.1.3. Mineralocorticoid receptor mutations and hypertension exacerbated by
pregnancy……………………………………………………………………………….. 11
4.1.4. Liddle’s syndrome………………………………………………………………... 11
4.1.5. Gordon’s syndrome (pseudohypoaldosteronism type II)………………………... 11
4.1.6. Autosomal dominant hypertension with brachydactyly……………………........ 12
4.2. Monogenic forms of hypotension……………………………………………………….. 12
4.3. Polygenic forms of hypertension………………………………………………………... 13
5. The calcium-sensing receptor (CASR)……………………………………………………….. 15
5.1. Structure…………………………………………………………………………………. 15
5.2. Localization and roles of the CASR…………………………………………………….. 15
5.3. Agonists and antagonists of the CASR………………………………………………….. 19
5.4. CASR gene………………………………………………………………………………. 19
II) CoLaus data analysis……………………………………………………………………………. 22
1. Methodology………………………………………………..………………………………… 22
1.1 CoLaus: methodology…………………………………………………………………… 22
1.2. Statistical analysis……………………………………………………………………….. 23
2. Results………………………………………………………………………………………… 25
2.1. Description of the study sample………..……………………………………………….. 25
2.2. Hardy-Weinberg proportions……………………………………………………………. 26
3
2.3. Linkage disequilibrium between SNPs………………………………………………….. 27
2.4. Association between CASR SNPs and hypertension…………………………………… 29
2.5. Association between CASR SNPs and systolic and diastolic blood pressure…………... 30
2.6. Stratified analyses……………………………………………………………………..… 30
3. Discussion…………………………………………………………………………………….. 33
4. Conclusion………………………………………………………………….………………… 41
III. Bibliography………………………………………………………………..…………………… 42
IV. Annexes…………………………………………………………………………………………. 44
Annex 1: References of figures ………………………………………………….……………… 45
Annex 2: References of articles from www.uptodate.com….……………………………..…..... 45
Annex 3 : Association of SNPs of the CASR with mean night SBP, mean nigh DBP, mean
24-hours SBP, mean 24-hours DBP, and 24-hours urinary calcium in
Tobin’s study…………….……………………………………………..……………..46
Acknowledgment...…………………………………………………………………………………. 46
4
List of tables
Table 1. Classification of hypertension by the European Societies of Hypertension and
Cardiology………………………………………………………………………………………… 8
Table 2. Monogenic forms of hypertension………………………………………………………. 10
Table 3. Monogenic forms of hypotension ………………………………………………………. 12
Table 4. Agonists and antagonists of the calcium-sensing receptor………………….…………… 19
Table 5. Mutations in the CASR causing calcium disorders……………………………………… 21
Table 6. Description of the study sample…………………………………………………………. 25
Table 7. Hardy-Weinberg equilibrium test………………………………………………………… 26
Table 8. Cross-tabulation of rs11716910 and rs10934581……………………………………….. 27
Table 9. Cross-tabulation of rs11716910 and rs5008830…………………………………………. 27
Table 10. Cross-tabulation of rs11716910 and rs2001548……………………………………….. 27
Table 11. Cross-tabulation of rs10934581 and rs5008830……………………………………….. 28
Table 12. Cross-tabulation of rs10934581 and rs2001548……………………………………….. 28
Table 13. Cross-tabulation of rs5008830 and rs2001548………………………………………... 28
Table 14. Χ2 test for association between SNPs and hypertension………………………………. 29
Table 15. Systolic and diastolic blood pressure according to the genotypes with ANOVA
test results………………………………………………………………………………………… 30
Table 16. Χ2 test for association between SNPs and hypertension in ten subgroups
of the CoLaus cohort……………………………………………………………………………… 31
Table 17. Association between CASR SNPs and blood pressure. Stratification by age…………… 31
Table 18. Association between CASR SNPs and blood pressure. Stratification by sex…………… 32
Table 19. Association between CASR SNPs and blood pressure. Stratification by BMI………….. 32
Table 20. Association between CASR SNPs and blood pressure. Stratification by corrected
calcium…………………………………………………………………………………………… 33
Table 21. Association between CASR SNPs and blood pressure. Stratification by creatinine…….. 33
List of figures
Figure 1. GPCR topology of the CASR. ……………………………………………………...… 16
Figure 2. CASR signaling in the parathyroid gland……………………………………………… 16
Figure 3. Reabsorption of calcium in the proximal tubule……………………………………………. 16
Figure 4. Reabsorption of calcium in the TAL………………………………………………………... 17
Figure 5. Reabsorption of calcium in the DCT……………………………………………………….. 17
Figure6. LD plot for rs10934581………………………………………………………………………. 29

5
List of abbreviations
20-HETE 20-hydroxyeicosatetraenoic acid
ACTH adenocorticotropic hormone
ADHH autosomal dominant hypocalcaemia with hypercalciuria
AME apparent mineralocorticoid excess
ANOVA analysis of variance
BMI body mass index
cAMP cyclic adenosine monophosphate
CASR calcium-sensing receptor
CLCKB chloride channel Kb
COX-2 cyclo-oxygenase 2
DBP diastolic blood pressure
EnaC epithelial sodium channel
FBHH familial benign hypocalciuric hypercalcemia
FIHP familial isolated hyperparathyroidism
GWAS genome-wide association study
LD linkage disequilibrium
MAF minor allele frenquency
MR mineralocorticoid receptor
NCCT sodium chloride cotransporter
NHE3 sodium proton cotransporter
NKCC2 cotransporter Na+K
+2Cl
-
NSHPT neonatal severe hyperparathyroidism
PKC protein kinase C
PLA2 phospholipase A2
RAAS renin-angiotensin-aldosterone system
ROMK renal outer-medullary potassium channel
SBP systolic blood pressure
SNP single nucleotide polymorphism
TAL thick ascending limb of the loop of Henle
TRPV4 transient receptor potential cation channel subfamily V member 4
TRPV5 transient receptor potential cation channel subfamily V member 5

6
ABSTRACT
Purpose: The purpose of this work is to analyze the association of variants in the CASR gene with
blood pressure in CoLaus, a Swiss population-based study. Hypertension is a common disease
affecting 20 to 25% of the general population worldwide and represents a major modifiable
cardiovascular risk factor.
Methods: First, a literature review on hypertension genetics and CASR was conducted using PubMed
and Web of Science. Second, a genetic association study of CASR variants with blood pressure was
conducted. CoLaus is a cross-sectional population-based study aiming at investigating the
epidemiology and determinants of cardiovascular risk factors and the metabolic syndrome in a group
of people living in Lausanne, Switzerland. The 6,188 subjects included in the study met the following
criteria: 1) age between 35 and 75, 2) Caucasian origin and 3) written informed consent. Blood
pressure was measured thrice on the left arm after at least ten minutes rest in the sitting position; the
average of the two last measurements was used for the analysis. Nuclear DNA was extracted from
blood and genotyping was performed using the Affymetrix 500 K SNP chip. Four SNPs located within
the CASR gene were used: rs11716910, rs10934581, rs5008830 and rs2001548. Data were analyzed
using STATA 10. The chi-square test was used to search for an association between each SNP and
hypertension. The ANOVA test was used to compare blood pressure in the three genotypes
(homozygous for the minor allele, heterozygous and homozygous for the major allele).
Results: Blood pressure and hypertension aggregate in families. Several rare monogenic forms of
hyper- and hypotension have been described, most of which are associated with disturbed renal
sodium handling by the kidney. The CASR gene is involved in Bartter’s syndrome, a rare monogenic
form of hypotension. Yet, more than 90% of hypertension cases are essential and, so far, it has been
difficult to identify genetic determinants of essential hypertension. The results of studies using a
candidate gene approach have been difficult to reproduce and recently genome-wide approaches have
identified new blood pressure candidate genes in humans. In CoLaus, no association between selected
CASR SNPs and hypertension or blood pressure was found. This might be due 1) to the fact that the
CoLaus study is underpowered to detect single SNPs effect for blood pressure, 2) to the fact that only
a subset of CASR SNPs was used, thus leading to low gene coverage, 3) to the existence of gene-gene
or gene-environment interaction (which were not assessed in this project), and/or 4) to the fact that
multiple rare unmeasured variants might play a role.
Conclusion: Despite negative results in this study, CASR remains a potential gene in the
understanding of hypertension and blood pressure control in humans. Further association studies in
large samples, which would account for all possible CASR variants and also consider potential
interaction with other genes and with environmental factors are worth considering.
Keywords: CASR, hypertension, systolic blood pressure, diastolic blood pressure.

7
I) Review of the literature
1. Introduction
This work focuses on the role of the calcium-sensing receptor (CASR) gene in hypertension in humans.
The first part includes a general introduction on hypertension with a description of monogenic forms
of hyper- and hypotension, a description of the CASR, its roles and its implications in familial
diseases. The second part contains an analysis of data from the population-based CoLaus study. The
goal of this analysis is to determine if there is an association between a few single nucleotide
polymorphisms (SNPs) in the CASR gene and hypertension in this cohort representative of the people
living in Lausanne. The association between the continuous blood pressure levels and CASR variants is
also analyzed.
Monogenic forms of hypertension have been discovered, but most cases of hypertension remain
essential. However, we know that this disease has a genetic component, because hypertension
aggregates in families. Researchers worldwide are interested in the genetics of hypertension for
several reasons, including the facts that hypertension affects 20 to 25% of the population, that it is a
modifiable cardiovascular risk factor, that its consequences may be life-threatening and that in most
cases, its etiology remains unknown. One long-term perspective would be to imagine a strategy of
prevention and treatment based on the genetic background (i.e. a personalized prevention and therapy),
but such a strategy is not possible at the time being and it is not clear whether or not this will ever be
possible. I chose this topic because of the high prevalence of hypertension in family practice, which is
the post-graduate formation I currently intend to follow.
2. Methodology
The first step of my master work was to conduct a literature review on calcium homeostasis, the
calcium-sensing receptor (CASR) and its relationship with hypertension and/or blood pressure. First, I
used articles from the medical website UpToDate1 as well as articles received from my tutor. Second, I
search for articles using the PubMed database. My keywords were “CASR” and “hypertension”,
linked with the bolean operator “AND”. This search retrieved 17 articles. Replacing “hypertension”
with “blood pressure” did not identify any further article. Third, I used the database Web of Science to
make exactly the same research, but no additional article was retrieved. The number of articles is small
because the role of CASR in hypertension has rarely been studied.
As the subject of this work is the genetics of hypertension, I also looked for reviews in PubMed about
monogenic forms of hyper- and hypotension. My keywords were “monogenic hypertension” and
1 www.uptodate.com See complete reference in annex 2
8
“monogenic hypotension”, linked by “AND”. I obtained 11 publications, but I worked mainly with a
review written by Rosskopf and al. (1) (see chapter 4).
The goal of the following review of the literature is to understand why researchers working on
hypertension are interested in the CASR.
3. Hypertension2
3.1. Epidemiology
Hypertension is a highly prevalent disease; 20 to 25 % of the population is affected worldwide. In
Switzerland, the Swiss health survey in 2007 showed that 23% of men and 21% of women were once
told that their blood pressure was too high (2). In CoLaus, the prevalence reaches 36.7% (3). This is
mainly due to the fact that young people under 35 years old are not included in this study and that
hypertension prevalence is increasing with age. Men are more likely than women to suffer from this
disease. Blood pressure is known to increase with age, especially the systolic blood pressure (SBP);
SBP is the most important predictive risk factor for cardiovascular complications. Blood pressure has a
circadian rhythm; it usually decreases at night (dipping) and is higher during the early morning
(morning surge). Blood pressure may be higher because of physical exercise, psychological stress or
emotion. Several mechanisms play a role in the regulation of blood pressure, such as reabsorption of
sodium by the kidney, the rennin-angiotensin-aldosterone system or the sympathetic nervous system.
Those mechanisms are the target for the currently available anti-hypertensive treatments.
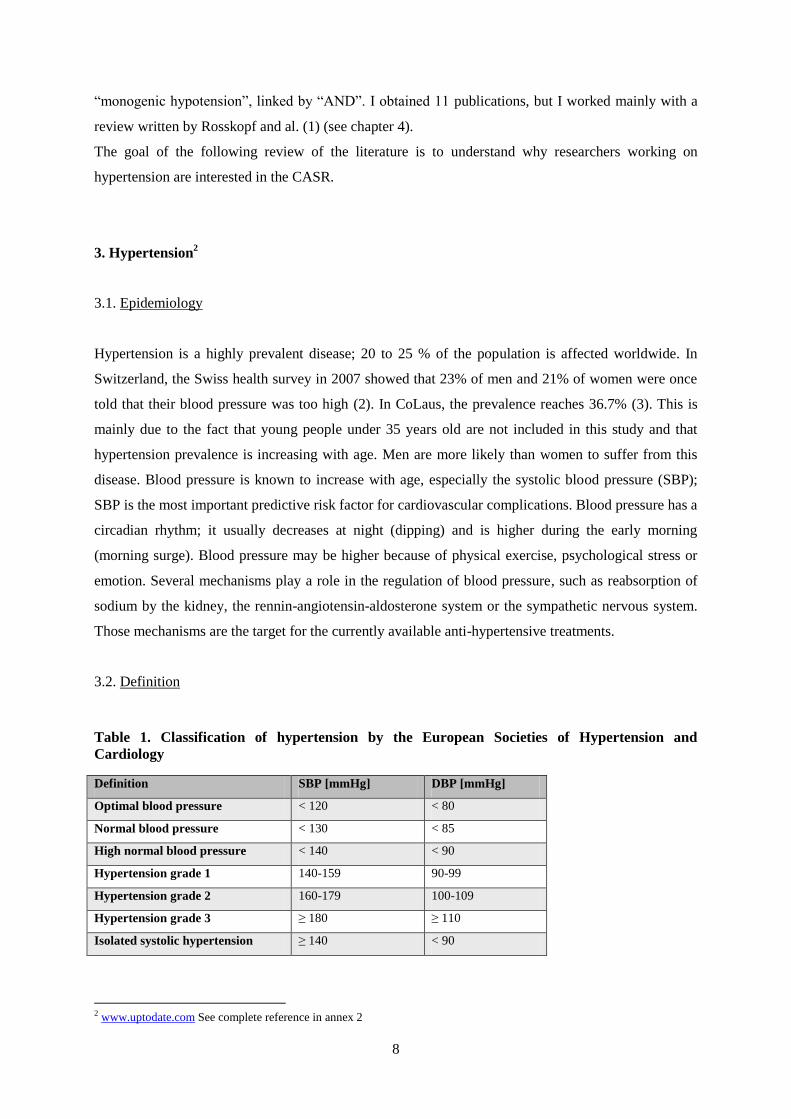
3.2. Definition
Table 1. Classification of hypertension by the European Societies of Hypertension and
Cardiology
Definition SBP [mmHg] DBP [mmHg]
Optimal blood pressure < 120 < 80
Normal blood pressure < 130 < 85
High normal blood pressure < 140 < 90
Hypertension grade 1 140-159 90-99
Hypertension grade 2 160-179 100-109
Hypertension grade 3 ≥ 180 ≥ 110
Isolated systolic hypertension ≥ 140 < 90
2 www.uptodate.com See complete reference in annex 2

9
People are hypertensive when one of these conditions is fulfilled: 1) SBP 140 mmHg, 2) diastolic
blood pressure (DBP) 80 mmHg or 3) taking a medication. The European Societies of Hypertension
and Cardiology published guidelines in 2007 classifying hypertension as described in table 1.
3.3. Hypertension as a cardiovascular risk factor
Hypertension is a modifiable cardiovascular risk factor, as are smoking, diabetes mellitus and
dyslipidemia. Non-modifiable cardiovascular risk factors include familial history of cardiovascular
disease, sex, age, ethnic group and genetic determinants.
Hypertension is associated with an increased risk (eight to four times) (2) of stroke, cardiac failure, left
ventricular hypertrophy, coronary heart disease, chronic kidney disease, abdominal aortic aneurism,
arteriopathy of inferior members and hypertensive retinopathy. It is to prevent these complications that
hypertension should be detected and treated. The goal of the treatment is to reach a blood pressure
level lower than 140/90 mmHg for non-diabetic individuals and lower than 1300/80 mmHg for
diabetic individuals, as recommended by the guidelines of PMU (Policlinique Médicale Universitaire)
base on three articles3. Yet, only half of the affected people are treated and among them, 50% have an
uncontrolled hypertension (3) (because of inappropriate treatment or lack of compliance).
Hypertension therefore represents a major public health burden worldwide.
3.4. Etiology
In 85 to 90% of all cases, hypertension is said to be “essential” or “idiopathic”, because no etiology
can be found. Causes of secondary hypertension include hyperaldosteronism, nephropathy, renal artery
stenosis, hypercorticism, hyperthyroidism, pheochromocytoma, primary hyperparathyroidism, drug-
induced hypertension, pregnancy-induced hypertension and aortic coarctation (40).
Hypertension is a multifactorial disease; environmental factors are implicated in the development of
hypertension, but available evidence suggests that this disease has a genetic component. First of all,
there is a positive correlation between the blood pressure of parents and children; secondly, blood
pressure is more strongly correlated within monozygotic twins than within dizygotic twins; finally,
3 Chiolero A, Bovet P et Burnier M. Recommandations américaines et européennes pour la prise en charge de patients
hypertendus : quel impact pour la pratique ? Revue médicale de la suisse romande, mars 2002. No 551. Disponible sous :
titan.medhyg.ch
Chobanian V, Bakris G, Black H et al. The seventh report of the joint national committee on prevention, detection, evaluation
and tratment of high blood pressure. JAMA 2003;289:2534-73. Disponible sous: jama.ama-assn.org
Groupe de travail pour la prise en charge de l’hypertension de la société europenne d’hypertension (ESH) et de la société
européenne de cardiologie (ESC). ESH/ESC 2007. Recommendations pratiques pour la prise en charge de l’hypertension
artérielle. HTA-info, 24, juin 2008 :19-29.

10
blood pressure is more strongly correlated within biological siblings than within adoptive siblings.
However, even if monogenetic forms of hypertension exist (see next paragraph), such forms are rare
and most people present a polygenic (i.e. multiple genes each with a small effect) form of
hypertension.
4. Monogenic forms of hypertension and hypotension
This chapter is mainly inspired by a review of the literature written by Rosskopf and al. (1).
4.1. Monogenic forms of hypertension
Only syndromes in which hypertension is the main manifestation are described here (table 2) even if
hypertension is common in several genetic syndromes.
Table 2. Monogenic forms of hypertension
Disease Transmission Gene implicated Clinic
Glucocorticoid-
remediable hypertension
Autosomal
dominant
Crossing-over between
CYP11B2 and CYPT11B1
Volume expansion, metabolic
alkalosis, hypokalemia, low plasma
renin activity
Apparent
mineralocorticoid excess
Autosomal
recessive
Loss-of-function mutations in
the gene for HSD11β2
Hypertension, low renin activity,
low aldosterone concentration,
metabolic alkalosis
Mineralocorticoid
receptor mutations and
hypertension exacerbated
by pregnancy
Autosomal
dominant
Activating mutation in the
mineralocorticoid receptor
(MR)
Hypertension during pregnancy
Liddle’s syndrome Autosomal
dominant
SCNN1B, SCNN1G (coding
for ENaC)
Early-onset hypertension,
metabolic alkalosis, hypokalemia,
low plasma renin concentration,
low aldosterone level concentration
Gordon’s syndrome
(pseudohypoaldostero-
nism type II)
Autosomal
dominant
Gain-of-function mutations in
WNK1; loss-of-function
mutations in WNK4
Hypertension, hyperkalemia,
hyperchloremic metabolic acidosis,
normal glomerular filtration rate,
low renin activity
Autosomal dominant
hypertension with
brachydactyly
Autosomal
dominant
intrachromosomal
rearrangement on
chromosome 12p.
Hypertension, strokes in young
age, brachydactyly, short stature
11
4.1.1. Glucocorticoid-remediable hypertension (GRA) (1,4)
Glucocorticoid-remediable hypertension (GRA) is an autosomal dominant syndrome due to a crossing-
over between two genes with a high degree of homology, CYP11B2 (coding for aldosterone synthase)
and CYP11B1 (coding for the 11β-hydroxylase). The result is a chimeric gene, consisting of the
promoter and regulatory region of the CYP11B1 followed by the region of CYP11B2 coding for the
structure of aldosterone synthase. As a result, aldosterone is synthesized under the control of ACTH
and not, as is the case in a normal physiological situation, under the control of angiotensin II. The
treatment consists in glucocorticoids that inhibit ACTH release.
4.1.2. Apparent mineralocorticoid excess (AME) (1,4,6)
This autosomal recessive syndrome results from loss-of-function mutations in the gene coding for the
hydroxysteroid-11β-dehydrogenase2 (HSD11β2), an enzyme present in tissues sensitive to aldosterone
that reduces cortisol to cortisone (an inactive metabolite); this reduction avoids cortisol binding to
mineralocorticoid receptors (MR). Both cortisol and aldosterone similarly activate the MR. In AME,
cortisol is not appropriately degraded and permanently activates MR in the kidney because of its
unusually elevated concentration. This leads to increased sodium reabsorption in the distal nephron.
4.1.3. Mineralocorticoid receptor mutations and hypertension exacerbated by pregnancy
In this autosomal dominant disease, there is an activating mutation S810L in the MR (NR3C2) itself
(1,5,6). This mutation leads to a modification of the affinity of the MR that is now activated by
progesterone; as progesterone concentration increases during pregnancy, hypertension is getting the
most severe during that period.
4.1.4. Liddle’s syndrome (1,5,6)
This autosomal dominant syndrome is due to some mutations in the genes SCNN1B or SCNN1G
coding for the carboxy-terminal region of epithelial sodium channel (ENaC, subunit β or γ (5)). This
channel is usually present on the apical membrane of the cells in the distal convoluted tubule of the
kidney only in presence of aldosterone and is ubiquitinated in absence of aldosterone. These mutations
lead to an impaired ubiquitination of ENaC that remains in the membrane even without aldosterone,
and sodium and water reabsorption follow, leading to hypertension.
4.1.5. Gordon’s syndrome (pseudohypoaldosteronism type II) (1,4,6)
This autosomal dominant disease is due to mutations in the WNK1 and WNK4 genes, which encode
two enzymes implicated in the regulation of the thiazide-sensitive Na-Cl cotransporter (NCCT, gene
SLC12A3) as well as ROMK (gene KCNJ1) and TRPV4 (a calcium channel). WNK4 diminishes the
incorporation of the thiazide-sensitive Na-Cl cotransporter in the membrane and WNK1 inhibits this
action. A gain-of-function mutation of WNK1 or a loss-of-function mutation of WNK4 leads to an

12
increased membrane expression of the thiazide-sensitive Na-Cl cotransporter, which leads to increased
sodium reabsorption and hypertension.
4.1.6. Autosomal dominant hypertension with brachydactyly (1,4)
This syndrome has been described in Turkish families presenting severe hypertension and strokes at a
young age, as well as brachydactyly and short stature. The locus of this syndrome has been identified
on chromosome 12p. It is explained by an impaired ability of the baroreceptor reflex to compensate an
increase in blood pressure. Unlike previously described monogenic forms of hypertension, this
syndrome is not associated with hypertension via increased sodium and water retention by the kidney
as the primary mechanism.
4.2. Monogenic forms of hypotension (1,7-11)
Table 3. Monogenic forms of hypotension
Disease Transmission Gene Defect
Pseudohypoaldostero-
nism type I
AR
AD
Inactivating mutations in SCNN1A,
SCNN1B and SCNN1G
Loss-of-function mutations in the
mineralocorticoid receptor gene
Decrease in ENaC activity.
Decrease in MR activity
Type I Bartter’s
syndrome
AR Inactivating mutation in SLC12A1 Decrease in Na+K
+2Cl
- (NKCC2)
activity
Type II Bartter’s
syndrome
AR Inactivating mutation in KCNJ1 Decrease in ROMK activity
Type III Bartter’s
syndrome
AR Inactivating mutation in CLCNKB Decrease in chloride channel
CLCKB activity
Type IV Bartter’s
syndrome
AR Inactivating mutation in BSND Decrease in chloride channel
activity because of mutation of the
β-subunit of CLCKB (barttin)
Type V Bartter’s
syndrome
AD Activating mutation in CASR Abnormal activation of CASR
Gitelman’s syndrome AR Inactivating mutation SLC12A3 Decrease in Na+Cl
- (NCCT)
channel
AD = autosomal dominant; AR = autosomal recessive
As for hypertension, there are monogenic forms of hypotension, summarized in table 3. The
monogenic forms of hypotension share the common pathophysiological mechanism of being renal

13
salt-wasting syndromes. Pseudohypoaldosteronism type I (1,4) presents itself with life-threatening
neonatal hypotension, dehydration, salt wasting, hyperkalemia, metabolic acidosis and increased
aldosterone levels. Gitelman’s syndrome is an autosomal recessive disease affecting 1/40,000 people
that present with hypokalemia, metabolic alkalosis, hypomagnesaemia and decrease in renal calcium
excretion. Bartter’s syndrome is a rare genetic diseases affecting 1/1,000,000 people. It is
characterized by deficient renal reabsorption of sodium and chloride, hypokalemia, metabolic
alkalosis, hypocalcaemia, hypercalciuria and secondary hyperreninaemia and hyperaldosteronism. The
pathogenesis of this disease was elucidated in the past ten years and nowadays, five types of Bartter’s
syndrome are described (see table 3). All types are characterized by mutations in genes expressed in
the thick ascending limb of the loop of Henle (TAL). Type V Bartter’s syndrome is caused by
activating mutations in the CASR.
In 2002, Vargas-Poussou and al. (10) discovered a CASR mutation in a patient suffering from
autosomal dominant hypocalcaemia with hypercalciuria (ADHH) and presenting all the characteristics
of a Bartter’s syndrome. In vitro experiments showed that this mutation, L125P, was an activating
mutation. Comparing the kinetic of wild-type CASR and mutants CASR, the researchers demonstrated
that L125P was the most activating mutation ever described. Then, Watanabe and al. (7) in turn
described two further activating mutations of CASR in patients with ADHH, A843E and C131W.
Those three mutations are associated with more severe clinical features than the ones observed in
autosomal dominant hypocalcaemia with hypercalciuria (ADHH) because they permit the activation of
the CASR at physiological calcium concentrations, i.e. CASR is much more sensitive to calcium than
in patients with ADHH.
Ji and al. (8) described mutations in SLC12A1, SLC12A1, and KCNJ1 associated with Gitelman’s
syndrome, type I and type II Bartter’s syndromes respectively. In SLC12A3, mutations with proven
biochemical loss-of-function variants are E112X, R399L, F495L, G613S, G741R, R964Q and G989R;
they lead to loss of salt, lower blood pressure and protection against hypertension. R320FS in
SLC12A1 and H251Y and T313FS is KCNJ1 are variants in which loss-of-function has been
demonstrated in vitro (8).
4.3. Polygenic forms of hypertension
For about twenty years, researchers have been looking for genes responsible for hypertension. Many
variants in genes coding for molecules implicated in the regulation of salt retention have been
discovered. The molecules that are possibly implicated are components of the classical blood pressure

14
regulation pathways like the renin-angiotensin-aldosterone system, renal transporters, receptors of the
sympathetic nervous system, but also G-proteins, hormones and enzymes. So far, more than 100 genes
have been studied and results have often been inconsistent across studies using a candidate gene
approach. A more detailed list of molecules included in polygenic forms of hypertension is available
in articles written by Luft (5) , Lang and al.(4) and the review written by Rosskopf and al. (1).
More recently, a hypothesis-free genome-wide approach has been possible thanks to the availability of
genome-wide chips containing 500’000 or 1’000’000 SNPs. Genome-wide association studies
(GWAS) have already identified single nucleotide polymorphisms (SNPs) robustly associated with
blood pressure. Two recent studies have been published in Nature Genetics (12,13). In 2009, the
Global BPgen consortium (12) conducted a meta-analysis of GWAs on hypertension including 17
cohorts of 23,433 Caucasians, and tested 2.5 million SNPs for association with SBP, DBP and
hypertension. Eight loci were identified as being associated with SBP or DBP: CYP17A1, CYP1A2,
FGF5, SH2B3, MTHRF, c10orf107, ZNF625 and PLCD3. The CHARGE consortium (13) conducted
a meta-analysis including 29,136 participants from six prospective cohorts and identified 13 SNPs
associated with SBP, 20 SNPs associated with DBP and 10 SNPs associated with hypertension. Four
SNPs were associated with SBP in both studies (STP2B1, CYP17A1, PLEKHA7 and SH2B3) and six
with DBP in both studies (ATP2B1, CACNB2, CSK-ULK3, SH2B3, TBX3-TBX5 and ULK4).
Several conclusions can be drawn from these genome-wide association studies. The first observation is
that the variants in genes known to cause hypertension (i.e. the genes coding for the molecules
targeted by current anti-hypertensive therapies) were not significantly associated with blood pressure.
The actual treatment of hypertension consists of inhibitors of the renin-angiotensin system, diuretics,
inhibitors of the sympathetic nervous system and blockers of calcium channels. Mutations in genes
coding for components of those regulatory systems known to control blood pressure did not appear
either. The second observation is that a great number of variants must be analyzed to discover only
few SNPs associated to hypertension. To take into account the very large number of statistical tests
conducted and avoid false positive results, researchers need to use a very low threshold for the p-value
for considering an association to be significant. The third observation is that the effect sizes of the
variants associated with blood pressure was very small. As a consequence, very large sample sizes (>
20,000) need to be used in order to have enough power to detect such small effect sizes. This also
implies that any singly variant only has a small impact at the individual level. The fourth observation
is that genome-wide approaches, unlike candidate gene approaches, are hypothesis free and therefore
allow identifying genes with previously unknown function and genes previously unsuspected to play a
role in blood pressure control. Genome-wide association studies may be a starting point to discover
new pathways and mechanisms for controlling blood pressure level, but this is usually not the case at
the time being. The fifth observation is that GWAs did not consider the interaction between genes and

15
the ones between genes and environment so far. SNPs are analyzed separately from each other and
only the association between one particular genetic variant and blood pressure is considered. It is
therefore likely that a lot of information is being lost.
5. The calcium-sensing receptor (CASR)
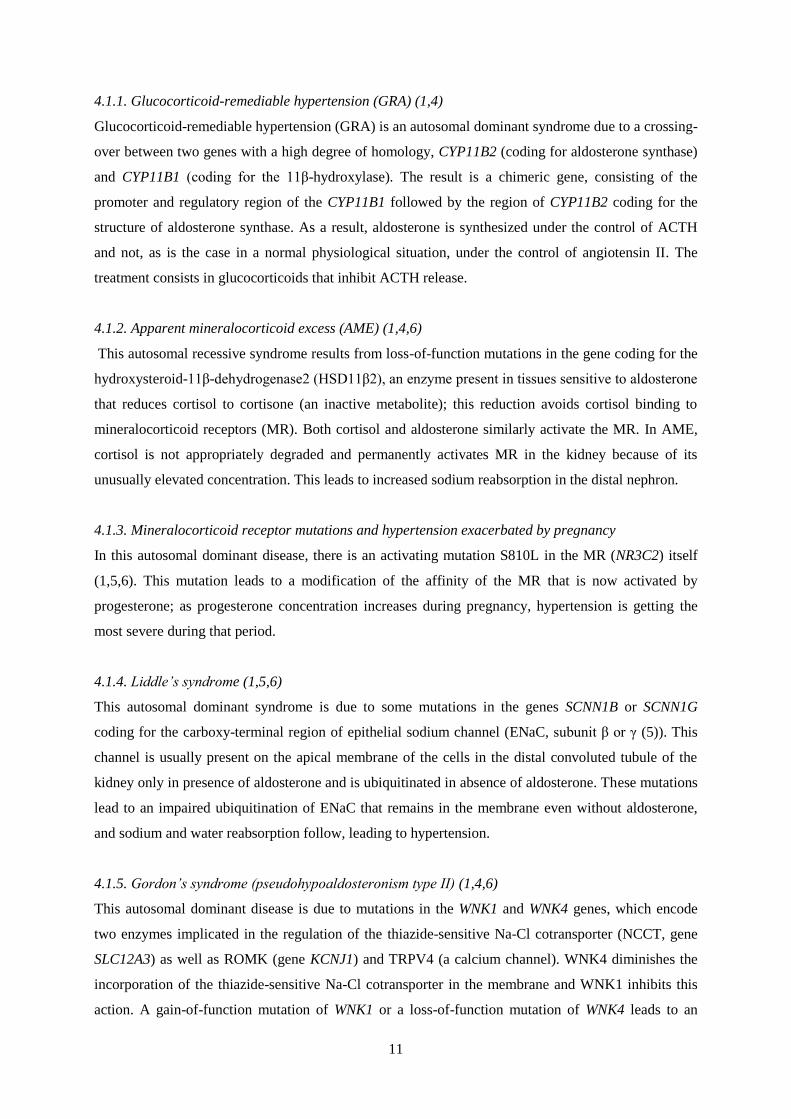
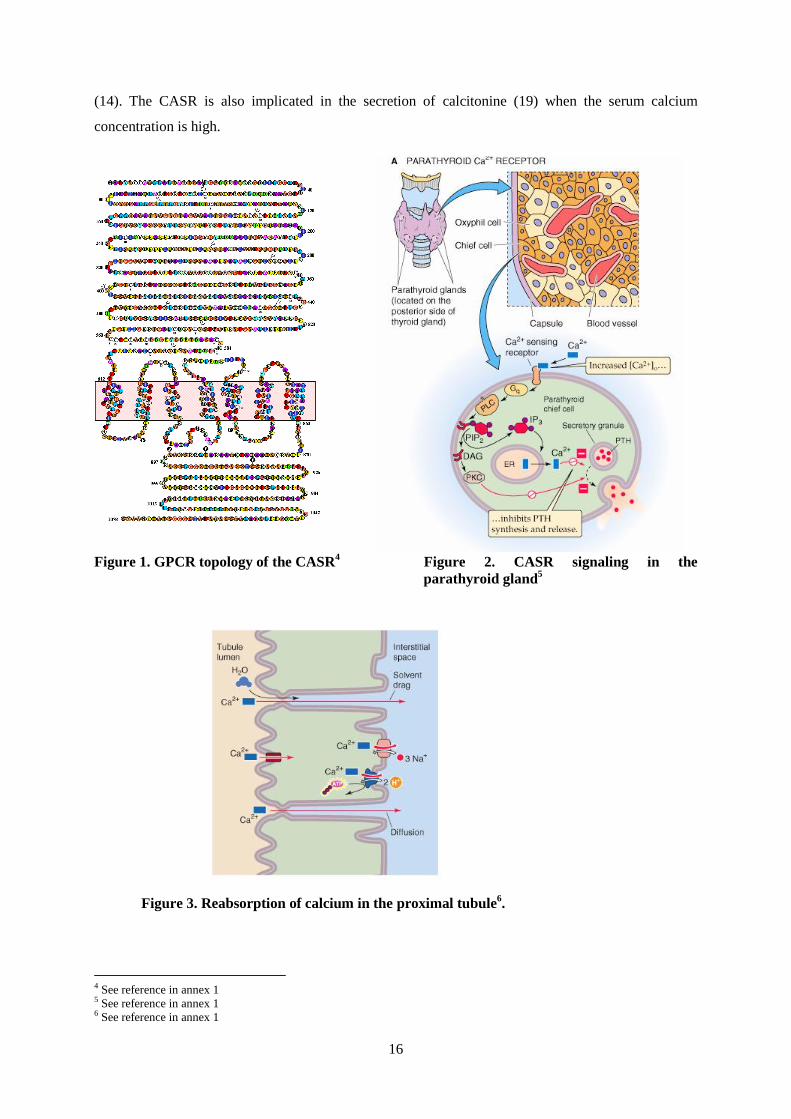
5.1. Structure (14,15)
The calcium-sensing receptor is a G-protein-coupled receptor of 1,078 amino acids (see figure 1). It
was first isolated from bovine parathyroid in 1993 (16,17). There is high homology between the
bovine and the human forms of the CASR. The receptor is composed of three parts. The extracellular
domain, made of about 610 amino acids, contains clusters of amino-acids interacting with calcium.
The N-glycosylation of these clusters can modify the level of activation of the receptor. Type I
calcimimetics (see § 5.3.) bind to this extracellular domain. The second part of the receptor contains
the 7 transmembrane domains and several intracellular loops involved in the receptor phosphorylation.
This second part of the receptor contains the site of binding of the calcimimetics type II. The C-
terminal intracellular part of the receptor is composed of 200 amino-acids. Some sequences in the
internal domain serve for the phosphorylation of the CASR by PKC, that diminishes the level of
activation of this receptor.
5.2. Localization and roles of the CASR (9,14,18)
The most studied role of the CASR is its function in the parathyroid cells, where it senses extracellular
ionized calcium concentration to modulate the secretion of the parathyroid hormone (PTH); it
increases PTH secretion when calcaemia decreases and vice versa. PTH maintains calcium level in a
narrow range by three mechanisms: 1) it enhances bon resorption, 2) it enhances calcium reabsorption
by the kidney and 3) it promotes the 1α-hydroxylation of 25-OH-vitamin D in the kidney, leading to
(1,25)-(OH)2-vitamin D, the active form of this molecule; vitamin D then enhances the reabsorption of
calcium in the gut and by the kidney. The CASR signaling in the parathyroid cells is mediated by G-
proteins, especially Gq/11 (mainly) and Gi. The result is the activation of the phospholipase C (PLC)
that stimulates the formation of inositol triphosphate (IP3) and diacylglycerol (DAG). IP3 induces the
exit of calcium from the endoplasmic reticulum, resulting in an elevation of calcium concentration in
the cytosol, and DAG activates PKC. (see figure 2).
In the parathyroid glands, CASR also prevents gland hyperplasia; that was proven by the fact that
hetero- and homozygous carriers of CASR inactivating mutations may have parathyroid hyperplasia
16
(14). The CASR is also implicated in the secretion of calcitonine (19) when the serum calcium
concentration is high.
Figure 1. GPCR topology of the CASR4 Figure 2. CASR signaling in the
parathyroid gland5
Figure 3. Reabsorption of calcium in the proximal tubule6.
4 See reference in annex 1 5 See reference in annex 1 6 See reference in annex 1

17
Figure 4. Reabsorption of
calcium in the TAL7
Figure 5. Reabsorption of calcium in the
DCT8
The CASR is also localized in the nephron, at the apical membrane of the proximal tubule, the cortical
and inner medullary collecting ducts and at the basolateral membrane of the thick ascending limb of
the loop of Henle (TAL). The signaling pathway is also mediated by G-proteins. When the CASR is
coupled with Gαi, cAMP formation decreases and the consequence is the inhibition of the Na+K
+2Cl
-
cotransporter (NKCC2) and the renal outer medullary potassium channel (ROMK). When it binds to
7 See reference in annex 1
8 See reference in annex 1

18
Gαq, PKC is activated and inhibits NKCC2. When CASR is bound to Gi/Go, the consequence is the
activation of the phospholipase type 2. PLA2 increases the degradation of arachidonic acid in 20-
hydroxyeicosatetraenoic acid (20-HETE) by the P450 or in prostaglandins by the COX-2. The role of
20-HETE is to inhibit NKCC2. However, under normal conditions, 20-HETE formation is favored,
but when CASR is activated, the COX-2 pathway is predominant (it means that calcium is
reabsorbed). In conclusion, the pathways through Gαi and Gαq work together to excrete calcium as the
Gi/Go pathway leads to reabsorption of calcium.
In the proximal tubule (see figure 3), the CASR is expressed in the apical membrane, where it is
implicated in the reabsorption of phosphate, by antagonizing the effect of the PTH (18). In this part of
the nephron, sodium is reabsorbed via the Na+/H
+ cotransporter (NHE3). This transporter is inhibited
by the PTH. The current hypothesis is that CASR may enhance sodium reabsorption by inhibiting the
PTH effect (as it inhibits the PTH effect on the phosphate reabsorption). In the TAL (see figure 4), the
CASR is localized on the basolateral membrane, where its activation inhibits NKKC2, ROMK and
Na+K
+ATPase. The consequence is a diminution of the gradient for calcium reabsorption by a less
positive lumen and a reduction of urine osmolarity. In the distal convoluted tubule (see figure 5), the
CASR is expressed on the basolateral membrane, but its role in this part of the kidney is not well-
defined. There, calcium is reabsorbed by the TRPV5 channel and sodium via the thiazide-sensitive
channel NCC (a cotransporter Na+/Cl
-). Both channels are regulated by WNK kinases. PTH activates
the TRPV5, and calcimimetics compounds reduce TRPV5 activation level in experiments, but the
mechanism is not fully understood. Note that when CASR is activated in both TAL and distal
convoluted tubules, it inhibits the action of PTH (that reabsorbs calcium) in hormone-sensitive sites of
the nephron. The CASR is also expressed in the collecting ducts, but its function is not defined. In the
macula densa, the CASR expressed on the basolateral membrane may act by sensing the interstitial
composition, affecting renin release and the tone of afferent arterioles. Maillard and Burnier (29)
recently suggested that CASR activation may decrease renin release, i.e. that CASR may be implicated
in the regulation of blood pressure via the renin-angiotensin-aldosterone system.
The role of the CASR in the regulation of sodium balance is still not fully elucidated. Desfleurs’s
hypothesis (21) is that CASR plays a role in sodium reabsorption indirectly: as it inhibits NKCC2 in
the TAL, calcium and magnesium are not reabsorbed in this part of the nephron; their delivery at the
distal part of the nephron then interferes with sodium reabsorption. However, other researchers seem
to say that CASR interferes directly with sodium reabsorption in the TAL. The in vivo observation
suggests that hypercalcaemia results in both increased calciuria and sodium excretion.
In the intestine (14,18,19), CASR modifies the transport of solutes and modulates the proliferation and
differentiation of the epithelial cells of the colon. In the placenta (14,22) it maintains calcium
homeostasis. It is also implicated in the transport of calcium in breast epithelial cells. Finally, CASR
plays a role in cell proliferation, cell differentiation and apoptosis in several other tissues (14,15).

19
5.3. Agonists and antagonists of CASR (14,15,23)
Not only calcium, but also other ligands can bind to CASR (see table 4). Those ligands are classified
in calcimimetics or calcilytic agents. Type I calcimimetics are full agonists that bind to the
extracellular domains of CASR; there are divalent cations, trivalent cations, polycations and polybasic
amino acids. Type II calcimimetics are allosteric modulators; while binding to CASR, they induce a
conformational change in the tridimensional structure of the receptor and lower its threshold of
activation. Those molecules are used to treat hyperparathyroidism because they inhibit PTH secretion.
Calcilytic agents are allosteric inhibitors of CASR used to increase the pulsatil secretion of PTH.
Balan and al. (24) have recently tried to synthesize negative allosteric modulators of the CASR that
could be used in the treatment of osteoporosis. PTH increases bone turnover (it increases formation of
bones more that resorption). The advantage of this treatment is not its mechanism of action, but relies
on the fact that the actual treatment of osteoporosis with biphosphonates is made of injections while
calcilytic agents can be taken orally.
Table 4. Agonists and antagonists of the calcium-sensing receptor
Role What Examples Effect
Type I calcimimetics Full agonists Divalent cations Ca2+,
Mg2+
, Sr2+
, Ba2+
, Cd2+
,
Co2+
, Fe2+
, Ni2+
, Pb2+
↓ PTH
Trivalent cations Gd3+
, La3+
, Eu3+
, Tb3+
, Yt3+
↓ PTH
Polycations spermine, aminoglycosides ↓ PTH
Polybasic
aminoacids
↓ PTH
Type II calcimimetics Allosteric modulators Cinacalcet ↓ PTH
Calcilytic agents Allosteric inhibitors Ronacaleret, NPS 2143,
JTT305
↑
5.4. CASR gene
The human CASR is localized on chromosome 3q13.3-21. On the CASR mutation database9, 112
mutations have been described, including 98 missense, 6 nonsense, 8 insertions or deletion and one
splice mutation. Those mutations play a role in healthy individuals as well as in people affected by a
familial disease.
9 http://www.casrdb.mcgill.ca/
20
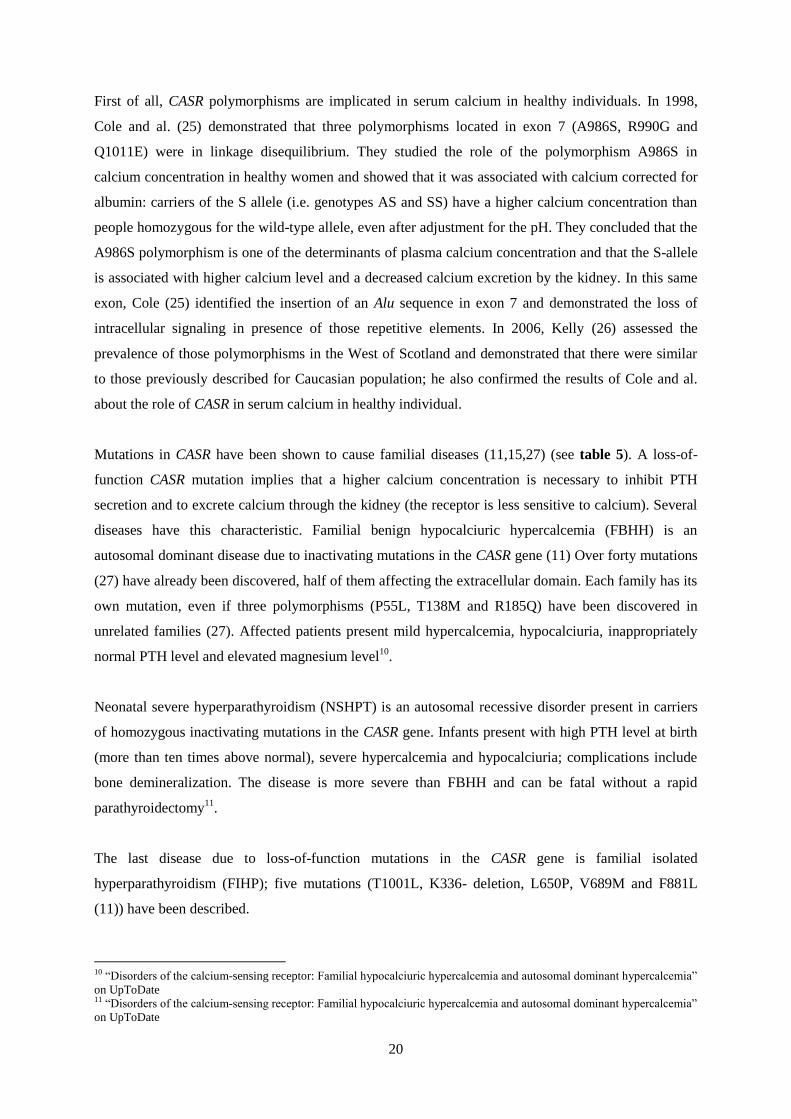
First of all, CASR polymorphisms are implicated in serum calcium in healthy individuals. In 1998,
Cole and al. (25) demonstrated that three polymorphisms located in exon 7 (A986S, R990G and
Q1011E) were in linkage disequilibrium. They studied the role of the polymorphism A986S in
calcium concentration in healthy women and showed that it was associated with calcium corrected for
albumin: carriers of the S allele (i.e. genotypes AS and SS) have a higher calcium concentration than
people homozygous for the wild-type allele, even after adjustment for the pH. They concluded that the
A986S polymorphism is one of the determinants of plasma calcium concentration and that the S-allele
is associated with higher calcium level and a decreased calcium excretion by the kidney. In this same
exon, Cole (25) identified the insertion of an Alu sequence in exon 7 and demonstrated the loss of
intracellular signaling in presence of those repetitive elements. In 2006, Kelly (26) assessed the
prevalence of those polymorphisms in the West of Scotland and demonstrated that there were similar
to those previously described for Caucasian population; he also confirmed the results of Cole and al.
about the role of CASR in serum calcium in healthy individual.
Mutations in CASR have been shown to cause familial diseases (11,15,27) (see table 5). A loss-of-
function CASR mutation implies that a higher calcium concentration is necessary to inhibit PTH
secretion and to excrete calcium through the kidney (the receptor is less sensitive to calcium). Several
diseases have this characteristic. Familial benign hypocalciuric hypercalcemia (FBHH) is an
autosomal dominant disease due to inactivating mutations in the CASR gene (11) Over forty mutations
(27) have already been discovered, half of them affecting the extracellular domain. Each family has its
own mutation, even if three polymorphisms (P55L, T138M and R185Q) have been discovered in
unrelated families (27). Affected patients present mild hypercalcemia, hypocalciuria, inappropriately
normal PTH level and elevated magnesium level10
.
Neonatal severe hyperparathyroidism (NSHPT) is an autosomal recessive disorder present in carriers
of homozygous inactivating mutations in the CASR gene. Infants present with high PTH level at birth
(more than ten times above normal), severe hypercalcemia and hypocalciuria; complications include
bone demineralization. The disease is more severe than FBHH and can be fatal without a rapid
parathyroidectomy11
.
The last disease due to loss-of-function mutations in the CASR gene is familial isolated
hyperparathyroidism (FIHP); five mutations (T1001L, K336- deletion, L650P, V689M and F881L
(11)) have been described.
10 “Disorders of the calcium-sensing receptor: Familial hypocalciuric hypercalcemia and autosomal dominant hypercalcemia”
on UpToDate 11 “Disorders of the calcium-sensing receptor: Familial hypocalciuric hypercalcemia and autosomal dominant hypercalcemia”
on UpToDate

21
On the other hand, activating mutations of the CASR gene lead to autosomal dominant hypocalcaemia
with hypercalciuria (ADHH) or type V Bartter’s syndrome. ADHH is a disorder with low PTH level,
hypocalcaemia, hypercalciuria, recurrent nephrolithiasis, and sometimes low magnesium
concentration. Over twenty-five mutations (27) are described. As in FBHH, each family has its own
mutation, but shared mutations exist (T151M, N118K, F612S and E127A (27), that is the first
mutation described as causing ADHH). As described in paragraph 4.2., type V Bartter’s syndrome
clinically includes hypokalemic alkalosis, renal salt wasting, hypotension, hyperaldosteronism, high
renin concentration, increased prostaglandin excretion, hypercalciuria and nephrocalcinosis. This type
of Bartter’s syndrome is due to activating mutations in CASR.
Table 5. Mutations in the CASR gene causing calcium disorders
Disease Type of
mutation
Polymorphisms (examples) Clinic
FBHH Loss-of-function Heterozygous mutations
P55L, T138M, R185Q
Hypercalcemia, hypocalciuria, normal PTH,
elevated magnesium
NSHPT Loss-of-function Homozygous mutations
P55L, T138M, R185Q
Severe hypercalcemia, severe hypocalciuria.
FIHP Loss-of-function T110L, K336- deletion,
L650P, V689M and F881L
Hypercalcaemia, hypercalciuria, inappropriately
high PTH levels, and isolated parathyroid tumors
with no evidence of hyperfunction of any other
endocrine tissues
ADHH Gain-of-function T151M, N118K, F612S,
E127A
Low PTH level, hypocalcaemia, hypercalciuria,
recurrent nephrolithiasis, and sometimes low
magnesium concentration
Bartter’s
syndrome
type V
Gain-of-function A843E (15) Hypokalemic alkalosis, renal salt wasting,
hypotension, hyperaldosteronism, high renin
concentration, increased prostaglandin excretion,
hypercalciuria and nephrocalcinosis
Note that auto-immune activation of the CASR is responsible for autoimmune hypoparathyroidism.
At the time being, it is not clear to what extend CASR variants play a role in bone mineral density(28),
coronary artery disease (29), controlling serum calcium (especially R990G and Q1011E) (30,31) and
PTH levels in primary hyperparathyroidism (espectiallyR990G and Q1011E) (31,32).

22
II) CoLaus data analysis
1. Methodology
1.1. CoLaus : methodology (3)
The CoLaus study is a cross-sectional population-based study whose aim is to investigate the
epidemiology and the genetic determinants of cardiovascular risk factors and of the metabolic
syndrome.
The recruitment took place in Lausanne, a city of 117,161 inhabitants. It lasted from June 2003 to May
2006. A first selection was made: only people between 35 and 75 years old were to be potentially
included in the study. The CoLaus study is not only interested in the prevalence of hypertension, but
also in cardiovascular risk factors in general. Preanalytical calculations showed that about 6,000
people had to be included in the study to detect genetic associations with diseases with a prevalence of
about 15% (as the prevalence of hypertension is 20 to 25%, there was a good chance to discover an
association).
Among the source population (i.e. every person living in Lausanne between 35 and 75 years), 19,830
(35%) received a letter inviting them to participate to the study. Among them, 54 were considered as
ineligible (because they were not living in Lausanne anymore, because they were dead or did not meet
the age criteria); 4,667 were considered as non responders (i.e. that no contact was established after
two letters and three telephone calls). Among the remaining 15,109 people, 6,189 refused to
participate (41% of responders) and 799 were ineligible (because of moving, age criteria or death). At
this stage, 8,121 agreed to participate, which represents 41% of the persons who received an invitation.
Finally, among persons who accepted to participate, 1,383 were not included because the goal was to
have about 6’000 participants and because 549 were not Caucasians. The final cohort includes 6,188
subjects.
Three inclusion criteria were necessary to participate in the study: 1) age between 35 and 75 years, 2)
Caucasian origin (i.e. having both parents and grandparents born in a restricted list of countries) and 3)
written informed consent.
Among the data obtained in this study, the blood pressure level is the most important for my work.
The blood pressure was taken three times on the left arm after a ten-minute rest in a sitting position

23
with an Omron® HEM-907 automated oscillometric sphygmomanometer (Matsusaka, Japan). This
sphygmomanometer was validated for blood pressure measuring in 2002 by El Assaad and al. (35).
Hypertension was defined in accordance to The European Societies of Hypertension and Cardiology
published guidelines described previously. DNA was extracted from leukocytes obtained by a venous
blood sample of 50 milliliters and genotyping was performed using Affymetrix 500 K SNP chip. Four
SNPs located within and around the CASR gene were selected because of their strong association with
serum calcium in CoLaus.
1.2. Statistical analysis
For this study, only a few variables were kept out of the entire database: age, sex, hypertension status,
serum calcium, corrected serum calcium, proteins, albumin, serum creatinine, systolic and diastolic
blood pressures, treatment status for angiotensin-converting enzyme inhibitors, beta-blockers, diuretics
and/or calcium-channel blockers. Four CASR SNPs were selected: rs11716910, rs10934581,
rs5008830 and rs2001548. Those SNPs were selected because they have the strongest association with
corrected serum calcium in CoLaus. The p-value for the X2 test less than
The analysis was made using Stata version 10 (Statacorp, College Station, TX, USA). First of all, the
population was described, the proportion of women and men compared, the mean age, the proportion
of hypertensive among this population and among hypertensive and the percentage of hypertensive
under treatment calculated. Then, hypertensive and normotensive were compared for age, weight,
height, BMI, systolic and diastolic blood pressure, and protein, albumin, total calcium, corrected
serum calcium and creatinine concentrations.
Then, numeric variable were generated with the SNPs, using an additive model: the value 2 was
attributed to the less frequent homozygous genotype (i.e. homozygous for the minor allele), the value
1 to the heterozygous phenotype and the value 0 to the homozygous phenotype for the major allele.
The next step was to see if genotypes were in Hardy-Weinberg equilibrium by doing a Χ2
test for
goodness of fit between observed and predicted genotypic frequencies. This test is based on the
Hardy-Weinberg distribution, that represents the mathematical relationship between allele frequencies
and genotype frequencies seen when no distorting factors are present. The criteria necessary to use
Hardy-Weinberg proportions are 1) there is no segregation distortion, 2) the allele frequencies are the
same in men and in women, 3) there is no mutation, 4) there is no migration 5) there is no selection 6)
the population size is big and 7) there is random mating. In this test, the hypothesis (H0) is that the
genotypes are in equilibrium in the population. If the p-value if the Χ2
test is <0.05, H0 of Hardy-
Weinberg equilibrium is rejected, which means that genotypes are probably not in equilibrium. If the

24
p-value is >0.05, H0 is accepted, which means that genotypes are probably in the Hardy-Weinberg
equilibrium. Only SNPs that are in Hardy-Weinberg equilibrium are usually used for further statistical
analyses.
To avoid duplicate analysis, SNPs were tabulated one with the other to see if there was a correlation,
i.e. carrying one genotype at one SNP involves always carrying a specific genotype at the second SNP.
In case of redundancy, only one of the SNPs can be used for further analyses. When two SNPs are
close enough on the same chromosome, they are usually transmitted together during meiosis. When
two SNPs do not randomly segregate in the population, they are said to be in linkage disequilibrium
(LD). LD is the non random association of two or more loci in a population. r2 is used to quantify the
LD. The higher the r2 is, the closer the two SNPs are on the chromosome and in this case, they have
great chance to be transmitted together. r2 ranges from 0 (no LD) to 1 (“complete” LD). For this test, I
calculated the r2 for: rs11716910 and rs10934581, rs11716910 and rs5008830, rs11716910 and
rs2001548, rs10934581 and rs5008830, rs10934581 an rs2001548 and rs5008830 and rs2001548.
To see if SNPs are associated with hypertension, a Χ2
test was made to compare the repartition of the
genotypes between normotensive and hypertensive. The null hypothesis (H0) is that the genotype
distributions are similar in both groups. A p-value <0.05 was considered as statistically significant and
suggested an association between the SNP and hypertension, because H0 would be rejected. A further
analysis consisted in conducting stratified analyses using a Χ2
test to compare the distribution of
genotypes across subgroups: younger versus older than 55 years old, male versus female, BMI ≥
30kg/m2 versus BMI < 30kg/m
2 (i.e. obese versus non obese), corrected calcium concentration <
2.21mM versus ≥ 2.21mM and creatinine concentration < 78.1mM versus ≥ 78.1mM (2.21mM and
78.1mM are the median values for corrected calcium and creatinine concentration, respectively). The
population was divided in two subgroups for each value, and not tertiles or quartiles, in order to have
groups big enough to be able to detect a relatively small effect of the SNPs on hypertension. These
stratified analyses aimed at exploring the presence of effect modification of selected covariates (e.g.
sex, obesity) on the association of CASR variants with hypertension.
The second question of this analysis was to see if there is a difference in the mean systolic and
diastolic blood pressures across the three genotypes (homozygous for the minor allele, homozygous
for the major allele and heterozygous). To answer this question, the ANOVA test was used. H0 in this
test is that mean values in the different subgroups (here, the three genotypes) are the same. If the p-
value of an ANOVA test is <0.05, H0 is rejected, it means that values in the different subgroups are
different. As for the Χ2
test, stratification was then made for the same variables with the same
subgroups to explore potential effect modifications
25
2. Results
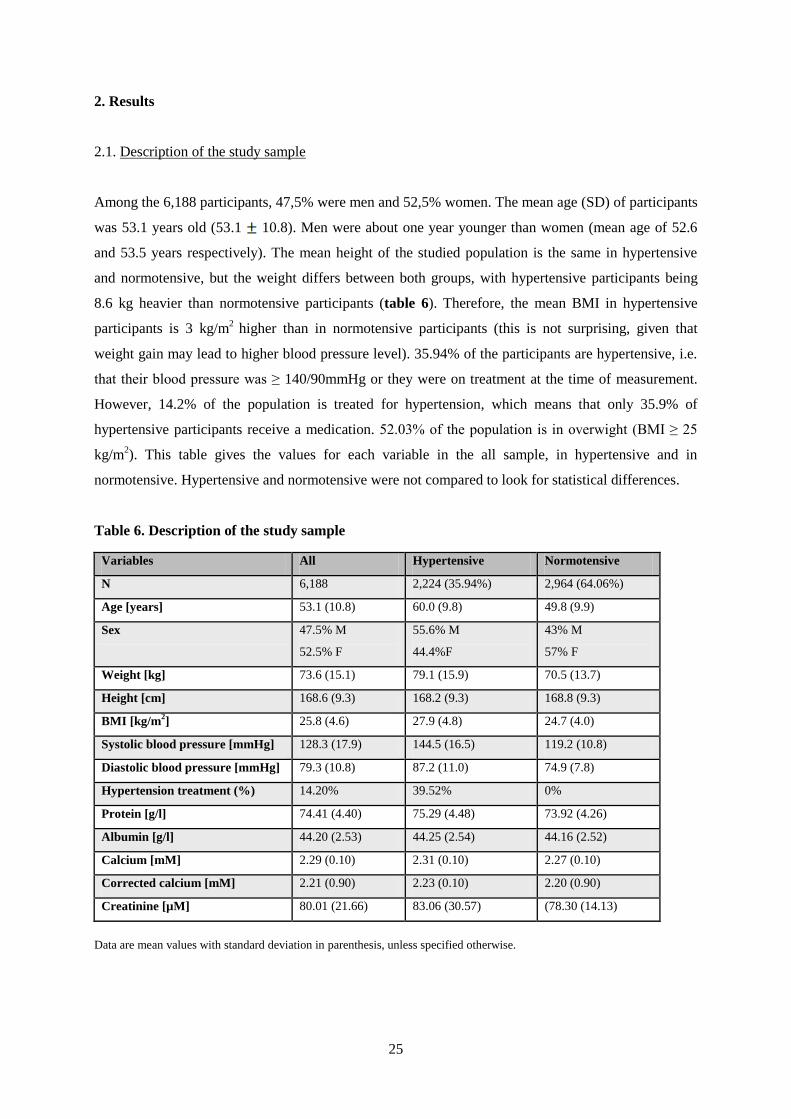
2.1. Description of the study sample
Among the 6,188 participants, 47,5% were men and 52,5% women. The mean age (SD) of participants
was 53.1 years old (53.1 10.8). Men were about one year younger than women (mean age of 52.6
and 53.5 years respectively). The mean height of the studied population is the same in hypertensive
and normotensive, but the weight differs between both groups, with hypertensive participants being
8.6 kg heavier than normotensive participants (table 6). Therefore, the mean BMI in hypertensive
participants is 3 kg/m2
higher than in normotensive participants (this is not surprising, given that
weight gain may lead to higher blood pressure level). 35.94% of the participants are hypertensive, i.e.
that their blood pressure was ≥ 140/90mmHg or they were on treatment at the time of measurement.
However, 14.2% of the population is treated for hypertension, which means that only 35.9% of
hypertensive participants receive a medication. 52.03% of the population is in overwight (BMI ≥ 25
kg/m2). This table gives the values for each variable in the all sample, in hypertensive and in
normotensive. Hypertensive and normotensive were not compared to look for statistical differences.
Table 6. Description of the study sample
Variables All Hypertensive Normotensive
N 6,188 2,224 (35.94%) 2,964 (64.06%)
Age [years] 53.1 (10.8) 60.0 (9.8) 49.8 (9.9)
Sex 47.5% M
52.5% F
55.6% M
44.4%F
43% M
57% F
Weight [kg] 73.6 (15.1) 79.1 (15.9) 70.5 (13.7)
Height [cm] 168.6 (9.3) 168.2 (9.3) 168.8 (9.3)
BMI [kg/m2] 25.8 (4.6) 27.9 (4.8) 24.7 (4.0)
Systolic blood pressure [mmHg] 128.3 (17.9) 144.5 (16.5) 119.2 (10.8)
Diastolic blood pressure [mmHg] 79.3 (10.8) 87.2 (11.0) 74.9 (7.8)
Hypertension treatment (%) 14.20% 39.52% 0%
Protein [g/l] 74.41 (4.40) 75.29 (4.48) 73.92 (4.26)
Albumin [g/l] 44.20 (2.53) 44.25 (2.54) 44.16 (2.52)
Calcium [mM] 2.29 (0.10) 2.31 (0.10) 2.27 (0.10)
Corrected calcium [mM] 2.21 (0.90) 2.23 (0.10) 2.20 (0.90)
Creatinine [µM] 80.01 (21.66) 83.06 (30.57) (78.30 (14.13)
Data are mean values with standard deviation in parenthesis, unless specified otherwise.

26
Given that normal calcium ranges from 2.2 to 2.5mM, albumin from 40 to 60g/l, creatinine from 50 to
110µM and total proteins from 60 to 80g/l, 15,7% of participants have hypocalcemia and 1,4%
hypercalcemia (9,8% and 0,4% for corrected calcium respectively), 3,2% have hypoalbuminemia, 178
subjects (2.9%) have a creatinine above 110 µM (among them, 9 have a value above 200) and 470
subjects (7.6%) have an hyperproteinemia; those participants were included in the analyses. Mean
values for the studied variables are given in table 6.
2.2. Hardy-Weinberg proportions
The results of the Χ2
test for goodness of fit between observed and predicted genotypes for the four
selected SNPs in the CASR gene are given in table 7. This table also shows the number of people
carrying the three possible genotypes (heterozygous, homozygous for the minor allele and
homozygous for the major allele).
Table 7. Hardy-Weinberg equilibrium test
SNP AA Aa Aa Total MAF P
rs11716910 2257 2446 617 5320 34.59% 0.2400
rs10934581 2335 2438 660 5433 34.58% 0.5428
rs5008830 3550 1629 203 5382 18.91% 0.3444
rs2001548 3516 1589 148 5253 17.64% 0.0480*
Data are the number of people carrying the different genotypes. AA = homozygous genotype for the major allele; Aa =
heterozygous genotype; aa= homozygous genotype for the minor allele; MAF = minor allele frequency; P=p-value for X2
test; the minor allele is G for rs11716910, T for rs10934581, A for rs2001548, A for rs5008830.
The minor allele frequencies (MAF) are above 15% for the four studied SNPs. It means that a
sufficient number of participants carry this allele and that if an allele is associated with hypertension,
SBP or DBP, there will be a sufficient number of participants to detect this effect. On the contrary, if
the MAF was 1% for example, only 60 participants of CoLaus would carry this allele.
The genotypes of one SNP (rs2001548) do not follow the Hardy-Weinberg proportion. Three main
reasons may explain this result. The first one is that one condition underlying the low of Hardy-
Weinberg is not respected in the CoLaus population. The second explanation may be a genotyping
error; to exclude this hypothesis, genotyping should be repeated, but for technical reasons, this cannot
be done for this work. The third reason is a chance finding. The consequence of this result is that this
SNP will not be used for further analyses.

27
2.3. Linkage disequilibrium between SNPs
The further tables (tables 8 to 13) give the results of tabulation of the four SNPs two by two. The r2 is
calculated here to avoid redundant calculations for further analyses. The conclusion is that there is a
strong correlation between rs11716910 and rs10934581 and between rs5008830 and rs2001548 (see
tables 8 and 13). rs2001548 was previously excluded and rs5008830 will be used for further analyses.
Among the remaining two SNPs, rs10934581 is selected for further analysis because of its higher p-
value for the Hardy-Weinberg test. In conclusion, further analysis will be made using rs10934581 and
rs2008830 only.
Table 8. Cross-tabulation of rs11716910 and rs10934581
rs10934581
rs11716910
C/C T/C T/T Total
A/A 2254 3 0 2257
G/A 34 2406 6 2446
G/G 0 15 602 617
Total 2288 2424 608 5320 r2 = 0.98
Data are the number of people carrying the genotypes.
Table 9. Cross-tabulation of rs11716910 and rs5008830
rs5008830
rs11716910
G/G A/G A/A Total
A/A 1245 842 150 2237
G/A 1690 683 49 2422
G/G 530 76 2 608
Total 3465 1601 201 5267 r2 = 0.05
Data are the number of people carrying the genotypes.
Table 10. Cross-tabulation of rs11716910 and rs2001548
rs2001548
rs11716910
G/G A/G A/A Total
A/A 1231 825 107 2163
G/A 1669 666 38 2373
G/G 532 70 1 603
Total 3432 1561 146 5139 r2= 0.05
Data are the number of people carrying the genotypes.

28
Table 11. Cross-tabulation of rs10934581 and rs5008830
rs5008830
rs10934581
G/G A/G A/A Total
C/C 1291 871 152 2314
T/C 1689 676 48 2413
T/T 569 81 3 653
Total 3549 1628 203 5380 r2= 0.05
Data are the number of people carrying the genotypes.
Table 12. Cross-tabulation of rs10934581 and rs2001548
rs2001548
rs10934581
G/G A/G A/A Total
C/C 1277 854 109 2240
T/C 1669 659 38 2366
T/T 569 75 1 645
Total 3515 1588 148 5251 r2= 0.05
Data are the number of people carrying the genotypes.
Table 13. Cross-tabulation of rs5008830 and rs2001548
rs2001548
rs5008830
G/G A/G A/A Total
G/G 3468 1 0 3469
A/G 2 1571 0 1573
A/A 0 16 147 163
Total 3470 1588 147 5205 r2= 0.99
Data are the number of people carrying the genotypes.
Figure 6 shows a linkage disequilibrium plot. The referent SNP is rs10934581, because it is the one
having the strongest association with serum calcium in CoLaus. Each square represents the position of
the SNP on the genome, represented on the abscissa; the number in parenthesis indicates the exact
position of the SNP on the genome. The green line represents the CASR gene. The blue line represents
the recombination rate on the genome (right ordinate axis). The region between two spikes define
haplotypes, it means regions of the genome transmitted together during meiosis. The color inside the
square represents the value of r2; the red indicates a r
2 of 1, the white indicates a r
2 of 0. Rs1095681 is
strongly correlated with itself and rs11716910 is also strongly correlated to the reference SNP. On the

29
contrary, rs5008830 and rs2001548 are not correlated with the reference SNP (they are correlated to
each other, but this is not represented on this figure. This graphic is consistent with the results depicted
in table 8.
Figure 6. LD plot for rs10934581, the reference SNP.
2.4. Association between CASR SNPs and hypertension
Table 14. Χ2 test for association between SNPs and hypertension.
Rs10934581 C/C T/C T/T p-values
Hypertensive 864 (43.86%) 890 (45.18%) 216 (10.96%)
Normotensive 1471 (42.48%) 1548 (44.70%) 444 (12.82%) 0.123
Rs5008830 G/G A/G A/A
Hypertensive 1289 (66.24%) 579 (29.75%) 78 (4.01%)
Normotensive 2261 (65.80%) 1050 (30.56%) 125 (3.64%) 0.686
Data are numbers of people in each group, with percentage in brackets. P-values are for the Χ2
test.

30
The Χ2
test used to compare hypertensive and normotensive doesn’t show any statistical difference in
the genotype distribution across both groups; indeed, the p-values are 0.123 for rs10934581 and 0.686
for rs5008830. The following table (table 14) gives the repartition of genotypes for each SNP across
hypertensive and normotensive. The last row gives the p-values for the Χ2 test.
2.5. Association between CASR SNPs and systolic and diastolic blood pressure
Despite no statistical association between the selected SNPs and hypertension, the ANOVA test was
used to look for differences in the mean systolic and diastolic blood pressures across the three
genotypes (table 15). As for the previous Χ2
test, p-values are above 0.3; it means that carrying one
genotype or the other leads to no statistical different blood pressure levels. Consequently, there is no
association of the selected SNPs with blood pressure levels in CoLaus. The following table gives the
values of systolic and diastolic blood pressure for both SNPs and for each genotype.
Table 15. Systolic and diastolic blood pressure according to the genotypes with ANOVA test
results.
Rs10934581 C/C T/C T/T (minor allele) P ANOVA
SBP 128.9 (0.375) 128.4 (0.358) 127.9 (0.710) 0.40
DBP 79.4 (0.226) 79.4 (0.218) 78.9 (0.404) 0.55
Rs5008830 G/G A/G A/A (minor allele) P ANOVA
SBP 128.6 (0.304) 128.2 (0.444) 128.2 (1.124) 0.72
DBP 79.3 (0.181) 79.2 (0.267) 80.2 (0.760) 0.50
Data are values of systolic and diastolic blood pressure in mmHg with standard errors in brackets. The last row gives the p-
value from an ANOVA test.
2.6. Stratified analyses
After the Χ2 test and the ANOVA test, stratification analyses were conducted to look for an association
between the SNPs and hypertension in particular subgroups of participants. The SNPs rs10934581 is
statistically associated with hypertension in people younger than 55 years old. For the same SNP, there
is a trend for an association with hypertension in women and in people with a calcium concentration
below 2.21mM (p = 0.058 and p = 0.059 respectively). The second SNP, rs5008830 is almost
associated with hypertension in obese (BMI ≥ 30kg/m2; p-value = 0.067) and in younger (p = 0.098).
Except for those results, the stratified analysis showed no further association between the SNPs and
hypertension (table 16).

31
Table 16. Χ2 test for association between SNPs and hypertension in ten subgroups of the CoLaus
cohort.
Variable rs10934581 rs5008830
<55 year 0.038* 0.098
≥55 year 0.855 0.723
Men 0.812 0.234
Women 0.058 0.541
BMI<30kg/m2 0.149 0.456
BMI≥30kg/m2 0.615 0.067
Corrected calcium <2.21M 0.059 0.233
Corrected calcium ≥2.21mM 0.823 1.000
Creatinine <78.1µM 0.331 0.446
Creatinine ≥78.1µM 0.327 0.130
Data are p-values from a Χ2
test.
The tables 17 to 21 give the systolic and diastolic blood pressure levels for each genotype of both
SNPs stratified by age, sex, BMI, corrected calcium and creatinine groups. Despite a statistical
association between rs10934581 and hypertension in people below 55 years old, the ANOVA test
shows no significant difference in the mean systolic or diastolic blood pressures in the three genotypes
as depicted in table 17. The second SNPs provides also a slightly higher SBD and DBP in
homozygous for the minor allele, but once again, it is not statistically significant.
Table 17. Association between CASR SNPs and blood pressure. Stratification by age.
Data are values of systolic and diastolic blood pressure in mmHg with standard errors in brackets. The last row gives the p-value
from an ANOVA test.
Rs10934581 C/C T/C T/T ANOVA
SBP <55 years 122.3 (0.415) 122.4 (0.394) 121.2 (0.735) 0.34
≥55 years 136.7 (0.572) 135.9 (0.562) 136.2 (1.126) 0.63
DBP <55 years 78.2 (0.302) 78.3 (0.289) 77.8 (0.515) 0.72
≥55 years 80.9 (0.336) 80.9 (0.327) 80.3 (0.633) 0.73
Rs5008830 G/G A/G A/A ANOVA
SBP <55 years 122.0 (0.326) 122.3 (0.493) 124.3 (0.320) 0.21
≥55 years 136.5 (0.469) 136.0 (0.694) 135.7 (1.779) 0.81
DBP <55 years 78.1 (0.250) 78.2 (0.357) 79.9 (1.013) 0.16
≥55 years 80.8 (0.273) 80.6 (0.398) 80.8 (1.082) 0.91
32
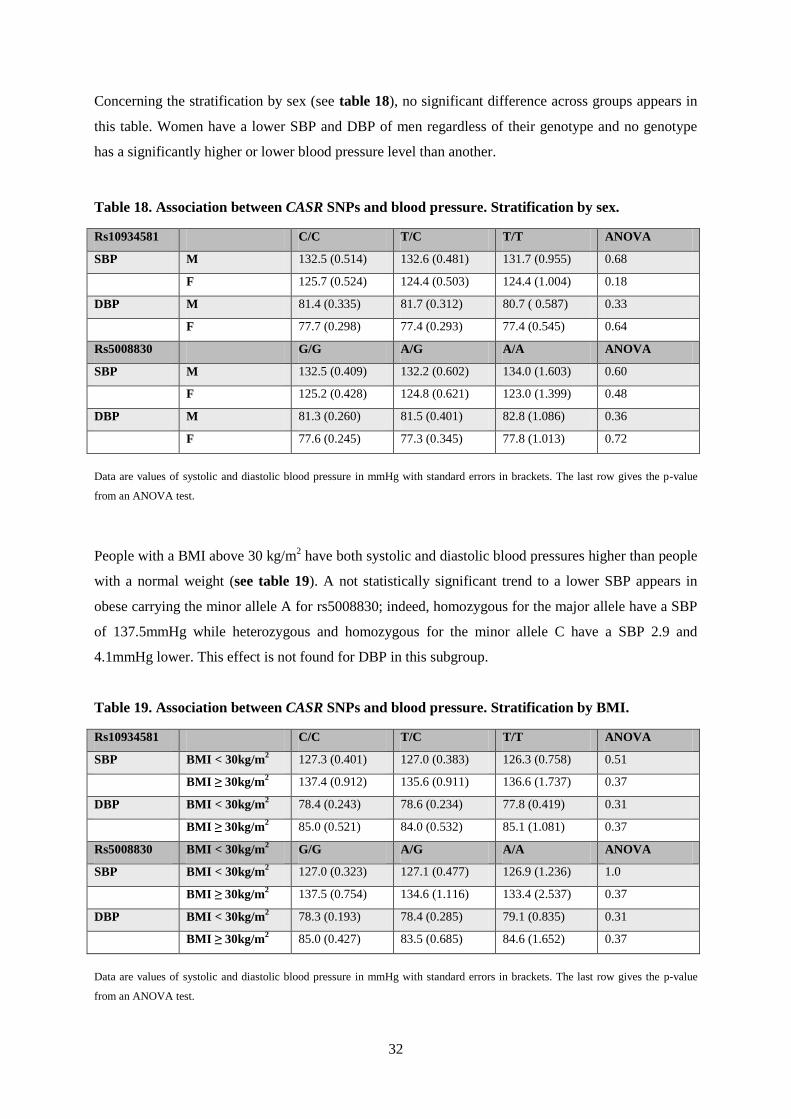
Concerning the stratification by sex (see table 18), no significant difference across groups appears in
this table. Women have a lower SBP and DBP of men regardless of their genotype and no genotype
has a significantly higher or lower blood pressure level than another.
Table 18. Association between CASR SNPs and blood pressure. Stratification by sex.
Rs10934581 C/C T/C T/T ANOVA
SBP M 132.5 (0.514) 132.6 (0.481) 131.7 (0.955) 0.68
F 125.7 (0.524) 124.4 (0.503) 124.4 (1.004) 0.18
DBP M 81.4 (0.335) 81.7 (0.312) 80.7 ( 0.587) 0.33
F 77.7 (0.298) 77.4 (0.293) 77.4 (0.545) 0.64
Rs5008830 G/G A/G A/A ANOVA
SBP M 132.5 (0.409) 132.2 (0.602) 134.0 (1.603) 0.60
F 125.2 (0.428) 124.8 (0.621) 123.0 (1.399) 0.48
DBP M 81.3 (0.260) 81.5 (0.401) 82.8 (1.086) 0.36
F 77.6 (0.245) 77.3 (0.345) 77.8 (1.013) 0.72
Data are values of systolic and diastolic blood pressure in mmHg with standard errors in brackets. The last row gives the p-value
from an ANOVA test.
People with a BMI above 30 kg/m2 have both systolic and diastolic blood pressures higher than people
with a normal weight (see table 19). A not statistically significant trend to a lower SBP appears in
obese carrying the minor allele A for rs5008830; indeed, homozygous for the major allele have a SBP
of 137.5mmHg while heterozygous and homozygous for the minor allele C have a SBP 2.9 and
4.1mmHg lower. This effect is not found for DBP in this subgroup.
Table 19. Association between CASR SNPs and blood pressure. Stratification by BMI.
Rs10934581 C/C T/C T/T ANOVA
SBP BMI < 30kg/m2 127.3 (0.401) 127.0 (0.383) 126.3 (0.758) 0.51
BMI ≥ 30kg/m2 137.4 (0.912) 135.6 (0.911) 136.6 (1.737) 0.37
DBP BMI < 30kg/m2 78.4 (0.243) 78.6 (0.234) 77.8 (0.419) 0.31
BMI ≥ 30kg/m2 85.0 (0.521) 84.0 (0.532) 85.1 (1.081) 0.37
Rs5008830 BMI < 30kg/m2 G/G A/G A/A ANOVA
SBP BMI < 30kg/m2 127.0 (0.323) 127.1 (0.477) 126.9 (1.236) 1.0
BMI ≥ 30kg/m2 137.5 (0.754) 134.6 (1.116) 133.4 (2.537) 0.37
DBP BMI < 30kg/m2 78.3 (0.193) 78.4 (0.285) 79.1 (0.835) 0.31
BMI ≥ 30kg/m2 85.0 (0.427) 83.5 (0.685) 84.6 (1.652) 0.37
Data are values of systolic and diastolic blood pressure in mmHg with standard errors in brackets. The last row gives the p-value
from an ANOVA test.

33
Table 20. Association between CASR SNPs and blood pressure. Stratification by corrected
calcium.
Rs10934581 C/C T/C T/T ANOVA
SBP Calcium < 2.21mM 124.0 (0.918) 124.1 (0.791) 124.0 (1.349) 1.0
Calcium ≥ 2.21mM 129.9 (0.408) 129.5 (0.398) 129.1 (0.822) 0.64
DBP Calcium < 2.21mM 77.2 (0.559) 77.6 (0.500) 78.4 (0.822) 0.54
Calcium ≥ 2.21mM 79.8 (0.246) 79.9 (0.241) 79.1 (0.464) 0.29
Rs5008830 G/G A/G A/A ANOVA
SBP Calcium < 2.21mM 124.7 (0.678) 122.3 (0.971) 124.2 (3.462) 0.15
Calcium ≥ 2.21mM 129.7 (0.337) 129.5 (0.490) 128.9 (1.180) 0.82
DBP Calcium < 2.21mM 77.8 (0.415) 76.9 (0.630) 78.0 (2.206) 0.52
Calcium ≥ 2.21mM 79.8 (0.200) 79.7 (0.293) 80.5 (0.808) 0.63
Data are values of systolic and diastolic blood pressure in mmHg with standard errors in brackets. The last row gives the p-value
from an ANOVA test.
Table 21. Association between CASR SNPs and blood pressure. Stratification by creatinine.
Rs10934581 C/C T/C T/T ANOVA
SBP Creat < 78.1µM 126.6 (0.530) 125.9 (0.513) 126.1 (1.036) 0.60
Creat ≥ 78.1µM 131.1 (0.524) 130.8 (0.492) 129.6 (0.962) 0.38
DBP Creat < 78.1µM 78.3 (0.315) 78.1 (0.300) 78.3 (0.577) 0.87
Creat ≥ 78.1µM 80.6 (0.321) 80.7 (0.311) 79.5 (0.565) 0.17
Rs5008830 G/G A/G A/A ANOVA
SBP Creat < 78.1µM 126.6 (0.441) 125.6 (0.615) 124.0 (1.389) 0.16
Creat ≥ 78.1µM 130.6 (0.414) 131.0 (0.626) 133.1 (1.685) 0.34
DBP Creat < 78.1µM 78.4 (0.256) 77.7 (0.357) 78.5 (1.043) 0.30
Creat ≥ 78.1µM 80.3 (0.254) 80.9 (0.391) 82.1 (1.081) 0.14
Data are values of systolic and diastolic blood pressure in mmHg with standard errors in brackets. The last row gives the p-value
from an ANOVA test.
3. Discussion
This work analyzed the association between two SNPs in or around the CASR gene (rs10934581 and
rs5008830) and hypertension in CoLaus, a population-based study. The results showed no association
of those SNPs with hypertension or systolic/diastolic blood pressure levels. In the stratified analysis,
rs10934581 was associated with hypertension in people younger than 55 years old, but other results
were not statistically significant. Nevertheless, a trend can be detected for an association of this SNP
with hypertension in women and in people with a calcium concentration below 2.21mM (p = 0.058
and p = 0.059 respectively). The second SNP, rs5008830, is almost associated with hypertension in

34
obese participants (BMI ≥ 30kg/m2; p-value = 0.067) and in younger (< 55 years; p = 0.098), but once
again, the results are not statistically significant.
Numerous candidate gene studies have been conducted to explore genetics of hypertension. So far
only three candidate gene studies focused on the association of CASR variants with hypertension
and/or blood pressure.
In 2000, Pratt and al. (33) explored the link between 3 CASR polymorphisms known to be associated
with serum calcium (25) (A986S, G990R and Q1011E) and sodium excretion and blood pressure.
Even if CASR is a channel implicated in urinary calcium excretion, they explored urinary sodium
excretion, because Fuleihan (34) and al. showed that an increase in serum calcium leads to an
increased urinary sodium excretion. They studied urinary sodium excretion in 191 black and 282 white
children (these children were chosen because of their lack of age-related cardiovascular disease, renal
disease, diabetes mellitus or medication intake, that may be confounding factors for the sodium
excretion) and blood pressure in normotensive and hypertensive white (379 people) and black (455
people) adults with a BMI less than 32 kg/m2. They found no association of these three SNPs with
sodium balance or with blood pressure. However, they found that the Q1011 allele was more prevalent
in Blacks than in Whites and that the polymorphism Q1011E was marginally associated with higher
SBP and DBP in black people (except after adjustment for multiple comparisons).
One limitation of this study may be the low allele frequency of the studied SNPs. In CoLaus, the MAF
of the SNPs studied in this work is 18% and 34%. In Pratt’s cohort, the highest MAF is 16.5% for
Q1011, but only 3 to 13% for the other alleles. As this sample size is small, especially that of the
children subgroup, it is difficult to detect a small effect of genetic polymorphisms on blood pressure.
The only effect that was demonstrated concerned the allele with the highest prevalence in the biggest
subgroup (black people were more numerous in this study than white people). In CoLaus, both the
MAF and the number of participants are higher than in Pratt’s study, but despite this, no association of
CASR SNPs with blood pressure was found.
However, in 2008, Tobin and al.(6) evaluated the effect of common variants in five genes (CASR,
NR3C2, SCNN1B, SCNN1G and KCNJ1) on blood pressure in a family-based study including 2037
Europeans from 520 families. Their first outcome was 24-hour ambulatory blood pressure (in CoLaus,
the ambulatory blood pressure is not available). Their main result was a strong association of SNPs in
the KCNJ1 with both SBP and DBP; as loss-of-function mutations in this gene cause type II Bartter’s
syndrome, a monogenic form of hypotension, one could expect that activating mutation have the
opposite effect on blood pressure and this was verified in this study. In addition, Tobin and al.
discovered that variants in the CASR gene were associated with 24-hour SBP and DBP (6). They used

35
16 SNPs of the CASR12
; one of them was rs11716910, as in this work, but it was not statistically
associated with mean 24h, mean daytime, mean night-time and clinic SBP and DBP, nor with 24h
urinary sodium, potassium and calcium (p-values were above 0.5). However, other SNPs in the CASR
were associated with those variables13
. This study shows the importance of a large sample size and the
quality of the phenotype (i.e. 24-hour blood pressure) in studies aiming at unraveling the genetic
determinants of hypertension.
In 2009, Jung and al. (36) (Jung and Pratt, who published the study described above, belong to the
same team) included, in a longitudinal study, the same black adolescents previously studied by Pratt in
2000 to look for an association between fifteen CASR SNPs and hypertension. Only the black
participants were followed since 2000, because they tend to have higher sodium retention, lower
calcium excretion as well as a blood pressure more sensitive to a diet rich in calcium or salt than
Whites. All these elements suggest that an association between genetic variants and hypertension may
be easier to detect in this ethnic group. This population-based study found three SNPs in strong
linkage disequilibrium (rs6438712, rs4678172 and rs937626) to be associated with systolic blood
pressure. This second study shows that even with a relatively small sample, a better gene coverage
(fifteen versus three SNPs) may be sufficient to detect significant associations. Despite this positive
result, Jung and al. surprisingly failed to mention their previous negative result in the bibliography and
did not clearly say that the same participants were included in both studies. But in this second study,
Jung et al added participants from a family-based study: 123 parents of the adolescents were included
in the sample. Rs4678172 was associated with blood pressure in the family-based and population-
based studies.
Jung and al. also examined the ethnic difference in urinary excretion of calcium; their previous study
examined the sodium excretion, but obtained negative results. This cross-sectional study included 106
African-Americans and European-Americans subjects and their parents (for 88 subjects) and once
again, a population-based and a family-based analysis was conducted. Six SNPs were associated with
calcium excretion, including four SNPs associated with blood pressure in both analyses. The alleles
associated with higher blood pressure were associated with a lower urinary calcium excretion. The
effect-size of the SNPs was calculated to be 2 mmHg in the population-based study and 3 mmHg in
the family-based study, which can be considered to be quite large.
These results suggest that the CASR gene might play a role in blood pressure control in the population.
The results by Jung et al are consistent with the hypothesis that CASR influences the function of
12 rs7648041, rs1048213, rs6762782, rs1973490, rs17203502, rs6783556, rs13320637, rs1354162, rs3863977, rs7647446,
rs2036399, rs11716910, rs13095172, rs1801725, rs10190 and rs7621124. 13 See annex 3

36
NKCC2 (CASR inhibits NKCC2). When the CASR is less activated, as evidenced by a lower
excretion of calcium, the blood pressure is higher. Consequently, a loss-of-function mutation in the
CASR may lead to higher sodium reabsorption and therefore to a higher blood pressure level. As
described in Jung’s article, this effect is particularly evident in African-Americans, whose NKCC2
activity is greater than in European-Americans. This ethnic difference in a channel activity suggests
that the prevention and the treatment of hypertension should not be the same for everyone; each group
and at term each person may need to receive a targeted and individual support.
As depicted in the three candidate gene studies previously described, positive results demonstrating an
association between gene polymorphisms and a multifactorial disease such as hypertension are
difficult to obtain and to replicate across studies. The CoLaus study is a large population-based study,
yet, genome-wide association studies (GWAS) showed that a study is not powerful enough if the
number of participants is less than 20,000. The difference between GWAS and candidate gene studies
is that GWAS are hypothesis free.
As depicted in the first part of this work, three GWAs were conducted since 2007 with the aim of
looking for SNPs in the human genome associated with blood pressure. The WTCCC in 2007 (38) did
not find any result and the other two consortia (Global BPgen (12) and CHARGE (13) in 2009)
detected about 20 SNPs associated with hypertension, high SBP or DBP, but none of those SNPs was
localized in classical genes implicated in blood pressure control. Those results prove that GWA is a
good method to detect genetic variants associated with common diseases such as hypertension, but
they also show that important means are necessary in term of participants, researchers, time and
money. A limitation of these studies is that they do not take into account the interactions between
genes and the influence of environmental conditions in the development of hypertension. The locus
containing the CASR gene was not found to be associated with blood pressure or hypertension in these
GWAS.
This CoLaus study has limitations that will be described below. However, to limit and detect
confounding factors of effect modifiers, stratified analyses were conducted. Confounding factors are
risk factors for a disease or a condition (here hypertension, SBP and DBP) other than the one studied
(in our case: SNPs in the CASR) that are associated both with the genetic risk factor of interest and the
outcome of interest (here blood pressure or hypertension). An effect modifier is a factor interacting
with the studied factor; both factors may have the same effect on the outcome (here: blood pressure
level and hypertension) or they can have an opposite effect. If for example, sex modifies the effect of
one SNP on blood pressure in the sense that a specific risk allele is associated with lower blood
pressure in men and higher blood pressure in women, an analysis combining men and women may fail
to detect the association of this SNP with blood pressure. A stratified analysis will allow detecting

37
such potential effect modification.
I decided to stratify for five variables. The first one was age. Blood pressure increases with age
because 1) with age, there is a structural modification in the wall of arteries leading to a loss of
elasticity and a stiffening of arteries and 2) people become more sensitive to salt with age;
hypertension itself sensitizes to salt; it is a vicious circle. Participants were divided in two subgroups,
above and below 55 years old; this age was chosen as a limit, because diastolic blood pressure
increases until the age of 55 and decreases after the age-range of 55 to 60 years old. The second
variable for stratification was sex. Men generally have a higher blood pressure level than women (it is
also the case in CoLaus). This is due to the protective action of estrogens against cardiovascular
events; postmenopausal women do not benefit from this protective effect anymore and reach the same
risk as men. Thirdly, BMI was chosen as a variable for stratification. The limit of 30 kg/m2, that is the
threshold to define obesity, was used to separate participants in two subgroups, because 1) obesity and
hypertension are two components of the metabolic syndrome; 2) weight excess leads to an increase in
blood pressure levels; 3) there is a higher proportion of hypertensive among obese than in the general
population and 4) obesity is also known to influence blood pressure sensitivity to salt. The fourth
variable included in the stratified analysis was corrected serum calcium (corrected calcium
concentration reflects the quantity of ionized calcium, which is the physiologically active calcium).
This variable was used because of the known association of CASR with serum calcium and the
potential of role of calcium in hypertension. The last variable included in the stratification was serum
creatinine. Indeed, renal function and blood pressure level closely interaction with each other. In case
of renal failure, one part of the kidney is not functional anymore and there is a compensatory
hypertrophy of the remaining functional nephrons. The renin-angiotensin-aldosterone system (RAAS)
is activated; this leads to a renal retention of sodium and water by the kidney, with finally an elevation
of the blood pressure level. The RAAS also leads to a vasoconstriction of arteries. Both these elements
contribute to a higher blood pressure level. Hypertension in turn may worsen renal function and is an
important risk factor for chronic kidney disease. Atherosclerosis in afferent and efferent arterioles of
the juxtaglomerular apparatus is the most common lesions in hypertension; they lead to a diminution
of glomerular filtration rate and tubular dysfunction.
Despite the stratification, some limitations in the CoLaus remain that may partially explain the absence
of association between the selected CASR SNPs and hypertension or blood pressure. Firstly, this study
is probably underpowered. The CoLaus study is a single-centre study; even if 6,188 subjects already
represent a large sample, it is not enough to detect the small effect that a single SNP may have on
blood pressure level. The effect sizes of the SNPs discovered by Jung were of 2 to 3 mmHg on the
blood pressure. This is quite large compared to the effect sizes discovered in recently conducted
GWAS (< 1 mm Hg).

38
Secondly, in the CoLaus study, the urinary calcium and sodium excretion were not measured. These
phenotypes are extremely important considering the role of CASR in urinary calcium excretion and
the natriuretic effect of extracellular calcium (34). Also, calcium binding to CASR inhibits the
NKCC2 in the TAL, which decreases renal tubular sodium reabsorption (39). The value of urinary
sodium is also important because salt balance is correlated to blood pressure; when the value of serum
sodium would be available, the fractional excretion of sodium could be calculated to evaluate the
function of the kidney.
Thirdly, in this work, only four SNPs were chosen and among them, only two were selected for the
analyses. One of the SNP was excluded from further analyses because it did not follow the Hardy-
Weinberg proportions (p-values for the X2 test = 0.048) and a second because of a strong correlation
with another SNP. The gene coverage was very poor which strongly limited the ability to detect any
association. A complete and more extensive analysis of the association of CASR variants with
hypertension and blood pressure in CoLaus is beyond the scope of this master’s thesis because of the
complexity of the statistical analyses. The following step after this work would be to extend the
analysis to all SNPs located within and around the CASR gene that are available in CoLaus and to
conduct haplotype-based analyses as well as potential gene-gene interactions.
One technical aspect also contributes to the insufficient gene coverage in this work. Only SNPs
present on the Affymetrix 500K chip were available. This chip does not specifically target genes and
many genes are therefore not sufficiently covered. SNPs found on the Affymetrix chip only represent a
tiny subset of currently known SNPs on the human genome. The HapMap database contains about 15
millions SNPs dispersed in the human genome. Those SNPs are markers of the heterogeneity of the
human genome, but they are not specifically located in genes. The SNPs available for the CASR gene
were selected by chance, that is without consideration of their position in the gene or even around the
gene (remember that a marker of a disease can segregate even if it is not located in the gene
responsible for the disease), nor of their function. For this work, four SNPs were selected: rs10934581,
rs5008830, rs2001548 and rs11716910. Among them, only the last one (rs11716910) is located in the
CASR gene, in an intron. The others are not located in the gene itself but in a region close to it.
Because of the low number of SNPs in this work and the fact that they may not adequately cover the
region of interest around the CASR gene, the present work should be considered as exploratory and the
negative results obtained so far do not provide sufficient evidence to exclude an implication of CASR
in hypertension or blood pressure in CoLaus. More extensive analyses are needed to further explore
the potential role of CASR SNPs in hypertension and blood pressure in CoLaus.
Despite the large number of participants, a GWA approach such as by using the Affymetrix chip in a
population-based study like CoLaus is not appropriate to detect the role of rare variants. Genome

39
sequencing approaches that allow identifying all variants within and around a specific gene should
help better understand the role of rare variants in common complex traits like hypertension.
Fourthly, another limitation of this study is that the blood pressure phenotype is based on the mean of
two out of three measurements. As described in the methodology, the blood pressure was measured
three times on the left arm after a ten-minute rest in a sitting position with an automated oscillometric
sphygmomanometer (Omron). However, following the guidelines, a diagnosis of hypertension cannot
be made at a single clinical visit. Ideally, blood pressure should be measured during several visits,
which was not the case for CoLaus. The second remark is that even if the measure was taken three
times, it represents only a single value in time and cannot accurately reflect the circadian blood
pressure pattern. The fact that the measure was not made at home is also a source of variation, because
it is known that blood pressure may be higher at the doctor’s office than at home, a phenomenon called
the white coat effect. Ideally, it would be good to have a 24-hour monitoring of the blood pressure like
in Tobin’s study or at least two groups of three measures, one at the place of the study and the other at
home. Note also that the blood pressure used for hypertensive is not the values that were measured
during the consultation. Indeed, as hypertensive people are taking medications, their measured blood
pressure is underestimated. Because of that, 15 mmHg and 10 mmHg are added to the measured SBP
and DBP respectively.
Finally, one may remind that CASR may interact with other genes or environment. The previous
review of the literature showed that the CASR is present in several tissues. In the kidney only, it
influences the function of many transporters, including NKCC2 and ROMK, both channel implicated
in Bartter’s syndrome, a monogenic form of hypotension. However, CASR is firstly a calcium sensing
receptor and may interfere with other components of calcium homeostasis, including vitamin D and
PTH. This hypothesis should be explored, because low vitamin D levels have been associated with
higher incidence of hypertension (3). Thus, vitamin D, PTH and CASR may interact in the kidney and
have repercussion on sodium balance. Maillard and al. also have demonstrated that the CASR in the
juxtaglomerular apparatus contributes to the regulation of rennin release; this suggests a potential
interaction between CASR and other components of the rennin-angiotensin-aldosterone system. Other
gene interactions may exist; including the one between CASR and SCL12A1/2 (type I and V Bartter’s
syndrome are due to monogenic mutations in those genes).
Despite an absence of association of selected CASR variants with hypertension and blood pressure in
the CoLaus study, CASR remains a good candidate gene for hypertension in humans. The first reason
to be interested in CASR as a candidate gene for hypertension is that 1) SNPs in the CASR were found
to be associated with hypertension in Jung’s study in African-Americans and 2) variants in the CASR
gene were also associated with 24-hour systolic and diastolic blood pressure in Tobin’s study. The

40
second good reason to be interested in CASR is its role in type V Bartter’s syndrome. Unlike essential
hypertension, this autosomal dominant disease manifests itself at a very young age and is a very rare
condition. People present with hypotension and hypercalciuria, while Jung’s variants are associated
with hypertension and hypocalciuria. It reinforces the idea that loss-of-function mutations in CASR
may explain hypertension in the general population. Even if known loss-of-function mutations cause
FBHH, NSHPT and FIHP, disease in which blood pressure is normal, Jung’s results suggest that other
variants may be associated with SBP or DBP.
A third reason to further explore the association of CASR variants with blood pressure is the potential
interaction with other genes. Tobin’s study showed that activating mutations in KCNJ1, the gene
implicated in type II Bartter’s syndrome, were associated with higher 24-hours SBP and DBP. We
already know that the CASR in the TAL inhibits the ROMK; it means that both channels interact with
each other. Consequently, one may hypothesize that an activating mutation in the CASR gene may lead
to a lower activity of the ROMK and to a higher blood pressure level.
Perspectives
Further studies with other data and more people may try once again to discover an association between
CASR and hypertension. A random subset of CoLaus participants has undergone 24-hour blood
pressure monitoring (Hercules study). Hercules participants also have data on 24-hour urinary sodium
and calcium excretion. It will be of major interest to explore the associations of available CASR
variants with these phenotypes in Hercules.
The goals of the studies exploring the influence of genes on blood pressure are to get better
understanding of the mechanisms of essential hypertension. The discovery of the implication of genes
in the development of hypertension may eventually have clinical applications. First of all, knowing
that a gene is an important risk factor to develop hypertension may permit to screen for people at risk
in the general population and to make targeted prevention. The actual guidelines used in the PMU in
Lausanne say that the doctor has to measure the blood pressure of every patient every two years from
the age of eighteen. The goal of screening for hypertension is to make prevention. If the genotype of
the patients is known, the prevention could target people that are especially at risk of developing
hypertension. Even if the prevention for cardiovascular risk factor is one task of all physicians, time is
sometimes lacking and targeting people at high risk of developing hypertension would be a good way
to be more effective. The final goal of such studies is not only to be able to detect hypertension, but
also to treat patients.
Drugs currently used to treat hypertension act only on a few systems: adrenergic receptors (alpha and
beta-antagonists, alpha2-agonists), calcium receptors (calcium channel blockers), renin-angiotensin
system (angiotensin-converting enzyme inhibitors, angiotensin II receptor antagonists, aldosterone

41
antagonists) and water-salt balance (diuretics). Discovering new pathways implicated in blood
pressure regulation may permit to develop new molecules to treat patients suffering from hypertension
and to develop individualized treatments.
Genetic tests aiming at detecting people who are at high risk of making an adverse drug reaction are
already marketed and can be used in clinics in specific cases (for example, Asians that have to receive
carbamazepine should be genotyped for HLAB*1502 because this genetic variant is associated with a
high risk of developing a Lyell syndrome while taking this drug). Such genetic tests could be
developed to detect people carrying mutations strongly associated with antihypertensive drug-related
side effects.
However, we do not know if genetics test may be useful to increase the rate of patients treated for
hypertension. Indeed, 35.9% of hypertensive are taking a medication in CoLaus. Several causes may
explain this low rate of treatment: 1) the screening may be insufficient, 2) physicians may not treat
every people presenting a too high blood pressure level and/or 3) patients compliance to treatment may
be low. Perhaps, knowing the genome of his patients and knowing that he may have in individualized
treatment may be a further argument to convince a physician to make prevention, to screen and to treat
his patients.
4. Conclusion
Even if genetic determinants play a role in hypertension, genes do not act alone and interactions are
possible between genes but also between genes and environmental factors such as diet. Hypertension
is a multifactorial disease with an important environmental component that researchers and physicians
working on hypertension cannot ignore. When one variant is shown to be associated with
hypertension, the effect of this single variant on the blood pressure is often very weak (<1 mmHg). For
all these reasons, studying the interaction between genes and hypertension is a very long work that
demands patience, perseverance and time, together with high financial and human resources.
42
III. Bibliography
1. Rosskopf D, Schürks M, Rimmbach C, Schäfers R. Genetics of arterial hypertension and
hypotension. Naunyn Schmiedebergs Arch. Pharmacol. 2007 Fev;374(5-6):429-469.
2. http://www.swissheart.ch/cms/dyn_media/pressroom/files/09_05_27_Zahlen_und_Fakte.
3. Firmann M, Mayor V, Vidal PM, Bochud M, Pécoud A, Hayoz D, et al. The CoLaus study: a
population-based study to investigate the epidemiology and genetic determinants of
cardiovascular risk factors and metabolic syndrome. BMC Cardiovasc Disord. 2008;8:6.
4. Lang F, Capasso G, Schwab M, Waldegger S. Renal tubular transport and the genetic basis of
hypertensive disease. Clin. Exp. Nephrol. 2005 Jun;9(2):91-99.
5. Luft FC. Molecular genetics of human hypertension. Curr. Opin. Nephrol. Hypertens. 2000
Mai;9(3):259-266.
6. Tobin MD, Tomaszewski M, Braund PS, Hajat C, Raleigh SM, Palmer TM, et al. Common
variants in genes underlying monogenic hypertension and hypotension and blood pressure in the
general population. Hypertension. 2008 Jun;51(6):1658-1664.
7. Watanabe S, Fukumoto S, Chang H, Takeuchi Y, Hasegawa Y, Okazaki R, et al. Association
between activating mutations of calcium-sensing receptor and Bartter's syndrome. The Lancet.
2002 8;360(9334):692-694.
8. Ji W, Foo JN, O'Roak BJ, Zhao H, Larson MG, Simon DB, et al. Rare independent mutations in
renal salt handling genes contribute to blood pressure variation. Nat. Genet. 2008 Mai;40(5):592-
599.
9. Gamba G, Friedman PA. Thick ascending limb: the Na(+):K (+):2Cl (-) co-transporter, NKCC2,
and the calcium-sensing receptor, CaSR. Pflugers Arch. 2009 Mai;458(1):61-76.
10 . Vargas-Poussou R, Huang C, Hulin P, Houillier P, Jeunemaître X, Paillard M, Planelles G,
Déchaux M, Miller RT, Antignac C. Functional characterization of a calcium-sensing receptor
mutation in severe autosomal dominant hypocalcemia with a Bartter-like syndrome. J Am Soc
Nephrol. 2002 Sep;13(9):2259-66.]
11 . Stechman M, Loh N, Thakker R. Genetic causes of hypercalciuric nephrolithiasis. Pediatr.
Nephrol. 2009 Dec; 24(12):2321-32
12. Newton-Cheh C, Johnson T, Gateva V, Tobin MD, Bochud M, Coin L, et al. Genome-wide
association study identifies eight loci associated with blood pressure. Nat. Genet. 2009 Mai 10;
41:666-676
13. Levy D, Ehret GB, Rice K, Verwoert GC, Launer LJ, Dehghan A, et al. Genome-wide association
study of blood pressure and hypertension. Nat. Genet. 2009 Mai 10;41:677-687
14. Goodman WG. Calcium-sensing receptors. Semin. Nephrol. 2004 Jan;24(1):17-24.
15. D'Souza-Li L. The calcium-sensing receptor and related diseases. Arq Bras Endocrinol Metabol.
2006 Aoû;50(4):628-639.
16. Bai M, Quinn S, Trivedi S, Kifor O, Pearce SH, Pollak MR, et al. Expression and characterization

43
of inactivating and activating mutations in the human Ca2+o-sensing receptor. J. Biol. Chem.
1996 Aoû 9;271(32):19537-19545.
17. Brown EM, Gamba G, Riccardi D, Lombardi M, Butters R, Kifor O, et al. Cloning and
characterization of an extracellular Ca2+-sensing receptor from bovine parathyroid. Nature. 1993
12;366(6455):575-580.
18. Huang C, Miller RT. Regulation of renal ion transport by the calcium-sensing receptor: an update.
Curr. Opin. Nephrol. Hypertens. 2007 Sep;16(5):437-443.
19. Kantham L, Quinn SJ, Egbuna OI, Baxi K, Butters R, Pang JL, et al. The calcium-sensing
receptor (CaSR) defends against hypercalcemia independently of its regulation of parathyroid
hormone secretion. Am. J. Physiol. Endocrinol. Metab. 2009 Oct;297(4):E915-923.
20. Maillard MP, Tedjani A, Perregaux C, Burnier M. Calcium-sensing receptors modulate renin
release in vivo and in vitro in the rat. J. Hypertens. 2009 Oct;27(10):1980-1987.
21. Desfleurs E, Wittner M, Simeone S, Pajaud S, Moine G, Rajerison R, et al. Calcium-sensing
receptor: regulation of electrolyte transport in the thick ascending limb of Henle's loop. Kidney
Blood Press. Res. 1998;21(6):401-412.
22. Weston AH, Absi M, Ward DT, Ohanian J, Dodd RH, Dauban P, et al. Evidence in favor of a
calcium-sensing receptor in arterial endothelial cells: studies with calindol and Calhex 231. Circ.
Res. 2005 Aoû 19;97(4):391-398.
23. Hofer AM, Brown EM. Extracellular calcium sensing and signalling. Nat. Rev. Mol. Cell Biol.
2003 Jul;4(7):530-538.
24. Balan G, Bauman J, Bhattacharya S, Castrodad M, Healy DR, Herr M, et al. The discovery of
novel calcium sensing receptor negative allosteric modulators. Bioorg. Med. Chem. Lett. 2009 Jun
15;19(12):3328-3332.
25. Cole DE, Peltekova VD, Rubin LA, Hawker GA, Vieth R, Liew CC, et al. A986S polymorphism
of the calcium-sensing receptor and circulating calcium concentrations. Lancet. 1999 Jan
9;353(9147):112-115.
26. Kelly C, Gunn IR, Gaffney D, Devgun MS. Serum calcium, urine calcium and polymorphisms of
the calcium sensing receptor gene. Ann. Clin. Biochem. 2006 Nov;43(Pt 6):503-506.
27. Gunn IR, Gaffney D. Clinical and laboratory features of calcium-sensing receptor disorders: a
systematic review. Ann. Clin. Biochem. 2004 Nov;41(Pt 6):441-458.
28. Pérez-Castrillón JL, Sanz A, Silva J, Justo I, Velasco E, Dueñas A. Calcium-sensing receptor gene
A986S polymorphism and bone mass in hypertensive women. Arch. Med. Res. 2006
Jul;37(5):607-611.
29. März W, Seelhorst U, Wellnitz B, Tiran B, Obermayer-Pietsch B, Renner W, et al. Alanine to
serine polymorphism at position 986 of the calcium-sensing receptor associated with coronary
heart disease, myocardial infarction, all-cause, and cardiovascular mortality. J. Clin. Endocrinol.
Metab. 2007 Jun;92(6):2363-2369.
30. Vezzoli G, Tanini A, Ferrucci L, Soldati L, Bianchin C, Franceschelli F, et al. Influence of
calcium-sensing receptor gene on urinary calcium excretion in stone-forming patients. J. Am. Soc.
Nephrol. 2002 Oct;13(10):2517-2523.

44
31. Rothe HM, Shapiro WB, Sun WY, Chou S. Calcium-sensing receptor gene polymorphism
Arg990Gly and its possible effect on response to cinacalcet HCl. Pharmacogenet. Genomics. 2005
Jan;15(1):29-34.
32. Corbetta S, Eller-Vainicher C, Filopanti M, Saeli P, Vezzoli G, Arcidiacono T, et al. R990G
polymorphism of the calcium-sensing receptor and renal calcium excretion in patients with
primary hyperparathyroidism. Eur. J. Endocrinol. 2006 Nov;155(5):687-692.
33. Pratt JH, Ambrosius WT, Wagner MA, Maharry K. Molecular variations in the calcium-sensing
receptor in relation to sodium balance and presence of hypertension in blacks and whites. Am. J.
Hypertens. 2000 Jun;13(6 Pt 1):654-658.
34. Fuleihan GEH, Seifter J, Scott J, Brown EM: Calcium-Regulated Renal Calcium Handling in
Healthy Men: Relationship to Sodium Handling. J Clin Endocrinol Metab 1998; 83:2366-2372
35. 35. El Assaad MA, Topouchian JA, Damé BM, Asmar RG. Validation of the Omron HEM-907
device for blood pressure measurmen. Blood Press Monit 2002 Aug; 7(4):237-41.
36. Jung J, Foroud TM, Eckert GJ, Flury-Wetherill L, Edenberg HJ, Xuei X, et al. Association of the
calcium-sensing receptor gene with blood pressure and urinary calcium in African-Americans. J.
Clin. Endocrinol. Metab. 2009 Mar;94(3):1042-1048.
37. Geller DS, Farhi A, Pinkerton N, Fradley M, Moritz M, Spitzer A, Meinke G, Tsai FT, Sigler PB,
Lifton RP. Activating mineralocorticoid receptor mutation in hypertension exacerbated by
pregnancy. Science. 2000 Jul 7;289(5476):119-23.
38. Wellcome Trust Case Control Consortium. Genome-wide association study of 14,000 cases of
seven common diseases and 3,000 shared controls. Nature 2007;447:661-78
39. Hebert SC, Brown EM, Harris HW 1997 Role of the Ca(2+)-sensing receptor in divalent mineral
ion homeostasis. J Exp Biol 200:295–302

45
IV. Annexes
Annex 1 : References of figures
Figure 1. GPCR topology of the CASR.
http://www.casrdb.mcgill.ca/?Topic=CasrGraph&v=new 12.11.2009, 2:27pm
Figure 2. CASR signaling in the parathyroid gland
http://www.studentconsult.com/content/figure.cfm?mediaISBN=0721632564&imagebodyID=F051007&ImageSeqNo=7774
6150&screenWidth=1400&screenHeight=1050
Figure 3. Reabsorption of calcium in the proximal tubule
http://www.studentconsult.com/content/figure.cfm?mediaISBN=0721632564&imagebodyID=F035016&ImageSeqNo=7756
9850&screenWidth=1400&screenHeight=1050
Figure 4. Reabsorption of calcium in the TAL
http://www.studentconsult.com/content/figure.cfm?mediaISBN=0721632564&imagebodyID=F035016&ImageSeqNo=7756
9900&screenWidth=1400&screenHeight=1050
Figure 5. Reabsorption of calcium in the DCT
http://www.studentconsult.com/content/figure.cfm?mediaISBN=0721632564&imagebodyID=F035016&ImageSeqNo=7756
9950&screenWidth=1400&screenHeight=1050
Annex 2 : References from articles coming from the website UpToDate
« Disorders of the calcium-sensing receptor : familial hypocalciuric hypercalcemia and autosomal
dominant hypercalcemia »
http://www.uptodate.com/online/content/topic.do?topicKey=calcium/6524&selectedTitle=1%7E150&source=search_result
22.04.2010, 14 :04
« Overview of vitamin D »
http://www.uptodate.com/online/content/topic.do?topicKey=bone_dis/14700&selectedTitle=1%7E150&source=search_resul
t 22.04.2010, 14 :04
« Hormonal regulation of calcium and phosphate balance »
http://www.uptodate.com/online/content/topic.do?topicKey=ren_phys/9023&selectedTitle=1%7E150&source=search_result
22.04.2010, 14 :04
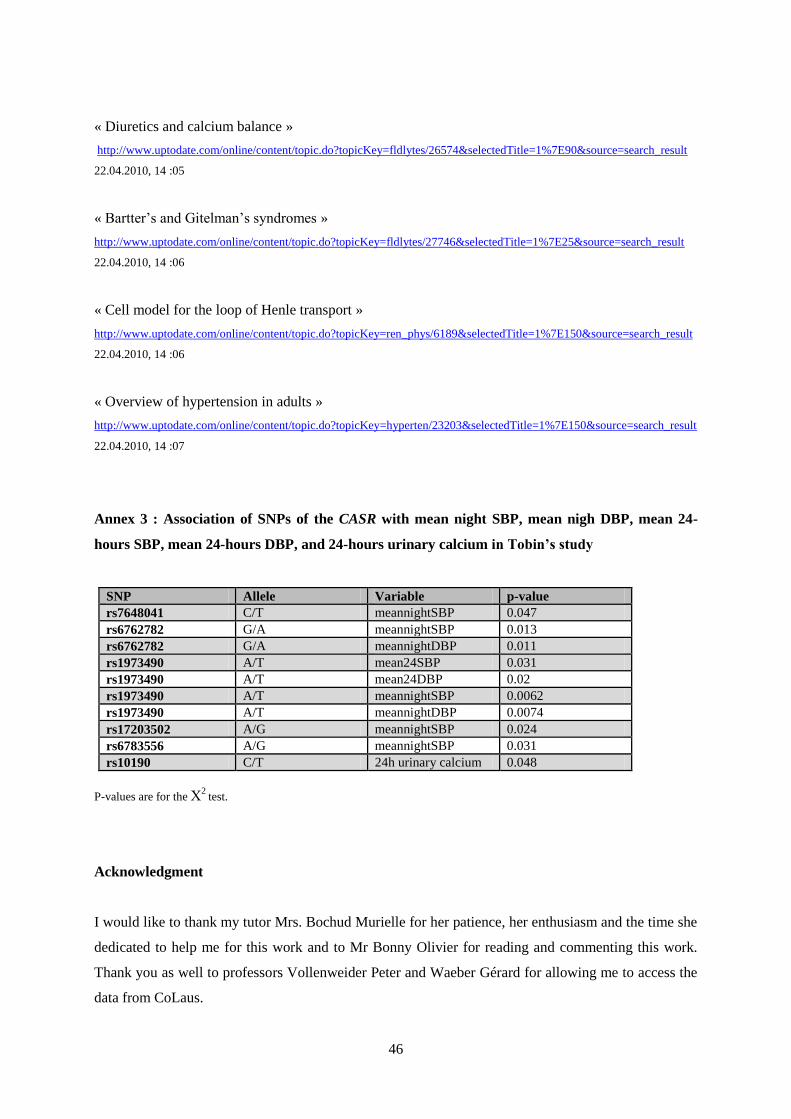
46
« Diuretics and calcium balance »
http://www.uptodate.com/online/content/topic.do?topicKey=fldlytes/26574&selectedTitle=1%7E90&source=search_result
22.04.2010, 14 :05
« Bartter’s and Gitelman’s syndromes »
http://www.uptodate.com/online/content/topic.do?topicKey=fldlytes/27746&selectedTitle=1%7E25&source=search_result
22.04.2010, 14 :06
« Cell model for the loop of Henle transport »
http://www.uptodate.com/online/content/topic.do?topicKey=ren_phys/6189&selectedTitle=1%7E150&source=search_result
22.04.2010, 14 :06
« Overview of hypertension in adults »
http://www.uptodate.com/online/content/topic.do?topicKey=hyperten/23203&selectedTitle=1%7E150&source=search_result
22.04.2010, 14 :07
Annex 3 : Association of SNPs of the CASR with mean night SBP, mean nigh DBP, mean 24-
hours SBP, mean 24-hours DBP, and 24-hours urinary calcium in Tobin’s study
SNP Allele Variable p-value
rs7648041 C/T meannightSBP 0.047
rs6762782 G/A meannightSBP 0.013
rs6762782 G/A meannightDBP 0.011
rs1973490 A/T mean24SBP 0.031
rs1973490 A/T mean24DBP 0.02
rs1973490 A/T meannightSBP 0.0062
rs1973490 A/T meannightDBP 0.0074
rs17203502 A/G meannightSBP 0.024
rs6783556 A/G meannightSBP 0.031
rs10190 C/T 24h urinary calcium 0.048
P-values are for the Χ2
test.
Acknowledgment
I would like to thank my tutor Mrs. Bochud Murielle for her patience, her enthusiasm and the time she
dedicated to help me for this work and to Mr Bonny Olivier for reading and commenting this work.
Thank you as well to professors Vollenweider Peter and Waeber Gérard for allowing me to access the
data from CoLaus.