food balance sheets (fbs) - gsars.orggsars.org/wp-content/uploads/2018/04/gs-fbs-brochure-07.pdf ·...
TRANSCRIPT
Food Balance Sheets (FBS)Producing analytical data sets for monitoring and analysing food security and food policies

Food Balance Sheets (FBS)
2
What is a Food Balance Sheet?
A Food Balance Sheet (FBS) is an aggregated and analytical data set that presents a comprehensive picture of the pattern of a country’s food supply and utilization during a specified reference period.
FBS are built on the premise that within a given country in a given year, the sum of all aspects of the supply of a given food product must be equal to the sum of utilizations of that product.
This balance is compiled for every food item (estimated on a primary-commodity-equivalent basis) consumed within a country. All primary-commodity-equivalent balances are then combined into a single overall FBS.
FBS provide estimates for every food item of per capita food available for human consumption in terms of quantity, calories, protein and fat.
BASIC FBS EQUATION
Viewing the domestic food supply and demand situation through FBS allows countries to examine conditions in a holistic way, aiding food supply analysis and facilitating food policy formulation
Food Supply Food Utilization
• Production• Imports• Stock variations
• Exports• Food availability• Food processing• Feed• Seed• Industrial utilization• Tourist food• Food loss• Residual and other
utilization

Producing analytical data sets for monitoring and analysing food security and food policies
3
FBS components
SCOPE OF dIFFERENT FBS COmPONENTS
FBS
CO
MP
ON
ENTS
SUPP
LY
PROdUCTION All production quantities of a given commodity within the country, including both commercial and non-commercial production
ImPORTS Transboundary flows of goods for a given final destination country that add to the total supply of goods available in that country
STOCk VARIATIONSDifference between the aggregate total product allocated to storage for use at a future point in time (regardless of intended future utilization) and the stock withdrawals made during the period
UTIL
IZAT
IONS
EXPORTS Transboundary flows of goods from a given country of origin that subtract from total availability of goods in that country
FOOd AVAILABILITYQuantity of any substance, whether raw, processed or semi-processed (including beverages), available for human consumption during a given reference period
FOOd PROCESSINGThe quantities of a food product that are directed towards a manufacturing process and are then transformed into a different edible commodity, with a separate entry in the FBS
FEEd All quantities of commodities, both domestically produced and imported, that are available for feeding to livestock and poultry
SEEd Any quantity of a commodity set aside for reproductive purposes in the following year
TOURIST FOOd Food that is available for consumption by non-resident visitors to a given country during the course of their stay
INdUSTRIAL USEAny quantity of a given product used in a non-food transformation or manufacturing process, including for biofuels, cosmetics, detergents, or paints
LOSS The quantities of a product that leave the supply chain and are not diverted to other uses
RESIdUAL ANd OTHER UTILIZATION
The combined imbalance and accumulated error in the supply-equals-utilization equation
For each food product of the FBS, food supply must be equal to food utilization
For a given commodity,
FBS compilers should collect data for each
FBS component
Food Balance Sheets (FBS)
4
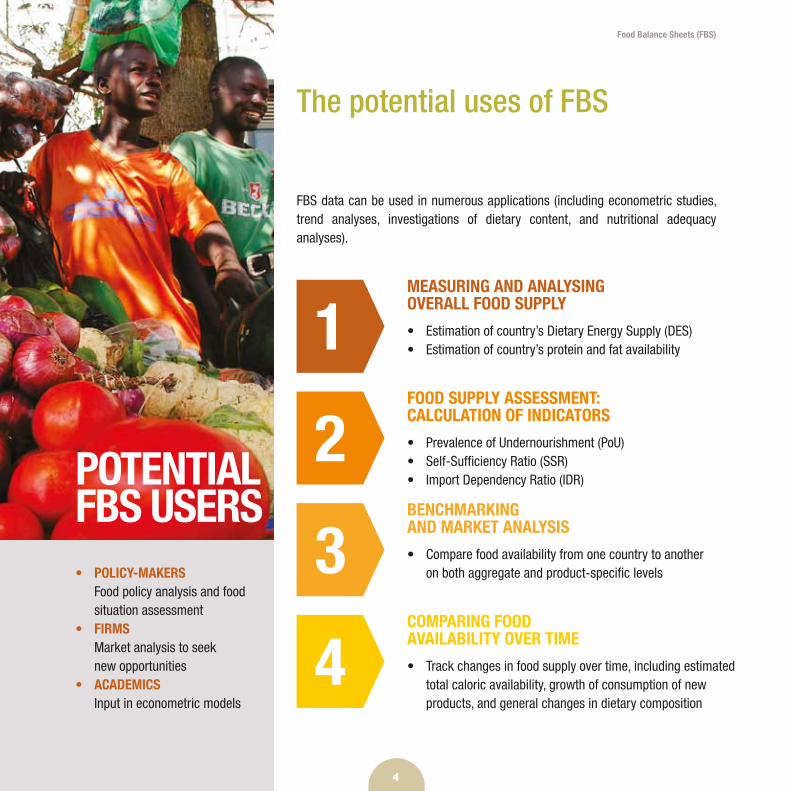
FBS data can be used in numerous applications (including econometric studies, trend analyses, investigations of dietary content, and nutritional adequacy analyses).
The potential uses of FBS
• POLICY-mAkERSFood policy analysis and food situation assessment
• FIRmSMarket analysis to seek new opportunities
• ACAdEmICSInput in econometric models
1
2
3
4
mEASURING ANd ANALYSING OVERALL FOOd SUPPLY
FOOd SUPPLY ASSESSmENT: CALCULATION OF INdICATORS
BENCHmARkING ANd mARkET ANALYSIS
COmPARING FOOd AVAILABILITY OVER TImE
• Estimation of country’s Dietary Energy Supply (DES)• Estimation of country’s protein and fat availability
• Prevalence of Undernourishment (PoU)• Self-Sufficiency Ratio (SSR)• Import Dependency Ratio (IDR)
• Compare food availability from one country to another on both aggregate and product-specific levels
• Track changes in food supply over time, including estimated total caloric availability, growth of consumption of new products, and general changes in dietary composition
POTENTIAL FBS USERS

Producing analytical data sets for monitoring and analysing food security and food policies
5
Within the Sustainable development Goal (SdG) framework, FBS contribute to the calculation of the Prevalence of Undernourishment (PoU) under SdG 2 (No Hunger) and the Global Food Loss Index under SdG 12 (Responsible consumption and production)
Producing analytical data sets for monitoring and analysing food security and food policies
5
6
7
ImPROVING NATIONAL STATISTICAL INTEGRATION
INPUT FOR NATIONAL ACCOUNTS
PROVIdING INPUT FOR ECONOmIC mOdELS
• FBS provide a framework for reconciling data, as total supply must equal total utilization• By bringing together all relevant stakeholders, problems or inconsistencies in data collection and estimation
can be identified and a country’s overall agricultural statistical program can be improved
• Fundamentally, FBS are an accounting framework specific to food and agricultural products; as such, FBS are naturally complementary to the estimation of national accounts
• FBS data can be used by several models that are structured using the supply-use format of national accounts data
• Most partial equilibrium models for agriculture utilize commodity balances in their data structures

Food Balance Sheets (FBS)
6
Data sources for FBS compilation
FBS data come from different sources that are often specific to the FBS components (production, trade data, food processing, etc.).
In the improved methodology for FBS compilation, the Food and Agriculture Organization of the United Nations (FAO) has provided recommendations for the data sources of each component.
NatioNaldata
providers
NatioNal statistical office (Nso)
MiNistry of iNdustry
MiNistry of agriculture (Ma)
coMModity orgaNizatioNs
NatioNal orgaNizatioN workiNg iN agriculture or food security
MaNufacturers’ associatioNs
MiNistry of tourisM
It is recommended to create a technical working group to better leverage the use of the various data sources and facilitate the validation of the final output

Producing analytical data sets for monitoring and analysing food security and food policies
7
International classification and FBS
Within FBS, two classifications are used:• The UN Central Product
Classification (CPC) for production data
• The Harmonized Commodity Description and Coding System (HS) of the World Customs Organization (WCO)
The mapping between these two classifications facilitate the comparison of production and trade data within the FBS context.
What if data are missing?
If data are missing for a given component for a commodity, FBS compilers may perform estimations and imputations.
In the new methodology for FBS compilation, FAO has recommended methods to derive national-level FBS estimations for each component.
iNterNatioNaldata
providers
uNited NatioNs statistics divisioN (uNsd)
usda’s productioN, supply aNd distributioN (ps&d) database
coMetrade data base
oecd-fao MediuM-terM outlook
world tourisM
orgaNizatioN (wto)
f.o. licht
world food
prograM (wfp)
agricultural Market
iNforMatioN systeM
(aMis)
POTENTIALDATA PROVIDERS

Food Balance Sheets (FBS)
8
COmPILING FBS
The most important step in compiling FBS is the establishment of Supply Utilization Accounts (SUA) for all edible commodities in a country. Once established, the SUA is standardized into their primary equivalent and aggregated into an overall FBS.
Steps for compiling FBS and estimating macronutrients
• Establish the basic FBS equation for each commodity in the SUA
Supply utilization account (Sua)
• Convert components for each SUA commodity into their primary equivalent by using extraction rate • Aggregate SUA commodity
beloging to the same commodity tree and balance the equation to obtain the FBS
Standardize SUa
AggregAte into FBS

Producing analytical data sets for monitoring and analysing food security and food policies
9
mACRONUTRIENT ESTImATES
Population data and nutrient data are combined with the food component of each SUA commodity to derive the per capita daily supplies of energy, protein and fat of each food item.
When the lines for all commodities have been included, the per capita daily supplies of energy, protein and fat for the individual commodities can then be added together up to calculate total daily supplies.
dIETARY ENERGY SUPPLY (dES) ESTImATES
The per capita estimates of caloric value for individual food products are then added together to obtain a country’s total daily per capita DES.
per capita: quaNtity, calories,
proteiN aNd fat
FOOd CONvErSiON FaCTOrSPOPulaTiON
FOOd COMPONENT FrOM Sua
FBS tools at country level
FAO, in partnership with the Global Strategy to improve Agricultural and Rural Statistics, has developed an FBS tool with R software and its Shiny package for FBS compilation at country level.
The FBS tool was tested in:• a national training workshop
in Colombo, Sri Lanka• a regional workshop for African
French-speaking countries in Dakar, Senegal
• a regional workshop for Asia-Pacific countries, in Daejeon, Republic of Korea
Within the framework of the Global Strategy’s technical assistance plan, the FBS tool is also used at country level in:• AFRICA
� Benin � Cameroon � Guinea � Madagascar � Mali
• ASIA PACIFIC � Cambodia � China � Sri Lanka � Viet Nam

Food Balance Sheets (FBS)
10
EXAmPLE OF COmmOdITY TREE ANd CORRESPONdING SUA �Commodity tree for rice
This is a sample commodity tree and SUA table, in that not all products are produced from paddy rice in every country. Also, additional products may be produced from paddy rice, including rice bran oil, starch, beer, breakfast cereals, rice-based fermented beverages and cereal preparations not elsewhere specified (not elsewhere specified).
� Corresponding SUA of the commodity tree
� Corresponding FBS line of primary equivalent after balancing and standardization
Examples of commodity tree, SUA and FBS layout
HUSkEd RICE
HULLS
mILLEd PAddY RICE BROkEN RICE
HULLS
BRAN
riCE, Paddy
Product Production Imports Exports Stock change Food Food
processing Feed Seed Net Tourist Food
Industrial Use Loss ROU
Paddy rice - - - - - - - - - - - -Husked rice - - - - - - - - - - - -Milled paddy rice - - - - - - - - - - - -
Rice bran - - - - - - - - - - - -Broken rice - - - - - - - - - - - -Rice flour - - - - - - - - - - - -
Product Production Imports Exports Stock change Food Food
processing Feed Seed Net Tourist Food
Industrial Use Loss ROU
Rice(milled equivalent) - - - - - - - - - - - -
ImPORTANT TO kNOW
FBS are presented in a primary equivalent format. For example, all derived products of wheat are standardized and aggregated up to one primary equivalent line in the FBS layout entitled “Wheat and products”.
To better conceptualize the primary/derived product relationships and better organize the standardization work, primary commodities and their derived products are organized into commodity trees.
An extraction rate is a technical conversion factor linking a food item to its derived products.
Commodity trees and extraction rates may be found in the document Technical Conversion Factors for Agricultural Commodities: http://www.fao.org/fileadmin/templates/ess/documents/methodology/tcf.pdf
Producing analytical data sets for monitoring and analysing food security and food policies
11
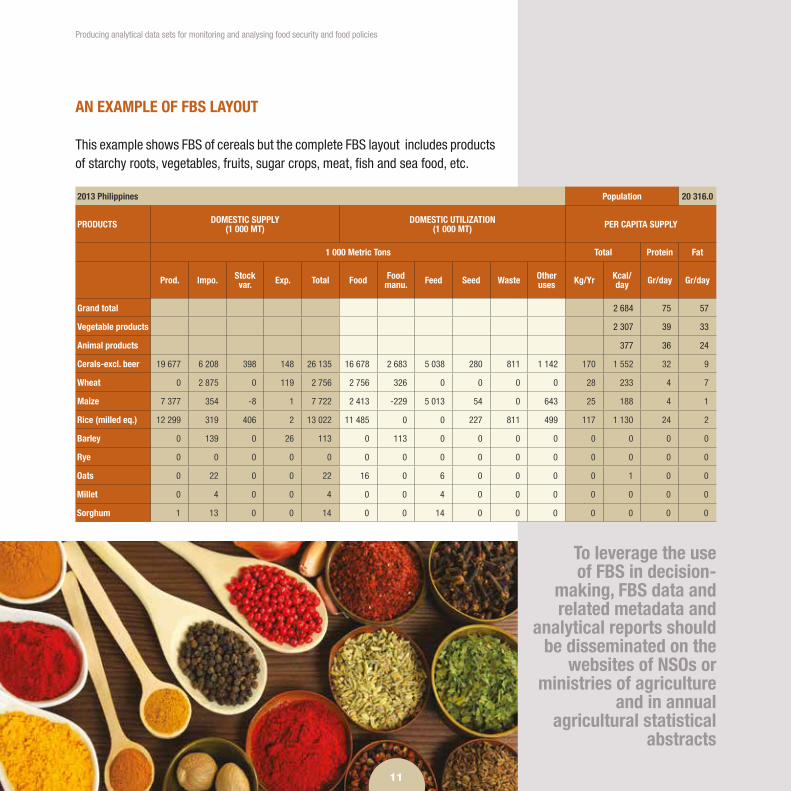
AN EXAmPLE OF FBS LAYOUT
This example shows FBS of cereals but the complete FBS layout includes products of starchy roots, vegetables, fruits, sugar crops, meat, fish and sea food, etc.
2013 Philippines Population 20 316.0
PROdUcTS dOMESTIc SUPPLY (1 000 MT)
dOMESTIc UTILIZATION (1 000 MT) PER cAPITA SUPPLY
1 000 Metric Tons Total Protein Fat
Prod. Impo. Stock var. Exp. Total Food Food
manu. Feed Seed Waste Other uses Kg/Yr Kcal/
day Gr/day Gr/day
Grand total 2 684 75 57
Vegetable products 2 307 39 33
Animal products 377 36 24
cerals-excl. beer 19 677 6 208 398 148 26 135 16 678 2 683 5 038 280 811 1 142 170 1 552 32 9
Wheat 0 2 875 0 119 2 756 2 756 326 0 0 0 0 28 233 4 7
Maize 7 377 354 -8 1 7 722 2 413 -229 5 013 54 0 643 25 188 4 1
Rice (milled eq.) 12 299 319 406 2 13 022 11 485 0 0 227 811 499 117 1 130 24 2
Barley 0 139 0 26 113 0 113 0 0 0 0 0 0 0 0
Rye 0 0 0 0 0 0 0 0 0 0 0 0 0 0 0
Oats 0 22 0 0 22 16 0 6 0 0 0 0 1 0 0
Millet 0 4 0 0 4 0 0 4 0 0 0 0 0 0 0
Sorghum 1 13 0 0 14 0 0 14 0 0 0 0 0 0 0
To leverage the use of FBS in decision-
making, FBS data and related metadata and
analytical reports should be disseminated on the
websites of NSOs or ministries of agriculture
and in annual agricultural statistical
abstracts

Statistics Division (ESS)
Food and Agriculture Organization of the United Nations
Viale delle Terme di Caracalla, 00153 Rome, Italy
www.gsars.org
Cover photo: © Michael Stern, page 2 © World Bank/Arne Hoel, page 3 © Michael Stern, page 4 © World Bank/Arne Hoel, page 6 © World Bank/Maria Fleischmann, page 7 © FAO/Danfung Dennis, page 8 © World Bank/Markus Kostner, page 11 © Michael Stern
March 2018
Training Course on Food Balance Sheets – English http://gsars.org/en/training-course-on-food-balance-sheets-english/
Training Course on Food Balance Sheets – French http://gsars.org/en/training-course-on-food-balance-sheets-french/
Handbook on Food Balance Sheets http://www.fao.org/docrep/003/x9892e/x9892e00.htm
National FBS compilation Users’ Guide
Guidelines for the compilation of Food Balance Sheets (EN-FR)
Guidelines for the compilation of Food Balance Sheets
Guidelines for the com
pilation of Food Balance Sheets