food labelling issues: quantitative research with consumers a presentation to food standards...
TRANSCRIPT

FOOD LABELLING ISSUES: QUANTITATIVE FOOD LABELLING ISSUES: QUANTITATIVE RESEARCH WITH CONSUMERSRESEARCH WITH CONSUMERS
A Presentation toFood Standards Australia New Zealand
(FSANZ)
Job Number C02020May 2003

2
LABEL ELEMENT LABEL CONSUMERS
1. Overview 3. Overview2. ChooseSpecific Element
4. ChooseConsumer Segment
Click Boxes 1 to 6 for further detail
5. Background and Objectives
6. Methodology
Main MenuMain Menu

3
OVERVIEW OF LABEL ELEMENTS
Click Boxes 1 to 4 for further detail
1. Needs &Attitudes
4. Label Interpretation
3. Use2. Awareness
Label Element MenuLabel Element Menu
Back to Main Menu

4
Ingredient List
NIP
Endorsements
Health Claim
Allergen Declaration
Nutrient Claim
Date Mark
GMO
Country of Origin
Percentage Labelling
Advisory Statement
Warning Statement
Irradiated Foods
Preparation/Storage
Novel Food
Click Label Element Box for further detail
Label Element MenuLabel Element Menu
Back to Main Menu

5Background to the ResearchBackground to the Research
In 2002, NFO Donovan Research was commissioned to conduct a quantitative study with consumers in Australia and New Zealand. The purpose of the research was to asses the impact of the changed labelling provisions featured in the new joint Australia New Zealand Food Standards Code (the Code.) This entailed the analysis of:
consumer awareness of label elements; the level of consumer understanding of label elements; and the role of labels in making informed choices about food products.
This research is based on qualitative research conducted by NFO Donovan Research in
2001 for FSANZ. It provides baseline data for the future evaluation of the new labelling
provisions in the Code, that came into full effect on 20 December 2002.

6
Specifically, the research provides baseline data on the following:
What consumers currently look for in the labels of packaged food and in unpackaged food;
Whether consumers are familiar with the various major labelling elements and new labelling information.;
Whether and how consumers use labelling information, and their reasons;
Concern about the clarity and trustworthiness of label elements;
Whether changes to labelling have changed consumers’ purchasing decisions, and if so in relation to which element in particular;
Whether consumers are able to interpret labels correctly;
Which label elements consumers find difficult to interpret.
Research ObjectivesResearch Objectives
Back to Main Menu

7
Overview: The interviews were conducted door-to-door with the general public in
Australia and New Zealand during August and September 2002. All participants were aged 18 or over and a mix of main grocery shoppers and
non-grocery shoppers was obtained All participants were offered a $2 scratch lottery ticket as an incentive to take
part in the research. The total number of interviews conducted was n=1940
MethodologyMethodology
Sydney Melbourne Perth Adelaide Hobart Canberra Darwin Brisbane
Australian = 1259
New Zealandn = 681
Auckland Christchurch Whangarei Hamilton Tauranga Rotorua Gisborne Invercargill
NapierHastingsPalmerston NthDunedinWanganuiNelsonTimaru

8
The Questionnaire
The questionnaire was developed in close consultation with FSANZ, to be administered face to face to consumers in the major cities of Australia and New Zealand.
Interviews were conducted door-to-door, by interviewers from IQCA accredited fieldwork companies : SurveyTalk (Australia) and NFO New Zealand.
All interviewers were fully briefed on the project in person, and all efforts were made to ensure they had a high degree of familiarity and comprehension of the questionnaire.
The final version of the questionnaire was 26 pages in length, and the average interview running time was 34 minutes in New Zealand and 30 minutes in Australia
MethodologyMethodology

9
Pre-test and Pilot Test
The development and testing of the questionnaire and stimulus materials included four stages:
Stage 1: Consultation with and extensive feedback from key FSANZ staff in Australia
and New Zealand, on the questionnaire framework and flow chart, developed by NFO Donovan Research.
Stage 2: Question pre-testing using cognitive interviewing and group discussions.
Stage 3: Formal pilot in Australia (Sydney) via n=30 interviews, followed by interviewer
debrief. Improvements to question wording, length and stimulus materials were made after this stage.
Stage 4: Formal pilot in New Zealand (Auckland) via n=20 interviews, followed by
interviewer debrief.
MethodologyMethodology

11Sample DemographicsSample DemographicsThe table below details the age categories of survey participants, compared to National 2001 Census Data collected by the Australian Bureau of Statistics and Statistics New Zealand (2001).
Denotes a statistically significant difference within the subgroups at the 95% confidence level

12Sample DemographicsSample DemographicsGender, Ethnicity and LanguageDemographics of the sample
Education statistics of the sample
Denotes a statistically significant difference within the subgroups at the 95% confidence level
Aust. %
N.Z %
Total %
Primary School
5 2 4
Year 10/ Form 5 (NZ)
20 24 21
Year 11 or 12/ Form 6 (NZ)
28 20 25
Trade quals. 9 7 8Certificate/ diploma
16 18 16
Degree 17 19 18Higher quals 5 10 7
Highest Level of Education
Aust. %
NZ %
Total %
Male 29 36 33Female 71 64 67
Aboriginal / Maori
1 11 4
Torres Strait /Pacific Islander
0.1 6 2
English 89 91 89Other 11 10 11
Language
Gender
Ethnicity

13Sample DemographicsSample DemographicsHousehold situation statistics of the sample
Proportion of main grocery shoppers in the sample, and reported income brackets of all participants
**Total household income proportions do notaccount for currency exchange rates between Australia and New Zealand
Denotes a statistically significant difference within the subgroups at the 95% confidence level
Back to Main Menu

14Special NeedsSpecial Needs
2%
3%
3%
4%
4%
5%
6%
7%
7%
8%
8%
11%
18%
21%
41%
0% 5% 10% 15% 20% 25% 30% 35% 40% 45% 50%
None
High BP/cholesterol
General health
Asthma
Diabetes
Food allergy, excluding nuts
Heart disease
Weightloss
Vegetarian / vegan
Migraine
Digestive
Allergy to nuts
Training for sports
Religous / ethical beliefs
Pregnancy / breast feeding
Q1. Do you or any members of your family have any special needs listed on this card and are therefore more careful about choosing food products?BASE: All respondents n=1940

15AttitudesAttitudes
3%
8%
34%
43%
12%
2%5%
43%
39%
13%
3%
9%
30%
45%
10%
0%
10%
20%
30%
40%
50%
60%
I'm not at allconcerned about thehealth or nutritional
value of the foods thatI choose
I usually don't worryabout the health or
nutritional value
I sometimes like tochoose healthy ornutritious foods
depending on cost andconvenience
I regularly choose thehealthy alternative
I always choose thehealthy alternative
Total Australia New Zealand
Q2. Here are five statements about buying food and I’d like you to tell me which one best describes how you feel when buying food for your household.
BASE: All respondents n=1940
Denotes a statistically significant difference between the subgroups at the 95% confidence level

16Attitudes by Special NeedsAttitudes by Special Needs
3%
8%
34%
43%
12%
1%4%
31%
50%
14%
5%
12%
39%
33%
9%
0%
10%
20%
30%
40%
50%
60%
I'm not at allconcerned about thehealth or nutritional
value of the foods thatI choose
I usually don't worryabout the health or
nutritional value
I sometimes like tochoose healthy ornutritious foods
depending on cost andconvenience
I regularly choose thehealthy alternative
I always choose thehealthy alternative
Total Special Needs No Special Needs
Q2. Here are five statements about buying food and I’d like you to tell me which one best describes how you feel when buying food for your household.
BASE: All respondents n=1940
Denotes a statistically significant difference between the subgroups at the 95% confidence level

17Attitudes by GenderAttitudes by Gender
3%
8%
34%
43%
12%
5%
11%
38% 37%
9%
2%
6%
32%
46%
14%
0%
10%
20%
30%
40%
50%
60%
I'm not at allconcerned about thehealth or nutritional
value of the foods thatI choose
I usually don't worryabout the health or
nutritional value
I sometimes like tochoose healthy ornutritious foods
depending on cost andconvenience
I regularly choose thehealthy alternative
I always choose thehealthy alternative
Total Male Female
Q2. Here are five statements about buying food and I’d like you to tell me which one best describes how you feel when buying food for your household.
BASE: All respondents n=1940
Denotes a statistically significant difference between the subgroups at the 95% confidence level

18Attitudes by AgeAttitudes by Age
3%
8%
34%
43%
12%
0%
10%
20%
30%
40%
50%
60%
I'm not at allconcerned about thehealth or nutritional
value of the foods thatI choose
I usually don't worryabout the health or
nutritional value
I sometimes like tochoose healthy ornutritious foods
depending on cost andconvenience
I regularly choose thehealthy alternative
I always choose thehealthy alternative
Total 18-24 25-44 45-64 65+ years
Q2. Here are five statements about buying food and I’d like you to tell me which one best describes how you feel when buying food for your household.BASE: All respondents n=1940

19Attitudes by AgeAttitudes by Age
3%
8%
34%
43%
12%
6%
15%
47%
21%
2%
42%
2%5%
51%
14%
10%7%
37%
11%
28%
5%7%
30%
46%
12%
0%
10%
20%
30%
40%
50%
60%
I'm not at allconcerned about thehealth or nutritional
value of the foods thatI choose
I usually don't worryabout the health or
nutritional value
I sometimes like tochoose healthy ornutritious foods
depending on cost andconvenience
I regularly choose thehealthy alternative
I always choose thehealthy alternative
Total 18-24 25-44 45-64 65+ years
Q2. Here are five statements about buying food and I’d like you to tell me which one best describes how you feel when buying food for your household.BASE: All respondents n=1940
Denotes a statistically significant difference to unmarked subgroups at the 95% confidence level

20Specific Consumer AttitudesSpecific Consumer Attitudes
“I’ve always been able to find any information I need on a food or drink label.”
“When I read the labels on food products, I just focus on one of two things, such as the levels of fat or if there are preservatives.”
“Generally speaking, it’s easy to understand and use the information on food labels.”
“I find some information on food labels really useful or important.”
“It’s hard to tell which parts of the label are advertising and which are standard information manufacturers have to put on it.”
“I don’t have enough time to read food labels when I’m shopping even if I wanted to.”
Q3. Here are a number of things other people have said about selecting food products. How strongly do you agree or disagree with each statement?

21
15%
37%
32%
7%
9%
-60%
-40%
-20%
0%
20%
40%
60%
80%
100%
Attitudes continuedAttitudes continuedQ3. How strongly do you agree or disagree with each statement?BASE: All respondents n=1940
“I’ve always been able to find any information I need on a food or drink label.”
Denotes a statistically significant difference in overall agreement or disagreement (combined strongly or tend to) between the subgroups at the 95% confidence level
Strongly agree Tend to agree Neither agree or disagree Tend to disagree Strongly disagree

22Attitudes continuedAttitudes continued
15% 16% 13%25% 18% 12% 13% 18%
37% 38%35%
49%
43%
32% 35%41%
6%
7%
32% 30% 34%
9%24%
38% 36%26%
6%
11%
7%
6%
8%
16%
9%6%7%
10%
2%
9%9%9%
-60%
-40%
-20%
0%
20%
40%
60%
80%
100%
Q3. How strongly do you agree or disagree with each statement?BASE: All respondents n=1940
Health ConsciousCountryTotal
“I’ve always been able to find any information I need on a food or drink label.”
Special Needs
38%
65%48%
Strongly agree Tend to agree Neither agree or disagree Tend to disagree Strongly disagree
Denotes a statistically significant difference in overall agreement or disagreement (combined strongly or tend to) between the subgroups at the 95% confidence level
41%
51%
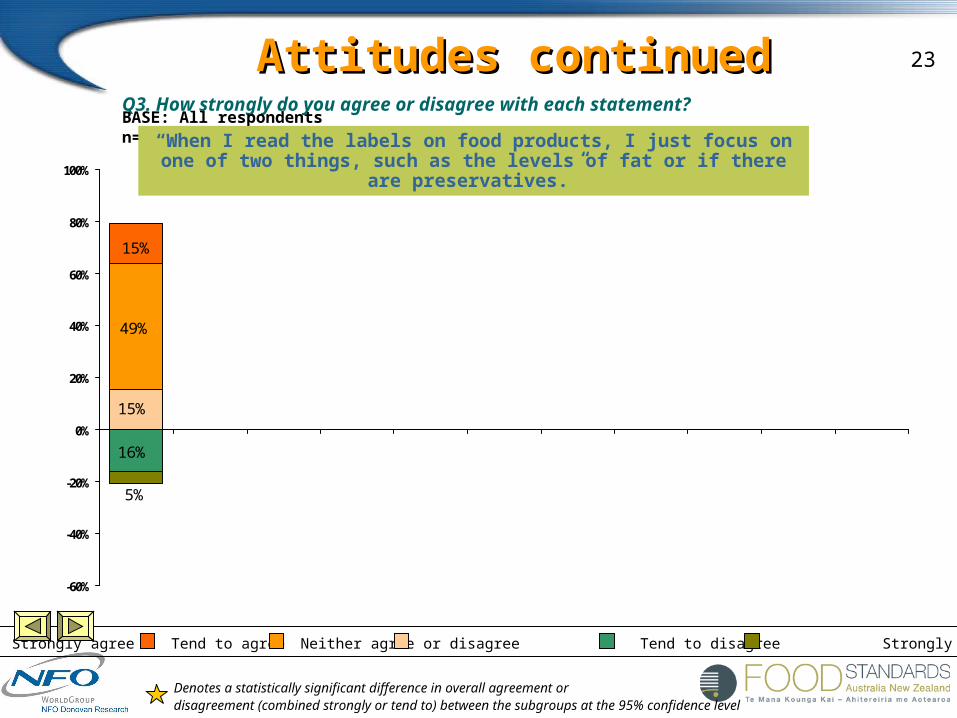
23
49%
15%
15%
16%
5%
-60%
-40%
-20%
0%
20%
40%
60%
80%
100%
Attitudes continuedAttitudes continuedQ3. How strongly do you agree or disagree with each statement?BASE: All respondents n=1940
“When I read the labels on food products, I just focus on one of two things, such as the levels of fat or if there are preservatives.”
Strongly agree Tend to agree Neither agree or disagree Tend to disagree Strongly disagree
Denotes a statistically significant difference in overall agreement or disagreement (combined strongly or tend to) between the subgroups at the 95% confidence level

24Attitudes continuedAttitudes continued
25%10% 12%
19%
49% 50% 46% 25%47%
52% 50%46%
16% 13%
16% 16% 19% 15% 16% 15%
5% 5%
15% 15% 15% 21%
16%13%
14%
18%13%15%
16% 17%4%
5%18%
5%5%5%
-60%
-40%
-20%
0%
20%
40%
60%
80%
100%
Australia
New Z
ealand
Not at A
ll
Modera
tely
Highly
YesNo
Q3. How strongly do you agree or disagree with each statement?BASE: All respondents n=1940
Health ConsciousCountryTotal
“When I read the labels on food products, I just focus on one of two things, such as the levels of fat or if there are preservatives.”
Special Needs
68%
Strongly agree Tend to agree Neither agree or disagree Tend to disagree Strongly disagree
Denotes a statistically significant difference in overall agreement or disagreement (combined strongly or tend to) between the subgroups at the 95% confidence level
60%
39%

25
43%
17%
10%
23%
7%
-40%
-20%
0%
20%
40%
60%
80%
100%
Attitudes continuedAttitudes continuedQ3. How strongly do you agree or disagree with each statement?BASE: All respondents n=1940
“Generally speaking, it’s easy to understand and use the information on food labels.”
Strongly agree Tend to agree Neither agree or disagree Tend to disagree Strongly disagree
Denotes a statistically significant difference in overall agreement or disagreement (combined strongly or tend to) between the subgroups at the 95% confidence level

26Attitudes continuedAttitudes continued
25%16% 15% 19%
43% 42% 45%35%
45%42% 43%
43%
9%10%
24% 21%5%
21% 26% 20%
7%7%
17% 18% 15% 18%
9%9%
19%
13%8%10%
23% 25%
6% 7%
9%
5%8%7%
-40%
-20%
0%
20%
40%
60%
80%
100%
Australia
New Z
ealand
Not at a
ll
Modera
tely
Highly
YesNo
Q3. How strongly do you agree or disagree with each statement?BASE: All respondents n=1940
Health ConsciousCountryTotal
“Generally speaking, it’s easy to understand and use the information on food labels.”
Special Needs
50%
27%
Strongly agree Tend to agree Neither agree or disagree Tend to disagree Strongly disagree
Denotes a statistically significant difference in overall agreement or disagreement (combined strongly or tend to) between the subgroups at the 95% confidence level
33%
58%
14%

27Attitudes continuedAttitudes continued
15%
54%
23%
6%
1%
-35%
-15%
5%
25%
45%
65%
85%
Q3. How strongly do you agree or disagree with each statement?BASE: All respondents n=1940
“I find some information on food labels really useful or important.”
Strongly agree Tend to agree Neither agree or disagree Tend to disagree Strongly disagree
Denotes a statistically significant difference in overall agreement or disagreement (combined strongly or tend to) between the subgroups at the 95% confidence level

28Attitudes continuedAttitudes continuedQ3. How strongly do you agree or disagree with each statement?BASE: All respondents n=1940
Health ConsciousCountryTotal“I find some information on food labels really useful or important.”
Special Needs
Strongly agree Tend to agree Neither agree or disagree Tend to disagree Strongly disagree
Denotes a statistically significant difference in overall agreement or disagreement (combined strongly or tend to) between the subgroups at the 95% confidence level
15% 16% 13% 18% 23%9% 12%
20%
54% 55%52%
33%
52%
56% 54%
54%
28% 17%
5% 7%
23% 20%28%
12%
16%27%
7%6% 5%
25%
7% 6%
2%1%1% 1%1%
7%
1%1%
-35%
-15%
5%
25%
45%
65%
85%
84%
45%

29Attitudes continuedAttitudes continued
21%
35%
26%
12%
5%
-40%
-20%
0%
20%
40%
60%
80%
100%
Q3. How strongly do you agree or disagree with each statement?BASE: All respondents n=1940
“It’s hard to tell which parts of the label are advertising and which are standard information manufacturers have to put on it.”
Strongly agree Tend to agree Neither agree or disagree Tend to disagree Strongly disagree
Denotes a statistically significant difference in overall agreement or disagreement (combined strongly or tend to) between the subgroups at the 95% confidence level

30Attitudes continuedAttitudes continued
21% 23% 19%28% 23% 20% 19% 25%
35% 35%34%
23% 36%35% 36%
33%
12%12%
26% 24% 29% 28%23% 28% 26% 25%
5% 5%
13%12%
14%11%13%
12%
5%5%
2%5%
4%5%
-40%
-20%
0%
20%
40%
60%
80%
100%
Q3. How strongly do you agree or disagree with each statement?BASE: All respondents n=1940
Health ConsciousCountryTotal
“It’s hard to tell which parts of the label are advertising and which are standard information manufacturers have to put on it.”
Special Needs
28%
28%
Strongly agree Tend to agree Neither agree or disagree Tend to disagree Strongly disagree
Denotes a statistically significant difference in overall agreement or disagreement (combined strongly or tend to) between the subgroups at the 95% confidence level
34%
30%

31Attitudes continuedAttitudes continued
18%
24%
36%
7%
15%
-80%
-60%
-40%
-20%
0%
20%
40%
60%
80%
100%
Q3. How strongly do you agree or disagree with each statement?BASE: All respondents n=1940
“I don’t have enough time to read food labels when I’m shopping even if I wanted to.”
Strongly agree Tend to agree Neither agree or disagree Tend to disagree Strongly disagree
Denotes a statistically significant difference in overall agreement or disagreement (combined strongly or tend to) between the subgroups at the 95% confidence level

32Attitudes continuedAttitudes continued
18% 18% 16% 19% 23%13% 16% 20%
24% 26%20%
25%28%
20%22%
26%4%
10%
36% 35% 37%23% 28%
42% 38% 32%
20%
12%
6%
10%21%
7%
7%7%
10%
18%
12%
19%13%15%
-80%
-60%
-40%
-20%
0%
20%
40%
60%
80%
100%
Q3. How strongly do you agree or disagree with each statement?BASE: All respondents n=1940
Health ConsciousCountryTotal
“I don’t have enough time to read food labels when I’m shopping even if I wanted to.”
Special Needs
33%
38%
27%
62%
36%28%
Strongly agree Tend to agree Neither agree or disagree Tend to disagree Strongly disagree
Denotes a statistically significant difference in overall agreement or disagreement (combined strongly or tend to) between the subgroups at the 95% confidence level
35%

33Attitudes continuedAttitudes continued
17%
37%
32%
10%
4%
-30%
-10%
10%
30%
50%
70%
90%
110%
Q3. How strongly do you agree or disagree with each statement?BASE: All respondents n=1940
“I’m very interested in food label information.”
Strongly agree Tend to agree Neither agree or disagree Tend to disagree Strongly disagree
Denotes a statistically significant difference in overall agreement or disagreement (combined strongly or tend to) between the subgroups at the 95% confidence level

34
17% 17% 17%10%
28%
9% 14%21%
37% 39% 34%
18%
34%
41%38%
36%
45%23%
4%14%1%
6%
39%17%
16%
37%30%32%
10% 10% 7%16%25%
9%
5%
2%
32%
3%4%4%
-35%
-15%
5%
25%
45%
65%
85%
105%
Australia
New Z
ealand
Not at a
ll
Modera
tely
Highly
YesNo
Health ConsciousCountryTotal Special Needs
51% 86%
34%
Attitudes continuedAttitudes continuedQ3. How strongly do you agree or disagree with each statement?BASE: All respondents n=1940
“I’m very interested in food label information.”
Strongly agree Tend to agree Neither agree or disagree Tend to disagree Strongly disagree
Denotes a statistically significant difference in overall agreement or disagreement (combined strongly or tend to) between the subgroups at the 95% confidence level
Return to Overview of Label Elements Menu

35AwarenessAwareness
• Unprompted awareness measures the respondent's ability to recall a food labelling element, it provides an indication of what elements are more ‘top of mind’ than others.
• However, for this study, it is not the best way to report awareness of specific label elements, particularly given the number of different elements included in the study, that some elements are much newer than others, and that some elements are similar or related to each other.
• It was known from the qualitative research that some consumers described quite incorrectly the features of particular elements, and others use one label element name and mean another (eg nutrient claim vs NIP; ingredients list vs allergen declaration).
• For these reasons prompted awareness (measured using label illustrations) is a more realistic and accurate measure of awareness. Prompted awareness measures recognition - a more appropriate mental task, and thus a more accurate measure of 'true awareness'. Therefore throughout this study, we refer to and report in more detail on prompted measures of awareness.

36Awareness (unprompted)Awareness (unprompted)Q4a. Firstly, thinking about all of the different types of food products available to buy, can you tell me what kinds of information can be found on packaged food and drink products?BASE: All respondents n=1940
6%
9%
9%
10%
13%
14%
14%
14%
17%
17%
21%
25%
40%
49%
0% 10% 20% 30% 40% 50% 60% 70% 80% 90% 100%
Ingredient List
NIP
Date Mark
Specific Nutrients (other than fat, sugar)
Country of Origin
Fat
Additives
Weight
Percentage (%) Label
Brand
Nutrient Claim
Sugar
Price
Specific nutrient claims
Recognised

37Awareness continuedAwareness continuedQ4a. Firstly, thinking about all of the different types of food products available to buy, can you tell me what kinds of information can be found on packaged food and drink products?BASE: All respondents n=1940
11%
0%
3%
3%
4%
4%
4%
6%
6%
7%
8%
8%
0% 10% 20% 30% 40% 50% 60% 70% 80% 90% 100%
Specific Ingredients
Manufacturer
Preparation / storage instr
Specific Nutrient Claims
Endorsements
Warning statement
Allergen declaration
Health Claim
Advisory statement
GMO
Novel food & Irradiated food
All other mentions
Recognised

38Awareness (prompted)Awareness (prompted)
Q4b. These pictures show 16 different types of information found on labels. Which of these do you recognise?

39Awareness (prompted)Awareness (prompted)
Q4b. These pictures show 16 different types of information found on labels. Which of these do you recognise?
Click herefor more
information

40
65%
7%
70%
10%
62%
14%
80%
17%
93%
25%
86%
40%
89%
49%
0% 10% 20% 30% 40% 50% 60% 70% 80% 90% 100%
Ingredients
NIP
Date Mark
Country of Origin
Percentage (%) label
Nutrient Claim
Preparation / storage instr
Awareness (prompted)Awareness (prompted)Q4b. These pictures show 16 different types of information found on labels. Which of these do you recognise?
Unprompted awareness Prompted awareness (recognised)

41
6%
0%
12%
0%
33%
3%
59%
3%
24%
4%
43%
4%
60%
4%
42%
6%
0% 10% 20% 30% 40% 50% 60% 70% 80% 90% 100%
Endorsements
Warning statement
Allergen declaration
Health claim
Advisory statement
GMO
Novel food
Irradiated foods
Awareness (prompted)Awareness (prompted)Q4b. These pictures show 16 different types of information found on labels. Which of these do you recognise?
Unprompted awareness Prompted awareness (recognised)
Return to Overview of Label Elements Menu
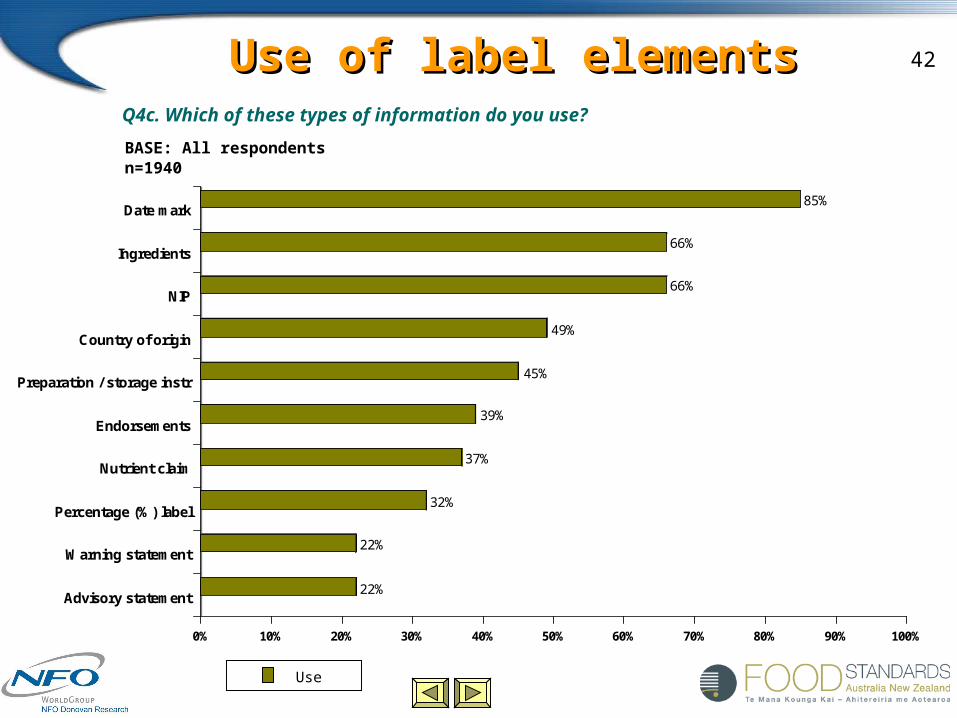
42
22%
22%
32%
37%
39%
45%
49%
66%
66%
85%
0% 10% 20% 30% 40% 50% 60% 70% 80% 90% 100%
Date mark
Ingredients
NIP
Country of origin
Preparation / storage instr
Endorsements
Nutrient claim
Percentage (%) label
Warning statement
Advisory statement
Use of label elementsUse of label elementsQ4c. Which of these types of information do you use?
BASE: All respondents n=1940
Use

43Use of label elements continuedUse of label elements continuedQ4c. Which of these types of information do you use?
BASE: All respondents n=1940
3%
9%
13%
14%
16%
0% 10% 20% 30% 40% 50% 60% 70% 80% 90% 100%
GMO
Health claim
Allergen declaration
Novel food
Irradiated food
Use

44Use of label elementsUse of label elementsQ4d. Thinking about all the different types of foods and drinks that you buy, which three types of information do you use the most?
BASE: All respondents n=1940
22%
22%
32%
37%
39%
45%
49%
66%
66%
85%
0% 10% 20% 30% 40% 50% 60% 70% 80% 90% 100%
Date mark
Ingredients
NIP
Country of origin
Preparation / storage instr
Endorsements
Nutrient claim
Percentage (%) label
Warning statement
Advisory statement
Use most

45Use of label elements continuedUse of label elements continued
BASE: All respondents n=1940
Q4d. Thinking about all the different types of foods and drinks that you buy, which three types of information do you use the most?
3%
9%
13%
14%
16%
66%
85%
0% 10% 20% 30% 40% 50% 60% 70% 80% 90% 100%
Date mark
Ingredients
GMO
Health Claim
Allergen Declaration
Novel Food
Irradiated Food
Use most

46
22% 33% 17% 28%
21% 34% 29% 16%
26% 35% 20% 20%
14% 34% 32% 20%
20% 31% 19% 30%
18% 31% 20% 31%
8% 24% 67% 1%
0% 10% 20% 30% 40% 50% 60% 70% 80% 90% 100%
Date Mark
Ingredients
NIP
Country of Origin
Preparation / storage instr
Endorsements
Nutrient Claim
Only occasionally Most of the time Everytime When I buy for the first time
Nature of element useNature of element useQ5b. When buying [nominated food type] ... how often do you look at [element]...?
n=1277
n=1276
n=235
n=613
n=725
n=1639
n=70
n=119
n=378

47
18% 32% 40% 11%
24% 32% 18% 26%
19% 30% 30% 21%
20% 28% 29% 23%
16% 35% 28% 21%
10% 29% 45% 16%
27% 27% 21% 24%
0% 10% 20% 30% 40% 50% 60% 70% 80% 90% 100%
Advisory statement
GMO
Health claims
Allergen declaration
Novel food
Percentage (%) label
Warning Statement
Only occassionally Most of the time Everytime When I buy for the first time
Nature of element useNature of element useQ5b. When buying ... how often do you look at ...?
n=80
n=324
n=71
n=43
n=338

48
7% 63% 30%
3% 42% 55%
3% 60% 36%
16% 52% 32%
7% 64% 30%
8% 63% 29%
10% 46% 44%
0% 10% 20% 30% 40% 50% 60% 70% 80% 90% 100%
Date Mark
Ingredients
NIP
Country of origin
Preparation / storage instr
Endorsements
Nutrient claim
Not very clear Fairly clear Very clear
Nature of element use - clarity of Nature of element use - clarity of elementelement
Q5c. Which of the following best describes how clear and easy to understand you think ... is?
n=723
n=1277
n=1277
n=235
n=615
n=1635
n=70

49
7% 58% 35%
12% 57% 31%
8% 56% 35%
29% 51% 20%
4% 64% 31%
8% 56% 36%
8% 59% 33%
0% 10% 20% 30% 40% 50% 60% 70% 80% 90% 100%
Percentage (%) label
Warning statement
Advisory statement
GMO
Health claims
Allergen declaration
Novel food
Not very clear Fairly clear Very clear
Nature of element use - clarity of Nature of element use - clarity of elementelement
Q5c. Which of the following best describes how clear and easy to understand you think ... is?
Base for Irradiated foods (n=7) - too small to report
n=117
n=380
n=80
n=324
n=71
n=43
n=336

50Reasons why element is not as Reasons why element is not as
clear as it could be (main reasons)clear as it could be (main reasons)Ingredients (n=93): Scientific language (39%)
Elements not listed had bases too small to provide valid reporting
NIP (n=78): Vague / confusing terms (35%)
Incomplete / not enough detail (32%)
Allergen declaration (n=28): Scientific language (25%)
Percentage label (n=47): Incomplete / not enough detail (40%)
Nutrient claim (n=46): Vague / confusing terms (30%)
Incomplete / not enough detail (24%)
Date mark (n=157): Can’t find it / hidden (62%)

51
10% 49% 41%
13% 52% 35%
14% 57% 29%
7% 40% 53%
2% 48% 50%
13% 47% 40%
15% 55% 31%
17% 54% 29%
5% 42% 53%
0% 10% 20% 30% 40% 50% 60% 70% 80% 90% 100%
Date Mark
Ingredients
NIP
Country of origin
Preparation / storage instr
Endorsements
Nutrient claim
Percentage (%) label
Warning statement
I'm not sure whether to trust it or not I'm pretty sure I trust what it says I trust what it says
Nature of element use - Nature of element use - trustworthiness of elementtrustworthiness of element
Q5d. How much do you feel you can trust the information given in the ...?
n=1271
n=234
n=614
n=721
n=1630
n=70
n=118
n=377
n=1271

52
16% 49% 35%
10% 53% 37%
13% 52% 35%
27% 51% 23%
13% 53% 34%
0% 10% 20% 30% 40% 50% 60% 70% 80% 90% 100%
Advisory statement
GMO
Health claims
Allergen declaration
Novel food
I'm not sure whether to trust it or not I'm pretty sure I trust what it says I trust what it says
Nature of element use - Nature of element use - trustworthiness of element cont’dtrustworthiness of element cont’d
Q5d. How much do you feel you can trust the information given in the ...?
Base for Irradiated foods (n=7) - too small to report
n=79
n=321
n=71
n=43
n=336

53Reasons for doubting how trustworthy an Reasons for doubting how trustworthy an element is element is (main reason, open-ended question)(main reason, open-ended question)
Ingredients (n=194): Too vague / it doesn’t tell you what you want (40%)
NIP (n=185): Companies lie on labels (26%)
Percentage label (n=47): Companies lie on labels (24%)
Nutrient claim (n=46): Companies lie on labels (27%)
Date mark (n=77): Negative previous experience (17%)
Best before doesn’t tell you how fresh it is (12%)
Country of origin (n=49): Suspicious of imported products / foreign language (71%)

54
Main reasons for all elements (consistently highest responses for all elements)
- Not interested / can’t be bothered
- Not concerned / not relevant
- Not useful / no benefit
- habit/positive experiences - consumers who have bought same product for years and not had a problem with it (which may contribute to disinterest in using labels).
Reasons for non-use of label Reasons for non-use of label elementselements
Q6. You said earlier that you recognised, but don’t use [element]. Why don’t you use [element]? (Pre-coded question, with ‘other, write in’ option).
Respondents who were younger (18-24), who had no special needs and
lower education were more likely to be not interested/can’t be bothered
Return to Overview of Label Elements Menu

55Label InterpretationLabel Interpretation
Questions 9-20 focused on label interpretation:
– Question 9 - combination of label elements
– Questions 10-14 - NIP
– Questions 15 a-b - ingredient list
– Questions 16 a-b - percentage label
– Question 17 - allergen declaration
– Question 18 - date mark
– Question 19 - country of origin
– Question 20 a-f - nutrient claims
For each question, respondents were shown a showcard featuring the relevant label element which was used to remind them of the element in question, or for their referral while considering their response.

56Combined Label InterpretationCombined Label InterpretationQ9. Which pieces of information [show pic card tub of yogurt] would you use when considering your purchase?

57Combined Label InterpretationCombined Label Interpretation
4%
10%
75%
0% 10% 20% 30% 40% 50% 60% 70% 80% 90% 100%
NIP
Ingredients
Percentage Label
Q9. Which pieces of information [show pic card tub of yogurt] would you use when considering your purchase? (Proportions of all mentions (multiple response) presented below.)
Click here for more detail
BASE: All respondents n=1940
Click here for more detail

58NIPNIPQ9. Which pieces of information [show pic card tub of yogurt] would you use when considering your purchase? (Proportions of all mentions of NIP information (multiple response) presented below.)
Sugar : 42%
Total fat : 40%
Fat (unspecified) : 27%
Energy : 25%
Sodium : 21%
Protein : 17%
Carbohydrate : 11%
Saturated fat : 11%
Both Total & Saturated fat : 8%
Serving Size: 4%
Serving per package: 2%
Return to Label Interpretation
BASE: All who used NIP (n=1439)

59IngredientsIngredientsQ9. Which pieces of information [show pic card tub of yogurt] would you use when considering your purchase? (Proportions of all mentions of Ingredient List information (multiple response) presented below.)
Ingredients : 63%
Strawberries / fruit content : 29%
Sugar : 23%
Additives : 18%
BASE: All who used Ingredients List (n=206)
Return to Label Interpretation

60
Hard to choose
13%
Don't know5%
Both the same8%
Product A39%Product B
(correct)35%
NIP InterpretationNIP InterpretationQ10a. Which of these foods do you think would be a wiser choice for a healthy diet?
Product B is a wiser choice, as it is significantly lower in sugar.
As many respondents answered correctly as incorrectly.
Product B is correct
BASE: All respondents n=1940

61NIP InterpretationNIP Interpretation
Product B is correct Either column could have been used, as serve
sizes are the same for both products.
Over half chose to use the per serving column.
Q10b. Which column of information did you mostly use to make your decision?
Per serving : 54%
Per 100g : 30%
Both : 15%
BASE: n=1837 (excludes ‘don’t know’ at Q10a)

62NIP InterpretationNIP Interpretation
Product B is correct
Q10c. Which nutrients did you mostly use to make your decision (multiple response allowed):
Total fat : 64% - of which 48% chose Product A
- of which 27% chose Product B
Sugars : 48% - of which 24% chose Product A
- of which 56% chose Product B
Saturated fat : 29%
Energy : 28%
Respondents should have based their decision on sugar
content, both products have similar levels of all other
nutrients.
Almost half the respondents used sugar in their decision
making, and over half of those (56%) correctly selected
Product B (). However one quarter (24%) selected
Product A, and therefore were not able to correctly
identify the healthier choice even when looking at the
correct nutrient.
Two thirds of respondents used total fat in their decision
making.
BASE: n=1837 (excludes ‘don’t know’ at Q10b)

63NIP InterpretationNIP InterpretationQ11a. Which of these foods do you think would be a wiser choice for a healthy diet?
Hard to choose
6%
Don't know3%
Both the same4%
Product A (correct)
73%
Product B14%
BASE: n=1015
Product A is a wiser choice, as it is significantly lower in sodium.
The majority of respondents made the right product selection, for a healthier choice.
Product A is correct

64NIP InterpretationNIP Interpretation
Q11b. Which column of information did you mostly use to make your decision?
Per serving : 55% - of which 78% chose Product A
- of which 14% chose Product B
Per 100g : 31% - of which 74% chose Product A
- of which 15% chose Product B
Both : 13%
Product A is correct
The per 100g column should have been used as
serve sizes differ between product A and B.
Only one third of respondents used the per 100g
column in their decision making. Of those, three
quarters made the correct product selection. This
equates to one fifth (22%) of those asked this
question.
BASE: n=983 (excludes ‘don’t know’ at Q11a)

65NIP InterpretationNIP Interpretation
Q11c. Which nutrients did you mostly use to make your decision (multiple response allowed):
Total fat : 65% - of which 79% chose Product A
- of which 11% chose Product B
Sugars : 38% - of which 76% chose Product A
- of which 11% chose Product B
Sodium : 35% - of which 82% chose Product A
- of which 8% chose Product B
Saturated fat : 29%
Energy : 28%
Product A is correct
Respondents should have based their decision on
sodium content, both products have similar levels of all
other nutrients.
However, only one third of respondents used sodium in
their decision making, and two thirds used total fat.
The majority of respondents who looked at sodium made
the correct product selection. Of those 82% correctly
selected Product A ().
BASE: n=975 (excludes ‘don’t know’ at Q11b)

66NIP InterpretationNIP InterpretationQ12a. Which of these foods do you think would be a wiser choice for a healthy diet?
Product B (correct)
66%
Hard to choose
1%
Don't know4%
One better in one way
7%
Both the same2%
Product A20%
BASE: n=934
Product B is correct
Product B is a wiser choice, as it is significantly lower in energy and fat.
The majority of respondents made the right product selection, for a healthier choice.

67NIP InterpretationNIP Interpretation
Q12b. Which column of information did you mostly use to make your decision?
Per serving : 54% - of which 22% chose Product A
- of which 71% chose Product B
Per 100g : 53% - of which 21% chose Product A
- of which 67% chose Product B Both : 13%
Product B is correct Either column could have been used, as serve
sizes are the same for both products.
Preference for using each column was evenly
divided.
BASE: n=895 (excludes ‘don’t know’ at Q12a)

68NIP InterpretationNIP InterpretationQ12c. Which nutrients did you mostly use to make your
decision:
Total fat : 68% - of which 11% chose Product A
- of which 79% chose Product B
Sugars : 34% - of which 10% chose Product A
- of which 76% chose Product B
Energy : 33% - of which 30% chose Product A
- of which 59% chose Product B Saturated fat : 31%
Sodium : 22%Product B is correct Respondents should have based their decision on fat
and/or energy content, both products have similar levels
of all other nutrients.
The majority of respondents referred to total fat.
Use of energy values was higher than in other questions
where energy content has been the same for both
products. The majority of respondents who looked at
total fat and/or energy made the correct product
selection (). However, one third of those who used
energy in their decision making still incorrectly selected
Product A.
BASE: n=885 (excludes ‘don’t know’ at Q12b)

69NIP InterpretationNIP Interpretation
Q13. How much saturated fat do you think there is in the
whole packet?
11.3g : 65%
23.6g : 8%
3.7g : 3%
7.3g : 1%
Other : 22%
BASE: All respondents n=1940
Two thirds correctly interpreted the label
information ().
Three quarters looked at fat values, 11% referred
to the wrong type of fat, or wrong column.

70NIP InterpretationNIP Interpretation
Q14. Which dinner would give you the most [nutrient]?
Product A Product B Not sure
Energy 90% 6% 4%
Sodium 4% 92% 4%
Total fat 89% 7% 4%
Saturated fat 88% 7% 4%
BASE: All respondents n=1940
Three quarters (77%) answered all four correctly ().
Return to Main Menu

71Ingredients List InterpretationIngredients List Interpretation
Q15a. Do you think the ingredients are presented in any particular order?
Don't know16% No
37%
Yes47%
BASE: n=1023
Q15b. What order?
Ascending : 6%
Descending : 66%
Other : 19%
Don’t know : 9%

72% Label Interpretation% Label Interpretation
Q16a. What does the 9% mean after the ingredient ‘strawberry’?
9% of this product contains strawberries : 71%
The ingredient (strawberries) is (only) 9% strawberries : 18%
Other / don’t know : 11%
BASE: n=478 (This question was rotated to 1/4 of the sample)
STRAWBERRY YOGHURT
FRUIT JUICE DRINK Q16b. What percentage of this product would you say comes from fruit?
35% of product : 84%
30% of product : 8%
5% of product : 2%
Other / don’t know : 6%

73
BASE: n=478 (This question was rotated to 1/4 of the sample)
Allergen Label InterpretationAllergen Label Interpretation
Q17. Imagine if you suffered from an allergy when eating nuts, how useful would you find a statement on a snack bar that said ‘may contain traces of nuts’?
Not very useful, because it doesn’t say whether nuts are definitely in the product : 26%
Quite useful, because it reminds me I may be eating a product containing nuts : 20%
Very useful, because I am told when there is even a chance that nuts are present : 53%
SNACK FOOD

74
BASE: n=478 (This question was rotated to 1/4 of the sample)
Allergen Label InterpretationAllergen Label Interpretation
Q17. Imagine if you suffered from an allergy when eating nuts, how useful would you find a statement on a snack bar that said ‘may contain traces of nuts’?
Not very useful, because it doesn’t say whether nuts are definitely in the product : 26%
Quite useful, because it reminds me I may be eating a product containing nuts : 20%
Very useful, because I am told when there is even a chance that nuts are present : 53%
SNACK FOOD
Responses lower for those with special health needs: Total special needs - 52% Allergy to nuts - 42% Other allergy - 44% No special needs - 55%
Responses higher for those with special health needs: Total special needs - 29% Allergy to nuts - 36% Other allergy - 28% No special needs - 21%

75Date Mark InterpretationDate Mark Interpretation
DATE MARK
Q18. Which of these two statements do you think applies to a ‘use-by’ date??
The use-by date is only a guide - it is quite safe to eat some food products after the use-by date has expired : 44%
It is illegal to sell a food product past its use-by date as the food can be potentially harmful : 56%
BASE: n=478 (This question was rotated to 1/4 of the sample)

76Country of Origin Label Country of Origin Label InterpretationInterpretation
Q19. Which product has the most Australian ( New Zealand )ingredients?
Total % Australia % New Zealand %
Made in ... : 31 27 37*
Product of ... : 60 61 57
Made from ……. and imported \ ingredients : 3 4 3
Don’t know / not sure : 6 8 3** Denotes a statistically significant difference in overall agreement ordisagreement between the countries at the 95% confidence level
BASE: n=934 (This question asked of half the sample)

77
Q20b. Would you say this term is?
Very confusing : 29%
A bit confusing : 45%
Not at all confusing : 25%
Nutrient Claim InterpretationNutrient Claim Interpretation
Q20a. Which of the following does “Lite” refer to? (multiple response question)
Fat : 77%
Sugar : 19%
Other : 19% (energy, colour, fruit content, any of the given choices)
BASE: n=934 (This question asked of half the sample)
Q20c. And how misleading, if at all, would you say the term ‘Lite’ is?
Very misleading : 33%
A bit misleading : 46%
Not at all misleading : 20%

78Nutrient Claim InterpretationNutrient Claim Interpretation
Q20d. Would you say this term (‘no added sugar’) means this food...?
Contains no sugar : 28%
Contains small amounts of sugar : 30%
Could be either a low, medium or high sugar food : 38%
Don’t know / not sure : 4% (small base)
Are you not sure because the term is..?
confusing: 65%
misleading: 28%
BASE: n=934 (This question asked of half the sample)

79Nutrient Claim InterpretationNutrient Claim Interpretation
Q20e. Would you say this term (‘reduced in salt’) means this food...?
Contains less salt compared to similar food labelled ‘low salt’ : 46%
Contains the same amount of salt compared to similar food labelled ‘low salt’ : 26%
Contains more salt compared to similar food labelled ‘low salt’ : 11%
Don’t know / not sure : 17%
Are you not sure because the term is..?
confusing: 55%
misleading: 35%
BASE: n=934 (This question asked of half the sample)

80Nutrient Claim InterpretationNutrient Claim Interpretation
Q20f. Would you say this term (‘94% fat free’) means this food is...?
A low fat food : 75%
A medium fat food : 16%
A high fat food : 3%
Don’t know / not sure : 7%
Are you not sure because the term is..?
confusing: 49%
misleading: 48%
BASE: n=926 (This question asked of half the sample)
Click here to return to Overview of Label Elements

81Ingredient ListIngredient List

82Ingredient ListIngredient List
49%
66%
89%
49%
0% 10% 20% 30% 40% 50% 60% 70% 80% 90% 100%
Unpromptedawareness
Prompted awareness
Use
Use most often
Products used for:
Breakfast cereals : 62%
Oils, butter, spreads : 54%
Canned foods : 52%
Dairy products : 48%
Soft drinks, cordial, fruit juices : 35%
Breads : 35%
BASE: n=1940

83Prompted awareness: Prompted awareness: ingredients listingredients list
- - (presenting subgroups with statistically significant differences)(presenting subgroups with statistically significant differences)
89% 87%
93%
0%
20%
40%
60%
80%
100%
Australia New Zealand
BASE: All respondents n=1940
Total Country
Denotes a statistically significant difference within the subgroups at the 95% confidence level

84
66%
55%
66%70%71%71%
61% 60%
70%
53%
62%
70%73%
64%65%
73%70%
64%
71%
60%
0%
20%
40%
60%
80%
100%
18-2
425
-34
35-4
445
-54
55-6
465
+M
ale
Female
Primary
Secondary
Trade
Tertiary
or h
igher
>$40,
000
$40,
000-
$74,
999
7500
0 and o
ver
YesNo
Allerg
ens
No alle
rgens
Use of Use of ingredients listingredients list - - (presenting subgroups with statistically significant differences)(presenting subgroups with statistically significant differences)
BASE: All respondents n=1940
Total GenderAge Special Needs
Education Income Children
(years)
Denotes a statistically significant difference within the subgroups at the 95% confidence level

85
Reasons for non-use: Not interested / can’t be bothered (33%)Bought same product for years (58%) Not concerned / relevant (19%)Not enough time while shopping (10%)
Ingredient ListIngredient List
Q5b. When buying (product) how often do you look at (element)?Frequency: Every time I buy product (20%)
Most of the time (31%)Only occasionally (18%)Buying for the first time (31%)
Q5c Which of these best describes how clear and easy to understand you think (element) is?Clarity: Very clear (29%)
Fairly clear (63%)Not very clear (8%)
Q5d. And how much do you feel you can trust the information given in (element)?Trust: I trust what it says (29%)
I’m pretty sure I can trust what it says (54%)I’m not sure whether to trust it (17%). Why don’t’ you trust?
Too vague (40%)Companies lie on
labels (18%)
(Base: n=455)
Return to Label Element Menu
(Base: n=1277)
(Base: n=1277)
(Base: n=1271)
Q6a. Why don’t you use the ingredients lists?

86Nutrition Information PanelNutrition Information Panel

87NIPNIP
52%
66%
86%
40%
0% 10% 20% 30% 40% 50% 60% 70% 80% 90% 100%
Unpromptedawareness
Prompted awareness
Use
Use most often
Products used for:
Breakfast cereals : 65%
Dairy products : 56%
Oils, butter, spreads : 56%
Canned foods : 42%
Breads : 39%
Frozen foods : 31%
BASE: n=1940

88Prompted awareness of Prompted awareness of NIPNIP - -
(presenting subgroups with statistically significant differences)(presenting subgroups with statistically significant differences)
86%82%
92%89%
81%
88%
81%
0%
20%
40%
60%
80%
100%
Australia NewZealand
Yes No Male Female
BASE: All respondents n=1940
Total Country Special needs Gender
Denotes a statistically significant difference within the subgroups at the 95% confidence level

89Use of Use of NIPNIP - -
(presenting subgroups with statistically significant differences)(presenting subgroups with statistically significant differences)
66%
57%
67%
73%68% 68%
58% 56%
71% 70%64% 62%
73%70%
56%
0%
20%
40%
60%
80%
100%
18-2
4
25-3
4
35-4
4
45-5
4
55-6
465
+M
ale
Femal
eYes No
Australia
New Zeala
nd
Med
ical
condi
tion
No med
ical
conditi
on
BASE: All respondents n=1940
Total GenderAge Children Country Special Needs
(years)
Denotes a statistically significant difference within the subgroups at the 95% confidence level

90
Reasons for non-use: Not interested / can’t be bothered (28%)Not concerned (24%)Bought same product for years (20%)Don’t understand how to read it (10%)
NIPNIP
Q5b. When buying (product) how often do you look at (element)?Frequency: Every time I buy product (19%)
Most of the time (31%)Only occasionally (20%)Buying for the first time (30%)
Q5c Which of these best describes how clear and easy to understand you think (element) is?Clarity: Very clear (30%)
Fairly clear (64%)Not very clear (7%)
Q5d. And how much do you feel you can trust the information given in (element)?Trust: I trust what it says (31%)
I’m pretty sure I can trust what it says (55%)I’m not sure whether to trust it (15%). Why don’t’ you trust?:
Too vague (26%)Companies lie on
labels (18%)
Base: n=398
Return to Label Element MenuNIP Interpretation
Q6b. Why don’t you use the NIP?
Base: n=1276
Base: n=1273
Base: n=1271

91Allergen DeclarationAllergen Declaration

92Allergen Declaration Allergen Declaration
5%
13%
43%
4%
0% 10% 20% 30% 40% 50% 60% 70% 80% 90% 100%
Unpromptedawareness
Prompted awareness
Use
Use most often
Products used for:
Sweet biscuits / confectionery : 46%
Savoury biscuits and snacks : 40%
Dairy products : 39%
Breakfast cereals : 37%
BASE: n=1940
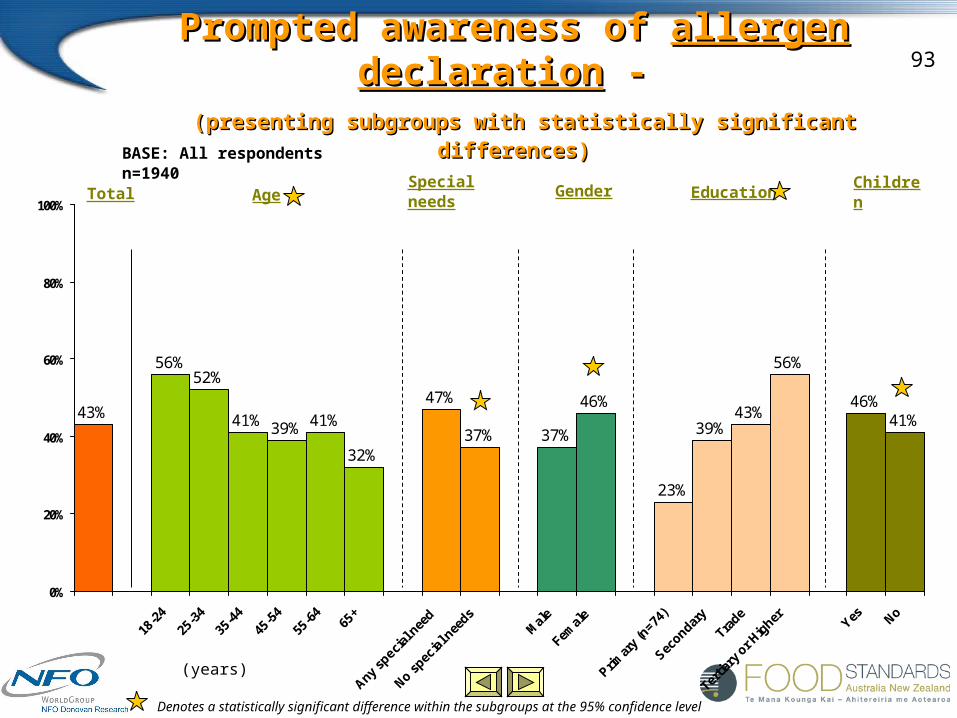
93Prompted awareness of Prompted awareness of allergen allergen
declarationdeclaration - - (presenting subgroups with statistically significant differences)(presenting subgroups with statistically significant differences)
43%
56%52%
41% 39% 41%
32%
47%
37% 37%
46%
23%
39%43%
56%
46%41%
0%
20%
40%
60%
80%
100%
18-2
4
25-3
4
35-4
4
45-5
4
55-6
465
+
Any speci
al nee
d
No spec
ial n
eeds
Mal
e
Femal
e
Primar
y (n=74
)
Secondar
y
Trade
Tertia
ry o
r Hig
her Yes No
BASE: All respondents n=1940
Total Special needsAge Gender Education Children
(years)
Denotes a statistically significant difference within the subgroups at the 95% confidence level

94Use of Use of allergen declarationallergen declaration - -
(presenting subgroups with statistically significant differences)(presenting subgroups with statistically significant differences)
13%9%
15%19% 18%
13%
25%
7%11%
0%
20%
40%
60%
80%
100%
Male Female Under 3 3-11 yrs 12-17 yrs 18 + Allergen NoAllergen
BASE: All respondents n=1940
Total Gender Age of Child(ren)
Special Needs
(years)

95
Reasons for non-use: Not concerned / not relevant (71%)Not useful (10%)
Allergen DeclarationAllergen Declaration
Q5b. When buying (product) how often do you look at (element)?Frequency: Every time I buy product (29%)
Most of the time (28%)Only occasionally (20%)Buying for the first time (23%)
Q5c Which of these best describes how clear and easy to understand you think (element) is?Clarity: Very clear (31%)
Fairly clear (57%)Not very clear (12%)
Q5d. And how much do you feel you can trust the information given in (element)?Trust: I trust what it says (37%)
I’m pretty sure I can trust what it says (53%)I’m not sure whether to trust it (10%)
Base: n=591
Return to Label Element Menu
Q6c. Why don’t you use the Allergen Declaration?
Base: n=235
Base: n=235
Base: n=234

96Percentage (%) LabelPercentage (%) Label

97Percentage (%) LabelPercentage (%) Label
13%
32%
62%
14%
0% 10% 20% 30% 40% 50% 60% 70% 80% 90% 100%
Unpromptedawareness
Prompted awareness
Use
Use most often
Products used for:
Oils, butter, spreads : 56%
Dairy products : 56%
Breakfast cereals : 38%
Soft drink, cordials, fruit juices : 32%
BASE: n=1940

98Prompted awareness of Prompted awareness of % label% label - -
(presenting subgroups with statistically significant differences)(presenting subgroups with statistically significant differences)
62%60%
64%
58%
65%69%
57%
66%
57%
66%
58%
47%
0%
20%
40%
60%
80%
100%
18-2
4
25-3
4
35-4
4
45-5
4
55-6
465
+Yes No
Highly
Moder
ately
Not at a
ll
BASE: All respondents n=1940
Total Age Special needs Health conscious
(years)
Denotes a statistically significant difference within the subgroups at the 95% confidence level

99Use of Use of % label% label - -
(presenting subgroups with statistically significant differences)(presenting subgroups with statistically significant differences)
32%
25%
31% 32%
37% 38%
30%
0%
20%
40%
60%
80%
100%
18-24 25-34 35-44 45-54 55-64 65+
BASE: All respondents n=1940
Total Age
(years)
Denotes a statistically significant difference within the subgroups at the 95% confidence level

100
Reasons for non-use: Not interested / can’t be bothered (24%)Not concerned (23%)Bought same product for years (17%)
Percentage (%) LabelPercentage (%) Label
Q5b. When buying (product) how often do you look at (element)?Frequency: Every time I buy product (18%)
Most of the time (32%)Only occasionally (24%)Buying for the first time (26%)
Q5c Which of these best describes how clear and easy to understand you think (element) is?Clarity: Very clear (33%)
Fairly clear (59%)Not very clear (8%)
Q5d. And how much do you feel you can trust the information given in (element)?Trust: I trust what it says (35%)
I’m pretty sure I can trust what it says (52%)I’m not sure whether to trust it (13%)
Base: n=587
Return to Label Element Menu
Q6d. Why don’t you use the Percentage (%) Labels?
Base: n=613
Base: n=615
Base: n=614

101Nutrient ClaimNutrient Claim

102Nutrient ClaimNutrient Claim
14%
37%
70%
10%
0% 10% 20% 30% 40% 50% 60% 70% 80% 90% 100%
Unpromptedawareness
Prompted awareness
Use
Use most often
Products used for:
Breakfast cereals : 58%
Dairy products : 47%
Oils, butter, spreads : 45%
Canned foods : 44%
Breads : 32%
BASE: n=1940

103
Prompted awareness of Prompted awareness of nutrient nutrient claimclaim
(presenting subgroups with statistically significant differences)(presenting subgroups with statistically significant differences)
70%
78%
66%71% 70% 72%
64%
73%
65% 64%
72% 74%
67%
74%
65%
47%
0%
20%
40%
60%
80%
100%
18-2
4
25-3
4
35-4
4
45-5
4
55-6
465
+Yes No
Mal
e
Femal
e
Australia
New Zeala
nd
Highly
Moder
ately
Not at a
ll
BASE: All respondents n=1940
Total Special needsAge Gender Country Health conscious
(years)
Denotes a statistically significant difference within the subgroups at the 95% confidence level

104Use of Use of nutrient claimnutrient claim - -
(presenting subgroups with statistically significant differences)(presenting subgroups with statistically significant differences)
37%
30%34%
43%40%
43%
33%29%
41%
34%
43%
66%
30%
0%
20%
40%
60%
80%
100%
18-2
4
25-3
4
35-4
4
45-5
4
55-6
465
+M
ale
Femal
e
Australia
New Zeala
nd
Weig
ht loss No
BASE: All respondents n=1940
Total GenderAge Country Special Needs
(years)
Denotes a statistically significant difference within the subgroups at the 95% confidence level

105
Reasons for non-use: Not concerned/ not relevant to me (26%)Not interested / can’t be bothered (22%)Bought same product for years (19%)
Nutrient ClaimNutrient Claim
Q5b. When buying (product) how often do you look at (element)?Frequency: Every time I buy product (17%)
Most of the time (33%)Only occasionally (22%)Buying for the first time (28%)
Q5c Which of these best describes how clear and easy to understand you think (element) is?Clarity: Very clear (30%)
Fairly clear (63%)Not very clear (7%)
Q5d. And how much do you feel you can trust the information given in (element)?Trust: I trust what it says (29%)
I’m pretty sure I can trust what it says (57%)I’m not sure whether to trust it (14%)
Base: n=632
Return to Label Element Menu
Q6e. Why don’t you use the Nutrient Claim?
Base: n=725
Base: n=723
Base: n=721

106Date MarkDate Mark

107Date MarkDate Mark
68%
85%
93%
25%
0% 10% 20% 30% 40% 50% 60% 70% 80% 90% 100%
Unpromptedawareness
Prompted awareness
Use
Use most often
Products used for:
Dairy products : 85%
Oils, butter, spreads : 54%
Breads : 51%
Fresh produce : 50%
BASE: n=1940

108
Reasons for non-use: Not interested / can’t be bothered (31%)Not concerned / not relevant (21%)
Date MarkDate Mark
Q5b. When buying (product) how often do you look at (element)?Frequency: Every time I buy product (67%)
Most of the time (24%)Only occasionally (8%)Buying for the first time (1%)
Q5c Which of these best describes how clear and easy to understand you think (element) is?Clarity: Very clear (44%)
Fairly clear (46%)Not very clear (10%)
Q5d. And how much do you feel you can trust the information given in (element)?Trust: I trust what it says (53%)
I’m pretty sure I can trust what it says (42%)I’m not sure whether to trust it (5%)
Base: n=173
Return to Label Element Menu
Q6f. Why don’t you use the Date Mark?
Base: n=1639
Base: n=1635
Base: n=1630
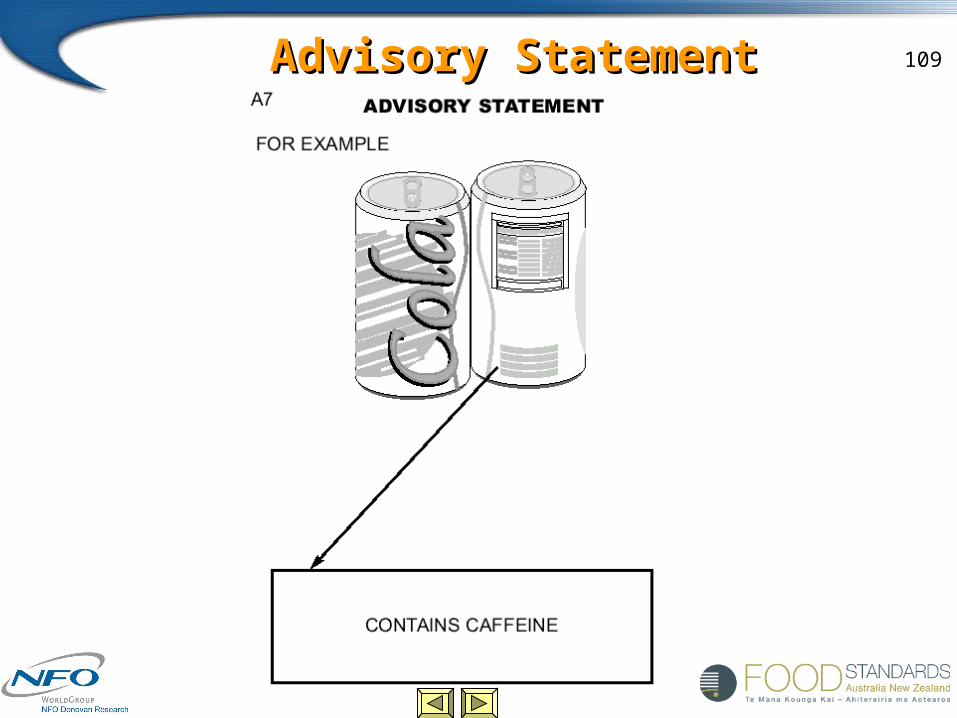
109Advisory StatementAdvisory Statement

110Advisory StatementAdvisory Statement
3%
22%
59%
3%
0% 10% 20% 30% 40% 50% 60% 70% 80% 90% 100%
Unpromptedawareness
Prompted awareness
Use
Use most often
Products used for:
Soft drinks, cordials, fruit juices : 62%
Dairy products : 36%
Canned foods : 27%
Oils, butter, spreads : 22%
BASE: n=1940

111
Prompted awareness of Prompted awareness of advisory statementadvisory statement - -
(presenting subgroups with statistically significant differences)(presenting subgroups with statistically significant differences)
59%
70%
58%58%56%
47%
40%
55%60%
68%
57%61%
67%62%
55% 55%
66%62%
55%
40%
65%
0%
20%
40%
60%
80%
100%
18-2
4
25-3
4
35-4
4
45-5
4
55-6
465
+
Primar
y
Secondar
y
Trade
Tertia
ry o
r hig
her
<$40,
000
$40,0
00-$
74,9
99
$75,0
00 a
nd over Yes No
Australia
New Zeala
nd
Highly
Moder
ately
Not at a
ll
BASE: All respondents n=1940
Total EducationAge Health conscious
Income Children Country
(years)
Denotes a statistically significant difference within the subgroups at the 95% confidence level

112Use of Use of advisory statementadvisory statement - -
(presenting subgroups with statistically significant differences)(presenting subgroups with statistically significant differences)
22%27%
17%19%
27%
0%
20%
40%
60%
80%
100%
Yes No Australia New Zealand
BASE: All respondents n=1940
Total Children Country
Denotes a statistically significant difference within the subgroups at the 95% confidence level

113Advisory StatementAdvisory Statement
Q5b. When buying (product) how often do you look at (element)?Frequency: Every time I buy product (21%)
Most of the time (27%)Only occasionally (27%)Buying for the first time (24%)
Q5c Which of these best describes how clear and easy to understand you think (element) is?Clarity: Very clear (31%)
Fairly clear (64%)Not very clear (4%)
Q5d. And how much do you feel you can trust the information given in (element)?Trust: I trust what it says (34%)
I’m pretty sure I can trust what it says (53%)I’m not sure whether to trust it (13%)
Base: n=70
Return to Label Element Menu
Base: n=70
Base: n=70

114Warning StatementWarning Statement

115Warning StatementWarning Statement
6%
22%
57%
4%
0% 10% 20% 30% 40% 50% 60% 70% 80% 90% 100%
Unpromptedawareness
Prompted awareness
Use
Use most often
Products used for:
Dairy products : 48%
Oils, butter, spreads : 46%
Soft drinks, cordials, fruit juices : 44%
Canned foods : 31%
BASE: n=1940

116
Prompted awareness of Prompted awareness of warning statementwarning statement - -
(presenting subgroups with statistically significant differences)(presenting subgroups with statistically significant differences)
60%
50%
58% 58% 59%
66%
50%
61%
51% 51%
60% 61%
54%51%
67%62%
52%
32%
0%
20%
40%
60%
80%
100%
18-2
4
25-3
4
35-4
4
45-5
4
55-6
465
+Yes No
Mal
e
Femal
eYes No
Australia
New Zeala
nd
Highly
Moder
ately
Not at a
ll
BASE: All respondents n=1940
Total Special NeedsAge Health conscious
Gender Children Country
(years)Denotes a statistically significant difference within the subgroups at the 95% confidence level

117Use of Use of warning statementwarning statement - -
(presenting subgroups with statistically significant differences)(presenting subgroups with statistically significant differences)
22%
15%
25%27%
18%
29%
18%
0%
20%
40%
60%
80%
100%
Male Female Yes No Australia NewZealand
BASE: All respondents n=1940
Total Gender Children Country
Denotes a statistically significant difference within the subgroups at the 95% confidence level

118Warning StatementWarning Statement
Q5b. When buying (product) how often do you look at (element)?Frequency: Every time I buy product (40%)
Most of the time (32%)Only occasionally (18%)Buying for the first time (11%)
Q5c Which of these best describes how clear and easy to understand you think (element) is?Clarity: Very clear (36%)
Fairly clear (56%)Not very clear (8%)
Q5d. And how much do you feel you can trust the information given in (element)?Trust: I trust what it says (41%)
I’m pretty sure I can trust what it says (49%)I’m not sure whether to trust it (10%)
Base: n=119
Return to Label Element Menu
Base: n=118
Base: n=117

119Country of OriginCountry of Origin

120Country of OriginCountry of Origin
19%
49%
80%
17%
0% 10% 20% 30% 40% 50% 60% 70% 80% 90% 100%
Unpromptedawareness
Prompted awareness
Use
Use most often
Products used for:
Canned foods : 72%
Oils, butter, spreads : 41%
Pasta, rice, noodles : 38%
Dairy products : 38%
BASE: n=1940

121Prompted awareness of Prompted awareness of country of origincountry of origin - - (presenting subgroups with statistically significant differences)(presenting subgroups with statistically significant differences)
80% 80%75%
82%87%
78%
87%
78%
0%
20%
40%
60%
80%
100%
Primary Secondary Trade Tertiary orhigher
<$40,000 $40,000-$74,999
$75,000and over
BASE: All respondents n=1940
Total Education Income
Denotes a statistically significant difference within the subgroups at the 95% confidence level

122Use of Use of country of origincountry of origin - -
(presenting subgroups with statistically significant differences)(presenting subgroups with statistically significant differences)
49%
30%
45%49%
56%54%
56%52%
44%
0%
20%
40%
60%
80%
100%
18-24 25-34 35-44 45-54 55-64 65+ Australia NewZealand
BASE: All respondents n=1940
Total Age Country
(years)
Denotes a statistically significant difference within the subgroups at the 95% confidence level

123Country of OriginCountry of Origin
Q5b. When buying (product) how often do you look at (element)?Frequency: Every time I buy product (32%)
Most of the time (34%)Only occasionally (14%)Buying for the first time (20%)
Q5c Which of these best describes how clear and easy to understand you think (element) is?Clarity: Very clear (32%)
Fairly clear (52%)Not very clear (16%)
Q5d. And how much do you feel you can trust the information given in (element)?Trust: I trust what it says (40%)
I’m pretty sure I can trust what it says (47%)I’m not sure whether to trust it (13%)
Base: n=380
Return to Label Element Menu
Base: n=378
Base: n=377

124Genetically Modified DeclarationGenetically Modified Declaration

125Genetically Modified DeclarationGenetically Modified Declaration
4%
16%
33%
3%
0% 10% 20% 30% 40% 50% 60% 70% 80% 90% 100%
Unpromptedawareness
Prompted awareness
Use
Use most often
Products used for:
Oils, butter, spreads : 58%
Canned food : 46%
Fresh produce : 45%
Pasta, rice, noodles : 43%
BASE: n=1940

126Prompted awareness of Prompted awareness of GMGM Declaration- Declaration-
(presenting subgroups with statistically significant differences)(presenting subgroups with statistically significant differences)
33% 35%
22%
36%
29%31% 30%
38%36%
0%
20%
40%
60%
80%
100%
Under64
65+ Yes No Yes No Australia NewZealand
BASE: All respondents n=1940
Total Age Special Needs Children Country
Denotes a statistically significant difference within the subgroups at the 95% confidence level
(years)
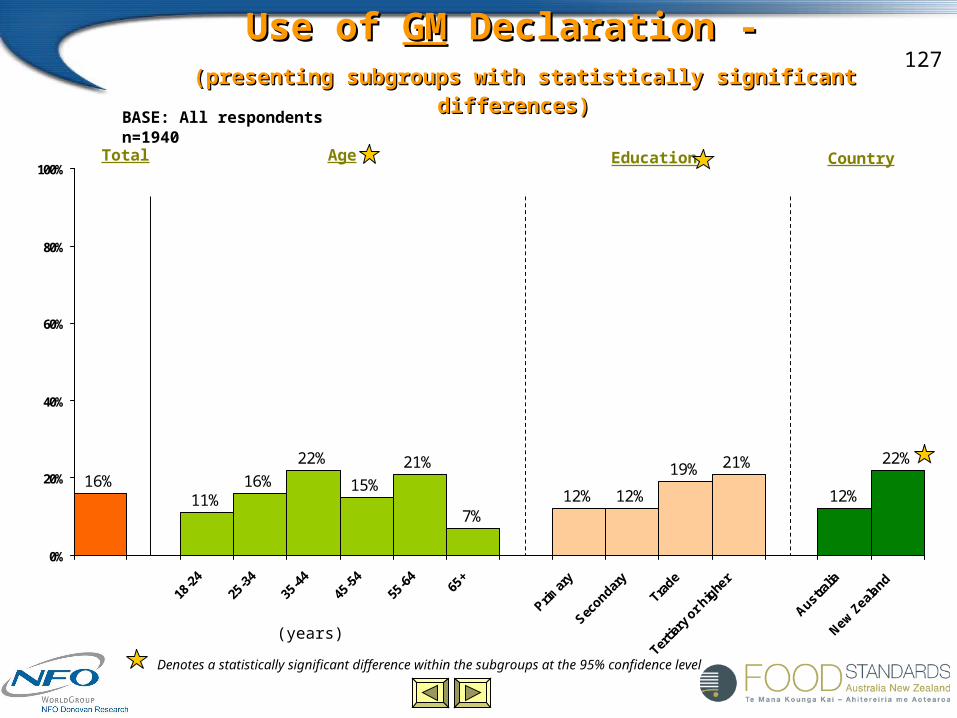
127Use of Use of GMGM Declaration - Declaration -
(presenting subgroups with statistically significant differences)(presenting subgroups with statistically significant differences)
16%11%
16%
22%
15%
21%
7%12% 12%
19% 21%
12%
22%
0%
20%
40%
60%
80%
100%
18-2
4
25-3
4
35-4
4
45-5
4
55-6
465
+
Primar
y
Secondar
y
Trade
Tertia
ry o
r hig
her
Australia
New Zeala
nd
BASE: All respondents n=1940
Total Age Education Country
(years)
Denotes a statistically significant difference within the subgroups at the 95% confidence level

128Genetically Modified DeclarationGenetically Modified Declaration
Q5b. When buying (product) how often do you look at (element)?Frequency: Every time I buy product (45%)
Most of the time (29%)Only occasionally (10%)Buying for the first time (16%)
Q5c Which of these best describes how clear and easy to understand you think (element) is?Clarity: Very clear (20%)
Fairly clear (51%)Not very clear (29%)
Q5d. And how much do you feel you can trust the information given in (element)?Trust: I trust what it says (23%)
I’m pretty sure I can trust what it says (51%)I’m not sure whether to trust it (27%)
Base: n=80
Return to Label Element Menu
Base: n=80
Base: n=79

129Irradiated FoodIrradiated Food

130Irradiated FoodIrradiated Food
0%
3%
6%
0%
0% 10% 20% 30% 40% 50% 60% 70% 80% 90% 100%
Unpromptedawareness
Prompted awareness
Use
Use most often
BASE: n=1940
Return to Label Element Menu

131Preparation / Storage Preparation / Storage
InstructionsInstructions

132Preparation / Storage Preparation / Storage
InstructionsInstructions
16%
45%
65%
7%
0% 10% 20% 30% 40% 50% 60% 70% 80% 90% 100%
Unpromptedawareness
Prompted awareness
Use
Use most often
Products used for:
Frozen foods : 66%
Fresh produce : 36%
Pasta, rice, noodles : 36%
Dairy products : 35%
BASE: n=1940

133Prompted awareness of Prompted awareness of prep & storage prep & storage
instructionsinstructions - - (presenting subgroups with statistically (presenting subgroups with statistically significant differences)significant differences)
65%70%
65%63%
67% 68%
60%62%
70%
0%
20%
40%
60%
80%
100%
18-24 25-34 35-44 45-54 55-64 65+ Australia NewZealand
BASE: All respondents n=1940
Total Age Country
Denotes a statistically significant difference within the subgroups at the 95% confidence level(years)

134Use of Use of prep & storage instructionsprep & storage instructions - - (presenting subgroups with statistically significant differences)(presenting subgroups with statistically significant differences)
45%
37%
48%
40%
53%
0%
20%
40%
60%
80%
100%
Male Female Australia New Zealand
BASE: All respondents n=1940
Total Gender Country
Denotes a statistically significant difference within the subgroups at the 95% confidence level

135Preparation / Storage Preparation / Storage
InstructionsInstructions
Q5b. When buying (product) how often do you look at (element)?Frequency: Every time I buy product (20%)
Most of the time (35%)Only occasionally (26%)Buying for the first time (20%)
Q5c Which of these best describes how clear and easy to understand you think (element) is?Clarity: Very clear (36%)
Fairly clear (60%)Not very clear (3%)
Q5d. And how much do you feel you can trust the information given in (element)?Trust: I trust what it says (50%)
I’m pretty sure I can trust what it says (48%)I’m not sure whether to trust it (2%)
Base: n=324
Return to Label Element Menu
Base: n=324
Base: n=321

136Health ClaimsHealth Claims

137Health ClaimsHealth Claims
4%
14%
24%
4%
0% 10% 20% 30% 40% 50% 60% 70% 80% 90% 100%
Unpromptedawareness
Prompted awareness
Use
Use most often
Products used for:
Oils, butter, spreads : 66%
Dairy products : 58%
Breakfast cereals : 54%
Breads : 36%
BASE: n=1940

138Health ClaimsHealth Claims
Q5b. When buying (product) how often do you look at (element)?Frequency: Every time I buy product (28%)
Most of the time (35%)Only occasionally (16%)Buying for the first time (21%)
Q5c Which of these best describes how clear and easy to understand you think (element) is?Clarity: Very clear (35%)
Fairly clear (56%)Not very clear (8%)
Q5d. And how much do you feel you can trust the information given in (element)?Trust: I trust what it says (35%)
I’m pretty sure I can trust what it says (52%)I’m not sure whether to trust it (13%)
Base: n=71
Return to Label Element Menu
Base: n=71
Base: n=71

139Novel FoodsNovel Foods
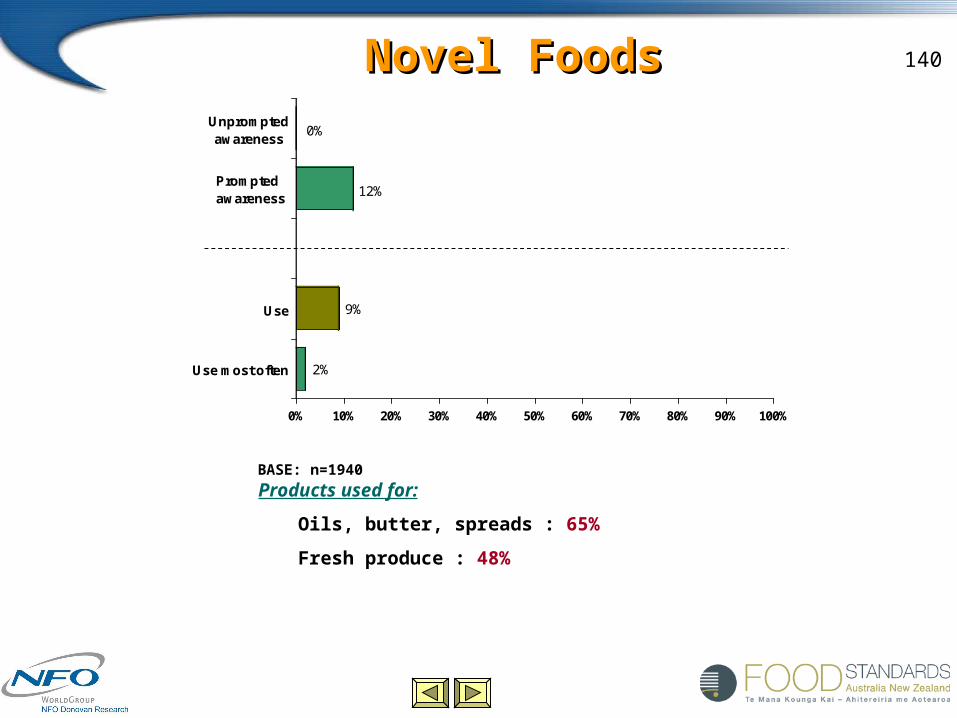
140Novel FoodsNovel Foods
2%
9%
12%
0%
0% 10% 20% 30% 40% 50% 60% 70% 80% 90% 100%
Unpromptedawareness
Prompted awareness
Use
Use most often
BASE: n=1940
Products used for:
Oils, butter, spreads : 65%
Fresh produce : 48%

141Prompted awareness of Prompted awareness of novel foodnovel food - - (presenting subgroups with statistically significant differences)(presenting subgroups with statistically significant differences)
12%9%
17%
0%
20%
40%
60%
80%
100%
Australia New Zealand
BASE: All respondents n=1940
Total Country

142Use of Use of novel foodnovel food - -
(presenting subgroups with statistically significant differences)(presenting subgroups with statistically significant differences)
9%6%
14%
0%
20%
40%
60%
80%
100%
Australia New Zealand
BASE: All respondents n=1940
Total Country

143Novel FoodsNovel Foods
Q5b. When buying (product) how often do you look at (element)?Frequency: Every time I buy product (30%)
Most of the time (30%)Only occasionally (19%)Buying for the first time (21%)
Q5c Which of these best describes how clear and easy to understand you think (element) is?Clarity: Very clear (35%)
Fairly clear (58%)Not very clear (7%)
Q5d. And how much do you feel you can trust the information given in (element)?Trust: I trust what it says (35%)
I’m pretty sure I can trust what it says (49%)I’m not sure whether to trust it (16%)
Base: n=43
Return to Label Element Menu
Base: n=43
Base: n=43

144EndorsementsEndorsements

145EndorsementsEndorsements
17%
39%
42%
6%
0% 10% 20% 30% 40% 50% 60% 70% 80% 90% 100%
Unpromptedawareness
Prompted awareness
Use
Use most
Products used for:
Oils, butter, spreads : 64%
Dairy products : 56%
Breakfast cereals : 39%
Canned foods : 36%
Fresh produce : 31%
BASE: n=1940

146EndorsementsEndorsements
Q5b. When buying (product) how often do you look at (element)?Frequency: Every time I buy product (29%)
Most of the time (34%)Only occasionally (21%)Buying for the first time (16%)
Q5c Which of these best describes how clear and easy to understand you think (element) is?Clarity: Very clear (55%)
Fairly clear (42%)Not very clear (3%)
Q5d. And how much do you feel you can trust the information given in (element)?Trust: I trust what it says (53%)
I’m pretty sure I can trust what it says (40%)I’m not sure whether to trust it (7%)
Base: n=338
Base: n=336
Base: n=336

147EndorsementsEndorsements
Click Here
Return to Label Element Menu

148
EndorsementsEndorsements‘Friendly Production ‘Friendly Production
Processes’ Processes’
The fictitious endorsement; ‘Friendly production Processes’ was included in the final set of picture cards. This was included to provide a measure of the validity of respondents’ recall and recognition of the legitimate endorsements, and more generally recognition of all other elements.
Only 2% of respondents reported recognising this endorsement, which strengthens the validity of recall results for all other elements, and the overall study per se.
Friendly
Return to Label Element Menu
Return to Main Menu

149Segmentation of Label UsersSegmentation of Label UsersMotivated
Unmotivated
CapableUnable
Click on segment for
more detail or proceed
through all segment profiles
1
3
4
6
5
2
HIGHLabel Use
LOWLabel Use
Back to Main Menu
Click here for Overview of Findings

150What is segmentation?What is segmentation?• Segmentation analysis is conducted in order to group individuals into
segments with like qualities. It is a way of examining whether the sample population is homogenous (ie basically one single group with similar attitudes and behaviour) or heterogeneous (ie comprised of several distinct segments, each with different priorities, preference, attitudes or behaviours).
• Traditionally, evaluation analysis involves the disaggregation of respondents by demographic characteristics such as age, gender, income, education etc. In some cases, differences in label use can be explained by these types of characteristics however, if two ‘like’ consumers (with the same demographics) use different numbers of label elements, there maybe other factors at play which cannot be explained by traditional analysis.

151How is segmentation used here?How is segmentation used here?
• This segmentation analysis and model attempts to understand what drives high or low label element use, in order to assist FSANZ in developing food standards in the future. The results could also be useful for developing education strategies.
• The ‘dependent’ variable is therefore the number of label elements a consumer uses. The segment produces ‘higher’ and ‘lower’ users, compared to the ‘average’ number of label elements used by the sample population.
• The segmentation is an attempt to simplify a very complex and partly irrational behaviour (both impulsive and habitual), and should therefore be used bearing this in mind.

152The 6 Segment PictureThe 6 Segment Picture• The segmentation analysis confirms that this sample of n=1940 consumers
is not homogenous in terms of label use. The analysis produced a 6 segment solution, supported by firm statistics.
• However, the results show that several of the six segments do not differ greatly from each other. Two segments (1 & 6) are clustered together, around higher label use, motivation and capacity. Three other segments (2, 4 & 5) are clustered together around ‘average’ levels of use, motivation and capacity. We suspect that this is because they are based on use of all the label elements a consumer uses (eg a date mark, an NIP, an allergen declaration, a nutrient claim etc). The earlier analysis of the data also suggests that different characteristics drive the use of different elements, eg. having special health needs. This would further contribute to the apparent lack of significant distinction between some segments of label users.

153The 6 Segment Picture cont’dThe 6 Segment Picture cont’d
• The premise underlying the segmentation analysis emerged from the preceding qualitative research, which indicated that consumers’ use of food labels varied enormously depending on their motivation, (and the reasons behind their motivation), and their capacity, including their success in previous attempts to interpret labels.
• The Model is therefore built around two dimensions, ‘motivation’ and ‘capacity’ to use labels:
– “Motivation” = health consciousness, special health needs, interest in food label information, and importance/usefulness of food label information.
– “Capacity” = past success in finding food label information; sufficient time to read labels while shopping; perceptions of label element clarity and trust of label elements.
• Levels or strength of “motivation” and “capacity” are broadly expressed as ‘high’, ‘moderate’ and ‘low’ - these are qualitative terms applied to give relative meaning to motivation/capacity between the segments. Intuitively, it appears that the “motivation” dimension is stronger than the “capacity” dimension, but this proposition has not been tested statistically.

154The 6 Segment Picture cont’dThe 6 Segment Picture cont’d
• Each segment is profiled in the following slides. Differences between the segments are discussed where they differ slightly or substantially from the average (ie the total sample) on a particular variable. Segments are firstly described in terms of “motivation” and “capacity”, and then profiled with demographic differences that help explain the “motivation” and “capacity’ indicators.
• Where the segments ‘fit’ on the model is in the end an intuitive placement, based on quantitative measures of this study, together with qualitative findings that proceeded it.

155Technical DetailsTechnical Details
• Analysis was conducted using GEMSegment, a sophisticated segmentation analysis, because traditional cluster analysis proved unstable.
• For some capacity indicators (ability to find any information needed, enough time to read labels when shopping) results are reported as an agreement/disagreement differential. The differential is either:
–strongly agree minus strongly disagree ratings, or
–strongly agree/tend to agree minus strongly disagree/tend to disagree ratings.
The differential is reported in comparison to the total sample. When the differential is a negative number, more people disagree than agree.

156Overview of FindingsOverview of Findings• The number of label elements used by a consumer increases with stronger
motivation and/or capacity. The average number of label elements used is five (5.3).
• Two of the smallest segments (11% each) are highest users - each segment uses approximately 7 label elements. These segments do have some different characteristics, but both indicated higher motivation and moderate-high capacity, compared to the other segments.
• The largest segment (31%) is comprised of the low users - 4 label elements. This segment of users indicated the lowest motivation and low-moderate capacity.
• The remaining 3 segments are clustered together, around ‘moderate’ levels of motivation and capacity.
– The two largest of these segments (19% and 17%) are ‘average’ label users (5 label elements).
– The smallest segment (10%) is comprised of slightly higher users (6 label elements).

157Implications - ‘food for Implications - ‘food for
thought’thought’• Surprisingly, there are few statistically significant differences (at 95% level)
between most of the characteristic traits examined for each of the segments, particularly for demographic variables. This suggests that whilst some segments differ enough to require different ‘messages’ (motivational or capacity/behaviour focused), a ‘mass’ approach to message and information dissemination is possibly the best way to proceed, in the absence of detailed understanding of what drives use of each individual label element (see comments under technical details).
• Although higher motivation and capacity appear to predict higher use of labels, more research is needed to understand whether this is true for all label elements or just some, and which ones. However, in terms of actioning the findings, to increase use of some or all elements, the results indicate that increasing a consumer’s motivation, without addressing capacity, is not sufficient. Simply trying to move consumers in the lower-use segments into the higher-use segments, by increasing their interest in labels or their perceived relevance is not enough. Consumers also need to be enabled, via education and practice, in order to become satisfied and effective users.

158Implications cont’dImplications cont’d• For example, segments 1 and 6 (high users) appear to be highly motivated
by their special needs, health consciousness and (therefore) interest in labelling. However these consumers still reported slightly lower levels of ‘success’ in finding label information they need, compared to consumers in lower user segments. These people appear to be ’soldiering on’ because the motivational indicators driving their use of labels are dominating ‘lifestyle’ needs. However if consumers in other segments, who are motivated by less fundamental needs are encouraged to increase use of labels, without the ‘capability’ issues being addressed, they are probably less likely to remain higher users for long.
• This hypothesis builds a strong argument for mass education, even if on a selected number of priority label elements, if labelling is to be useful, as it could well be, to the general population.
Back to Main Menu
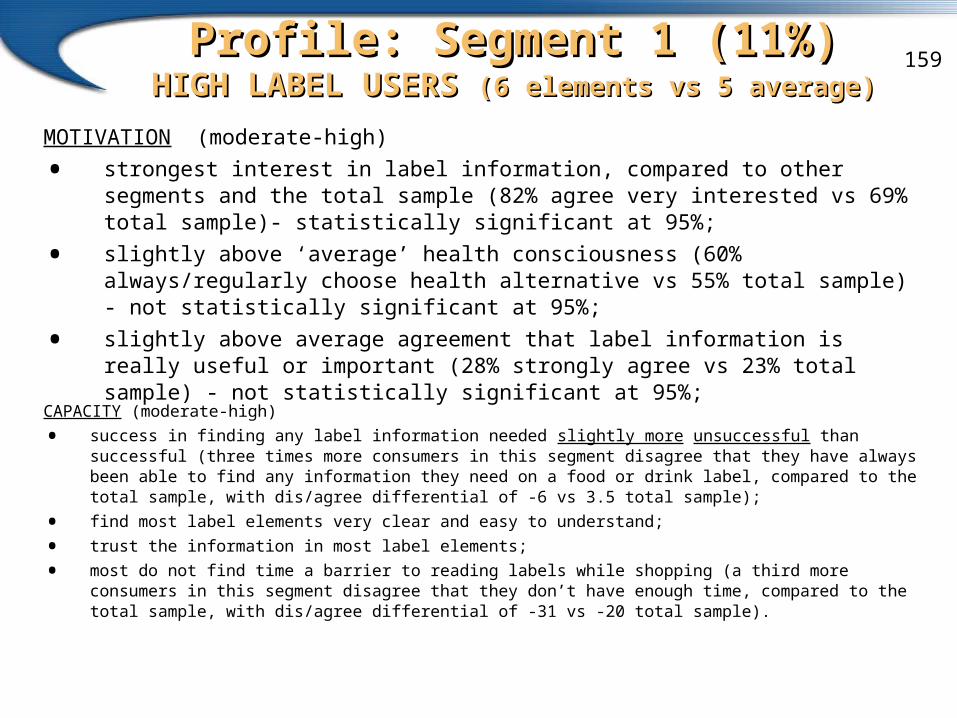
159Profile: Segment 1 (11%)Profile: Segment 1 (11%)
HIGH LABEL USERS HIGH LABEL USERS (6 elements vs 5 average)(6 elements vs 5 average)
MOTIVATION (moderate-high)
• strongest interest in label information, compared to other segments and the total sample (82% agree very interested vs 69% total sample)- statistically significant at 95%;
• slightly above ‘average’ health consciousness (60% always/regularly choose health alternative vs 55% total sample) - not statistically significant at 95%;
• slightly above average agreement that label information is really useful or important (28% strongly agree vs 23% total sample) - not statistically significant at 95%;
CAPACITY (moderate-high)
• success in finding any label information needed slightly more unsuccessful than successful (three times more consumers in this segment disagree that they have always been able to find any information they need on a food or drink label, compared to the total sample, with dis/agree differential of -6 vs 3.5 total sample);
• find most label elements very clear and easy to understand;
• trust the information in most label elements;
• most do not find time a barrier to reading labels while shopping (a third more consumers in this segment disagree that they don’t have enough time, compared to the total sample, with dis/agree differential of -31 vs -20 total sample).

160Profile: Segment 1 (11%)Profile: Segment 1 (11%)
• Uses more label elements than the average for the total sample (mean = 6.9 vs 5.3 total sample);
• Same proportion of males/females to total population
• Has a higher household income (61% earn over $40,000 vs 50% total sample). Most respondents are in the ‘middle’ income bracket of $40,000-$74,999;
• Is mainly ‘middle’ aged. Within this segment there are significantly more people aged 35-64yrs than all other ages;
• Has three times more couples than singles (68% couples vs 20% singles, 12% other/refused);
• Has slightly more children than the total sample (51% vs 45% total sample), however these differences are not statistically significant.
Return to Segmentation of Label Users
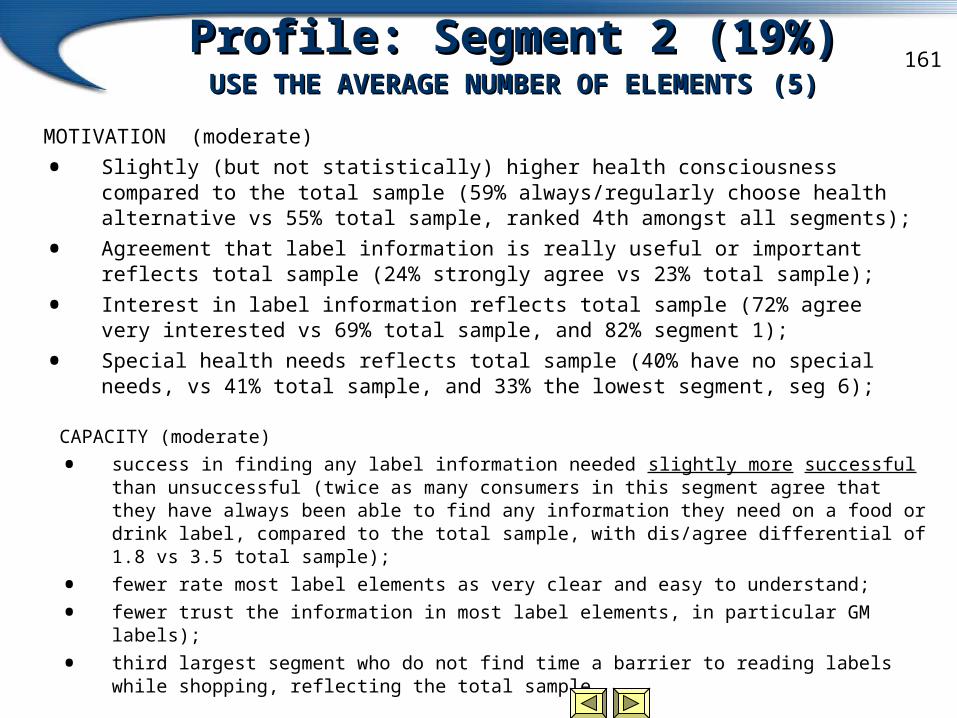
161Profile: Segment 2 (19%)Profile: Segment 2 (19%)
USE THE AVERAGE NUMBER OF ELEMENTSUSE THE AVERAGE NUMBER OF ELEMENTS (5)(5)
MOTIVATION (moderate)
• Slightly (but not statistically) higher health consciousness compared to the total sample (59% always/regularly choose health alternative vs 55% total sample, ranked 4th amongst all segments);
• Agreement that label information is really useful or important reflects total sample (24% strongly agree vs 23% total sample);
• Interest in label information reflects total sample (72% agree very interested vs 69% total sample, and 82% segment 1);
• Special health needs reflects total sample (40% have no special needs, vs 41% total sample, and 33% the lowest segment, seg 6);
CAPACITY (moderate)
• success in finding any label information needed slightly more successful than unsuccessful (twice as many consumers in this segment agree that they have always been able to find any information they need on a food or drink label, compared to the total sample, with dis/agree differential of 1.8 vs 3.5 total sample);
• fewer rate most label elements as very clear and easy to understand;
• fewer trust the information in most label elements, in particular GM labels);
• third largest segment who do not find time a barrier to reading labels while shopping, reflecting the total sample.

162Profile: Segment 2 (19%)Profile: Segment 2 (19%)
• Uses the average number of label elements (mean = 5 vs 5.3 total sample);
• Same proportion of males/females as total population
• Education levels are more polarised than some segments, with slightly larger proportions of tertiary or higher (27% vs 24% total sample) and secondary only (50% vs 46% total sample);
• Mainly ‘middle’ aged. Within this segment there are slightly more people aged 35-64yrs than all other ages, and fewer people aged 18-24, than other segments;
• Proportionally more couples compared to other segments (63% couples vs 28% singles, 12% other/refused).
Return to Segmentation of Label Users

163Profile: Segment 3 (31%)Profile: Segment 3 (31%)
LOW LABEL USERS (4 elements vs 5 average)LOW LABEL USERS (4 elements vs 5 average)MOTIVATION (low)
• lowest interest in label information (64% agree very interested vs 69% total sample, and 82% segment 1 (high label users));
• lowest health consciousness compared to all segments but not statistically different from the total sample (50% always/regularly choose health alternative vs 55% total sample and 66% segment 6);
• lowest agreement that label information is really useful or important (19% strongly agree vs 23% total sample - not statistically significant at 95%);
• fewest special health needs of all segments and largest proportion of no special health needs (45% no special needs vs 41% total population - not statistically significant at 95%);
CAPACITY (moderate-low)
• one and a half times as many consumers in this segment agree that they have always been able to find any information they need on a food or drink label, compared to the total sample (dis/agree differential of 5.4 vs 3.5 total sample);
• fewer rate most label elements as very clear and easy to understand;
• fewer trust the information in most label elements, in particular ingredients list, allergen declaration, nutrient claim and endorsements);
• largest proportion who find time a barrier to reading labels while shopping.

164Profile: Segment 3 (31%)Profile: Segment 3 (31%)
• Uses the fewest label elements (mean = 4.2 vs 5.3 total sample);
• Has the most males (38% vs 33% total sample);
• Education levels are slightly lower compared to other segments, but generally reflect total sample;
• Proportionally more older (65+) and younger (18-24) respondents than other segments;
• Proportionally fewer couples compared to singles (57% couples vs 28% singles, 12% other/refused);
• Fewest children, compared to other segments as well as the total sample (40% vs 45% total sample), these differences are statistically significant;
Return to Segmentation of Label Users

165Profile: Segment 4 (17%) Profile: Segment 4 (17%)
USE THE AVERAGE NUMBER OF ELEMENTSUSE THE AVERAGE NUMBER OF ELEMENTS (5)(5)
MOTIVATION (moderate)
• ‘average’ level of health consciousness (57% always/regularly choose health alternative vs 55% total sample);
• ‘average’ agreement that label information is really useful or important ie (26% strongly agree vs 23% total sample);
• ‘average’ interest in label information, reflecting the total sample (69% agree very interested);
• few special health needs (allergens, vegetarian/vegan, religious beliefs) and smaller proportion of no special health needs (34% no special needs vs 41% total population).
CAPACITY (low-moderate)
• do not find some label elements very clear and easy to understand (allergen declaration, nutrient claim, country of origin, GM)
• do not trust the information in some label elements (ingredient list, NIP, % label, but do trust the allergen declaration);
• most do not find time a barrier to reading labels while shopping (a third more consumers in this segment disagree that they don’t have enough time, compared to the total sample, with dis/agree differential of -30 vs -20 total sample).

166Profile: Segment 4 (17%)Profile: Segment 4 (17%)• Uses just below the average number of label elements (mean = 4.8 vs
5.3 total sample), but is the second lowest ‘user’ segment;
• Is comprised of more males than other segments, in proportion with the total sample (32% vs 33% total sample);
• Largest proportion of Australians (71% vs 64% total sample).
• Education levels are slightly higher than the total sample, with the lowest proportion of respondents achieving lowest levels of education (45% secondary or lower vs 50% total sample), however this difference is not significant at the 95% confidence level;
• Proportionally slightly more older (65+) respondents than most other segments, and the total sample (17% vs 16% total sample) however this difference is not significant at the 95% confidence level;
• Proportionally more couples (fewer with children than other segments), with fewer singles (67% couples vs 22% singles, 11% other/refused);
Return to Segmentation of Label Users
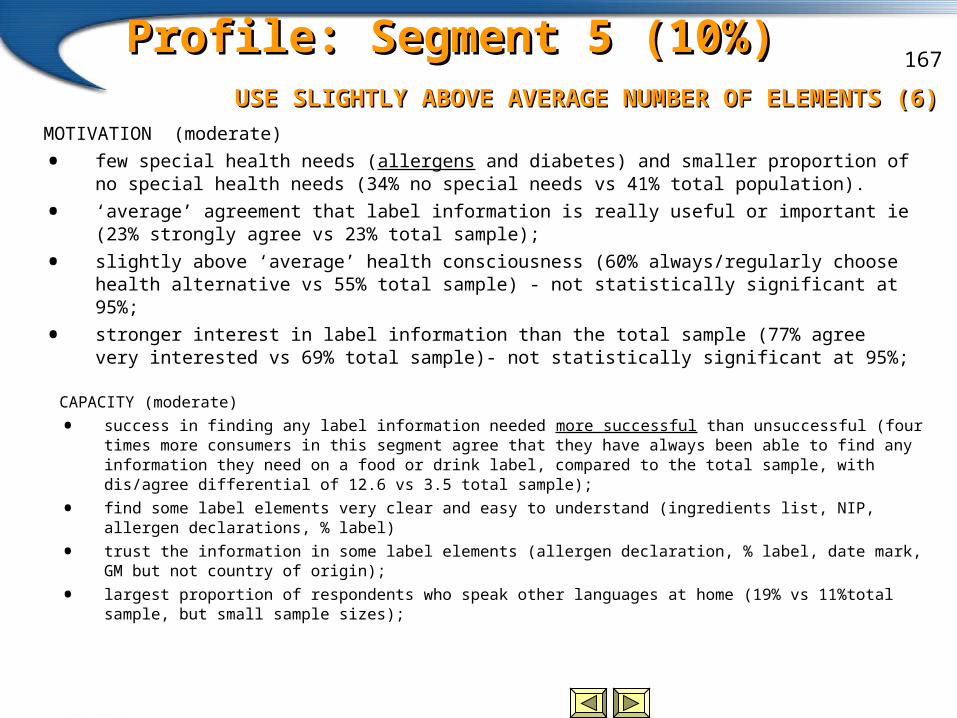
167Profile: Segment 5 (10%) Profile: Segment 5 (10%) USE SLIGHTLY ABOVE AVERAGE NUMBER OF ELEMENTS (6)USE SLIGHTLY ABOVE AVERAGE NUMBER OF ELEMENTS (6)
MOTIVATION (moderate)
• few special health needs (allergens and diabetes) and smaller proportion of no special health needs (34% no special needs vs 41% total population).
• ‘average’ agreement that label information is really useful or important ie (23% strongly agree vs 23% total sample);
• slightly above ‘average’ health consciousness (60% always/regularly choose health alternative vs 55% total sample) - not statistically significant at 95%;
• stronger interest in label information than the total sample (77% agree very interested vs 69% total sample)- not statistically significant at 95%;
CAPACITY (moderate)
• success in finding any label information needed more successful than unsuccessful (four times more consumers in this segment agree that they have always been able to find any information they need on a food or drink label, compared to the total sample, with dis/agree differential of 12.6 vs 3.5 total sample);
• find some label elements very clear and easy to understand (ingredients list, NIP, allergen declarations, % label)
• trust the information in some label elements (allergen declaration, % label, date mark, GM but not country of origin);
• largest proportion of respondents who speak other languages at home (19% vs 11%total sample, but small sample sizes);

168Profile: Segment 5 (10%)Profile: Segment 5 (10%)
• Uses the average number of label elements (mean = 5.9 vs 5.3 total sample);
• Has slightly more females (73% vs 67% total sample);
• Education levels are slightly higher than the total sample, with the highest proportion of tertiary or higher (29% vs 24% total sample) and fewer achieving lowest levels of education (48% secondary or lower vs 50% total sample), however this difference is not significant at the 95% confidence level;
• More 18-24yr olds than most segments, and fewest aged 55+;
• Proportionally more couples, with the fewest singles (65% couples vs 14% singles, 21% other/refused);
• Most children compared to all other segments and the total sample (62% vs 45% total sample), these differences are statistically significant;
• Largest proportion of respondents who speak other languages at home (19% vs 11%total sample, but small sample sizes);
• 2nd largest proportion of New Zealanders (46% vs 35%v total sample).
Return to Segmentation of Label Users

169Profile: Segment 6 (11%) Profile: Segment 6 (11%) USE THE MOST ELEMENTS (7)USE THE MOST ELEMENTS (7)
MOTIVATION (high)
• significantly above ‘average’ health consciousness (66% always/regularly choose health alternative vs 55% total sample);
• most special health needs (asthma, diabetes, heart disease, general health concerns, migraine, religious but not allergens!) and smallest proportion of no special health needs (33% no special needs vs 41% total population).
• strongest agreement that label information is really useful or important (35% strongly agree vs 23% total sample) - not statistically significant at 95%;
• stronger interest in label information than the total sample (79% agree very interested vs 69% total sample)- not statistically significant at 95%;
CAPACITY (moderate-high)
• success in finding any label information needed more unsuccessful than successful (twice as many consumers in this segment disagree that they have always been able to find any information they need on a food or drink label, compared to the total sample, with dis/agree differential of -1.8 vs 3.5 total sample);
• find most label elements very clear and easy to understand;
• trust the information in most label elements;
• most do not find time a barrier to reading labels while shopping, represented in the same proportion as the total sample.

170Profile: Segment 6 (11%)Profile: Segment 6 (11%)
• Uses the most label elements (mean = 7.2 vs 5.3 total sample);
• Has the most females (77% vs 67% total sample);
• Education levels reflect total sample, with slightly fewer achieving lowest education (48% secondary or lower vs 50% total sample), however this difference is not significant at the 95% confidence level;
• Proportionally fewer couples compared to singles (60% couples vs 29% singles, 11% other/refused);
• Largest proportion of respondents who mainly speak English at home (93% vs 89%total sample).
• Has slightly more children than the total sample (50% vs 45% total sample), however these differences are not statistically significant;
Return to Segmentation of Label Users
Return to Main Menu

FOOD LABELLING ISSUES: QUANTITATIVE FOOD LABELLING ISSUES: QUANTITATIVE RESEARCH WITH CONSUMERSRESEARCH WITH CONSUMERS
A Presentation toFood Standards Australia New Zealand
(FSANZ)
Job Number C02020May 2003

172
18-24 is significantly different to:
35-4445-5455-64
Age:
Click on coloured area to return to relevant graph
Use of Use of nutrient claimnutrient claim - - (presenting subgroups with statistically significant differences)(presenting subgroups with statistically significant differences)
65+ is significantly different to:
35-4455-64

173
65+ is significantly different to:
25-3435-4445-5455-64
Age:
Click on coloured area to return to relevant graph
Use of Use of GMGM Declaration - Declaration - (presenting subgroups with statistically significant differences)(presenting subgroups with statistically significant differences)
18-24 is significantly different to:
35-4455-64
Education:
Primary is significantly different to:
Tertiary or higher
Secondary is significantly different to:
TradeTertiary or higher

174
Age:18-24 is significantly different to:
25-3435-4445-5455-6465+
Click on coloured area to return to relevant graph
Use of Use of country of origincountry of origin - - (presenting subgroups with statistically significant differences)(presenting subgroups with statistically significant differences)
25-34 is significantly different to: 45-5455-6465+

175
‘Secondary’ is significantly different to: Trade
Tertiary or higher
Education:
Income:‘$75 000 and over’ is significantly
different to: <$40 000
$40 000-$74 999
Click on coloured area to return to relevant graph
Prompted awareness of Prompted awareness of country of origincountry of origin - - (presenting subgroups with statistically significant differences)(presenting subgroups with statistically significant differences)

176
55-64 is significantly different to:
25-3435-44
Age:
Health Conscious: ‘Highly’ is significantly different to:
‘Not at all’‘Moderately’
Click on coloured area to return to relevant graph
Prompted awareness of Prompted awareness of warning statementwarning statement - -
(presenting subgroups with statistically significant differences)(presenting subgroups with statistically significant differences)
18-24 is significantly different to:
25-3435-4445-5455-64
65+ is significantly different to:
25-3435-4445-5455-64
‘Moderately’ is significantly different to:
‘Not at all’

177
65+ is significantly different to:
45-54 55-64
Age:
Click on coloured area to return to relevant graph
Use of Use of % label% label - - (presenting subgroups with statistically significant differences)(presenting subgroups with statistically significant differences)
18-24 is significantly different to:
45-5455-64

178Attitudes by AgeAttitudes by Age18-24 significantly different to:
25-4445-64
“I sometimes like to choose healthy or
nutritious foods depending on cost and convenience”
“I regularly choose
the healthy alternative”
18-24 significantly different to:
25-4445-6465+
18-24 significantly different to:
25-4445-6465+
Click on coloured area to return to relevant graph
18-24 significantly different to: 25-4445-6465+
“I’m not at all concerned about the health or nutritional value
of the food I choose”
“I usually don’t worry about the health or nutritional value”
65+ significantly different to:
25-44
25-44 significantly different to:
45-64

179Use of Use of ingredients listingredients list - -
(presenting subgroups with statistically significant differences)(presenting subgroups with statistically significant differences)
18-24 is significantly different to: 25-3435-4445-5455-64
Age:
$75 000 and over is significantly different to:
>$40 000$40 000-$74 999
Income:
Primary is significantly different to:
TradeTertiary or Higher
Education: Secondary is significantly different to:
Trade
Tertiary or Higher
Click on coloured area to return to relevant graph
65+ is significantly different to: 35-4445-5455-64

180Use of Use of NIPNIP - - (presenting subgroups with statistically significant differences)(presenting subgroups with statistically significant differences)
65+ is significantly different to:25-34 35-4445-5455-64
18-24 significantly different to: 25-3435-4445-5455-64
Age:
Click on coloured area to return to relevant graph

181Prompted awareness of Prompted awareness of allergen allergen
declarationdeclaration - - (presenting subgroups with statistically significant differences)(presenting subgroups with statistically significant differences)
18-24 significantly different to:
35-4445-5455-64
Age:
25-34 is significantly different to:
35-4445-5455-64
Primary is significantly different to:
Secondary Trade
Tertiary or higher
Education: Tertiary or higher is significantly different to:
Trade Secondary
Click on coloured area to return to relevant graph
65+ is significantly different to:
18-2425-3435-4445-5455-64

182
18-24 is significantly different to:
55-64
Prompted awareness of Prompted awareness of % label% label - - (presenting subgroups with statistically significant differences)(presenting subgroups with statistically significant differences)
Age:
Health Conscious: ‘Highly’ is significantly different to: ‘Not at all’
‘Moderately’
Click on coloured area to return to relevant graph
35-44 is significantly different to:
55-64
65+ is significantly different to:
25-3445-5455-64
Special needs:
‘Yes’ is significantly different to:
‘No’

183
18-24 is significantly different to: 25-3445-5465+
Age:
Click on coloured area to return to relevant graph
Prompted awareness of Prompted awareness of nutrient nutrient claimclaim
(presenting subgroups with statistically significant differences)(presenting subgroups with statistically significant differences)
Health Conscious: ‘Highly’ is significantly different to:
‘Not at all’‘Moderately’
‘Moderately’ is significantly different to:
‘Not at all’

184
18-24 is significantly different to:
35-4445-5455-64
Age: 65+ is significantly different to:
18-24 25-3435-4445-5455-64
Click on coloured area to return to relevant graph
Prompted awareness of Prompted awareness of advisory statementadvisory statement - -
(presenting subgroups with statistically significant differences)(presenting subgroups with statistically significant differences)
$75 000 and over is significantly different to:<$40 000
Income:
Primary is significantly different to:Secondary
TradeTertiary or Higher
Education: Secondary is significantly different to:
Trade
Tertiary or Higher
Highly is significantly different to:ModeratelyNot at all
Health Conscious:
25-34 is significantly different to:
35-4445-5455-64
Moderately is significantly different to:
Not at all

185Prompted awareness of Prompted awareness of prep and storage prep and storage instructionsinstructions - -
(presenting subgroups with statistically significant differences)(presenting subgroups with statistically significant differences)
Age: 18-24 is significantly different to:
65+