food losses and waste in turkey - home | food and
TRANSCRIPT
FOOD LOSSES AND WASTE IN TURKEY
Country Report
Prepared by F.F.Tatlıdil, İ.Dellal, Z. Bayramoğlu
2013
This paper carries the name of the author and should be used and cited accordingly. The findings,
interpretations and conclusions are the authors’ own and should not be attributed to the Food and Agriculture
Organization of the UN, its management, or any member countries.
This paper was prepared within the “Food Losses and Waste in Europe and Central Asia” component of the
Agrarian Structures Initiative, which is a regional program of FAO in Europe and Central Asia.
More information on the Agrarian Structures Initiative and its projects is available at
http://www.fao.org/europe/agrarian-structures-initiative/en/

Contents
1. SUMMARY ............................................................................................................................................... 1
2. INTRODUCTION ....................................................................................................................................... 4
2.1. Concept ................................................................................................................................................ 6
2.2. Objectives ............................................................................................................................................. 6
2.3. Methodology used for Analysis ............................................................................................................ 6
2.4. Sources and type of information.......................................................................................................... 7
2.5. Structure of the Analysis ...................................................................................................................... 8
3. OVERVIEW OF MAIN COMMODITY GROUPS............................................................................................. 10
3.1. Cereals ................................................................................................................................................ 10
3.2. Pulses ................................................................................................................................................. 12
3.3. Oilseeds .............................................................................................................................................. 14
3.4. Root and tubers .................................................................................................................................. 16
3.5. Vegetables .......................................................................................................................................... 17
3.6. Fruit .................................................................................................................................................... 19
3.7. Meat ................................................................................................................................................... 20
3.8. Milk..................................................................................................................................................... 22
3.9. Eggs .................................................................................................................................................... 23
3.10. Fish and seafood .............................................................................................................................. 23
4.1 Identification of priority agri-food chains ..................................................................................... 25
4.2 Description of priority agri-food chains ....................................................................................... 27
4.3 Assessment of food losses and waste and critical loss points ...................................................... 31
4.4. Summary assessment of FLW............................................................................................................. 40
5. ANALYSIS OF KEY FACTORS FOR FLW ........................................................................................................ 42
5.1. Technology and investment ............................................................................................................... 42
5.2. Human resources ............................................................................................................................... 42
5.3. Food safety and quality standards ..................................................................................................... 43
6. PRIORITY ACTIONS AND POLICIES FOR REDUCING FLW ............................................................................ 44
6.1. The enabling environment for agri-food chain performance ....................................................... 44
6.2 Actions and policy proposals ........................................................................................................ 45
References ..................................................................................................................................................... 47
ANNEXES........................................................................................................................................................ 48

1
1. SUMMARY
This study has been carried out to validate food losses and waste as a priority in the agri-food chain in Turkey at the request of the Food and Agriculture Organization of the United Nations (FAO) in 2013. The Turkish Country Report is a part of overall FAO work on identifying food losses and waste in the framework of the Save Food Project. The objective of the study is to assess food losses and waste at critical points in the food supply chain for commodity groups specified by FAO and the Swedish Institute for Biotechnology in Turkey, which together have the greatest impact on food security and supply in the country. The commodity groups in question are cereals, roots and tubers, oilseeds and pulses, fruit and vegetables, meat, fish and seafood, milk and eggs. For this purpose, food losses and waste were assessed in general together with their effects on food security and supply in the Turkey country report. Critical loss points in the food supply chain for selected commodities were also identified and analyzed. The commodities can be sorted as follows in terms of the largest economic importance (production value and contribution to foreign exchange), the largest impact smallholder producers, and the most significant share in agricultural production:
Wheat, barley and corn for the cereals group; Sugar beet and potatoes for the roots and tubers group; Sunflower seeds, chickpeas, lentils and beans for the oil seeds and pulses group; Grapes, olives, apples, tomatoes, green peppers and cucumbers for the fruit and vegetables
group; Beef, chicken, mutton, and goat for the meat group; Milk (cattle, sheep, goat, buffalo milk), cheese, yogurt, butter and eggs for the milk and eggs
products; All products for the fish and seafood group.
Five priority agri-food chains were determined for a detailed critical loss point (CLP) analysis; namely, flour and flour products, milk and dairy products, meat and meat products, olive oil and refined tomato products. These were chosen based on their economic importance, employment generation, contribution to foreign exchange and food security. The sources of data used in the study are as follows:
In relation to commodity groups identified by FAO and the Swedish Institute for Biotechnology the following data sources were used: data from the FAOSTAT Food and Balance Sheet related to Turkey; data from the Turkish Statistics Institute (TURKSTAT); and data from various reports prepared by the public and private sector as well as related NGOs. Focus group meetings with producers and stakeholders were also held to identify food losses and waste and critical loss points in the supply chains of flour and flour products, meat and meat products, milk and egg products and fish and sea food.
For olive oil, tomato products (tomato paste, tomato mash, etc), eggs, sugar and potato
products (chips, frozen potato, etc) interviews were conducted with experienced key persons in the respective sectors. In meetings, semi-structured questionnaires for each specific commodity group were used. In these questionnaires, losses in the food supply chain are
2
considered in the context of five stages; namely, agricultural production, postharvest handling and storage, processing and packaging, distribution and consumption. In focus group meetings, food losses and waste rates and critical loss points along the food supply chain were identified on the basis of discussions with participants.
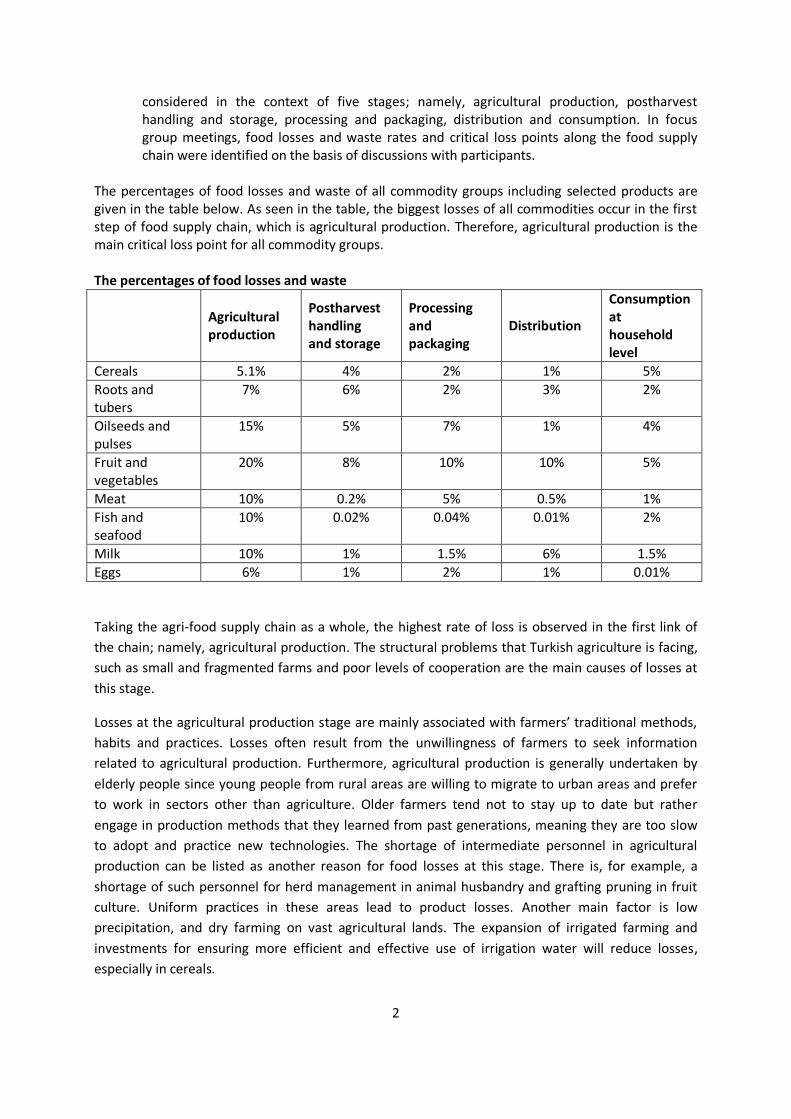
The percentages of food losses and waste of all commodity groups including selected products are given in the table below. As seen in the table, the biggest losses of all commodities occur in the first step of food supply chain, which is agricultural production. Therefore, agricultural production is the main critical loss point for all commodity groups. The percentages of food losses and waste
Agricultural production
Postharvest handling and storage
Processing and packaging
Distribution
Consumption at household level
Cereals 5.1% 4% 2% 1% 5%
Roots and tubers
7% 6% 2% 3% 2%
Oilseeds and pulses
15% 5% 7% 1% 4%
Fruit and vegetables
20% 8% 10% 10% 5%
Meat 10% 0.2% 5% 0.5% 1%
Fish and seafood
10% 0.02% 0.04% 0.01% 2%
Milk 10% 1% 1.5% 6% 1.5%
Eggs 6% 1% 2% 1% 0.01%
Taking the agri-food supply chain as a whole, the highest rate of loss is observed in the first link of
the chain; namely, agricultural production. The structural problems that Turkish agriculture is facing,
such as small and fragmented farms and poor levels of cooperation are the main causes of losses at
this stage.
Losses at the agricultural production stage are mainly associated with farmers’ traditional methods,
habits and practices. Losses often result from the unwillingness of farmers to seek information
related to agricultural production. Furthermore, agricultural production is generally undertaken by
elderly people since young people from rural areas are willing to migrate to urban areas and prefer
to work in sectors other than agriculture. Older farmers tend not to stay up to date but rather
engage in production methods that they learned from past generations, meaning they are too slow
to adopt and practice new technologies. The shortage of intermediate personnel in agricultural
production can be listed as another reason for food losses at this stage. There is, for example, a
shortage of such personnel for herd management in animal husbandry and grafting pruning in fruit
culture. Uniform practices in these areas lead to product losses. Another main factor is low
precipitation, and dry farming on vast agricultural lands. The expansion of irrigated farming and
investments for ensuring more efficient and effective use of irrigation water will reduce losses,
especially in cereals.

3
Food safety and quality standards are important elements in achieving low levels of losses in
agriculture. Although there are various regulations on these subjects, there are some restrictions in
achieving safer and better quality agricultural products. One of these restrictions is the lack of pricing
systems based on nutritional content for all products.
Losses that occur in the other stages are relatively smaller than those that occur in the agricultural
production stage. Recent advances in transportation, processing and storage technologies and
preference of firms in the supply chain for new technologies are helping to reduce losses.
The Ministry of Food, Agriculture and Animal Husbandry and other related ministries have some
regulations that cover all those problems not only solving long lasting structural problems of Turkish
agriculture but also adapting its agricultural policy to EU. However, proper application, control and
governance at the all stages of agri-food supply chain are needed.
4
2. INTRODUCTION
In the context of the “Save Food Programme” aimed at improving food supply and security, the Food and Agricultural Organization of United Nations is conducting activities in various countries to reduce food losses and waste and to enhance awareness on these issues. The first of these activities was carried out by the Swedish Institute for Food and Biotechnology in 2010-2011. According to the research findings:
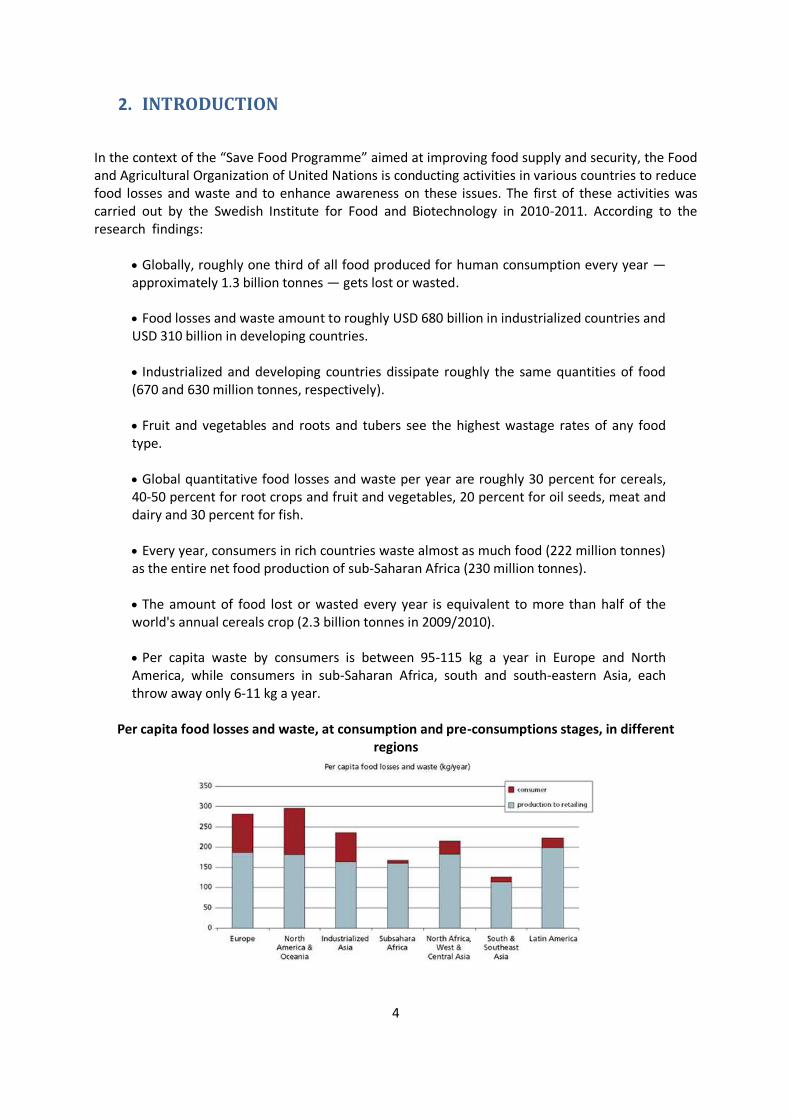
Globally, roughly one third of all food produced for human consumption every year — approximately 1.3 billion tonnes — gets lost or wasted. Food losses and waste amount to roughly USD 680 billion in industrialized countries and USD 310 billion in developing countries. Industrialized and developing countries dissipate roughly the same quantities of food (670 and 630 million tonnes, respectively). Fruit and vegetables and roots and tubers see the highest wastage rates of any food type. Global quantitative food losses and waste per year are roughly 30 percent for cereals, 40-50 percent for root crops and fruit and vegetables, 20 percent for oil seeds, meat and dairy and 30 percent for fish. Every year, consumers in rich countries waste almost as much food (222 million tonnes) as the entire net food production of sub-Saharan Africa (230 million tonnes). The amount of food lost or wasted every year is equivalent to more than half of the world's annual cereals crop (2.3 billion tonnes in 2009/2010). Per capita waste by consumers is between 95-115 kg a year in Europe and North America, while consumers in sub-Saharan Africa, south and south-eastern Asia, each throw away only 6-11 kg a year.
Per capita food losses and waste, at consumption and pre-consumptions stages, in different
regions
5
Total per capita food production for human consumption is about 900 kg a year in rich countries, almost twice the 460 kg a year produced in the poorest regions.
In developing countries 40 percent of losses occur at post-harvest and processing levels while in industrialized countries more than 40 percent of losses happen at retail and consumer levels.
At retail level, large quantities of food are wasted due to quality standards that over-
emphasize appearance.
Food loss and waste also amount to a major squandering of resources, including water, land, energy, labour and capital and needlessly produce greenhouse gas emissions, contributing to global warming and climate change.
The food currently lost or wasted in Latin America could feed 300 million people.
The food currently wasted in Europe could feed 200 million people.
The food currently lost in Africa could feed 300 million people.
Even if just one-quarter of the food currently lost or wasted globally could be saved, it would
be enough to feed 870 million hungry people.
Food losses during harvests and in storage translate into lost income for small-scale farmers and into higher prices for poorer consumers.
In developing countries food waste and losses occur mainly at early stages of the food value
chain and can be traced back to financial, managerial and technical constraints in harvesting techniques as well as storage and cooling facilities. Strengthening the supply chain through the direct support of farmers and investments in infrastructure, transportation, as well as in an expansion of the food and packaging industry could help to reduce the amount of food loss and waste.
In medium- and high-income countries food is wasted and lost mainly at later stages in the
supply chain. Unlike in developing countries, the behaviour of consumers plays a huge part in industrialized countries. The study identified a lack of coordination between actors in the supply chain as a contributing factor. Farmer-buyer agreements can be helpful in increasing the level of coordination. Additionally, raising awareness among industries, retailers and consumers as well as finding a beneficial use for food that is presently thrown away are useful measures for decreasing the amount of losses and waste.
Food is lost or wasted throughout the supply chain, from initial agricultural production down to final household consumption. In medium- and high-income countries food is wasted at the consumption stage to a significant extent, meaning that it is discarded even if it is still suitable for human consumption. Significant losses also occur early in the food supply chains in the industrialized regions. In low-income countries food is lost mostly during the early and middle stages of the food supply chain; much less food is wasted at consumer level.
6
2.1. Concept Food losses and waste that occur at every stage in the supply chain, from seed in crop fields to consumer kitchens, lead to qualitative and quantitative reductions in consumable food. While food losses occur before food reaches consumers, food waste is a phenomenon related more to retailing, the food services sector, and consumers. Food losses before harvesting are caused by various factors including the ineffective use of appropriate technologies and inputs at the production stage, adverse climatic conditions and inappropriate and untimely culturing practices. Pre-harvest losses generally manifest themselves as low yields. Losses during harvesting are caused mostly by using inappropriate machinery or uninformed use of appropriate machinery. Post-harvest losses take place during transport, storage, processing and marketing. These losses typically take the form of pest invasion and loss in nutritional value. Waste at the consumption stage includes losses in nutritional value, degradation, spoilage, rancidity and kitchen waste (Anonymous, 1982).
2.2. Objectives The objective of the study conducted under the consultancy of the Agribusiness and Enterprise Development Officer of the FAO Regional Office for Europe is to assess food losses and waste emerging at critical points in food supply chain for the commodity groups that have the largest impact on food security and food supply in the country (specified by FAO in Turkey). Similar studies are also being carried out simultaneously in selected countries in Europe and Central Asia regions.
2.3. Methodology used for Analysis In this study, the methodology developed by FAO and the Swedish Institute for Food and Biotechnology was used. This considers commodities that have the largest influence on food security and supply in Turkey (cereals, roots and tubers, oilseeds and pulses, fruit and vegetables, meat, fish and seafood, milk and eggs). To this end, primarily in each of all the product groups, products of importance in terms of production area, production output, production value and the contribution of exportation are determined based on their properties (Table 1). Among the mentioned products, five agricultural food industry products that are considered to be lost and wasted in large quantities were chosen. These products are flour and flour products, milk and dairy products, meat and meat products, olive oil and refined tomato products. The most vital constraint here is that the studies are limited. In order to determine food losses and waste as well as critical loss points along supply chains, focus group meetings were organized with the participation of stakeholders from the flour and flour products sector, the meat and meat products sector, the milk and milk products sector and the fish and seafood sector.
7
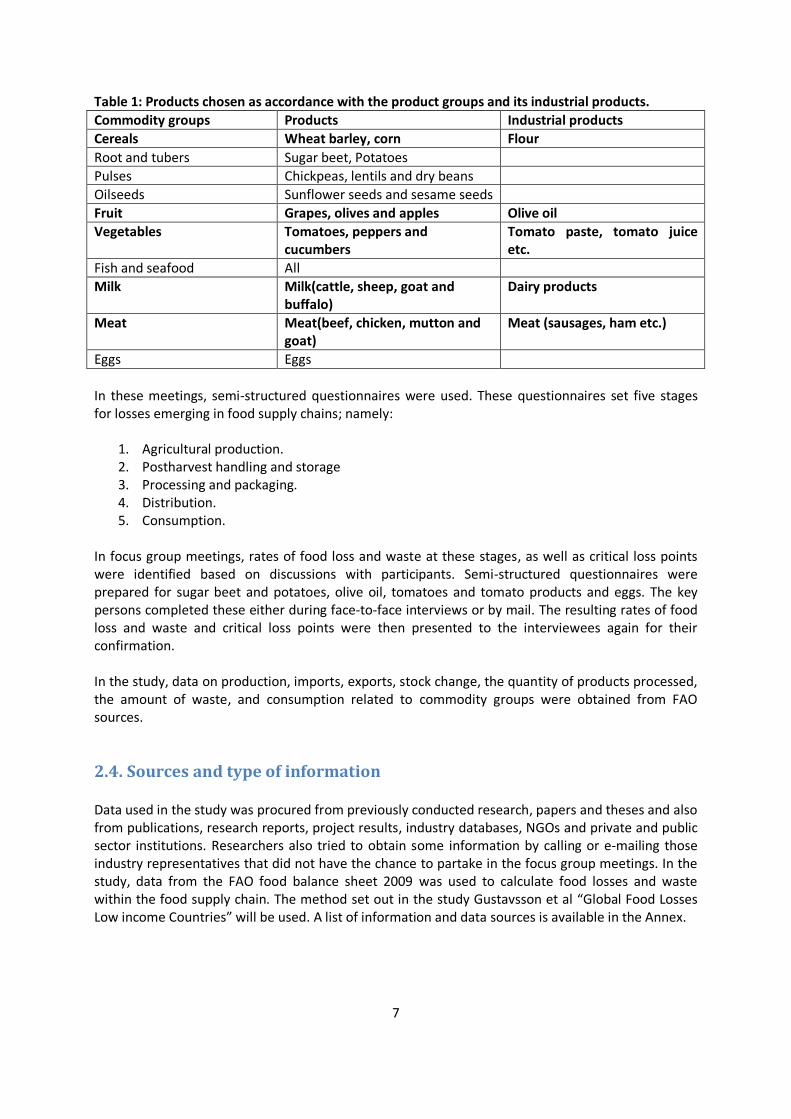
Table 1: Products chosen as accordance with the product groups and its industrial products.
Commodity groups Products Industrial products
Cereals Wheat barley, corn Flour
Root and tubers Sugar beet, Potatoes
Pulses Chickpeas, lentils and dry beans
Oilseeds Sunflower seeds and sesame seeds
Fruit Grapes, olives and apples Olive oil
Vegetables Tomatoes, peppers and cucumbers
Tomato paste, tomato juice etc.
Fish and seafood All
Milk Milk(cattle, sheep, goat and buffalo)
Dairy products
Meat Meat(beef, chicken, mutton and goat)
Meat (sausages, ham etc.)
Eggs Eggs
In these meetings, semi-structured questionnaires were used. These questionnaires set five stages for losses emerging in food supply chains; namely:
1. Agricultural production. 2. Postharvest handling and storage 3. Processing and packaging. 4. Distribution. 5. Consumption.
In focus group meetings, rates of food loss and waste at these stages, as well as critical loss points were identified based on discussions with participants. Semi-structured questionnaires were prepared for sugar beet and potatoes, olive oil, tomatoes and tomato products and eggs. The key persons completed these either during face-to-face interviews or by mail. The resulting rates of food loss and waste and critical loss points were then presented to the interviewees again for their confirmation. In the study, data on production, imports, exports, stock change, the quantity of products processed, the amount of waste, and consumption related to commodity groups were obtained from FAO sources.
2.4. Sources and type of information Data used in the study was procured from previously conducted research, papers and theses and also from publications, research reports, project results, industry databases, NGOs and private and public sector institutions. Researchers also tried to obtain some information by calling or e-mailing those industry representatives that did not have the chance to partake in the focus group meetings. In the study, data from the FAO food balance sheet 2009 was used to calculate food losses and waste within the food supply chain. The method set out in the study Gustavsson et al “Global Food Losses Low income Countries” will be used. A list of information and data sources is available in the Annex.
8
2.5. Structure of the Analysis 1) The commodity groups with the largest impact on food security and food supply on domestic and international markets
First of all, an overall evaluation was made regarding each commodity group. In this evaluation two or three products in each commodity group were identified according to their economic importance (production value, contribution to foreign exchange), their impact on smallholder producers and their share in agricultural production in Turkey.
2) Assessment of FLW in selected agri-food chains Agri-food chains from each group were considered and priority agri-food chains were identified based on their economic importance, employment generation, contribution to foreign exchange and contribution to food security. a) In depth analysis of priority agri-food chains For an in-depth analysis, components in each of the selected five agri-food chains were exposed and then critical loss points in agri-food chains were determined together with representatives of the Government, NGOs, producers, agri-food industry leaders and key persons. b) Brief descriptions of priority agri-food chains Each agri-food chain was examined in detail and in-depth analyses regarding the components of the chain were conducted together with stakeholders and key persons. c) Assessment of FLW in priority agri-food chains (critical loss points) Critical loss points are the stages in agri-food chains where FLW is highest, as well as where it has the highest impact on food security, and the highest effect on the economic result of the FSC. The assessment of the magnitude of FLW should be based on available reports and studies and key informant interviews with the representatives and stakeholders in the agri-food chains in question. FLW at the critical loss points were analysed and any good practices or approaches to reduce FLW was analysed and documented. Food losses, both in terms of quality and quantity, were taken into consideration.
d) Summary assessment of FLW The overall evaluation of food losses and waste was conducted with regard to the major stages of the food supply chain as determined by FAO; namely: agricultural production, postharvest handling and storage, processing and packaging, distribution (retailers and supermarket) and consumption. 3) Analysis of key factors for FLW The major factors considered in FLW evaluation are resources and technologies, human resources, food safety and quality standards for analysed agri-food chains.
9
4) Priority actions and policies for reducing FLW Finally, the study provides an overview of the agri‐food policy environment and government support programs in the sphere of food losses and waste reduction as well as a series of potential initiatives that may facilitate further reductions. a) Enabling environment for agri‐food chain performance The current macroeconomic and policy environment is outlined, including current government initiatives in the sphere of food losses and waste and the impact of macroeconomic policies on the ability of the state to formulate and carry out relevant policies. b) Actions and policy proposals The report recommends potential actions and policies, taking into account cooperation opportunities with the private sector, the need to consider whole value chains rather than single levels where losses occur, good practices and approaches from the country and region. The report also indicates actions to set up a food loss reporting mechanism to help reduce food loss and waste further.
10
3. OVERVIEW OF MAIN COMMODITY GROUPS Agriculture has always been one of the leading sectors in the Turkish economy, largely because the land has rich soil sources and because there is a lot of biological diversity, a good climate and geographical conditions. There is also a tradition of farmers and, more recently, private entrepreneurs interested in investing in Turkish agriculture. Agriculture has an important impact on Turkey’s social and economic development as it meets the majority of the population’s food requirements domestically and also supplies the raw materials for other sectors dependent on agriculture.
In 2009 agricultural production was TRY 79 billion, accounting for 8.3 percent of Turkey’s GDP. The agricultural sector employs 5.5 million people, which accounts for approximately 24 percent of total employment in Turkey. According to the Last General Agricultural Census, there are 3 022 127 farms in Turkey; 99.28 percent of which are small family farms each with less than 50 hectares of land. These farms own 88.65 percent of total agricultural land in Turkey (2010). In 2009, 2 382 731 farmers registered with the farmers’ registration system. A significant portion of the products considered in this study are produced by small family farms. When determining the products to be used in the study, the following criteria were used in terms of how much they contribute to the national economy and partake in the commodity groups determined by FAO.
Production quantity
Production value
Exportation value
When determining the products, each product’s share in the product group was considered by taking the above criteria into account. The products that came out on top in multiple criteria were given priority and rated accordingly.
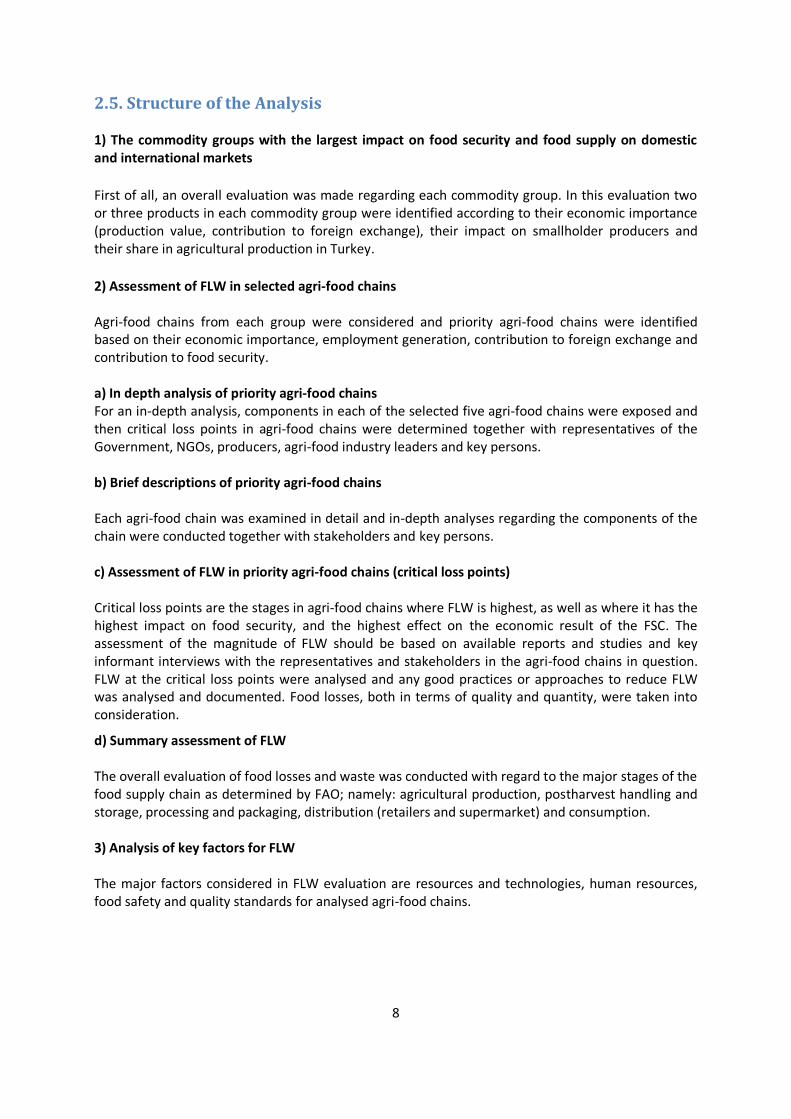
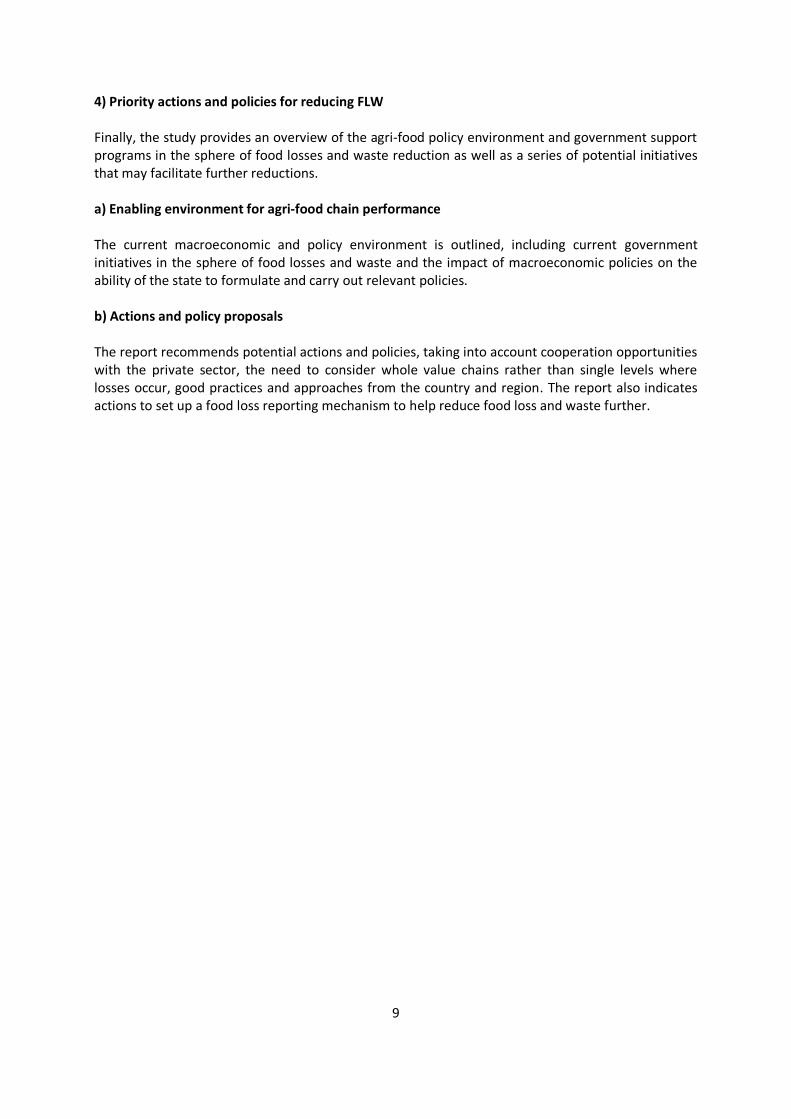
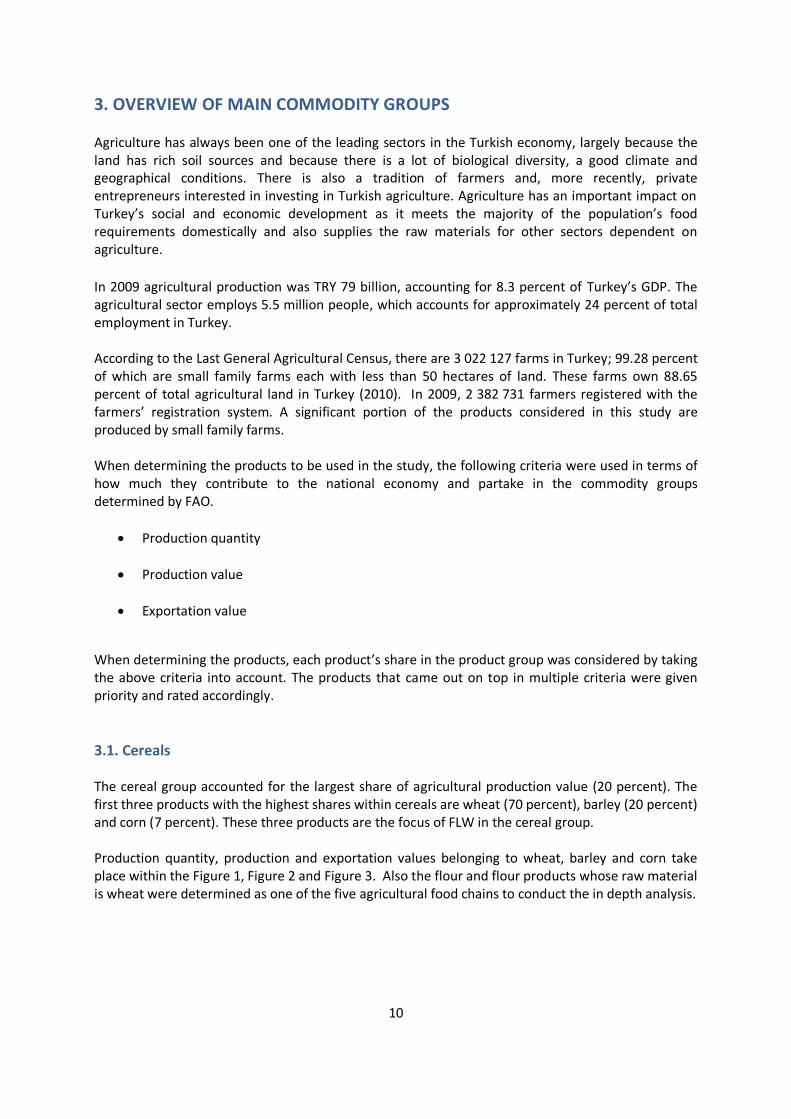
3.1. Cereals The cereal group accounted for the largest share of agricultural production value (20 percent). The first three products with the highest shares within cereals are wheat (70 percent), barley (20 percent) and corn (7 percent). These three products are the focus of FLW in the cereal group. Production quantity, production and exportation values belonging to wheat, barley and corn take place within the Figure 1, Figure 2 and Figure 3. Also the flour and flour products whose raw material is wheat were determined as one of the five agricultural food chains to conduct the in depth analysis.
11
Figure 1: Production quantity of wheat, barley and corn
Figure 2: Production value of wheat, barley and corn
Figure 3: Export value of wheat, barley and corn
12
In Turkey, the area sown with wheat varies and production and yields show regional variations. Central Anatolia is the region with the largest area planted with wheat. As far as total production is concerned, Western and Central Anatolia lead the list. Central Anatolia also tops the list in terms of yields (Anonymous, 2012a). The second most import product in terms of area sown and production is barley. While the area sown with barley has been shrinking over the years, there has been an increase in production. Regions where barley production is common include Central Anatolia, Western Anatolia, and the Aegean and South-eastern Anatolia regions. Thrace, on the other hand, is the region where yields are highest (Anonymous, 2012b, Anonymous 2010). Corn is the cereal with the third highest production. It is mainly grown in South-eastern Anatolia and the Mediterranean and Aegean regions. Although the area under corn is expanding, the most important reason behind rising output is the spread of hybrid seed and increase in yield per unit of land as a result of advanced farming techniques. The yield per hectare is over 1 000 kg. Turkey is a net importer of wheat, mainly due to is the severe drought in 2007 and the absence of high quality wheat. Although the situation is similar for barley, imports have decreased when domestic yields have been high. Due to increases in corn yields, imports have been falling since 2005, although they increased again in 2007 as a result of drought. Small amounts of all three cereals are exported. There has been a variety of research on cereal and cereal products. In studies on consumer behaviour between 1974 and 2006, 37-58 percent of the daily energy need was found to have been received from the cereal and cereal products. Wheat is mostly consumed as bread, pasta and bulgur. (Köksal, 1974, Arslan et al, 2006, Pekcan et al 2006). Wheat has a significant impact in Turkish people’s diet, with annual consumption of about 250 kg per head.
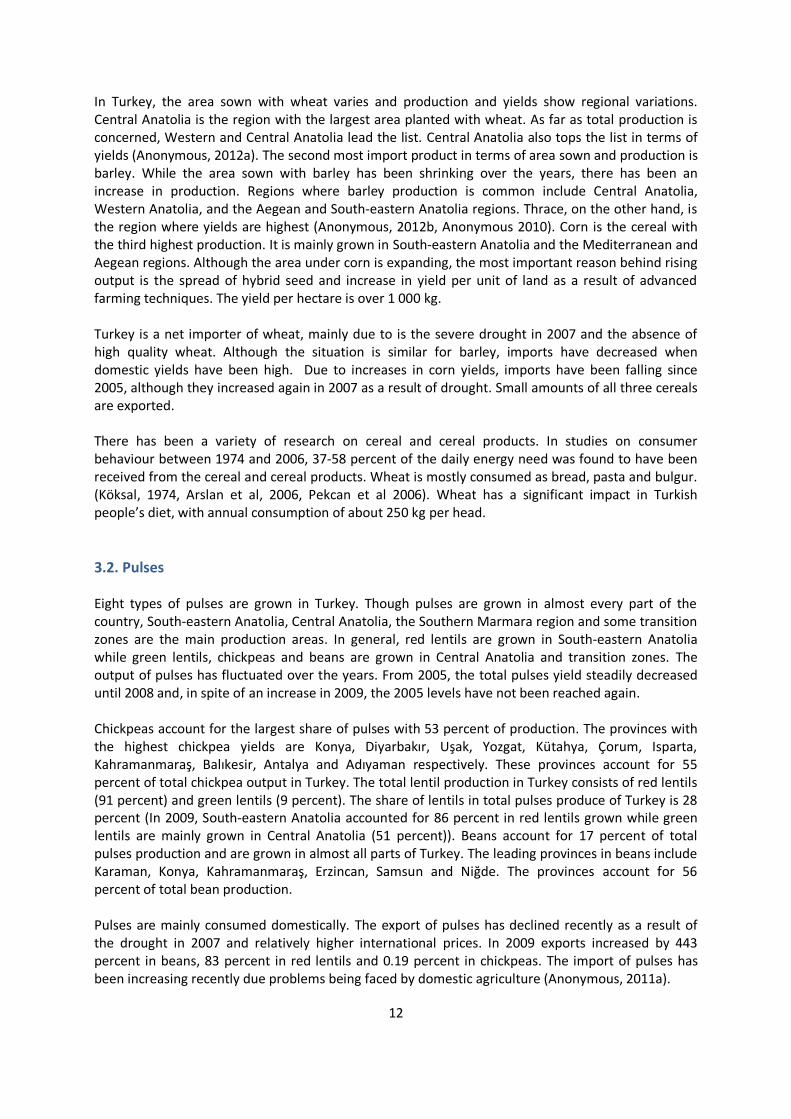
3.2. Pulses Eight types of pulses are grown in Turkey. Though pulses are grown in almost every part of the country, South-eastern Anatolia, Central Anatolia, the Southern Marmara region and some transition zones are the main production areas. In general, red lentils are grown in South-eastern Anatolia while green lentils, chickpeas and beans are grown in Central Anatolia and transition zones. The output of pulses has fluctuated over the years. From 2005, the total pulses yield steadily decreased until 2008 and, in spite of an increase in 2009, the 2005 levels have not been reached again. Chickpeas account for the largest share of pulses with 53 percent of production. The provinces with the highest chickpea yields are Konya, Diyarbakır, Uşak, Yozgat, Kütahya, Çorum, Isparta, Kahramanmaraş, Balıkesir, Antalya and Adıyaman respectively. These provinces account for 55 percent of total chickpea output in Turkey. The total lentil production in Turkey consists of red lentils (91 percent) and green lentils (9 percent). The share of lentils in total pulses produce of Turkey is 28 percent (In 2009, South-eastern Anatolia accounted for 86 percent in red lentils grown while green lentils are mainly grown in Central Anatolia (51 percent)). Beans account for 17 percent of total pulses production and are grown in almost all parts of Turkey. The leading provinces in beans include Karaman, Konya, Kahramanmaraş, Erzincan, Samsun and Niğde. The provinces account for 56 percent of total bean production. Pulses are mainly consumed domestically. The export of pulses has declined recently as a result of the drought in 2007 and relatively higher international prices. In 2009 exports increased by 443 percent in beans, 83 percent in red lentils and 0.19 percent in chickpeas. The import of pulses has been increasing recently due problems being faced by domestic agriculture (Anonymous, 2011a).
13
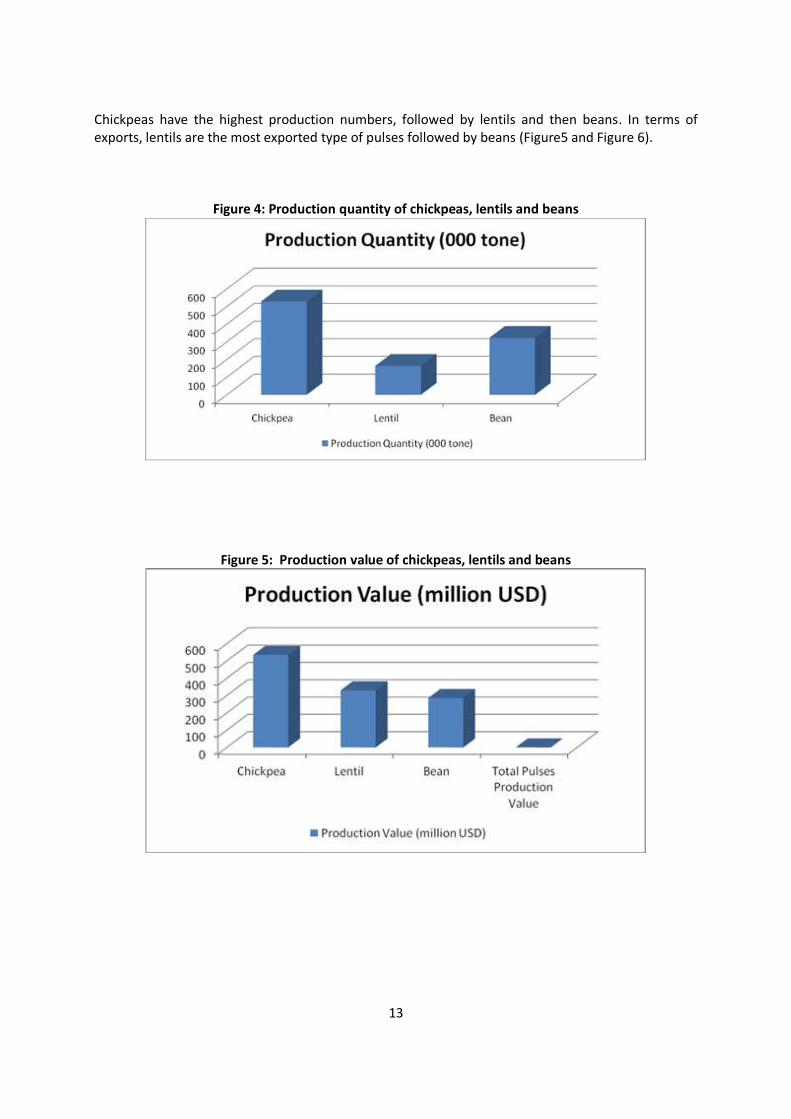
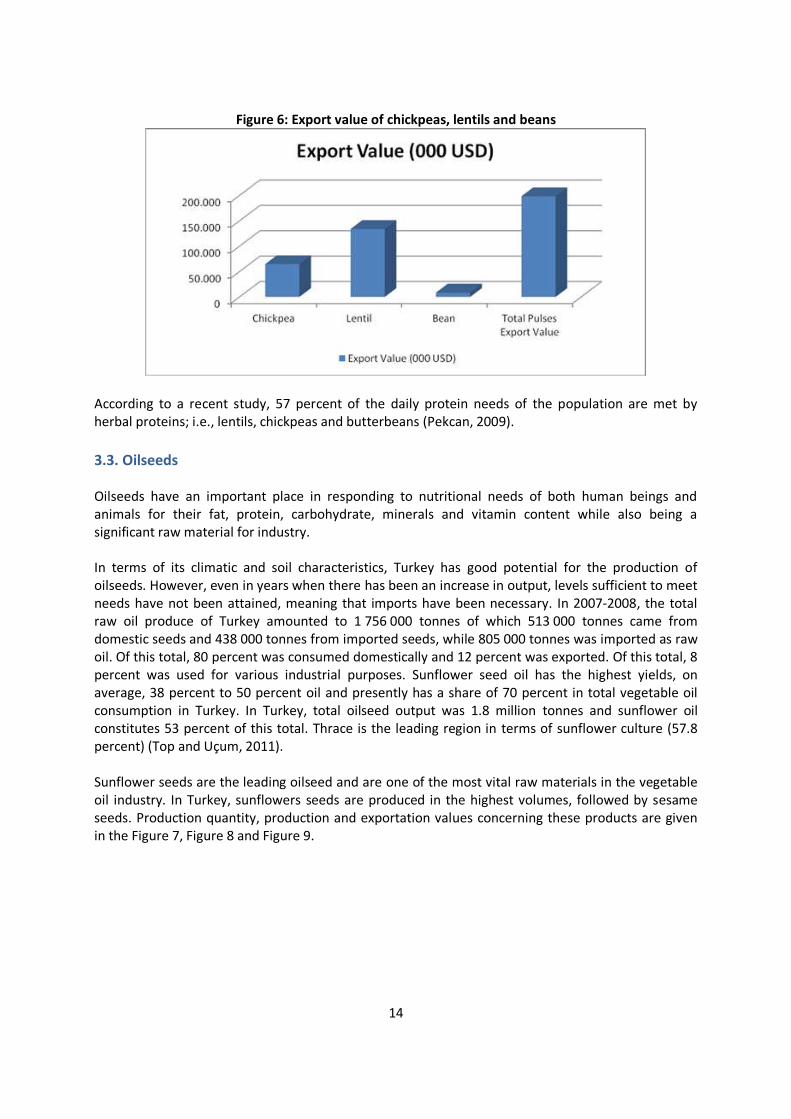
Chickpeas have the highest production numbers, followed by lentils and then beans. In terms of exports, lentils are the most exported type of pulses followed by beans (Figure5 and Figure 6).
Figure 4: Production quantity of chickpeas, lentils and beans
Figure 5: Production value of chickpeas, lentils and beans
14
Figure 6: Export value of chickpeas, lentils and beans
According to a recent study, 57 percent of the daily protein needs of the population are met by herbal proteins; i.e., lentils, chickpeas and butterbeans (Pekcan, 2009).
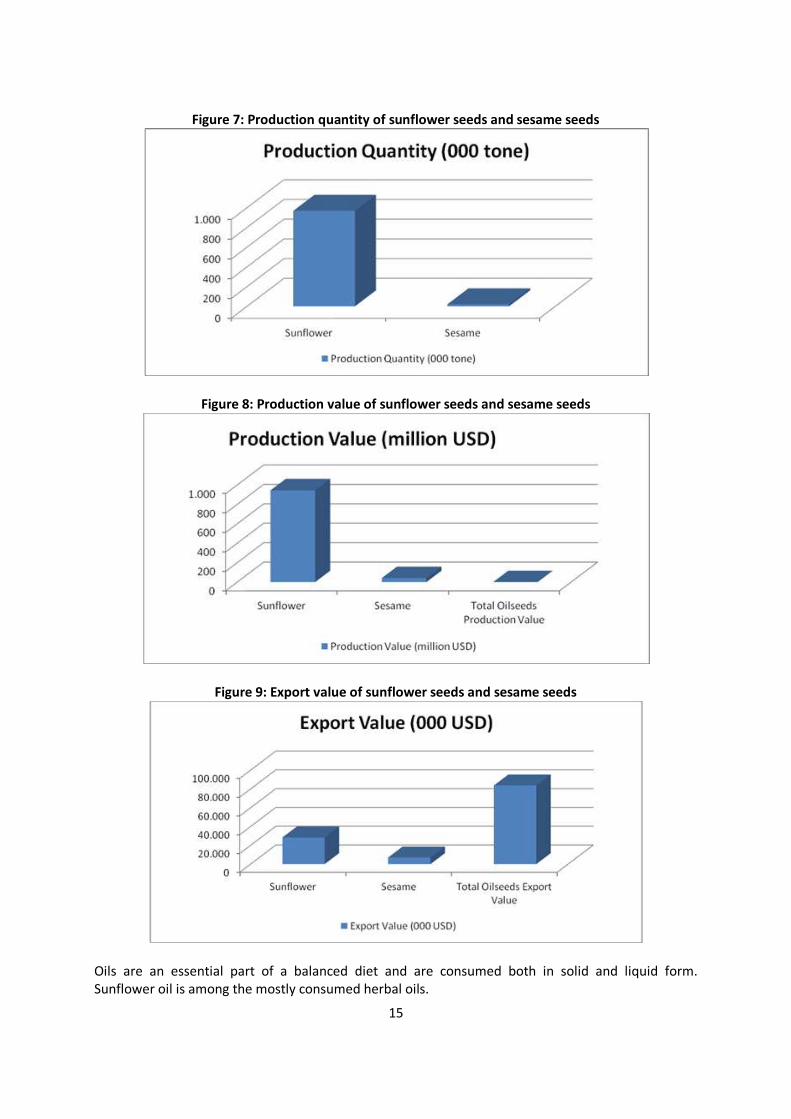
3.3. Oilseeds Oilseeds have an important place in responding to nutritional needs of both human beings and animals for their fat, protein, carbohydrate, minerals and vitamin content while also being a significant raw material for industry. In terms of its climatic and soil characteristics, Turkey has good potential for the production of oilseeds. However, even in years when there has been an increase in output, levels sufficient to meet needs have not been attained, meaning that imports have been necessary. In 2007-2008, the total raw oil produce of Turkey amounted to 1 756 000 tonnes of which 513 000 tonnes came from domestic seeds and 438 000 tonnes from imported seeds, while 805 000 tonnes was imported as raw oil. Of this total, 80 percent was consumed domestically and 12 percent was exported. Of this total, 8 percent was used for various industrial purposes. Sunflower seed oil has the highest yields, on average, 38 percent to 50 percent oil and presently has a share of 70 percent in total vegetable oil consumption in Turkey. In Turkey, total oilseed output was 1.8 million tonnes and sunflower oil constitutes 53 percent of this total. Thrace is the leading region in terms of sunflower culture (57.8 percent) (Top and Uçum, 2011). Sunflower seeds are the leading oilseed and are one of the most vital raw materials in the vegetable oil industry. In Turkey, sunflowers seeds are produced in the highest volumes, followed by sesame seeds. Production quantity, production and exportation values concerning these products are given in the Figure 7, Figure 8 and Figure 9.
15
Figure 7: Production quantity of sunflower seeds and sesame seeds
Figure 8: Production value of sunflower seeds and sesame seeds
Figure 9: Export value of sunflower seeds and sesame seeds
Oils are an essential part of a balanced diet and are consumed both in solid and liquid form. Sunflower oil is among the mostly consumed herbal oils.
16
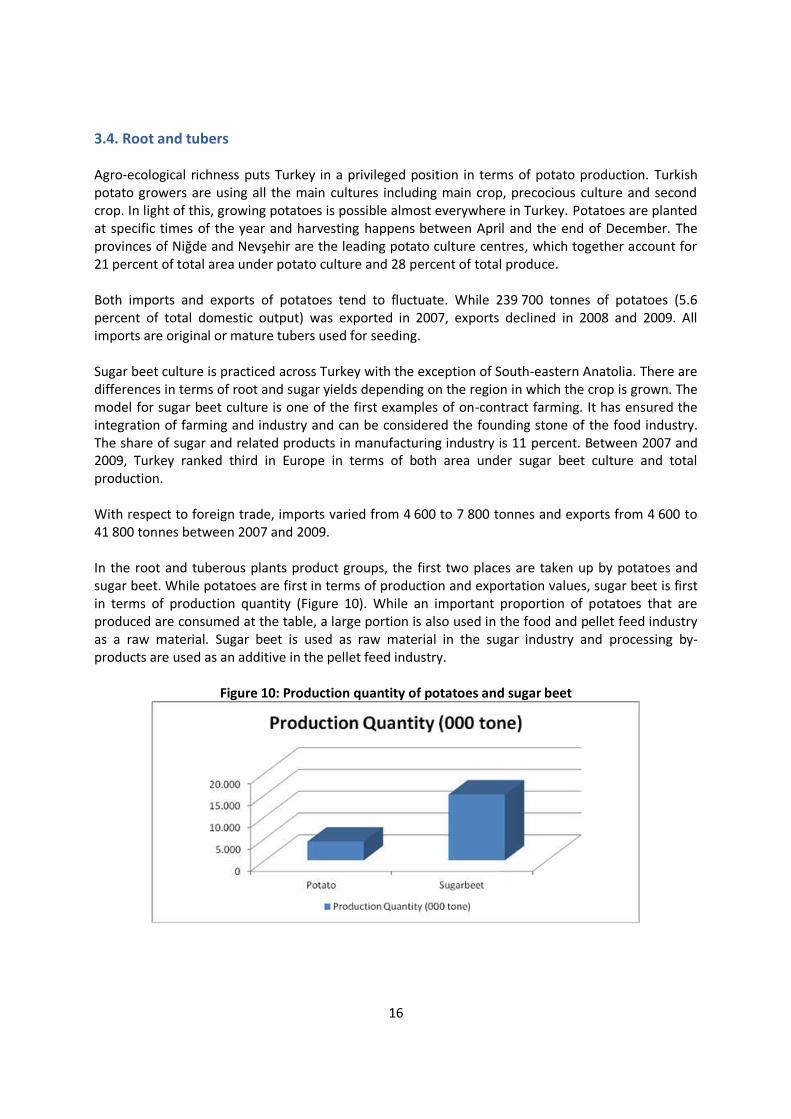
3.4. Root and tubers Agro-ecological richness puts Turkey in a privileged position in terms of potato production. Turkish potato growers are using all the main cultures including main crop, precocious culture and second crop. In light of this, growing potatoes is possible almost everywhere in Turkey. Potatoes are planted at specific times of the year and harvesting happens between April and the end of December. The provinces of Niğde and Nevşehir are the leading potato culture centres, which together account for 21 percent of total area under potato culture and 28 percent of total produce. Both imports and exports of potatoes tend to fluctuate. While 239 700 tonnes of potatoes (5.6 percent of total domestic output) was exported in 2007, exports declined in 2008 and 2009. All imports are original or mature tubers used for seeding. Sugar beet culture is practiced across Turkey with the exception of South-eastern Anatolia. There are differences in terms of root and sugar yields depending on the region in which the crop is grown. The model for sugar beet culture is one of the first examples of on-contract farming. It has ensured the integration of farming and industry and can be considered the founding stone of the food industry. The share of sugar and related products in manufacturing industry is 11 percent. Between 2007 and 2009, Turkey ranked third in Europe in terms of both area under sugar beet culture and total production. With respect to foreign trade, imports varied from 4 600 to 7 800 tonnes and exports from 4 600 to 41 800 tonnes between 2007 and 2009. In the root and tuberous plants product groups, the first two places are taken up by potatoes and sugar beet. While potatoes are first in terms of production and exportation values, sugar beet is first in terms of production quantity (Figure 10). While an important proportion of potatoes that are produced are consumed at the table, a large portion is also used in the food and pellet feed industry as a raw material. Sugar beet is used as raw material in the sugar industry and processing by-products are used as an additive in the pellet feed industry.
Figure 10: Production quantity of potatoes and sugar beet
17
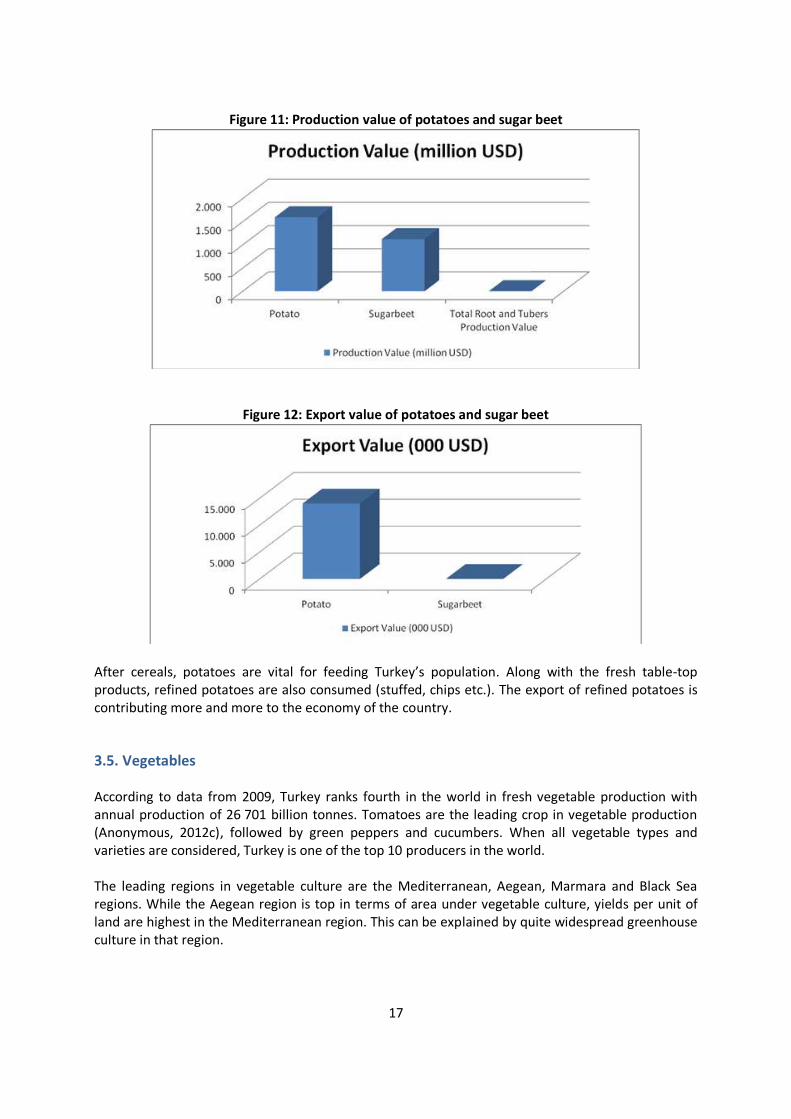
Figure 11: Production value of potatoes and sugar beet
Figure 12: Export value of potatoes and sugar beet
After cereals, potatoes are vital for feeding Turkey’s population. Along with the fresh table-top products, refined potatoes are also consumed (stuffed, chips etc.). The export of refined potatoes is contributing more and more to the economy of the country.
3.5. Vegetables According to data from 2009, Turkey ranks fourth in the world in fresh vegetable production with annual production of 26 701 billion tonnes. Tomatoes are the leading crop in vegetable production (Anonymous, 2012c), followed by green peppers and cucumbers. When all vegetable types and varieties are considered, Turkey is one of the top 10 producers in the world. The leading regions in vegetable culture are the Mediterranean, Aegean, Marmara and Black Sea regions. While the Aegean region is top in terms of area under vegetable culture, yields per unit of land are highest in the Mediterranean region. This can be explained by quite widespread greenhouse culture in that region.
18
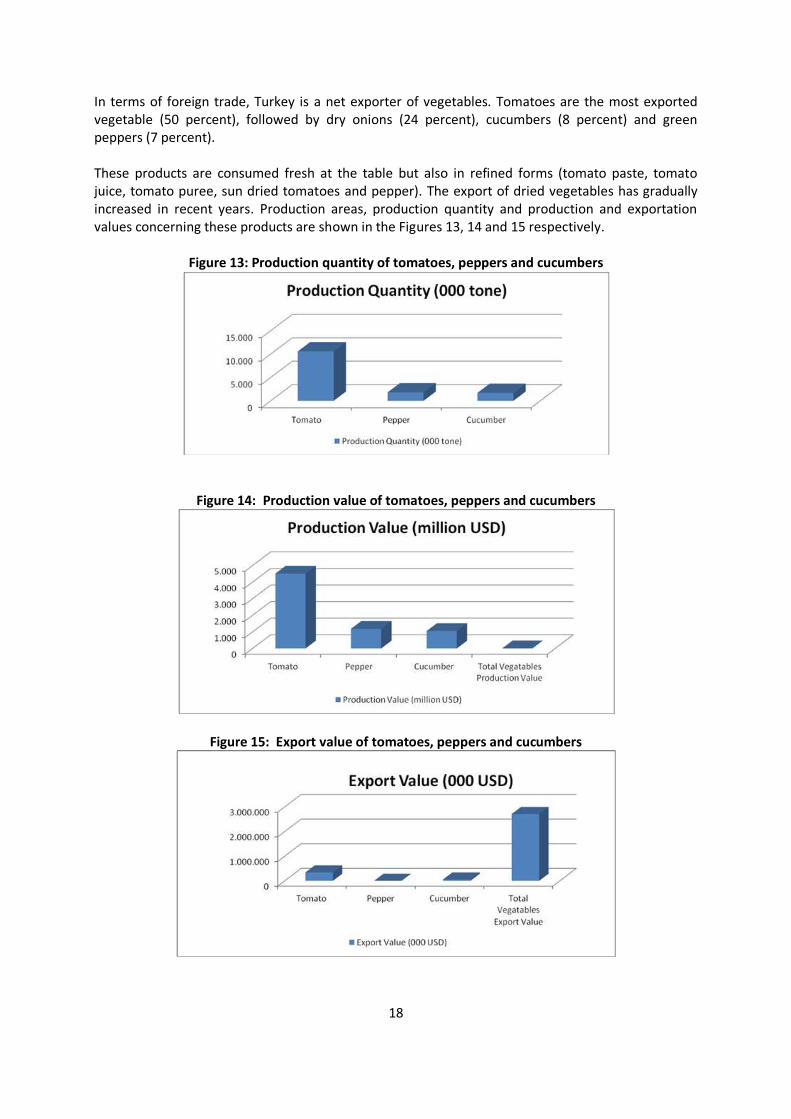
In terms of foreign trade, Turkey is a net exporter of vegetables. Tomatoes are the most exported vegetable (50 percent), followed by dry onions (24 percent), cucumbers (8 percent) and green peppers (7 percent). These products are consumed fresh at the table but also in refined forms (tomato paste, tomato juice, tomato puree, sun dried tomatoes and pepper). The export of dried vegetables has gradually increased in recent years. Production areas, production quantity and production and exportation values concerning these products are shown in the Figures 13, 14 and 15 respectively.
Figure 13: Production quantity of tomatoes, peppers and cucumbers
Figure 14: Production value of tomatoes, peppers and cucumbers
Figure 15: Export value of tomatoes, peppers and cucumbers
19
Vegetables are nutritionally indispensable. In various studies conducted to determine the eating behaviour of individuals, it was determined that vegetables are the second mostly consumed product group after cereal and cereal products. Refined tomato products were chosen as one of the five agricultural food chains on which an in depth analysis would be conducted.
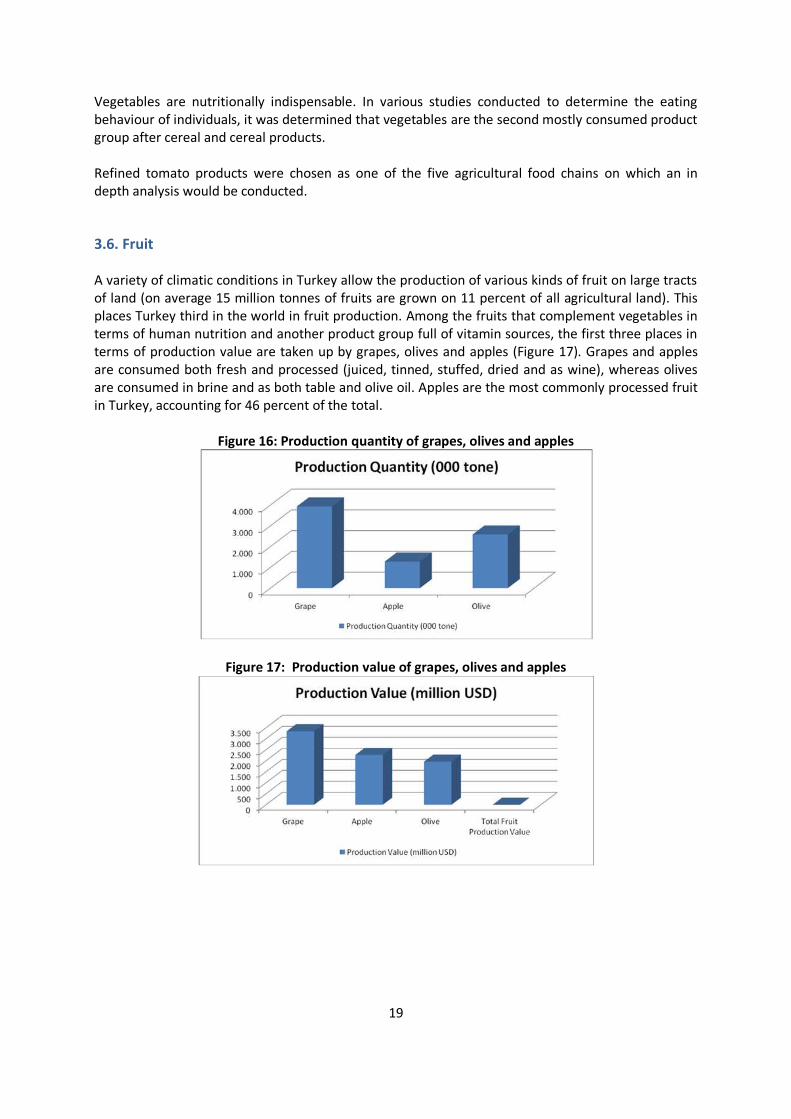
3.6. Fruit A variety of climatic conditions in Turkey allow the production of various kinds of fruit on large tracts of land (on average 15 million tonnes of fruits are grown on 11 percent of all agricultural land). This places Turkey third in the world in fruit production. Among the fruits that complement vegetables in terms of human nutrition and another product group full of vitamin sources, the first three places in terms of production value are taken up by grapes, olives and apples (Figure 17). Grapes and apples are consumed both fresh and processed (juiced, tinned, stuffed, dried and as wine), whereas olives are consumed in brine and as both table and olive oil. Apples are the most commonly processed fruit in Turkey, accounting for 46 percent of the total.
Figure 16: Production quantity of grapes, olives and apples
Figure 17: Production value of grapes, olives and apples
20
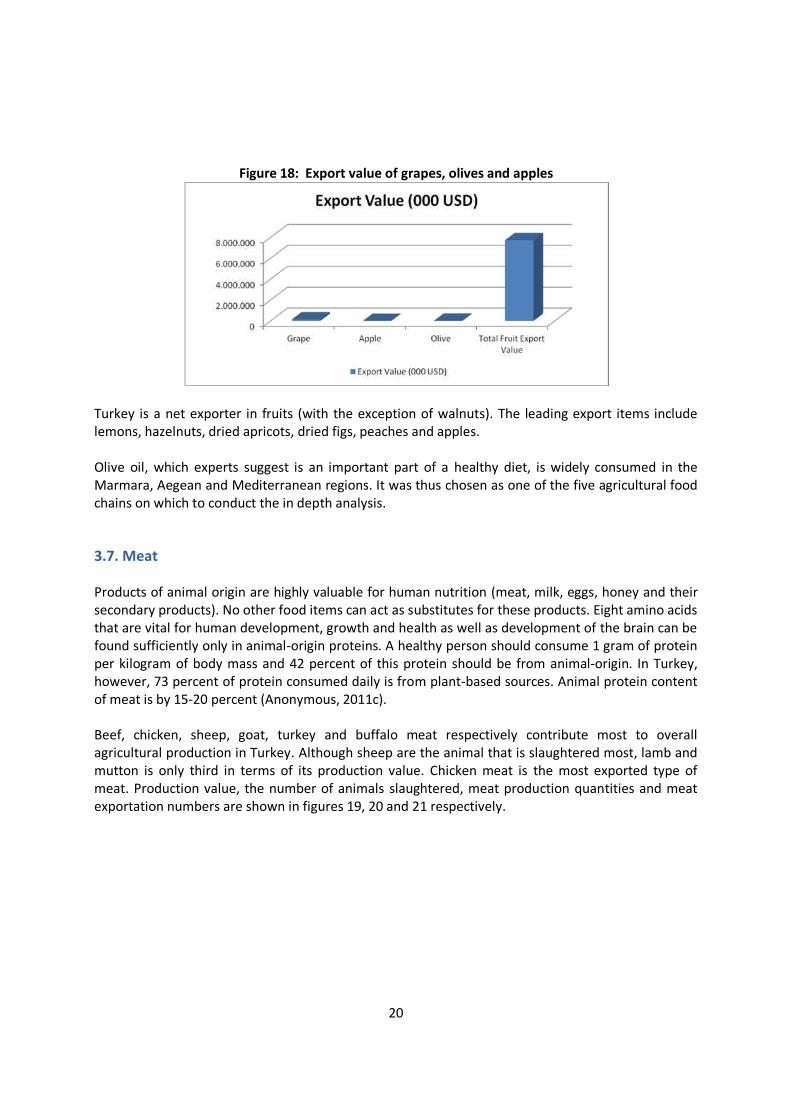
Figure 18: Export value of grapes, olives and apples
Turkey is a net exporter in fruits (with the exception of walnuts). The leading export items include lemons, hazelnuts, dried apricots, dried figs, peaches and apples. Olive oil, which experts suggest is an important part of a healthy diet, is widely consumed in the Marmara, Aegean and Mediterranean regions. It was thus chosen as one of the five agricultural food chains on which to conduct the in depth analysis.
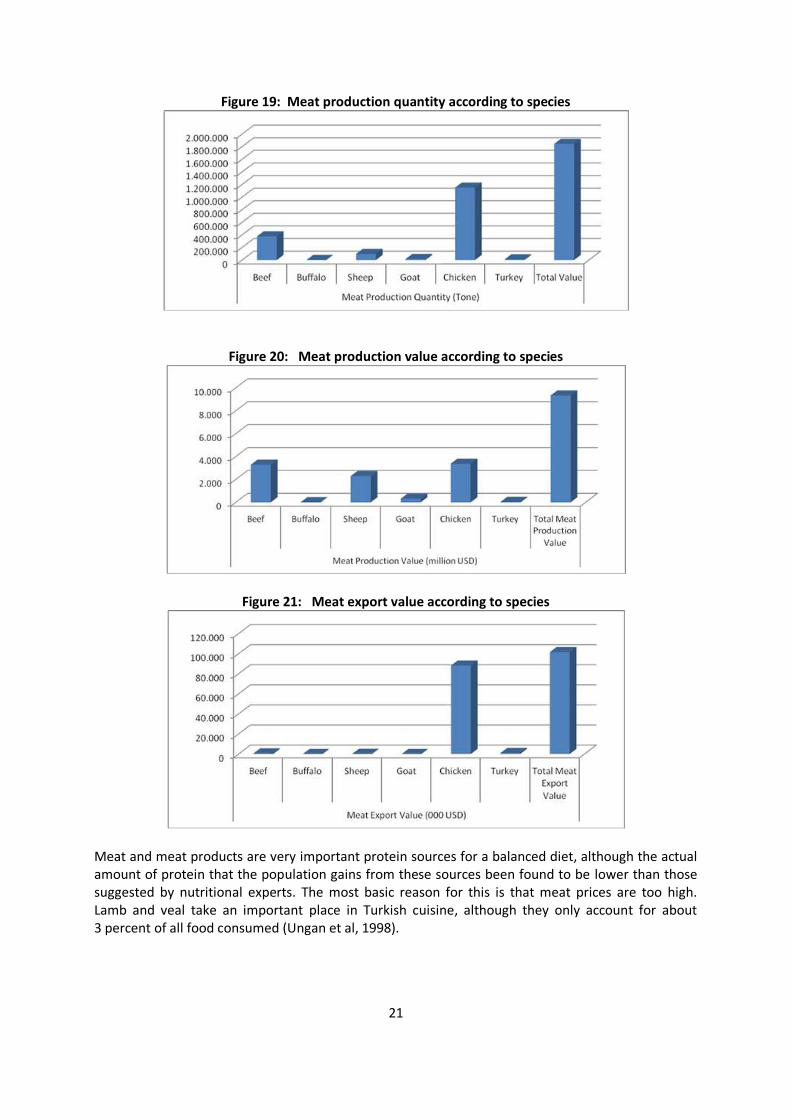
3.7. Meat Products of animal origin are highly valuable for human nutrition (meat, milk, eggs, honey and their secondary products). No other food items can act as substitutes for these products. Eight amino acids that are vital for human development, growth and health as well as development of the brain can be found sufficiently only in animal-origin proteins. A healthy person should consume 1 gram of protein per kilogram of body mass and 42 percent of this protein should be from animal-origin. In Turkey, however, 73 percent of protein consumed daily is from plant-based sources. Animal protein content of meat is by 15-20 percent (Anonymous, 2011c). Beef, chicken, sheep, goat, turkey and buffalo meat respectively contribute most to overall agricultural production in Turkey. Although sheep are the animal that is slaughtered most, lamb and mutton is only third in terms of its production value. Chicken meat is the most exported type of meat. Production value, the number of animals slaughtered, meat production quantities and meat exportation numbers are shown in figures 19, 20 and 21 respectively.
21
Figure 19: Meat production quantity according to species
Figure 20: Meat production value according to species
Figure 21: Meat export value according to species
Meat and meat products are very important protein sources for a balanced diet, although the actual amount of protein that the population gains from these sources been found to be lower than those suggested by nutritional experts. The most basic reason for this is that meat prices are too high. Lamb and veal take an important place in Turkish cuisine, although they only account for about 3 percent of all food consumed (Ungan et al, 1998).
22
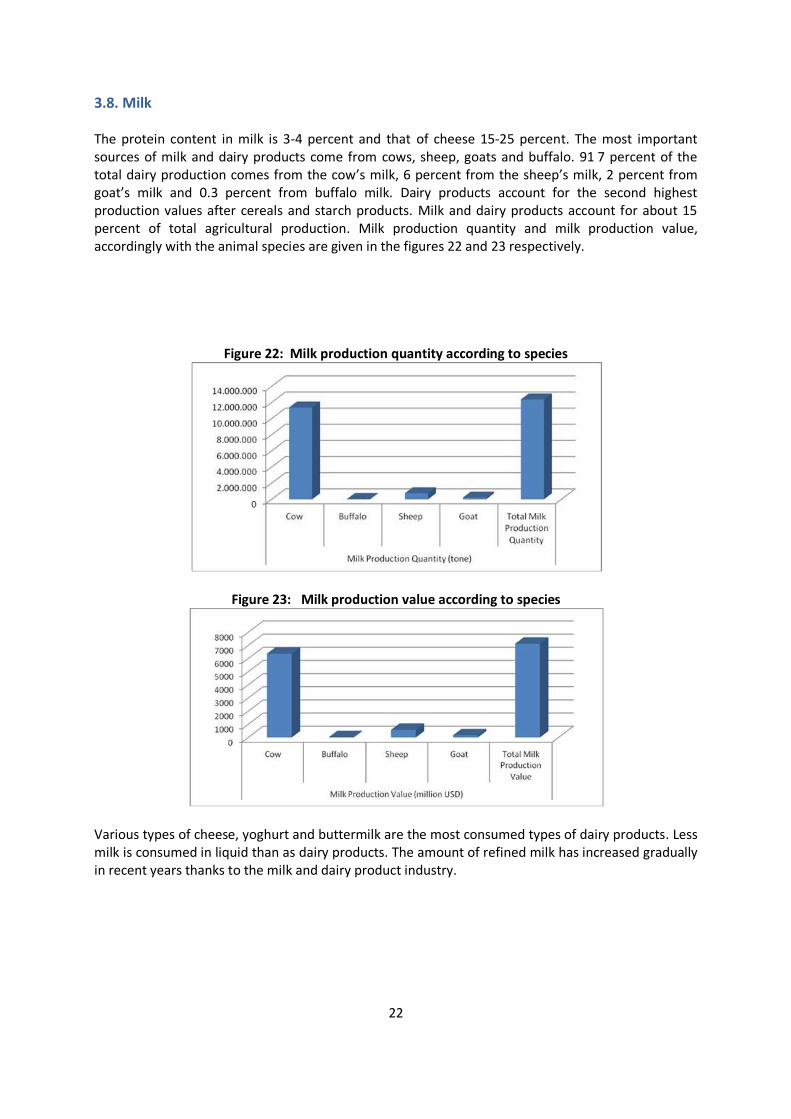
3.8. Milk The protein content in milk is 3-4 percent and that of cheese 15-25 percent. The most important sources of milk and dairy products come from cows, sheep, goats and buffalo. 91 7 percent of the total dairy production comes from the cow’s milk, 6 percent from the sheep’s milk, 2 percent from goat’s milk and 0.3 percent from buffalo milk. Dairy products account for the second highest production values after cereals and starch products. Milk and dairy products account for about 15 percent of total agricultural production. Milk production quantity and milk production value, accordingly with the animal species are given in the figures 22 and 23 respectively.
Figure 22: Milk production quantity according to species
Figure 23: Milk production value according to species
Various types of cheese, yoghurt and buttermilk are the most consumed types of dairy products. Less milk is consumed in liquid than as dairy products. The amount of refined milk has increased gradually in recent years thanks to the milk and dairy product industry.
23
3.9. Eggs Eggs contain thirteen essential vitamin and minerals and have a protein content of 12 percent. Eggs are produced in Central Anatolia, Marmara, Aegean, Mediterranean, Western Black Sea and Eastern Anatolia regions. Data on eggs is shown in Tables 2 and 3.
Table 2: Number of laying hens between 2007 and 2009
Years Laying hens (number)
2007 64 286 383
2008 63 364 818
2009 66 500 461
Source : TURKSTAT
Table 3: Number of eggs between 2007 and 2009
Years Hen eggs (Thousand)
2007 12 724 959
2008 13 190 696
2009 13 832 726
Source : TURKSTAT
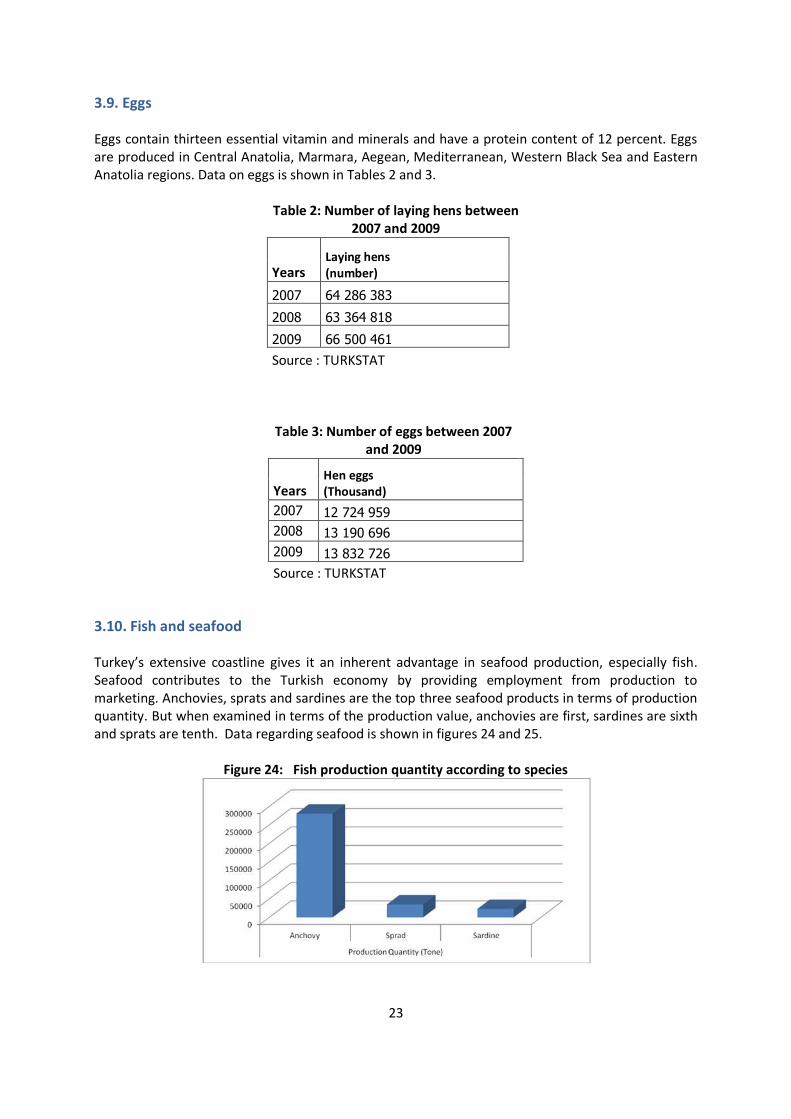
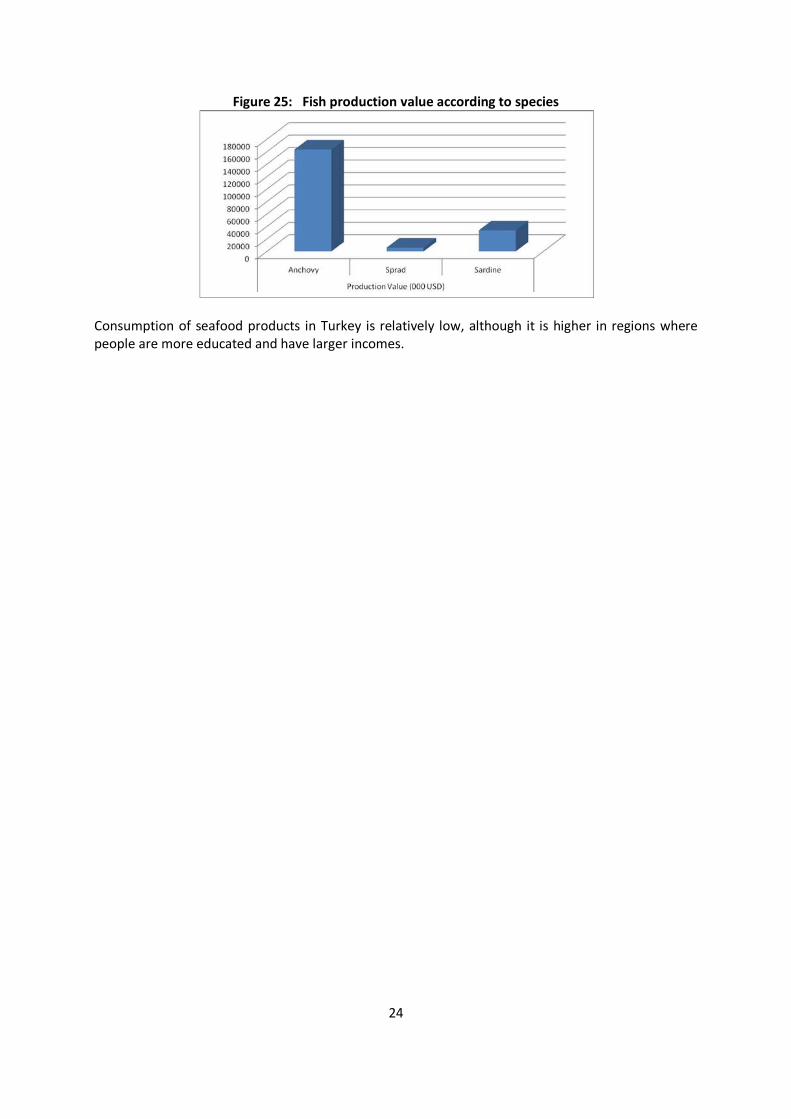
3.10. Fish and seafood Turkey’s extensive coastline gives it an inherent advantage in seafood production, especially fish. Seafood contributes to the Turkish economy by providing employment from production to marketing. Anchovies, sprats and sardines are the top three seafood products in terms of production quantity. But when examined in terms of the production value, anchovies are first, sardines are sixth and sprats are tenth. Data regarding seafood is shown in figures 24 and 25.
Figure 24: Fish production quantity according to species
24
Figure 25: Fish production value according to species
Consumption of seafood products in Turkey is relatively low, although it is higher in regions where people are more educated and have larger incomes.
25
4. ASSESMENT OF FLW IN SELECTED AGRI-FOOD CHAINS
4.1 Identification of priority agri-food chains In this section we prioritize the five agri-food chains to be analysed in depth in this study in terms of economic importance, employment generation, contribution to foreign exchange and contribution to food security (national and global). The prioritization of critical loss point analysis was validated by focus group meetings for wheat, milk, meat, fish and seafood. The focus group meetings were held in the FAO sub-regional Office for Central Asia (SEC) with the participation of government representatives, inter-professional organizations and agri-food industry leaders. The semi structural survey forms were prepared for each commodity agri-food chain, based on the discussions. For the other studied commodities including tomatoes, olive oil, potatoes, sugar beet and sunflower seeds, loss and waste ratios were determined based on key informant interviews. Before interviews semi-structural survey forms for each commodity were sent by e-mail and then interviews in person or over the phone. Therefore, FLW was determined for each selected commodity. Cereals priority agri-food chain: Wheat Wheat has been grown in Anatolia for thousands of years and is now grown in almost every region of Turkey. In 2009 21 million tonnes of wheat was produced by 2.7 million farms, which is over 90 percent of all farms in Turkey. The average yield was 252 kg per hectare. Wheat is generally produced on dry land as winter wheat. Therefore, farming begins in October and the crop is harvested in June. Likewise, it has significant impact in Turkish people’s diet, with an annual consumption of about 250 kg per head. Wheat flour production is an important economic activity for Turkey in terms of income generation, export and employment. Annually approximately 2 million tonnes wheat flour is exported. By comparison, the other two major cereals produced in Turkey, barley and maize, are used primarilyin animal feed and are thus largely irrelevant for the purposes of this study.
Milk priority agri-food chain: Milk and milk products
In Turkey 12 million tonnes milk was produced from 4 million cows, 10 million sheep and 2 million goats in 2009. There are over 2 million agricultural holdings that produce milk, mainly cow’s milk concentrated in western parts. Eastern and Southeast Regions perform livestock production for local consumption or for breeding. There are more than 3 000 enterprises in the milk processing industry (FAO, 2007). Average milk production in the lactation period is 1.2 tonnes per head for cows and 170 kg per head for sheep and goats. Of total milk production, 20 percent was consumed in farm households, 20 percent was sold as street milk, 27 percent was processed in modern milk processors and 33 percent was processed at small milk processors (mandıra) (ASÜD 2013). Of the total milk produced, 1.5 million tonnes was used in liquid form, 7 million tonnes was processed cheese, 2.3 million tonnes as yogurt, 1.3 million tonnes as butter, 87 000 tonnes milk as powder and 49 000 in ice-cream making.

26
Meat priority agri-food chain: Red meat In Turkey, 1.5 million cattle, 4 million sheep and 600 000 goats were slaughtered in 2009. Total red meat production was 422 000 tonnes. Livestock farms generally breed both dairy and beef cattle. Male calves from dairy cattle breeding are used in beef production. Most meat processing plants process both cattle and small ruminants. There are 665 such plants divided into public and private organizations. Private enterprises usually include a slaughterhouse, a cold storage unit and a cutting/processing plant. Meat plants are divided into three categories (Anonymous, 2005); namely: Class 1: >40 cattle per day and cold storage facility (33 percent of the total, mostly private) Class 2: from 21 to 40 cattle per day; (4 percent of the total number mostly public) Class 3: <20 Bovine per day; (63 percent of the total number, mostly public) Vegetables priority agri-food chain: Tomatoes
Turkey is one of the biggest vegetable producers and 3 percent of world’s vegetables are produced in Turkey. Tomato production accounts for half of all vegetable production in Turkey. Tomatoes produced in Turkey are mainly consumed domestically and only 2 percent are exported. Tomatoes are produced in both open fields and in greenhouses. Greenhouse tomato production accounts for half of total production and is concentrated in the Mediterranean region. Tomatoes are the most processed vegetable in Turkey and are fresh, preserved and processed in all sub-branches of the food sector such as the vegetable and fruit canned food industry, the fruit juice industry, the frozen vegetable and fruit industry and the dried fruit and vegetable industry (Keskin ve Gül, 2004). Fruits priority agri-food chain: Olive oil Olive oil production was about 160 000 tonnes in 2009. Turkey is the fourth largest olive and olive oil producer in the world. Its average share of world olive production is between 7 and 10 percent. Recently, the Turkish olive sector has increased its importance in the Turkish economy overall. There were 111 million fruit-bearing olive trees and 45.8 million non-fruit-bearing olive trees covering 826 000 hectares in 2009 (TURKSTAT, 2011). 76 percent of the trees are in Aegean Region, 14 percent of the trees are in Mediterranean Region and 9.5 percent of the trees are in Marmara Region. Olive and olive oil production rates are in line with the number of trees, which is increasing every year. Marmara Region: The olives in this region are most appropriate corning. This region produces 9.5 percent of all Turkey’s olives. Aegean region: The border between Çanakkale and Mugla has the best growing conditions for olive trees. This region is the biggest olive producing area in Turkey and 76 percent of olive trees in Turkey are located in this region. Most of these trees produce olives for olive oil production. However, studies on increasing the production of table olives have been undertaken in recent years. Mediterranean region: This region in Turkey has lagged behind other regions in the country. There are indigenous olive varieties as well as common olive varieties of Marmara and Aegean regions. Table olives account for 15 percent of production in this region while the region as a whole accounts for 14 percent of Turkey’s overall output.
27
According to recent data, there are more than 250 registered olive oil processing enterprises. Although there are many processors in the industry, a few firms dominate the packaged olive oil market. The majority of processors are small and operate on local or regional markets. Only 15 of them had 20 or more employees in 2009, for example, producing approximately 24 000 tonnes of olive oil that year (TURKSTAT, 2011).
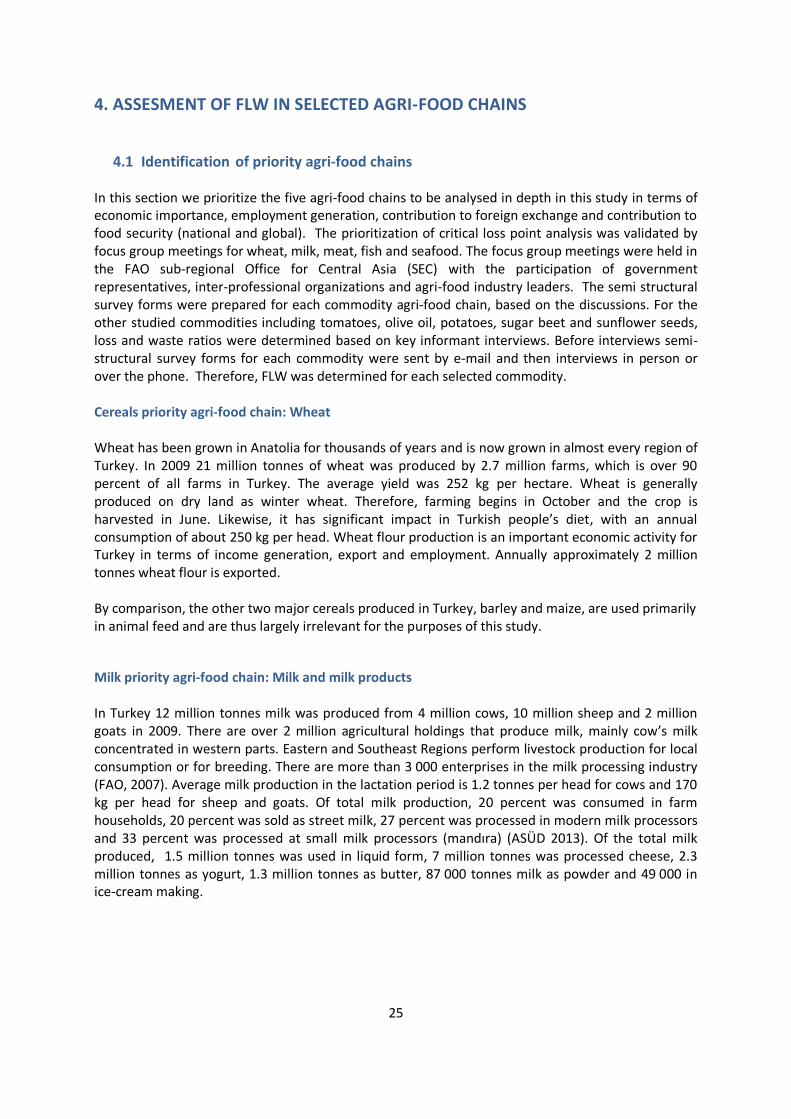
4.2 Description of priority agri-food chains The majority of agricultural production in Turkey comes from small family farms. There are also medium and large commercial farms, but they account for only a small percentage of all farms. Only 57 percent of farms in Turkey are larger that 5 hectares. Wheat Wheat is produced on small scale family farms, which tend to be very fragmented. These farms tend to allocate a portion of their wheat production for home consumption. Wheat enters the market via one of three channels; i.e. through a trader or processing industry, the Turkish Grain Board (TGB) or the Cereals Stock Exchange. Wheat processed as flour, pasta, cracked wheat, bread etc. reaches to consumers via wholesalers and retailers.
Figure 26: Wheat food supply chain (FSC) and critical loss points (CLP) in Turkey
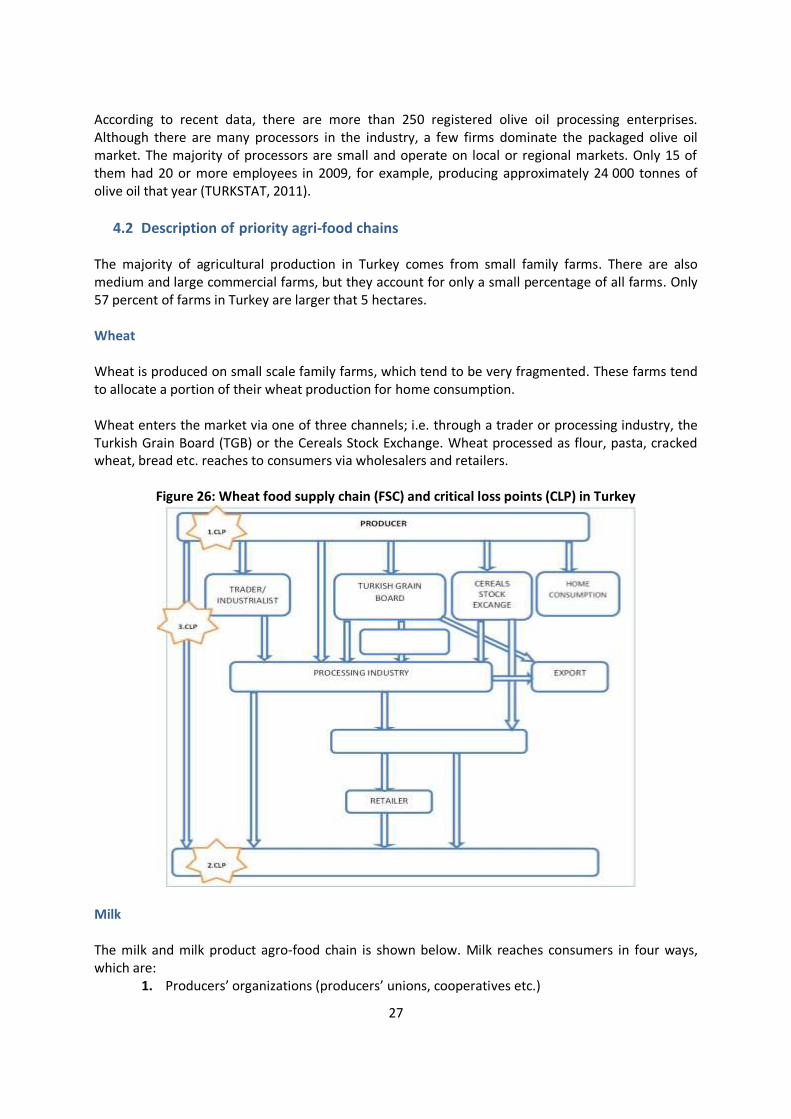
Milk The milk and milk product agro-food chain is shown below. Milk reaches consumers in four ways, which are:
1. Producers’ organizations (producers’ unions, cooperatives etc.)
28
2. The processing industry 3. Local markets 4. Direct sales, street milk etc.
In the collecting system, milk is carried to small collecting units (called village centres) by producers, and is then transported to the big collection centres or processing units by mediators such as collectors, buying firms or unions.
Figure 27: Milk food supply chain (FSC) and critical loss points (CLP) in Turkey
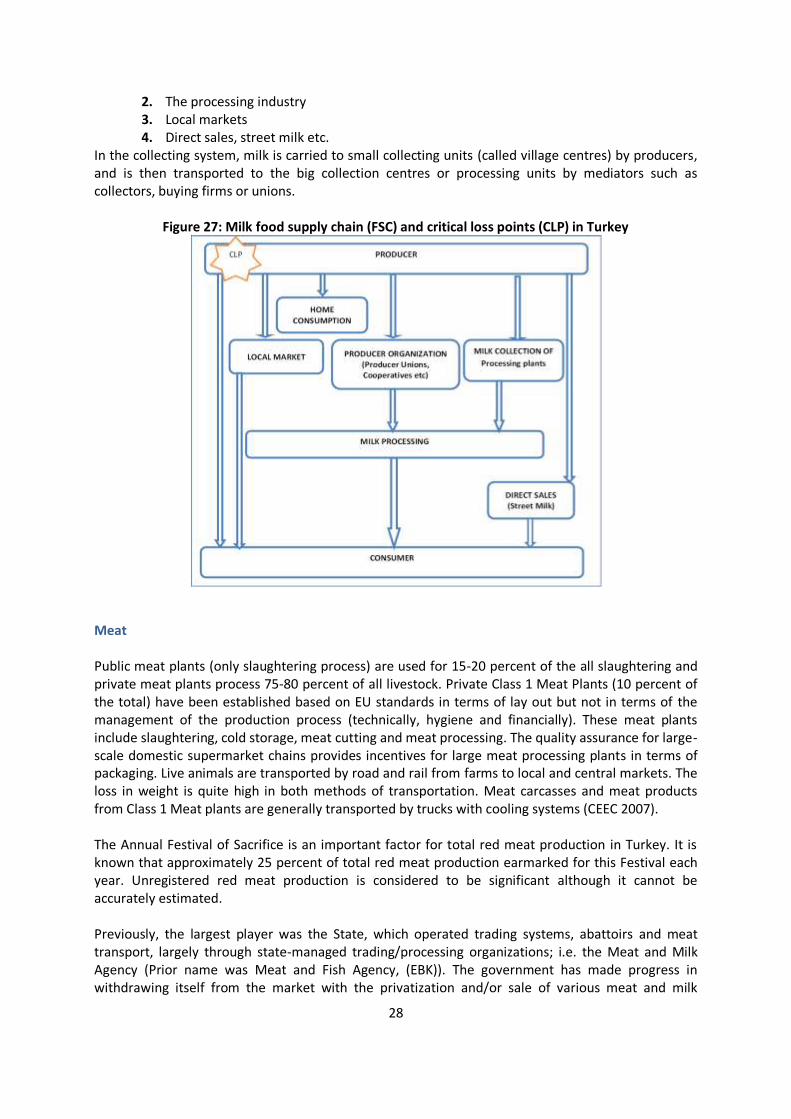
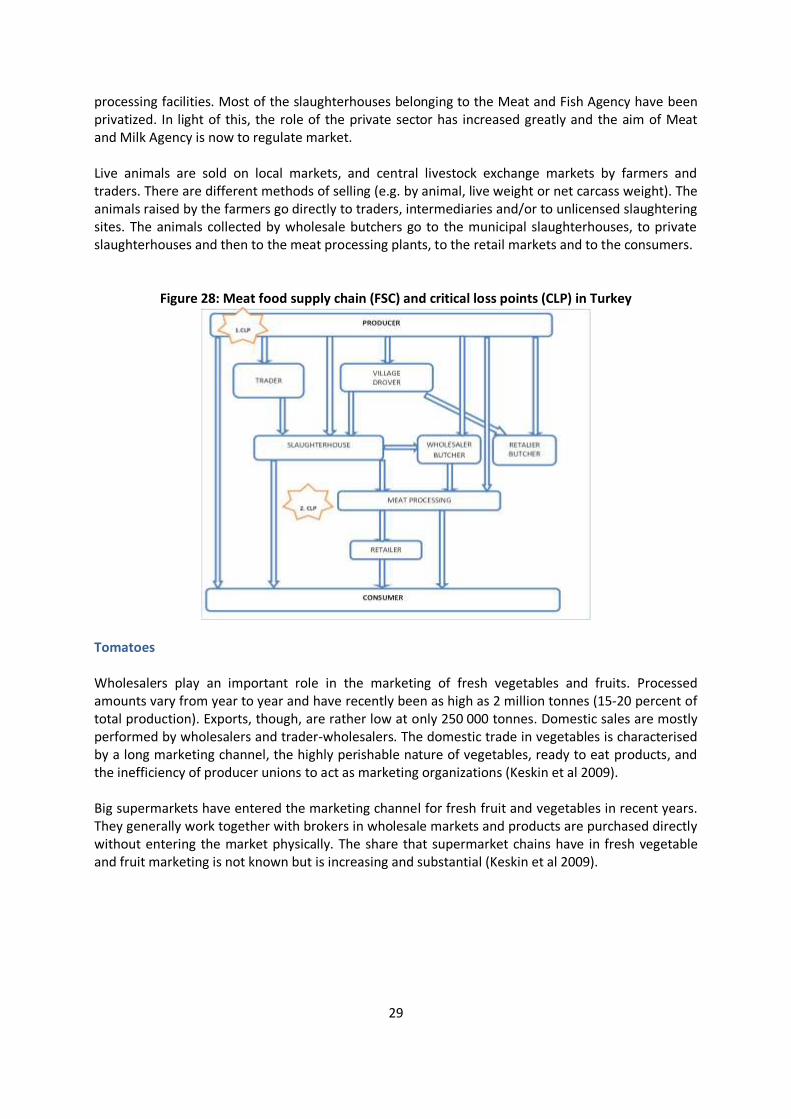
Meat Public meat plants (only slaughtering process) are used for 15-20 percent of the all slaughtering and private meat plants process 75-80 percent of all livestock. Private Class 1 Meat Plants (10 percent of the total) have been established based on EU standards in terms of lay out but not in terms of the management of the production process (technically, hygiene and financially). These meat plants include slaughtering, cold storage, meat cutting and meat processing. The quality assurance for large-scale domestic supermarket chains provides incentives for large meat processing plants in terms of packaging. Live animals are transported by road and rail from farms to local and central markets. The loss in weight is quite high in both methods of transportation. Meat carcasses and meat products from Class 1 Meat plants are generally transported by trucks with cooling systems (CEEC 2007). The Annual Festival of Sacrifice is an important factor for total red meat production in Turkey. It is known that approximately 25 percent of total red meat production earmarked for this Festival each year. Unregistered red meat production is considered to be significant although it cannot be accurately estimated. Previously, the largest player was the State, which operated trading systems, abattoirs and meat transport, largely through state-managed trading/processing organizations; i.e. the Meat and Milk Agency (Prior name was Meat and Fish Agency, (EBK)). The government has made progress in withdrawing itself from the market with the privatization and/or sale of various meat and milk
29
processing facilities. Most of the slaughterhouses belonging to the Meat and Fish Agency have been privatized. In light of this, the role of the private sector has increased greatly and the aim of Meat and Milk Agency is now to regulate market. Live animals are sold on local markets, and central livestock exchange markets by farmers and traders. There are different methods of selling (e.g. by animal, live weight or net carcass weight). The animals raised by the farmers go directly to traders, intermediaries and/or to unlicensed slaughtering sites. The animals collected by wholesale butchers go to the municipal slaughterhouses, to private slaughterhouses and then to the meat processing plants, to the retail markets and to the consumers.
Figure 28: Meat food supply chain (FSC) and critical loss points (CLP) in Turkey
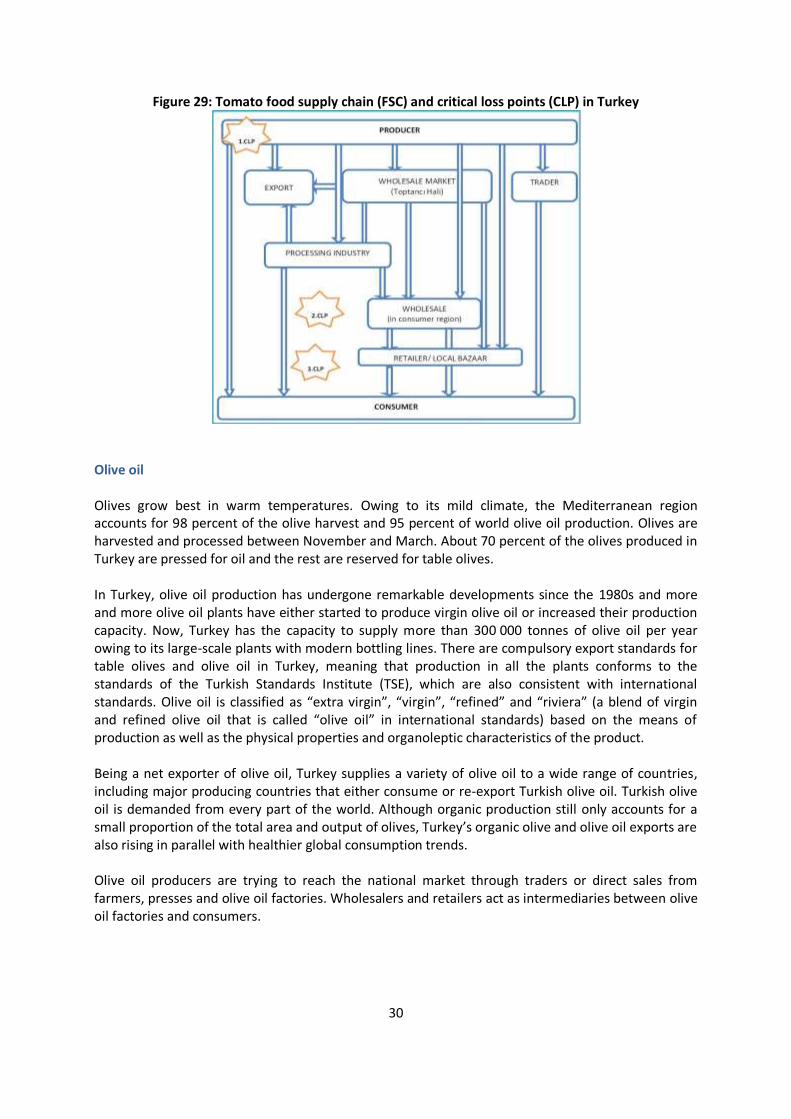
Tomatoes Wholesalers play an important role in the marketing of fresh vegetables and fruits. Processed amounts vary from year to year and have recently been as high as 2 million tonnes (15-20 percent of total production). Exports, though, are rather low at only 250 000 tonnes. Domestic sales are mostly performed by wholesalers and trader-wholesalers. The domestic trade in vegetables is characterised by a long marketing channel, the highly perishable nature of vegetables, ready to eat products, and the inefficiency of producer unions to act as marketing organizations (Keskin et al 2009). Big supermarkets have entered the marketing channel for fresh fruit and vegetables in recent years. They generally work together with brokers in wholesale markets and products are purchased directly without entering the market physically. The share that supermarket chains have in fresh vegetable and fruit marketing is not known but is increasing and substantial (Keskin et al 2009).
30
Figure 29: Tomato food supply chain (FSC) and critical loss points (CLP) in Turkey
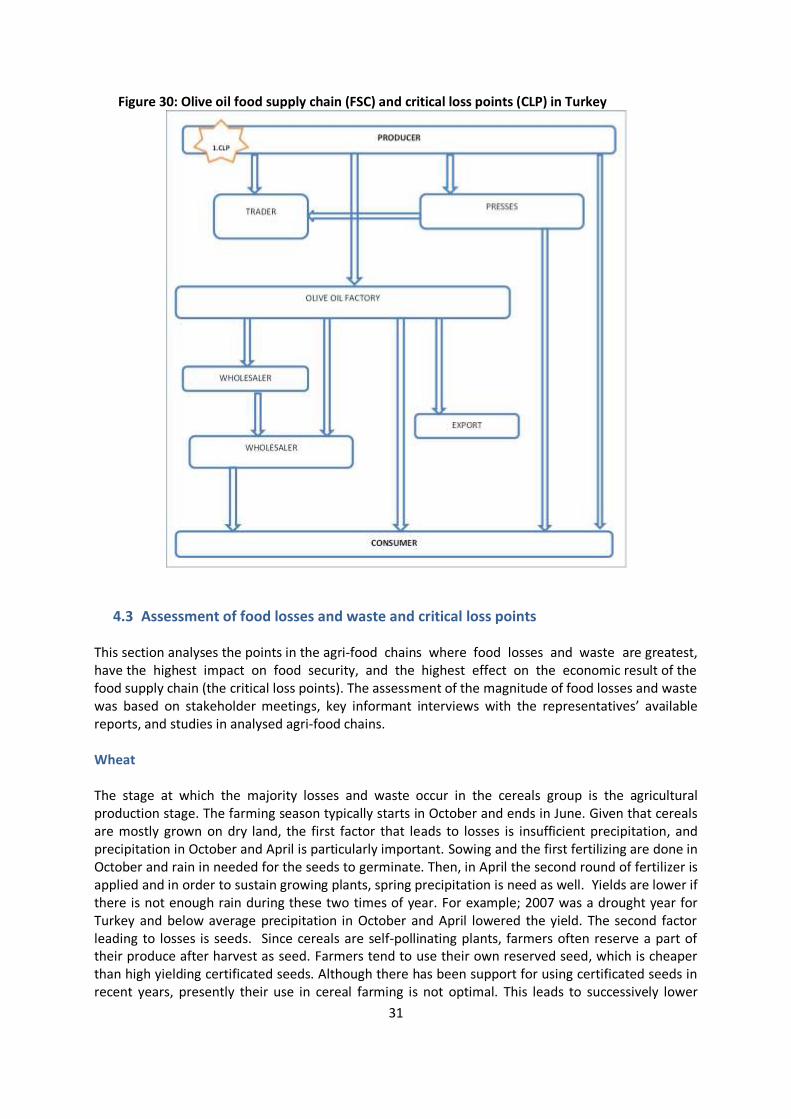
Olive oil Olives grow best in warm temperatures. Owing to its mild climate, the Mediterranean region accounts for 98 percent of the olive harvest and 95 percent of world olive oil production. Olives are harvested and processed between November and March. About 70 percent of the olives produced in Turkey are pressed for oil and the rest are reserved for table olives. In Turkey, olive oil production has undergone remarkable developments since the 1980s and more and more olive oil plants have either started to produce virgin olive oil or increased their production capacity. Now, Turkey has the capacity to supply more than 300 000 tonnes of olive oil per year owing to its large-scale plants with modern bottling lines. There are compulsory export standards for table olives and olive oil in Turkey, meaning that production in all the plants conforms to the standards of the Turkish Standards Institute (TSE), which are also consistent with international standards. Olive oil is classified as “extra virgin”, “virgin”, “refined” and “riviera” (a blend of virgin and refined olive oil that is called “olive oil” in international standards) based on the means of production as well as the physical properties and organoleptic characteristics of the product. Being a net exporter of olive oil, Turkey supplies a variety of olive oil to a wide range of countries, including major producing countries that either consume or re-export Turkish olive oil. Turkish olive oil is demanded from every part of the world. Although organic production still only accounts for a small proportion of the total area and output of olives, Turkey’s organic olive and olive oil exports are also rising in parallel with healthier global consumption trends. Olive oil producers are trying to reach the national market through traders or direct sales from farmers, presses and olive oil factories. Wholesalers and retailers act as intermediaries between olive oil factories and consumers.
31
Figure 30: Olive oil food supply chain (FSC) and critical loss points (CLP) in Turkey
4.3 Assessment of food losses and waste and critical loss points
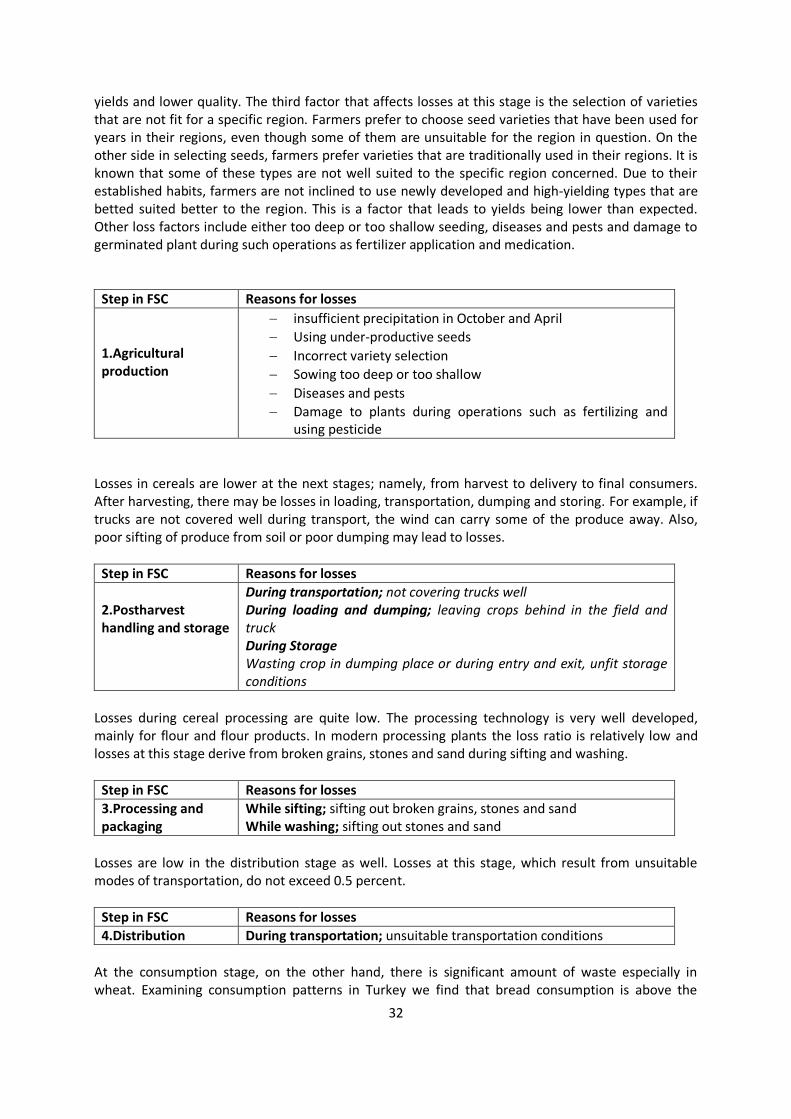
This section analyses the points in the agri‐food chains where food losses and waste are greatest, have the highest impact on food security, and the highest effect on the economic result of the food supply chain (the critical loss points). The assessment of the magnitude of food losses and waste was based on stakeholder meetings, key informant interviews with the representatives’ available reports, and studies in analysed agri‐food chains. Wheat The stage at which the majority losses and waste occur in the cereals group is the agricultural production stage. The farming season typically starts in October and ends in June. Given that cereals are mostly grown on dry land, the first factor that leads to losses is insufficient precipitation, and precipitation in October and April is particularly important. Sowing and the first fertilizing are done in October and rain in needed for the seeds to germinate. Then, in April the second round of fertilizer is applied and in order to sustain growing plants, spring precipitation is need as well. Yields are lower if there is not enough rain during these two times of year. For example; 2007 was a drought year for Turkey and below average precipitation in October and April lowered the yield. The second factor leading to losses is seeds. Since cereals are self-pollinating plants, farmers often reserve a part of their produce after harvest as seed. Farmers tend to use their own reserved seed, which is cheaper than high yielding certificated seeds. Although there has been support for using certificated seeds in recent years, presently their use in cereal farming is not optimal. This leads to successively lower
32
yields and lower quality. The third factor that affects losses at this stage is the selection of varieties that are not fit for a specific region. Farmers prefer to choose seed varieties that have been used for years in their regions, even though some of them are unsuitable for the region in question. On the other side in selecting seeds, farmers prefer varieties that are traditionally used in their regions. It is known that some of these types are not well suited to the specific region concerned. Due to their established habits, farmers are not inclined to use newly developed and high-yielding types that are betted suited better to the region. This is a factor that leads to yields being lower than expected. Other loss factors include either too deep or too shallow seeding, diseases and pests and damage to germinated plant during such operations as fertilizer application and medication.
Step in FSC Reasons for losses
1.Agricultural production
insufficient precipitation in October and April
Using under-productive seeds
Incorrect variety selection
Sowing too deep or too shallow
Diseases and pests
Damage to plants during operations such as fertilizing and using pesticide
Losses in cereals are lower at the next stages; namely, from harvest to delivery to final consumers. After harvesting, there may be losses in loading, transportation, dumping and storing. For example, if trucks are not covered well during transport, the wind can carry some of the produce away. Also, poor sifting of produce from soil or poor dumping may lead to losses.
Step in FSC Reasons for losses
2.Postharvest handling and storage
During transportation; not covering trucks well During loading and dumping; leaving crops behind in the field and truck During Storage Wasting crop in dumping place or during entry and exit, unfit storage conditions
Losses during cereal processing are quite low. The processing technology is very well developed, mainly for flour and flour products. In modern processing plants the loss ratio is relatively low and losses at this stage derive from broken grains, stones and sand during sifting and washing.
Step in FSC Reasons for losses
3.Processing and packaging
While sifting; sifting out broken grains, stones and sand While washing; sifting out stones and sand
Losses are low in the distribution stage as well. Losses at this stage, which result from unsuitable modes of transportation, do not exceed 0.5 percent.
Step in FSC Reasons for losses
4.Distribution During transportation; unsuitable transportation conditions
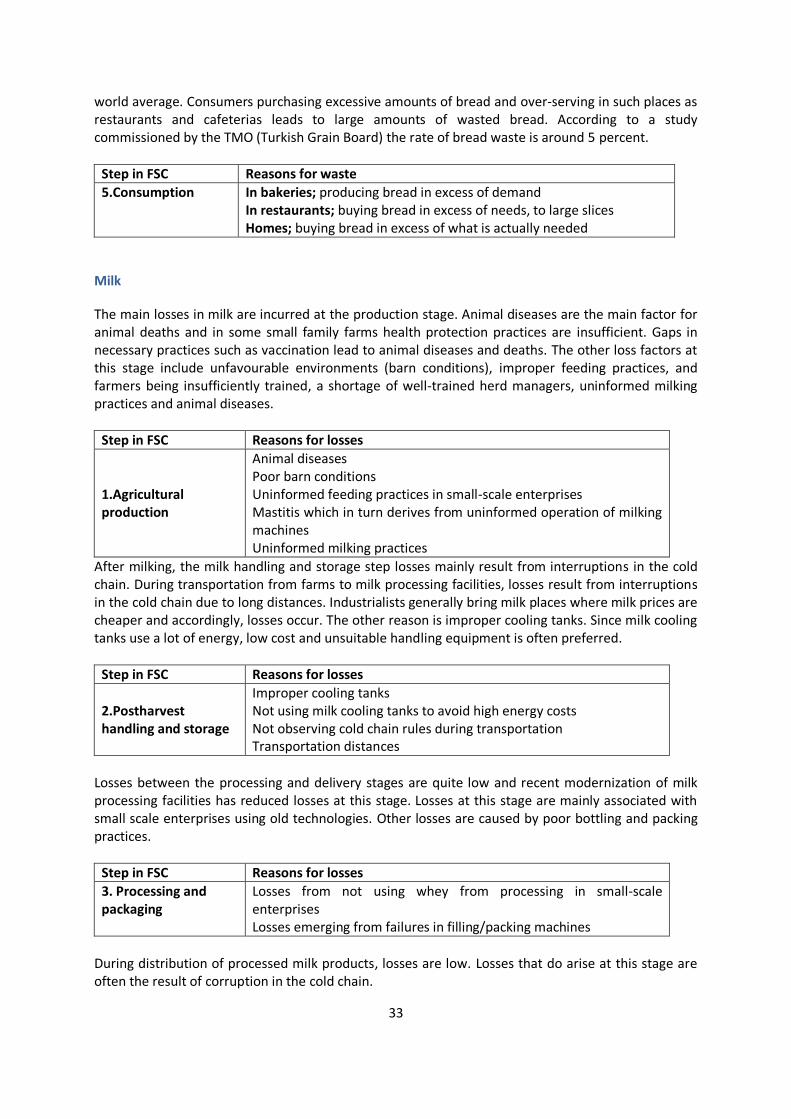
At the consumption stage, on the other hand, there is significant amount of waste especially in wheat. Examining consumption patterns in Turkey we find that bread consumption is above the
33
world average. Consumers purchasing excessive amounts of bread and over-serving in such places as restaurants and cafeterias leads to large amounts of wasted bread. According to a study commissioned by the TMO (Turkish Grain Board) the rate of bread waste is around 5 percent.
Step in FSC Reasons for waste
5.Consumption In bakeries; producing bread in excess of demand In restaurants; buying bread in excess of needs, to large slices Homes; buying bread in excess of what is actually needed
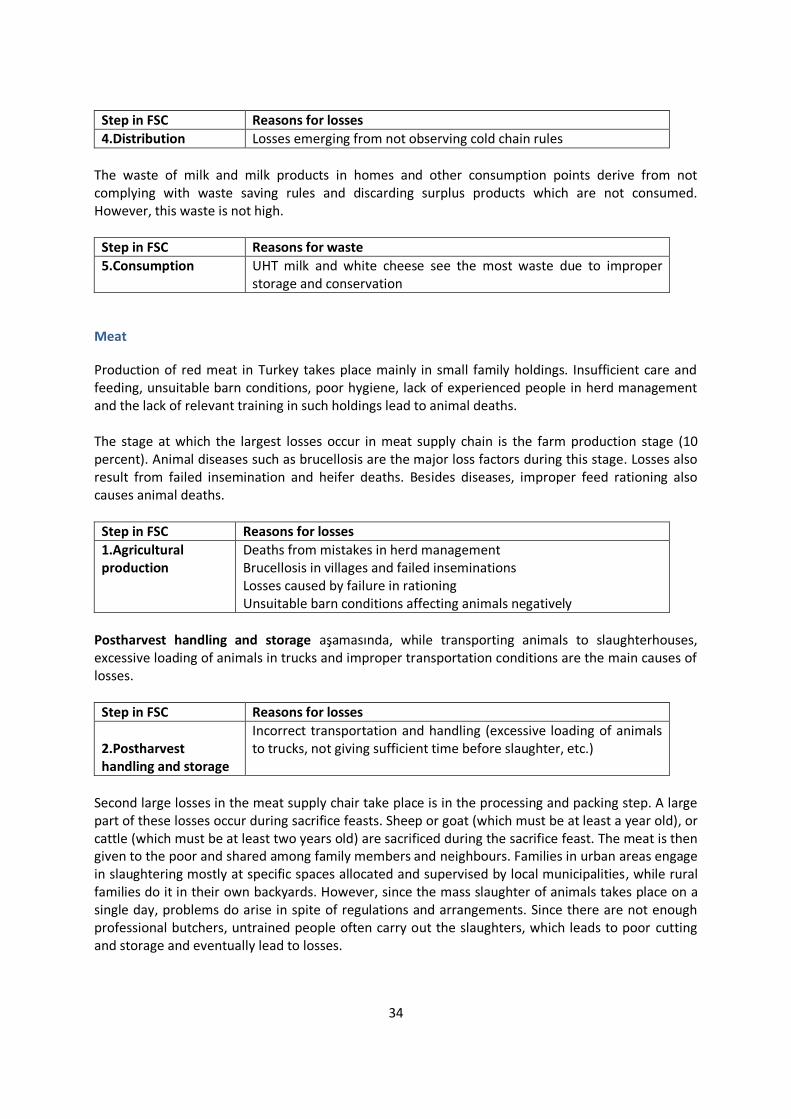
Milk
The main losses in milk are incurred at the production stage. Animal diseases are the main factor for animal deaths and in some small family farms health protection practices are insufficient. Gaps in necessary practices such as vaccination lead to animal diseases and deaths. The other loss factors at this stage include unfavourable environments (barn conditions), improper feeding practices, and farmers being insufficiently trained, a shortage of well-trained herd managers, uninformed milking practices and animal diseases.
Step in FSC Reasons for losses
1.Agricultural production
Animal diseases Poor barn conditions Uninformed feeding practices in small-scale enterprises Mastitis which in turn derives from uninformed operation of milking machines Uninformed milking practices
After milking, the milk handling and storage step losses mainly result from interruptions in the cold chain. During transportation from farms to milk processing facilities, losses result from interruptions in the cold chain due to long distances. Industrialists generally bring milk places where milk prices are cheaper and accordingly, losses occur. The other reason is improper cooling tanks. Since milk cooling tanks use a lot of energy, low cost and unsuitable handling equipment is often preferred.
Step in FSC Reasons for losses
2.Postharvest handling and storage
Improper cooling tanks Not using milk cooling tanks to avoid high energy costs Not observing cold chain rules during transportation Transportation distances
Losses between the processing and delivery stages are quite low and recent modernization of milk processing facilities has reduced losses at this stage. Losses at this stage are mainly associated with small scale enterprises using old technologies. Other losses are caused by poor bottling and packing practices.
Step in FSC Reasons for losses
3. Processing and packaging
Losses from not using whey from processing in small-scale enterprises Losses emerging from failures in filling/packing machines
During distribution of processed milk products, losses are low. Losses that do arise at this stage are often the result of corruption in the cold chain.
34
Step in FSC Reasons for losses
4.Distribution Losses emerging from not observing cold chain rules
The waste of milk and milk products in homes and other consumption points derive from not complying with waste saving rules and discarding surplus products which are not consumed. However, this waste is not high.
Step in FSC Reasons for waste
5.Consumption UHT milk and white cheese see the most waste due to improper storage and conservation
Meat
Production of red meat in Turkey takes place mainly in small family holdings. Insufficient care and feeding, unsuitable barn conditions, poor hygiene, lack of experienced people in herd management and the lack of relevant training in such holdings lead to animal deaths. The stage at which the largest losses occur in meat supply chain is the farm production stage (10 percent). Animal diseases such as brucellosis are the major loss factors during this stage. Losses also result from failed insemination and heifer deaths. Besides diseases, improper feed rationing also causes animal deaths.
Step in FSC Reasons for losses
1.Agricultural production
Deaths from mistakes in herd management Brucellosis in villages and failed inseminations Losses caused by failure in rationing Unsuitable barn conditions affecting animals negatively
Postharvest handling and storage aşamasında, while transporting animals to slaughterhouses, excessive loading of animals in trucks and improper transportation conditions are the main causes of losses.
Step in FSC Reasons for losses
2.Postharvest handling and storage
Incorrect transportation and handling (excessive loading of animals to trucks, not giving sufficient time before slaughter, etc.)
Second large losses in the meat supply chair take place is in the processing and packing step. A large part of these losses occur during sacrifice feasts. Sheep or goat (which must be at least a year old), or cattle (which must be at least two years old) are sacrificed during the sacrifice feast. The meat is then given to the poor and shared among family members and neighbours. Families in urban areas engage in slaughtering mostly at specific spaces allocated and supervised by local municipalities, while rural families do it in their own backyards. However, since the mass slaughter of animals takes place on a single day, problems do arise in spite of regulations and arrangements. Since there are not enough professional butchers, untrained people often carry out the slaughters, which leads to poor cutting and storage and eventually lead to losses.
35
Step in FSC Reasons for losses
3.Processing and packaging
Losses caused by improper slaughtering by untrained and uncertified people.
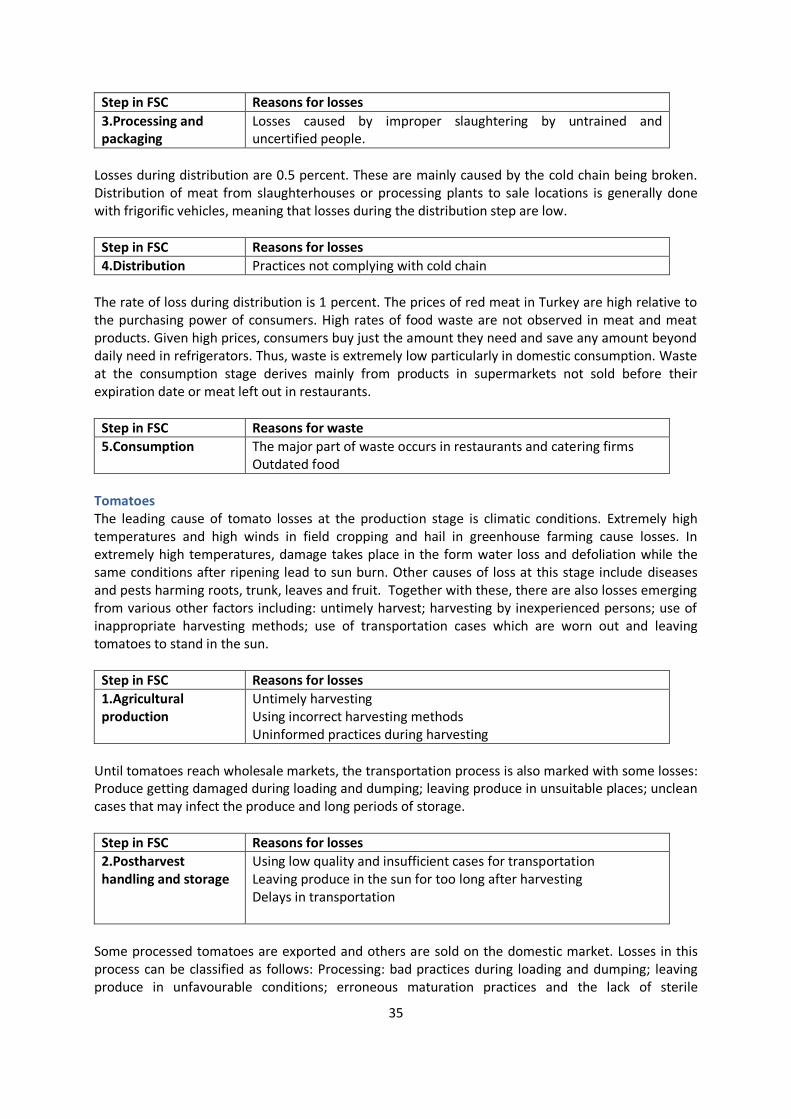
Losses during distribution are 0.5 percent. These are mainly caused by the cold chain being broken. Distribution of meat from slaughterhouses or processing plants to sale locations is generally done with frigorific vehicles, meaning that losses during the distribution step are low.
Step in FSC Reasons for losses
4.Distribution Practices not complying with cold chain
The rate of loss during distribution is 1 percent. The prices of red meat in Turkey are high relative to the purchasing power of consumers. High rates of food waste are not observed in meat and meat products. Given high prices, consumers buy just the amount they need and save any amount beyond daily need in refrigerators. Thus, waste is extremely low particularly in domestic consumption. Waste at the consumption stage derives mainly from products in supermarkets not sold before their expiration date or meat left out in restaurants.
Step in FSC Reasons for waste
5.Consumption The major part of waste occurs in restaurants and catering firms Outdated food
Tomatoes The leading cause of tomato losses at the production stage is climatic conditions. Extremely high temperatures and high winds in field cropping and hail in greenhouse farming cause losses. In extremely high temperatures, damage takes place in the form water loss and defoliation while the same conditions after ripening lead to sun burn. Other causes of loss at this stage include diseases and pests harming roots, trunk, leaves and fruit. Together with these, there are also losses emerging from various other factors including: untimely harvest; harvesting by inexperienced persons; use of inappropriate harvesting methods; use of transportation cases which are worn out and leaving tomatoes to stand in the sun.
Step in FSC Reasons for losses
1.Agricultural production
Untimely harvesting Using incorrect harvesting methods Uninformed practices during harvesting
Until tomatoes reach wholesale markets, the transportation process is also marked with some losses: Produce getting damaged during loading and dumping; leaving produce in unsuitable places; unclean cases that may infect the produce and long periods of storage.
Step in FSC Reasons for losses
2.Postharvest handling and storage
Using low quality and insufficient cases for transportation Leaving produce in the sun for too long after harvesting Delays in transportation
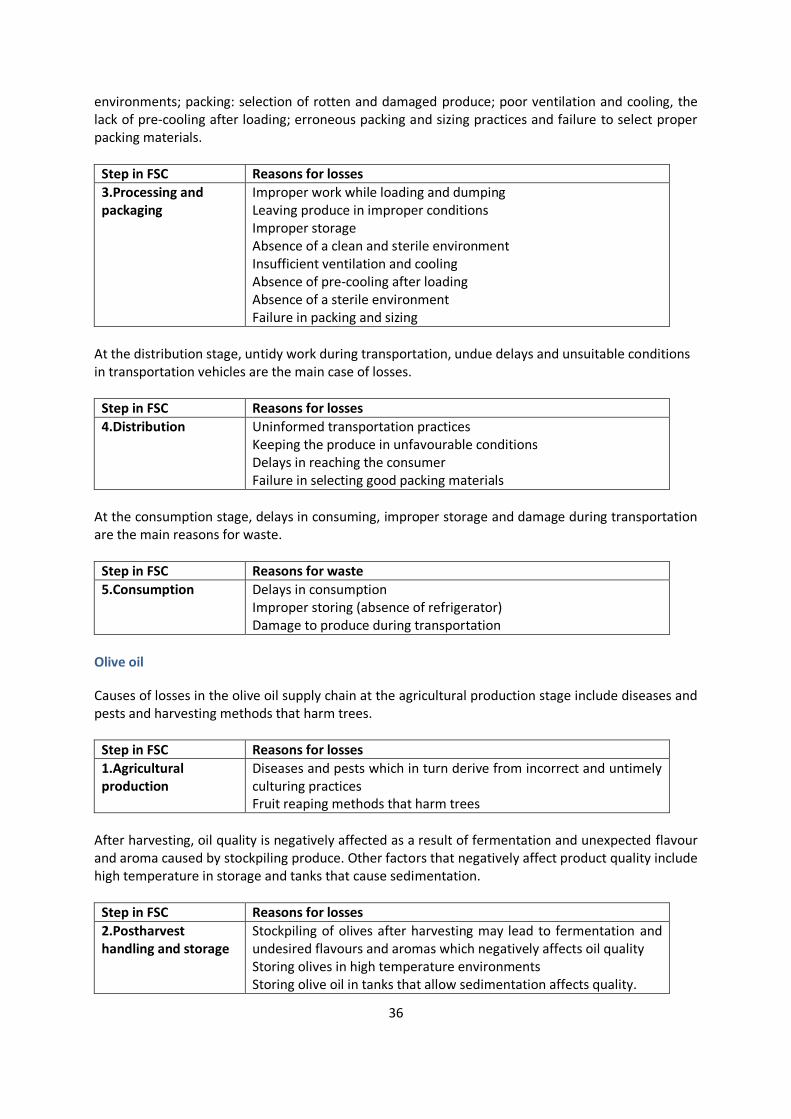
Some processed tomatoes are exported and others are sold on the domestic market. Losses in this process can be classified as follows: Processing: bad practices during loading and dumping; leaving produce in unfavourable conditions; erroneous maturation practices and the lack of sterile
36
environments; packing: selection of rotten and damaged produce; poor ventilation and cooling, the lack of pre-cooling after loading; erroneous packing and sizing practices and failure to select proper packing materials.
Step in FSC Reasons for losses
3.Processing and packaging
Improper work while loading and dumping Leaving produce in improper conditions Improper storage Absence of a clean and sterile environment Insufficient ventilation and cooling Absence of pre-cooling after loading Absence of a sterile environment Failure in packing and sizing
At the distribution stage, untidy work during transportation, undue delays and unsuitable conditions in transportation vehicles are the main case of losses.
Step in FSC Reasons for losses
4.Distribution Uninformed transportation practices Keeping the produce in unfavourable conditions Delays in reaching the consumer Failure in selecting good packing materials
At the consumption stage, delays in consuming, improper storage and damage during transportation are the main reasons for waste.
Step in FSC Reasons for waste
5.Consumption Delays in consumption Improper storing (absence of refrigerator) Damage to produce during transportation
Olive oil
Causes of losses in the olive oil supply chain at the agricultural production stage include diseases and pests and harvesting methods that harm trees.
Step in FSC Reasons for losses
1.Agricultural production
Diseases and pests which in turn derive from incorrect and untimely culturing practices Fruit reaping methods that harm trees
After harvesting, oil quality is negatively affected as a result of fermentation and unexpected flavour and aroma caused by stockpiling produce. Other factors that negatively affect product quality include high temperature in storage and tanks that cause sedimentation.
Step in FSC Reasons for losses
2.Postharvest handling and storage
Stockpiling of olives after harvesting may lead to fermentation and undesired flavours and aromas which negatively affects oil quality Storing olives in high temperature environments Storing olive oil in tanks that allow sedimentation affects quality.
37
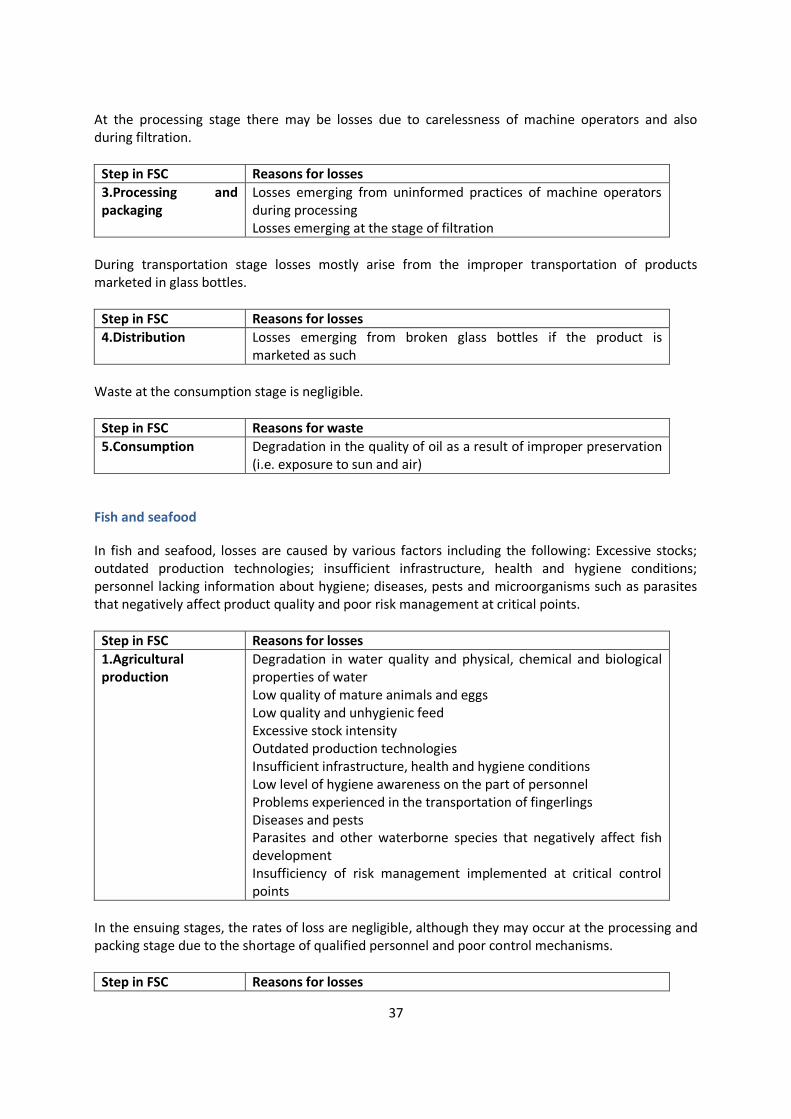
At the processing stage there may be losses due to carelessness of machine operators and also during filtration.
Step in FSC Reasons for losses
3.Processing and packaging
Losses emerging from uninformed practices of machine operators during processing Losses emerging at the stage of filtration
During transportation stage losses mostly arise from the improper transportation of products marketed in glass bottles.
Step in FSC Reasons for losses
4.Distribution Losses emerging from broken glass bottles if the product is marketed as such
Waste at the consumption stage is negligible.
Step in FSC Reasons for waste
5.Consumption Degradation in the quality of oil as a result of improper preservation (i.e. exposure to sun and air)
Fish and seafood
In fish and seafood, losses are caused by various factors including the following: Excessive stocks; outdated production technologies; insufficient infrastructure, health and hygiene conditions; personnel lacking information about hygiene; diseases, pests and microorganisms such as parasites that negatively affect product quality and poor risk management at critical points.
Step in FSC Reasons for losses
1.Agricultural production
Degradation in water quality and physical, chemical and biological properties of water Low quality of mature animals and eggs Low quality and unhygienic feed Excessive stock intensity Outdated production technologies Insufficient infrastructure, health and hygiene conditions Low level of hygiene awareness on the part of personnel Problems experienced in the transportation of fingerlings Diseases and pests Parasites and other waterborne species that negatively affect fish development Insufficiency of risk management implemented at critical control points
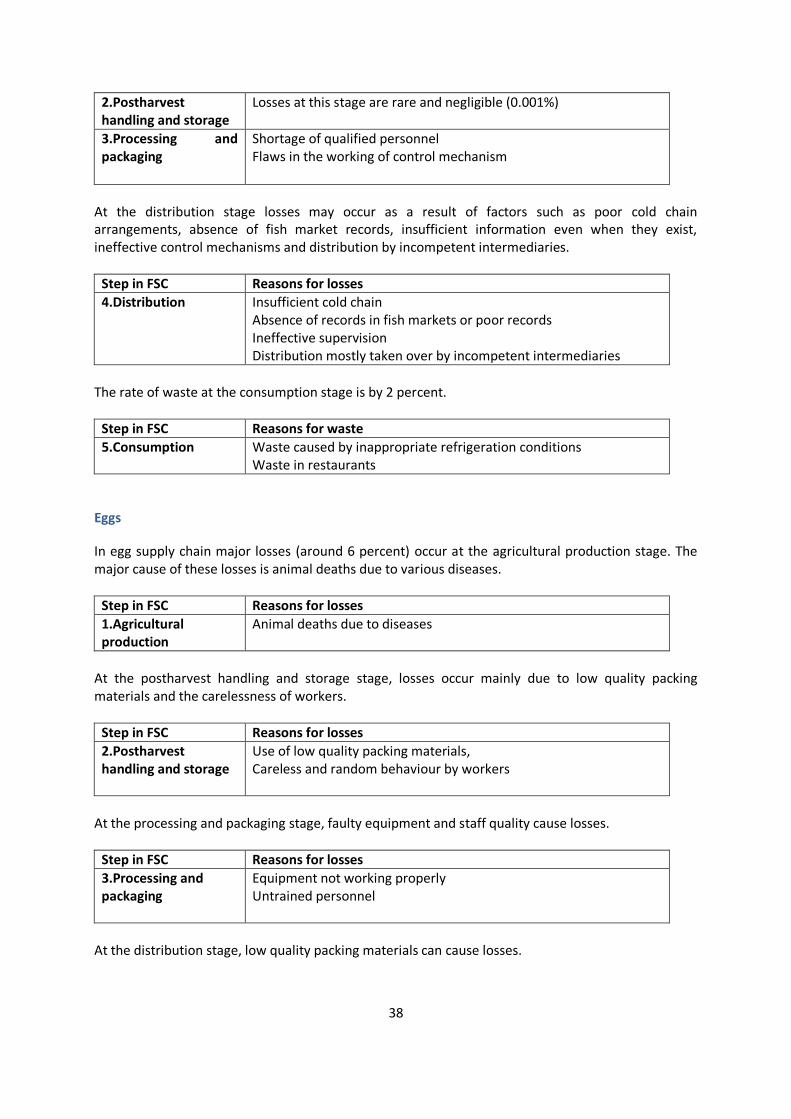
In the ensuing stages, the rates of loss are negligible, although they may occur at the processing and packing stage due to the shortage of qualified personnel and poor control mechanisms.
Step in FSC Reasons for losses
38
2.Postharvest handling and storage
Losses at this stage are rare and negligible (0.001%)
3.Processing and packaging
Shortage of qualified personnel Flaws in the working of control mechanism
At the distribution stage losses may occur as a result of factors such as poor cold chain arrangements, absence of fish market records, insufficient information even when they exist, ineffective control mechanisms and distribution by incompetent intermediaries.
Step in FSC Reasons for losses
4.Distribution Insufficient cold chain Absence of records in fish markets or poor records Ineffective supervision Distribution mostly taken over by incompetent intermediaries
The rate of waste at the consumption stage is by 2 percent.
Step in FSC Reasons for waste
5.Consumption Waste caused by inappropriate refrigeration conditions Waste in restaurants
Eggs
In egg supply chain major losses (around 6 percent) occur at the agricultural production stage. The major cause of these losses is animal deaths due to various diseases.
Step in FSC Reasons for losses
1.Agricultural production
Animal deaths due to diseases
At the postharvest handling and storage stage, losses occur mainly due to low quality packing materials and the carelessness of workers.
Step in FSC Reasons for losses
2.Postharvest handling and storage
Use of low quality packing materials, Careless and random behaviour by workers
At the processing and packaging stage, faulty equipment and staff quality cause losses.
Step in FSC Reasons for losses
3.Processing and packaging
Equipment not working properly Untrained personnel
At the distribution stage, low quality packing materials can cause losses.
39
Step in FSC Reasons for losses
4.Distribution Low quality packing materials
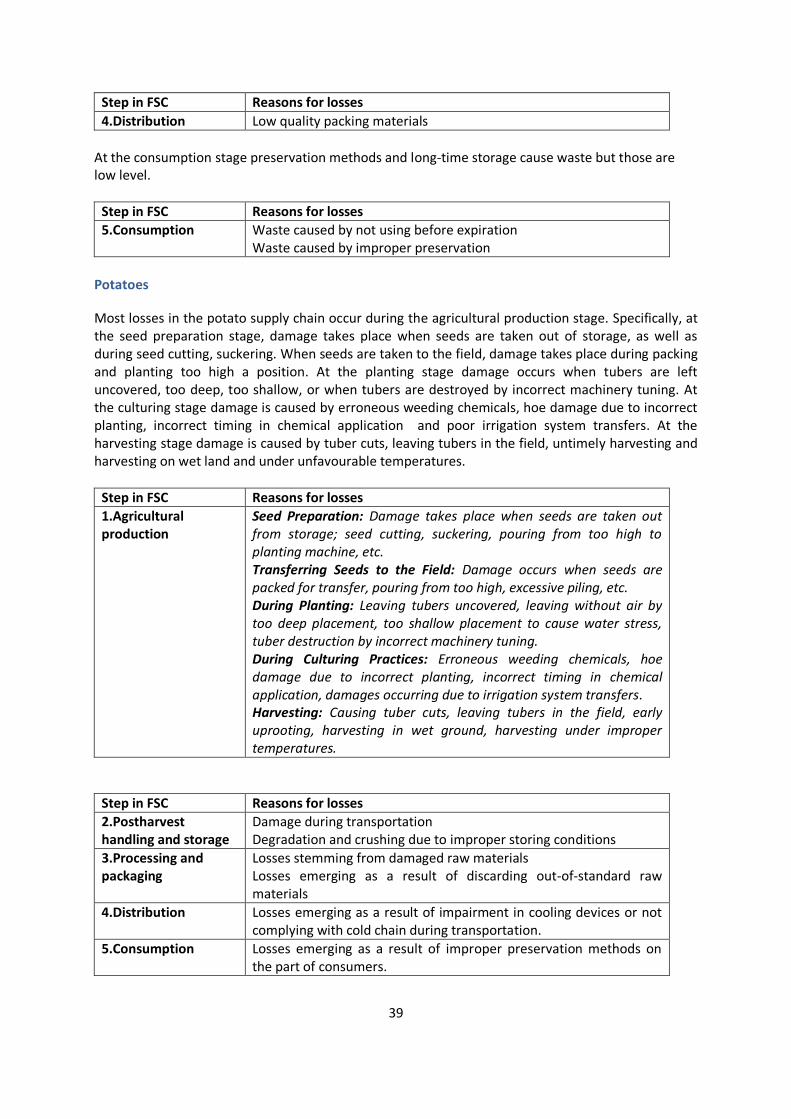
At the consumption stage preservation methods and long-time storage cause waste but those are low level.
Step in FSC Reasons for losses
5.Consumption Waste caused by not using before expiration Waste caused by improper preservation
Potatoes
Most losses in the potato supply chain occur during the agricultural production stage. Specifically, at the seed preparation stage, damage takes place when seeds are taken out of storage, as well as during seed cutting, suckering. When seeds are taken to the field, damage takes place during packing and planting too high a position. At the planting stage damage occurs when tubers are left uncovered, too deep, too shallow, or when tubers are destroyed by incorrect machinery tuning. At the culturing stage damage is caused by erroneous weeding chemicals, hoe damage due to incorrect planting, incorrect timing in chemical application and poor irrigation system transfers. At the harvesting stage damage is caused by tuber cuts, leaving tubers in the field, untimely harvesting and harvesting on wet land and under unfavourable temperatures.
Step in FSC Reasons for losses
1.Agricultural production
Seed Preparation: Damage takes place when seeds are taken out from storage; seed cutting, suckering, pouring from too high to planting machine, etc. Transferring Seeds to the Field: Damage occurs when seeds are packed for transfer, pouring from too high, excessive piling, etc. During Planting: Leaving tubers uncovered, leaving without air by too deep placement, too shallow placement to cause water stress, tuber destruction by incorrect machinery tuning. During Culturing Practices: Erroneous weeding chemicals, hoe damage due to incorrect planting, incorrect timing in chemical application, damages occurring due to irrigation system transfers. Harvesting: Causing tuber cuts, leaving tubers in the field, early uprooting, harvesting in wet ground, harvesting under improper temperatures.
Step in FSC Reasons for losses
2.Postharvest handling and storage
Damage during transportation Degradation and crushing due to improper storing conditions
3.Processing and packaging
Losses stemming from damaged raw materials Losses emerging as a result of discarding out-of-standard raw materials
4.Distribution Losses emerging as a result of impairment in cooling devices or not complying with cold chain during transportation.
5.Consumption Losses emerging as a result of improper preservation methods on the part of consumers.
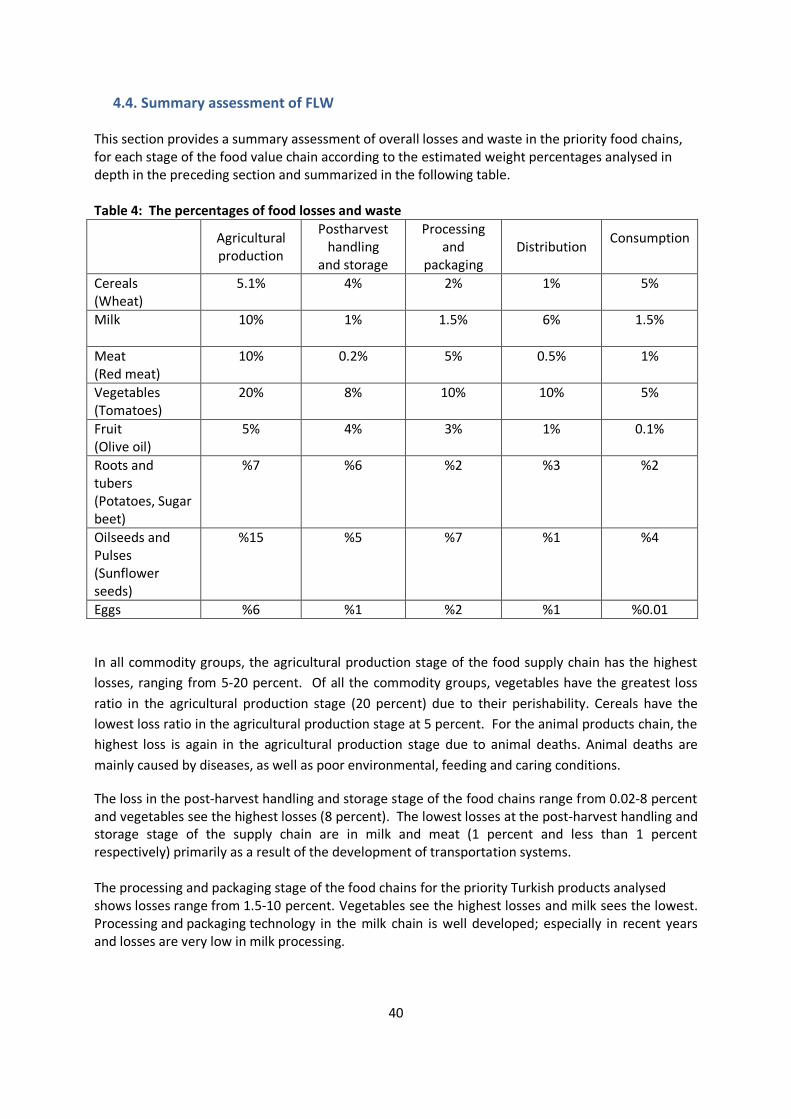
40
4.4. Summary assessment of FLW This section provides a summary assessment of overall losses and waste in the priority food chains, for each stage of the food value chain according to the estimated weight percentages analysed in depth in the preceding section and summarized in the following table. Table 4: The percentages of food losses and waste
Agricultural production
Postharvest handling
and storage
Processing and
packaging Distribution
Consumption
Cereals (Wheat)
5.1% 4% 2% 1% 5%
Milk
10% 1% 1.5% 6% 1.5%
Meat (Red meat)
10% 0.2% 5% 0.5% 1%
Vegetables (Tomatoes)
20% 8% 10% 10% 5%
Fruit (Olive oil)
5% 4% 3% 1% 0.1%
Roots and tubers (Potatoes, Sugar beet)
%7 %6 %2 %3 %2
Oilseeds and Pulses (Sunflower seeds)
%15 %5 %7 %1 %4
Eggs %6 %1 %2 %1 %0.01
In all commodity groups, the agricultural production stage of the food supply chain has the highest
losses, ranging from 5-20 percent. Of all the commodity groups, vegetables have the greatest loss
ratio in the agricultural production stage (20 percent) due to their perishability. Cereals have the
lowest loss ratio in the agricultural production stage at 5 percent. For the animal products chain, the
highest loss is again in the agricultural production stage due to animal deaths. Animal deaths are
mainly caused by diseases, as well as poor environmental, feeding and caring conditions.
The loss in the post‐harvest handling and storage stage of the food chains range from 0.02-8 percent and vegetables see the highest losses (8 percent). The lowest losses at the post-harvest handling and storage stage of the supply chain are in milk and meat (1 percent and less than 1 percent respectively) primarily as a result of the development of transportation systems. The processing and packaging stage of the food chains for the priority Turkish products analysed shows losses range from 1.5-10 percent. Vegetables see the highest losses and milk sees the lowest. Processing and packaging technology in the milk chain is well developed; especially in recent years and losses are very low in milk processing.
41
The reasons for the high loss ratio in tomato processing and packaging are improper work while loading and dumping, keeping the produce in poor conditions, improper storage conditions, absence of a clean and sterile environment, insufficient ventilation and cooling systems, absence of pre-cooling after loading, absence of a sterile environment and failure in packing and sizing of tomatoes. At the distribution stage, losses and waste are estimated to range from 0.5-10 percent. Tomatoes see the highest loss and waste due to uninformed transportation practices, keeping the produce in unfavourable conditions, delays in reaching the consumer and failure to select good packing materials. Meat has the lowest ratio at 0.5 percent. At the consumption stage waste ratios range from 0.1-5 percent. The wheat food supply chain sees the highest waste. Because of the relatively high level of bread consumption, families tend to buy more bread than they need, while restaurants also waste a lot of bread.

42
5. ANALYSIS OF KEY FACTORS FOR FLW
In this section we analyse the causes of losses and waste. Causes were identified by conducting interviews with relevant stakeholders in the respective commodity groups. Causes of food losses and waste are given in tabular form in the annexes.
5.1. Technology and investment The highest rates of loss are observed in the first link of the chain; namely, agricultural production. One of the most serious structural problems in Turkish agriculture is small and fragmented farms and the low level of agricultural cooperation. As unorganized actors, small farmers do not have a competitive advantage in either the purchase of inputs or the sale of outputs in a free market economy. At the agricultural production stage, high input prices prevent yield increasing initiatives and practices, the use of certificated seeds and fertilizers as well as veterinary and medicine services. Small profit margins, in turn, preclude new investments and the use of advanced technology.
The other factor is irrigation. As mentioned below, particularly in cereals, precipitation is the most important factor that constrains output. The average annual precipitation in Turkey is 643 mm. In the Central Anatolia region which makes up the major part of cereals production, the average annual precipitation is lower than the country average. Irrigated farming takes place only on 5.5 million hectares of land out of 23 million hectares in total. The expansion of irrigated farming and investments for ensuring more efficient and effective use of irrigation water will reduce losses, especially in cereals.
Losses emerging up to the stage of final consumption are relatively smaller. Recent advances in transportation, processing and storage technologies and the preference of firms in the supply chain for new technologies help reduce losses at stages that follow agricultural production. At these stages, the rate of loss is relatively higher for products that spoil quickly, such as tomatoes. However, even these losses tend to become smaller together with developments in processing technology.
5.2. Human resources It can be said that losses at the agricultural production stage are mainly associated with farmers’ traditional methods, habits and practices. In wheat, for example, the improper selection of seed with respect to the region concerned, sowing too deep or not deep enough and the use of low yield seeds are factors that contribute to losses. In animal husbandry, erroneous practices particularly in animal care and feeding, poor environmental conditions and failures in making timely interventions in animal health lead to animal losses. Losses emerge from farmers’ unwillingness to seek information related to agricultural production. Since young people in rural areas tend not to want to work in farming, agricultural production is generally undertaken by older people. Older farmers do not keep track of innovations and engage in production practices that they learned from past generations. They are too slow in adopting and practising new technologies. The shortage of intermediate personnel in agricultural production can be listed as another reason. There is, for example, a shortage of such personnel for herd management in animal husbandry and grafting pruning in fruit culture. Uninformed practices in these areas lead to product losses.
43
The Ministry of Food, Agriculture and Animal Husbandry employs extension staff to introduce new technologies to farmers. These extension staff also have training needs. Losses at the stage of agricultural production can be reduced by training extensionists in such issues as region-specific products, practices and problems.
5.3. Food safety and quality standards With respect to food safety and quality, there have been significant developments in Turkey for some commodity groups. For example, in wheat which is widely produced and consumed, the Soil Products Office (TMO) uses the criteria of protein content while purchasing wheat from farmers. Pricing according to protein content encourages farmers to be more careful at the production stage. In bread consumption too, there are changes in flour standards according to consumer preferences. However, purchasing on the basis of content is not valid for all commodities. In raw milk, for example, there is still no pricing on the basis of somatic cells, microbial numbers, protein and milk fat content.
Lower rates of loss are expected in systems where pricing is based on quality.
44
6. PRIORITY ACTIONS AND POLICIES FOR REDUCING FLW This section is comprised of two parts. Firstly a brief overview is provided of government agri-food policy priorities, support programs and activities in the sphere of food losses and waste. Secondly a series of recommendations are provided of potential initiatives to monitor levels of losses and waste and to reduce losses and waste at critical loss points identified early in this study.
6.1. The enabling environment for agri-food chain performance
Agricultural policies in Turkey have undergone a significant reform process to solve long-lasting problems in the agricultural sector. The major problems of Turkish agriculture are the small size of farms, fragmented and scattered farms, low efficiency, insufficiencies in production and marketing infrastructures, low levels of professional agricultural activity, low investment capacity, low level of education, ineffective institutional structures and farmers’ organizations. The other reason for reforms is to adapt to the European Union’s common agricultural policy. In this context, a Strategic Plan has been prepared to achieve the relevant aims. According to the 2013-2017 Strategic Plan of the Ministry of Food, Agriculture and Livestock, strategic areas are:
Agricultural production and supply security
Food safety
Plant health, animal health and welfare
Agricultural infrastructure and rural development
Institutional capacity There are strategic areas and 38 strategic objectives under the Plan to guide the production and management structure, to improve their advantage in international markets, to convert to bio-diversity, to ensure adequate and reliable food supply has been identified as key priorities. The Strategic Plan aims to:
Guide agricultural production and provide security of supply;
Develop agricultural infrastructure, protect and improve environment and natural resources, enable sustainability and take measures to reduce the effect of natural disasters;
Provide high quality supply of food and feed;
Eradicate diseases and pests, prevent product losses and protect public health;
Develop agricultural infrastructure services, human resources and organizational level in rural areas, provide market integration, diversify the income of the rural population and increase local development capacity and quality of life;
Provide perfect managerial and institutional capacity to offer efficient and qualified services. Furthermore, food safety has become one of the target areas of agricultural policy. Some legal arrangements have been made regarding food safety. Negotiations with the European Union were opened in the 12th Chapter “Food Safety, Veterinary and Plant Health”.
Risky regions and products in terms of food safety have been determined;
Inspections and controls have been increased;

45
The staff responsible for inspections in municipalities and provincial special administrations have been trained through food inspector courses;
Pursuant to Montreal protocol, the application of methyle bromide was abolished in2007.;
The production and import of active substance of 181 plant protection products have been prohibited with the aim of harmonization to EU;
A National Food Reference Laboratory at international level was put into service in 2010.
The number of private Food Control Laboratory was increased to 79.
“Food Safety Information System”(GGBS) has been established;
Guidebooks on Good Hygiene applications have been published;
A biosecurity law was published in 2010.
On the other hand, storage of harvested products under appropriate conditions is essential for minimizing losses. Because of short harvest periods, over supply occurs in many agricultural products in several weeks. This results both in farmers achieving only low prices and a high loss ratio. At this point, licensed warehouses are very important for producers. Some regulations have been made in this regard in Turkey. In a Licensed Warehouse System, after analysing the products to see if they meet EU regulations, they are stored in a healthy environment with modern infrastructure. Trading of stored products is realized through the ownership of equity representing the product value. The Ministry of Customs and Trade prepared the "Regulation of Agricultural Products Licensed Warehousing", which was published on September 2013 in the Official Gazette. With this regulation, 6 agricultural commodities including cereals, pulses, oil seeds , nuts, olives, olive oil and cotton , as well as dried apricots are covered by the licensed warehouses. Studies have been ongoing to establish the system properly.
6.2 Actions and policy proposals Some measures geared towards reducing losses during agricultural production are listed below: For cereals, roots and tubers, oilseeds and pulses and fruit and vegetables:
Proper preparation of soil;
Correct selection of the type of seed;
Promotion of the use of certificated seed;
Informed and timely combat against diseases and pests;
Building awareness among farmers;
Training of persons involved in harvesting;
Training farmers about production techniques;
Development and implementation of early warning systems;
Use of advanced technology machinery in harvesting. For milk, meat and eggs:
Giving importance to protective medicine;
Early intervention to diseases;
Further support to efforts for improving barn conditions;
Building awareness among farmers;
Training farmers in feeding; breeding and milking techniques;
Joint projects and training activities with universities and research institutes to cover the shortage of experienced technical workers in herd management;
46
Extending necessary support to the milking of small ruminants in pastures together with relevant monitoring and evaluation.
For fish and seafood;
Adopting necessary measures to preserve water quality and sustainability and improving water quality;
Providing healthy and quality animals capable of giving birth;
Using appropriate methods in the procurement of eggs and larvae;
Preparation of digestible and high calorie feed rations in larvae and fish hatching and use of quality feed;
Employment and training of specialized personnel; their hygiene
Improving and expanding the scope of R&D activities. At other stages of FSC the following may be adopted to reduce losses:
Informing farmers/truck drivers about transportation requirements and training workers involved in loading and dumping operations.
Informing and training farmers; drivers; workers and combined harvester operators.
Selecting materials used in transporting harvested produce (sacks; cases etc) so as not to allow any compromise in terms of product quality and quantity.
Being tidy on storage conditions and informing farmers about what is necessary for keeping storages clean and hygienic;
Informing and training consumers about ways of conserving and using food.
Preparation and enforcement of a legislation to control household animal slaughters during sacrifice feasts.
Informing consumers about food use; conservation and recycling by using public spots.
Regular maintenance and upkeep of machinery and equipment.
Responding to need for trained personnel.
Creating a labelling system to cover information at all stages from farm to table.
Operating and control of feedback monitoring systems and mechanisms.
Using cold chain channels at all stages.
Suggestions by respective commodity groups are given in annexes.
47
References Anonymous 2012a. Konya’da Tarımsal Sanayide Yapısal Özelliklerin Analizi ve Rekabet Stratejilerinin Belirlenmesi Sonuç Raporu Un İmalatı Sektörü, TEPAV, Konya Ticaret Borsası, Konya. http://ktb.org.tr/?cat=121
Anonymous 2012b, TUIK, http://tuikapp.tuik.gov.tr/bitkiselapp/bitkisel.zul
Anonymous, 1982. Hasat Öncesi,Hasat ve Hasat Sonrası Ürün Kayıpları Seminer Bildirileri, 13-17 Aralık 1982, Ankara.
Anonymous, 2010. Hububat Sektör Raporu, Orta Anadolu İhracatçılar Birliği Genel Sekreterliği, Ankara. http://www.hububatbirlik.org/content/docs/hububat-sektor-raporu.pdf
Anonymous, 2011a. Ulusal Baklagil Konseyi, Baklagil Raporu, http://www.ubk.org.tr/ziraat_rapor.pdf
Anonymous, 2011b.TOBB, Ekonomik Rapor 2010. TOBB Yayın No:2011/135. http://www.tobb.org.tr/Documents/yayinlar/ekonomikrapor2010.pdf
Anonymous, 2011c. Gıda, Tarım Ve Hayvancılık Bakanlığı Tarım İşletmeleri Genel Müdürlüğü, 2011 Yılı Hayvancılık Sektör Raporu, http://www.tigem.gov.tr/Sektrel%20Deerlendirme%20Raporlar/2011%20T%C4%B0GEM%20HAYVANCILIK%20SEKT%C3%96R%20RAPORU.pdf
Anonymous, 2012c,Türkiye Ekonomi Bakanlığı, Yaş Meyve Sebze Sektör Raporu, İhracat Genel Müdürlüğü, Tarım Ürünleri Daire Başkanlığı, http://www.ibp.gov.tr/pg/sektorpdf/tarim/tazemeyvesebze.pdf
Arslan P, Mercanlıgil S, Özal HG, Akbulut GÇ, Dönmez N, Çiftçi H, Keleş İ, Onat A, 2006. Genel Beslenme Örüntüsü ve Beslenme Alışkanlıkları. Türk Kardiyol Dern Arş – Arch Türk Sor Cardiol;34(6):331-339.
ASÜD 2013. Packaged Milk and Milk Products Industrialists Association. http://www.asuder.org.tr
CEEC 2007, Agripolicy, Sıtuatıon And Pespectıve For The Meat Sector In Turkey
FAO Statistics Division Working Paper Series. No. ESS/ESSA/006 e.(www.fao.org).
FAO, 2007. Overview of Turkish Dairy Sector within the Framework of EU-Accession. Rome
Keskin, G., Gül, U., 2004. Domates, TEAE Bakış, Sayı 5, Nüsha 13, Nisan- 2004, Ankara
Köksal O. 1974.A Report of 1974-National Nutrition, Health and Food Consumption Survey.Hacettepe University,Ankara.
Pekcan G. Türkiye’de Beslenme ve Sağlık Durumu. Hacettepe Beslenme ve Diyetetik Günleri, II. Mezuniyet Sonrası Eğitim Kursu, 2009, 13-22, Ankara.
Scherz, H. And Senser, F., 1989.Food Composition and Nutrition Tables, ISBN:3-8047-0833-1Wissenschaftliche Verlagsgesellschaft mbH, Postfach 40,D-7000 Stuttgart 1,Printed Germany.
Singh H, Mishra D, Nahar NM. Energy use pattern in production agriculture of a typical village in Arid Zone India-Part I. Energy Convers Manage 2002.
Top,T.B. and UÇUM,İ. 2011. Durum ve Tahmin Ayçiçeği ve Soya 2011/2012. Tarımsal Ekonomi ve Politika Geliştirme Enstitüsü, TEPGE YAYIN NO: 199,ISBN: 978-975-407-339-3 ISSN: 1304-3803.

48
ANNEXES
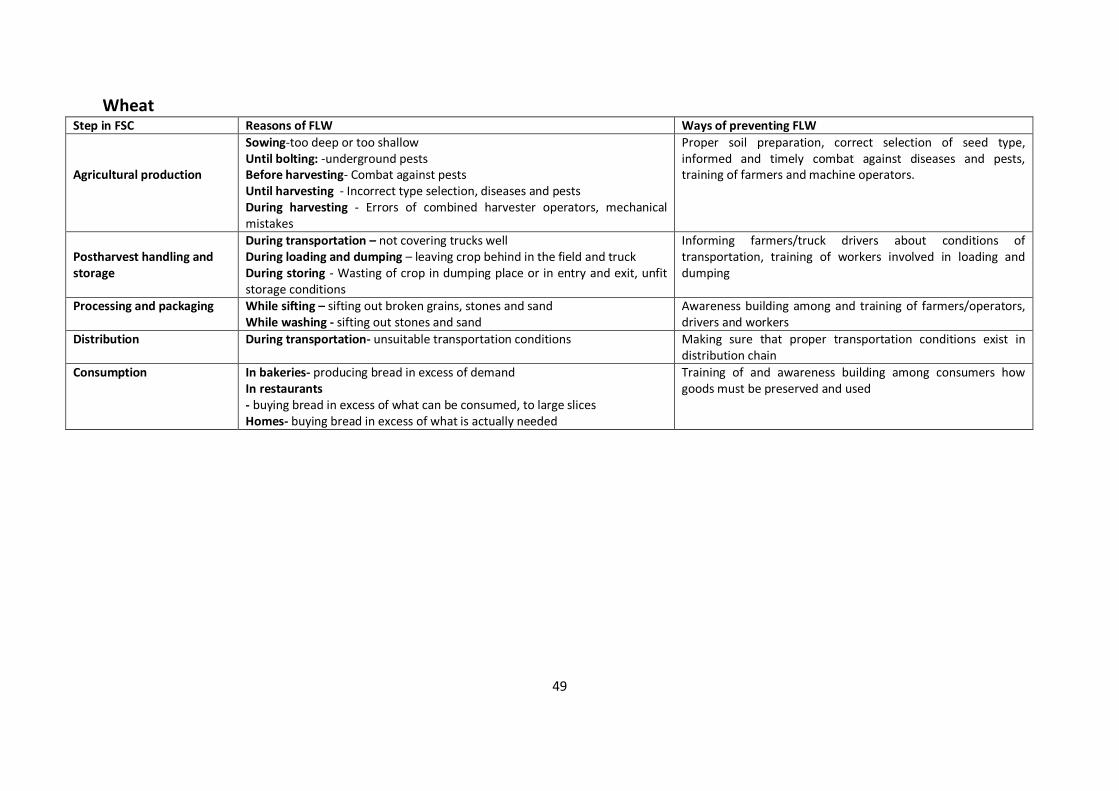
49
Wheat Step in FSC Reasons of FLW Ways of preventing FLW
Agricultural production
Sowing-too deep or too shallow Until bolting: -underground pests Before harvesting- Combat against pests Until harvesting - Incorrect type selection, diseases and pests During harvesting - Errors of combined harvester operators, mechanical mistakes
Proper soil preparation, correct selection of seed type, informed and timely combat against diseases and pests, training of farmers and machine operators.
Postharvest handling and storage
During transportation – not covering trucks well During loading and dumping – leaving crop behind in the field and truck During storing - Wasting of crop in dumping place or in entry and exit, unfit storage conditions
Informing farmers/truck drivers about conditions of transportation, training of workers involved in loading and dumping
Processing and packaging While sifting – sifting out broken grains, stones and sand While washing - sifting out stones and sand
Awareness building among and training of farmers/operators, drivers and workers
Distribution During transportation- unsuitable transportation conditions Making sure that proper transportation conditions exist in distribution chain
Consumption In bakeries- producing bread in excess of demand In restaurants - buying bread in excess of what can be consumed, to large slices Homes- buying bread in excess of what is actually needed
Training of and awareness building among consumers how goods must be preserved and used
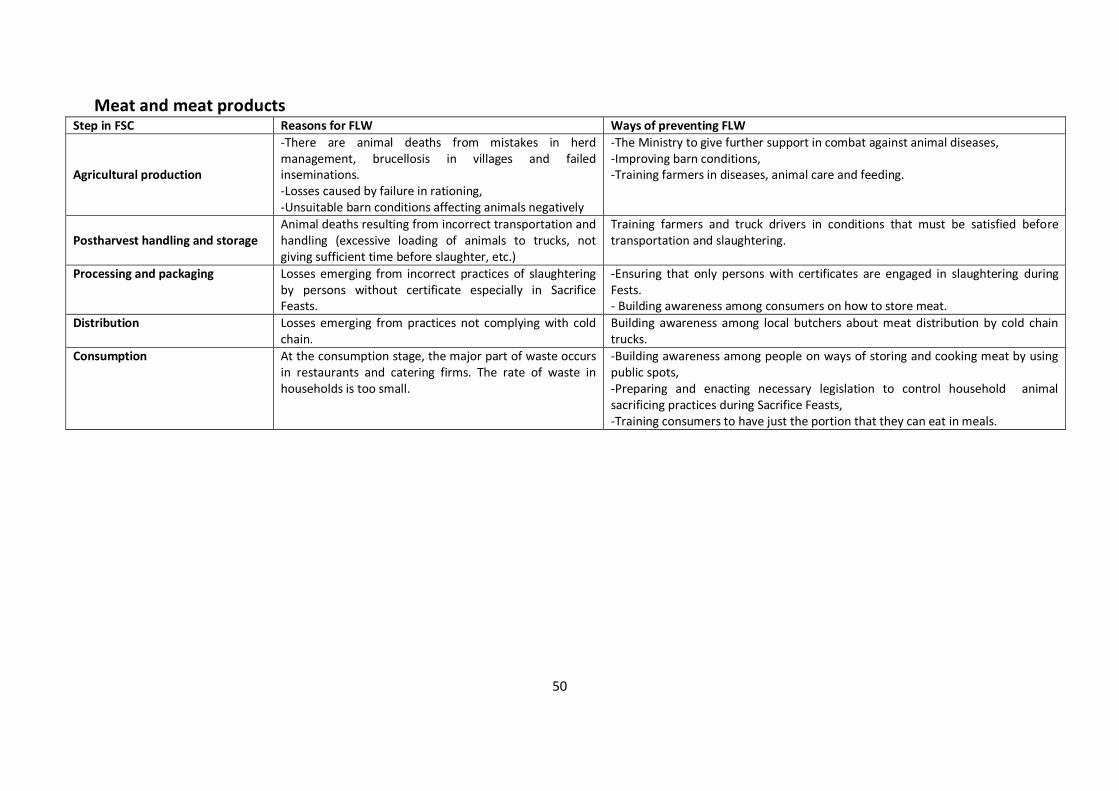
50
Meat and meat products Step in FSC Reasons for FLW Ways of preventing FLW
Agricultural production
-There are animal deaths from mistakes in herd management, brucellosis in villages and failed inseminations. -Losses caused by failure in rationing, -Unsuitable barn conditions affecting animals negatively
-The Ministry to give further support in combat against animal diseases, -Improving barn conditions, -Training farmers in diseases, animal care and feeding.
Postharvest handling and storage
Animal deaths resulting from incorrect transportation and handling (excessive loading of animals to trucks, not giving sufficient time before slaughter, etc.)
Training farmers and truck drivers in conditions that must be satisfied before transportation and slaughtering.
Processing and packaging Losses emerging from incorrect practices of slaughtering by persons without certificate especially in Sacrifice Feasts.
-Ensuring that only persons with certificates are engaged in slaughtering during Fests. - Building awareness among consumers on how to store meat.
Distribution Losses emerging from practices not complying with cold chain.
Building awareness among local butchers about meat distribution by cold chain trucks.
Consumption At the consumption stage, the major part of waste occurs in restaurants and catering firms. The rate of waste in households is too small.
-Building awareness among people on ways of storing and cooking meat by using public spots, -Preparing and enacting necessary legislation to control household animal sacrificing practices during Sacrifice Feasts, -Training consumers to have just the portion that they can eat in meals.
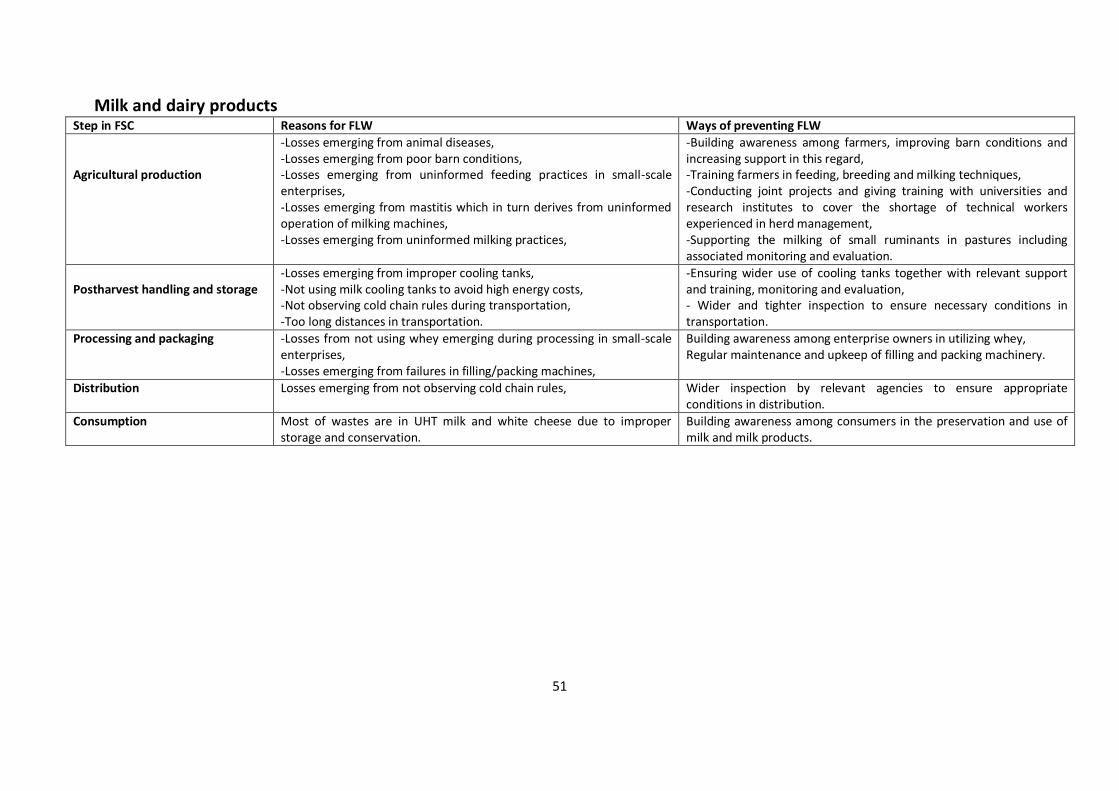
51
Milk and dairy products Step in FSC Reasons for FLW Ways of preventing FLW
Agricultural production
-Losses emerging from animal diseases, -Losses emerging from poor barn conditions, -Losses emerging from uninformed feeding practices in small-scale enterprises, -Losses emerging from mastitis which in turn derives from uninformed operation of milking machines, -Losses emerging from uninformed milking practices,
-Building awareness among farmers, improving barn conditions and increasing support in this regard, -Training farmers in feeding, breeding and milking techniques, -Conducting joint projects and giving training with universities and research institutes to cover the shortage of technical workers experienced in herd management, -Supporting the milking of small ruminants in pastures including associated monitoring and evaluation.
Postharvest handling and storage
-Losses emerging from improper cooling tanks, -Not using milk cooling tanks to avoid high energy costs, -Not observing cold chain rules during transportation, -Too long distances in transportation.
-Ensuring wider use of cooling tanks together with relevant support and training, monitoring and evaluation, - Wider and tighter inspection to ensure necessary conditions in transportation.
Processing and packaging -Losses from not using whey emerging during processing in small-scale enterprises, -Losses emerging from failures in filling/packing machines,
Building awareness among enterprise owners in utilizing whey, Regular maintenance and upkeep of filling and packing machinery.
Distribution Losses emerging from not observing cold chain rules, Wider inspection by relevant agencies to ensure appropriate conditions in distribution.
Consumption Most of wastes are in UHT milk and white cheese due to improper storage and conservation.
Building awareness among consumers in the preservation and use of milk and milk products.
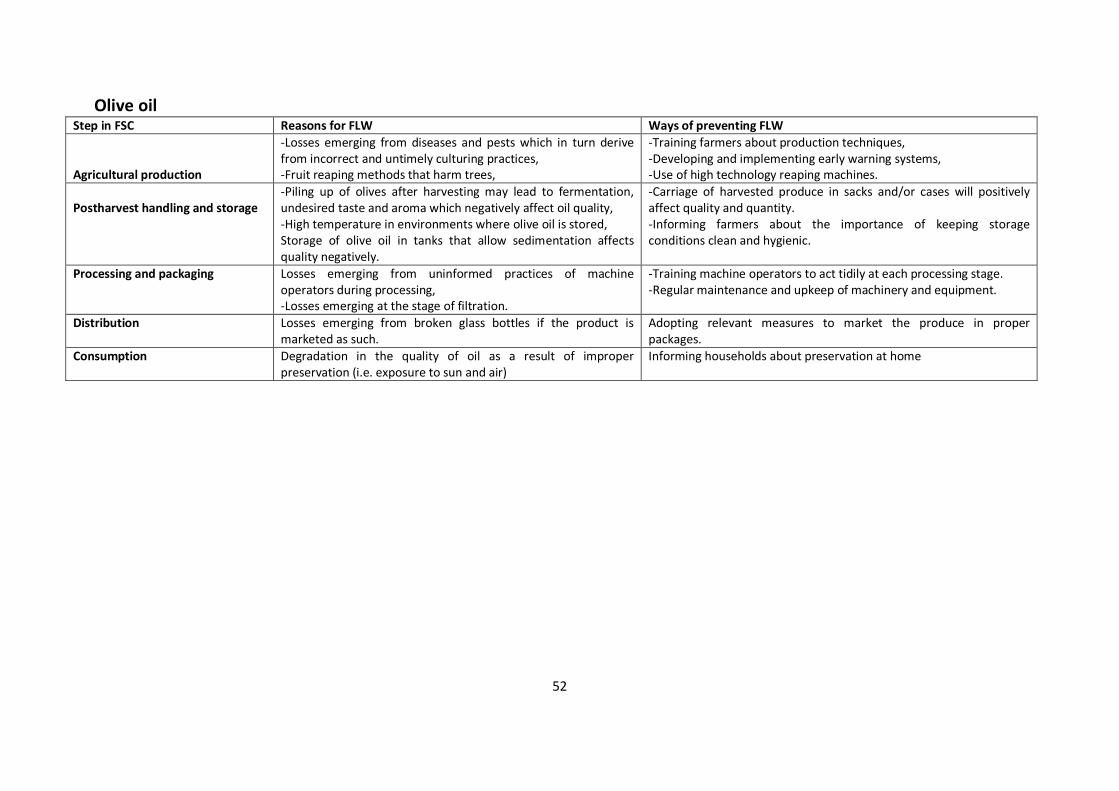
52
Olive oil Step in FSC Reasons for FLW Ways of preventing FLW
Agricultural production
-Losses emerging from diseases and pests which in turn derive from incorrect and untimely culturing practices, -Fruit reaping methods that harm trees,
-Training farmers about production techniques, -Developing and implementing early warning systems, -Use of high technology reaping machines.
Postharvest handling and storage
-Piling up of olives after harvesting may lead to fermentation, undesired taste and aroma which negatively affect oil quality, -High temperature in environments where olive oil is stored, Storage of olive oil in tanks that allow sedimentation affects quality negatively.
-Carriage of harvested produce in sacks and/or cases will positively affect quality and quantity. -Informing farmers about the importance of keeping storage conditions clean and hygienic.
Processing and packaging Losses emerging from uninformed practices of machine operators during processing, -Losses emerging at the stage of filtration.
-Training machine operators to act tidily at each processing stage. -Regular maintenance and upkeep of machinery and equipment.
Distribution Losses emerging from broken glass bottles if the product is marketed as such.
Adopting relevant measures to market the produce in proper packages.
Consumption Degradation in the quality of oil as a result of improper preservation (i.e. exposure to sun and air)
Informing households about preservation at home
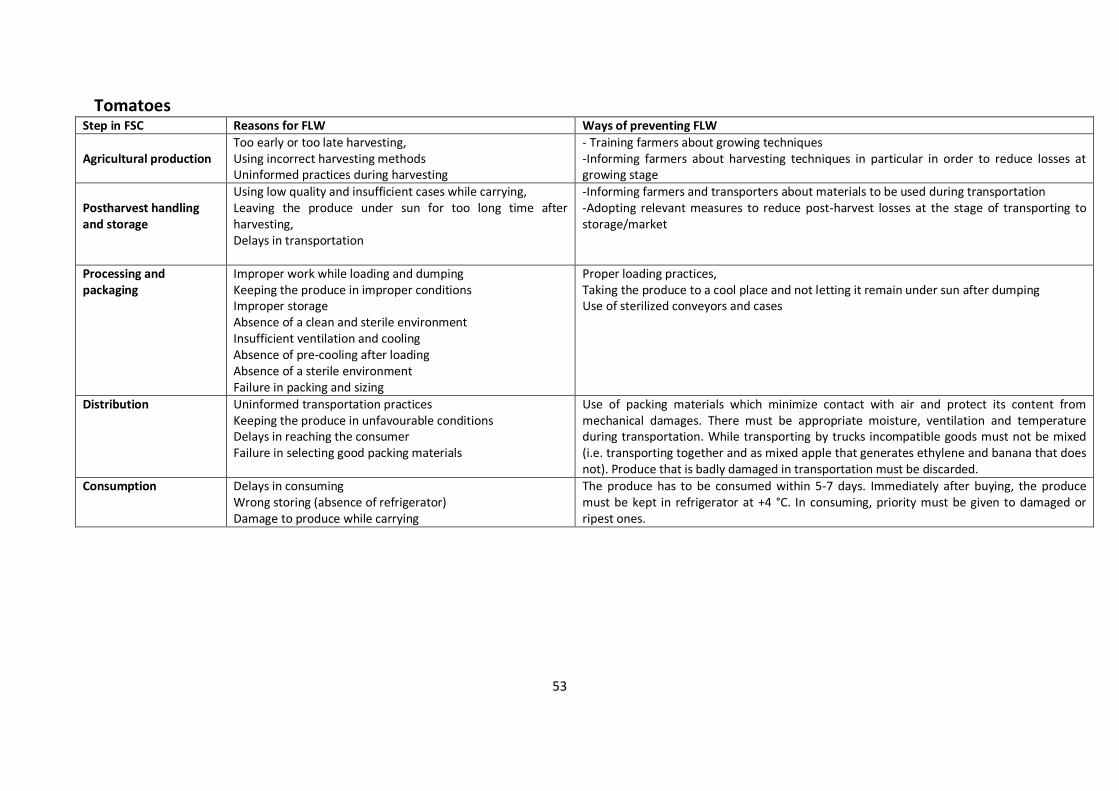
53
Tomatoes Step in FSC Reasons for FLW Ways of preventing FLW
Agricultural production
Too early or too late harvesting, Using incorrect harvesting methods Uninformed practices during harvesting
- Training farmers about growing techniques -Informing farmers about harvesting techniques in particular in order to reduce losses at growing stage
Postharvest handling and storage
Using low quality and insufficient cases while carrying, Leaving the produce under sun for too long time after harvesting, Delays in transportation
-Informing farmers and transporters about materials to be used during transportation -Adopting relevant measures to reduce post-harvest losses at the stage of transporting to storage/market
Processing and packaging
Improper work while loading and dumping Keeping the produce in improper conditions Improper storage Absence of a clean and sterile environment Insufficient ventilation and cooling Absence of pre-cooling after loading Absence of a sterile environment Failure in packing and sizing
Proper loading practices, Taking the produce to a cool place and not letting it remain under sun after dumping Use of sterilized conveyors and cases
Distribution Uninformed transportation practices Keeping the produce in unfavourable conditions Delays in reaching the consumer Failure in selecting good packing materials
Use of packing materials which minimize contact with air and protect its content from mechanical damages. There must be appropriate moisture, ventilation and temperature during transportation. While transporting by trucks incompatible goods must not be mixed (i.e. transporting together and as mixed apple that generates ethylene and banana that does not). Produce that is badly damaged in transportation must be discarded.
Consumption Delays in consuming Wrong storing (absence of refrigerator) Damage to produce while carrying
The produce has to be consumed within 5-7 days. Immediately after buying, the produce must be kept in refrigerator at +4 °C. In consuming, priority must be given to damaged or ripest ones.
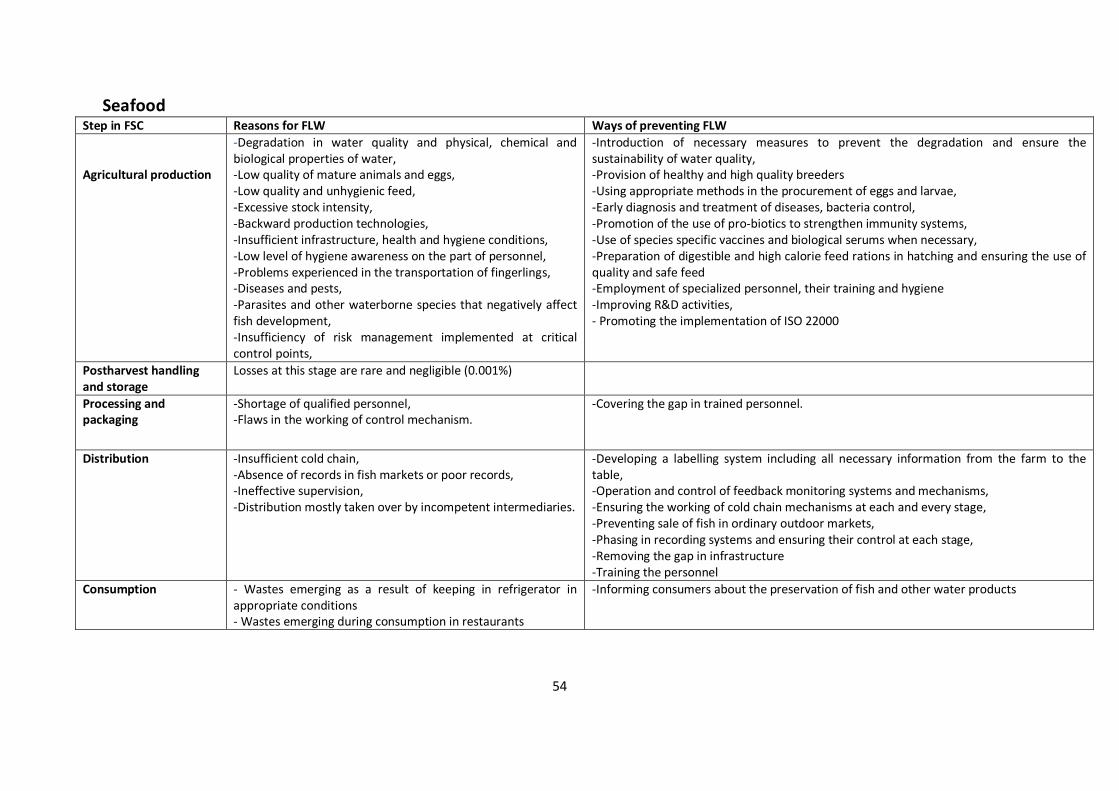
54
Seafood Step in FSC Reasons for FLW Ways of preventing FLW
Agricultural production
-Degradation in water quality and physical, chemical and biological properties of water, -Low quality of mature animals and eggs, -Low quality and unhygienic feed, -Excessive stock intensity, -Backward production technologies, -Insufficient infrastructure, health and hygiene conditions, -Low level of hygiene awareness on the part of personnel, -Problems experienced in the transportation of fingerlings, -Diseases and pests, -Parasites and other waterborne species that negatively affect fish development, -Insufficiency of risk management implemented at critical control points,
-Introduction of necessary measures to prevent the degradation and ensure the sustainability of water quality, -Provision of healthy and high quality breeders -Using appropriate methods in the procurement of eggs and larvae, -Early diagnosis and treatment of diseases, bacteria control, -Promotion of the use of pro-biotics to strengthen immunity systems, -Use of species specific vaccines and biological serums when necessary, -Preparation of digestible and high calorie feed rations in hatching and ensuring the use of quality and safe feed -Employment of specialized personnel, their training and hygiene -Improving R&D activities, - Promoting the implementation of ISO 22000
Postharvest handling and storage
Losses at this stage are rare and negligible (0.001%)
Processing and packaging
-Shortage of qualified personnel, -Flaws in the working of control mechanism.
-Covering the gap in trained personnel.
Distribution -Insufficient cold chain, -Absence of records in fish markets or poor records, -Ineffective supervision, -Distribution mostly taken over by incompetent intermediaries.
-Developing a labelling system including all necessary information from the farm to the table, -Operation and control of feedback monitoring systems and mechanisms, -Ensuring the working of cold chain mechanisms at each and every stage, -Preventing sale of fish in ordinary outdoor markets, -Phasing in recording systems and ensuring their control at each stage, -Removing the gap in infrastructure -Training the personnel
Consumption - Wastes emerging as a result of keeping in refrigerator in appropriate conditions - Wastes emerging during consumption in restaurants
-Informing consumers about the preservation of fish and other water products
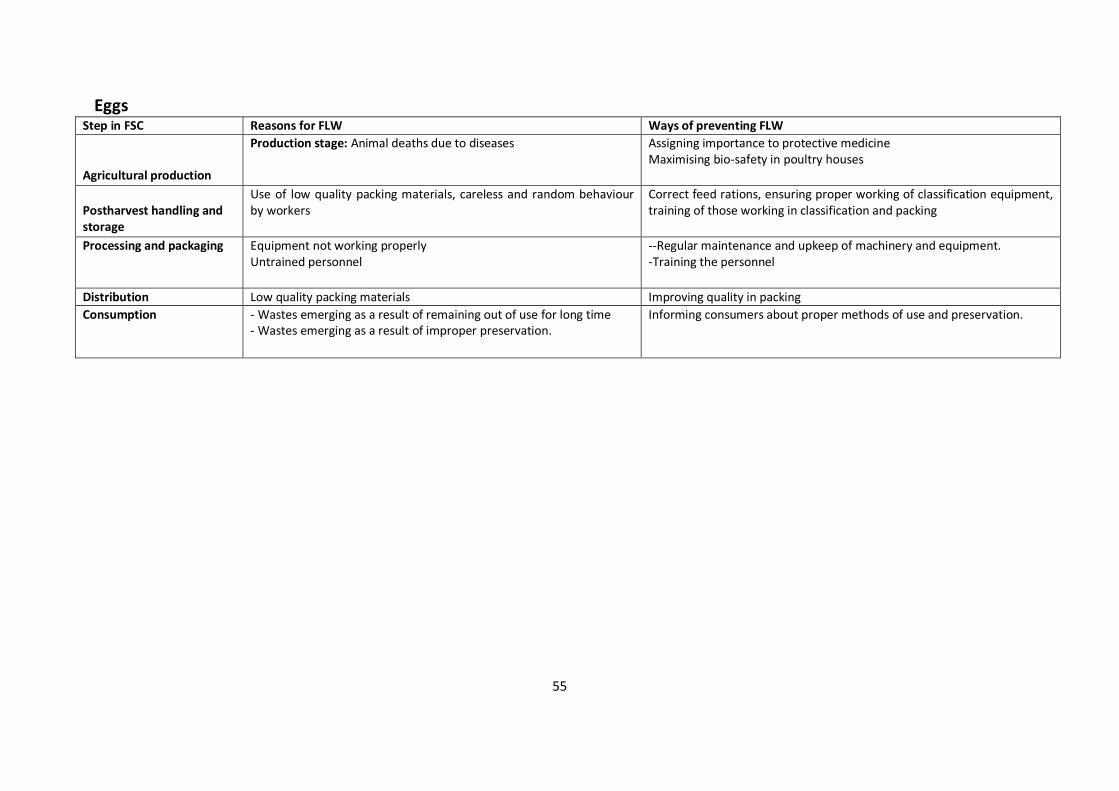
55
Eggs Step in FSC Reasons for FLW Ways of preventing FLW
Agricultural production
Production stage: Animal deaths due to diseases Assigning importance to protective medicine Maximising bio-safety in poultry houses
Postharvest handling and storage
Use of low quality packing materials, careless and random behaviour by workers
Correct feed rations, ensuring proper working of classification equipment, training of those working in classification and packing
Processing and packaging Equipment not working properly Untrained personnel
--Regular maintenance and upkeep of machinery and equipment. -Training the personnel
Distribution Low quality packing materials Improving quality in packing
Consumption - Wastes emerging as a result of remaining out of use for long time - Wastes emerging as a result of improper preservation.
Informing consumers about proper methods of use and preservation.
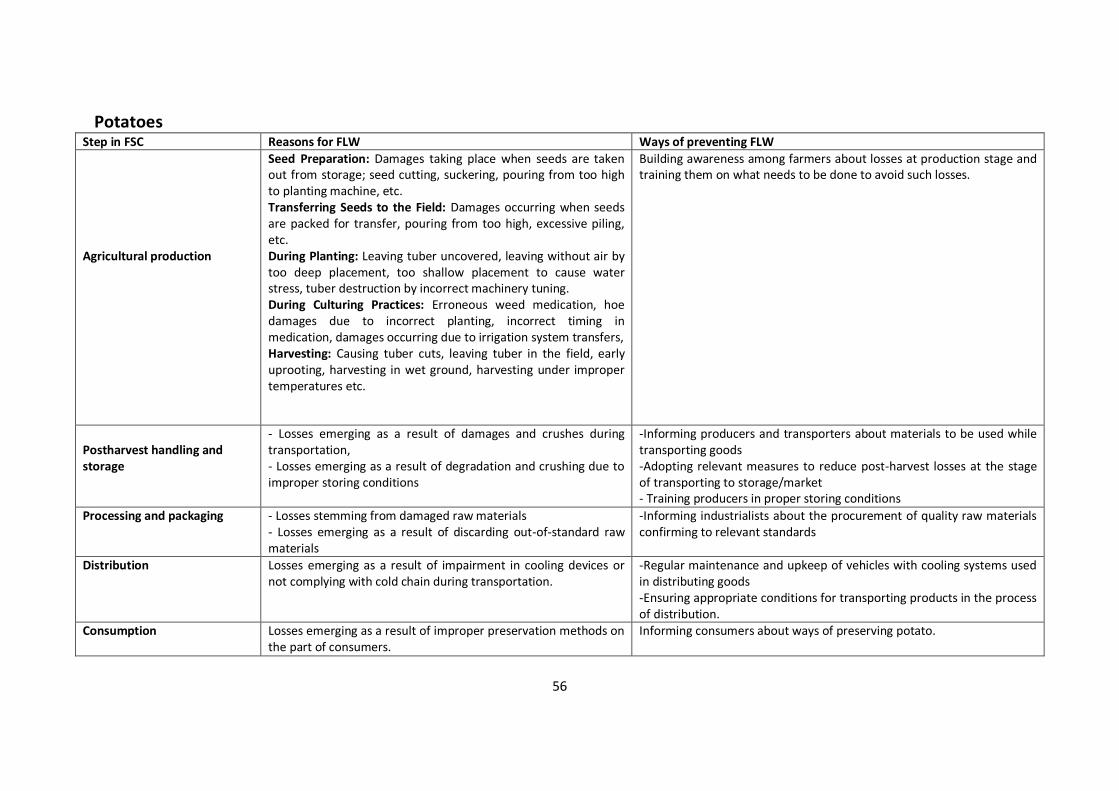
56
Potatoes Step in FSC Reasons for FLW Ways of preventing FLW
Agricultural production
Seed Preparation: Damages taking place when seeds are taken out from storage; seed cutting, suckering, pouring from too high to planting machine, etc. Transferring Seeds to the Field: Damages occurring when seeds are packed for transfer, pouring from too high, excessive piling, etc. During Planting: Leaving tuber uncovered, leaving without air by too deep placement, too shallow placement to cause water stress, tuber destruction by incorrect machinery tuning. During Culturing Practices: Erroneous weed medication, hoe damages due to incorrect planting, incorrect timing in medication, damages occurring due to irrigation system transfers, Harvesting: Causing tuber cuts, leaving tuber in the field, early uprooting, harvesting in wet ground, harvesting under improper temperatures etc.
Building awareness among farmers about losses at production stage and training them on what needs to be done to avoid such losses.
Postharvest handling and storage
- Losses emerging as a result of damages and crushes during transportation, - Losses emerging as a result of degradation and crushing due to improper storing conditions
-Informing producers and transporters about materials to be used while transporting goods -Adopting relevant measures to reduce post-harvest losses at the stage of transporting to storage/market - Training producers in proper storing conditions
Processing and packaging - Losses stemming from damaged raw materials - Losses emerging as a result of discarding out-of-standard raw materials
-Informing industrialists about the procurement of quality raw materials confirming to relevant standards
Distribution Losses emerging as a result of impairment in cooling devices or not complying with cold chain during transportation.
-Regular maintenance and upkeep of vehicles with cooling systems used in distributing goods -Ensuring appropriate conditions for transporting products in the process of distribution.
Consumption Losses emerging as a result of improper preservation methods on the part of consumers.
Informing consumers about ways of preserving potato.
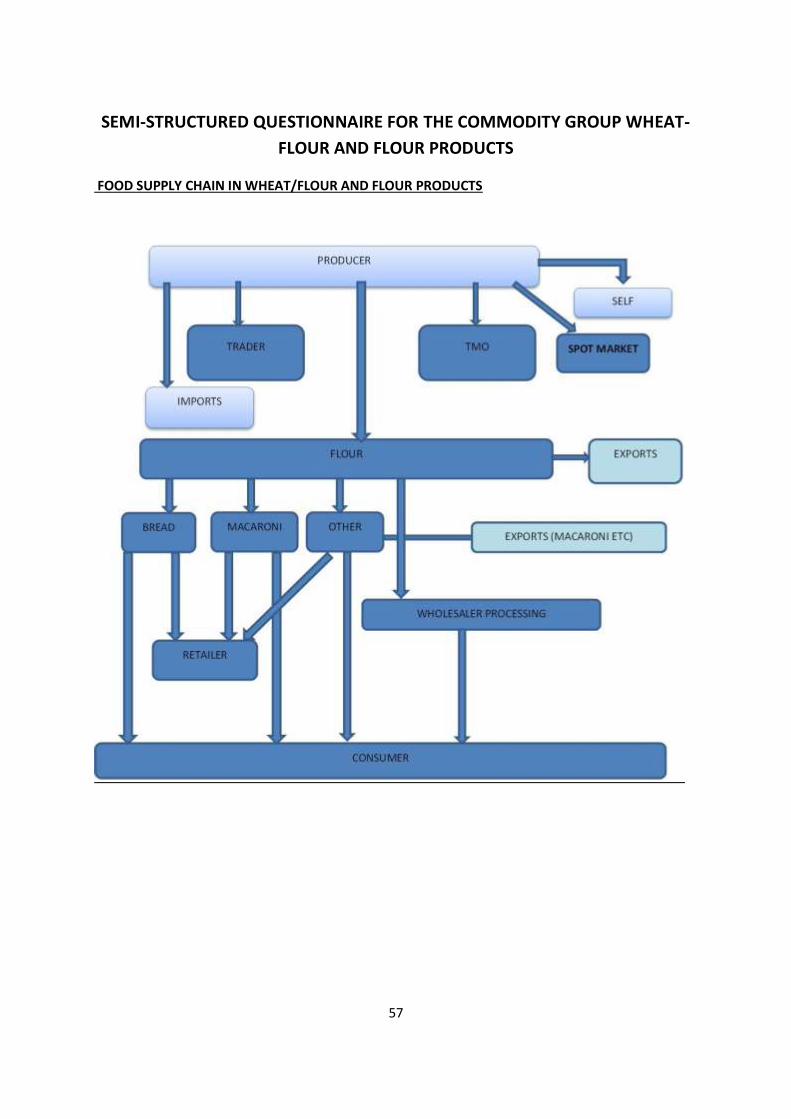
57
SEMI-STRUCTURED QUESTIONNAIRE FOR THE COMMODITY GROUP WHEAT-
FLOUR AND FLOUR PRODUCTS
FOOD SUPPLY CHAIN IN WHEAT/FLOUR AND FLOUR PRODUCTS
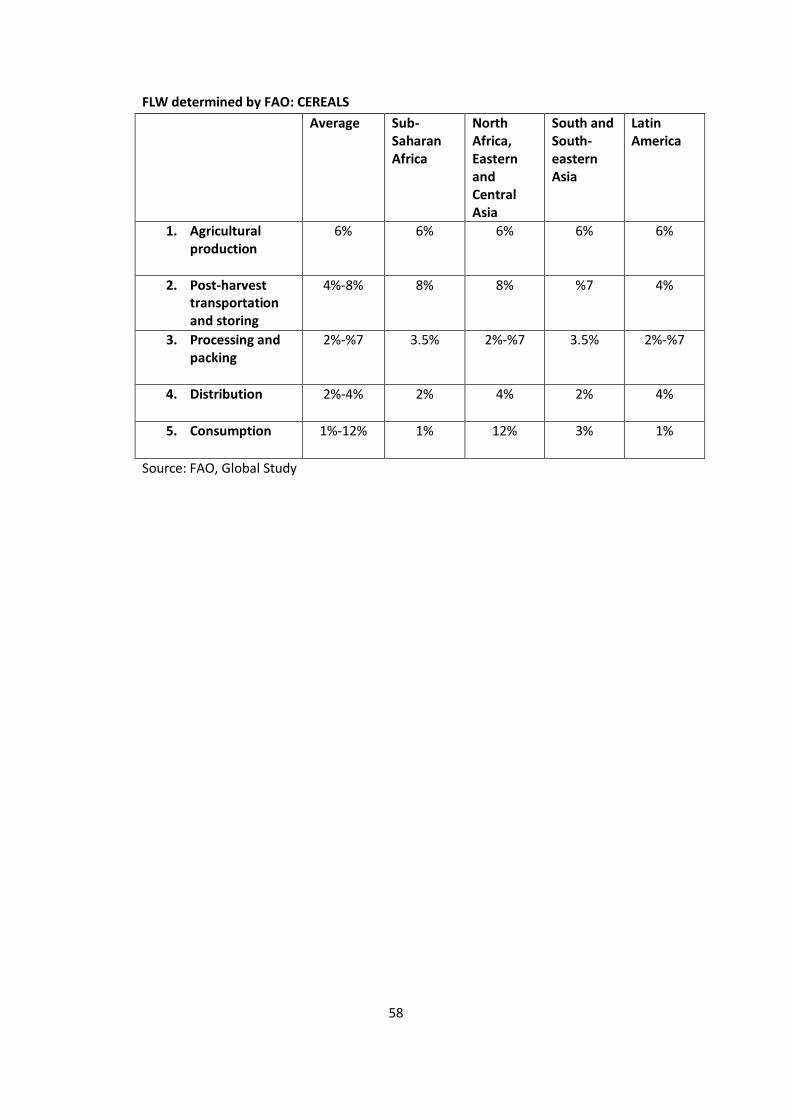
58
FLW determined by FAO: CEREALS
Average Sub-Saharan Africa
North Africa, Eastern and Central Asia
South and South-eastern Asia
Latin America
1. Agricultural production
6% 6% 6% 6% 6%
2. Post-harvest transportation and storing
4%-8% 8% 8% %7 4%
3. Processing and packing
2%-%7 3.5% 2%-%7 3.5% 2%-%7
4. Distribution
2%-4% 2% 4% 2% 4%
5. Consumption
1%-12% 1% 12% 3% 1%
Source: FAO, Global Study
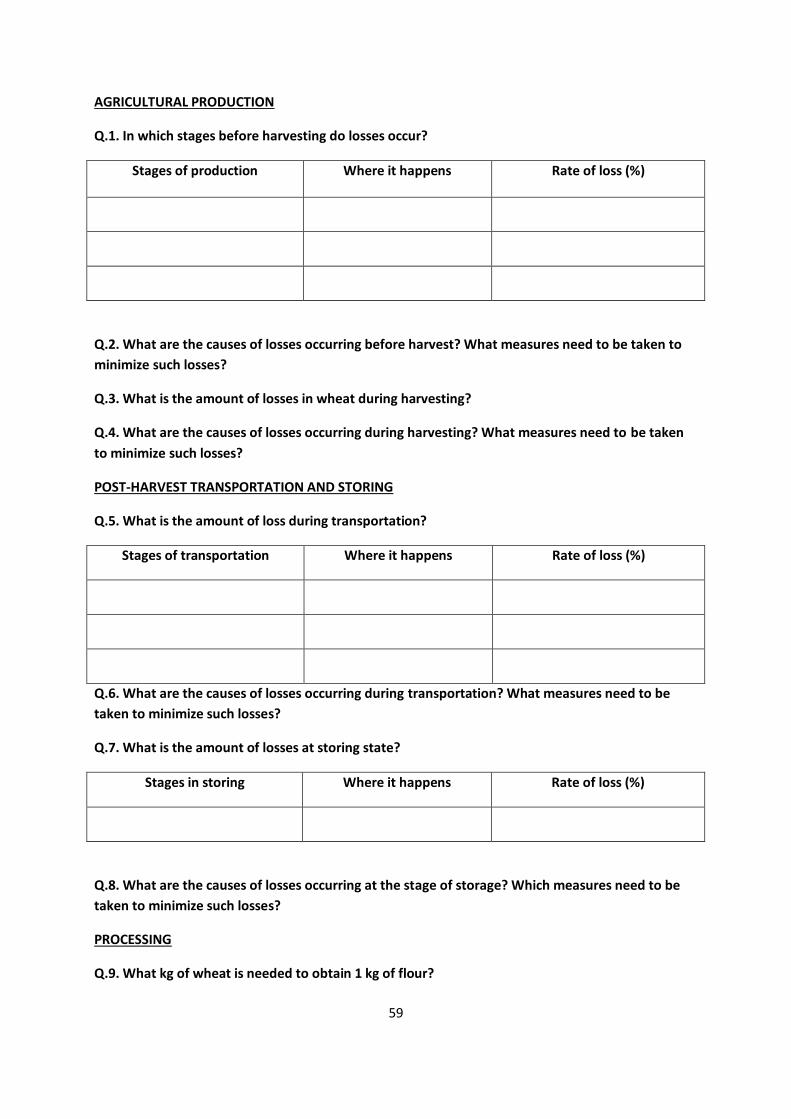
59
AGRICULTURAL PRODUCTION
Q.1. In which stages before harvesting do losses occur?
Stages of production Where it happens Rate of loss (%)
Q.2. What are the causes of losses occurring before harvest? What measures need to be taken to
minimize such losses?
Q.3. What is the amount of losses in wheat during harvesting?
Q.4. What are the causes of losses occurring during harvesting? What measures need to be taken
to minimize such losses?
POST-HARVEST TRANSPORTATION AND STORING
Q.5. What is the amount of loss during transportation?
Stages of transportation Where it happens Rate of loss (%)
Q.6. What are the causes of losses occurring during transportation? What measures need to be
taken to minimize such losses?
Q.7. What is the amount of losses at storing state?
Stages in storing Where it happens Rate of loss (%)
Q.8. What are the causes of losses occurring at the stage of storage? Which measures need to be
taken to minimize such losses?
PROCESSING
Q.9. What kg of wheat is needed to obtain 1 kg of flour?
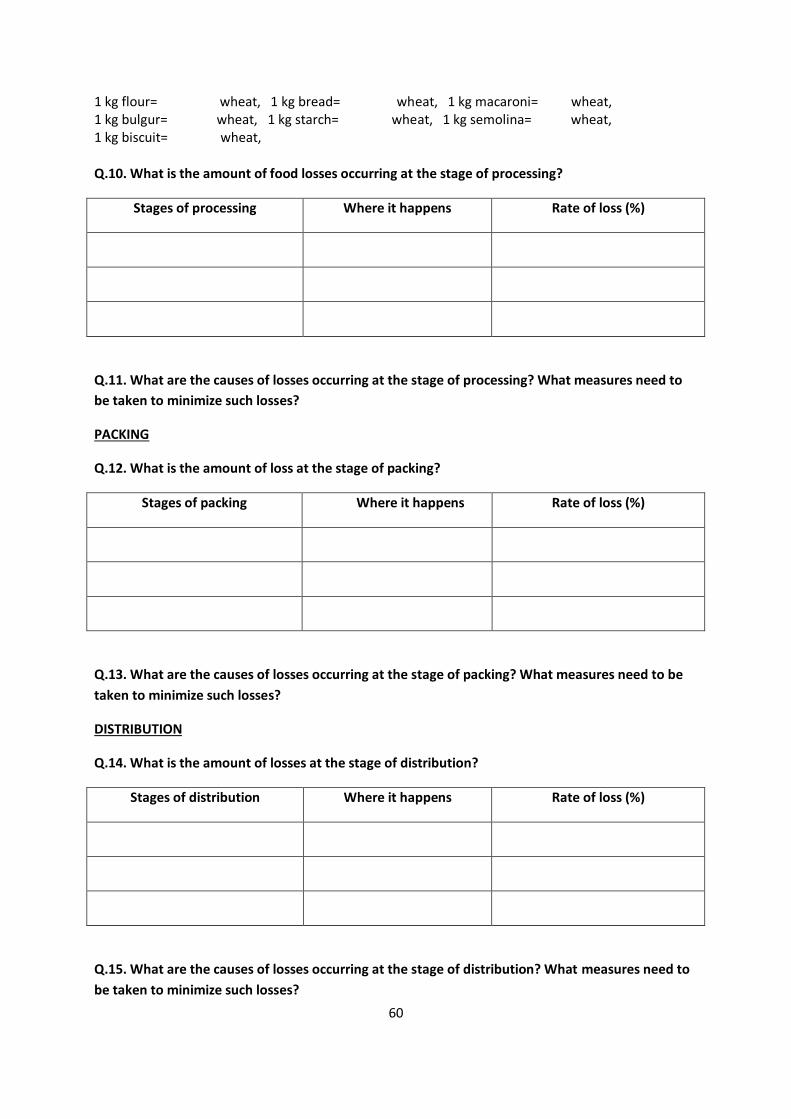
60
1 kg flour= wheat, 1 kg bread= wheat, 1 kg macaroni= wheat, 1 kg bulgur= wheat, 1 kg starch= wheat, 1 kg semolina= wheat, 1 kg biscuit= wheat, Q.10. What is the amount of food losses occurring at the stage of processing?
Stages of processing Where it happens Rate of loss (%)
Q.11. What are the causes of losses occurring at the stage of processing? What measures need to
be taken to minimize such losses?
PACKING
Q.12. What is the amount of loss at the stage of packing?
Stages of packing Where it happens Rate of loss (%)
Q.13. What are the causes of losses occurring at the stage of packing? What measures need to be
taken to minimize such losses?
DISTRIBUTION
Q.14. What is the amount of losses at the stage of distribution?
Stages of distribution Where it happens Rate of loss (%)
Q.15. What are the causes of losses occurring at the stage of distribution? What measures need to
be taken to minimize such losses?

61
CONSUMPTION
Q.16. What is the amount of wastes in the process of consumption?
What happens in consumption Where it happens Rate of waste (%)
Q.17. What are the causes of wastes emerging in the process of consumption? What measures
need to be taken to minimize such wastes?
Q.18. Assess, in general, losses in food supply chain with respect to the following factors:
Resources and technology used Management-marketing and product development Market and management structure (value chain coordination-supply-logistics) Trade and taxation policies Food safety and quality standards Research, development and innovation Programmes and special policies related to food supply chair.
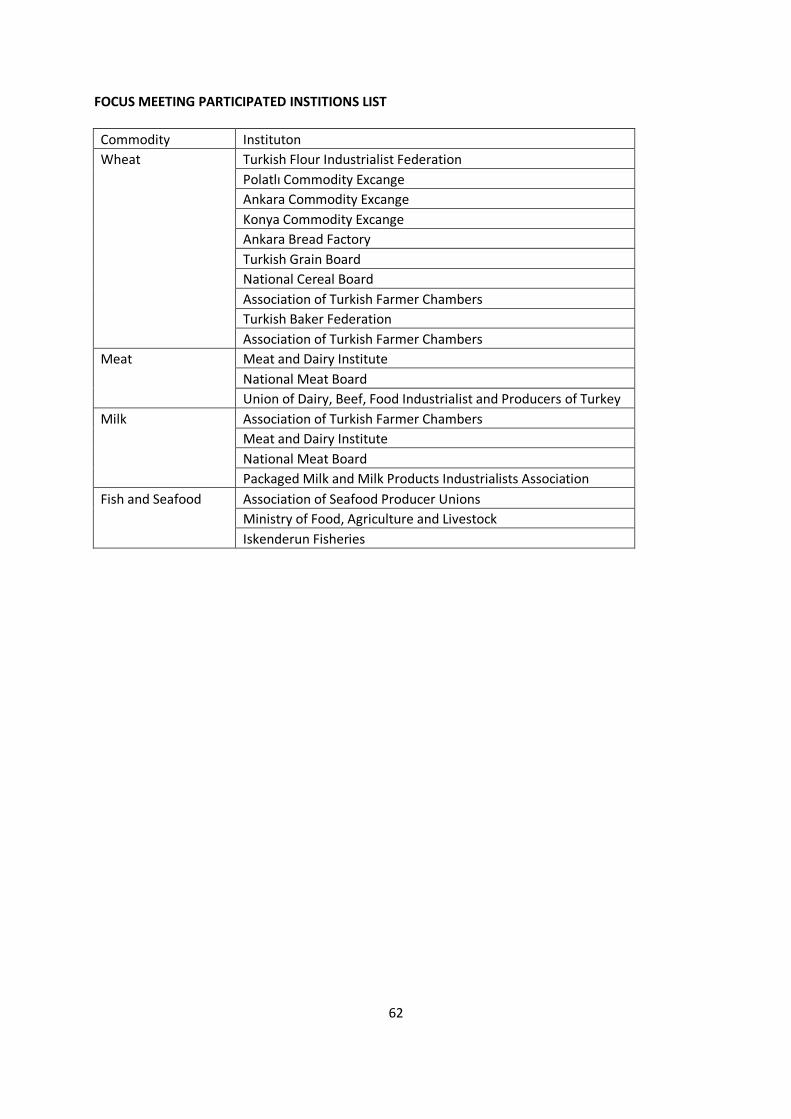
62
FOCUS MEETING PARTICIPATED INSTITIONS LIST
Commodity Instituton
Wheat Turkish Flour Industrialist Federation
Polatlı Commodity Excange
Ankara Commodity Excange
Konya Commodity Excange
Ankara Bread Factory
Turkish Grain Board
National Cereal Board
Association of Turkish Farmer Chambers
Turkish Baker Federation
Association of Turkish Farmer Chambers
Meat Meat and Dairy Institute
National Meat Board
Union of Dairy, Beef, Food Industrialist and Producers of Turkey
Milk Association of Turkish Farmer Chambers
Meat and Dairy Institute
National Meat Board
Packaged Milk and Milk Products Industrialists Association
Fish and Seafood Association of Seafood Producer Unions
Ministry of Food, Agriculture and Livestock
Iskenderun Fisheries
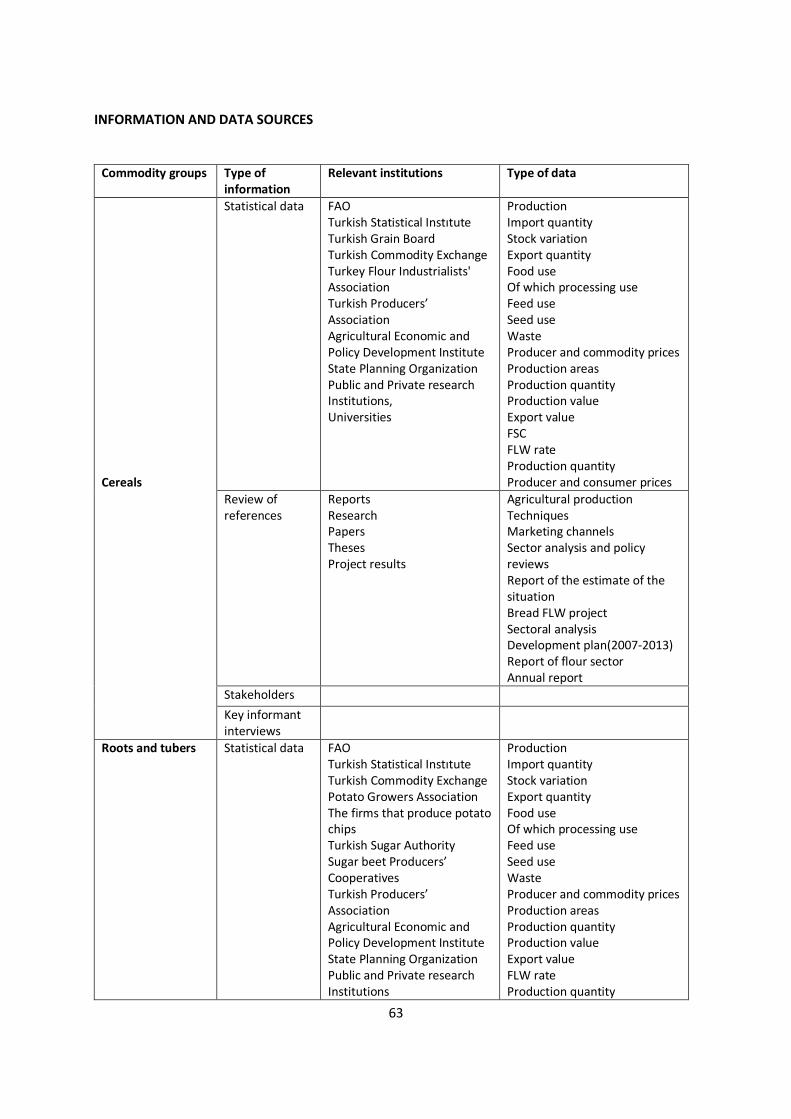
63
INFORMATION AND DATA SOURCES
Commodity groups Type of information
Relevant institutions Type of data
Cereals
Statistical data FAO Turkish Statistical Instıtute Turkish Grain Board Turkish Commodity Exchange Turkey Flour Industrialists' Association Turkish Producers’ Association Agricultural Economic and Policy Development Institute State Planning Organization Public and Private research Institutions, Universities
Production Import quantity Stock variation Export quantity Food use Of which processing use Feed use Seed use Waste Producer and commodity prices Production areas Production quantity Production value Export value FSC FLW rate Production quantity Producer and consumer prices
Review of references
Reports Research Papers Theses Project results
Agricultural production Techniques Marketing channels Sector analysis and policy reviews Report of the estimate of the situation Bread FLW project Sectoral analysis Development plan(2007-2013) Report of flour sector Annual report
Stakeholders Key informant interviews
Roots and tubers Statistical data FAO Turkish Statistical Instıtute Turkish Commodity Exchange Potato Growers Association The firms that produce potato chips Turkish Sugar Authority Sugar beet Producers’ Cooperatives Turkish Producers’ Association Agricultural Economic and Policy Development Institute State Planning Organization Public and Private research Institutions
Production Import quantity Stock variation Export quantity Food use Of which processing use Feed use Seed use Waste Producer and commodity prices Production areas Production quantity Production value Export value FLW rate Production quantity
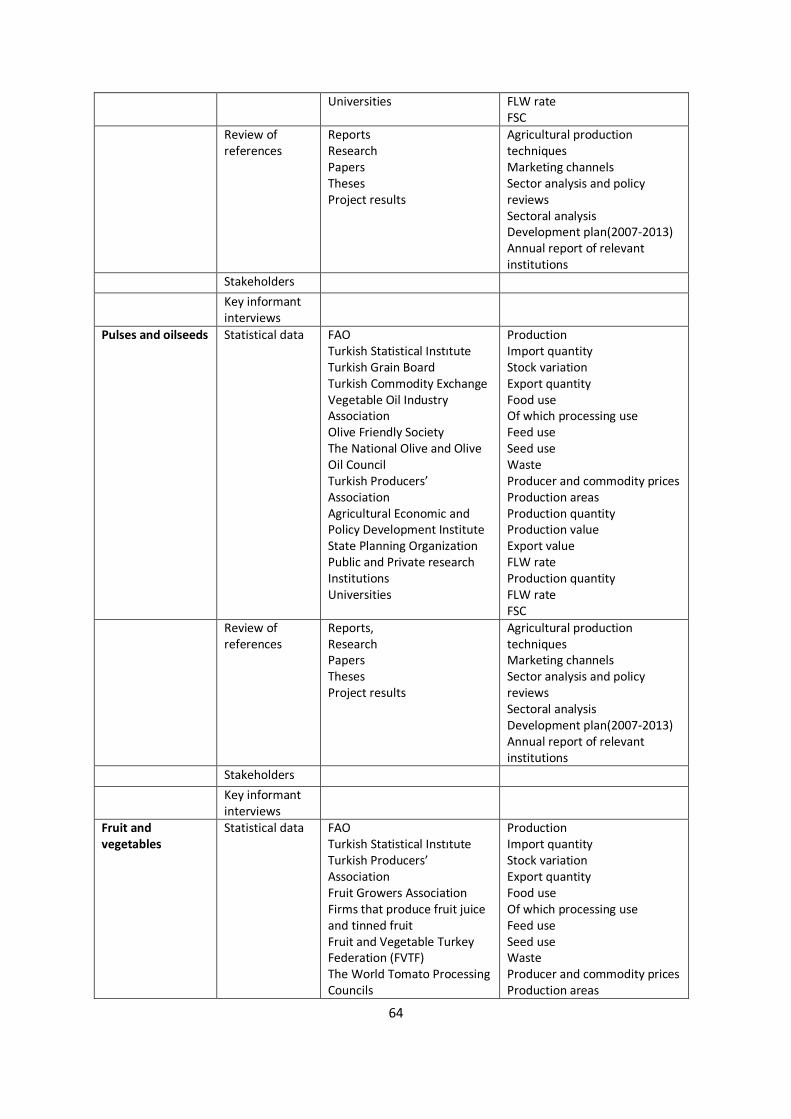
64
Universities FLW rate FSC
Review of references
Reports Research Papers Theses Project results
Agricultural production techniques Marketing channels Sector analysis and policy reviews Sectoral analysis Development plan(2007-2013) Annual report of relevant institutions
Stakeholders Key informant
interviews
Pulses and oilseeds Statistical data FAO Turkish Statistical Instıtute Turkish Grain Board Turkish Commodity Exchange Vegetable Oil Industry Association Olive Friendly Society The National Olive and Olive Oil Council Turkish Producers’ Association Agricultural Economic and Policy Development Institute State Planning Organization Public and Private research Institutions Universities
Production Import quantity Stock variation Export quantity Food use Of which processing use Feed use Seed use Waste Producer and commodity prices Production areas Production quantity Production value Export value FLW rate Production quantity FLW rate FSC
Review of references
Reports, Research Papers Theses Project results
Agricultural production techniques Marketing channels Sector analysis and policy reviews Sectoral analysis Development plan(2007-2013) Annual report of relevant institutions
Stakeholders Key informant
interviews
Fruit and vegetables
Statistical data FAO Turkish Statistical Instıtute Turkish Producers’ Association Fruit Growers Association Firms that produce fruit juice and tinned fruit Fruit and Vegetable Turkey Federation (FVTF) The World Tomato Processing Councils
Production Import quantity Stock variation Export quantity Food use Of which processing use Feed use Seed use Waste Producer and commodity prices Production areas
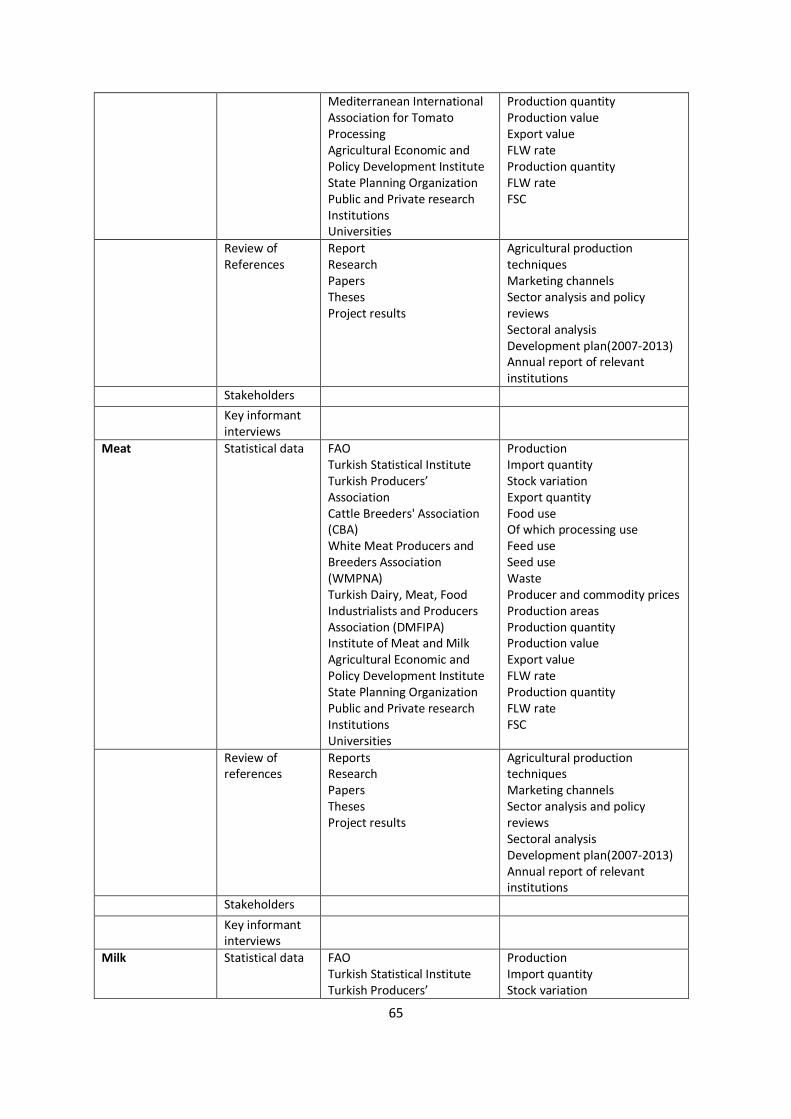
65
Mediterranean International Association for Tomato Processing Agricultural Economic and Policy Development Institute State Planning Organization Public and Private research Institutions Universities
Production quantity Production value Export value FLW rate Production quantity FLW rate FSC
Review of References
Report Research Papers Theses Project results
Agricultural production techniques Marketing channels Sector analysis and policy reviews Sectoral analysis Development plan(2007-2013) Annual report of relevant institutions
Stakeholders Key informant
interviews
Meat Statistical data FAO Turkish Statistical Institute Turkish Producers’ Association Cattle Breeders' Association (CBA) White Meat Producers and Breeders Association (WMPNA) Turkish Dairy, Meat, Food Industrialists and Producers Association (DMFIPA) Institute of Meat and Milk Agricultural Economic and Policy Development Institute State Planning Organization Public and Private research Institutions Universities
Production Import quantity Stock variation Export quantity Food use Of which processing use Feed use Seed use Waste Producer and commodity prices Production areas Production quantity Production value Export value FLW rate Production quantity FLW rate FSC
Review of references
Reports Research Papers Theses Project results
Agricultural production techniques Marketing channels Sector analysis and policy reviews Sectoral analysis Development plan(2007-2013) Annual report of relevant institutions
Stakeholders Key informant
interviews
Milk Statistical data FAO Turkish Statistical Institute Turkish Producers’
Production Import quantity Stock variation
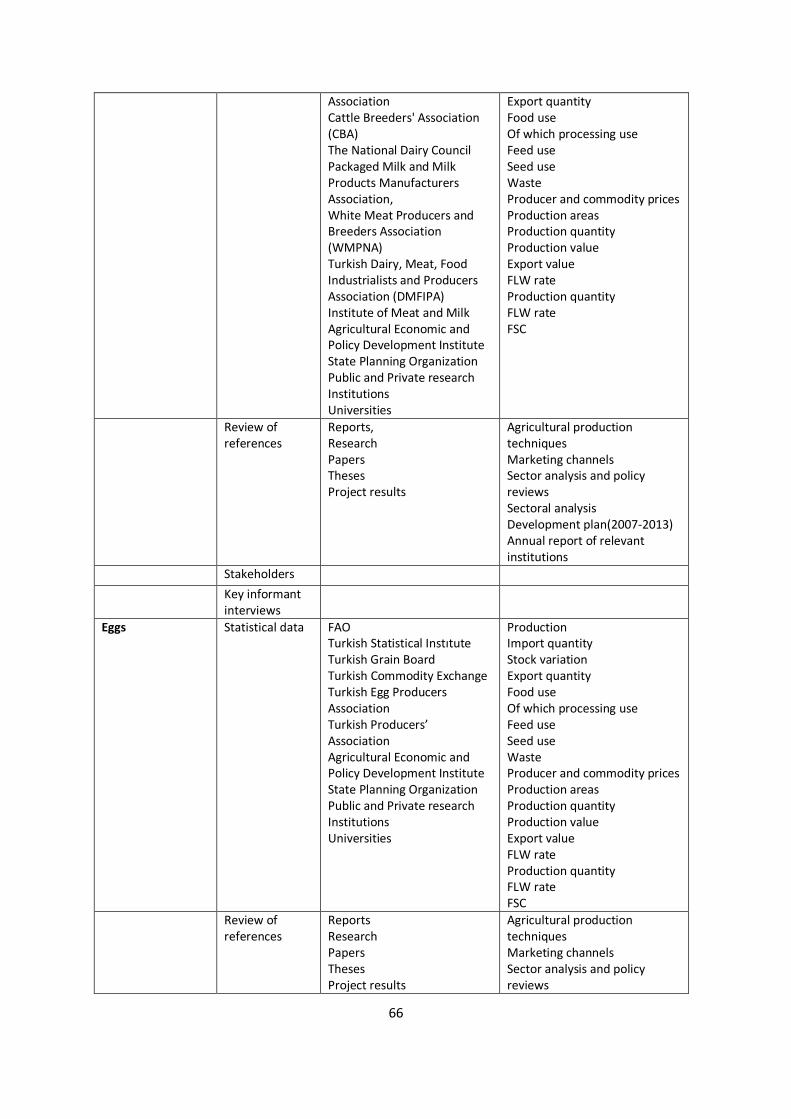
66
Association Cattle Breeders' Association (CBA) The National Dairy Council Packaged Milk and Milk Products Manufacturers Association, White Meat Producers and Breeders Association (WMPNA) Turkish Dairy, Meat, Food Industrialists and Producers Association (DMFIPA) Institute of Meat and Milk Agricultural Economic and Policy Development Institute State Planning Organization Public and Private research Institutions Universities
Export quantity Food use Of which processing use Feed use Seed use Waste Producer and commodity prices Production areas Production quantity Production value Export value FLW rate Production quantity FLW rate FSC
Review of references
Reports, Research Papers Theses Project results
Agricultural production techniques Marketing channels Sector analysis and policy reviews Sectoral analysis Development plan(2007-2013) Annual report of relevant institutions
Stakeholders Key informant
interviews
Eggs Statistical data FAO Turkish Statistical Instıtute Turkish Grain Board Turkish Commodity Exchange Turkish Egg Producers Association Turkish Producers’ Association Agricultural Economic and Policy Development Institute State Planning Organization Public and Private research Institutions Universities
Production Import quantity Stock variation Export quantity Food use Of which processing use Feed use Seed use Waste Producer and commodity prices Production areas Production quantity Production value Export value FLW rate Production quantity FLW rate FSC
Review of references
Reports Research Papers Theses Project results
Agricultural production techniques Marketing channels Sector analysis and policy reviews
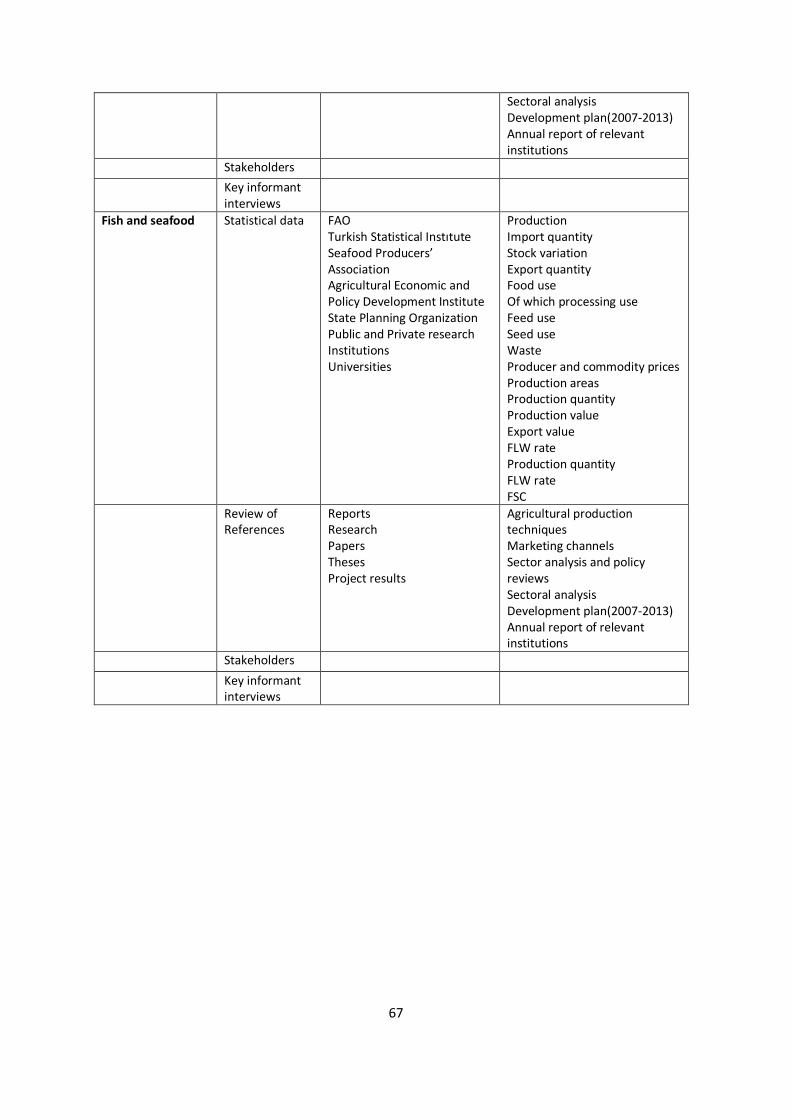
67
Sectoral analysis Development plan(2007-2013) Annual report of relevant institutions
Stakeholders Key informant
interviews
Fish and seafood Statistical data FAO Turkish Statistical Instıtute Seafood Producers’ Association Agricultural Economic and Policy Development Institute State Planning Organization Public and Private research Institutions Universities
Production Import quantity Stock variation Export quantity Food use Of which processing use Feed use Seed use Waste Producer and commodity prices Production areas Production quantity Production value Export value FLW rate Production quantity FLW rate FSC
Review of References
Reports Research Papers Theses Project results
Agricultural production techniques Marketing channels Sector analysis and policy reviews Sectoral analysis Development plan(2007-2013) Annual report of relevant institutions
Stakeholders Key informant
interviews