food security and livelihoods needs assessment
TRANSCRIPT
7/23/2019 Food Security and Livelihoods Needs Assessment
http://slidepdf.com/reader/full/food-security-and-livelihoods-needs-assessment 1/31
7/23/2019 Food Security and Livelihoods Needs Assessment
http://slidepdf.com/reader/full/food-security-and-livelihoods-needs-assessment 2/31
Food security and livelihoods needs assessment
1. Objectives of assessment and methodology used.
MEU
MEU
MEU
MEU

7/23/2019 Food Security and Livelihoods Needs Assessment
http://slidepdf.com/reader/full/food-security-and-livelihoods-needs-assessment 3/31
01.09.2013
Main objective:
The purpose of the assessment was to provide an overview of the food
security situation in areas with high refugee concentration, as well as to
assess current opportunities for livelihoods development to meet the
income needs of vulnerable Syrian refugee and Jordanian host communitypopulations.
FSLA needs assessment (May 2013)
Main objective

7/23/2019 Food Security and Livelihoods Needs Assessment
http://slidepdf.com/reader/full/food-security-and-livelihoods-needs-assessment 4/31
Dates for data collection: two weeks between 19 May and 2 June 2013.
Location: Mafraq, Irbid, Zarqa, Balqa, Ajloun and Jarash.
Tools used: Data collected at household level using structured interviews
with the household members. Key informants discussions were conducted to
evaluate the market systems including factors affecting pricing, access and
food availability, through key-informants interviews.
FSLA needs assessment (May 2013)
Methodology
01.09.2013

7/23/2019 Food Security and Livelihoods Needs Assessment
http://slidepdf.com/reader/full/food-security-and-livelihoods-needs-assessment 5/31
FSLA needs assessment (May 2013)
Methodology
Sample size:
• The sample size was calculated using sample size calculator
with error margin of 6% and confidence level of 95%.
•
A total of 80 households were interviewed in eachgovernorate, out of which 50% were Syrian and 50%
Jordanians.
• In total, 480 households were interviewed across all six
governorates.

7/23/2019 Food Security and Livelihoods Needs Assessment
http://slidepdf.com/reader/full/food-security-and-livelihoods-needs-assessment 6/31
Food security and livelihoods needs assessment
2. Profile of respondents
MEU
MEU
MEU
MEU
7/23/2019 Food Security and Livelihoods Needs Assessment
http://slidepdf.com/reader/full/food-security-and-livelihoods-needs-assessment 7/31
01.09.2013
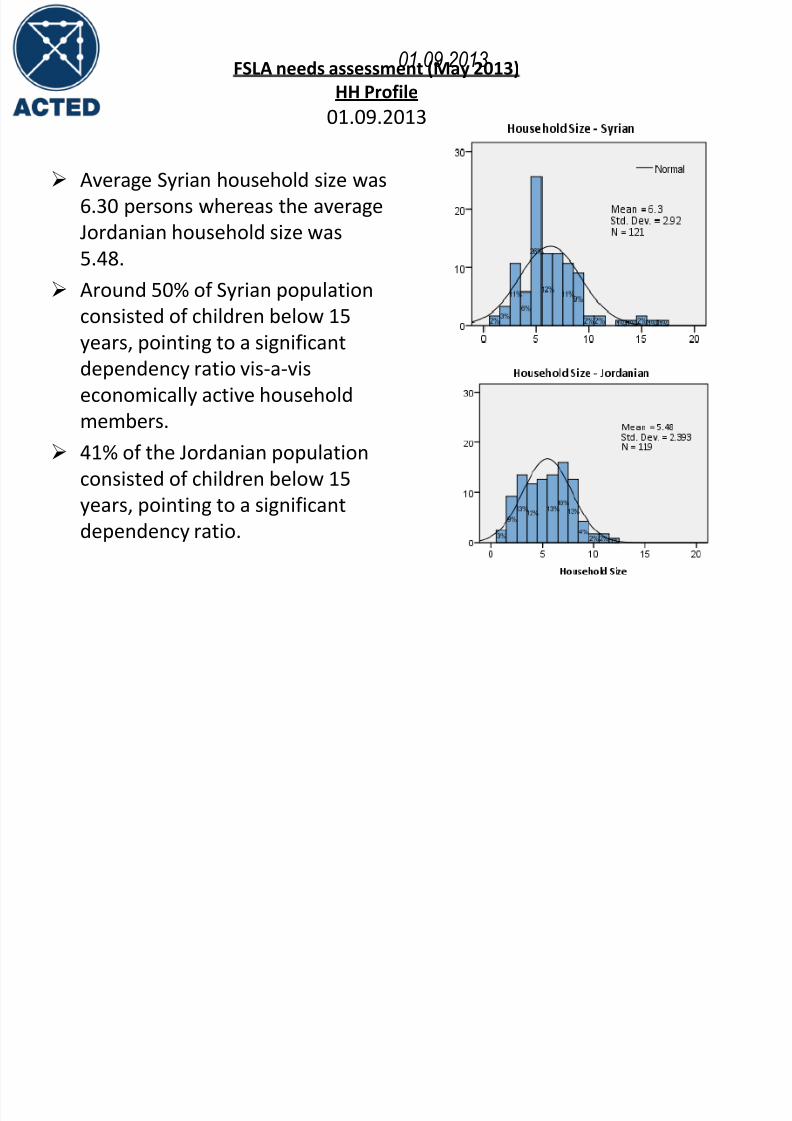
Average Syrian household size was
6.30 persons whereas the average
Jordanian household size was
5.48.
Around 50% of Syrian population
consisted of children below 15
years, pointing to a significant
dependency ratio vis-a-vis
economically active household
members.
41% of the Jordanian population
consisted of children below 15
years, pointing to a significant
dependency ratio.
FSLA needs assessment (May 2013)
HH Profile
01.09.2013

7/23/2019 Food Security and Livelihoods Needs Assessment
http://slidepdf.com/reader/full/food-security-and-livelihoods-needs-assessment 8/31
Food security and livelihoods needs assessment
3. Key economic indicators
MEUMEUMEUMEU
7/23/2019 Food Security and Livelihoods Needs Assessment
http://slidepdf.com/reader/full/food-security-and-livelihoods-needs-assessment 9/31
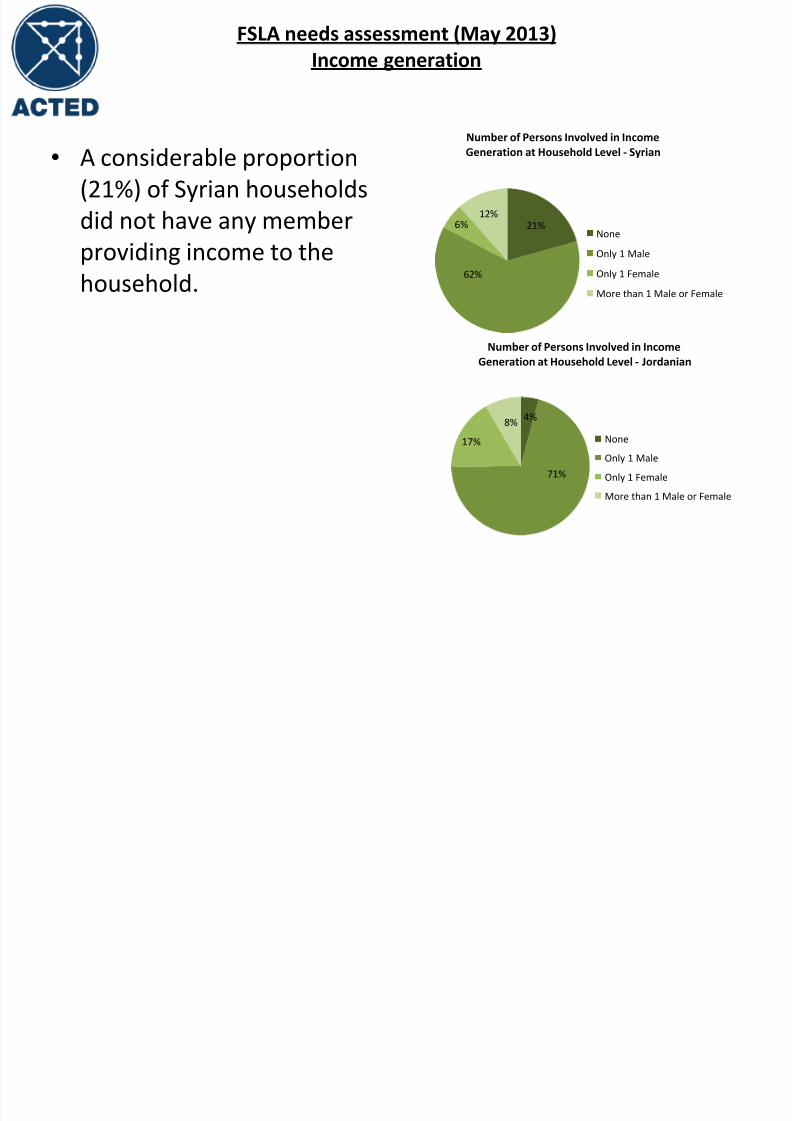
FSLA needs assessment (May 2013)
Income generation
• A considerable proportion
(21%) of Syrian households
did not have any member
providing income to the
household.
21%
62%
6%12%
Number of Persons Involved in IncomeGeneration at Household Level - Syrian
None
Only 1 Male
Only 1 Female
More than 1 Male or Female
4%
71%
17%
8%
Number of Persons Involved in Income
Generation at Household Level - Jordanian
None
Only 1 Male
Only 1 Female
More than 1 Male or Female
7/23/2019 Food Security and Livelihoods Needs Assessment
http://slidepdf.com/reader/full/food-security-and-livelihoods-needs-assessment 10/31
FSLA needs assessment (May 2013)
Income generation activities
• Syrian communities werehighly dependent onsupport received throughaid actors, such as WFP
vouchers, credit and loan,assistance by other NGOs orcharity, UNHCR cash grants,etc.
• Also, a considerable
proportion of Syrians wereearning income throughunskilled labour.
• Jordanians had moresustainable income sources.
• Skilled employment andsocial security funds were
prevalent occupation typesnoted among Jordanianrespondents.
• Unskilled labour remainedthe second most
widespread incomegeneration means for bothSyrians and Jordanians.
7/23/2019 Food Security and Livelihoods Needs Assessment
http://slidepdf.com/reader/full/food-security-and-livelihoods-needs-assessment 11/31
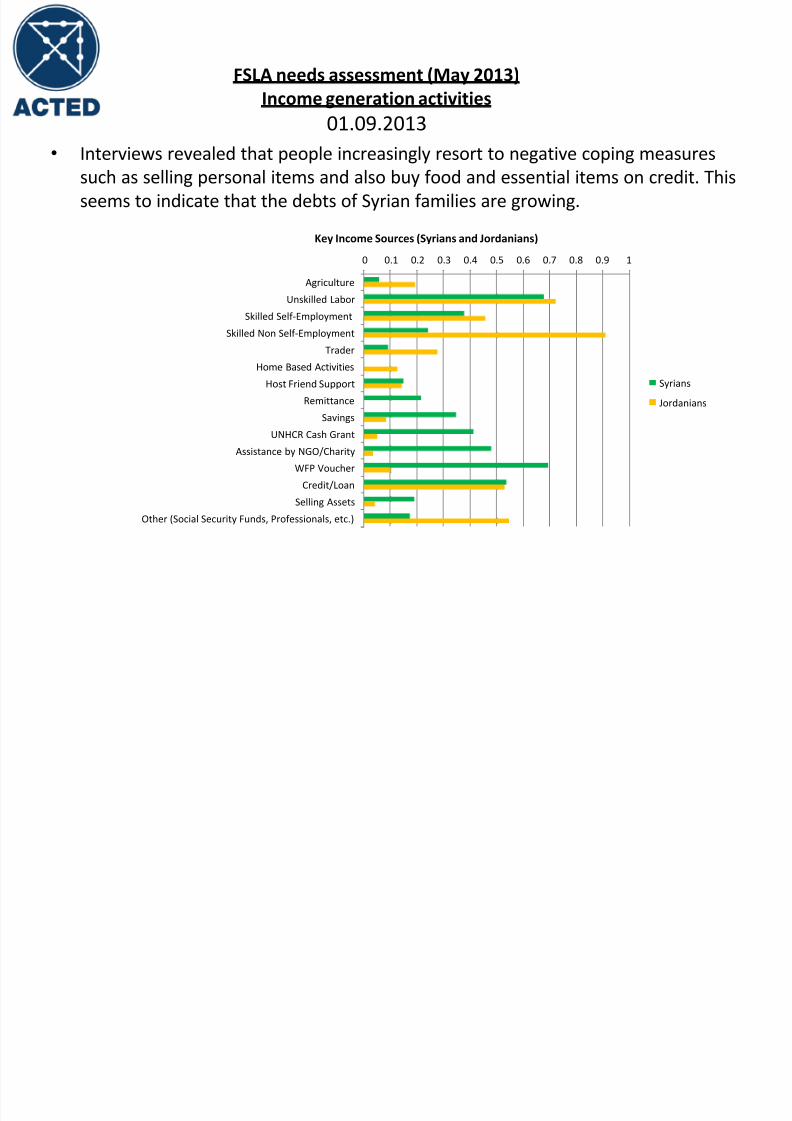
• Interviews revealed that people increasingly resort to negative coping measures
such as selling personal items and also buy food and essential items on credit. This
seems to indicate that the debts of Syrian families are growing.
FSLA needs assessment (May 2013)
Income generation activities
01.09.2013
0 0.1 0.2 0.3 0.4 0.5 0.6 0.7 0.8 0.9 1
Agriculture
Unskilled Labor
Skilled Self-Employment
Skilled Non Self-Employment
Trader
Home Based Activities
Host Friend Support
Remittance
Savings
UNHCR Cash Grant
Assistance by NGO/Charity
WFP Voucher
Credit/Loan
Selling Assets
Other (Social Security Funds, Professionals, etc.)
Key Income Sources (Syrians and Jordanians)
Syrians
Jordanians
7/23/2019 Food Security and Livelihoods Needs Assessment
http://slidepdf.com/reader/full/food-security-and-livelihoods-needs-assessment 12/31
FSLA needs assessment (May 2013)
Average Income
• Income for Jordanianhousehold respondents was123% that of Syrianhouseholds, with averages
recorded as 193 JD forJordanians and 156 JD permonth respectively.
• Few Syrians had access to jobs with regular income,and those who did mainlyreceived income through
skilled labour jobs.• The proportion of Jordanian
households with regularsalaries was significant, andthey received it through
skilled non self-employed jobs- government jobs,professional jobs and socialsecurity funds.

7/23/2019 Food Security and Livelihoods Needs Assessment
http://slidepdf.com/reader/full/food-security-and-livelihoods-needs-assessment 13/31
FSLA needs assessment (May 2013)
Expenditures and Income Gap
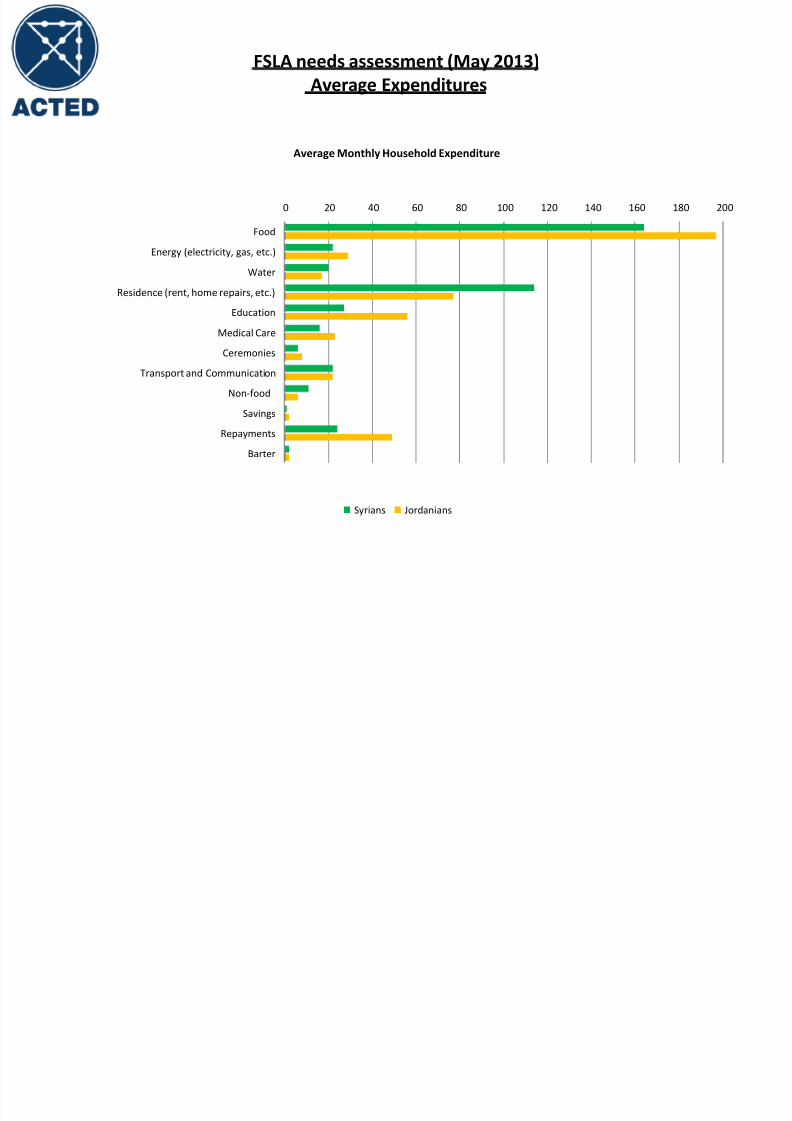
• Main monthly expenditureswere food (38%) and shelter(27%) for Syrian families whilefor Jordanians – food (40%),shelter (16%), and education
(11%) were reported.• A high proportion of Syrians
(90%) spent a significantlyhigher amount on rent.
• As a whole, there has beendeficiency of money to coverhousehold expenses due toinsufficient earnings (i.e.expenses greater than
income).• The average monthly
deficiency had been recordedas JD 271 for Syrians and JD294 for Jordanians.
• The proportion of
beneficiaries having adeficiency in earning wasfound to be the same (92%)for both groups.
7/23/2019 Food Security and Livelihoods Needs Assessment
http://slidepdf.com/reader/full/food-security-and-livelihoods-needs-assessment 14/31
FSLA needs assessment (May 2013)
Average Expenditures
0 20 40 60 80 100 120 140 160 180 200
Food
Energy (electricity, gas, etc.)
Water
Residence (rent, home repairs, etc.)
Education
Medical Care
Ceremonies
Transport and Communication
Non-food
Savings
Repayments
Barter
Average Monthly Household Expenditure
Syrians Jordanians
7/23/2019 Food Security and Livelihoods Needs Assessment
http://slidepdf.com/reader/full/food-security-and-livelihoods-needs-assessment 15/31
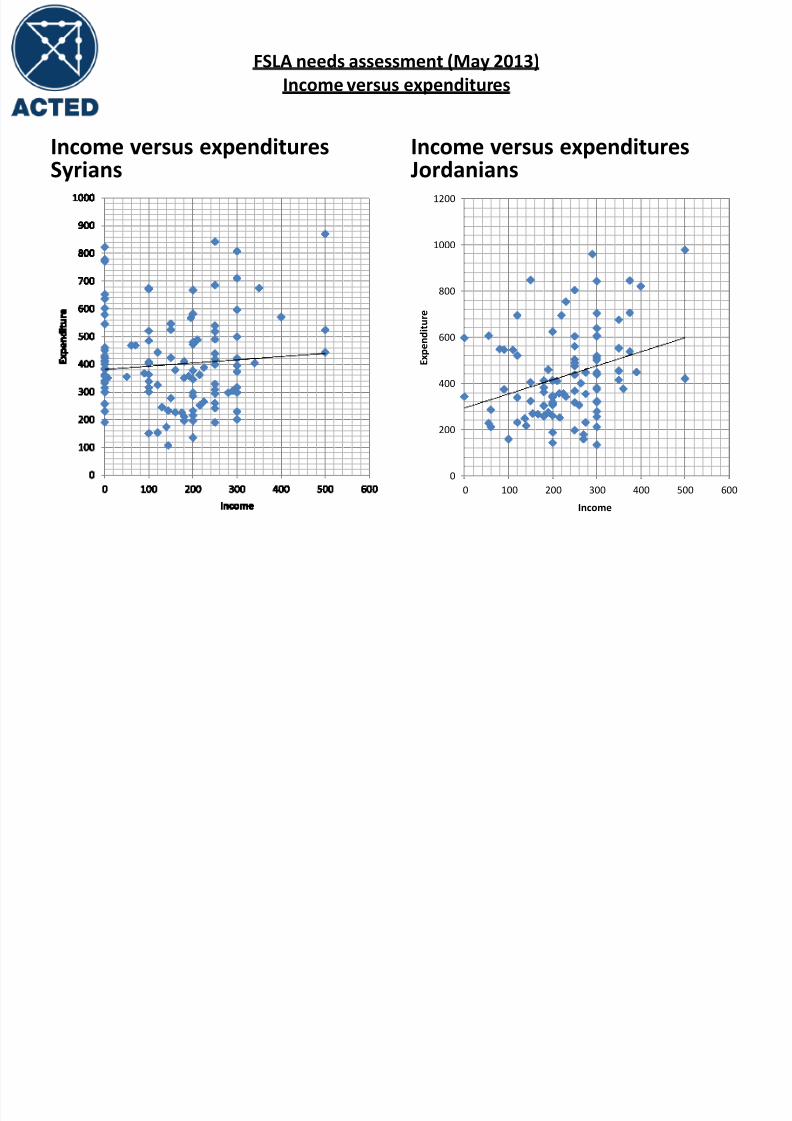
FSLA needs assessment (May 2013)
Income versus expenditures
Income versus expendituresSyrians
Income versus expendituresJordanians
0
200
400
600
800
1000
1200
0 100 200 300 400 500 600
E x p e n d i t u r e
Income

7/23/2019 Food Security and Livelihoods Needs Assessment
http://slidepdf.com/reader/full/food-security-and-livelihoods-needs-assessment 16/31
FSLA needs assessment (May 2013)
Income versus expenditures, Syrians
-JOD 400
-JOD 300
-JOD 200
-JOD 100
JOD 0
JOD 100
JOD 200
JOD 300
JOD 400
JOD 500
Average Syrian Household Income Average Syrian Household Expenditure Funding Gap (filled by unsustainable, negativeor limited coping mechanisms)
Monthly Income Gap for Syrian Households

7/23/2019 Food Security and Livelihoods Needs Assessment
http://slidepdf.com/reader/full/food-security-and-livelihoods-needs-assessment 17/31
Food security and livelihoods needs assessment
4. Food security and food consumption
MEUMEU

7/23/2019 Food Security and Livelihoods Needs Assessment
http://slidepdf.com/reader/full/food-security-and-livelihoods-needs-assessment 18/31
• Respondents indicated that
all essential food items
were readily available for
purchasing in local market
places.
• They usually rely on
supermarkets (92%) and
local food stores (8%) to buy
almost all household fooditems.
Shelter and winterization needs assessment
01.09.2013
FSLA needs assessment (May 2013)
Market Access and Food availability
01.09.2013
• Key informants interviews
revealed that there is a
trend of steady price
increases, however with no
parallel trend in increasedincome to match.

7/23/2019 Food Security and Livelihoods Needs Assessment
http://slidepdf.com/reader/full/food-security-and-livelihoods-needs-assessment 19/31
FSLA needs assessment (May 2013)
Food consumption patterns
• Both communities showedsimilar patterns overall,although a significantdifference was observed interms of proportion of
households consumingmeat.
• Overall, meat, fish and fruitconsumptions were poor,though protein-rich food
intake was somewhatmanaged by adding eggsand dairy to the diet – albeitto a variable degree.
0% 50% 100%
Cereals &…
Legumes
Vegetables
Fruits
Meat
Fish/Sea Food
Milk & Dairy…
Oil & Fat
Sugar
Eggs
% of Families Consuming each Item weekly
Food Consumption Patterns of Households
Syrians
Jordania
ns

7/23/2019 Food Security and Livelihoods Needs Assessment
http://slidepdf.com/reader/full/food-security-and-livelihoods-needs-assessment 20/31
FSLA needs assessment (May 2013)
Food Consumption Score (FCS)
• Food Consumption Score (FCS) plays a vital role in measuring
food security in terms of nutritional diversity.
• It is a composite score based on dietary diversity, food
frequency, and relative nutritional importance of different
food groups.
• It predicts the quantitative dimension of household food
security, defined as having adequate food quantity or calorie
consumption per capita.
7/23/2019 Food Security and Livelihoods Needs Assessment
http://slidepdf.com/reader/full/food-security-and-livelihoods-needs-assessment 21/31
FSLA needs assessment (May 2013)
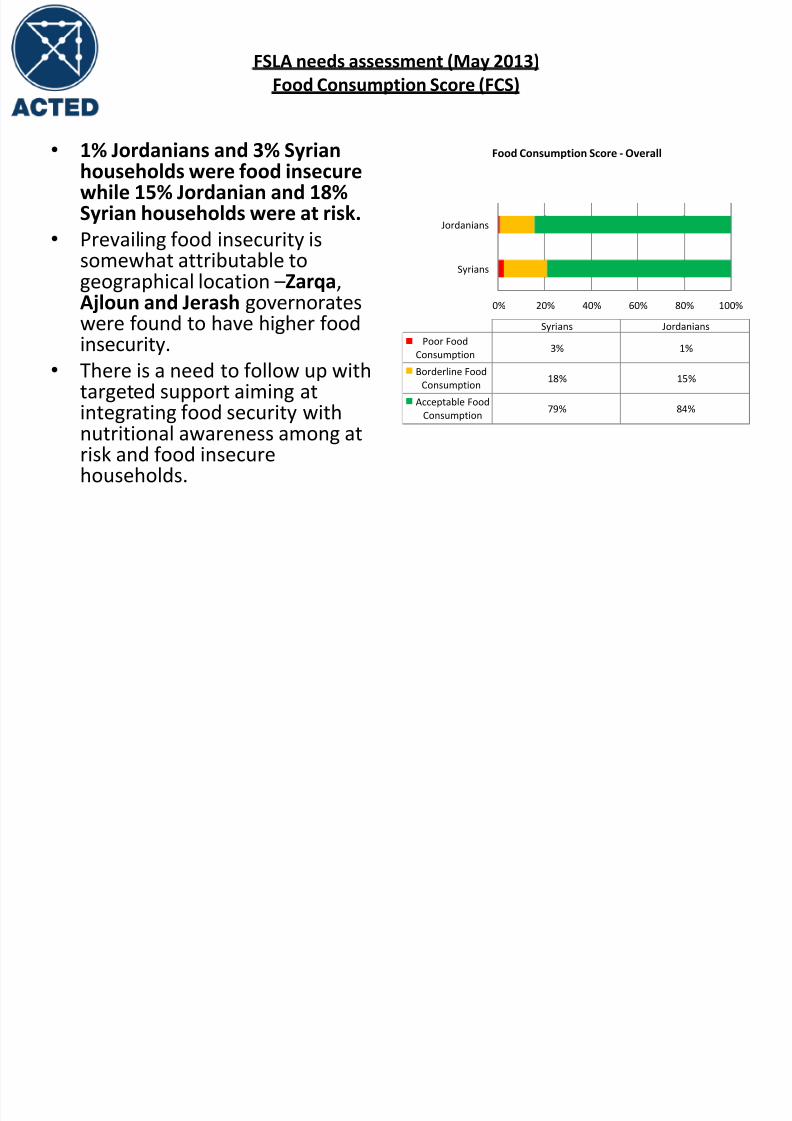
Food Consumption Score (FCS)
• 1% Jordanians and 3% Syrianhouseholds were food insecurewhile 15% Jordanian and 18%Syrian households were at risk.
• Prevailing food insecurity issomewhat attributable to
geographical location –Zarqa,Ajloun and Jerash governorateswere found to have higher foodinsecurity.
• There is a need to follow up withtargeted support aiming at
integrating food security withnutritional awareness among atrisk and food insecurehouseholds.
0% 20% 40% 60% 80% 100%
Syrians
Jordanians
Syrians Jordanians
Poor Food
Consumption3% 1%
Borderline Food
Consumption18% 15%
Acceptable Food
Consumption
79% 84%
Food Consumption Score - Overall

7/23/2019 Food Security and Livelihoods Needs Assessment
http://slidepdf.com/reader/full/food-security-and-livelihoods-needs-assessment 22/31
FSLA needs assessment (May 2013)
Food Consumption Score (FCS)
6%
0%
0%
5%
0%
0%
0%
0%
0%
0%
0%
5%
5%
18%
11%
35%
74%
95%
84%
90%
95%
82%
86%
85%
86%
85%
84%
0% 20% 40% 60% 80% 100%
Ajloun
Balqa
Irbid
Jarash
Mafraq
Zarqa
Ajloun
Balqa
Irbid
Jarash
Mafraq
Zarqa
S y r i a n s
J o r d a n i a n s
Food Consumption Score - Geographical
Poor Food Consumption Borderline Food Consumption Acceptable Food Consumption
7/23/2019 Food Security and Livelihoods Needs Assessment
http://slidepdf.com/reader/full/food-security-and-livelihoods-needs-assessment 23/31
FSLA needs assessment (May 2013)
Food Consumption Score (FCS) correlations
• No significant relationship wasobserved between FCS of thetarget communities and theirmonthly household income .
• Even some of the households
with comparatively higherincome found to have poor orborderline food consumption,and vice-versa.
• FCS of the target communitiespositively correlates with themeat, fish and eggconsumption and/or dairyconsumption of the givencommunities.
• Food consumption status ofthese communities wasmostly affected by level oftheir animal proteinconsumption.
• As such, they must beeducated on the importanceof adding animal proteins totheir diets.

7/23/2019 Food Security and Livelihoods Needs Assessment
http://slidepdf.com/reader/full/food-security-and-livelihoods-needs-assessment 24/31
FSLA needs assessment (May 2013)
Coping mechanisms
• In the most recent 7 daysbefore data collection, 54% ofSyrian and 38% of Jordanianhouseholds had experiencedperiods in which they had notenough food or money to buyfood.
• The households who hadinsufficient food forconsumption also had variouscoping strategies to managethe situation.
•
They were relying on lesspreferred and less expensivefood, buying food on credit,reducing consumption byadults in order for smallchildren to eat, borrowing
food, money to buy food, andlimiting portion sizes atmeals.

7/23/2019 Food Security and Livelihoods Needs Assessment
http://slidepdf.com/reader/full/food-security-and-livelihoods-needs-assessment 25/31
Food security and livelihoods needs assessment
5.Livelihoods and employment access
MEUMEU
7/23/2019 Food Security and Livelihoods Needs Assessment
http://slidepdf.com/reader/full/food-security-and-livelihoods-needs-assessment 26/31
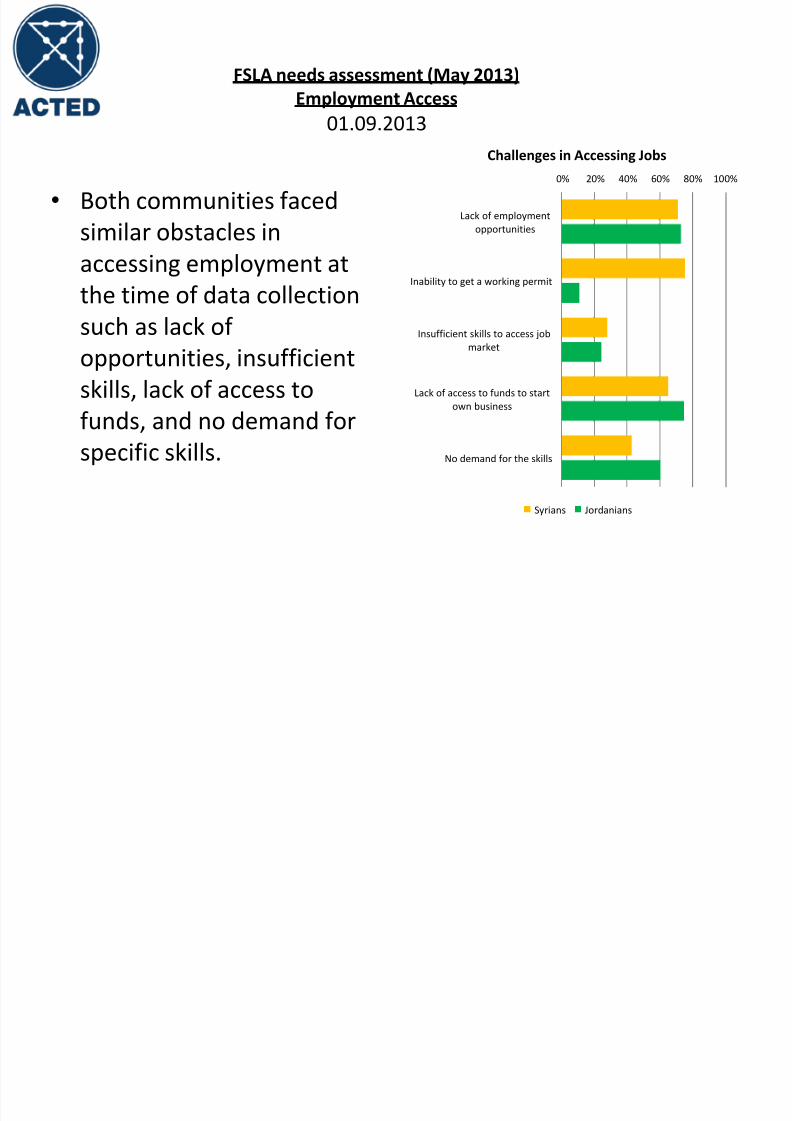
• Both communities faced
similar obstacles in
accessing employment at
the time of data collection
such as lack of
opportunities, insufficient
skills, lack of access to
funds, and no demand forspecific skills.
FSLA needs assessment (May 2013)
Employment Access
01.09.2013
0% 20% 40% 60% 80% 100%
Lack of employment
opportunities
Inability to get a working permit
Insufficient skills to access job
market
Lack of access to funds to start
own business
No demand for the skills
Challenges in Accessing Jobs
Syrians Jordanians
7/23/2019 Food Security and Livelihoods Needs Assessment
http://slidepdf.com/reader/full/food-security-and-livelihoods-needs-assessment 27/31
FSLA needs assessment (May 2013)
Key constraints and preference for assistance
• Syrians reported that havinginsufficient or no capital wasthe key constraint to startlivelihood activities. Also, theyhad to have working permits inorder to obtain formal jobs,which are not possible toformally obtain.
• They prefer receiving furtherinformation about obtainingwork permits and employment
opportunities, and also somecapital to start up new incomegeneration activities.
• For Jordanians, not havingopportunities due to highcompetition but less demandwas the most challengingfactor.
•
As such, they prefer receivingfunds for establishing new orimproving existing incomegeneration opportunities suchas small businesses throughthe necessary technical/skill
trainings schemes.
7/23/2019 Food Security and Livelihoods Needs Assessment
http://slidepdf.com/reader/full/food-security-and-livelihoods-needs-assessment 28/31
FSLA needs assessment (May 2013)
Women’s access to employment
• Women were not involved
in any income generation
usually, with the exception
of 15% for Syrian women
and 26% of Jordanians.
• Teaching, handicrafts,
embroidery, and food
preparation.
• About 64% households of
both communities were
willing to let women
participate in home-based
income generation orrelated trainings.

7/23/2019 Food Security and Livelihoods Needs Assessment
http://slidepdf.com/reader/full/food-security-and-livelihoods-needs-assessment 29/31
Food security and livelihoods needs assessment
6. Recommendations
MEUMEU

7/23/2019 Food Security and Livelihoods Needs Assessment
http://slidepdf.com/reader/full/food-security-and-livelihoods-needs-assessment 30/31
FSLA needs assessment (May 2013)
Recommendations
01.09.2013
• Household levelintervention for promotingfood security targeting foodinsecure and at-riskpopulations is crucial.
• Awareness raisingprograms on nutrition andgood practices, alsoincluding importance andaffordable ways of adding
animal proteins to theirdiets.
• Providing cash assistance topay for basic living costsincluding rent, food,clothes, and basic utilities isessential to prevent resort
to negative copingmechanisms.
• Conditional cash assistancefor Jordanians to establishsmall income generating
activities that can generatea quick economic returnwould be worthwhile forfuture consideration.

7/23/2019 Food Security and Livelihoods Needs Assessment
http://slidepdf.com/reader/full/food-security-and-livelihoods-needs-assessment 31/31
Thank you!