foot and mouth disease vaccination and post-vaccination ... · foot and mouth disease vaccination...
TRANSCRIPT

Foot and mouth disease
vaccination and
post-vaccination monitoring
Guidelines
Editors Samia Metwally
Susanne Münstermann
AuthorsGiancarlo Ferrari
David Paton
Sergio Duffy
Chris Bartels
Theo Knight-Jones
Sus

Foot and mouth disease vaccination and post-vaccination monitoring
Guidelines
Editors Samia Metwally & Susanne Münstermann
Authors Giancarlo Ferrari, David Paton, Sergio Duffy, Chris Bartels & Theo Knight-Jones
Published by
The Food and Agriculture Organization of the United Nations
and
the World Organisation for Animal Health

The designations employed and the presentation of material in this information product do
not imply the expression of any opinion whatsoever on the part of the Food and Agriculture
Organization of the United Nations (FAO), or of the World Organisation for Animal Health
(OIE) concerning the legal or development status of any country, territory, city or area or of its
authorities, or concerning the delimitation of its frontiers or boundaries. The mention of specific
companies or products of manufacturers, whether or not these have been patented, does not
imply that these have been endorsed or recommended by FAO or OIE in preference to others of a
similar nature that are not mentioned. The views expressed in this information product are those
of the author(s) and do not necessarily reflect the views or policies of FAO or OIE.
FAO encourages the use, reproduction and dissemination of material in this information product. Except where otherwise indicated, material may be copied, downloaded and printed for private study, research and teaching purposes, or for use in non-commercial products or services, provided that appropriate acknowledgement of FAO as the source and copyright holder is given and that FAO’s endorsement of users’ views, products or services is not implied in any way.
All requests for translation and adaptation rights, and for resale and other commercial use rights should be made via www.fao.org/contact-us/licence-request or addressed to [email protected].
FAO information products are available on the FAO website (www.fao.org/publications) and can be purchased through [email protected]
© FAO and OIE, December 2016FAO ISBN: 978-92-5-109349-8OIE ISBN: 978-92-95108-25-7

iii
Foot and mouth disease vaccination and post-vaccination monitoring. Guidelines
Foreword
The past decade has been an exciting period for foot and mouth disease (FMD) control and elimination
efforts. The progressive control pathway for FMD (PCP-FMD) was developed to provide a novel stepwise
methodology for a risk management and cost effective approach to FMD control. The PCP-FMD contributed
significantly to the FAO-OIE Global Control Strategy (2012), whereby it represented the backbone for
its implementation. The Food and Agriculture Organization of the United Nations (FAO) and the World
Organisation for Animal Health (OIE) continue to encourage and support their membership in making FMD
control a feasible option to reduce its impact on food security and safe trade and to contribute to improved
livelihoods.
Foot and mouth disease remains endemic in many countries in most parts of Asia, Africa and the Middle
East. Any FMD outbreak can have potentially devastating impacts on farmers with adverse effects on
livestock assets, production income, available nutrition and consumption.
Vaccine is one of the main tools proven to better manage or eliminate the disease when properly applied
and with desirable quality and composition. It is imperative that up-to-date information on circulating
virus strains in any geographical location be known for selection of appropriate vaccine strains.
Typically, the cost of vaccine and vaccination represents over 90% of the total expense of FMD control
so that it is essential to plan and evaluate vaccine and vaccination effectiveness to convince decision
makers, including the most important – farmers – to maintain rigorous vaccination efforts. The guidelines
herein are developed under the auspices of FAO and OIE to advise on the principles of FMD vaccine/
vaccination monitoring and best practices for vaccine application with the focus on how to evaluate
and ensure the success of the vaccination programmes. These guidelines are presented from experts’
viewpoint to determine the vaccine effectiveness against the circulating FMD viruses, which directly
affect multiple cloven-hoofed species and can indirectly cripple local and global commerce.
These guidelines are designed to guide and assess national or sub-national vaccination programmes
at various stages of PCP-FMD; and can be equally helpful for regaining FMD free status following the
incursion of FMD virus in previously free countries or those where vaccination is to be discontinued, as
given in the OIE Terrestrial Animal Health Code. The importance of effective performance of Veterinary
Services to implement FMD control programmes, particularly vaccination, is highlighted in the guidelines.
Given that most readers and users may have a broad background in disease management and may not
necessarily be FMD specialists, the contributors have sought to provide a balance of scientific background,
methodology and practical examples.
We wish to thank the editors and authors for developing these guidelines and the reviewers from many
countries representing Asia, Africa and South America, and vaccine producers as well as selected FMD
specialists, including those from OIE and FAO reference centres, for their valuable contributions.
Dr Juan Lubroth Dr Monique Éloit
Chief, Animal Health Service Director General
FAO OIE


CONTENTSFOREWORD . . . . . . . . . . . . . . . . . . . . . . . . . . . . . . . . . . . . . . . . . . . . . . . . . . . . . . . . . . . . . . . . . . . . . . . . . . . . . . . . . . . . . . .iii
EXECUTIVE SUMMARY. . . . . . . . . . . . . . . . . . . . . . . . . . . . . . . . . . . . . . . . . . . . . . . . . . . . . . . . . . . . . . . . . . . . . . . . . . . . . . . 3
ACKNOWLEDGEMENT . . . . . . . . . . . . . . . . . . . . . . . . . . . . . . . . . . . . . . . . . . . . . . . . . . . . . . . . . . . . . . . . . . . . . . . . . . . . . . . 4
INTRODUCTION . . . . . . . . . . . . . . . . . . . . . . . . . . . . . . . . . . . . . . . . . . . . . . . . . . . . . . . . . . . . . . . . . . . . . . . . . . . . . . . . . . . . . . . 5
CHAPTER 1 - VACCINE ATTRIBUTES 9
1.1 Introduction . . . . . . . . . . . . . . . . . . . . . . . . . . . . . . . . . . . . . 11
1.2 Vaccine types . . . . . . . . . . . . . . . . . . . . . . . . . . . . . . . . . . . . 11
1.3 Vaccine matching and criteria for selection of vaccine strains. . . . . . . . . . . 11
1.4 Vaccine quality . . . . . . . . . . . . . . . . . . . . . . . . . . . . . . . . . . . 12
1.4.1 Requirements during manufacturing process . . . . . . . . . . . . . . 12
1.4.2 Requirements for vaccine registration process. . . . . . . . . . . . . . 13
1.5 Considerations when purchasing vaccine . . . . . . . . . . . . . . . . . . . . . 13
1.5.1 Vaccine purchase through a tender procedure . . . . . . . . . . . . . . 13
1.5.2 Vaccine supply to the tenderer . . . . . . . . . . . . . . . . . . . . . . 14
1.6 Checklist for vaccine selection . . . . . . . . . . . . . . . . . . . . . . . . . . . 14
CHAPTER 2 - VACCINE PROGRAMME, DELIVERY, SCHEDULE AND COVERAGE 15
2.1 Introduction . . . . . . . . . . . . . . . . . . . . . . . . . . . . . . . . . . . . . 17
2.2 Objectives of a vaccination programme . . . . . . . . . . . . . . . . . . . . . . 17
2.3 Vaccine delivery . . . . . . . . . . . . . . . . . . . . . . . . . . . . . . . . . . . 18
2.3.1 Packaging . . . . . . . . . . . . . . . . . . . . . . . . . . . . . . . . . 18
2.3.2 Cold chain and logistics management . . . . . . . . . . . . . . . . . . 18
2.4 Vaccination schedule . . . . . . . . . . . . . . . . . . . . . . . . . . . . . . . . 18
2.5 Vaccine coverage . . . . . . . . . . . . . . . . . . . . . . . . . . . . . . . . . . 19
2.6 Checklist for implementing vaccination. . . . . . . . . . . . . . . . . . . . . . . 20
CHAPTER 3 - EVALUATION OF THE IMMUNE RESPONSE 23
3.1 Introduction . . . . . . . . . . . . . . . . . . . . . . . . . . . . . . . . . . . . . 25
3.2 Use of serological tests for post-vaccination monitoring. . . . . . . . . . . . . . 27
3.2.1 Antibody responses to structural proteins . . . . . . . . . . . . . . . . 27
3.2.2 Correlation between structural protein antibody responses and protection . . . . . . . . . . . . . . . . . . . . . . . . . 28
3.2.3 Antibody responses to non-structural proteins. . . . . . . . . . . . . . 28

2 Foot and mouth disease vaccination and post-vaccination monitoring. Guidelines
3.3 Small-scale trial for the evaluation of vaccine quality . . . . . . . . . . . . . . . 28
3.3.1 Vaccination protocol and blood sampling . . . . . . . . . . . . . . . . 29
3.3.2 Antibody testing . . . . . . . . . . . . . . . . . . . . . . . . . . . . . 29
3.3.3 Interpretation of the results . . . . . . . . . . . . . . . . . . . . . . . 29
3.4 Evaluation of immune responses in vaccinated animals under field conditions . . . . . . . . . . . . . . . . . . . . . . . . . . . . . . . . 31
3.5 Post-vaccination monitoring to assess immunity at population level . . . . . . . 32
3.5.1 Post-vaccination monitoring to assess population immunity at individual animal level . . . . . . . . . . . . . . . . . . . . . . . . . 35
3.5.2 Post-vaccination monitoring to assess population immunity at herd level. . . . . . . . . . . . . . . . . . . . . . . . . . . . . . . . 36
3.6 Checklist for post-vaccination monitoring of immunity. . . . . . . . . . . . . . . 37
CHAPTER 4 - MONITORING THE IMPACT OF VACCINATION AND OTHER CONTROL MEASURES 39
4.1 Introduction . . . . . . . . . . . . . . . . . . . . . . . . . . . . . . . . . . . . . 41
4.2 Vaccine efficacy and effectiveness . . . . . . . . . . . . . . . . . . . . . . . . . 41
4.3 Investigating outbreaks in vaccinated animals . . . . . . . . . . . . . . . . . . . 42
4.4 Effectiveness of a foot and mouth disease control programme . . . . . . . . . . 43
4.5 Monitoring. . . . . . . . . . . . . . . . . . . . . . . . . . . . . . . . . . . . . . 44
4.6 Status at the start of implementation . . . . . . . . . . . . . . . . . . . . . . . 44
4.7 Expected outcomes . . . . . . . . . . . . . . . . . . . . . . . . . . . . . . . . . 45
REFERENCES 47
ANNEXES 51
ANNEX 1 Monitoring vaccine coverage . . . . . . . . . . . . . . . . . . . . . . 53
ANNEX 2 Statistical methods for designing field surveys of population immunity . . . . . . . . . . . . . . . . . . . . . . . . . . 59
ANNEX 3 Strengthening Veterinary Services . . . . . . . . . . . . . . . . . . . . 71
ANNEX 4 Vaccine effectiveness. . . . . . . . . . . . . . . . . . . . . . . . . . . 73

3
Foot and mouth disease vaccination and post-vaccination monitoring. Guidelines
Executive summary
Foot and mouth disease (FMD) control and/or eradication measures have been in existence for many
years in different regions, supported by an official World Organisation for Animal Health (OIE) system
for recognition of national control programmes and of country status in order to manage the trade
risks for reintroduction of FMD. A global FMD control strategy was announced by the Food and
Agriculture Organization of the United Nations (FAO) and OIE in 2012, incorporating a progressive
control pathway for FMD (PCP-FMD) that elaborates principles for the application of control measures
in a step-wise manner. The OIE Performance of Veterinary Services tool helps countries to monitor the
structures essential for implementation of their programmes. Vaccination is an important component
of programmes that seek to reduce the impacts of FMD and to block circulation of the causative virus
in order to establish and maintain disease freedom.
The choice and successful implementation of the appropriate vaccine and vaccination regimens are
affected by many dynamic factors, including:
(i) the diversity of the viruses to be controlled
(ii) the performance characteristics and instability of vaccines
(iii) the range of susceptible animal species and husbandry systems
(iv) the purposes of vaccination
(v) the short-lived nature of vaccine-induced immunity, and
(vi) the design and application of vaccination programmes.
Furthermore, vaccination is unlikely to succeed unless supported by other complementary control
measures. Therefore, the entire process of vaccine selection and vaccination must be continuously
monitored and evaluated to ensure that it fulfils its objectives and contributes to sustainable control
of FMD. This document is intended to help guide this process. Since the variable and changing
circumstances of FMD control require different approaches, the guidance is not prescriptive. Instead,
it reviews the options available for vaccine selection and vaccination strategies and presents
methodology to check that a potential vaccine is able to provide a protective immune response and
that the implemented vaccination programme has translated this into a protective level of population
immunity.
4
Foot and mouth disease vaccination and post-vaccination monitoring. Guidelines
AcknowledgementThese guidelines grew out of discussions within a working group of the OIE/FAO FMD Reference
Laboratory Network and other FMD experts, namely Rossana Allende, Paul Barnett, Hernando Duque,
He Jiun, Xiangtao Liu, Eduardo Maradei, Antonio Mendes, Samia Metwally, Susanne Münstermann,
Bramhadev Pattnaik, Claudia Perez, Ludovic Plee and Zhang Qiang. A subsequent FAO–OIE expert
panel, comprising some of the authors and Kris de Clercq, Tim Doel, Phaedra Eblé, Mary Joy
Gordoncillo, Cornelis van Maanen, Alasdair King, Mokganedi Mokopasetso and Keith Sumption,
helped shape the scope and format of the guidelines.
5
Foot and mouth disease vaccination and post-vaccination monitoring. Guidelines
INTRODUCTION
Foot and mouth disease (FMD) is one of the most contagious viral diseases known, with potentially devastating economic, social and environmental impacts. It is caused by a virus belonging to the Aphthovirus genus of the family Picornaviridae. FMD virus (FMDV) has seven immunologically distinct serotypes, namely O, A, C, SAT1, SAT2, SAT3 and Asia 1. Globally, there is great disparity in progress towards FMD control and eradication. While some countries are either FMD free or well on the road to achieving freedom, others are at an early stage of FMD control. Recently, there has been international endorsement of a progressive control pathway for FMD (15, 38) and this has stimulated new national and regional efforts to control the disease (43). Vaccination is one of the most important tools to combat FMD, and countries embarking on new control initiatives may benefit from guidance on how to optimise vaccine-based control programmes. Various approaches to vaccination have been used based on local situations and objectives, for example mass vaccination, vaccination applied to target animal populations, zones or high-risk areas, ring vaccination around outbreaks and vaccination at buffer or protection zones around disease-free areas. Since many factors can influence the effectiveness of vaccination against FMD, which can vary widely and sometimes be extremely poor, the regimens and programmes used must be monitored continuously to identify any failings and to ensure sustained control of the disease.
Purpose of this guide
Many countries do not adequately monitor the effectiveness of FMD vaccination, perhaps because they do not realise how important this is, but often because of uncertainty about the best ways to do so in the context of their own particular objectives and needs. This guide is intended to set out and explain the different steps in the process and to assist countries in evaluating the performance of their FMD vaccination regimens and programmes. It is primarily directed at vaccination of cattle, although similar principles and approaches can be applied to other ruminants and pigs. The purpose of this guide is referred to, hereinafter, as post-vaccination monitoring (PVM).
Why post-vaccination
monitoring?
PVM is necessary to optimise the vaccination regimen and programme and the use of limited resources in attaining
expected objectives. Demonstrating the impact of vaccination programmes on the disease burden helps to justify the vaccination cost, while identification of weaknesses in the vaccination programme enables improvements to be put in place. Very large sums of public and private money can be wasted on ineffective vaccination programmes, and farmers and other livestock stakeholders can become very discouraged about the prospects for FMD control. Monitoring of vaccination programmes and of population immunity are important components of the surveillance system for countries embarking on vaccine-based FMD control (progressive control pathway for FMD [PCP-FMD] stages 2–3). They are also a requirement for those seeking official recognition by the World Organisation for Animal Health (OIE) of endorsed national control programmes or national or zonal freedom from FMD with vaccination (PCP-FMD stages 3 and beyond). PVM will also stimulate the production and use of high-quality vaccines and the development of improved vaccines.
Description of this guide
This guide has been developed by an expert team to provide practical guidance to end users on how to conduct PVM as part of vaccination programmes. Nevertheless, a balance has been struck between theory and practice so that the more general principles described can help readers to adapt specific protocols to the particular combinations of prevailing local circumstances, not all of which can be described or anticipated. An attempt has also been made to tailor the need for PVM to the requirements of countries at different stages of the PCP-FMD.
Table I gives an overview of the objectives of each chapter and the information that it provides. Chapter 1 of this guide presents key background information on FMD vaccines and the specifications that should be met by and sought from vaccine manufacturers. Chapter 2 describes the probable objectives of vaccination programmes in relation to the different stages of the PCP-FMD. It then describes different principles and approaches for vaccine delivery and scheduling and for determining vaccine coverage. Chapter 3 provides practical methods to determine immune responses to vaccination before and after purchase of vaccine and at individual, herd and population levels. Approaches are described to overcome the difficulties in evaluating and interpreting immune responses to vaccination when the vaccine quality is not fully known or when the correlation between protection against a vaccine strain and antibody titre has not been fully established or validated. The evaluation of population immunity is considered in relation

6
Foot and mouth disease vaccination and post-vaccination monitoring. Guidelines
Introduction
to different vaccination programme objectives that reflect the stage of progress towards FMD control, namely to (i) reduce the clinical incidence of FMD, (ii) eliminate circulation of FMDV, (iii) maintain freedom from FMD, or (iv) regain freedom from FMD. This core element of PVM is summarised in Table II. More detailed materials on the key methods described in Chapters 2 and 3 are presented in Annexes 1 and 2. Chapter 4 briefly considers options for monitoring the impact of vaccination in terms of FMD control, such as reducing the incidence of disease and/or infection, or demonstrating that disease or infection is absent. These outcomes will also depend upon control measures other than vaccination, and full consideration of the steps needed to evaluate overall progress in FMD control are beyond the scope of this guide.
Who needs to be involved when
implementing this guide?
Country-level decision makers should set up the objectives of PVM and assign resources pertaining to activities on PVM. Epidemiologists and statisticians select and design the appropriate methods tailored to their national
objectives and carry out data analyses. Field veterinarians, non-governmental organisations (NGOs) and animal health workers collect samples for data analyses. Specialists from veterinary diagnostic laboratories share information on the performance of the serological tests employed for PVM, carry out the diagnostic analysis and participate in the interpretation of the serological test results. Additional advice, in relation to the PVM should be sought from OIE and Food and Agriculture Organization of the United Nations (FAO) FMD Reference Laboratories and Collaborating Centres:
– www.wrlfmd.org/ref_labs/ref_lab_reports/OIE-FAO FMD Ref Lab Network Report 2013.pdf
– www.fao.org/ag/againfo/partners/en/ref_centres.htm.
When is this guide useful?
– After deciding to implement a vaccination programme.
– When planning a vaccination programme.
– While a vaccination campaign is under way.
– After vaccination to monitor and evaluate vaccine effectiveness.
Table I Overview of the components of post-vaccination monitoring by chapter
IssuesChapter 1
Attributes of FMD vaccines
Chapter 2Vaccination programme
objectives, vaccine distribution, vaccination schedule and vaccine
coverage
Chapter 3Antibody responses to
vaccination
Chapter 4Outcomes
What does it tell? How to select a
suitable vaccine for
purchase
Considerations for implementing a
successful vaccination programme
How to test a vaccine prior to and
after purchase
How to evaluate whether the
vaccination programme has
adequately immunised the target
population
Measuring the effectiveness of
vaccination in reducing disease
and/or virus circulation
Monitoring: means
of verification for
indicators (and
targets)
Documentation on
quality (per batch)
including shelf
life and estimated
duration of
protection
Potency (per batch),
r-value (per strain)
Vaccine purity (per
batch)
Temperature cards to accompany vaccines
Vaccination record cards
Vaccination registration books
Progress with vaccine consignment and
administration
Proportions of animals vaccinated in
different age categories
Level of ‘protection’ after vaccination,
defined by proportion of animals/
epi-units with sufficient amounts of
protective antibodies
Numbers of clinical FMD
outbreaks
Levels of virus circulation
(animal, epi-unit) from
sero-surveys
Proportion of vaccinated animals
not showing clinical FMD in an
outbreak compared with non-
vaccinated animals
Frequency Per batch Continuous monitoring At specific time intervals, as set out
in Chapter 3
Continuous monitoring per unit
of time and over an extended
period of time
epi-unit: epidemiological unit r-value: a serological measure of the antigenic match between a vaccine virus and a field virus

7
Foot and mouth disease vaccination and post-vaccination monitoring. Guidelines
Introduction
Table II Overview of post-vaccination monitoring of immunity as discussed in Chapter 3
Section Type of studyArguments for study Design
Objective Result Example Target animals Sample size Days to sample
3.3 Independent
evaluation of
vaccine quality
Prior to vaccine
purchase to
confirm selection
and calibrate
serology testing
Information on
the level of SP
antibody response
after vaccination
(with and without
booster dose)
A country is going
to purchase a
vaccine that it
has not used
previously
and does not
receive complete
assurance of
vaccine quality
from supplier
Individual animal
level
Cattle vaccinated
at 6–9 months
of age
Free of NSP
antibodies
12 calves per
batch:
5 calves, single
dose
5 calves, booster
dose
2 controls (not to
be vaccinated)
Days: 0, 5, 14,
28, 56
Testing antibodies
for both SP
(response to
vaccination) and
NSP (ruling out
infection prior to
and during study)
3.4 Evaluation of
immune response
after vaccination
under field
conditions
At the start of
the vaccination
campaign to
benchmark the
antibody response
to vaccination
More accurate
estimation of
the proportion
of animals
developing
specified titres of
SP antibody after
vaccination and
of the duration of
immunity
Estimation
of proportion
of animals
developing NSP
antibodies after
vaccination
During
vaccination, to
calibrate the level
of protection
expected after
vaccination and
the expected
specificity of NSP
testing
Individual animal
level
Cattle vaccinated
at 6–12 months
of age
Free of NSP
antibodies
From different epi-
units, for example
no more than 5
from one epi-unit
Input parameters
for sample size
calculation:
Estimated
proportion
of animals
developing
antibody titres:
85%
Allowable error:
5%
Confidence level:
95%
55 animals
Day 0 (day of
vaccination) and
day 28, 56 and
168 afterwards
Testing antibodies
for both SP
(response to
vaccination) and
NSP (ruling out
lack of vaccine
purity or infection
prior to and during
the study)
3.5 Evaluation of
immunity at
population level
At any point in
time, to evaluate
the level of
immunity (due
to vaccination
or infection) in
animals
Proportion of
animals with
adequate
vaccination-
induced and/or
infection-induced
immunity
Method to
monitor the level
of immunity over
time in relation
to the impact
of a vaccination
programme
The study designs
can be applied at
any of the four
PCP-FMD stages
Individual animal
level
Irrespective of
vaccination status
Cattle age groups:
(0–6 months)
6–12 months
13–24 months
> 24 months
A general
indication of
10 animals per
age-category per
epi-unit and 27
epi-units
Any time
Record
vaccination
history per animal
Testing SP and
NSP as above
At any point
in time, to
evaluate the
level of immune
response (due
to vaccination
or infection) in
epi-units
Proportion
of epi-units
non-adequately
vaccinated
(NAVEU) and/or
not adequately
immune following
infection
Epi-unit level
Irrespective of
vaccination status
Epi-units randomly
selected
Cattle in randomly
selected epi-units
In epi-settings
2 and 3, age
categories:
6–12 months
13–24 months
Any time
Record
vaccination
history per
epi-unit
Testing SP and
NSP as above
epi-unit: epidemiological unitSP antibody: antibody against FMDV structural proteins (protective and serotype-specific, elicited by vaccination or infection)NSP antibody: antibody against FMDV non-structural proteins (not protective and pan-serotype reactive, elicited by infection or by use of unpurified vaccines)

8
Foot and mouth disease vaccination and post-vaccination monitoring. Guidelines
The importance of strengthening
Veterinary Services to
implement post-vaccination
monitoring
The successful execution of a PVM for FMD is an important monitoring tool for disease control that remains the ultimate responsibility of the national Veterinary Services. The Veterinary Services of a country are defined within the OIE Terrestrial Animal Health Code (the Terrestrial Code) as the governmental and NGOs that implement animal health and welfare measures and other standards and recommendations in the Terrestrial Code.
This includes relevant public and private sector organisations, veterinarians and veterinary paraprofessionals accredited and officially approved by the Veterinary Authority to deliver their delegated functions. The Veterinary Authority must be supported by appropriate legislation and be responsible for and competent at ensuring or supervising the implementation of the aforementioned animal health and welfare measures, international veterinary certification and other standards and recommendations in the Terrestrial Code in the whole territory of a Member Country.
For all the processes described in this guide, the quality and good governance of Veterinary Services provide the enabling environment for the implementation of the PVM methods under the responsibility of public services or under delegated authority to the accredited private sector.
The OIE has several tools and activities to support Member Countries to meet the prescribed standards for the quality of Veterinary Services. These include the Performance of Veterinary Services (PVS) pathway to identify and address opportunities for improvement in 47 identified critical competencies and associated twinning programmes for veterinary laboratories, veterinary education establishments and veterinary statutory bodies. Further details on the PVS Pathway are provided in Annex 3.
Introduction

Foot and mouth disease vaccination and post-vaccination monitoring. Guidelines
CHAPTER 1VACCINE ATTRIBUTES

Foot and mouth disease vaccination and post-vaccination monitoring. Guidelines
VACCINE ATTRIBUTESChapter 1 (9-14)
1.1
Introduction
One or more of a variety of serotypes and strains of FMDV can be incorporated into FMD vaccines and the quality of vaccines can vary widely. Selection of an appropriate vaccine in terms of quality and strain composition is a prerequisite for a successful vaccination programme, without which all other efforts will be in vain.
Regulatory authorities in different countries have developed various approaches to ensuring the quality of vaccines. Although alike in their ultimate goal, these systems may vary in the emphasis they give to the control of the production process and the testing of the final product. Where possible, vaccines should be produced in compliance with good manufacturing practice (GMP). However, as GMP is neither universally applied by manufacturers nor satisfactorily regulated, or even required by all national authorities, it is recommended that in the absence of reliable GMP systems, manufacture and testing of FMD vaccines must be in accordance with OIE standards – Chapters 1.1.6 (Principles of veterinary vaccine production) and 2.1.5 (FMD vaccine) of the OIE Manual of Diagnostic Tests and Vaccines for Terrestrial Animals (Terrestrial Manual) (44) and the relevant national standards including pharmacopoeia requirements1.
Vaccine strain selection should be based on knowledge of threats from trade and from viruses circulating regionally and, if not specified nationally, advice can be sought from regional and international reference laboratories. Regular collection of locally circulating viruses and submission to reference laboratories will provide the most definitive information.
Assuming that the correct vaccine strains are selected, the quality of the vaccine should be monitored. The objective of this chapter is to give guidance on the selection of FMD vaccine of an appropriate quality and specificity.
1. It is to be expected that national standards for manufacture and test-ing of FMD vaccines may be legally binding on the manufacturer of the vaccine or the country intending to use the vaccine. If such stan-dards are not broadly equivalent or superior to the OIE standards, the OIE standards should also be used wherever possible.
1.2
Vaccine types
The virus is usually propagated in baby hamster kidney (BHK) cells and the virus suspension is clarified by filtration or centrifugation to remove cell debris. The clarified virus is then inactivated following first-order kinetics using a chemical such as binary ethylenimine (BEI). After inactivation, the viral antigen can be concentrated by precipitation, ultrafiltration or a combination of both, but it can also be directly formulated without further processing. These concentration processes also result in the purification of the antigen by reducing the content of non-structural proteins (NSPs). Use of purified vaccines improves the differentiation of infected from vaccinated animals (DIVA). Concentration and purification of the viral antigen can result in loss of antigenic mass, which might need adjustment, depending upon the required vaccine potency.
Depending on the type of adjuvant, the vaccines can be in aqueous or oil form. Aqueous FMD vaccines are formulated with aluminium hydroxide gel and saponin as adjuvants. In the case of oil vaccines, two types are available: single emulsion, water in oil (W/O); and water in oil in water (W/O/W), also known as double oil emulsion (DOE). Aqueous vaccines are commonly used in cattle, sheep, goats and buffalo but are not effective in pigs. Oil vaccines are used in all species. For example, W/O vaccines are routinely used in South American cattle and W/O/W vaccines are routinely used in pigs in Asia.
1.3
Vaccine matching and criteria
for selection of vaccine strains
The principles and available methodologies for selection of FMD vaccine strains are described in the Terrestrial Manual, Chapter 2.1.5. (44), while a review by Paton et al. (34) gives further details on this topic. Since immunity to FMDV is serotype specific, and even within serotypes cross-protection between strains may be incomplete, the aim is to select a vaccine that incorporates one or more vaccine strains that are able to induce protective immunity against a threat or threats from one or more circulating virus strains.

12 VACCINE ATTRIBUTES
Foot and mouth disease vaccination and post-vaccination monitoring. Guidelines
The ideal vaccine will provide a broad range of protection against multiple threats. The amount of antigenic variation is greater for some serotypes than others. Whether or not protective levels of immunity can be induced will depend upon three main independently variable factors:
(i) the potency of the vaccine;
(ii) the antigenic match between the vaccine strain and the field strain; and
(iii) the vaccination schedule (31).
For example, a highly potent vaccine may cross-protect against a wide range of divergent strains and give relatively long-lasting immunity after a single dose. In contrast, a vaccine with a low potency will induce an antigenically narrow and short-lived protection, but, if a second round of vaccination, one month after the first dose, has been given, the boost in antibodies will contribute to broader and longer-lasting protection. The severity of challenge may also differ according to the husbandry system and density of susceptible livestock.
1.4
Vaccine quality
In FMD control programmes using vaccines, the quality of the vaccines, combined with the correct selection of virus strains, are of utmost importance. The first step in the assurance of vaccine quality must be provided by the vaccine manufacturers, by adhering to prescribed standards, such as those in the Terrestrial Manual, Chapter 2.1.5. The steps specified in the Terrestrial Manual that should be followed in the production process are summarised hereafter.
1.4.1 Requirements during manufacturing process
1.4.1.1 Seed virus management
The seed virus should be characterised and of known provenance and therefore obtained from a reliable source, such as the World Reference Laboratory or an FAO/OIE Reference Laboratory. Master seed viruses (MSVs) must be pure and proven to be free from extraneous agents.
In the event of the emergence of a new strain with a poor match to existing vaccines and a high likelihood of spread, provision can be made to develop a new vaccine strain from a representative field isolate. Its use in the field, when full testing has not been completed, can be authorised in an emergency, but the risks need to be carefully assessed, for example extraneous contamination of the antigen produced from the new MSV.
1.4.1.2 Method of manufacture
The process of virus propagation for antigen production from large-scale suspension cultures or monolayers should be documented, including the inactivation process of the virus, its concentration, purification and final formulation as oil adjuvanted or aqueous vaccines blended with adjuvants and preservatives.
The entire manufacturing process has critical control points addressed by:
1.4.1.3 In-process controls
a) The rate and linearity of the inactivation process should be measured at regular intervals by inoculation into susceptible cells and measuring infectivity, until a concentration of less than one infectious particle per 104 litres of liquid preparation is reached.
b) An innocuity test should be carried out for every batch of antigen, using passage in sensitive monolayer cell cultures to test for the absence of any residual live virus.
1.4.1.4 Final batch test
In the absence of verifiable GMP, each batch of the final vaccine product should be tested by the manufacturer for the following criteria.
a) Sterility
Bulk inactivated antigen, concentrated antigen and final product formulation need to be examined for possible contamination with microorganisms.
b) Identity testing
To demonstrate that only the originally selected strain(s) are contained in the final product.
c) Virus non-structural protein testing
Vaccines claiming to be purified from NSPs have to demonstrate that they do not induce antibodies to NSPs.
d) Safety
The final product has to be tested in animals to demonstrate absence of local and systemic reactions over a period of 14 days, unless consistent safety of the product is demonstrated and approved in the registration dossier.
e) Potency test
The standard to test the final product for potency is the live virus challenge test. However, for batch-release testing, indirect serological tests such as enzyme-linked immunosorbent assay (ELISA) or a virus neutralisation

13VACCINE ATTRIBUTES
Foot and mouth disease vaccination and post-vaccination monitoring. Guidelines
test (VNT) can be used to calculate an expected percentage of protection (EPP) or other scoring system, provided a correlation between serological titre and percentage of protection is established.
1.4.2 Requirements for vaccine registration process
Assuming that the manufacturer has satisfactorily carried out all these quality assurance tests during the production process, a dossier for the registration of the vaccine by the regulatory authorities needs to be prepared, including documentation of the following quality attributes.
1.4.2.1 Manufacturing process
A detailed description of the steps described under sections 1.4.1.1–1.4.1.4 needs to be provided.
1.4.2.2 Target animal safety
A trial batch of the vaccine needs to be tested in vivo in each target species using the recommended route of administration as a single and repeat dose. The trial vaccine should contain the maximum permitted payload and should be administered as a primary course of vaccination (usually two injections, one month apart). Animals should be observed for 14 days for any local or systematic reaction.
1.4.2.3 Efficacy
Each vaccine strain should be demonstrated to give the required potency, as some strains are more immunogenic than others. Vaccine efficacy is tested in vaccinated animals by challenge testing with live FMD reference viruses, distributed by the World Reference Laboratory or other FAO/OIE Reference Laboratories.
Protocols used for challenge testing in cattle are the PD50
(50% protective dose) test or PGP (protection against generalised foot infection) test.
1.4.2.4 Purity testing for non-structural protein antibodies
A trial batch of vaccine should be tested in vivo to prove the absence of induced antibodies against NSPs, if the vaccine manufacturer claims to be producing a purified vaccine.
1.4.2.5 Duration of immunity (DOI)
The DOI depends on the efficacy of a vaccine and should be demonstrated either by a challenge test or an alternative test described under section 1.4.2.3 (efficacy) carried out at the end of the period of protection claimed by the manufacturer.
The manufacturer should indicate in the registration dossier the recommended age for first vaccination and the follow-up vaccination schedule.
1.4.2.6 Stability
As part of the registration dossier, the manufacturer needs to demonstrate the stability of the vaccine properties at the end of the claimed shelf life, for example that the minimum potency is consistently maintained. Storage temperature should be indicated and a warning should be given if vaccine quality can be affected by freezing or ambient temperatures.
1.5
Considerations when purchasing
vaccine
Where FMD vaccination is part of a government-regulated programme of FMD control, the vaccine may be licensed and its use regulated in the country by the relevant authorities. FMD vaccine should be obtained from one or more reputable manufacturers that produce vaccine in accordance with Chapters 1.1.6 and 2.1.5 of the Terrestrial Manual or a national standard that is considered equivalent to these standards. Before purchasing FMD vaccine from a manufacturer, a dossier of information on its product should be requested to help select the most appropriate supplier and vaccine for the vaccination programme. Where the information provided by the manufacturer or experience of vaccine use in the field leaves doubt over the absolute or relative suitability of a vaccine, then this may be tested independently of the vaccine manufacturer’s claims. This can be done by vaccinating a group of the target species and examining the elicited protective immunity using indirect serological methods (see section 3.4) and, if necessary, by direct live virus challenge. In the case of a repeat order of vaccine, samples for serology may be obtained from animals in the field that have already been vaccinated with the previous batch of the vaccine in question.
1.5.1 Vaccine purchase through a tender procedure
Many situations might require the purchase of vaccine using a tender procedure, particularly when large quantities need to be purchased either from the national budget or through a donor agency (4).
The call for tender should include the following information to enable the manufacturer to provide a satisfactory tender dossier:

14 VACCINE ATTRIBUTES
Foot and mouth disease vaccination and post-vaccination monitoring. Guidelines
a) Information provided by the tenderer:
– the virus strain(s) to be included in the vaccine;
– the target species for vaccination;
– the number of doses requested;
– the volume of the vaccine dose and the number of doses per vial;
– the nature of the preferred adjuvant and the formulation of the vaccine;
– special requirements concerning the label (e.g. size, language, warnings).
b) Information to be provided by the manufacturer
General requirements:
– The vaccine manufacture process and the quality control testing of the final batch and the finished product must be conducted in accordance with OIE standards – Chapters 1.1.6 and 2.1.5 of the Terrestrial Manual, 2014.
– The vaccine must be produced in facilities that comply with appropriate requirements and under licence from the national Regulatory Authorities.
Specific requirements:
– Vaccine type – Specify the vaccine serotypes and strains (i.e. polyvalent vaccine).
– Species – The FMD vaccine must be approved for use in the target animals.
– Quantity – Specify number of doses and doses per vial.
– Route – Specify route of administration.
– Adjuvant – Specify type of adjuvant (single oil emulsion, double oil emulsion, or aluminium hydroxide and saponin).
– Potency – Specify vaccine potency in PD50 (usually three PD50), specify the onset (usually two weeks) and duration of immunity (usually six months).
– Stability – The shelf life of the vaccine (finished product or batch) must be stated (usually a period of at least 12 months).
– Reference sera – Indicate if sera for homologous vaccine strains to use as reference standards in serological tests for PVM can be made available to the tenderer.
– Recommended vaccination schedule – Normally requires a two-dose primary course to achieve six months of protection.
The tender dossier should be submitted in the desired language and must provide documentation/proof of all the points listed above, as well as the date and port of delivery, the storage recommendations and the expiry date.
1.5.2 Vaccine supply to the tenderer
The vaccine must be delivered to a designated site in the country. The vaccine containers should be provided with cold chain monitoring devices. Before accepting the consignment, the recipient should verify continuous cold storage at 2–8°C during transport to maintain the quality of the vaccine.
Each batch of FMD vaccine should be accompanied by documentation specific to the batch, signed by an authorised, suitably qualified expert representing the manufacturer, containing all the product information described under section 1.5.1(b) and in addition:
– batch identification;
– date of manufacture;
– any specific instructions, for example shake well before administering;
– hazard warning in case of self-injection.
1.6
Checklist for vaccine selection
– Vaccine efficacy varies widely, so price is not the only relevant factor in a tender process.
– There can be important antigenic differences between vaccine and field strains, so get independent advice on strain selection from reference laboratories.
– Send samples from recent outbreaks to the reference laboratory for virus characterisation and vaccine matching.
– Buy from one or more reputable sources and ensure that there is an independent system for quality control.
– Test immune responses elicited before and after purchase (see Chapter 3).

Foot and mouth disease vaccination and post-vaccination monitoring. Guidelines
CHAPTER 2
VACCINE PROGRAMME, DELIVERY, SCHEDULE AND COVERAGE


VACCINE PROGRAMME, DELIVERY, SCHEDULE AND COVERAGEChapter 2 (15-21)
2.1
Introduction
Vaccination against an infectious disease, such as FMD, may have several objectives (see section 2.2):
a) it can be used to reduce the number of animals that will develop clinical signs after infection and thus limit the economic consequences of the disease (e.g. mortality of young stock, loss of milk yield, reduced growth and draught power); and/or
b) it can be used to progressively reduce or block circulation of FMDV, in which case the proportion of vaccinated animals should be high enough to reduce the transmission chain of the virus in the target population.
Consequently, vaccination may be targeted at a particular livestock sector, for instance dairy cattle or pigs, which suffer considerably from the disease, or at enterprises that promote persistence and spread of the virus, for instance those that keep susceptible species at high density or regularly trade their animals. Vaccination should be applied as part of wider control measures including detection and control of outbreaks, controls on movements of animals and their products, and surveillance. FMD control is a long-term process but one that has been successfully applied over many years in different countries and continents. Guidance on the staging and implementation of different approaches has been set out as a progressive control pathway for FMD (15, 38).
The delivery system (see section 2.3) can be defined as the sequence of events that leads from vaccine being distributed to where it will eventually be consigned to the vaccinators to it being administered to the animals to be vaccinated. The distribution and delivery system should guarantee that a high proportion of the animal population eligible to be vaccinated is actually administered efficacious vaccine.
The vaccination schedule (see section 2.4) is the timing of vaccination and revaccination in relation to the age and species of the animals, their vaccination history, the profile of the risk of infection, the season and other factors, all of which vary according to the prevailing circumstances of husbandry and the pattern of occurrence of FMD, as well as the aims of the control programme (16).
The proportion of eligible animals that are actually vaccinated is termed the vaccine coverage (see section 2.5) and this can be monitored and used as an indicator of the performance of the distribution and delivery system. The vaccine coverage required to control FMD depends upon the rate of spread of the virus, which is in turn dependent upon the way the animals are kept and moved and other risk factors related to indirect virus spread. Information on vaccine coverage is used for a variety of purposes: to monitor the performance of immunisation services at local, national and international levels; to guide disease control initiatives and to identify areas of weak delivery system performance that may require extra resources and focused attention (7). A good vaccine coverage indicates that the distribution system is working properly. To measure vaccine coverage, appropriate data must be collected and, ideally, a tracking system should be implemented so that batches of vaccine are followed from central to local centres and finally to vaccinators.
Other important aspects of vaccination include:
a) the need to decide whether or not to delegate some or all of the vaccination programme to farmers and, if so, how to supervise/monitor that best practice is followed;
b) training of vaccinators in the proper procedures for care and administration of the vaccine, for recording which animals and herds have been vaccinated, and for maintaining biosecurity precautions when moving between herds and villages.
2.2
Objectives of a vaccination
programmeIn accordance with the objectives of a vaccination programme, four main broad epi-settings can be identified under the following four categories (A–D):
A) Vaccinating to reduce the incidence of clinical FMD – Under this category are countries or zones where FMD is endemic and the main objective of the vaccination programme is to reduce the burden of clinical outbreaks of FMD. This scenario may typically be found in countries at stage 2 of the PCP-FMD.
Foot and mouth disease vaccination and post-vaccination monitoring. Guidelines

18 VACCINE PROGRAMME, DELIVERY, SCHEDULE AND COVERAGE
Foot and mouth disease vaccination and post-vaccination monitoring. Guidelines
B) Vaccinating to eliminate the circulation of FMDV – Under this category, the country or zone has still not achieved freedom from disease but is moving towards this status. The official control programme for FMD may become eligible for OIE Endorsement in accordance with Chapter 8.5.48 in the OIE Terrestrial Animal Health Code (Terrestrial Code, 2014) (45). Vaccination is likely to be one of the components of an overall control programme that would include additional measures such as movement control and stamping out. This scenario may be typical of countries at stage 3 of the PCP-FMD.
C) Vaccinating to maintain freedom from FMD – These are countries or zones that are recognised as FMD-free with vaccination following the Terrestrial Code, Chapters 8.5.3 or 8.5.5, and in which FMDV circulation in domestic livestock has been eliminated. Vaccination programmes are implemented to minimise the consequences should FMD incursions occur from outside. This scenario may be typical of countries at stages 4 and 5 of the PCP-FMD.
D) Vaccinating to regain freedom from FMD – These are previously FMD-free countries where vaccination may be practised or not, which have experienced FMD incursions and are trying to recover their disease-free status in compliance with the Terrestrial Code, Chapter 8.5.9. In this category are countries or zones that have experienced a recent reintroduction and are working towards recovering their free status. Vaccination programmes are implemented as an emergency measure in order to regain FMD-free status, with a similar outcome to countries in category B. Providing that outbreaks are rapidly controlled, a long period of protection may not be required. This scenario may be found in countries at stage 5 of the PCP-FMD or those that have left the pathway, having been recognised officially free without vaccination.
Obviously, the objective, extent and duration of a vaccination programme will dictate the target and source population for implementing PVM.
2.3
Vaccine delivery
2.3.1 Packaging
The vaccine should be in vials and transported in thermo-regulated containers. Packaging inserts should be in the language of the receiving country. These must be prepared and signed off in collaboration with the customer so that the insert can be packed by the manufacturer and cross-checked with a master copy.
2.3.2 Cold chain and logistics management
This refers to the system of labour, policies, procedures, vehicles, fuel and equipment that work together to make sure that vaccines given to livestock are effective. Because vaccines have specific temperature requirements (2–8°C), an effective cold chain and logistics management system prevents both excessive heat and cold from damaging the vaccines from the time of manufacturing until they are used. The temperature requirements should be maintained during storage, transport and handling of vaccines from the time of leaving the manufacturing facilities until the vaccine is used. It is necessary to monitor temperature and keep the vaccine in the recommended temperature range during transport. This can be done by the use of monitoring cards or similar devices inserted by the manufacturer. Verification of the continuity of the appropriate storage temperature of the vaccine from production to delivery will be required. If correctly stored, the efficacy of the vaccine should remain acceptable at least until the expiry date specified by the manufacturer. However, it is good practice to use formulated vaccine as soon as possible, since vaccine quality can gradually decline during storage, even if optimal conditions are maintained.
2.4
Vaccination schedule
The species of animal to be vaccinated will depend upon the aims of the vaccination campaign. The importance of different susceptible species in the maintenance and spread of disease varies according to animal density, husbandry and animal contact structures and movement patterns (4), as well as the host specificity of the circulating strains of FMDV.
Foot and mouth disease vaccines provide relatively short-lived protection. When using high-potency vaccines to provide a rapid onset of short-term, emergency protection, revaccination may not be required (i.e. a single dose may suffice). However, in areas with a continuing risk of FMD, prophylaxis requires repeated vaccination to maintain protective levels of immunity, and the schedule chosen must take account of logistical convenience (e.g. the ease of vaccination when animals are housed rather than at pasture), the occurrence of high-risk periods (e.g. when animals are moved or mixed) and the duration of immunity derived from earlier vaccination (39). Furthermore, the structure and dynamics of the population to be immunised will also influence the selection of an optimal vaccination schedule

19VACCINE PROGRAMME, DELIVERY, SCHEDULE AND COVERAGE
Foot and mouth disease vaccination and post-vaccination monitoring. Guidelines
in order that a high level of immunity is maintained over time (28).
The duration of protective immunity should be specified by the manufacturer but may be affected by vaccine potency, vaccine match and prior immunity from vaccination and infection. Therefore, a fixed interval for revaccination cannot be stipulated, and it may vary from four to 12 months after the initial course. In many husbandry systems, there is a high turnover of animals with a significant recruitment of young stock every year. Once these animals lose any maternally derived antibodies, they become highly susceptible to infection, and are a critical target for vaccination. Two doses of vaccine administered at least one month apart provide the best primary course of vaccination. The administration of the second dose significantly enhances the antibody response, the breadth of antigenic protection and the duration of immunity thereafter (35). The next dose of vaccine is commonly given around six months later with the possibility of extending subsequent revaccination intervals up to a year, depending upon vaccine quality and weight of challenge. The manufacturer’s registration dossier should be consulted to confirm safety for use in pregnant animals. Neonates can be vaccinated from two weeks after birth, but maternally derived antibodies absorbed passively from the colostrum of immune dams can interfere with the induction of active immunity by vaccination for up to five months in cattle and two months in pigs (24, 32). Therefore, for prophylactic vaccination in populations with a high level of background immunity, the first vaccination may be delayed until animals are at least two to three months old in the case of pigs and up to four to six months old in the case of cattle. However, as maternally derived antibody levels are highly variable, even in immune populations, some animals may benefit from earlier vaccination. Moreover, in practice, in extensive production systems, the calving season may last for six or more months and it may not be possible to gather animals more than two or three times per year. Therefore, it may be better to prophylactically vaccinate all ages. This would also be the case for emergency vaccination (11).
If FMD has a known seasonal pattern, then vaccination should commence three months before the high-risk period. Supplementary vaccination prior to other high-risk activities such as moving and mixing animals is also good practice and needs to take account of the lag between vaccination and development of protection, including the need for booster vaccination. A minimum of ten days should be allowed for the development of immunity after the first vaccination and five days after a booster vaccination. Whereas vaccination of ruminants is often done mainly during set periods (e.g. in the spring and autumn), in large pig herds, vaccination has to be carried out on a semi-continuous basis and is more likely to be delegated to the farmer.
A simple method is needed to establish the best interval for scheduling the first dose of vaccine. As an example, if the
objective is to ensure that animals are vaccinated once they reach the third month of age and to ensure that vaccination is not delayed beyond the seventh month of age, then newly born animals should be vaccinated every four months (the difference between the maximum and minimum age of eligibility for receiving the first dose). In other examples provided within these guidelines, it has been assumed that the minimum age for first vaccination will be six months and the maximum will be 12 months (the schedule is then every six months). This fits in with the pattern of revaccinating animals every six months.
2.5
Vaccine coverage
Vaccine coverage is often taken to mean the proportion of animals assigned to be vaccinated that are actually administered the vaccine, and the figures calculated can then be used as an indicator of how the delivery system performs. However, it can also have a different meaning, namely the proportion vaccinated in relation to the entire susceptible population. It is vital to be clear about which definition and denominator is being used. The difference between the eligible and total population will be dependent upon both the scheduling of vaccination and the structure (and dynamics) of the population targeted for the vaccination, and these extrinsic factors have an important impact on the effectiveness of the vaccination programme, complementing intrinsic factors such as the protection conferred by the vaccine itself.
The coverage necessary to stop the FMDV from spreading within a herd will depend upon the number of cases that one case generates on average over the course of its infectious period, in a totally susceptible population (the basic reproductive ratio, R0). If a proportion of the population is immune, transmission to these animals may be blocked and the net reproduction ratio (Rn) will decline. If it is reduced to a level at which each infected animal infects on average less than one new animal (Rn < 1), the proportion of the population that is infected will tend to decrease over time, ultimately leading to eradication. The proportion that is immune from vaccination will depend upon coverage and the protective effect of the vaccine. Previously infected animals will also be immune. Examples of the relationship between coverage and the blocking of virus spread are provided in Annex 1. Spread between herds may not be controlled using vaccination alone, if conditions such as high livestock density and unregulated movements support a high between-herd transmission rate. This is why vaccination should always be combined with other control measures that limit opportunities for spread between animals, and the use of

20 VACCINE PROGRAMME, DELIVERY, SCHEDULE AND COVERAGE
Foot and mouth disease vaccination and post-vaccination monitoring. Guidelines
high-quality, well-matched vaccines able to elicit high levels of protection is essential.
To calculate vaccine coverage, the availability of reliable data is of utmost importance, and in this regard it is essential that a simple information system is implemented for this purpose.
Vaccine coverage can be assessed based on the records of the vaccination cards and the registration book for batches and doses (Annex 1) that should be made available at local distribution centres.
Vaccine coverage in eligible animals after the last round of vaccination may be calculated from:
(Number of animals vaccinated/Number of animals eligible for vaccination) × 100
where ‘number of animals vaccinated’ is the numerator and ‘number of animals eligible for vaccination’ is the denominator.
If the purpose is to calculate the vaccination coverage over an entire susceptible population, the denominator of the proportion has to be replaced with the total number of animals and becomes:
(Number of animals vaccinated/Number of susceptible animals in the population) × 100
There are several ways of obtaining the information required to estimate vaccine coverage (7). Although a considerable investment and effort is required to obtain reliable and detailed data, simple methods are sometimes possible. More detailed data allow greater investigation of gaps in vaccine coverage, for example assessing coverage for different geographical or administrative units and per age category, and may identify under-protected subgroups.
The denominator should reflect the carefully defined target population, i.e. those eligible for vaccination or alternatively the total susceptible population. If the denominator estimate is incorrect, coverage estimates will also be incorrect. In countries with a national database of animals and where the animals are individually tagged, obtaining this figure may be relatively simple. In countries where no national databases are available, livestock census data may be available. If not, a survey may be needed to estimate this figure. As a last resort, the actual number of animals eligible and ineligible for vaccination can be assessed at the time of vaccination, although some preliminary approximate information is needed in advance to decide the number of doses to be distributed across the peripheral centres that
will be involved in the implementation of the vaccination programme.
Information on the number of animals actually vaccinated (the numerator) can also be acquired from several sources.
Foot and mouth disease vaccination coverage is often described as the number of doses of vaccine distributed (i.e. the number of doses sent out to the vaccination centres) divided by the estimated population size (distributed method). Although easy to perform, the distributed method has limitations, and in order to obtain reliable estimates it is vital that (i) registration books for batches and doses are accurately compiled, and (ii) estimates of the animal population targeted for vaccination are accurate. Sub-regions with low coverage may not be identified if local vaccine distribution statistics are not available. If records describe only which village, farm or district was vaccinated and not how many animals, inaccuracies may be encountered, as not all animals within a unit may be vaccinated, particularly in backyard settings. If vaccines are provided by different sources (e.g. public and private sector), it is important that both are included in the numerator.
The administered method is identical to the distributed method, except that records of doses administered to animals in the field are used, not doses distributed to vaccination centres. Individual animal vaccine history may also be recorded; this allows calculation of the proportion of animals vaccinated within a certain time period or the number of doses received by the animals over their lifetime. This requires excellent data recording and management capabilities.
Vaccine coverage should be regularly monitored and verified. Detailed examples of how to record and analyse vaccination data on an on-going basis are given in Annex 2. Overall progress should be reviewed at least annually and in conjunction with the information obtained from population immunity studies, especially those directed at looking at immunity in the vaccinated population (see section 3.5).
2.6
Checklist for implementing
vaccination
– If feasible, start vaccination on a small scale and build up the programme as local experience matures.
– Establish clear objectives and targets.
– Decide which species and population to vaccinate.

21VACCINE PROGRAMME, DELIVERY, SCHEDULE AND COVERAGE
Foot and mouth disease vaccination and post-vaccination monitoring. Guidelines
– Decide when to vaccinate and boost.
– Decide who will vaccinate and establish a supervision system.
– Procure sufficient funds for vaccine purchase, vaccination and monitoring.
– Procure sufficient amounts of vaccine for prophylaxis and contingent supplies for emergency.
– Establish distribution centres and a cold chain.
– Establish a vaccination registration system to evaluate coverage.
– Establish a vaccine monitoring team.


Foot and mouth disease vaccination and post-vaccination monitoring. Guidelines
CHAPTER 3
EVALUATION OF THE IMMUNE RESPONSE

Foot and mouth disease vaccination and post-vaccination monitoring. Guidelines
EVALUATION OF THE IMMUNE RESPONSEChapter 3 (23-37)
3.1
Introduction
Estimating the immunity of the population targeted for protection by vaccination is the core of PVM, as it is a key indicator of how well vaccination has been carried out and whether or not protection against infection is likely. However, interpretation of wider field studies of population immunity requires an understanding of the serological responses that can be expected from the vaccine that is used, as well as how these relate to protection from disease and virus transmission. Evaluation of the immune response to vaccination is also an important method for vaccine selection. Therefore, this chapter describes the principles of selection and interpretation of PVM serology, as well as protocols for evaluating post-vaccination immunity before and after vaccine purchase and widespread use. A summary of the issues addressed and the approaches recommended for evaluating immunity is provided in Table II.
FMD vaccines elicit an antibody response against the structural proteins (SP) of the virus that make up the virus shell or capsid, and therefore serological tests can be used to identify vaccinated animals in a naïve population. There is also a correlation between the levels of these antibodies and the protection induced by the vaccine, and it is possible to establish the threshold of antibodies that equates to a given level of protection in the individual animal (36). However, this threshold varies between vaccines and serological tests and according to the time after vaccination (40). It can be established, for a particular vaccine and serological test, by comparing the vaccine-induced serological responses with the vaccine-induced protection in animals challenged with live virus in a potency test (3, 37). This provides a rational threshold for evaluating protection in a population, even if the strength of the challenge may differ under field conditions from that of a potency test.
In the absence of a known correlation between protection and antibody titre, the serologically determined response to vaccination can still be used to inform vaccine selection and monitor the vaccination programme. For example, a crude assessment of quality can be made to ensure that the vaccine in question is able to induce an antibody response, while the relative potency of alternative vaccine supplies can be compared in terms of the comparative levels of antibodies
they induce. The sera obtained from such trials can also be used to calibrate the testing of the wider vaccinated population, for example to monitor for any diminution in antibody levels that might result from variability in vaccine batches or an inadequate cold chain. Similarly, when monitoring population immunity, even if the correlation between serology and protection is uncertain, serology can be used to compare differences in immunity between subpopulations, for example according to animal age, or to compare regional effectiveness in vaccine delivery.
In practice, for FMD, defining a protective titre of antibodies is quite difficult, as this will be affected by many variables (the type of vaccine, the type and reproducibility of the test used to measure the serological response, the strain of virus against which protection is needed, the weight of challenge, etc.).
Three possible approaches can be considered:
1. Where the protective titre for a particular vaccine, challenge virus and test has been defined, allowing vaccinated animals to be tested and categorised as protected or not;
2. Where this titre is not precisely known but can be estimated through knowledge of the virus strains within the vaccine and in the field and of the performance of serological tests incorporating appropriate strains and standards;
3. In the absence of information on the correlation between serology results and protection where interpreting the serological response is limited to determining what proportion of animals have an antibody response that is consistent with successful vaccination (i.e. achieving the expected immunity targets).
The vaccine quality, safety and efficacy of each batch of FMD vaccine should be guaranteed by the manufacturer (as described in Chapter 2.1.5, part C of the Terrestrial Manual, 2014). However, vaccine evaluation, independent of the manufacturer, can provide additional assurance of vaccine quality and strain suitability. It can also indicate the expected level of antibody to be found in animals at a known time after vaccination with a specific schedule and vaccine and measured using a particular test. This evaluation should ideally be carried out prior to wider use of the vaccine in the
26 EVALUATION OF THE IMMUNE RESPONSE
Foot and mouth disease vaccination and post-vaccination monitoring. Guidelines
field, and comparing vaccines from different producers can help to select the appropriate producer (21, 22). A simple methodology using a small number of animals is provided in section 3.3 below.
In addition, it is worthwhile studying the serological responses of a specific cohort of animals that are vaccinated in the field, something that can be done at the same time as, or just before, the widespread application of the same batch of vaccine. The method described below in section 3.4 requires a larger number of animals and consequently gives a more accurate estimate of the SP antibody response that can be expected from the vaccine batch being used. It also provides an opportunity to test for
vaccine purity, by estimating the proportion of vaccinated animals that have mounted a detectable NSP antibody response, something that cannot be done with very small numbers of animals. This will provide information about the specificity to be expected when NSP testing is used to monitor the vaccinated population for evidence of infection.
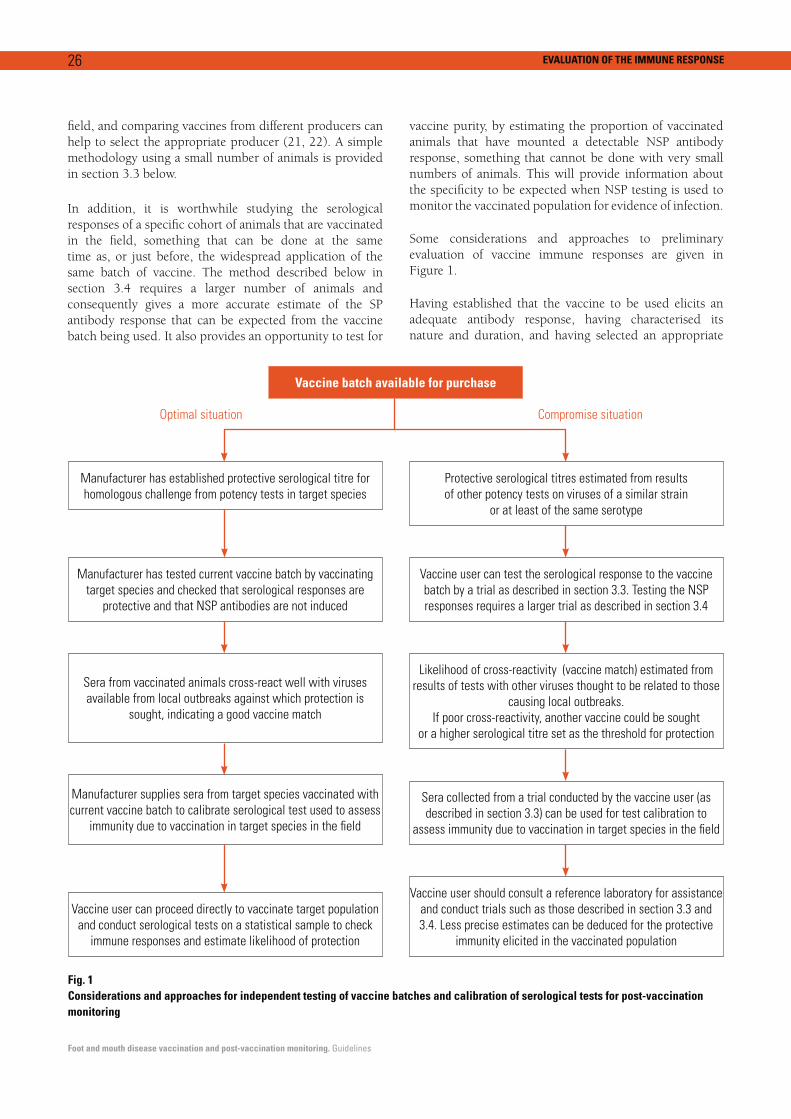
Some considerations and approaches to preliminary evaluation of vaccine immune responses are given in Figure 1.
Having established that the vaccine to be used elicits an adequate antibody response, having characterised its nature and duration, and having selected an appropriate
Fig. 1 Considerations and approaches for independent testing of vaccine batches and calibration of serological tests for post-vaccination monitoring
Vaccine batch available for purchase
Optimal situation Compromise situation
Manufacturer has established protective serological titre for
homologous challenge from potency tests in target species
Manufacturer has tested current vaccine batch by vaccinating
target species and checked that serological responses are
protective and that NSP antibodies are not induced
Sera from vaccinated animals cross-react well with viruses
available from local outbreaks against which protection is
sought, indicating a good vaccine match
Manufacturer supplies sera from target species vaccinated with
current vaccine batch to calibrate serological test used to assess
immunity due to vaccination in target species in the field
Vaccine user can proceed directly to vaccinate target population
and conduct serological tests on a statistical sample to check
immune responses and estimate likelihood of protection
Protective serological titres estimated from results
of other potency tests on viruses of a similar strain
or at least of the same serotype
Vaccine user can test the serological response to the vaccine
batch by a trial as described in section 3.3. Testing the NSP
responses requires a larger trial as described in section 3.4
Likelihood of cross-reactivity (vaccine match) estimated from
results of tests with other viruses thought to be related to those
causing local outbreaks.
If poor cross-reactivity, another vaccine could be sought
or a higher serological titre set as the threshold for protection
Sera collected from a trial conducted by the vaccine user (as
described in section 3.3) can be used for test calibration to
assess immunity due to vaccination in target species in the field
Vaccine user should consult a reference laboratory for assistance
and conduct trials such as those described in section 3.3 and
3.4. Less precise estimates can be deduced for the protective
immunity elicited in the vaccinated population

27EVALUATION OF THE IMMUNE RESPONSE
Foot and mouth disease vaccination and post-vaccination monitoring. Guidelines
test methodology, the response to vaccination of the target population must be monitored to see if the expected levels of immunity have actually been obtained. This is the principal component of PVM. The targets set for population immunity at individual and herd levels should reflect the degree of protection required, taking account of the fact that areas of high animal density and areas with unregulated animal movements will require much higher levels of vaccine-induced protection to stop the expression of clinical disease and the spread of the FMDV. Furthermore, the structure and dynamics of the target population, as already mentioned, may affect the desired level of immunity.
A number of different approaches can be taken to sampling and monitoring representative animals and herds. It is possible to use slaughterhouse surveys to obtain blood samples for such an evaluation, but usually a more systematic selection is desirable, and possible methods of doing this are described in section 3.5 below.
3.2
Use of serological tests for
post-vaccination monitoring
3.2.1 Antibody responses to structural proteins
Serological tests that detect antibodies directed towards the virus structural proteins (SP tests) are suited to measuring protective antibody responses induced by vaccination. These include the VNT and the liquid-phase blocking ELISA (LPBE) (44). An advantage of the VNT is that different virus strains can be readily incorporated, to make the test
homologous to either the vaccine strain or the challenge strain (Table III). For the LPBE, the process of incorporating different test viruses is more complicated, as the test requires both an antigen prepared against one or more virus strains, as well as hyperimmune rabbit and guinea pig antisera or monoclonal antibodies to the virus strains selected. Newer tests such as the solid-phase competition ELISA (SPCE) (9, 29) and other ELISAs based on monoclonal antibodies (6) may offer advantages in terms of repeatability and broader cross-specificity but may lack data to show their correlation with protection. In terms of ease of use, the VNT needs to be performed in high-level biocontainment facilities, it is laborious and it requires trained staff. ELISA tests can be offered on a simple platform for testing large numbers of samples and do not require extensive training in their use.
Table III Effect of antigenic differences on serological test results
Sensitivity of tests for antibodies induced by vaccines or field infection
Tests incorporating different
virus strains
Vaccine or field infection
A1
Vaccine or field
infection A2
FMDV A1 +++ +
FMDV A2 + +++
FMDV A3 (example) ++ +
Therefore, establishing fully validated and reproducible methods for serological assessment of vaccines requires considerable effort, particularly if a large number of different vaccine and field strains are involved (Table IV). Nevertheless, countries embarking on FMD control, that have less than optimal capacity for vaccine selection and testing and acquire vaccines from suppliers who provide limited proof of vaccine suitability may still undertake useful if less precise serological assessments.
Table IVList of variables that can affect the reliability of serological results and possible control measures to consider
Variable factors Control measures
Variability in animal responses to vaccination Include sufficient animals in studies to assess vaccine responses and to set
threshold levels for interpretation of serological results
Variability in serological test results within a given laboratory and between
laboratories performing similar tests
Standardise tests by inclusion of reference sera and participate in inter-laboratory
proficiency tests
Variability in serological test results owing to differences in the antigenic specifi-
city of tests according to the particular virus strains and antibody reagents utilised
in the tests (Table III)
Select test reagents that are appropriate for relevant vaccine or field strains.
Alternatively, use reference sera to relevant virus strains to calibrate tests
Variability in antigenic characteristics of FMDV strains so that a vaccine that
elicits a protective immunity to the vaccine strain may be inadequate to protect
against a field challenge from a different strain
Measure antibody responses to both the vaccine strain(s) and the strain(s) against
which protection is being sought by adjusting the strain specificity of the test or
compensate for differences by use of reference sera or prior test information
Variability in the amount of antibody needed to protect against different strains of
the FMDV
Establish threshold of protection from prior potency test
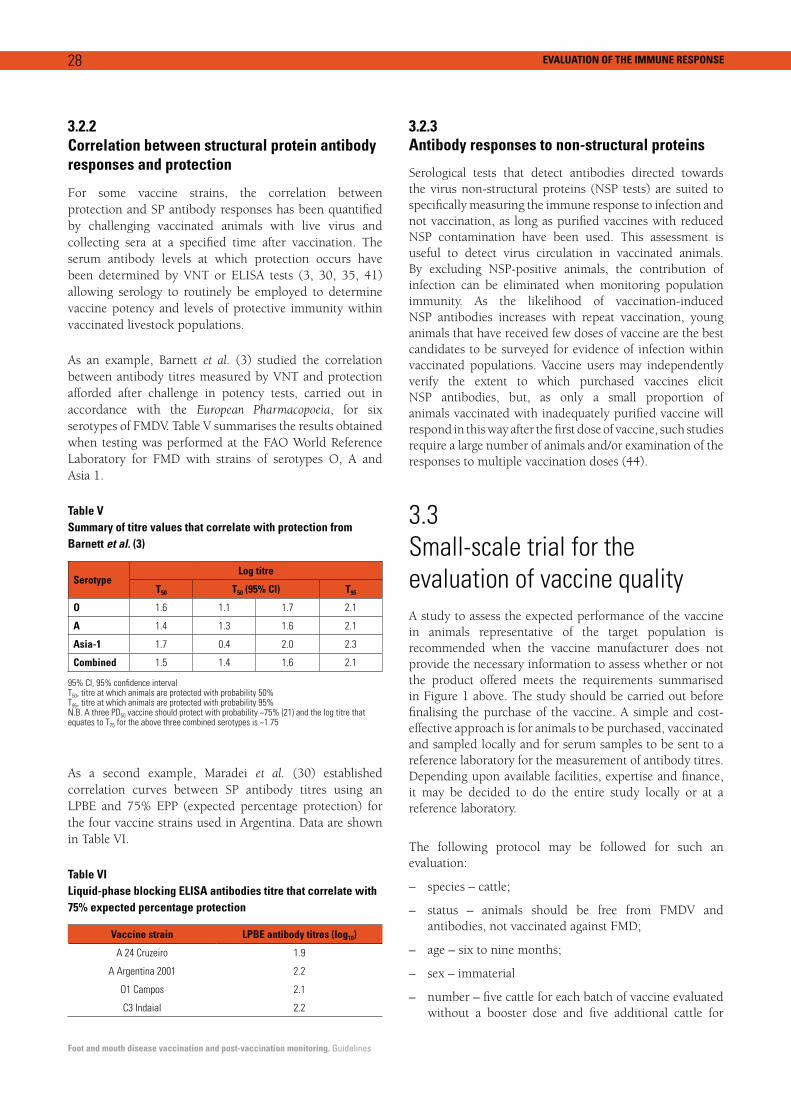
28 EVALUATION OF THE IMMUNE RESPONSE
Foot and mouth disease vaccination and post-vaccination monitoring. Guidelines
3.2.2 Correlation between structural protein antibody responses and protection
For some vaccine strains, the correlation between protection and SP antibody responses has been quantified by challenging vaccinated animals with live virus and collecting sera at a specified time after vaccination. The serum antibody levels at which protection occurs have been determined by VNT or ELISA tests (3, 30, 35, 41) allowing serology to routinely be employed to determine vaccine potency and levels of protective immunity within vaccinated livestock populations.
As an example, Barnett et al. (3) studied the correlation between antibody titres measured by VNT and protection afforded after challenge in potency tests, carried out in accordance with the European Pharmacopoeia, for six serotypes of FMDV. Table V summarises the results obtained when testing was performed at the FAO World Reference Laboratory for FMD with strains of serotypes O, A and Asia 1.
Table V Summary of titre values that correlate with protection from Barnett et al. (3)
SerotypeLog titre
T50 T50 (95% CI) T95
O 1.6 1.1 1.7 2.1
A 1.4 1.3 1.6 2.1
Asia-1 1.7 0.4 2.0 2.3
Combined 1.5 1.4 1.6 2.1 95% CI, 95% confidence intervalT50, titre at which animals are protected with probability 50% T95, titre at which animals are protected with probability 95% N.B. A three PD50 vaccine should protect with probability ~75% (21) and the log titre that equates to T75 for the above three combined serotypes is ~1.75
As a second example, Maradei et al. (30) established correlation curves between SP antibody titres using an LPBE and 75% EPP (expected percentage protection) for the four vaccine strains used in Argentina. Data are shown in Table VI.
Table VI Liquid-phase blocking ELISA antibodies titre that correlate with 75% expected percentage protection
Vaccine strain LPBE antibody titres (log10)
A 24 Cruzeiro 1.9
A Argentina 2001 2.2
O1 Campos 2.1
C3 Indaial 2.2
3.2.3 Antibody responses to non-structural proteins
Serological tests that detect antibodies directed towards the virus non-structural proteins (NSP tests) are suited to specifically measuring the immune response to infection and not vaccination, as long as purified vaccines with reduced NSP contamination have been used. This assessment is useful to detect virus circulation in vaccinated animals. By excluding NSP-positive animals, the contribution of infection can be eliminated when monitoring population immunity. As the likelihood of vaccination-induced NSP antibodies increases with repeat vaccination, young animals that have received few doses of vaccine are the best candidates to be surveyed for evidence of infection within vaccinated populations. Vaccine users may independently verify the extent to which purchased vaccines elicit NSP antibodies, but, as only a small proportion of animals vaccinated with inadequately purified vaccine will respond in this way after the first dose of vaccine, such studies require a large number of animals and/or examination of the responses to multiple vaccination doses (44).
3.3
Small-scale trial for the
evaluation of vaccine quality
A study to assess the expected performance of the vaccine in animals representative of the target population is recommended when the vaccine manufacturer does not provide the necessary information to assess whether or not the product offered meets the requirements summarised in Figure 1 above. The study should be carried out before finalising the purchase of the vaccine. A simple and cost-effective approach is for animals to be purchased, vaccinated and sampled locally and for serum samples to be sent to a reference laboratory for the measurement of antibody titres. Depending upon available facilities, expertise and finance, it may be decided to do the entire study locally or at a reference laboratory.
The following protocol may be followed for such an evaluation:
– species – cattle;
– status – animals should be free from FMDV and antibodies, not vaccinated against FMD;
– age – six to nine months;
– sex – immaterial
– number – five cattle for each batch of vaccine evaluated without a booster dose and five additional cattle for

29EVALUATION OF THE IMMUNE RESPONSE
Foot and mouth disease vaccination and post-vaccination monitoring. Guidelines
evaluation with a booster dose; two non-vaccinated controls in each experiment;
– method of identification – individual ear tag;
– sanitary surveillance – daily;
– housing – cattle should be kept in an area or location with a low probability of exposure to FMDV and under adequate farm biosecurity;
– feeding and drinking conditions – standard feed for cattle, water ad libitum;
– test system justification – target species for FMDV vaccines.
If calves are born from dams that have been infected or vaccinated, it is necessary to wait until maternally derived antibodies have been lost. This happens normally by six months after birth, and the calves should be checked for antibodies against FMD before the vaccination study starts. The two non-vaccinated control animals must be housed with the vaccinated animals for use as sentinels to check for FMDV infection in the facilities during the experiment.
3.3.1 Vaccination protocol and blood sampling
The sampling protocol below will provide key information on the rising and falling of the post-vaccination antibody levels:
– Before vaccination – Collect two 10-ml tubes of clotted blood for serum from each animal.
– Day 0 –Vaccinate the vaccination groups with a single dose of vaccine as stated on the label.
– Day 5 after vaccination – Collect two 10-ml tubes of clotted blood for serum from each animal.
– Day 14 after vaccination – Collect two 10-ml tubes of clotted blood for serum from each animal.
– Day 281 after vaccination – Revaccinate (boost) five cattle from the vaccination group with a single dose of vaccine as stated on the label. Collect five 10-ml tubes of clotted blood for serum from each animal.
– Day 56 after first vaccination – Collect two 10-ml tubes of clotted blood for serum from each animal.
1. In vaccine potency tests, challenge may be at 21 or 28 days post vaccination (dpv) (commonly 21 dpv for aqueous vaccines and 28 dpv for oil vaccines). Consequently, some reference laboratories have calibrated their tests to estimate protection using 21-dpv sera rather than 28-dpv sera and so the precise timing should be agreed through advance consultation.
– Optional six months after vaccination – Collect two 10-ml tubes of clotted blood for serum from each animal.
3.3.2 Antibody testing
– The sera from the vaccinated animals should be tested for SP antibodies to assess the strength of immunity elicited. The sera from all of the animals should be tested for NSP antibodies to check that the animals did not become infected with FMDV during the trial.
– Suitable commercial NSP tests are readily available (e.g. PrioCHECK FMDV NS, Life Technologies, Carlsbad, California), facilitating local testing in the country performing the animal experiment.
– If the country performing the animal experiment is able to test the sera with serotype-specific tests such as the PrioCHECK, or reference laboratory-supplied serotype-specific tests, LPBE, SPCE or VNT, then the sera should be titrated against all serotypes included in the vaccine.
– Reference sera should be included for local test calibration (preferably with a titre that is equal to 50% protection in an animal potency experiment). It may be possible to obtain such sera from a reference laboratory or, if available, batch release sera provided by the vaccine manufacturer can also assist test calibration and interpretation.
– The sera (especially those collected at day 0, 5, 14 and 282) could also be sent to an accredited reference laboratory for testing against relevant vaccine and field strains (Fig. 2).
3.3.3 Interpretation of the results
– The test for antibodies against NSPs should give negative results before and after first vaccination (and if revaccinated, then after this too).
– Both control animals should not develop antibodies against NSPs (or against SPs if so tested).
– The sera collected five days after first vaccination should not contain antibodies against SPs, as this is indicative of an anamnestic response, meaning that the vaccinated animals had already been previously infected or vaccinated.
– The reference laboratory testing should indicate whether the vaccine has elicited a response likely to indicate
2. See footnote 1.

30 EVALUATION OF THE IMMUNE RESPONSE
Foot and mouth disease vaccination and post-vaccination monitoring. Guidelines
– The local test response also indicates the best that can be expected when the vaccine is used more widely in the field.
The numbers of animals used in the above methodology represent an absolute minimum, and more reliable information can be obtained by increasing the group size. Alternatively, a small field trial can be performed, as described in section 3.4.
Fig. 2 Use of serology to set thresholds for monitoring vaccine induced immunity. DPV, days post-vaccination
Receive sera from vaccine manufacturer from batch testing or
carry out trial according to section 3.3
Send 21-28 dpv sera to reference laboratory (RL)
RL tests sera for ability to neutralize strain(s)
of virus circulating locally
Based on this cut-off and numbers of cattle from trial that meet
it, RL calculates expectation for achieving ~75% protection
Sera from trial that have neutralising antibody titres around
protective threshold are used as reference reagents to establish
cut-off for use in commercially available serology ELISA
This ELISA test is used for wider population immunity studies
Fig. 3 Example of a vaccine trial interpretation of likelihood of protection based on the level of antibody elicited
A serotype A vaccine was given to five cattle with two unvaccinated control animals. Sera harvested at 21 days post vaccination were examined by a reference laboratory using two VNTs, one with a homologous virus to the vaccine (A1) and the other with a heterologous virus (A2) known to be circulating in the region. The likelihood of protection afforded by the vaccine against a homologous and a heterologous challenge was calculated as shown below.
Table 1. Summary of titre values that correlated with protection from Barnett et al. (2003)
SerotypeLog titre
T50 T50 (95% Cl) T95
A 1.45 1.326 1.56 2.567
T50 = titre at which animals are protected with probability of 50%T95 = titre at which animals are protected with probability of 95%95% CI = 95% confidence interval
Table 2. Individual antibody titres 21 days after vaccination, assessed by VNT with a homologous (A1) and a heterologous (A2) test virus.
Animal ID Neutralisation titre
A1 A2
1 1.81 1.34
2 1.51 0.90
3 1.20 1.04
4 1.34 1.20
5 1.81 2.11
Table 3. Average (Geometric Mean) titres and expected probability of protection for vaccine against challenge by homologous (A1) and a specific heterologous (A2) virus
SerotypeNeutralisation
titreLog titre
Expected probability of
protectionP value*
A1 1 in 34 1.53 0.73 0.125
A2 1 in 21 1.32 0.48 0.529
*A P value <0.05 indicates that the expected probability of protection is significantly higher than that expected to protect 50% of animals
protection (see Fig. 3). For example, if the VNT is performed at the World Reference Laboratory for FMD, mean antibody titre in VNT between 1.2 and 1.6 (in log10) or in LPBE equal (or above) 2.0 (in log10) (17), respectively, on serum samples collected at 21 or 28 dpv is indicative of an adequately protective response. Those cut-offs can then be utilised when performing PVM according to the methodologies explained hereafter.

31EVALUATION OF THE IMMUNE RESPONSE
Foot and mouth disease vaccination and post-vaccination monitoring. Guidelines
3.4
Evaluation of immune responses
in vaccinated animals under
field conditions
This field study method is proposed for use once a vaccine has been selected in order to gain a better understanding of how it will behave in a larger group of animals than that utilised in the pre-purchase trial described in section 3.3 above. If there is no requirement to undertake the pre-purchase trial, then some of the objectives of that trial (such as serological test calibration) can also be accomplished after vaccine purchase using this field study. The approach is one of a longitudinal study, in which a selected cohort of animals is vaccinated and monitored over time.
A suggested protocol is provided in this section (with the statistical background explained in more detail in Annex 2).
The specific objectives for such an evaluation are as follows:
– to provide an accurate estimate of the proportion of animals that will develop an SP antibody titre equal to or greater than a pre-specified level at day 28 after vaccination;
– to provide an accurate estimate of the proportion of animals that will maintain an SP antibody titre equal to or greater than a pre-specified level at days 56 and 168 (after first vaccination);
– to provide an accurate estimate of the range and mean antibody response at days 28, 56 and 168 (after first vaccination);
– to indicate whether or not the vaccine elicits NSP antibody responses in vaccinated animals.
Depending on the data available, these studies may be used to evaluate protection as follows:
– In cases in which countries have no data on correlation between serology and protection, results from these trials (the mean, the distribution and the 95% confidence intervals [95% CIs] of titres) may help to establish provisional cut-off values to be used in wider sero-surveys.
– In cases in which countries have enough data to establish a provisional cut-off value (e.g. ‘highly protected’ and ‘poorly protected’), the main expected result would be the proportion of animals in each of those two groups. In addition to the mean, the
distribution and the 95% CI of titres will help to refine the cut-off values.
– In the case in which a country has established the relationship between titres and protection, the results will allow estimation of the expected level of protection of animals belonging to the vaccinated population under field conditions.
Any assessment of immune responses to vaccination requires a source of FMD seronegative animals and a holding facility or farms where the animals can be maintained and monitored under conditions that minimise the risk of the animals becoming infected with FMDV. In countries with a high incidence of FMD (PCP-FMD stage 1 or 2 ) and/or where vaccination has been widely used, it may be difficult to find animals free of antibodies to the virus resulting from either active or passive (colostral) immunisation. In such situations, in order to ensure a low likelihood of exposure to FMD while the monitoring is on-going, the epidemiological units (epi-units) could be selected based on knowledge of no past exposure to FMDV in the previous two years.
The following protocol may be used to evaluate the immune response in vaccinated animals under field conditions:
a) suggested values for expected proportion of animals that will develop a specific level of antibodies in the age category 6–12 months – 85%;
b) allowable standard error – 10%;
c) level of confidence – 95%.
– Based on the above values, 49 animals are need for the study.
– Increase the sample size to 55 animals, in order to compensate for possible withdrawals, previous exposure to the virus or problems with sample analysis.
– Animals from 6 to 12 months of age, known to be free of FMD antibodies (NSP and SP to vaccine strains) should be selected by either simple random sampling or systematic random sampling.
– Select a sufficient number of epi-units to carry out the trial to achieve the required number of animals. Ideally the epi-units selected should have little chance of being exposed to field viruses (no FMD detected in the past two years) in order not to confound the effect of the vaccine with the effect due to exposure to field virus.
– Animals should be individually identified.
– Collect blood samples at days 0 (time of first vaccination), 28 (time of booster dose), 56 and 168.

32 EVALUATION OF THE IMMUNE RESPONSE
Foot and mouth disease vaccination and post-vaccination monitoring. Guidelines
– Analyse samples to:
- Determine the titres of SP antibodies against homologous vaccine virus (no antibodies to FMDV should be found at day 0). It is also advisable to measure SP antibody titres against field strain(s) to measure protection against circulating virus.
- Determine the presence of NSP (NSP antibodies should be absent throughout the field trial).
– Calculate the proportion (and its confidence interval) of animals that developed specific antibody titres (or the proportion of animals developing an antibody titre equal to or above a cut-off considered to be protective).
– Calculate the mean specific antibody titre at the different time points.
The evaluation is successful only if animals are negative for both SP and NSP antibodies at the start. NSP seroreactivity at any time point indicates possible infection or lack of purity of the vaccine used.
The results of such a field study should provide information (i) about the expected proportion of animals that will develop a specific level of antibodies following the administration of a single dose of the vaccine, (ii) to evaluate the effect of a booster dose, and (iii) about the duration (and level) of specific antibody titres over time. In combination with vaccine coverage data (if available), it can be used to estimate the expected proportion of animals with a specific level of antibodies at the population level. This partly addresses the aims of the studies indicated in section 3.5, although it is likely that in countries endemic for FMD the immune status of a population will be the combined effect of current or past vaccination programmes and previous exposure to field virus. In addition, wider field studies are needed to detect regional differences in vaccine application and induced immunity.
The evaluation of the serological titres against a specific level of antibodies (considered to be protective) can also be interpreted as vaccine efficacy that in this case will correspond to the proportion of individuals that have developed an immune response equal to or above the protective titre.
Few countries may be in a position to establish a serological titre cut-off point to discriminate between highly and less protected animals (as is done in South American countries). However, some countries may have useful information from the vaccine manufacturer or from experts on what level of antibodies may be considered acceptable. In such circumstances, the quantitative evaluation of the mean antibodies titre (and its 95% confidence interval) may help to establish provisional cut-off values.
3.5
Post-vaccination monitoring
to assess immunity at
population levelThe overall population immunity is the proportion (percentage) of animals with immunity in the whole population susceptible to FMD, or at least that part of it that has been targeted for FMD control. This is a function of the vaccine coverage and the proportion of animals that responded to vaccination, as well as reflecting other sources of immunity, namely infection, earlier vaccination or maternally derived antibodies. In countries embarking on FMD control where infection is still common, significant levels of post-infection immunity may be anticipated (commonly 15–30% or greater), whereas in countries at later stages of FMD eradication, post-infection immunity is unlikely to be a significant component of population immunity.
It has been already mentioned when introducing vaccine coverage, how important it is to be clear, when designing and interpreting sero-surveys for population immunity, whether the aim is to sample only vaccinated animals or the entire population. In the example illustrated (Fig. 4), the whole population is a total of 30 cattle. The population eligible for vaccination is a subset of this population comprising 24 cattle. Of these 24 cattle, 20 are vaccinated and 14 have sufficient antibody against FMD (cattle surrounded by a green border). These antibodies may be due to either vaccination or infection and it is possible to distinguish between the two if both SP and NSP testing is performed, as vaccination should induce only SP antibodies, whereas infection will induce both SP and NSP antibodies. Some possible reasons for having non-immune cattle in the vaccinated population are:
– not vaccinated, despite being eligible – not at home during campaign, too wild to vaccinate, late pregnancy, owner not cooperative;
– not vaccinated because ineligible (e.g. below minimum age);
– vaccinated but no immune response – depends on potency of vaccine, application of vaccination (low dose, spilled dose), shelf life of vaccine, cold chain.
Reasons for animals not being part of the vaccinated population include:
– insufficient vaccine doses available;
– cattle not eligible for vaccination, for example too young;

33EVALUATION OF THE IMMUNE RESPONSE
Foot and mouth disease vaccination and post-vaccination monitoring. Guidelines
– cattle newly introduced from a non-vaccinating source, for example imported.
The overall population immunity (OPI) in the target population is the best indicator of how readily virus can spread and cause disease, whereas the vaccinated population immunity (VPI) is a useful measure of the response to vaccination and, when combined with data on vaccine coverage, provides an overall measure of the quality of the vaccination programme.
As already mentioned, the population immunity achieved at any point in time through a vaccination programme may be influenced by the structure and dynamics of the
entire susceptible population targeted for vaccination and if, between one campaign and the next one, the turnover of the animals is particularly high, then the overall immunity level may fluctuate over time bringing the level of overall protection down to one that may not be adequate to interrupt the chain of transmission (should FMDV be introduced).
Evaluating the level of population immunity is important to assess both the proportion of animals with a specific level of antibodies and also their distribution. The presence of clusters of individuals with low levels of antibodies may facilitate the introduction and maintenance of the agent in the population and may also indicate that in
Fig. 4 Example population to illustrate non-vaccinated, vaccinated and vaccinated but not immune components
Total population (30) Eligible population (24) Vaccinated population (20) Immune population (14)
Vaccine coverage is 20 out of 24 = 83% Vaccinated population immunity is 14 out of 20 = 70%Vaccinated population is 20 out of 30 = 67%Overall population immunity is 14 out of 30 = 47%Plus potential complication of immunity from infection

34 EVALUATION OF THE IMMUNE RESPONSE
Foot and mouth disease vaccination and post-vaccination monitoring. Guidelines
specific farming systems different scheduling of vaccine administration should be adopted (as may be the case for large pig farms, where vaccination is carried out on a semi-continuous basis). Identification of such high-risk clusters (farms, villages, etc.) may help in the understanding of the epidemiology of disease infection and in improving the vaccination programme.
There are two general approaches to assess the immune status of a population:
1. estimating the immune status at individual animal level; or
2. estimating the immune status at epi-unit level (e.g. herd or village).
The two approaches have different methodological requirements, so that, usually, one or other, but not both, of the two methodologies will be applied. In general, estimating the immune status at individual animal level is recommended whenever vaccination is carried out in countries qualified at PCP stage 2 or 3 (when FMD virus is still expected to circulate), while the estimation of immune status at epi-unit level may be recommended at higher stages of PCP when expectation of virus circulation is low and a country is achieving (or has already achieved) official status of freedom with or without vaccination.
Whatever approach is adopted, the type of study to be implemented will fall under the category of a cross-sectional one, with animals being sampled at a specific point in time.
Details on the statistical methodological background and examples are provided in Annex 2.
The goal is to estimate either the proportion of individual animals with a specific level of antibodies (section 3.5.1) or the proportion of individual herds or epi-units within which the proportion of individual animals is expected to be above a certain threshold for that group to be considered protected (section 3.5.2).
The timing for individual sample collection will depend on which type of information is to be obtained. Assuming that the vaccination campaigns are regularly carried out every six months, then, in general, there are two possible scenarios:
1. samples are collected at the time of vaccination (which will allow estimation of immunity at the start of the campaign as well as the residual immunity from previous campaigns); and
2. samples are collected at a specific point in time after animals have been vaccinated (blood samples collected from one to three months after animals have been vaccinated will allow estimation of immunity at its highest level).
Animals can also be sampled at two different points in time to assess the changes in population immunity. As an example, sampling at time 0 (time of vaccination) and again after one to three months should show a significant increase in the level of population immunity. It should be noted that, if such double sampling is carried out, it is not essential that the same animals are sampled in the two rounds.
It should also be noted that the proposed assessment differs from the one illustrated in section 3.4, as in this case it will target individuals irrespective of their vaccination status (i.e. to evaluate OPI). In theory, animals less than 6 months old could also be sampled, but, in practice, usually only two or three age categories are evaluated, namely 6–12 months old, 12–24 months old and more than 24 months old. The justification for including the youngest age group depends upon the objective of the survey and whether or not it is intended to obtain an estimation of the protective level of antibodies indirectly conferred by colostral immunity and to evaluate the optimal age for primary vaccination. In practice, if the objective includes assessment of the level of immunity in the young stock not eligible for vaccination, then four age-groups need to be targeted, and suggested sample sizes are indicated in the next section. Should the survey be restricted only to those age groups eligible for vaccination, the six months and under category will be excluded and sample sizes remain unchanged for the three age groups considered.
The following methods can be used to establish the thresholds for acceptance of serological measures of immunity. They achieve different objectives and require different prior information. One method might be used for the majority of the testing, complemented by alternative tests on a subset of the collected sera. The ultimate aim is to provide protection against field challenge, and the third approach comes closest to measuring this:
a) Demonstrating that field use of the vaccine has been as effective as use under controlled conditions and that animals have been successfully vaccinated with intact vaccine. For this approach, use post-vaccination sera from controlled studies (such as that described above in section 3.3.1.) to provide a benchmark level of expected immunity. These control sera should have been collected at the same time after vaccination as those being used for the population survey. Regardless of the type of SP antibody test used and of its strain composition, the expectation would be to obtain similar titres in the field, providing an assurance of the effectiveness of vaccine delivery.
b) Demonstrating that vaccination has elicited sufficient immunity to protect animals against challenge by a virus
35EVALUATION OF THE IMMUNE RESPONSE
Foot and mouth disease vaccination and post-vaccination monitoring. Guidelines
strain homologous to that of the vaccine. Use an SP test employing a virus homologous to the vaccine and use a threshold determined by either a homologous potency test or an estimate derived from calibration sera or based on past experience of the test.
c) Demonstrating that vaccination has elicited sufficient immunity to protect animals against challenge by a virus strain circulating in the region and likely to be a threat. Use an SP test employing a locally circulating virus (or equivalent strain) and use a threshold determined by either a heterologous potency test or an estimate derived from calibration sera or based on past experience of the test.
3.5.1 Post-vaccination monitoring to assess population immunity at individual animal level
a) Suggested values for the expected proportion of animals with a specific level of antibodies in the following age groups:
– age 0–6 months – expected proportion 60%;
– age 6–12 months – expected proportion 70%;
– age 12–24 months – expected proportion 80%;
– age > 24 months – expected proportion 90%.
b) Allowable standard error – 10%.
c) Level of confidence – 95%.
– Based on the above values, the following number of epi-units for each of the age groups will be required:
- age 0–6 months – 26 epi-units, collect 10 samples per unit (total 260 samples);
- age 6–12 months – 26 epi-units, collect 7 samples per unit (total 182 samples);
- age 12–24 months – 26 epi-units, collect 4 samples per unit (total 104 samples);
- age > 24 months – 26 epi-units, collect 2 samples per unit (total 52 samples).
– A total of at least 598 blood samples will then be required for this study (which will reduce to 338 if the age-group six months and under is not sampled). The sample size should be increased by one additional epi-unit per group, in order to compensate for possible withdrawals.
– Selection of epi-units depends on the available sampling frame:
- Should a reliable list of epi-units and the estimated number of animals for each epi-unit exist (and their distribution in the four age groups), then epi-units
may be selected with probability proportional to size (PPS) taking into account that PPS may be different for each of the four age groups considered for sampling. If this procedure for selecting primary sampling units (PSUs) has been utilised, then analysis of samples can be conducted using the procedure described in Annex 2 (example II.a – option 1).
- Should only a reliable list of epi-units be available, then epi-units may be selected by simple random sampling (SRS). If this procedure for selecting PSUs has been utilised, then analysis of samples can be conducted using the procedure described in Annex 2 (example II.a – option 2).
– In each selected epi-unit, animals from each age-group may be selected by SRS or systematic random sampling.
– Collect blood samples according to the procedure established (at the time of vaccination and/or at any point in time).
– Analyse the samples:
- Determine the proportion of animals with detectable levels of SP against the homologous vaccine strains and NSP antibodies. It is also advisable to measure SP antibody titres against field strain(s) to measure protection against circulating virus.
– Determine the mean titres of SP antibodies.
– Calculate the level of SP antibodies and the confidence interval for each age group:
- If epi-units were selected with PPS, then use equations 13, 14, and 15 (in Annex 2).
- If epi-units were selected by SRS, then use equations 16, 14, and 17 (in Annex 2). The proposed procedure is based on the assumption that the minimum age for being eligible for vaccination is six months and that campaigns will be carried out every six months. The age-cohort of animals six months and under will contribute to the overall estimate of immunity and will possibly allow also the assessment of the presence of maternal antibodies and how passive immunity contributes to the overall population immunity.
The sample size proposed has been estimated for different expected proportions (from 60% to 90%), assuming that, when regular vaccination is carried out, the proportion of SP-positive animals will progressively increase with age. It should also be noted that the number of the primary sampling units sampled should be always above 25 epi-units, to conform to statistical theory regarding unbiased parameter estimates (13).

36 EVALUATION OF THE IMMUNE RESPONSE
Foot and mouth disease vaccination and post-vaccination monitoring. Guidelines
These figures can be changed (following the procedures described in Annex 2). For example, if more precision is required, then the allowable error can be lowered to 5%, which in turn will increase the size of the samples to be collected. The main constraint will be the resources available within countries to implement such surveys.
The way in which the epi-units are selected (either using a PPS or SRS procedure) will affect the way in which the proportion of positive animals (and its confidence interval) can be estimated (see Annex 2 for details on this issue).
3.5.2 Post-vaccination monitoring to assess population immunity at herd level
In countries where the main purpose of the vaccination is to reduce the incidence of clinical FMD (epi-setting 1, usually corresponding to stage 2 of the PCP-FMD), this approach may not be recommended, as it is expected that a significant proportion of animals will show immunity due to previous exposure to field virus.
It may, however, be useful to assess immunity at herd level where the expectation for being seropositive is mainly (if not exclusively) due to the administration of the vaccine, and so this methodology is appropriate for countries under scenario B (likely to be in stage 3 of the PCP-FMD or even higher), clearly aiming for eradication, and also for countries in scenarios C and D.
The purpose is to estimate the proportion of ‘epi-units not-adequately vaccinated’ (NAVEU) (see example III.a in Annex 2), which implies that an epi-unit may be defined as ‘adequately vaccinated’ when a given proportion of animals with a specific level of antibodies is found.
In order to estimate the sample size within each sampled epi-unit, it is necessary to establish a threshold proportion below which the epi-unit is considered not protected:
a) suggested values for expected proportion of NAVEUs – 20%;
b) allowable standard error – 10%;
c) level of confidence – 95%;
d) target threshold value to define a single epi-unit as NAVEU is when the proportion of animals with a specific antibody’s titre is: (i) less than 60% in the 6–12 months age group, AND (ii) less than 70% among the 12–24 months age group;
e) probability of detecting 0 animals with a level of antibodies equal to or above a specific titre 0.05 (in each of the two age groups).
– Based on the above target values, 62 epi-units and three individual animals 6–12 months old and two individual animals 12–24 months old are needed in each epi-unit selected .
– Increase sample size to 70 epi-units in order to compensate for animals previously exposed to field virus or problems with sample analysis.
– Select the number of epi-units by SRS.
– In each selected epi-unit, animals are selected by SRS or systematic random sampling.
– Collect blood samples according to the procedur e established (at the time of vaccination and/or at any point in time).
– Analyse samples to:
- Determine the titres of SP antibodies against homologous vaccine strains. It is also advisable to measure SP antibody titres against field strain(s) to measure protection against circulating virus. Determine the presence of NSPs (exclude any epi-unit in which test results indicate likelihood of infection).
- An individual epi-unit is classified as NAVEU if either among the three sampled 6- to 12-month-old animals or among the two sampled 12- to 24-month-old animals no SP positives are found.
– Calculate the proportion of NAVEU and its confidence interval:
- use equations 3 and 4 (illustrated in Annex 2).
It is important to further highlight that the sampling is restricted only to those age groups eligible for vaccination, and the categorisation of the individual herd as NAVEU will be based on the findings in those selected age groups. Therefore, this approach does not provide information about the overall level of protection within herds.
Sample size, as estimated in the above example, can be changed and adjusted to local conditions and depending on which age group(s) is considered to be the best source of information. The main advantage of this approach is that it will require a number of samples that is significantly less than that required by the methodology described in section 3.5.1, and, in addition, the design and analysis of the study is greatly simplified.
37EVALUATION OF THE IMMUNE RESPONSE
Foot and mouth disease vaccination and post-vaccination monitoring. Guidelines
3.6
Checklist for post-vaccination
monitoring of immunity
– Obtain evidence of vaccine efficacy and, if possible, post-vaccination sera from vaccine manufacturers’ potency and batch release tests.
– Establish serology thresholds taking account of the impact of variability in the immune responses of animals, in the reproducibility of tests and in the antigenic properties of vaccine, field and test viruses.
– Carry out a pre-purchase study of elicited immunity in a small group of local animals and afterwards in a cohort of animals in the field when vaccination has been implemented.
– Monitor levels of regional and overall population immunity to determine if vaccination has been implemented properly and if protection can be expected.


Foot and mouth disease vaccination and post-vaccination monitoring. Guidelines
CHAPTER 4
MONITORING THE IMPACT OF VACCINATION
AND OTHER CONTROL MEASURES


Foot and mouth disease vaccination and post-vaccination monitoring. Guidelines
MONITORING THE IMPACT OF VACCINATION AND OTHER CONTROL MEASURESChapter 4 (39-45)
4.1
Introduction
The serological evidence of immunity, as described in Chapter 3, does not provide direct evidence of achieving the purpose for which the vaccination programme was implemented (i.e. FMD control), so it is important to also monitor the occurrence of FMD outbreaks and/or infection. However, as FMD tends to occur spasmodically, in waves of infection with quiescent intervals, a lack of outbreaks cannot be taken as assurance of an effective vaccination programme. Monitoring both immunity and outbreaks and/or infection is therefore required.
In most circumstances, it is likely that the vaccination programme is one, among others, of the elements of an overall programme and, consequently, it may be difficult to disentangle the effect of vaccination from the other control measures.
Movement controls, other zoosanitary measures and stamping out are typically part of the response mechanism to prevent incursions of the virus and occurrence of secondary outbreaks (Fig. 5), while vaccination can be used either as a response mechanism (emergency vaccination) or as a preventive tool to mitigate the impact of FMDV should incursions occur in the area or farming system targeted for vaccination.
Therefore, the evaluation of the effectiveness of a control programme will be the result of a combined effect of vaccination (if used) and additional measures.
Immunity against FMD virus
Quarantine or stamping out
Animal movement restriction
Biosecurity and sanitation
FMD control
Fig. 5 The elements of control of foot and mouth disease
4.2
Vaccine efficacy and
effectiveness
Vaccine efficacy is a measure of how well a vaccine protects an animal against a given undesirable outcome, for instance disease, virus replication, virus shedding or virus transmission, when tested under controlled conditions such that the circumstances of vaccination and challenge infection are well characterised. An example is the cattle potency test described in the Terrestrial Manual, whereby following a prescribed regime of vaccination and challenge, the outcome measured is the generalisation of virus after inoculation into the tongue, leading to the appearance of vesicles on the feet (44). The measure gives an indication of the intrinsic quality of the vaccine.
Vaccine efficacy, in addition to the method described above, can also be measured under controlled field conditions through randomised controlled trials (RCTs). In such a case, vaccine efficacy is expressed as the amount of reduction of disease/infection in the vaccinated population compared with a control population administered with a placebo.
Vaccine efficacy is sometimes confused with vaccine effectiveness, which is an indicator of how well animals are protected in the field by a programme of vaccination (26). Vaccine effectiveness is a measure of the protection afforded against a given undesirable outcome, usually disease or infection, derived from a comparison between the incidence of the outcome in vaccinated and unvaccinated animals within the same population. It not only depends upon the initial (intrinsic) quality of the vaccine, as supplied by the manufacturer, but also upon extrinsic factors, such as the impact of vaccine storage and distribution, the vaccine match, the vaccination schedule and, indirectly, vaccine coverage.
One of the reasons why vaccine efficacy and effectiveness are sometimes incorrectly used inter-changeably may be because both can be estimated using the same equation:
VE = (RU –RV)/RU (equation 1)
where RU is the incidence risk or rate in the unvaccinated population, and RV is the incidence in those vaccinated.

42 MONITORING THE IMPACT OF VACCINATION AND OTHER CONTROL MEASURES
Foot and mouth disease vaccination and post-vaccination monitoring. Guidelines
Although the two concepts are related, they should be viewed as distinct because they differ in the approach used for their estimation: (i) vaccine efficacy is estimated through an RCT; while (ii) vaccine effectiveness is estimated through field observational studies or sometimes field trials under normal programme conditions.
In order to avoid confusion between efficacy and effectiveness; the acronym VE shall refer (in this document) to vaccine effectiveness, with equation 1 reformulated as:
VE = 1 – (RV/RU) (equation 2)
and it is normally given as a percentage.
Along the PCP-FMD, stages 2 and 3 are those where control measures are applied while the disease/infection is still present. It is possible that, in stage 2, vaccination may be the only measure applied (a country may not find it feasible to achieve freedom from FMD and may wish to balance the economic cost of the disease with the cost of vaccination), whereas once stage 3 is entered, a decision to move towards freedom from disease has been taken and a more aggressive policy will be adopted with the clear aim of eradication.
It is when countries are in either stage 2 or 3 of the PCP-FMD (when FMD outbreaks are still expected to occur) that vaccine effectiveness should be measured to ensure that under field conditions the vaccine used is conferring the expected protection.
4.3
Investigating outbreaks in
vaccinated animals
Thorough investigation of outbreaks that occur in vaccinated animals, where protection would have been expected, is an important aspect of monitoring the performance of vaccination. Findings should be considered in the context of the wider monitoring programme described in Chapters 2 and 3, so as to decide whether the breakdown may have a specific and local cause or be part of a wider problem with the vaccination programme. A systematic approach is recommended in order to check off all the steps where
Fig. 6 Disease outbreak investigation – Considerations and contributory factors
Outbreak in vaccinated animals
Introduction of new virus with poor match to vaccine strains
Vaccine contaminated with live FMD virus
Conduct innocuity testing in remaining vaccine batch See Figure 7
Contributing factors1. Host factors:
a) Age of vaccinates (young animals received one vaccine dose)
b) Health condition (stress, malnutrition, infection)
c) Time of last vaccination2. Vaccine characteristic:
a) Low potencyb) Unstablec) Past recommended shelf life
3. Vaccine application:a) Vaccination schedule (elapse in
interval of vaccinations)b) Low vaccination coveragec) Breach in maintaining cold chain
4. Serological test used for PVM analysis:a) Low test specificity, false positiveb) Misinterpretation of lab results c) Untrained laboratory staff
5. Overwhelming challenge due to lack of other effective FMD control measures
Report to manufacturer if confirmed
Conduct field investigation and laboratory confirmation
Check timing of vaccination in relation to active circulation of
field virus
Failure in vaccination programme in presence of
active virus circulation

43MONITORING THE IMPACT OF VACCINATION AND OTHER CONTROL MEASURES
Foot and mouth disease vaccination and post-vaccination monitoring. Guidelines
problems could potentially have occurred from initial vaccine quality and suitability, through vaccine storage, delivery and vaccination, vaccine coverage, induced immunity and the nature of the challenge, which might have been overwhelming owing to weight of infection, long post-vaccination interval or change in antigenic phenotype (Fig. 6).
The timing of outbreaks in relation to vaccination is a key consideration, as immunity takes time to develop and then wanes. Figure 7 shows a decision tree for this aspect of an investigation. A specific methodological approach utilising data collected in the course of outbreak investigations is given in Annex 4, based on experience of retrospective outbreak investigations in Turkey (27).
4.4
Effectiveness of a foot
and mouth disease control
programme
As already mentioned, and depending on the status of the country or zone, an FMD control programme (which may include vaccination) should be designed and implemented with a clear purpose at the outset. The same categories used in Chapter 3 to define target values for assessing immunity
Vaccination campaign applied
after incubation time of outbreak
(when first clinical signs were
already present)
FMD virus was already present at
time of vaccination campaign
Need to check
with any epi-units
being vaccinated
subsequently that
no FMD virus has
been transferred
leading to spread of
infection
Stresses the
need for SOP on
biosecurity measures
by vaccinators
Vaccination campaign within incubation time of outbreak
(1-30 days prior to date of first
clinical signs)
There is direct time-association
between vaccination activities
and introduction of FMD virus as
incubation period overlaps with
date of vaccination
Need to check with
epi-units vaccinated
previously if clinical
FMD was apparent
or became apparent
later
Vaccination campaign before incubation time of outbreak (more
than 30 days prior to date of first
clinical signs
There is apparent time association
between vaccination and
introduction of FMD virus,
however, there is no overlap found
between incubation period and
date of vaccination
Result
Interpretation
Consideration
Actions
Fig 7 Disease outbreak investigation Determining the relation between timing of the vaccination campaign and the incubation period of the outbreak SOP: standard operating procedure
Apparently, the vaccination has
not lead to sufficient protection
against FMD infection, which
should be further investigated
Need to check
vaccine safety
– is vaccine
virus sufficiently
inactivated?
Need to check vaccine
attributes:
– matching between field
virus and vaccine virus
– potency of vaccine
– shelf life
– cold chain
Conduct vaccine effectiveness
study
Are vaccinated animals better
protected against clinical FMD
compared with non-vaccinated
animals?

44 MONITORING THE IMPACT OF VACCINATION AND OTHER CONTROL MEASURES
Foot and mouth disease vaccination and post-vaccination monitoring. Guidelines
are now used to set the strategic objectives of a control programme. These are summarised in Table VII.
4.5
Monitoring
Monitoring is the process of management by which performance indicators are used to show that the expected results are being attained during or following a vaccination programme. Designing a monitoring system needs indicators of success of the secondary preventive measures to be defined in terms of one or more of the following:
– the expected extent of reduction of disease or virus circulation;
– the acceptable incidence of disease, below which a programme is considered successful;
– the absence of disease or circulation.
Decisions on these performance indicators are usually made by consultation with public and private sector stakeholders before control programmes commence. Setting achievable
outcomes is important, and these outcomes should be those that will ensure the continued support of stakeholders.
4.6
Status at the start
of implementation
As described above, the objective of an FMD vaccination campaign can be either to reduce clinical disease or to eliminate FMDV infection or regain freedom from FMD. It is clear that, for each of these strategic objectives, there is a well-determined outcome that is targeted to be achieved at the outset.
For the purpose of clarity and in order to establish baseline information prior to the implementation of a control programme, it is important that those implementing and/or those who wish to monitor the programme evaluate whether the outcomes defined at the outset were achieved. In line with international standards, this guideline uses definitions of FMD case, infection and circulation that are
Table VII Strategic purpose of a control programme and indicators of success
Category
Strategic purpose of the control programme
Status at the start of implementationOutcome expected
Criterion indicating success
(see 4.4 below)Comments
(see 4.5 below) Virus circulation OIE statusPCP-FMD
stage
A
Reduce
clinical FMD
incidence
Occurs (indicated
by cases or
outbreaks of
disease)
Not free Usually 2Disease incidence
reduced
Disease incidence
reduced to acceptable
levels (set by
stakeholders)
Acceptable level of
disease can be used
where pre-control
baseline is not known
B
Eliminate
FMDV
circulation
Occurs (may or may
not be reported
disease) or may not
occur
Not free Usually 3 Virus circulation
reduced
FMDV circulation
reduced to zero or below
an acceptable level (set
by stakeholders)
Acceptable level of
circulation can be used
where pre-control
baseline is not known
C
Retain status
of free with
vaccination
Does not occur
Evidence for
absence accepted
by OIE
Free with
vaccination
Typically 4
and 5
Evidence sufficient
to retain free status
No virus circulation
detected
Fulfils requirements of
the Terrestrial Code to
retain status
Rationale behind
vaccination is that
incursions would have
less impact than if free
without vaccination
adopted
D
Regain
freedom after
an incursion
(emergency
vaccination)
Occurring
(outbreaks
resulting from
incursion into FMD
free country or
zone)
Disease-
free status
suspended
Assumes that
country was in
stage 4 or 5
Evidence sufficient
to substantiate
absence of virus
circulation
Fulfils requirements
of the Terrestrial Code
(trading partners) to
regain status

45MONITORING THE IMPACT OF VACCINATION AND OTHER CONTROL MEASURES
Foot and mouth disease vaccination and post-vaccination monitoring. Guidelines
in accordance with the Terrestrial Code, 2013 (Boxes 1, 2 and 3).
BOX 1 FMD case (OIE Terrestrial Code, Chapter 8.6.1.)
A case is an animal infected with FMD virus.
BOX 2FMDV infection (OIE Terrestrial Code, Chapter 8.6.1.)
1. FMD virus (FMDV) has been isolated and identified as such from an
animal or a product derived from that animal; or
2. Viral antigen or viral ribonucleic acid (RNA) specific to one or more of
the serotypes of FMDV has been identified in samples from one or more
animals, whether showing clinical signs consistent with FMD or not, or
epidemiologically linked to a confirmed or suspected outbreak of FMD, or
giving cause for suspicion of previous association or contact with FMDV;
or
3. Antibodies to structural or non-structural proteins of FMDV that are not a
consequence of vaccination, have been identified in one or more animals
showing clinical signs consistent with FMD, or epidemiologically linked to
a confirmed case?
BOX 3 FMDV circulation (OIE Terrestrial Code, Chapter 8.6.42.)
From the OIE Terrestrial Code, virus circulation means transmission of FMDV
as demonstrated by clinical signs, serological evidence or virus isolation.
4.7
Expected outcomes
The expected outcome of the control programmes listed under A to D in Table 4.1 in the Terrestrial Code are defined in terms of one or more of the following:
1. The incidence of disease or FMDV infection is reduced.
2. The incidence of disease or FMDV infection is below a defined target value.
3. The incidence of disease or FMDV infection is shown to be absent.
The general approach to monitoring a control programme will make extensive use of epidemiological field observational studies that are not considered in the present guidelines. How to design such studies can be found in many epidemiology textbooks.


Foot and mouth disease vaccination and post-vaccination monitoring. Guidelines
REFERENCES

Foot and mouth disease vaccination and post-vaccination monitoring. Guidelines
REFERENCES(47-50)
1. Alexandersen S., Zhang Z., Donaldson A.I. & Garland A.J.M. (2003). – The pathogenesis and diagnosis of foot-and-mouth disease. J. comp. Pathol., 129, 1–36. doi: 10.1016/s0021-9975(03)00041-0.
2. Armitage P. (1971). – Statistical methods in medical research. Blackwell Scientific Publications, Oxford, United Kingdom.
3. Barnett P.V., Statham R.J., Vosloo W. & Haydon D.T. (2003). – Foot-and-mouth disease vaccine potency testing: determination and statistical validation of a model using a serological approach. Vaccine, 21, 3240–3248. doi: 10.1016/S0264-410X(03)00219-6.
4. Barteling S.J., Yadin H. & Sutmoller P. (2004). – Discussion paper on guidelines for control of Foot-and-Mouth Disease (FMD) vaccine quality and performance in the field. Available at:www.fao.org/ag/againfo/commissions/docs/greece04/App19.pdf.
5. Bennett S., Woods T., Liyanage W.M. & Smith D.L. (1991). – A simplified general method for cluster sample surveys of health in developing countries. World Health Stat. Q., 44, 98–106.
6. Brocchi E., De Simone F., Bugnetti M., Gamba D. & Capucci L. (1990). – Application of a monoclonal antibody based competition ELISA to the measurement of anti-FMDV antibodies in animal sera. Report of the European Commission for the Control of Foot-and-Mouth Disease (Session of the Research Group of the Standing Technical Committee), Lindholm, Denmark, Appendix 14. FAO, Rome, Italy.
7. Burton A., Monasch R., Lautenbach B., Gacic-Dobo M., Neill M., Karimov B., Lara Wolfson R., Jones G. & Birmingham M. (2009). – WHO and UNICEF estimates of national infant immunization coverage: methods and processes. Bull. World Health Organ., 87, 535–541. doi: 10.2471/BLT.08.053819.
8. Chen R.T. & Orenstein W.A. (1996). – Epidemiologic methods in immunization programmes. Epidemiol. Rev., 18, 99–117. doi: 10.1093/oxfordjournals.epirev.a017931.
9. Chénard G., Miedema K., Moonen P., Schrijver R.S. & Dekker A. (2003). – A solid-phase blocking ELISA for detection of type O foot-and-mouth disease virus antibodies suitable for mass serology. J. virol. Methods, 107, 89–98. doi: 10.1016/S0166-0934(02)00196-9.
10. Cochran W.G. (1977). – Sampling techniques, 3rd Ed. Wiley, New York.
11. Doel T.R. (1999). – Optimisation of the immune response to FMD vaccines. Vaccine, 17, 1767–1771. doi: 10.1016/j.vaccine.2009.08.039.
12. Estrada C., Perez A.M. & Thurmond M.C. (2008). – Herd reproduction ratio and time-space analysis of a foot-and-mouth disease epidemic in Peru in 2004. Transbound. emerg. Dis., 55, 284–92. doi: 10.1111/j.1865-1682.2008.01023.x.
13. Farid M.N. & Frerichs R.R. (2007). – Survey version 2.0. Department of Epidemiology, University of California (UCLA). Available online: www.ph.ucla.edu/epi/programs/csurvey2_manual.pdf
14. Fleiss J.L. (1981). – Statistical methods for rates and proportions, 2nd Ed. John Wiley & Sons, Chichester, United Kingdom.
15. Food and Agriculture Organization of the United Nations (FAO) (2012). – The progressive control pathway for FMD control. Principles, stage descriptions and standards. Available online: www.fao.org/fileadmin/user_upload/eufmd/docs/PCP/PCP_en.pdf.
16. Garland A.J. (1999). – Vital elements for the successful control of foot-and-mouth disease by vaccination. Vaccine, 17, 1760–1766.
17. Hamblin C., Kitching R.P., Donaldson A.L., Crowther J.R. & Barnett I.T.R. (1987). – Enzyme-linked immunosorbent assay (ELISA) for the detection of antibodies against foot-and-mouth disease virus. 3. Evaluation after infection and vaccination. Epidemiol. Infect., 99, 733–744. doi: 10.1017/S0950268800066590.
18. Haydon D.T., Woolhouse M.E.J. & Kitching R.P. (1997). – An analysis of foot and mouth disease epidemics in the UK. IMA J. math. appl. Med. Biol., 14, 1–9. doi: 10.1093/imammb/14.1.1.
19. Hayes R.J. & Bennett S. (1999). – Simple sample size calculation for cluster randomized trials. Int. J. Epidemiol., 28, 319–326. doi: 10.1093/ije/28.2.319.
20. Henderson R.H. & Sundaresan T. (1982). – Cluster sampling to assess immunization coverage: a review of experience with a simplified sampling method. Bull. World Health Organ., 60, 253–260.
21. Jamal S.M., Bouma A., van den Broek J., Stegeman A., Chenard G. & Dekker A. (2008). – Foot-and-mouth disease vaccine potency testing: the influence of serotype, type of adjuvant, valency, fractionation method, and virus culture on the dose-response curve in cattle. Vaccine, 26, 6317–6321. doi: 10.1016/j.vaccine.2008.09.021.
22. Jamal S.M., Shah S.I., Ali Q., Mehmood A., Afzal M. & Dekker A. (2013). – Proper quality control of formulated foot-and-mouth disease vaccines in countries with prophylactic vaccination is necessary. Transbound. emerg. Dis., 61, 483–489. doi: 10.1111/tbed.12051.
50
Foot and mouth disease vaccination and post-vaccination monitoring. Guidelines
23. Keeling M.J., Woolhouse M.E.J., Shaw D.J., Matthews L., Chase-Topping M., Haydon D.T., Cornell S.J., Kappey J., Wilesmith J. & Grenfell B.T. (2001). – Dynamics of the 2001 UK foot and mouth epidemic: stochastic dispersal in a heterogeneous landscape. Science, 294 (5543), 813–817. doi: 10.1126/science.1065973.
24. Kitching R.P. & Salt J.S. (1995). – The interference by maternally-derived antibody with active immunization of farm animals against foot-and-mouth disease. Br. vet. J., 151, 379–389. doi: 10.1016/S0007-1935(95)80127-8.
25. Kish L. (1965). – Survey sampling. Wiley, New York.
26. Knight-Jones T.J., Edmond K., Gubbins S. & Paton D.J. (2014a). – Veterinary and human vaccine evaluation methods. Proc. biol. Sci., 281 (1784): 20132839. doi: 10.1098/rspb.2013.2839.. PMID: 24741009.
27. Knight-Jones T.J., Bulut A.N., Gubbins S., Stärk K.D., Pfeiffer D.U., Sumption K.J. & Paton D.J. (2014b). Retrospective evaluation of foot-and-mouth disease vaccine effectiveness in Turkey. Vaccine, 32 (16), 1848–1855. doi: 10.1016/j.vaccine.2014.01.071.
28. Knight-Jones T.J., Gubbins S., Bulut A.N., Stärk K.D., Pfeiffer D.U., Sumption K.J. & Paton D.J. (2016). – Mass vaccination, immunity and coverage: modelling population protection against foot-and-mouth disease in Turkish cattle. Sci. Rep., 6, 22121. doi: 10.1038/srep22121.
29. Mackay D., Davidson F. & Rendle T. (1996). – FAO Phase XIV – Standardisation for FMD antibody detection ELISA. In European Commission for Control of Foot-and-mouth Disease, Session of the Research Group of the Standing Technical Committee, 2–6 September Kibbutz Ma’aleHachamisha, Israel.
30. Maradei E., La Torre J., Robiolo B., Esteves J., Seki C., Pedemonte A., Iglesias M., D’Aloia R. & Mattion N. (2008). – Updating of the correlation between lpELISA titers and protection from virus challenge for the assessment of the potency of polyvalent aphtovirus vaccines in Argentina. Vaccine, 26 (51), 6577–6586. doi: 10.1016/j.vaccine.2008.09.033.
31. Nicholls M.J., Rweyemamu M.M., Okeke E.N., Shidali N.N. & Lamorde A.G. (1983). – The control of foot and mouth disease by vaccination. Considerations for Nigeria. Rev. Sci. Tech. Off. Int. Epiz., 2 (3), 771–780.
32. Nicholls M.J., Black L., Rweyemamu M.M., Genovese J., Ferrari R., Hammant C.A., de Silva E. & Umehara O. (1984). – The effect of maternally derived antibodies on the response of calves to vaccination against foot and mouth disease. J. Hyg. (Camb.), 92, 105–116. doi: 10.1017/S0022172400064081.
33. Orenstein W.A., Bernier R.H. & Hinman A.R. (1988). – Assessing vaccine efficacy in the field. Further observations. Epidemiol. Rev., 10, 212–241.
34. Paton D.J., Valarcher J.F., Bergmann I., Matlho O.G., Zakharov V.M., Palma E.L. & Thomson G.R. (2005). – Selection of foot and mouth disease vaccine strains – a review. Rev. Sci. Tech. Off. Int. Epiz., 24 (3), 981–93.
35. Pay T.W.F. (1984). – Factors influencing the performance of foot-and-mouth disease vaccines under field conditions. Academic Press, Orlando, Florida.
36. Pay T.W.F. & Hingley P.J. (1992). – Foot and mouth disease vaccine potency tests in cattle: the interrelationship of antigen dose, serum neutralizing antibody response and protection from challenge. Vaccine, 10, 699–706. doi: 10.1016/0264-410X(92)90092-X.
37. Robiolo B., La Torre J., Maradei E., Perez Bascoechea C., Perez A., Seki C., Smitsaart E., Fondevilla N., Palma E., Goris N., De Clercq K. & Mattion N. (2010). – Confidence in indirect assessment of foot-and-mouth disease vaccine potency and vaccine matching carried out by liquid phase ELISA and virus neutralization tests. Vaccine, 28, 6235–6241. doi: 10.1016/j.vaccine.2010.07.012.
38. Sumption K., Domenech J. & Ferrari G. (2012). – Progressive control of FMD on a global scale. Vet. Rec., 170, 637–639. doi: 10.1136/vr.e4180.
39. Terpstra C., van Maanen C. & van Bekkum J.G. (1990). – Endurance of immunity against foot-and-mouth disease in cattle after three consecutive annual vaccinations. Res. vet. Sci., 49, 236–242.
40. Van Bekkum J.G., Fish R.C. & Nathans I. (1969). – Immunologic responses in Dutch cattle vaccinated with foot-and-mouth disease vaccines under field conditions: neutralizing antibody responses and immunity to O, A, and C types. Am. J. vet. Res., 30, 2125–2159.
41. Van Maanen C. & Terpstra C. (1989). – Comparison of a liquid-phase blocking sandwich ELISA and a serum neutralization test to evaluate immunity in potency tests of foot-and-mouth disease vaccines. J. Immunol. Methods, 124, 111–119.
42. Woolhouse M.E.J., Haydon D.T., Pearson A. & Kitching R.P. (1996). – Failure of vaccination to prevent outbreaks of foot and mouth disease. Epidemiol. Infect., 116, 363–371. doi: 10.1017/S0950268800052699.
43. World Organisation for Animal Health (OIE) (2012). – The Global Foot and Mouth Disease Control Strategy. Strengthening animal health systems through improved control of major diseases. Available at: www.oie.int/doc/ged/D11886.PDF.
44. World Organisation for Animal Health (OIE) (2014). – Manual of Diagnostic Tests and Vaccines for Terrestrial Animals, 2014. Chapter 2.1.5. Foot-and-mouth disease. OIE, Paris. Available at: www.oie.int/manual-of-diagnostic-tests-and-vaccines-for-terrestrial-animals/.
45. World Organisation for Animal Health (OIE) (2014). – Terrestrial Animal Health Code. Available at: www.oie.int/international-standard-setting/terrestrial-code/access-online/.
REFERENCES
Foot and mouth disease vaccination and post-vaccination monitoring. Guidelines
ANNEXES


Foot and mouth disease vaccination and post-vaccination monitoring. Guidelines
ANNEX 1
(51-58)
1.
Introduction
The coverage necessary to stop the FMDV from spreading within a herd will depend upon the number of cases that one case generates on average over the course of its infectious period, in an otherwise uninfected, naïve population (the basic reproductive ratio, R0). The value of R0 will depend on the nature of the contact structures within the herd and will be greatest when large numbers of highly susceptible animals have regular contact opportunities. In a fully susceptible herd of housed cattle, an R0 of considerably greater than 10 is possible (42). Similar considerations on proximity and contact networks apply to the spread of FMDV infection between herds, but spread will usually be less efficient, giving rise to lower estimates for the herd-to-herd R0 at the start of outbreaks (values of 2–5 have been reported for outbreaks in the United Kingdom and Peru [12, 18, 23]). However, higher values have been reported where conditions favour extremely rapid spread (18).
Within herds, the figure of 80% vaccination coverage is commonly cited as a target for control of FMD (4), the denominator for coverage being, in this case, the total number of susceptible animals within herds (i.e. those both eligible and ineligible for vaccination). A vaccination coverage of 80% should reduce an Rv (Rv being the reproduction ratio in vaccinated animals) of 5 to less than 1 and thereby halt the spread of the FMDV among vaccinated animals; it should always be very clear what this 80% is referring to.
However, in many cases, vaccination does not fully block transmission and if a 75% probability of achieving this is assumed, then, with 80% coverage, an outbreak will be brought under control only where the R0 is already less than 2.5 (Table 1).
At the herd level, it should be possible to vaccinate a high proportion of herds (> 80%) but it will be difficult to achieve 100% effectiveness. However, contact between units (and thus R0) will be reduced by effective biosecurity and this will reduce dependency on unobtainable levels of vaccine protection. Conversely, effective vaccine protection will often block transmission if biosecurity is suboptimal.
It should be noted that, if regional coverage is monitored, within that region there will be areas of high coverage and areas of low coverage, possibly those hardest to access or where farmers are least motivated to vaccinate their animals. Thus, at the aggregated regional level, it may appear that coverage is sufficient to control transmission, but islands of low coverage within the region may allow reservoirs of continued virus circulation to persist.
It is also important to bear in mind that not all vaccinated animals will develop a protective level of immune response. As an example, if vaccine coverage = f = 0.9 and the proportion of animals with a protective level of specific antibodies = h = 0.95, then the overall proportion of animals with a protective level of specific antibodies will be p = 0.90 × 0.95 = 0.855 or 85.5%. Furthermore, an immune response may be due to infection rather than vaccination or may reflect earlier rounds of vaccination than that being measured. In young animals, immunity may also reflect passive uptake of antibodies from maternal colostrum.
In Chapter 2, reference was made to vaccination coverage and some of the methods used to estimate it. Regardless of the method, a reliable estimation of vaccine coverage requires that the target population to be vaccinated is known. This information, in addition to being essential
Table 1. The relationship between rate of transmission in the population and vaccination coverage needed to halt virus spread (f × h = 1 – 1/R0)
Initial rate of spread (R0)
Proportion of animals that must be
vaccinated (f), assuming vaccination is 100% effective (h)
Proportion of animals that must
be vaccinated (f), assuming
vaccination is 75% effective (h)
2.5 60% 80%
4 75% 100%
5 80% Impossible*
6.7 85% Impossible
10 90% Impossible
20 95% Impossible * Impossible to eliminate infection even by vaccinating the whole population
MONITORING VACCINE COVERAGE

Foot and mouth disease vaccination and post-vaccination monitoring. Guidelines
54 ANNEX 1
when estimating the proportion of the population covered by the vaccination programme, is also essential at the stage of planning for vaccine needs.
Estimation of the vaccine coverage implies collection of data and the assessment of activities, in order to enable the targets agreed in the action plan to be compared with what has been actually achieved. Monitoring an immunisation programme will then include the proper use of recording tools from which data can be easily retrieved at any point in time along the implementation of the vaccination campaign.
The approach proposed for monitoring and evaluating vaccination coverage is based on the following assumptions: (i) the distribution of vaccine to the vaccinators is done through a local distribution centre (lowest chain along the vaccine distribution from central to peripheral level); (ii) there is no individual animal identification in place; (iii) it is part of a structured immunisation campaign (the frequency of which is assumed to be every six months); (iv) the vaccination schedule anticipates that each farm/household is visited twice in each campaign (the first visit is to vaccinate all eligible animals present and the second to inject the booster dose to young animals as follow-up to their first dose). There may be exceptions to this that will be recorded on the vaccination card.
2.
Recording tools
2.1 Vaccination card
The vaccination card contains all relevant information about the animals belonging to a single owner and the immunisation history at herd level.
An example of a simple vaccination card is shown in Figure 1.
The vaccination card, presented as an example, is divided into three sections and the card will be filled completely in two separate steps. Section 1 is supposed to be filled in when the owner is visited for the first time under the current campaign and in accordance with the vaccination schedule (in this example, it is assumed to be every six months).
Sections 2 and 3 must be completed during the second visit to inject animals supposed to receive a booster dose (usually 30 days after having received the first dose) and/or to administer the vaccine to those animals that, although present during the previous visit, were left unvaccinated.
Many of the data necessary to fill the form are self-explanatory and the importance of reporting precise data is further emphasised.
Field 1 refers to the date of the visit and field 2 to the full name of the operator (the vaccinator).
Field 3 refers to a number or code that enables the vaccination campaign to be uniquely identified (example: autumn_2014 or 1_2014).
Field 4 indicates the number of animals present on the date of the visit belonging to specific age groups. It is important that, if the owner has animals that on the day of the visit are not physically present (e.g. they have been sent to pasture and for that reason cannot be vaccinated), they should also be indicated among the number of animals present.
Field 5 indicates the number of animals actually injected with the vaccine. In the vaccination card used as an example, the age group < 6 m (six months and under) is not eligible for vaccination and thus the corresponding cells have been shaded, indicating that the cells do not have to be filled in. It is important that animals falling into the 6–12-months age group (and as such supposed to receive a booster dose after 30 days) are now also reported in Table 2 (under the column headed by field 12).
Field 6 indicates the number of animals left unvaccinated. Animals may be left unvaccinated either because they were not eligible (under six months of age) or for some other reason that should be indicated in field 9. It is also important that the animals left unvaccinated are reported in Table 3 (under the column headed by field 15)
Fields 7 and 8 indicate the number of the batch reported on the bottle and the date of expiry of the vaccine, respectively.
Field 9 indicates the reasons why one (or more) animal(s) although eligible has not been vaccinated. Sick animals or those that may be difficult to restrain may have escaped vaccination during the first visit.
Field 10 refers to the date of the second visit and field 11 to the full name of the operator (the vaccinator).
Field 12 is the number of animals that received a first dose of vaccine during the first visit and that are supposed to receive a booster dose during the second visit. This number should be the same as the one indicated in Table 1 (age group 6–12 months, number vaccinated).
Field 13 is the number of animals still present (on the day of the second visit), of those that were supposed to receive a booster dose.
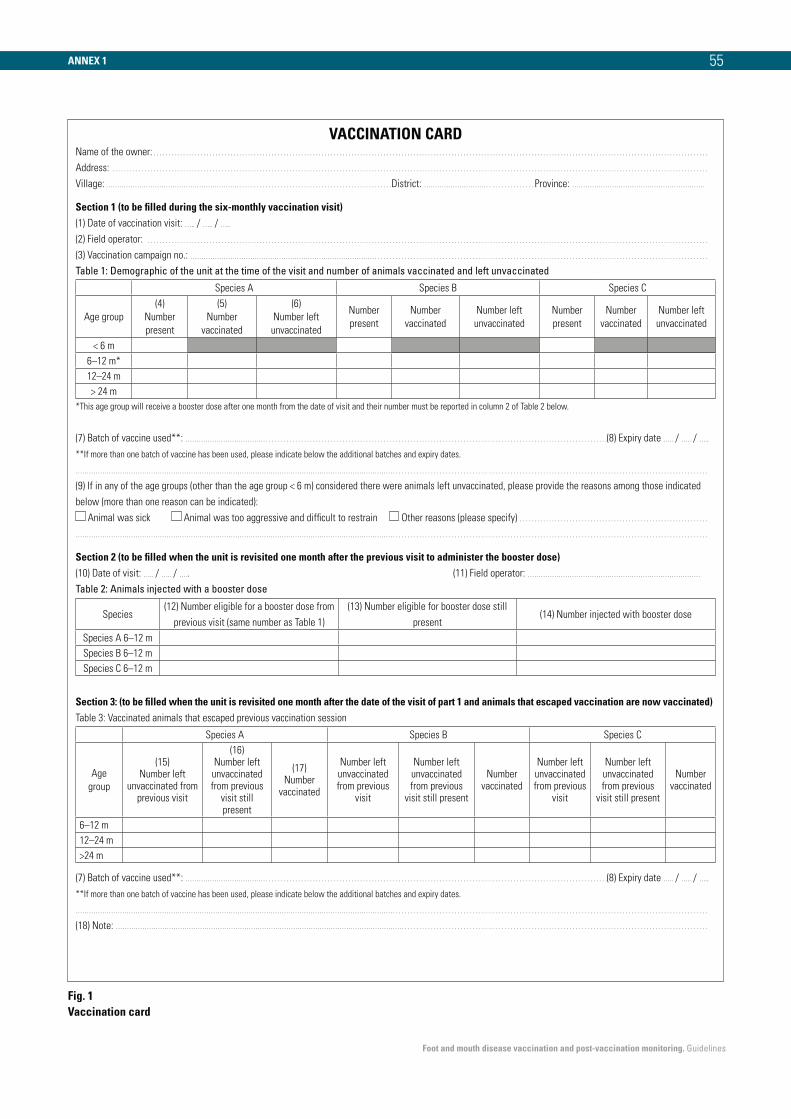
Foot and mouth disease vaccination and post-vaccination monitoring. Guidelines
55
VACCINATION CARDName of the owner: . . . . . . . . . . . . . . . . . . . . . . . . . . . . . . . . . . . . . . . . . . . . . . . . . . . . . . . . . . . . . . . . . . . . . . . . . . . . . . . . . . . . . . . . . . . . . . . . . . . . . . . . . . . . . . . . . . . . . . . . . . . . . . . . . . . . . . . . . . . . . . . . . . . . . . . . . . . . . . . . . . . . . . . . . . . . . . . . . . . . . . . . . . . .
Address: . . . . . . . . . . . . . . . . . . . . . . . . . . . . . . . . . . . . . . . . . . . . . . . . . . . . . . . . . . . . . . . . . . . . . . . . . . . . . . . . . . . . . . . . . . . . . . . . . . . . . . . . . . . . . . . . . . . . . . . . . . . . . . . . . . . . . . . . . . . . . . . . . . . . . . . . . . . . . . . . . . . . . . . . . . . . . . . . . . . . . . . . . . . . . . . . . . . . . . . . . .
Village: ……………………………………………………. . . . . . . . . . . . . . . . . . . . . . . . . . . . . . . . . . . . . . . . . . . . . . . . . . . .District: ………………………… . . . . . . . . . . . . . . Province: ……………………………………………………
Section 1 (to be filled during the six-monthly vaccination visit)(1) Date of vaccination visit: ….. / ….. / …..
(2) Field operator: . . . . . . . . . . . . . . . . . . . . . . . . . . . . . . . . . . . . . . . . . . . . . . . . . . . . . . . . . . . . . . . . . . . . . . . . . . . . . . . . . . . . . . . . . . . . . . . . . . . . . . . . . . . . . . . . . . . . . . . . . . . . . . . . . . . . . . . . . . . . . . . . . . . . . . . . . . . . . . . . . . . . . . . . . . . . . . . . . . . . . . . . . . . . . .
(3) Vaccination campaign no.: ………………………………………………………………………… . . . . . . . . . . . . . . . . . . . . . . . . . . . . . . . . . . . . . . . . . . . . . . . . . . . . . . . . . . . . . . . . . . . . . . . . . . . . . . . . . . . . . . . . . . . . . . . . . . . . . . . . . . . . . . . .
Table 1: Demographic of the unit at the time of the visit and number of animals vaccinated and left unvaccinated
Species A Species B Species C
Age group
(4)
Number
present
(5)
Number
vaccinated
(6)
Number left
unvaccinated
Number
present
Number
vaccinated
Number left
unvaccinated
Number
present
Number
vaccinated
Number left
unvaccinated
< 6 m
6–12 m*
12–24 m
> 24 m
*This age group will receive a booster dose after one month from the date of visit and their number must be reported in column 2 of Table 2 below.
(7) Batch of vaccine used**: ……………………………… . . . . . . . . . . . . . . . . . . . . . . . . . . . . . . . . . . . . . . . . . . . . . . . . . . . . . . . . . . . . . . . . . . . . . . . . . . . . . . . . . . . . . . . . . . . . . . . . . . . . . . . . . . . . . . . . . . . .(8) Expiry date ….. / ….. / …..
**If more than one batch of vaccine has been used, please indicate below the additional batches and expiry dates.
……………………………………………………………………………………………………………………………… . . . . . . . . . . . . . . . . . . . . . . . . . . . . . . . . . . . . . . . . . . . . . . . . . . . . . . . . . . . . . . . . . . . . . . . . . . . . . . . . . . . . . . . . . . . . . . . . . . . . . . . . . .
(9) If in any of the age groups (other than the age group < 6 m) considered there were animals left unvaccinated, please provide the reasons among those indicated
below (more than one reason can be indicated):
Animal was sick Animal was too aggressive and difficult to restrain Other reasons (please specify) . . . . . . . . . . . . . . . . . . . . . . . . . . . . . . . . . . . . . . . . . . . . . . . . . . . . . . . . . . . . . . . .
……………………………………………………………………………………………………………………………… . . . . . . . . . . . . . . . . . . . . . . . . . . . . . . . . . . . . . . . . . . . . . . . . . . . . . . . . . . . . . . . . . . . . . . . . . . . . . . . . . . . . . . . . . . . . . . . . . . . . . . . . . .
Section 2 (to be filled when the unit is revisited one month after the previous visit to administer the booster dose)(10) Date of visit: ….. / ….. / ….. (11) Field operator: ……………………………………………………………………
Table 2: Animals injected with a booster dose
Species(12) Number eligible for a booster dose from
previous visit (same number as Table 1)
(13) Number eligible for booster dose still
present(14) Number injected with booster dose
Species A 6–12 m
Species B 6–12 m
Species C 6–12 m
Section 3: (to be filled when the unit is revisited one month after the date of the visit of part 1 and animals that escaped vaccination are now vaccinated)Table 3: Vaccinated animals that escaped previous vaccination session
Species A Species B Species C
Age
group
(15) Number left
unvaccinated from previous visit
(16) Number left unvaccinated from previous
visit still present
(17) Number
vaccinated
Number left unvaccinated from previous
visit
Number left unvaccinated from previous
visit still present
Number vaccinated
Number left unvaccinated from previous
visit
Number left unvaccinated from previous
visit still present
Number vaccinated
6–12 m
12–24 m
>24 m
(7) Batch of vaccine used**: ……………………………… . . . . . . . . . . . . . . . . . . . . . . . . . . . . . . . . . . . . . . . . . . . . . . . . . . . . . . . . . . . . . . . . . . . . . . . . . . . . . . . . . . . . . . . . . . . . . . . . . . . . . . . . . . . . . . . . . . . .(8) Expiry date ….. / ….. / …..
**If more than one batch of vaccine has been used, please indicate below the additional batches and expiry dates.
……………………………………………………………………………………………………………………………… . . . . . . . . . . . . . . . . . . . . . . . . . . . . . . . . . . . . . . . . . . . . . . . . . . . . . . . . . . . . . . . . . . . . . . . . . . . . . . . . . . . . . . . . . . . . . . . . . . . . . . . . . .
(18) Note: …………………………………………………………………………………………………………………. . . . . . . . . . . . . . . . . . . . . . . . . . . . . . . . . . . . . . . . . . . . . . . . . . . . . . . . . . . . . . . . . . . . . . . . . . . . . . . . . . . . . . . . . . . . . . . . . . . . . . . .
Fig. 1 Vaccination card
ANNEX 1

Foot and mouth disease vaccination and post-vaccination monitoring. Guidelines
56
Field 14 is the actual number of animals vaccinated out of those indicated in field 13.
Field 15 indicates the number of animals that have been left unvaccinated from the previous visit, and the number reported here should be the same as in field 6.
Filed 16 indicates the number of animals (out of those indicated in field 15) that are still present.
Field 17 indicates the number of animals (among those left unvaccinated) that were vaccinated during the second visit.
Field 18 is left for any notes that the operator thinks are relevant to add.
Two copies of the vaccination card are needed, with one copy left with the owner and the second one consigned to the local distribution centre. Those cards not yet completed (because the second visit has not yet been made) will be archived in separate files, and once booster doses have been administered they will be archived with the already completed cards.
If the data contained in the vaccination card can also be stored in an electronic worksheet, this will greatly simplify data retrieval and analysis.
The proposed approach (according to the assumptions used) has two main shortcomings: (i) there must be some way of identifying animals that are supposed to receive a booster dose (reusable collars could be an option); and (ii) between the two visits there may be newborns or new animals introduced to the herd. A new vaccination card should be filled out for these animals (which were not counted during the previous visit) whether or not they are vaccinated.
Use of the vaccination card for monitoring and evaluation purposes
Vaccination coverage can be expressed as the percentage of eligible, fully vaccinated animals compared with either the total number of animals eligible to be vaccinated or all of the susceptible animals in the target population. At any point in time during the implementation of the vaccination campaign, appropriate indicators can be built in to monitor progress. Those indicators can be introduced readily, but their reliability will largely depend on the quality of the data recorded on the vaccination card.
Below are examples of indicators that can be established from information recorded through the vaccination cards:
OVC or the overall vaccination coverage at a specific point in time since the start of the campaign (by species) = no. animals vaccinated/no. estimated at the outset of the campaign1.
The numerator of this indicator will be the sum of all fields 5 and 17 of the vaccination cards filled since the start of the vaccination campaign while the denominator will be the total number of animals estimated at the outset. If this number was estimated as the total number of animals eligible, than OVC will provide information about coverage on those supposed to be vaccinated, alternatively if the denominator of OVC is the total number of susceptible animals in the targeted population, then OVC may be interpreted as the coverage in the entire population.
OCW or the vaccination coverage within farms at any point in time (by species and age group) = no. animals vaccinated/no. animals found to be present2.
The numerator of this indicator is the sum of all fields 5 and 17 and the denominator is the sum of field 4.
If this indicator is estimated at the end of the campaign, it will give the overall vaccination coverage in relation to the entire animal population present (which can now be compared with the estimated one).
ORD is the proportion of animals in the 6- to 12 month age group that have correctly received the booster dose of vaccine. Conversely 1-ORD estimates the rate of dropouts (proportion of animals that failed to receive a booster dose).
This indicator uses as numerator (only for the age group 6–12 months) the sum of field 14 and as denominator the sum of field 5.
The indicators above can be compared with target indicators that may have been established in the planning phase of the field operation.
As an example: if the target was to conclude the campaign within two months from its start, then OVC may indicate
1 The estimated number of animals to be vaccinated before the cam-paign starts is essential for planning purposes and it is important to state whether the denominator of OVC reflects only those eligible or the entire population.
2 The actual number of animals found to be present also includes those that are not at an eligible age for vaccination. At the end of the campaign, the number of eligible and ineligible animals actually found may differ from the initial estimated number and can also be used for planning the next campaign.
ANNEX 1

Foot and mouth disease vaccination and post-vaccination monitoring. Guidelines
57
whether or not this objective can be achieved within the target time. Similarly, if the target is to ensure that on each farm at least 80% of the animals are vaccinated, then OCW can provide information on whether or not this objective is being achieved.
A summary table of the different indicators and their meaning and evaluation is presented below (see Table III).
2.2 Batches and doses registration book
Each local distribution centre should be responsible for the correct management of the vaccine received. Besides ensuring appropriate storage, it is assumed that the local distribution centre will be the place where vaccinators will receive the amount of vaccine required for their field operations. The management of the amount of vaccine received and the amount distributed to the final users should be done through a registration book with sections for incoming and outgoing vaccine. Each different batch of vaccine received should have an individual section in the registration book. Table 2 shows an example of how a batch and doses registration book may be set out.
The incoming section of the registration book will contain the following information (see Table 2): (i) batch identification number/code; (ii) date of receipt; (iii) total number of cattle doses; and (vi) date of expiry.
The outgoing section of the registration book is composed of different rows. A new row is generated whenever vaccine is consigned to a vaccinator for administration. The following data will need to be registered:
– number of available doses;
– name of the vaccinator;
– date of consignment;
– total number of cattle doses consigned;
– total number of cattle doses returned unused;
– date when unused doses were returned.
In each new row, the number of available doses will be the result of a subtraction [(doses available) – (doses consigned)] from the preceding row (for the very first row generated, the ‘Number of doses available’ will be equal to the ‘Total number of cattle doses’ indicated in section 1).
The batch and doses registration book can be implemented through an electronic worksheet.
Use of the batches and doses registration book for monitoring and evaluation purposes
By analogy with the method for estimating vaccine coverage through the vaccination card, indicators can also be developed using the data from the batches and doses registration book to monitor the performance of the distribution system and the progress of the vaccination campaign.
Below are indicators that can be developed from information recorded through the registration book:
RCV or overall cumulative rate of consignment to vaccinators from start to end of campaign (for each batch) = no. doses consigned/no. doses initially loaded.
RMV or monthly (or some other interval) rate of consignment to vaccinators (for each batch) = no. of doses consigned at the end of the monitoring period/no. of doses available at the starting of the monitoring period.
Table 2 Batches and doses registration book
Registration book (section 1 – incoming vaccine)
Batch number/code Date of receiptTotal number of
cattle dosesDate of expiry
Registration book (section 2 – outgoing vaccine)
Number of doses
availableName of vaccinator
Date of consign-
ment
Total doses con-
signedTotal doses returned
Date of return of
unused dosesNotes
ANNEX 1

Foot and mouth disease vaccination and post-vaccination monitoring. Guidelines
ANNEX 1
RUV or cumulative rate of utilisation for a selected interval (for each batch) = no. doses consigned in the interval – no. of doses returned in the interval)/no. of doses consigned in the interval3.
The indicators above can be compared with target indicators that may have been established in the planning phase of the field operation.
As an example: if the target was to utilise 95% of the doses loaded, then the RUV may indicate whether or not this objective is being achieved.
3 The indicator can also be used to estimate the percentage of wastage = 1 – RUV.
Table 3 Vaccination campaign indicators
Indicator What it may indicate
OVC (%)
Overall vaccination
coverage at a specific
point in time since the
start of the campaign
OVC indicates whether or not the speed of the vaccination campaign is proceeding as intended. As an example, if the target was to conclude
the vaccination campaign in two months, then it may be expected that in one month OVC should be approximately 50%
According to the denominator used to estimate OVC, insights can be obtained on whether or not eligible animals are vaccinated as planned
or on the vaccine coverage of the entire population
Combining OVC with studies such as the one proposed in section 3.4 may provide insights on the expected level of immunity at population
level
Low values of OVC do not necessarily indicate that the campaign is proceeding slowly; the denominator of the indicator is in fact the
estimated population at the outset of the campaign, and if this number has been over-estimated it will generate falsely low values of OVC
The opposite will happen if the animal population has been under-estimated
OCW (%)
Vaccination coverage
within farms at any
point in time
This proportion depends upon the structure of the population to be vaccinated. If a large proportion of animals is not eligible to be vaccinated
because of their age, this will affect the value of OCW. Values of OCW around 80% may indicate that the population is structured in such a
way that approximately 20% of the animals will be found on average (at any point in time) to be at an age not eligible for vaccination
If values are constantly below 70%, the vaccination scheduling may need to be reviewed and the age at which animals can first be
vaccinated may be lowered
The denominator of OCW estimated at the end of the vaccination campaign can be compared with the total number of animals estimated
before the campaign started to evaluate how far estimates were from what was actually found. Note that the denominator of OCW at the
end of the campaign (when theoretically all herds have been visited) may provide information on the population structure and can be used for
planning the required number of doses for the next campaign
ORD (%)
Overall rate of animals
that received booster
vaccinations at any
specific point in time
ORD is the proportion of animals in the 6- to 12 month age group that have correctly received the booster dose of vaccine. The denominator
of ORD is all animals that have already received at least one dose, and thus low values may indicate that animals found during the first visit
(and vaccinated) were difficult to find during the next visit
A reasonable value of ORD may be 90%, and values that exceed 100% indicate that there are some issues in the vaccinators’ completion of
the forms (ORD cannot be higher than 100%)
The rate of dropouts will be 1-ORD (or 100-ORD% if percentages are used)
RCV (%)
Rate of consignment to
vaccinators
RCV indicates the percentage of doses consigned at the end of the vaccination campaign versus the doses loaded before the campaign
started. The closer this percentage is to 100%, the better was the estimation of the doses needed for the campaign
Low values of RCV may either indicate incorrect estimation of the doses needed or insufficient consignment to vaccinators (although the
campaign was supposed to be finished)
RMV (%)
Monthly rate of
consignment to
vaccinators
RMV is similar to RCV, with the main difference being that RMV is estimated for specific intervals. With a constant number of doses
consigned in each interval, RMV should progressively increase during the implementation of the campaign
RUV (%)
Cumulative rate of
utilisation
RUV indicates the utilisation rate of the vaccine for any selected interval during the campaign. Values of RUV close to 100% indicate that, of
the vaccine consigned to vaccinators, a high percentage has actually been administered to animals
RUV can be used to estimate the percentage of wastage (1 – RUV, i.e. the proportion of doses that have been returned by the vaccinators
and cannot be utilised). A high percentage of wastage may indicate that the number of doses per bottle of vaccine is too high in comparison
with the average number of animals to be vaccinated within each individual farm/household, which may prevent complete consumption of
the doses within a single bottle
3.
Monitoring the immunisation
programme
Table 3 summarises the use of some of the indicators described above and what they may indicate in relation to the implementation of the vaccination campaign.
58
Foot and mouth disease vaccination and post-vaccination monitoring. Guidelines
1.
Introduction
The purpose of this annex is to provide the general background on the statistics utilised according to the different study designs proposed throughout the document. Some of the suggested methodologies will apply equally well for different purposes and reference to those will be made when appropriate.
The explanations that follow use examples for ease of understanding.
In survey design, there are two important aspects that should be taken into account: (i) a selection process to decide which members of the target population are included in the sample; and (ii) an estimation process (estimator) for computing the sample statistics (2, 10, 25).
The two aspects are intimately linked and the way individuals are selected will affect the way estimators are computed.
This leads to the concept of parameter (a characteristic referring to the entire population) and estimate (of that parameter), which is achieved through sampling.
The estimation of a parameter of the population is always susceptible (among other things) to random error that cannot be entirely eliminated, and the best that can be done is to control the unavoidable error with appropriate selection procedures and sample sizes.
This is the reason why estimates are presented with a confidence interval (standard error of the mean value) which gives an indication of the range of values (at a specified probability level) within which the true (and unknown) value of the parameter is likely to lie. The narrower the width of the standard error, the more precise the estimation of the underlying parameter.
ANNEX 2
(59-70)
The width of the standard error is affected mainly by: (i) the sample size; and (ii) the study design.
An additional aspect to be considered whenever designing a sampling survey is the starting hypothesis. If, for example, an estimate of the proportion of (say) NSP-positive animals is to be made, it is necessary (for computing the sample size) to make an initial judgement of what that proportion is likely to be. This point is sometimes considered to be controversial by those not familiar with designing surveys, and a frequent comment is: ‘Why am I asked to guess if that is what I want to know?’
The issue is that, from the statistical point of view, this preliminary hypothesis is necessary to estimate the sample size.
To summarise, the ‘ingredients’ required to design a sampling survey and compute the sample size will be:
Expected prevalence – what level of ‘disease’ (read prevalence) one expects to be present? This again may be confusing as the objective is to measure that prevalence. However, one can use pre-existing studies or information sources to set this estimate. One has to keep in mind that the sample size increases as the expected prevalence rises from 1 to 50% and then decreases again with an expected prevalence from 51 to 100%.
Margin of error allowed when estimating the prevalence – when the allowable error margin is greater (10% instead of 5%), the accuracy of the study is lower and, consequently, the sample size required is reduced. In general, an error margin of 5% is applied for estimated prevalence between 10 and 90%) and of 2% between 1 and 10% or between 90 and 100%.
Confidence levels – usually, for studies aimed at estimating prevalence, a 95% confidence level is taken, while for proving absence of disease, a high level of confidence (99%) is often taken.
STATISTICAL METHODS FOR DESIGNING FIELD SURVEYS OF POPULATION IMMUNITY

Foot and mouth disease vaccination and post-vaccination monitoring. Guidelines
60
2.
Methodology I
Estimation of immune proportions using a simple random sampling (SRS) selection process
An example of such an approach is described in Chapter 3 (section 3.4) and details are explained below.
Objective: To estimate the proportion of animals vaccinated for the first time that will develop a specific level of antibodies considered protective and due to the vaccine.
Target population: The 6- to 12-month-old animals that will be injected with FMD vaccine not previously exposed to natural infection.
Unit of interest: Individual animals.
Measurable response: SP antibody titres against the types of virus contained in the vaccine and NSP antibodies. If a threshold of protection is known, then animals with SP antibody titres above such a threshold are considered ‘adequately protected’ and those animals with titres below are considered ‘not adequately protected.
Time of sampling: This sub-category should be sampled at the time of vaccination (t0) and after 28, 56 and 168 days (t1, t2, t3, respectively). This allows an assessment of the immune response induced by the vaccine, and the duration during the campaign, and provides a way of discounting previous exposure to the virus or virus circulation during the field trial.
Methodological approach and implications: As the objective is to estimate the immune response due to the injection of the vaccine, differentiation between antibodies due to the vaccine and antibodies due to previous exposure to field virus is necessary. Assuming that the vaccine used does not induce detectable NSP antibodies, testing serum samples also for NSP antibodies in each interval allows a distinction to be made between antibodies due to vaccination and antibodies due to infection. When incidence of virus circulation in the area is either very low or zero, tests for NSP may be used to indicate NSP purity (actually specificity of NSP tests in vaccinated animals). Sampling animals at different intervals, as proposed, implies that the sampling plan must be prepared in advance and those animals should be individually identified (i.e. ear-tagged).
Study design: An SRS design (details on the procedures for selecting members under an SRS design are readily
available in many basic statistical textbooks and will not be addressed here) would require that an individual list of animals in the target population is available. From such a list, it is then possible to randomly select the required number of individuals. This list is usually not available in advance (especially in developing countries) and thus it may be impossible to strictly adhere to an SRS procedure.
A practical approach to overcome this issue is to make a preliminary selection of 10 to 15 epi-units before the vaccination campaign starts (the number of 10–15 is only indicative and in general the number of epi-units should be sufficient to yield a number of eligible animals at least twice the estimated sample size).
The selection of the epi-units should be based on knowledge of the past occurrence of FMD (to ensure that sampled animals are less likely to have been already exposed to field virus). Once the epi-units have been selected, they should be visited to create a census of all animals age matching the eligibility criteria (source population from which individuals will be selected). If animals could be individually ear-tagged at the time of the visit, a list could be created from which animals could be subsequently selected under an SRS procedure (a systematic random sampling approach could also be applied). This approach, from the practical point of view, can be considered a proxy for an SRS design.
Sample size: Estimation of the sample size involves both non-statistical and statistical considerations. Non-statistical considerations include availability of sampling frames, resources, manpower and facilities. Statistical considerations are considered below.
In order to estimate the sample size under an SRS design, the equation to use is:
n = 1.962 p(1−p) (equation 1)
e2
As stated in the introduction, the estimation of the sample size requires judgement of what the expected proportion of animals with a detectable level of antibodies is likely to be, what is the allowable error and what is the confidence level that the investigator wishes to have for drawing conclusions.
According to the criteria indicated in section 3.4: (i) the expected proportion is 85%, indicated as p in equation 1); (ii) the absolute error (allowable error or desired precision, indicated as e in equation 1) is 10% (which means that if the expected proportion is really 85%, it is expected that the estimate obtained will lie between 75% and 95%; and (iii) finally the level of confidence chosen is 95% (which means that the investigator wants to be 95% confident that the estimate of the proportion (should that be truly
ANNEX 2

Foot and mouth disease vaccination and post-vaccination monitoring. Guidelines
85%) will actually lie between 75% and 95%. The value 1.96 is the normal standard deviation for a 95% confidence level (should the investigator wish to have a 99% or 90% confidence level, the value 1.96 should be replaced with 2.58 or 1.64, respectively).
Equation 1 is used to estimate the sample size over an infinite population, but if the total population eligible for sampling is known, then the sample size can be adjusted for a finite population using:
ni = 1 (equation 2) 1/n +1/N
where n is the sample size estimated over an infinite population and N is the total number of animals eligible for sampling4.
Applying equation 1 for the purpose indicated in section 3.5.1 will yield:
n = 1.962 × 0.85 × (1−0.85) = 49 0.12
The sample size has been computed without correction for a finite population.
The user can try out different input values according to varying hypotheses about likely prevalence.
Table 4 indicates the required number of samples (under an SRS design) for different situations, assuming 100% sensitivity and specificity of the diagnostic tests used.
Estimated proportion and confidence interval: Once the test results from the laboratory are available, the prevalence (and its 95% confidence interval) can be estimated. Under an SRS design, the proportion of animals with antibody titres equal to or above a specific level can be estimated for each one of the intervals considered and is given by:
p = a (equation 3) n
where a is the number of animals with antibody titres equal to or above the established threshold and n is the number of animals in the sample (sample size).
4 If samples will be collected in accordance with the proposed design, from the practical point of view it is advisable not to apply the correction factor, as its introduction will cause the sample size to become smaller.
~
Table 4 Sample numbers required
Expected proportion
Allowable error
Level of confidence
No. of samples required
5 (95) 2 90* 322
95 457
5 90 52
95 73
10 (90) 2 90 609
95 865
5 90 98
95 139
20 (80) 5 90 174
95 246
10 90 44
95 62
40 (60) 5 90 260
95 369
10 90 65
95 93
50 5 90 271
95 385
10 90 68
95 97 * Note that, for a 90% confidence level, the standard deviation is 1.64
The 95% confidence interval (CI) for the estimated proportion is:
95% CI = p ± 1.96 × SE (equation 4)
The standard error (SE) is given by:
SE(p) = p(1− p)
(equation 5) n−1
By replacing SE in equation 4 by equation 5, the 95% CI is given by:
95% CI = p ± 1.96 × p(1− p)
(equation 6) n−1
Assuming that 43 out of the 49 vaccinated animals show a detectable level of antibodies at day 30 post vaccination (a = 43 and n = 49), then:
p = 43 = 0.877 (87.7%) 49
ANNEX 2 61
Foot and mouth disease vaccination and post-vaccination monitoring. Guidelines
62
with:
SE (p) = 0.877(1−0.877) = 0.047 49−1
and the 95% confidence interval for the estimated proportion is:
95% C.I.= 0.877± 1.96 × 0.047
thus the 95% CI for the estimated proportion will be 0.877 ± 0.092 meaning that the true value is between 0.9703 (or 97.03%) and 0.7448 (or 74.48%).
In the above equation (6), no correction is made for finite population. Should the data on the total number of eligible animals for sampling be available, then the 95% confidence interval would have been:
95%CI = p ± 1.96 × p(1−p) (N−n)
(equation 7) n−1 N
where N is the total number of animals being vaccinated and eligible for sampling. The quantity N−n is the finite population correction factor. N
Comments: According to the assumed findings that 43 out of 49 (87.7%) animals developed a measurable response to vaccination, the investigator can then conclude: (i) the initial hypothesis of expecting 85% of animals to develop a measurable response is different from 87.7% actually found (although the 95% confidence interval 87.7% ± 9.2% will include the guessed prevalence of 85%); (ii) the value of 87.7% represents the best point estimation available (the initial hypothesis is necessary to estimate the sample size, but once data are available the estimation should be based on the findings). In any case, it may be concluded that the initial hypothesis was not very far from the actual findings.
The user may note that equation 1 for estimating the sample size is only a re-arrangement of equation 5. In fact the allowable error is the standard error of the estimate.
Remarks: The methodology can also be used whenever the selection process is carried out in accordance with a systematic random sampling procedure. Although not strictly correct, the bias introduced is negligible for most practical purposes.
3.
Methodology II
Estimation of immune proportions using a more complex study design (two-stage random sampling)
Objective: To estimate the proportion of animals with a ‘detectable level of antibodies’ in the population.
Target population: The total number of animals present in the area or zone where the vaccination programme is implemented and for which the conclusions of the survey will apply. The target population should be stratified if it is heterogeneous, with the potential for significantly different subpopulations with different levels of responses to the vaccination given, owing to either species composition or variable factors in the vaccination regime (different vaccination strategy, vaccination teams, cold chains, vaccine batches, etc.). The greater the certainty needed, the more thoroughly the stratification should be carried out. In practice, it is usual to consider each species as a different target population, and commonly provinces or districts may be used as the unit of population, rather than an entire country or zone, in order to test for regional differences in the performance of vaccination. The numbers recommended for sampling then apply to each subpopulation.
Lastly, it should also be considered that animals eligible for sampling are all those comprising the target population, which will include both vaccinated and unvaccinated animals (animals that were not eligible to be vaccinated during the vaccination campaign, animals missing the vaccination or newly introduced animals).
Source population: Individual animals eligible for sampling present in the primary sampling units (see Study design below) pre-selected for sampling.
Unit of interest: Individual animals
Outcome of interest: Level of detectable antibodies against FMD.
Measurable response: SP antibody titre against the types of virus contained in the vaccine. If a threshold of protection is known, then animals with antibody titres above such a threshold can be considered ‘adequately protected’ and those animals with titres below can be considered ‘not adequately protected.
Time of sampling: When a vaccination programme is regularly implemented, immunity can be estimated either
( )
ANNEX 2
Foot and mouth disease vaccination and post-vaccination monitoring. Guidelines
63
at the time that the highest or lowest level is expected. This is either 30 days post vaccination or the day animals will be vaccinated again, respectively. If vaccination is not regularly implemented, sampling on the day of vaccination may not be relevant.
Methodological approach and implications: As the objective is to estimate the overall immunity level, it is useful to distinguish between antibodies due to the vaccine and antibodies that may be due to previous exposure to field virus. Assuming that the vaccine used does not induce detectable NSP antibodies, testing serum samples for NSP antibodies too will distinguish between antibodies due to vaccination and antibodies due to infection (NB The proportion of animals with NSP antibodies induced by vaccination will be low in herds that have received only one or two doses of vaccine, even with unpurified vaccines). When the incidence of virus circulation in the zone is either very low or zero, tests for NSP antibodies may not be necessary.
When a vaccination programme is regularly implemented, there is a direct association between immunity level and age. Therefore, stratification by age is recommended. Stratification by age will facilitate the interpretation of the test results. Each of those different age groups should be considered a different subpopulation.
If estimation of the level of immunity is restricted to only one specific age category, it is suggested that the age category one to two years old be sampled, which will probably include animals already vaccinated many times and may provide some insight into the immunity levels in younger age classes (likely to be lower) and older age classes (likely to be higher).
Should the number of eligible animals per epi-unit not be available in advance (common in many developing countries), then data should be collected at the time of sampling.
Sampling design: The assessment of the level of immunity of the general population or of specific sub-groups generally involves the design of a complex survey. In this specific case, it is likely that the design will be a two-stage cluster sampling, with the first stage being the epi-units (primary sampling units – PSUs) and the second stage individual animals (secondary sampling units – SSUs) present within those selected PSUs. The procedure would be to first select a certain number of PSUs and then, within each of those, select a certain number of individuals (SSUs). Obviously, this procedure restricts the choice of the SSUs to only those PSUs selected in the first stage.
PSUs may be selected by different random selection methods. However, PSUs are generally selected by either
sampling with probability proportional to size (PPS) or by SRS. Where a list of all epi-units and the approximate number of animals per epi-unit in the zone where the PVM is to take place is available, PPS sampling is recommended. This selection process guarantees that the sample is ‘self-weighting’ and no further adjustments are needed when estimating the proportion of positives (p) and its confidence interval (procedures for selecting PSUs using a probability proportional to size are not addressed here and can be found in many statistical textbooks). It is rather important to further consider that if PSUs will be selected using a PPS procedure, the size of the reference population may be different for each one of the age groups considered for sampling.
Where only a list of all epi-units is available, PSUs are selected by SRS.
SSUs may be selected by either systematic random sampling or SRS, where feasible.
Sample size: In order to calculate a suitable sample size, a balance between precision and cost is needed (19). Sample size depends on (in analogy with what was described in methodology I) the desired precision of the estimate (or allowable error or standard error), the expected prevalence of the event, and the required level of confidence. In this specific type of survey, where the number of PSUs is usually large, the size of the population is not relevant.
Two stages of sampling means that there are two sources of variability: (i) the variability between PSUs (clusters); and (ii) the variability within PSUs.
Two additional concepts, namely the design effect and the intra-cluster correlation coefficient, need to be introduced in order to gain a better understanding of the implications when applying such complex designs (5, 19).
The design effect (D) is the ratio between the variability observed with a complex design and the variability that would have been expected if the design was an SRS one (with a given sample size n). The design effect provides an indication of how many samples would have been required under a complex survey design (such as two-stage cluster sampling if compared with an SRS design) in order to obtain the same level of precision (i.e. the same standard error). If, for example D = 2, then, for a complex survey design, we need 2n samples to have the same level of precision that would have been expected if it was an SRS design. This is expressed as:
Dscluster
2
ssrs2 (equation 8)
ANNEX 2

Foot and mouth disease vaccination and post-vaccination monitoring. Guidelines
64
where s2 is the variance under the two types of study design as indicated in equation 8.
The design effect can be accurately calculated only at the end of the study. However, it may be estimated based on the average number of samples collected in each epi-unit and the value of the intra-cluster correlation coefficient (rho), in fact:
D = 1 + (m – 1) rho (equation 9)
where m is the average number of samples collected in each epi-unit.
The intra-cluster correlation coefficient (rho) quantifies the extent to which population units within clusters are similar to one another. It accounts for the relatedness of clustered data by comparing the variance between clusters and the variance within clusters.
This is expressed as:
rho = S2b (equation 10)
S2b +S2
w
where S2b is the variance between clusters and S2
w is the variance within clusters. Note that rho may be estimated by rearranging equation 9:
rho = D − 1 (equation 11) m − 1
The value of rho can range between 0 and 1 (although negative values are also possible). When rho = 1, it corresponds to a complete segregation of the variable within the cluster: all elements comprising a cluster will have exactly the same value.
If the variable is distributed completely at random among the clusters,
then D = 1+(n − 1)rho = 1 the expectation is that rho is zero. If rho = 0 then 1 (independently from the value of n). This means that the variability of a cluster design will equal that of an SRS design and no adjustment for the sample size is required.
The parameter rho will affect the sample size within each cluster and, in general, with values of rho closer to 1, the sample size within clusters is reduced (as it is sufficient to test only a few animals to obtain the desired information), but it will increase the number of PSUs (clusters) to be sampled because of the increased overall variability.
Values of rho close to 1 are rare and values 0.2, > 0.2 and 0.4, and > 0.4 are commonly considered indicative of low, medium and high degrees of homogeneity.
Several specific software programmes to calculate the sample size and to analyse results from two-stage cluster samplings are available, but a certain level of expertise is needed and such software programmes are often not available for field
veterinarians, particularly in developing countries. Where it is not feasible to use a specific software programme, the following procedure may be used to estimate an approximate sample size for these complex surveys.
For illustrative purposes only, the estimation of sample size is presented in a five-step procedure:
Step 1 – define the following items:
– the desired level of confidence (usually 95%);
– the expected prevalence of the event (p);
– the desired precision (or allowable error or standard error) of the estimate (e);
– the number of samples to be collected in each selected epi-unit (m).
Step 2 – estimate the overall number of SSUs (animals) needed assuming an SRS design using equation 1:
n = 1.96 p (1− p)
e2
Step 3 – estimate the design effect using equation 9 (and assuming that m individuals in each epi-unit were going to be sampled):
D = 1 + (m-1) rho
Values of rho may be available from previous studies or calculated in a pilot study; if that is not feasible, values of rho from other diseases with similar epidemiological behaviour may be used. Finally, if none of those alternatives are possible, then rho would have to be guessed. As already stated, values 0.2, > 0.2 and 0.4, and > 0.4 are indicative of low, medium and high degrees of homogeneity, respectively.
Step 4 – adjust sample size for clustering effects :
nadjusted = n × D
where nadjusted is the total number of SSUs needed after accounting for similarities among clustered subjects.
Step 5 – determine the number of clusters to be sampled (C)
C = nadjusted/m
Finally, the number of SSUs needed to estimate the prevalence of the event by a two-stage sampling method given a desired level of confidence, a degree of precision and a number of samples per SSU is obtained.
ANNEX 2

Foot and mouth disease vaccination and post-vaccination monitoring. Guidelines
Estimation of prevalence and confidence interval: Estimating the prevalence should take into account the procedure used to select the clusters. If clusters are selected with PPS and a fixed number of subjects are selected in each epi-unit, then each animal in the population has the same probability of being selected. Similarly, if clusters are selected by SRS and a constant proportion of the animals present in each epi-unit are selected, then each animal in the population would have approximately the same probability of being selected as well.
If clusters are selected by SRS and a fixed number of subjects are selected in each epi-unit, then the animals do not have an equal probability of being selected. These different probabilities of being selected should be considered to obtain the appropriate point estimate.
Option 1. Estimation of prevalence and CI when clusters
are selected with PPS (or SRS with a fixed percentage of
animals in each PSU)
The prevalence of an event may be estimated by:
p = yh (equation 14) mh
where yh is the number of animals ‘adequately protected’ in each generic h PSU (epi-unit or cluster) and mh is the number of animals sampled in each generic h PSU.
The 95% confidence interval is estimated by equation 4:
95% CI = p ±1.96 × SE
where:
SE = c [ yh2 − 2p mh yh + p2 m2
h
mh [c(c−1)]
and c is the number of clusters sampled.
Example II.b
In this example, following on from the above, 26 clusters are sampled, with the results obtained being those summarised in Table 5:
The prevalence of ‘adequately protected’ 6- to 12-month-old calves may be estimated by equation 14:
p = yh = 176 = 0.6769 = 0,68 mh 260
65
As mentioned above, this procedure has been presented step by step for illustrative purposes only. In practice, the final result may be directly obtained by applying the following equation (5):
C = 1.962 × p × (1−p)
× D
(equation 12) e2 × m
where D may be replaced by equation 8:
C = 1.962 × p × (1−p)
[1 + (m−1)rho] (equation 13)
e2 × m
Before proceeding with an example, it is recalled that, as stated in section 3.5.1, the number of clusters to be selected should be at least 25.
Example II.a
Suppose that the immune status in a cattle population needs to be evaluated. It is decided to carry out a two-stage cluster sampling whereby clusters are selected with PPS to estimate the proportion of cattle with a ‘specific level of antibodies’ against FMD in the zone where the programme is being applied. In this case, it is decided to stratify the animal population by age (0–6 months, 6–12 months, 12–24 months and > 24 months) as indicated in section 3.5.1. Each of those different age groups should be considered a different subpopulation. For illustrative purposes, estimation of sample size, prevalence and confidence intervals is restricted to the 0–6 months age group.
For practical reasons it is considered that a reasonable workload would be to collect ten samples per cluster. The expected prevalence is established at 60% and an estimate with a level of confidence of 95% and a precision of 10% is desired. All animals between six months of age and under are not supposed to be vaccinated and maternal antibodies may still be present, therefore the level of immunity could be highly variable. As a consequence of that, a relatively low level of homogeneity would be expected in the immune status of those animals. In the absence of data on the value of rho from previous surveys, it is assumed that a value of 0.2 may be appropriate.
The question is now: How many clusters should be included in the sample?
The number of clusters to be sampled is estimated by equation 13:
C = 1.962 × p × (1−p)
[1 + (m−1) × rho]
e2 × m
By replacing the formula with the corresponding values:
C = 1.962 × 0.6 × (1−0.6)
[1 + (10−1) × 0.2] 26
0.12 ×10
a total of 260 samples should be collected from 26 epi-units. Ten samples per epi-unit would then be needed to evaluate the immunity in the age group six months and under.
In this case, being the number of clusters equal to 26 (with 10 individual samples to be collected in each cluster) the assumption of normality is not violated and the result is acceptable.
If the number of clusters to be sampled was below 25, then equation 12 should have been solved by m keeping the number of clusters to be sampled fixed (C = 25). This approach has been used to estimate sample sizes across the four different age groups indicated in section 3.5.1.
~
]
(equation 15)
ANNEX 2

Foot and mouth disease vaccination and post-vaccination monitoring. Guidelines
66
As it is assumed that samples were collected with a PPS, no further adjustments are needed, and then the standard error of the estimate may be calculated by equation 15:
SE = 26 [1252 − (2×0,68×1760)+(0,682 ×2600)] = 0,031 260 [26(26 −1)]
Details of the calculations are presented in Table 6.
According to the above results, the 95% CI will be 0.68 ± 1.96 × 0.031. Therefore, the true proportion of ‘adequately protected’ animals will lie between 0.62 and 0.74.
Option 2. Estimation of prevalence and CI when clusters
are selected by SRS (with a fixed number of animals
sampled in each PSU)
This is the case when the sample is not self-weighting and, before proceeding to the estimate of the prevalence and its confidence interval, appropriate adjustments need to be made.
The weighting factor for each cluster is the number of the Mh eligible animals divided by the total number of eligible animals in the source population, and it is expressed as:
wh = Mh / Mh
Table 5. Hypothetical results obtained
Cluster Mh mh yh
1 80 10 6
2 212 10 9
3 35 10 4
4 1,000 10 6
5 23 10 8
6 145 10 7
7 145 10 6
8 569 10 6
9 675 10 8
10 25 10 5
11 67 10 7
12 58 10 4
13 45 10 8
14 55 10 6
15 90 10 5
16 78 10 9
17 234 10 8
18 30 10 5
19 780 10 9
20 900 10 8
21 1,200 10 6
22 35 10 7
23 187 10 8
24 26 10 7
25 812 10 9
26 27 10 5
Total 7,533 260 176 where: Mh: is the number of eligible animals in each generic h PSU, mh is the number of animals sampled and yh is the number of positives found.
Table 6. Cluster results using the PPS method
Cluster mh yh y 2h mhyh m 2
h
1 10 6 36 60 100
2 10 9 81 90 100
3 10 4 16 40 100
4 10 6 36 60 100
5 10 8 64 80 100
6 10 7 49 70 100
7 10 6 36 60 100
8 10 6 36 60 100
9 10 8 64 80 100
10 10 5 25 50 100
11 10 7 49 70 100
12 10 4 16 40 100
13 10 8 64 80 100
14 10 6 36 60 100
15 10 5 25 50 100
16 10 9 81 90 100
17 10 8 64 80 100
18 10 5 25 50 100
19 10 9 81 90 100
20 10 8 64 80 100
21 10 6 36 60 100
22 10 7 49 70 100
23 10 8 64 80 100
24 10 7 49 70 100
25 10 9 81 90 100
26 10 5 25 50 100
Total 260 176 1,252 1,760 2,600
ANNEX 2

Foot and mouth disease vaccination and post-vaccination monitoring. Guidelines
67
Then the weighted proportion may be estimated by the formula:
p = wh.ph (equation 16)
where ph is the proportion of positives in each generic h PSU.
The same consideration made for the estimation of unweighted and weighted p also remains valid for the estimation of the standard error. The estimation of standard error using the weighted number of samples collected and the number of positive results in each cluster becomes:
SE= c [ y2hw−2p mhwyhw + p2 m2
hw]
mhw [c(c−1)]
(equation 17)
where mhw = wh.n (n = 260, the total sample size of Tables 5 and 6) and yhw = ph.mhw (ph is the proportion of
positives found in each cluster, namely h
h
my
in Table 5)
Finally, the 95% CI is estimated using equation 17.
Example II.c
The same data are used as used in the previous example. However, in this case it is assumed that clusters are selected by SRS instead of PPS (consequently the sample is not self-weighting). Therefore, results from the survey need to be weighted in order to estimate the prevalence of the event. The weighted prevalence is estimated by equation 16. The calculation details are presented in Table 7.
The weighted prevalence, 0.7286 (or 72.86%) is different from the unweighted estimate. If the size of clusters are similar, the difference between the unweighted and weighted estimates will differ only slightly. Where clusters are farms, villages, crush pens, etc., the range of the cluster size is usually very wide.
The weighted standard error is calculated by equation 17:
SE = 26 3532 −(2×0.73×4743) + (0.732×6576) = 0.041 260 [26(26−1)]
The calculation details to solve equation 17 (using the data in Table 7) are presented in Table 8.
According to the above results the 95% CI will be 0.7286 ± 1.96 × 0.041. Therefore, the true proportion of animals with a ‘detectable level of antibodies’ will lie between 0.648 (or 64.8%) and 0.809 (or 80.9%).
4.
Methodology III
Monitor the post-vaccination immune response at herd level
Objective: To estimate the proportion of ‘not adequately vaccinated’ epi-units.
Target population: The total number of epi-units present in the area or zone where the vaccination programme is applied.
Table 7. Cluster results for weighted prevalence
Cluster Mh mh yh ph
Weight (wh)
phwh
1 80 10 6 0.6 0.011 0.0064
2 212 10 9 0.9 0.028 0.0253
3 35 10 4 0.4 0.005 0.0019
4 1,000 10 6 0.6 0.133 0.0796
5 23 10 8 0.8 0.003 0.0024
6 145 10 7 0.7 0.019 0.0135
7 145 10 6 0.6 0.019 0.0115
8 569 10 6 0.6 0.076 0.0453
9 675 10 8 0.8 0.090 0.0717
10 25 10 5 0.5 0.003 0.0017
11 67 10 7 0.7 0.009 0.0062
12 58 10 4 0.4 0.008 0.0031
13 45 10 8 0.8 0.006 0.0048
14 55 10 6 0.6 0.007 0.0044
15 90 10 5 0.5 0.012 0.0060
16 78 10 9 0.9 0.010 0.0093
17 234 10 8 0.8 0.031 0.0249
18 30 10 5 0.5 0.004 0.0020
19 780 10 9 0.9 0.104 0.0932
20 900 10 8 0.8 0.119 0.0956
21 1,200 10 6 0.6 0.159 0.0956
22 35 10 7 0.7 0.005 0.0033
23 187 10 8 0.8 0.025 0.0199
24 26 10 7 0.7 0.003 0.0024
25 812 10 9 0.9 0.108 0.0970
26 27 10 5 0.5 0.004 0.0018
Total 7,533 260 176 0.7286
ANNEX 2

Foot and mouth disease vaccination and post-vaccination monitoring. Guidelines
68
Unit of interest: The epi-unit (farms, villages, crush pens, dip tanks).
Time of sampling: When a vaccination programme is regularly implemented, immunity can be estimated at the time either the highest or the lowest level is expected. This is usually at 28 days post vaccination or the day that animals will be vaccinated again, respectively. The timing of sample collection should be taken into account to evaluate the performance of the vaccination programme, based on a threshold level of antibodies supposed to be equal to or higher than such a threshold.
Methodological approach and implications: To estimate the proportion of NAVEU, an appropriate number of epi-units is selected (first stage), then the status of the epi-units is determined based on the results obtained from samples
collected within each of the selected epi-units (second stage). Based on this, the proportion of NAVEU is estimated.
The recommendations made on stratification by age for methodology II also apply in this case and stratification by age is recommended.
As the objective is to estimate the immunity level of epi-units due to vaccination, it is necessary to distinguish between antibodies due to the vaccine and antibodies due to previous exposure to field virus. Assuming that the vaccine used does not induce detectable NSP antibodies, testing serum samples for NSP antibodies too allows antibodies due to vaccination to be distinguished from antibodies due to infection. When incidence of virus circulation in the zone is either very low or zero, testing for NSP antibodies may not be necessary.
Sampling design to select epi-units: If a reliable list of epi-units is available, then epi-units may be selected by an SRS design. The selected epi-units will be the source population from which individual samples will be drawn.
Sampling design to select individuals within each epi-unit: Selection of individual eligible animals can be made either using an SRS procedure or a systematic random selection process.
Sample size to estimate required epi-units: As has been mentioned already, sample size estimation involves both non-statistical and statistical considerations. In this case, statistical considerations include two different issues that need to be addressed.
The number of epi-units required depends on the desired precision of the estimate, the expected prevalence of the event, and the required level of confidence. In order to estimate the sample size using an SRS design, equation 1 should be used:
n = 1.962 p(1−p)
e2
If the total population eligible for sampling is known and the calculated sample size is one-tenth or more of the total population, then the sample size can be adjusted by the finite population correction factor.
Sample size to assess the status of each sampled epi-unit: The first step is to establish what is the expected prevalence of animals with a level of antibodies equal to or greater than a level to be considered protective if the epi-unit was adequately vaccinated. Once this threshold is defined, the sample size is then calculated so that the probability of obtaining no animals with such antibody levels or greater
Table 8. Weighted values to solve equation 17
Cluster mhw yhw m2hw y2
hw mhwyhw
1 2.86 1.72 8.18 2.94 4.91
2 7.28 6.55 53.00 42.93 47.70
3 1.30 0.52 1.69 0.27 0.68
4 34.58 20.75 1,195.78 430.48 717.47
5 0.78 0.62 0.61 0.39 0.49
6 4.94 3.46 24.40 11.96 17.08
7 4.94 2.96 24.40 8.79 14.64
8 19.76 11.86 390.46 140.56 234.27
9 23.40 18.72 547.56 350.44 438.05
10 0.78 0.39 0.61 0.15 0.30
11 2.34 1.64 5.48 2.68 3.83
12 2.08 0.83 4.33 0.69 1.73
13 1.56 1.25 2.43 1.56 1.95
14 1.82 1.09 3.31 1.19 1.99
15 3.12 1.56 9.73 2.43 4.87
16 2.60 2.34 6.76 5.48 6.08
17 8.06 6.45 64.96 41.58 51.97
18 1.04 0.52 1.08 0.27 0.54
19 27.04 24.34 731.16 592.24 658.05
20 30.94 24.75 957.28 612.66 765.83
21 41.34 24.80 1,709.00 615.24 1,025.40
22 1.30 0.91 1.69 0.83 1.18
23 6.50 5.20 42.25 27.04 33.80
24 0.78 0.55 0.61 0.30 0.43
25 28.08 25.27 788.49 638.67 709.64
26 1.04 0.52 1.08 0.27 0.54
Total 260.00 190.00 6,576.00 3,532.00 4,743.00
ANNEX 2

Foot and mouth disease vaccination and post-vaccination monitoring. Guidelines
69
First, the appropriate number of epi-units is calculated. Assuming that the expected prevalence of NAVEU is p = 0.35 (or 35%, meaning that it is expected that 65% of the epi-units are ‘adequately vaccinated’), and an absolute precision of 0.05 (or 5%) and a 95% confidence level are desired, then (using equation 1):
n = 1.962 (0.35) (0.65) 350 0.052
Since the number of epi-units to be sampled is > 10% of the total number of epi-units (350/1,000) the finite population correction factor is applied (using equation 2):
ni = 1 259
1/350+1/1000
Second, the appropriate number of samples per epi-unit is calculated. Assuming that the minimum expected prevalence of animals with antibody titre equal to or above a specific level is 70%, the desired confidence level is 95% and that there are 100 eligible animals in this epi-unit, equation 18 is applied:
n = 1−(0.05)1/70 100− 70−1 =2.7 3 2
Thus three individual samples need to be collected in every epi-unit that has 100 animals eligible for sampling. A table can be prepared in advance in which the number of samples to be drawn will be a function of the total number of eligible animals present.
If, out of the three samples collected, none is positive, this means that (at the 95% confidence level) the prevalence of positives is below 70%. Therefore, the epi-unit is classified as NAVEU.
When sampling from an infinite population, equation 19 may also be used:
n> log (0.05) = 2.488 3 log(1−0.70)
For this specific purpose, the approximate equation may be used even when samples come from a finite population. The extra number of samples to be collected per epi-unit as a result of using an approximate formula is generally small.
Estimate and confidence interval: Once the status of all epi-units has been determined, the prevalence of NAVEUs and the 95% CI may be estimated.
must not exceed 5% (meaning that the confidence level will be 95%).
In this case, the sample size within each epi-unit will be estimated using the following equation:
n = 1 − (�)1/D N − D − 1 (equation 18) 2
where:
� is the probability of not finding at least one animal with an antibody titre equal to or greater than a specific level (� = 1 – confidence level);
D is the absolute number of animals supposed to show an antibody titre equal to or above a specific level and assumed to be present (obtained by multiplying the expected prevalence by N); and
N is the total number of animals eligible for sampling in any epi-units.
When sampling from an infinite population, the following approximate formula may also be used:
n = log(�) (equation 19) log(1–p)
where:
� is the probability of not finding at least one animal with an antibody titre equal to or above a specific level in the sample (� = 1 – confidence level); and
p is the minimum expected prevalence of animals with an antibody titre equal to or above a specific level.
An epi-unit will be classified as NAVEU if no animals with an antibody titre equal to or above a specific level are found.
Estimation of prevalence and confidence interval: Once the status of all epi-units has been defined, the prevalence of NAVEU and its 95% confidence interval may be estimated using equations 3 and 6, respectively.
Example III.a
A vaccination programme against FMD was put in place three years ago. Cattle older than three months have been vaccinated every six months. The total cattle population is distributed across 1,000 epi-units. The objective of the survey is to estimate the proportion of NAVEU. In this example, an epi-unit is considered NAVEU if the prevalence of animals with an antibody titre equal to or above a specific level is < 70%.
( [ ] )
(( [ ] ))
ANNEX 2

70
Foot and mouth disease vaccination and post-vaccination monitoring. Guidelines
ANNEX 2
When a vaccination programme is systematically applied, older animals will have been vaccinated more often than younger ones, therefore the older the animal is, the higher its immunity level. Therefore, stratification by age is recommended. Each of those different age groups is considered a different subpopulation (i.e. conduct a complete survey in each age stratum).
Assuming that 72 out of 259 epi-units tested were classified as NAVEU (which means that in those 72 epi-units the diagnostic tests scored negative in all sampled animals), then the proportion of NAVEU is given by equation 3:
p = 72 0.28(28%) 259
And the standard error of p is estimated by using equation 5:
SE(p) = 0.28 × 0.72 = 0.028 259−1
And the 95% CI for the estimated proportion using equation 6 is:
95% CI = 0.28 ± 1.96 × 0.028
Thus the 95% CI for the estimated proportion will be 0.28 ± 0.055 meaning that the true value is (at 95% CI) between 0.335 (or 33.5%) and 0.225 (or 22.5%).
~

Foot and mouth disease vaccination and post-vaccination monitoring. Guidelines
71
The OIE PVS Pathway
The OIE PVS Pathway supports Veterinary Services to achieve the quality standards and good governance that are critical determinants for success in supporting the FAO/OIE Global Foot and Mouth Disease Control Strategy (43) and the associated PVM guidelines.
Good governance of animal health systems based on disease prevention and preparedness, early detection and transparency of reporting of disease occurrence, rapid response and proper legislation and the means of enforcing it, as well as close public–private partnerships, are the responsibility of all governments. In today’s interconnected reality, a potential vulnerability anywhere is potentially a vulnerability everywhere.
To help strengthen the capacity of the national Veterinary Services to meet the standards for the quality of Veterinary Services prescribed in the Terrestrial Code, the PVS pathway has been developed to evaluate performance and provide for continuous improvement and the targeting of investments to maximise effectiveness.
The strategy can be represented visually:
Additional information concerning the application of the PVS Tool and twinning programmes for capacity building can be accessed from the following resources on the OIE’s website at www.oie.int:
– PVS Pathway: www.oie.int/en/support-to-oie-members/pvs-pathway
– PVS Evaluation: www.oie.int/en/fileadmin/Home/eng/Support_to_OIE_Members/pdf_A_Tool_Final_Edition_2013.pdf
– PVS Gap Analysis: www.oie.int/en/support-to-oie-members/pvs-gap-analysis/pvs-gap-analysis-tool/
– Veterinary Legislation: www.oie.int/en/support-to-oie-members/veterinary-legislation/
– Guide to Veterinary Education Twinning: www.oie.int/en/support-to-oie-members/veterinary-education/
– Guide to Veterinary Laboratory Twinning: www.oie.int/en/support-to-oie-members/laboratory-twinning/.
ANNEX 3
(71)
‘Treatment’Capacity building, specific activities,
projects and programmes
PVSEvaluation
PVSGap Analysis
VeterinaryLegislation
Public / PrivatePartnership
PVS PathwayFollow-UpMissionsVeterinary
Education
Laboratories
Including Veterinary Services’ strategic
priorities
‘Diagnosis’ ‘Prescription’
The OIE collaborates with governments,
donors and other stakeholders
STRENGTHENING VETERINARY SERVICES


Foot and mouth disease vaccination and post-vaccination monitoring. Guidelines
1.
Theory
Vaccine effectiveness (VE) refers to vaccine protection achieved in the field within a vaccination programme. This may differ from vaccine efficacy, which refers to protection under ideal conditions.
Vaccine effectiveness can vary unpredictably and should be monitored, particularly when there are outbreaks occurring within a vaccination programme. For human medicine, evaluation of vaccine effectiveness is a key step in the assessment of vaccines after they have been licensed.
Vaccine protection in the field may differ from protection achieved under ideal conditions owing to poor adherence to cold chain and shelf life requirements. In addition, different batches of vaccine may have different potencies, and individual immune responses to vaccination will vary.
Vaccine effectiveness is typically calculated by comparing incidence of disease or infection in vaccinated animals with incidence in unvaccinated animals that were exposed to a similar level of virus using the equation:
VE = (RU –RV)/RU (equation 1)
where RU is the incidence risk or rate in the unvaccinated population, and RV is the incidence in those vaccinated.
The equation can be reformulated as:
VE = 1 – RV/RU (equation 2)
and it is normally given as a percentage.
The data needed to calculate VE are often collected in field studies (27).
Several different designs are possible. One simple design based on investigation of outbreaks is described in detail below. Readers are referred to other texts for details of other
designs (8, 27, 33). Many of the methods are not possible in disease-free populations, as they require cases of disease.
2.
Retrospective cohort vaccine
effectiveness study
2.1 Outbreak selection
– Select a large farm or village that has vaccinated within the last six months but subsequently experienced an outbreak of FMD (several adjacent villages/farms affected by the same outbreak may be assessed in the same investigation).
– VE is investigated as soon as the outbreak has finished (the tail-end of an outbreak may be adequate).
– There must be good records of which animals were vaccinated. Small-holdings may remember details adequately.
– Farmers must be aware of which animals developed FMD.
– There must be no recent history of exposure to FMD prior to the outbreak (in the previous three years).
– Additional vaccination performed during the outbreak will complicate the investigation.
2.2 Sampling and data collection (templates are included)
– Details of local livestock management, vaccination and FMD history are gathered (Table 9).
73ANNEX 4
(73-74)VACCINE EFFECTIVENESS

Foot and mouth disease vaccination and post-vaccination monitoring. Guidelines
74
– Households/groups with known FMDV exposure are visited, that is, those with cases or known contact with cases. If there is insufficient time to include all eligible households/groups, a random sample should be selected. Failing that, equal proportions of households/groups may be systematically selected from different geographic sections of a village or large farm.
– Within households, details of whether an animal was affected by FMD and details of vaccination are then collected for each animal. Animals are blood sampled (this may include only cattle 24 months old). All cattle receive an oral examination for FMD lesions on the hard palate, gums, lips and tongue (extruded) except when impossible or unsafe.
– Oral vesicles and blisters typically appear about four days after infection. They typically heal within ten days, leaving a scar that becomes less visible over time, although foci lacking lingual papillae may be visible for weeks (1). As the appearance of clinical signs is strongly correlated with shedding and transmission, this is a relevant outcome for assessing vaccine protection.
– Cattle under six months of age can be excluded, as they may have maternally derived antibody protection.
– An investigation may take three trained staff approximately eight days with poor handling facilities requiring at least 250 cattle, preferably many more, to be sampled, although a sample size calculation should be performed.
Table 9. Information collected during a retrospective cohort vaccine effectiveness investigation
Holding details:– Province, district, village and farmer name, type of grazing (none,
private, common), herd size, date of first and last FMD case
Animal details:
– Animal ear tag number, age, sex, housing group, breed
– FMD (i) reported by farmer, (ii) seen on examination, (iii) detected on
serology
Vaccination details:– Date of last vaccination, type and batch number of FMD vaccine recei-
ved last, number of vaccine doses received in lifetime, time between
outbreak and last vaccination, group vaccine coverage at last round of
vaccination (calculated from data)
2.3 Analysis
The simplest analysis is to look at incidence (number of cases/number of animals) according to the number of doses of vaccine that animals have received in their lifetime. Consider an animal diseased if FMD was reported by the farmer or detected on examination. Infection status can be assessed by NSP serology if purified vaccines are used.
The effectiveness of the last dose of vaccine may be assessed using equation 1 or 2, preferably making a separate estimate for cattle that have received different numbers of vaccine doses over their lifetime. Where vaccination is rigorously performed, vaccination will be highly correlated with age, and it may not be possible to separate the protective effect of age from that of the vaccine effect. Where unvaccinated cattle of all ages are present, this effect may be controlled for using multivariable regression techniques or Mantel–Haenszel methods. If this is not done, the raw unadjusted VE is likely to be biased and misleading. Other confounders should also be investigated. However, conclusions may still be made about vaccine protection by observing incidence in vaccinated animals and judging whether or not it is unacceptably high, particularly in those animals vaccinated many times.
Strengths: This method is relatively inexpensive, it can be conducted rapidly and it is likely to obtain a result.
Weaknesses: The method relies on farmer recollection and records, and so cross-checking of different sources is recommended. Outbreaks investigated could be isolated cases of vaccine failure and may not reflect typical vaccine performance. Unvaccinated control animals may not always be present.
For more details see Knight-Jones et al. (27).
ANNEX 4


The past decade has been an exciting period for the control of foot and mouth disease (FMD). The Progressive Control Pathway for FMD (PCP-FMD) was developed to provide a novel stepwise methodology for a cost-effective, risk-management approach to FMD control, and it is now the backbone for the implementation of the FAO-OIE Global Foot and Mouth Disease Control Strategy (2012). The costs of vaccination, one of the most important tools for managing this devastating disease, represent 90% of the total expense of FMD control, so it is essential to plan and evaluate vaccine and vaccination effectiveness to convince decision makers to continue implementing rigorous control measures. These guidelines provide expert advice on how to ensure the success of vaccination programmes. They are designed to guide and assess national or sub-national vaccination programmes at various stages of the PCP-FMD, and will be equally helpful for countries looking to regain FMD-free status following an incursion of FMD, in accordance with the standards in the OIE Terrestrial Animal Health Code. They stress the importance of having up-to-date information on the virus strains circulating in a given area and highlight the importance of effective Veterinary Services in the implementation of FMD control programmes. Given that most readers and users may have a broad background in disease management and may not necessarily be FMD specialists, the contributors have sought to provide a balance of scientific background, methodology and practical examples.
FAO ISBN: 978-92-5-109349-8OIE ISBN: 978-92-95108-25-7