foothill college de anza college - fhda. · pdf filefoothill-de anza community college...
TRANSCRIPT

EDUCATIONAL MASTER PLAN 2005 – 2015
ADVANCING THE LEGACY
Foothill College De Anza College

Foothill-De Anza Community College DistrictBoard of Trustees
Betsy BechtelPaul Fong
Edward A. HayAndrea Leiderman
Hal Plotkin
Bridget Howe, Student Trustee, FoothillMaryam Noor, Student Trustee, De Anza
Martha J. Kanter, Chancellor
Bernadine Chuck Fong, President, Foothill CollegeM. Brian Murphy, President, De Anza College

Table of Contents
I. The Legacy .........................................................................................................................1Golden Anniversary OverviewThe Legacy AdvancesEducational Master Planning Process
II. Advancing the Legacy: Who We Are and What’s Important to Us ................................7The District’s Vision, Mission and ValuesThe District’s Goals, Guiding Strategies and Priorities
III. Advancing the Legacy: The External Environment and its Impact on the District......13Planning Premises, Research and AnalysisImplications for Foothill-De Anza
IV. Advancing the Legacy: Educational Master Plan – Where We’re Headed...................63Excerpt: Foothill College Educational Master Plan 2005
Vision, Core Values, Purpose, Mission and Core Learning OutcomesGoals and Plans
Excerpt: De Anza College Educational Master Plan 2005Vision, Core Values, Mission, Purposes and Core Learning OutcomesGoals and Plans
Central ServicesMissionGoals
Chancellor’s Office Human Resources and Equal Opportunity Business Services Facilities and Operations Educational Technology Services (ETS) Institutional Research and Planning Foundation
V. Advancing the Legacy....................................................................................................105

1
I. The Legacy
The Foothill-De Anza Community College District will mark its golden anniversary in 2007,celebrating its first 50 years of excellence, opportunity and innovation in educating a growingand diverse student body.
The legacy of the district had its origins in a post-World War II California that representedunprecedented opportunity. Industry burgeoned, jobs were plentiful, urban centers and suburbsflourished and affordable housing abounded. It was in this climate of growth and essentialoptimism that local educators came together to explore the formation of a community collegedistrict, which area voters approved by a six-to-one margin in 1957.
The year 1957 also saw the election of the first trustees of the Foothill Junior College District.Monterey Peninsula College President Calvin C. Flint was named by the five-member governingboard as the district’s first superintendent and president. Within six months of beginning his postin 1958, Flint hired the college’s first faculty members and classes began, held for the time beingin an unused elementary school—the “Highway School” in Mountain View. Foothill offered afull range of academic and career programs to 1,414 students, and just months after it opened,became the first California community college to be given full accreditation in its first year. Bythat time, area voters had already approved a $10.4 million bond and trustees had selected thepermanent site of Foothill College, purchasing the land for just over $1 million. The campus,which garnered several architectural awards, opened on September 5, 1961, to rave reviews.
Even as classes were commencing at Foothill, the board of trustees was already exploring thecreation of a second campus, and in 1959 established a citizens’ committee to study methods offinancing a new college. In 1962, voters approved a $14 million bond for the construction of asecond Foothill Junior College District campus in Cupertino. The land for the college, purchasedfor $1.1 million, was the site of Beaulieu, a historic vineyard and estate. Former Foothill Dean ofStudents and then Director of Research and Planning A. Robert DeHart was named president ofDe Anza College. September 1967 marked the first classes, with more than 3,000 studentsattending. In 1971, the Calvin C. Flint Center for the Performing Arts was dedicated on thecampus, honoring the district’s first chancellor and the architect of its legacy.
By the time De Anza opened, the zeitgeist was markedly different from that in which Foothillwas formed. The country, and certainly California, was feeling the incipient growing pains thatmarked a country in transition—the birth pangs of civil rights and women’s rights movementsaiming for equality and inclusion, as well as the wounds of a country fractionalized by theVietnam War. Some held steadfastly to longtime assumptions and values, but as the postmodernage took hold, many—particularly students, teachers and intellectuals throughout thenation—questioned what had been held as truth.
Through the seemingly boundless optimism that marked the opening of Foothill and theupheaval that greeted De Anza College, the Foothill-De Anza Community College District’slegacy of opportunity was born. From the academic rigor demanded and designed by thefounders to Foothill’s record accreditation to the carefully chosen founding faculty and later thepioneers who left Foothill to form a new college at De Anza, the legacy of excellence grew

2
alongside the diversity that would shape California’s future. And over the next 50 years, thelegacy of innovation became ever more apparent.
The Legacy Advances
In 2005, the Foothill-De Anza Community College District is one of the largest and mostrespected community college districts in the state and across the nation, serving primarily theSilicon Valley communities of Cupertino, Los Altos, Los Altos Hills, Mountain View, Palo Alto,Stanford, Sunnyvale and West San Jose. Since the founding of the district, more than one millionstudents have attended Foothill and De Anza, and each year, more than one million communitymembers visit the campuses for study, cultural events and recreation.
A combined 45,000 students now attend the colleges each quarter—an exponential increase ofthe number who inaugurated Foothill College. Female students are now the majority on bothcampuses, a stark contrast to a half-century ago when twice as many men as women attended.From a relatively homogeneous student population to one that mirrors the diverse Silicon Valley,the district has expanded its legacy of opportunity for students of various backgrounds, needsand goals. Opportunity has also been the keyword for those directly affected by the downturn inthe Silicon Valley economy, which began in earnest in 2001, and who are returning to school toupdate their skills or retrain for new careers. Foothill-De Anza continues to advance its legacy ofexcellence, opportunity and innovation even in the most challenging of times. Since thedevelopment of the previous master plan in 1999, demand has expanded and the state budget hasbeen reduced in the face of an uncertain economy.
Diverse students have diverse needs. Foothill-De Anza is known for national contributions to thebody of research about community college students and what works in the classroom toencourage student success, as well as for creating tested models of collaborative learning, thescholarship of teaching, learning communities, distance learning, global access and high learningoutcomes of the thousands of students we educate each year. This spirit of innovation has neverbeen more important than it has recently. While the economy shows signs of rebounding,California continues to struggle with a severe budget crisis that has led to unprecedentedreductions for community colleges. Foothill-De Anza was forced to cut over 10 percent of ourmore than $200 million budget over the past few years. Using our principles and strategies forbudget reductions—which state, among other tenets, that we focus on our primary educationalmission, purpose and goals on providing the highest quality education for our students as we domore with less—we have maintained and even remarkably improved many of our programscrucial for the success of our students. Nevertheless, the budget reductions have had a clearimpact, particularly on student services and the infrastructure, and the human toll of staffreductions cannot be overestimated.
Since the previous master plan, there have also been major changes in the district’sadministrative leadership. In 2003, longtime trustees Mary Mason and Judy Moss retired andwere replaced by Betsy Bechtel and Hal Plotkin. Trustee Andrea Leiderman, who had beenappointed in 2002 to fill the vacancy left by Dolly Sandoval upon her election to the CupertinoCity Council, was also elected. Earlier that year, Martha Kanter, the president of De Anza for adecade, was named chancellor by the board of trustees in 2003, following the departure of LeoChavez. The presidency of De Anza College was filled in 2004 by Brian Murphy, the formerexecutive director of San Francisco State University’s Urban Institute. Meanwhile, Foothill

3
President Bernadine Chuck Fong continues her longtime leadership of the college at which shebegan her career as an instructor.
Certainly the most visible change since the 1999 Educational Master Plan is the sweeping build-out of the $248 million Measure E construction bond. The district is tremendously grateful to ourcommunity for the overwhelming support it showed for Measure E in 1999, approving the bondby a vote of almost 72 percent. By the conclusion of construction, there will be new science, artand technology centers at both colleges, new student services buildings, renovated, modernizedclassrooms and a range of other improvements available to Foothill-De Anza students forgenerations to come. With projected enrollment estimated to increase by as much as 15 percentby 2010, the capacity of even these new facilities—and of our ability to serve studentswell—will be challenged. Careful facilities planning is uniquely critical at this juncture, and assuggested later in this master plan, the board of trustees may explore a new bond measure orparcel tax to accommodate new students, complete the campus renovations postponed due torising costs, equip the Measure E buildings, and propose a third educational center to meetincreasing student demand on the eastern portion of the district along Highway 101.
As we have seen at Foothill-De Anza, change is opportunity. Our vision and mission hasconsistently emphasized excellence, and ongoing innovation will be critical to continuing toadvance the legacy of the Foothill-De Anza Community College District over the next decade.
2005-2015 Educational Master Plan—The Process
Advancing the district’s legacy demands strategizing new and improved models of studentlearning and engagement, always ongoing at the colleges, and preparation—particularly atCentral Services—for essential supporting needs: budget, staffing, facilities, technology,research and the Foothill-De Anza Foundation.
For the past 50 years, the success of students at Foothill-De Anza has been made possible bycareful planning, hard work and the measurement of progress toward a clearly defined set ofeducational goals. Students, faculty, staff, administrators, the board of trustees and the largercommunity have all played significant roles in shaping the futures of the colleges, the district asa whole and students themselves. This continuous, cumulative assessment of needs and theconstant pursuit of excellence inform this district Educational Master Plan. Since its inception,Foothill-De Anza has regarded its master plans as a series of foundational documents to chart thegoals and progress of the district. The master plan is used to develop new programs andcurricula, hire faculty and staff, seek and allocate revenues, renovate and build new facilities, andbenchmark how we are doing against our goals as we seek to improve upon the educationalprograms and services we offer our community.
The Educational Master Plan provides us with a common framework for reviewingaccomplishments, assessing initiatives, meeting challenges and taking the next steps towardrealizing our vision: delivering educational opportunity and excellence for all. The master planrepresents the best of our thinking as a blueprint of our priorities and goals and the strategicdirections we will take to achieve them. The best of our efforts is seen in the outcomes of thestudents themselves, in their papers, speeches, applications, portfolios and creative works theyundertake to reach their educational goals. Much of what enables their success happens in theunique series of courses that are designed for the degrees, certificates, services and courses of

4
studies that our students pursue. The infrastructure to support teaching and learning, however, isnot easily seen: the program reviews, facilities design, employment services, technologies,ongoing financial planning, board policies and administrative procedures.
In fall 2003, Kanter convened the Chancellor’s Advisory Council (CAC)—the main participatorygovernance group advising the chancellor on district policies and procedures, and for whichplanning is a significant responsibility—to begin the planning process that would result in thedistrict’s 2005-2015 Educational Master Plan. As a first task, the leadership team reviewed thedistrict’s mission, goals and priorities in use since 1990 and the foundation for the district’s 1999Educational Master Plan. The group also reviewed master plans used over the past five decades.
By spring 2004, a new mission statement was drafted, vetted at the colleges and CentralServices, and then adopted by the board of trustees in June. Accompanying the mission wererevised district priorities and directions statements for use in developing the Educational MasterPlan. In January 2005, the board of trustees reviewed opportunities and challenges affecting thedistrict and previewed the outline and elements of the district’s Educational Master Plan. In thespring, CAC reviewed the outline and completed its detailed review of this draft in the summerprior to board action and district implementation.
During 2004-05, the colleges, supported by Central Services, engaged in detailed programreviews and analyses as part of the self-studies for accreditation by the Accrediting Commissionof Community and Junior Colleges. Approved by each college, the self-studies were used toinform the college educational master plans, reviewed by the board of trustees in spring 2005 inconjunction with the annual State of the College reports. Summaries of the college planningagendas from the self-studies were then incorporated into the district’s Educational Master Plan.Concurrently, the district’s institutional research team examined key issues in regard to studentaccess, achievement, human resources, finance, technology and facilities, reviewed researchstudies completed during the past several years, and examined external factors facing the district.The researchers updated the student, community and statewide data to be used to benchmark thedistrict’s progress in achieving its newly stated priorities and directions. Like the collegeplanning agendas, these data were shared with the Chancellor’s Advisory Council and providedto the colleges and Central Services in Spring 2005 for incorporation into the district’sEducational Master Plan, which was subsequently presented to the board of trustees for itsreview in July. (The chart on page eight illustrates the dynamic and cyclical planning processused by Foothill-De Anza since its founding.)
The district Educational Master Plan is designed as a dynamic set of priorities and directions tomeet the changing needs of the student body and the communities of the region and state servedby the Foothill-De Anza Community College District.

5
Concepts and Terms Used in the Planning Process
Mission—a statement of philosophy expressing the overarching purpose of the college
Values—a set of principles, standards or qualities upon which all our work is grounded
Vision—an approach to future efforts derived from both the “Mission” and “Values” statements,represented in qualitative terms
Goals—aspirations, reviewed and revised annually, that define what the institution seeks toachieve and are used to guide the development of programs, services, resource allocation andother district decisions
Guiding Strategies—specific plans or methods used to achieve the district’s goals
Quality Indicators—a set of data-based factors on which the district assesses progress towardachieving its mission
Educational Master Plan—a document, incorporating all the preceding elements, that providesa framework for the direction of the district over the next decade
Accreditation Self-Study—a process undertaken every six years documenting to theAccrediting Commission that each college meets or exceeds the criteria of the four standards orsix themes established by the commission; the basis of accrediting the colleges
Program Review—a formal documentation of the work effort of each department and programwith proposals for change and improvement; used as a basis for prioritizing both new positionsand equipment expenditures

6
ANNUAL OPERATIONAL PLANS
7
II. Advancing the Legacy: Who We Are and What’s Important to Us
FOOTHILL-DE ANZA COMMUNITY COLLEGE DISTRICT
Vision
Educational Excellence and Opportunity for All
Mission
The Foothill-De Anza Community College District provides a dynamic learning environmentthat fosters excellence, opportunity and innovation in meeting the educational needs of ourdiverse students and community.
Values
1. The Foothill-De Anza Community College District commits itself to serving our students,our local communities, and the people of the state of California, and considers thefollowing values as cornerstones of our mission:
pursuing truth and knowledge recognizing inherent potential in all people fostering informed and responsible citizenship maintaining academic rigor and inquiry developing cultural and global awareness generating creativity and creative expression promoting ethics and ethical behavior promoting environmental sustainability
2. Foothill-De Anza provides:
high quality educational opportunities for all our students an environment that is respectful of human dignity and diversity the resources necessary to realize the vision and mission of the district
Organizing Principles
The Foothill-De Anza Community College District accomplishes its objectives by adhering to anadaptive organizational framework
1. We employ a governance structure that is open, inclusive, reflective, and flexible.2. We recognize and support the distinct ethos of each college.
8
3. We emphasize clear and open communication.4. We foster an environment that maximizes the talents, abilities, and contributions of
district employees and students.5. We establish procedures that welcome all perspectives in decision making and planning.6. We promote and reward creativity and ingenuity.7. We facilitate cooperation and inclusion.8. We use district resources effectively and efficiently.
Guiding Strategies
Our values and organizing principles give rise to these guiding strategies:
1. Attract and retain students from all areas and groups within our communities andinternationally.
2. Recruit and employ faculty and staff that enhance the district’s emphasis on educationalexcellence.
3. Develop and implement instructional methods and support services that center on studentsuccess and learning outcomes.
4. Evaluate all programs regularly to ensure their continued high quality, currency andnecessity.
5. Seek revenues from all sources, both public and private.6. Inform the public of District issues and accomplishments, as well as schedules of all
programs and events.7. Promote relationships with other institutions and programs, locally, nationally and
internationally.
Purposes and Functions
Drawing on the mission, values, organizing principles, and guiding strategies, the Foothill-DeAnza Community College District identifies these purposes for each facet of the District:
I. The Community, having established the Foothill-De Anza Community College District:A. Elects representatives to a Board of Trustees that oversees District operations.B. Supports the District through local, state, and other resources, ensuring the continued
excellence of each college.C. Provides valuable feedback to the district that helps shape district goals and priorities.
II. The Board of Trustees, as representatives of the community:A. Oversees the Foothill-De Anza mission.B. Sets District policy and monitors its implementation.C. Is responsible for all District operations.D. Participates in and actively promotes partnerships with the colleges.E. Employs and oversees the evaluation of all personnel.F. Advocates on behalf of the District at all levels of government.G. Meets regularly in open session.H. Encourages and welcomes public feedback.

9
III. Foothill-De Anza provides high quality educational opportunity through these elements:A. The Chancellor, as Chief Executive Officer of the District:
1. Provides thoughtful and proactive leadership for the District2. Is responsible for District resource and program coordination and master planning3. Implements Board policy and state and federal regulations4. Promotes effective communication among all District communities5. Directs budget development and resource allocation procedures6. Administers and is responsible for collective bargaining negotiations7. Coordinates the functions and activities of the two Colleges and Central Services.8. Represents Foothill-De Anza in educational and legislative matters at all levels of
government9. Provides leadership in seeking new fiscal resources10. Promotes the reputation and accomplishments of the District11. Ensures that access to District services and programs remain open to all
B. The Colleges, as centers of instruction and student services:1. Identify and respond to the educational needs of their unique constituencies2. Provide high quality instructional programs and the support services necessary to
maintain them3. Develop and implement programs and curricula that meet community needs while
maintaining rigorous academic standards4. Coordinate instructional standards and goals for courses and programs offered by
both Colleges5. Administer and monitor the College budgets6. Evaluate all campus programs and staff7. Recruit, screen, and recommend employment of all College staff8. Coordinate with Central Services and one another in recognition of the needs of the
entire district9. Pursue all available methods of funding10. Establish and maintain educational opportunities that are meaningful and enhance
the quality of life of students11. Review educational and support programs regularly for both quality and success12. Emphasize the measurable outcomes of courses and programs of study13. Develop, monitor, and implement budgets14. Support educational technology
C. Central Services, as Foothill-De Anza’s staff administrative agency:1. Assists the Colleges in achieving their missions2. Provides District-wide research and information management3. Coordinates the development of the budget4. Monitors the budget, providing accounting, purchasing, and internal financial
control services5. Performs District reporting and compliance functions6. Provides all necessary district-wide services, including human resources, plant,
payroll, and educational technology resources7. Seeks to integrate services seamlessly into the daily operations of the District and
the Colleges
10
Priorities
Our vision, mission, values and goals guide and shape the priorities of the District. In accordancewith these priorities, District members work to provide a high quality teaching/learningenvironment that focuses on student success and sound educational programs. These programsinclude both formal and informal student experiences and promote ethics and a yearning forunderstanding. Whether enrolled in a single class or an entire course of study, Foothill-De Anzastudents will discover our emphasis on personal and civic responsibility, global awareness, and ameaningful exploration of the human condition, including an understanding of the physical andsocial sciences, written and oral expression, the arts, and quantitative reasoning.
Attaining these goals requires that program effectiveness be maintained through thoughtful andcareful review. Some factors considered in assessing program effectiveness include, but are notlimited to the:
Promotion of complex critical and analytical thinking Development of career training, retraining, and/or preparation Development of community awareness and engagement Development of communication skills Number of students served Number of graduates from a program Level of community support Revenues involved
Inherent in our mission is the belief that each student has merit and that our programs andservices are available to students without regard to enrollment status, physical ability, age, sex,ethnicity, religion, or sexual orientation.
Comprehensiveness, i.e., offering a wide range of programs, remains a District commitment. Ifresources do not allow specific programs to be offered on both campuses, curriculum balanceshould be achieved by offering courses and programs on at least one campus.
The quality of our educational programs can best be realized by maintaining a work environmentthat recognizes the dignity and contributions of all employees of the district regardless ofwhether they are full-time, part-time, temporary or casual.
Educational excellence and opportunity for all remains the District’s top priority.
In view of the foregoing values, the District affirms the following priorities, as the basis fordetermining what programs will be offered to the community. A balance among all of theseprograms should be maintained.
1. In order to sustain the quality, richness, and diversity of its programs, the District gives firstand equal priority to courses required for general education and to courses required formajors in all degree and certificate programs. In general, programs designed to provide entryinto postsecondary fields of study and programs offering career and vocational developmentin areas of identified community-need would get higher priority than programs with otheremphases.
11
2. Entry-level counseling, assessment and placement, support services, and essentialinstructional resources must be maintained to enroll and assist students in appropriate coursework.
3. Developmental courses will be offered to provide instruction necessary for successfulparticipation in college-level course work.
4. Support services beyond the entry-level should be maintained in proportion to the need forassistance in areas critical to the educational success of students.
5. Lifelong learning programs are an important aspect of the curriculum and services of theDistrict in fulfilling its mission to the community.
6. Serving international students here and abroad is an essential element of the District’scommitment to foster understanding and build global partnerships.

13
III. Advancing the Legacy: The External Environment and Its Impact on the District
Ever-changing social, economic and cultural factors require that Foothill-De Anza adapt to theneeds of the larger community. These changes always present challenges, as well as a vast arrayof opportunities to better serve students and to effect changes of our own on the environment:well-educated, highly trained students who contribute personally, professionally andeconomically to their families, communities and the state of California. The analysis of data onthe Silicon Valley trends that will have the greatest impact on the district led to seven planningpremises for Foothill-De Anza’s Educational Master Plan 2005-2015:
Planning Premises
1) Dynamic Population Changes Are Creating Diverse Educational Needs2) Knowledge-Based Industries Are Fueling the Shift from a Manufacturing- to Service-
Based Economy3) The Occupational Structure is Shifting Toward Jobs Requiring High-Level, Flexible
Skills4) Other Postsecondary Education and Training Providers Form a Context for Collaboration
and Competition5) Fiscal Resources Must Be Enhanced6) We Must Respond to Overall Trends in the California Community Colleges

14
Planning Premise 1Dynamic Population Changes Are Creating Diverse Educational Needs
Foothill-De Anza must respond to a changing population diverse in age, ethnicity, language andlifestyles and with a range of educational needs in order to provide educational opportunity andexcellence. While the demographic changes in our service area will be dramatic, they arenonetheless generally predictable.
Silicon Valley’s Changing Population
The population of Santa Clara County is expected to grow at a little less than one percentannually over the next few decades, from 1.75 million people in 2005 to 2.15 million by 2030.Growth in San Mateo County will be slower, reaching 800,000 during the same time period.
0
250,000
500,000
750,000
1,000,000
1,250,000
1,500,000
1,750,000
2,000,000
2,250,000
2,500,000
1990 1995 2000 2005 2010 2015 2020 2025 2030
Figure 1 - Historical and Forecast Population by County1990 to 2030
SOURCE: State of California, Department of Finance, Race/Ethnic Population with Age and Sex Detail, 1990–1999. Sacramento, CA, May 2004. State of California, Department of Finance, Race/Ethnic Population with Age and Sex Detail, 2000–2050. Sacramento, CA, May 2004.
San Mateo County0.6% annually1990 to 2030
Santa Clara County0.9% annually1990 to 2030

15
As the current workforce retires, much of the growth will be in Silicon Valley’s older population.The number of individuals 60 or older is expected to increase 2.9 percent annually to 2030, morethan three times the overall rate of growth. Though the working-age population grewconsiderably over the 1990s as the economic boom attracted workers from around the UnitedStates and abroad, this trend is not expected to continue, with the working-age populationremaining essentially unchanged. The secondary and postsecondary school-aged population isexpected to experience moderate growth of 0.6 percent annually to 2030.
0
250,000
500,000
750,000
1,000,000
1,250,000
1,500,000
1990 1995 2000 2005 2010 2015 2020 2025 2030
Figure 2 - Historical and Forecast Population by Age GroupSanta Clara and San Mateo Counties Combined1990 to 2030
SOURCE: State of California, Department of Finance, Race/Ethnic Population with Age and Sex Detail, 1990–1999. Sacramento, CA, May 2004. State of California, Department of Finance, Race/Ethnic Population with Age and Sex Detail, 2000–2050. Sacramento, CA, May 2004.
Age 25 to 590.1% annually2000 to 2030
Age 60+2.9% annually2000 to 2030
Age 0 to 140.2% annually2000 to 2030
Age 15 to 240.6% annually2000 to 2030
16
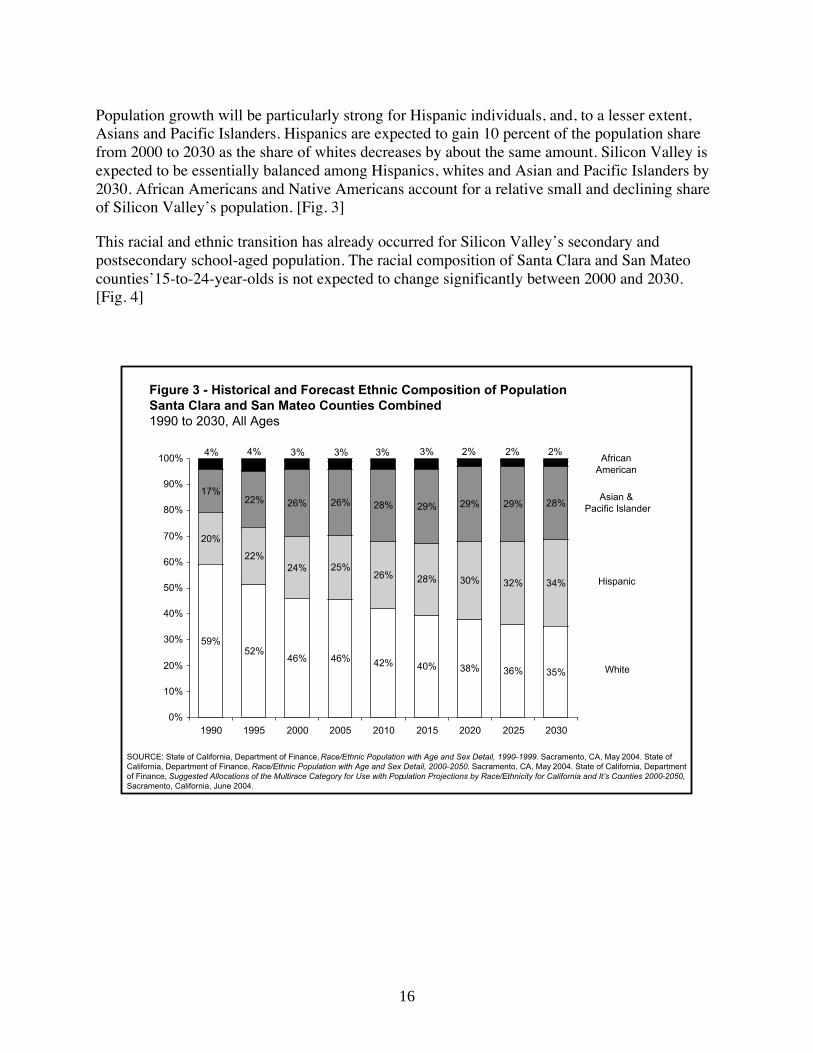
Population growth will be particularly strong for Hispanic individuals, and, to a lesser extent,Asians and Pacific Islanders. Hispanics are expected to gain 10 percent of the population sharefrom 2000 to 2030 as the share of whites decreases by about the same amount. Silicon Valley isexpected to be essentially balanced among Hispanics, whites and Asian and Pacific Islanders by2030. African Americans and Native Americans account for a relative small and declining shareof Silicon Valley’s population. [Fig. 3]
This racial and ethnic transition has already occurred for Silicon Valley’s secondary andpostsecondary school-aged population. The racial composition of Santa Clara and San Mateocounties’15-to-24-year-olds is not expected to change significantly between 2000 and 2030.[Fig. 4]
Figure 3 - Historical and Forecast Ethnic Composition of PopulationSanta Clara and San Mateo Counties Combined1990 to 2030, All Ages
SOURCE: State of California, Department of Finance, Race/Ethnic Population with Age and Sex Detail, 1990–1999. Sacramento, CA, May 2004. State of California, Department of Finance, Race/Ethnic Population with Age and Sex Detail, 2000–2050. Sacramento, CA, May 2004. State of California, Department of Finance, Suggested Allocations of the Multirace Category for Use with Population Projections by Race/Ethnicity for California and It’s Counties 2000-2050,Sacramento, California, June 2004.
59%52%
46% 46% 42% 40% 38% 36% 35%
20%
22%24% 25%
26% 28% 30% 32% 34%
17%22% 26% 26% 28% 29% 29% 29% 28%
2%2%2%3%3%3%3%4%4%
0%
10%
20%
30%
40%
50%
60%
70%
80%
90%
100%
1990 1995 2000 2005 2010 2015 2020 2025 2030
AfricanAmerican
Asian & Pacific Islander
Hispanic
White

17
Figure 4 - Historical and Forecast Ethnic Composition of PopulationSanta Clara and San Mateo Counties Combined1990 to 2030, Ages 15 to 24
SOURCE: State of California, Department of Finance, Race/Ethnic Population with Age and Sex Detail, 1990–1999. Sacramento, CA, May 2004. State of California, Department of Finance, Race/Ethnic Population with Age and Sex Detail, 2000–2050. Sacramento, CA, May 2004. State of California, Department of Finance, Suggested Allocations of the Multirace Category for Use with Population Projections by Race/Ethnicity for California and It’s Counties 2000-2050,Sacramento, California, June 2004.
48%39%
34% 38% 35% 32% 32% 33% 32%
28%
31%35%
32% 33% 35% 35% 36% 39%
19%26% 27% 25% 27% 28% 29% 28% 27%
2%2%3%3%3%4%4%4%5%
0%
10%
20%
30%
40%
50%
60%
70%
80%
90%
100%
1990 1995 2000 2005 2010 2015 2020 2025 2030
AfricanAmerican
Asian & Pacific Islander
Hispanic
White

18
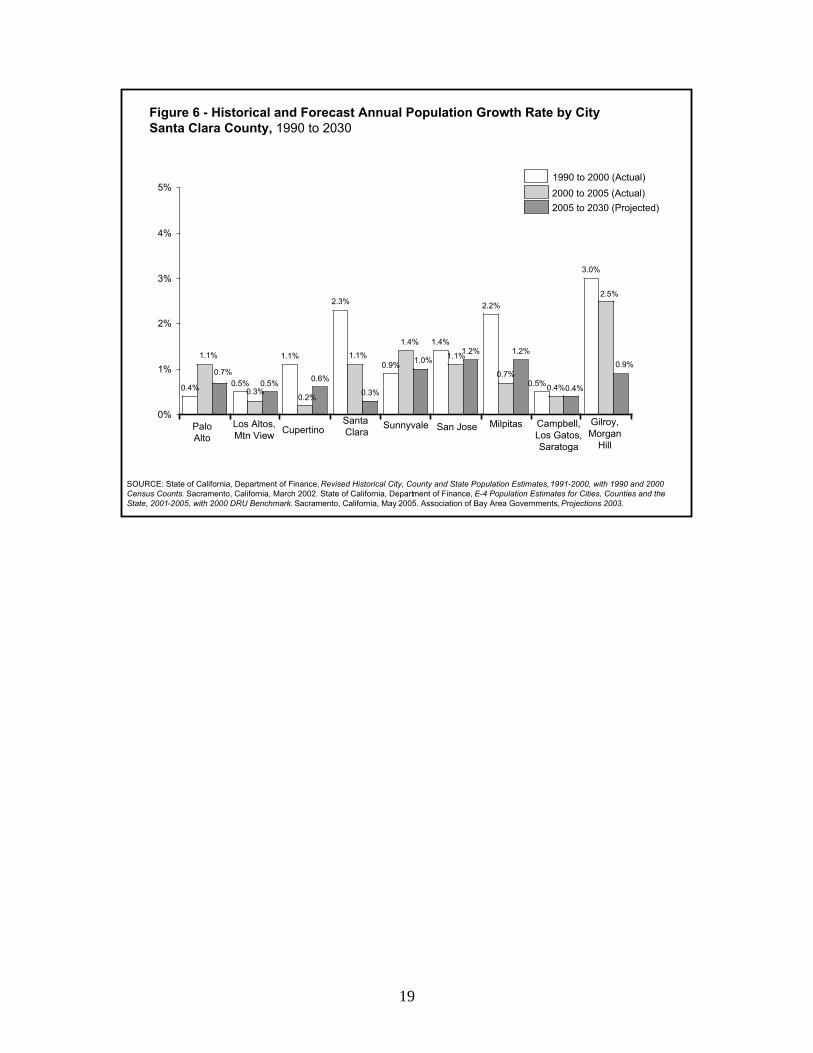
Much of Santa Clara County’s population growth has occurred and will continue to occur in thecity of San Jose, which added more than 160,000 residents from 1990 to 2005. Recent populationgrowth has also been significant in the cities surrounding and south of San Jose, including SantaClara, Milpitas, Gilroy and Morgan Hill. Most of the cities within Foothill-De Anza’s servicearea have experienced moderate to slow growth in recent years; this pattern is expected tocontinue.
25,000
50,000
75,000
100,000
125,000
150,000
1990 1995 2000 2005500,000
600,000
700,000
800,000
900,000
1,000,000
Figure 5 - Population by CitySanta Clara County, 1990 to 2005
SOURCE: State of California, Department of Finance, Revised Historical City, County and State Population Estimates, 1991-2000, with 1990 and 2000 Census Counts. Sacramento, California, March 2002. State of California, Department of Finance, E-4 Population Estimates for Cities, Counties and the State, 2001-2005, with 2000 DRU Benchmark. Sacramento, California, May 2005.
Los Altos, Mountain View
Sunnyvale
Santa Clara
Campbell, Los Gatos, Saratoga
Gilroy, Morgan Hill
Milpitas
Palo Alto
Cupertino
San Jose
Scale for San JoseScale for All Others
19
0.7%
0.4%0.5% 0.6%
0.3%
1.2% 1.2%
0.5%0.5%0.4%
1.1%
2.3%
0.9%
1.4%
2.2%
3.0%
1.1%
0.2%0.3%
1.1%
2.5%
1.4%
1.1%0.9%
0.4%
1.0%0.7%
0%
1%
2%
3%
4%
5%
Figure 6 - Historical and Forecast Annual Population Growth Rate by CitySanta Clara County, 1990 to 2030
SOURCE: State of California, Department of Finance, Revised Historical City, County and State Population Estimates, 1991-2000, with 1990 and 2000 Census Counts. Sacramento, California, March 2002. State of California, Department of Finance, E-4 Population Estimates for Cities, Counties and the State, 2001-2005, with 2000 DRU Benchmark. Sacramento, California, May 2005. Association of Bay Area Governments, Projections 2003.
Los Altos, Mtn View
SunnyvaleSanta Clara
Gilroy, Morgan
Hill
Milpitas Palo Alto
Cupertino San Jose
1990 to 2000 (Actual)2000 to 2005 (Actual)
Campbell, Los Gatos, Saratoga
2005 to 2030 (Projected)

20
The Reach of Foothill-De Anza
While the population of Silicon Valley has steadily increased, fall enrollment in theFoothill-De Anza Community College District has fluctuated at around 40,000 students.
0
5,000
10,000
15,000
20,000
25,000
30,000
35,000
40,000
45,000
50,000
1980
1981
1982
1983
1984
1985
1986
1987
1988
1989
1990
1991
1992
1993
1994
1995
1996
1997
1998
1999
2000
2001
2002
2003
2004
0
200,000
400,000
600,000
800,000
1,000,000
1,200,000
1,400,000
1,600,000
1,800,000
2,000,000
Figure 7 - Population and Enrollment Growth1980 to 2004
SOURCE: Enrollment data from FH-DACCD Institutional Research Office. Population data from State of California, Department of Finance, Revised Historical City, County and State Population Estimates, 1991-2000, with 1990 and 2000 Census Counts.Sacramento, California, March 2002 and E-4 Population Estimates for Cities, Counties and the State, 2001-2005, with 2000 DRU Benchmark. Sacramento, California, May 2005.
Population of Santa Clara County
Fall Enrollment in Foothill-De Anza CCD
Enrollment Population

21
Foothill-De Anza has increasingly attracted more Asian and Pacific Islander students and fewerwhites, while the share of Hispanic and African American students has increased more gradually.Foothill-De Anza currently enrolls about two-fifths white and two-fifths Asian students, withHispanic and African American students making up the balance. Some caution must beexercised, however, regarding this calculation; a significant proportion of students—as many as20 percent in recent years—have declined to state their ethnicity, which is therefore “unknown.”In Figure 8 below, the assumption is that those of “unknown” ethnicity are distributed in thesame proportion as those that are known.
Figure 8 - Ethnic Composition of Foothill-De Anza District Students1996 to 2004, All Ages
SOURCE: FHDA Institutional Research & Planning Office
50% 49% 46% 45% 42% 41% 40% 39% 39%
12% 12%13% 14% 14% 14% 14% 15% 15%
33% 34% 36% 37% 39% 41% 42% 41% 41%
5%4%4%4%4%4%4%4%4%
0%
10%
20%
30%
40%
50%
60%
70%
80%
90%
100%
1996 1997 1998 1999 2000 2001 2002 2003 2004
AfricanAmerican
Asian & Pacific Islander
Hispanic
White

22
While Foothill-De Anza has disproportionately more Asian or Pacific Islander and fewerHispanic students than the population of Santa Clara County, enrollment is fairly representativeof the racial composition of cities nearest to each college. Palo Alto, Mountain View and LosAltos residents are primarily white and Asian; Foothill College has a similar racial composition.Residents of the cities of Cupertino, Sunnyvale and Santa Clara are also primarily white andAsian and De Anza’s student body reflects this pattern as well.
Figure 9 – Ethnic Composition of Foothill-De Anza Students and Neighboring Cities2000, All Ages
Notes: Individuals with unknown, other, or two or more races arenot includedSOURCE: FHDA Institutional Research & Planning Office; U.S. Census 2000 Summary File 1 through American FactFinder
42% 46%53%
75%
57%
80%
35%49% 48% 50%
14%
25% 14%
5%
19%
3%
14%
4%16% 17%
39%
27% 29%
18% 21%16%
46%46%
33% 31%
0%
10%
20%
30%
40%
50%
60%
70%
80%
90%
100%
FH-D
A D
istri
ct
San
ta C
lara
Cou
nty
Foot
hill
Col
lege
Pal
o A
lto
Mou
ntai
n V
iew
Los
Alto
s
De
Anz
a C
olle
ge
Cup
ertin
o
Sun
nyva
le
San
ta C
lara
AfricanAmerican
Asian & Pacific Islander
Hispanic
White
23
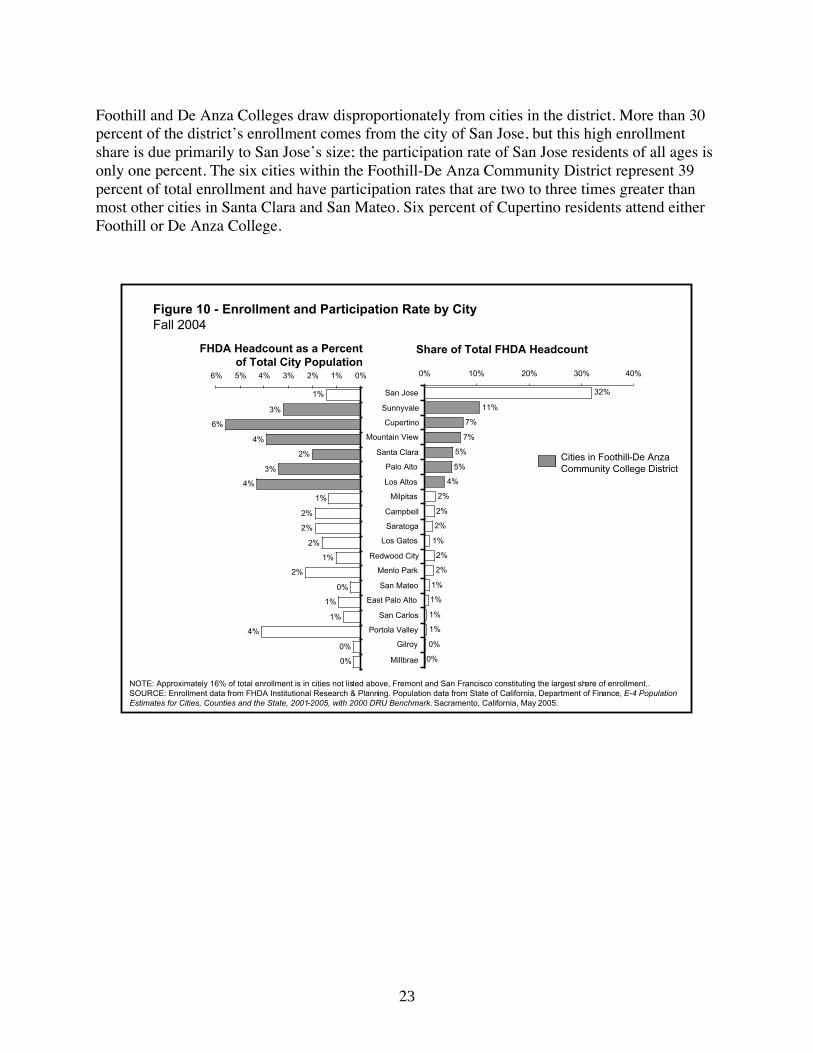
Foothill and De Anza Colleges draw disproportionately from cities in the district. More than 30percent of the district’s enrollment comes from the city of San Jose, but this high enrollmentshare is due primarily to San Jose’s size; the participation rate of San Jose residents of all ages isonly one percent. The six cities within the Foothill-De Anza Community District represent 39percent of total enrollment and have participation rates that are two to three times greater thanmost other cities in Santa Clara and San Mateo. Six percent of Cupertino residents attend eitherFoothill or De Anza College.
NOTE: Approximately 16% of total enrollment is in cities not listed above, Fremont and San Francisco constituting the largest share of enrollment.. SOURCE: Enrollment data from FHDA Institutional Research & Planning. Population data from State of California, Department of Finance, E-4 Population Estimates for Cities, Counties and the State, 2001-2005, with 2000 DRU Benchmark. Sacramento, California, May 2005.
1%
1%
1%
0%
0%
1%
2%
2%
1%
2%
2%
4%
5%
5%
7%
7%
32%
11%
2%
0% 10% 20% 30% 40%
San Jose
Sunnyvale
Cupertino
Mountain View
Santa Clara
Palo Alto
Los Altos
Milpitas
Campbell
Saratoga
Los Gatos
Redwood City
Menlo Park
San Mateo
East Palo Alto
San Carlos
Portola Valley
Gilroy
Millbrae
Figure 10 - Enrollment and Participation Rate by CityFall 2004
1%
1%
4%
0%
0%
0%
2%
1%
2%
2%
2%
4%
3%
2%
4%
6%
1%
3%
1%
0%1%2%3%4%5%6%
FHDA Headcount as a Percent of Total City Population
Share of Total FHDA Headcount
Cities in Foothill-De AnzaCommunity College District
24
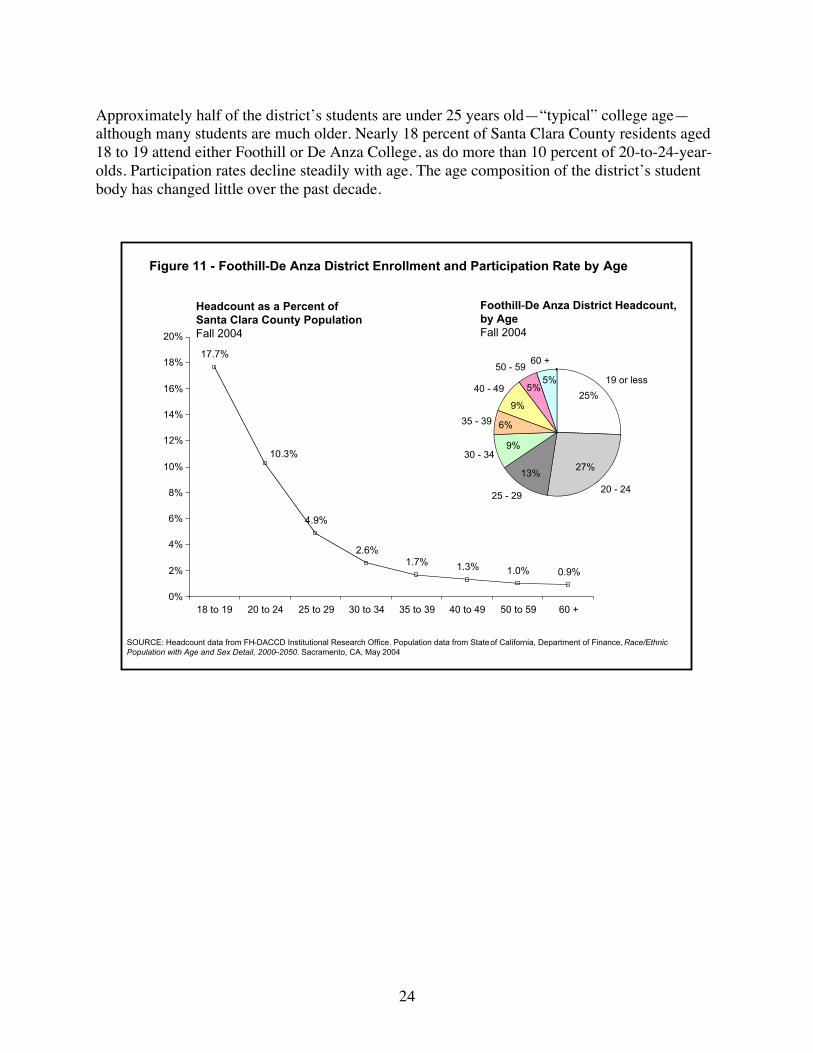
Approximately half of the district’s students are under 25 years old—“typical” college age—although many students are much older. Nearly 18 percent of Santa Clara County residents aged18 to 19 attend either Foothill or De Anza College, as do more than 10 percent of 20-to-24-year-olds. Participation rates decline steadily with age. The age composition of the district’s studentbody has changed little over the past decade.
Figure 11 - Foothill-De Anza District Enrollment and Participation Rate by Age
SOURCE: Headcount data from FH-DACCD Institutional Research Office. Population data from State of California, Department of Finance, Race/Ethnic Population with Age and Sex Detail, 2000–2050. Sacramento, CA, May 2004
17.7%
4.9%
2.6%1.7% 1.3% 1.0% 0.9%
10.3%
0%
2%
4%
6%
8%
10%
12%
14%
16%
18%
20%
18 to 19 20 to 24 25 to 29 30 to 34 35 to 39 40 to 49 50 to 59 60 +
19 or less
20 - 2425 - 29
30 - 34
35 - 39
40 - 49
50 - 5960 +
25%
27%13%
9%
9%
6%
5%5%
Headcount as a Percent of Santa Clara County PopulationFall 2004
Foothill-De Anza District Headcount,by AgeFall 2004

25
Projected Public High School Graduates
Twelfth-grade enrollment, and therefore the number of high school graduates, is projected togrow somewhat from 2004 through 2007 for Santa Clara County, but then decline slowlythrough 2015. Twelfth-grade enrollment for San Mateo County is projected to be stable from2004 to 2008, then begin a gradual decline to at least 2015.
Figure 12 – Projected 12th Grade EnrollmentSanta Clara and San Mateo Counties, 1999 to 2015
SOURCE: California Dept of Education, CBEDS Database, K-12 Public School Enrollment Reports, 1996-97 to 2003-04, Cohort Survival Ratio Forecasts by FHDA IR&P - Lourdes Del Rio-Parent – 5/19/05
0
2,000
4,000
6,000
8,000
10,000
12,000
14,000
16,000
18,000
20,000
1999 2000 2001 2002 2003 2004 2005 2006 2007 2008 2009 2010 2011 2012 2013 2014 2015
Santa Clara San Mateo

26
Student Preparedness
The level of preparedness of Santa Clara County high school students has increased in recentyears. High school graduation rates have improved slightly since 1998-99 after a steady periodduring the mid-1990s. At the same time, somewhat more students are finishing high schoolhaving successfully taken courses required for admission to the University of California andCalifornia State University systems.
SOURCE: CA Dept of Education, DataQuest Database; Graduation Rate Formula is based on the NCES definition.
Figure 13 – Graduation Rates and UC/CSU Preparedness of Santa Clara CountyHigh School Students
0%
10%
20%
30%
40%
50%
60%
70%
80%
90%
100%
94-95 95-96 96-97 97-98 98-99 99-00 00-01 01-02 02-03 03-04
Graduation Rate Met UC/CSU Requirements

27
However, there are enormous racial disparities in high school student preparedness. Asian, whiteand Filipino high school graduates are much more likely to meet UC and CSU courserequirements than African American, Hispanic, and Native American students. This pattern isreplicated statewide, but the disparities are more pronounced in Santa Clara County due to thehigh performance of Asian and white students in the county relative to the rest of California.
Figure 14 - UC/CSU Preparedness of Santa Clara County High School Students by Ethnicity2003-2004
SOURCE: CA Dept of Education, DataQuest Database
0%
10%
20%
30%
40%
50%
60%
70%
80%
90%
100%
Asian/PI AfricanAmerican
Filipino Hispanic Native Am White
Santa Clara State
28
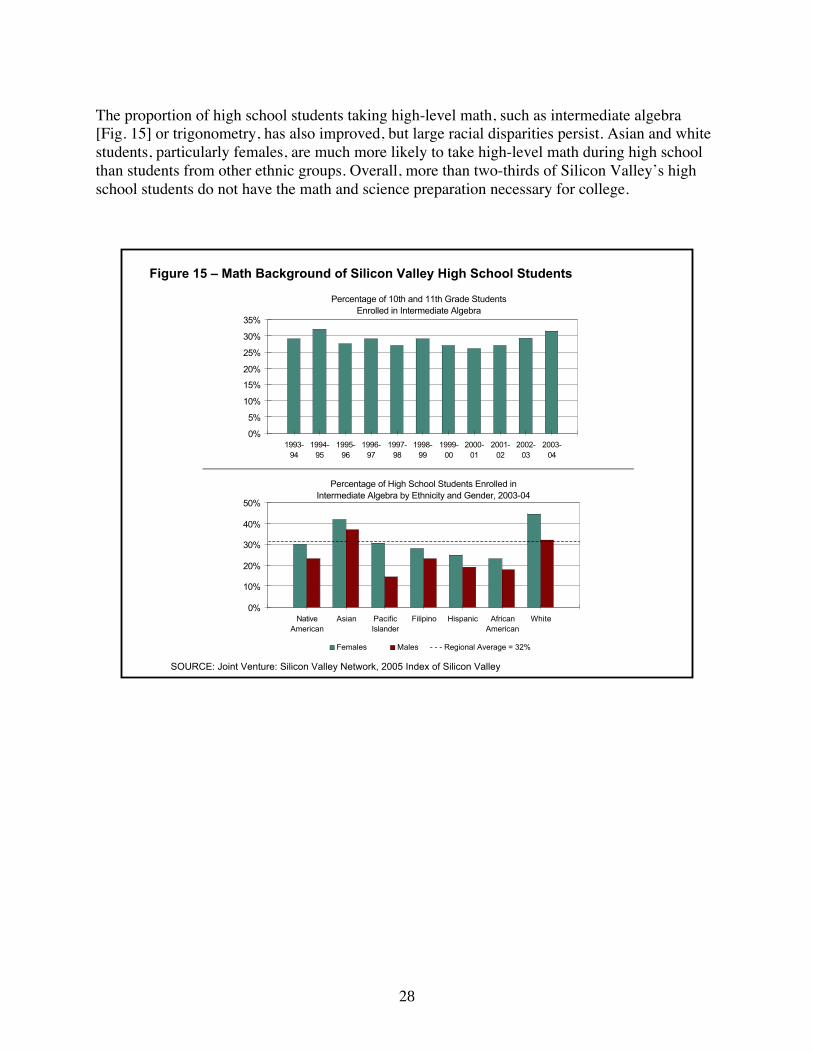
The proportion of high school students taking high-level math, such as intermediate algebra[Fig. 15] or trigonometry, has also improved, but large racial disparities persist. Asian and whitestudents, particularly females, are much more likely to take high-level math during high schoolthan students from other ethnic groups. Overall, more than two-thirds of Silicon Valley’s highschool students do not have the math and science preparation necessary for college.
SOURCE: Joint Venture: Silicon Valley Network, 2005 Index of Silicon Valley
Figure 15 – Math Background of Silicon Valley High School Students
Percentage of 10th and 11th Grade StudentsEnrolled in Intermediate Algebra
0%
5%
10%
15%
20%
25%
30%
35%
1993-94
1994-95
1995-96
1996-97
1997-98
1998-99
1999-00
2000-01
2001-02
2002-03
2003-04
Percentage of High School Students Enrolled inIntermediate Algebra by Ethnicity and Gender, 2003-04
0%
10%
20%
30%
40%
50%
NativeAmerican
Asian PacificIslander
Filipino Hispanic AfricanAmerican
White
Females Males - - - Regional Average = 32%
29
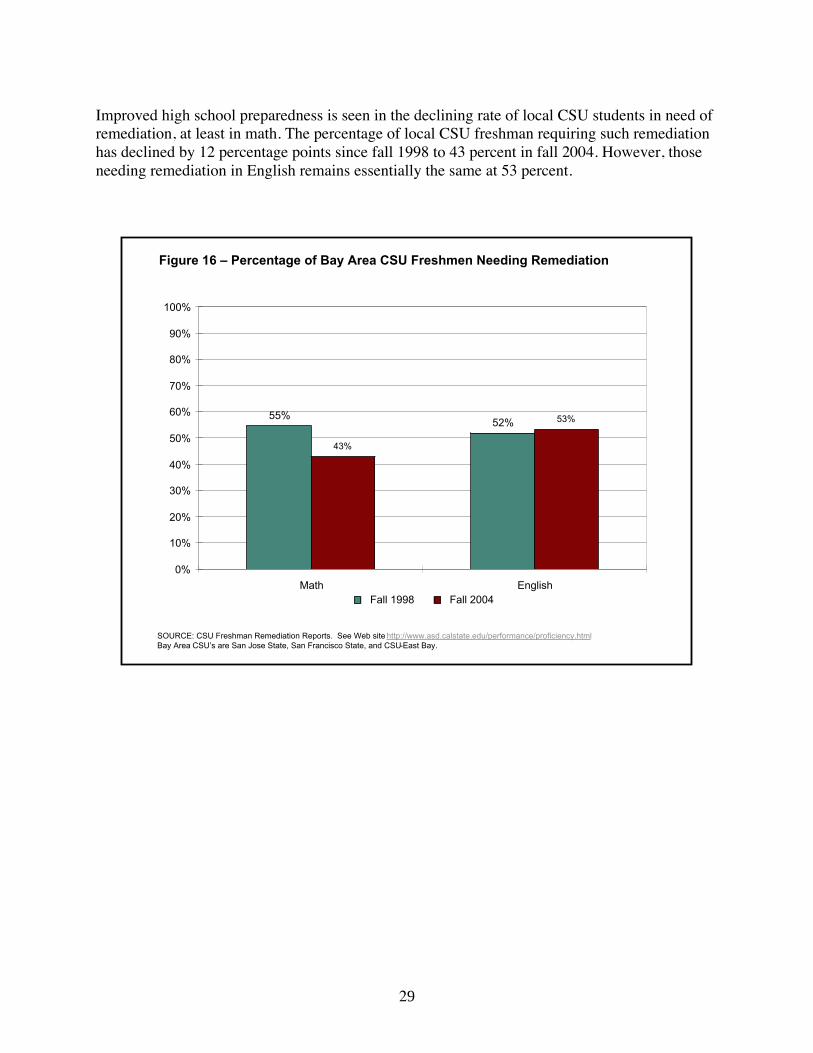
Improved high school preparedness is seen in the declining rate of local CSU students in need ofremediation, at least in math. The percentage of local CSU freshman requiring such remediationhas declined by 12 percentage points since fall 1998 to 43 percent in fall 2004. However, thoseneeding remediation in English remains essentially the same at 53 percent.
Figure 16 – Percentage of Bay Area CSU Freshmen Needing Remediation
SOURCE: CSU Freshman Remediation Reports. See Web site http://www.asd.calstate.edu/performance/proficiency.htmlBay Area CSU’s are San Jose State, San Francisco State, and CSU-East Bay.
55%52%
43%
53%
0%
10%
20%
30%
40%
50%
60%
70%
80%
90%
100%
Math English Fall 1998 Fall 2004

30
Many Foothill-De Anza students are older, working adults who already have a four-year degree.The number of Foothill-De Anza students with a U.S. or foreign bachelor’s degree peaked atalmost 8,700 in 2002; even with the decline over the next two years, there were still 7,239students with a bachelor’s degree in 2004. Another 2,560 had a graduate degree.
Figure 17 – Prior Degrees Obtained by Foothill-De Anza Students
SOURCE: FHDA Institutional Research & Planning (Web Site Factbook, Enrollment Trends by Highest Degree)
0
500
1,000
1,500
2,000
2,500
3,000
3,500
4,000
4,500
5,000
5,500
6,000
6,500
1996 1997 1998 1999 2000 2001 2002 2003 2004
Associate's Bachelor's Master's or Higher Foreign Degree
31
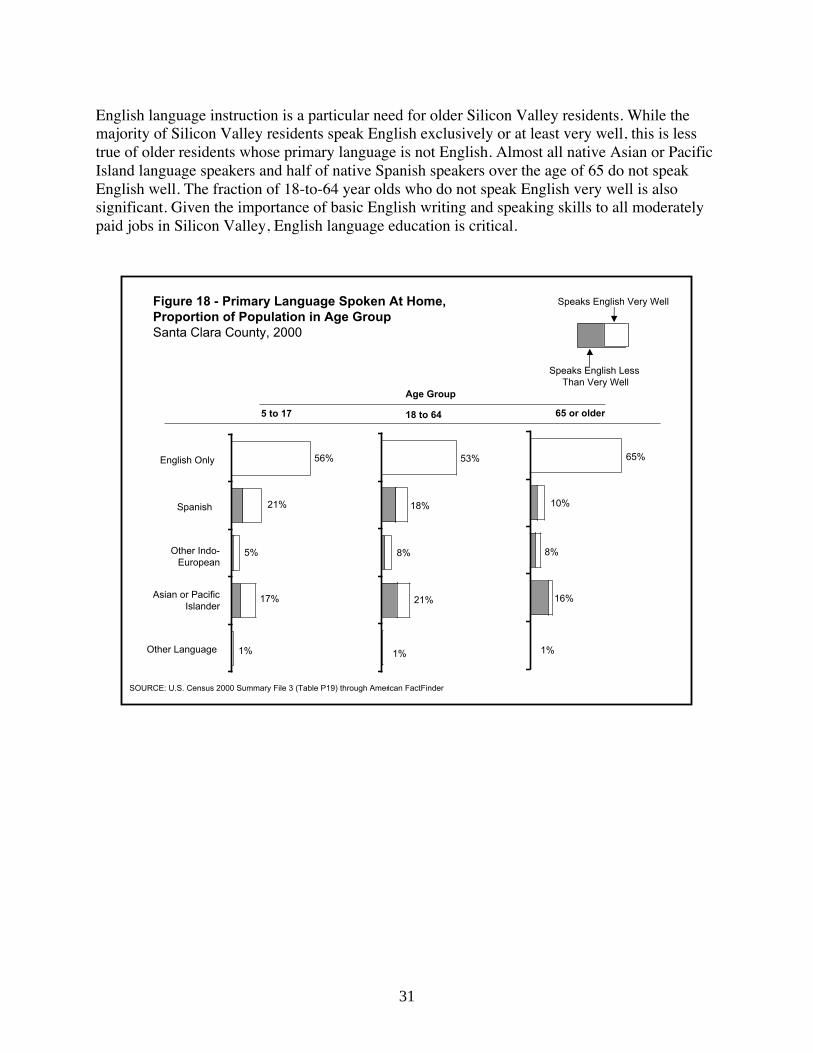
English language instruction is a particular need for older Silicon Valley residents. While themajority of Silicon Valley residents speak English exclusively or at least very well, this is lesstrue of older residents whose primary language is not English. Almost all native Asian or PacificIsland language speakers and half of native Spanish speakers over the age of 65 do not speakEnglish well. The fraction of 18-to-64 year olds who do not speak English very well is alsosignificant. Given the importance of basic English writing and speaking skills to all moderatelypaid jobs in Silicon Valley, English language education is critical.
English Only
Spanish
Other Indo-European
Asian or Pacific Islander
Other Language
Figure 18 - Primary Language Spoken At Home, Proportion of Population in Age GroupSanta Clara County, 2000
SOURCE: U.S. Census 2000 Summary File 3 (Table P19) through American FactFinder
5 to 17
56%
21%
5%
17%
1%
18 to 64
53%
18%
8%
21%
1%
65 or older
65%
10%
8%
16%
1%
Speaks English Very Well
Speaks English Less Than Very Well
Age Group

32
Implications for Foothill-De Anza: Changes in Demographics and Educational Needs
As posited in Planning Premise 1, Silicon Valley’s growth in population brings with it anincreasing diversity in the educational needs of its residents served by the colleges. The populationof Silicon Valley has undergone several pronounced changes in recent years. The share ofresidents that are Hispanic or Asian has increased dramatically over the past decade, particularlyamong college-aged residents. The share of Asian residents is expected to level off, although theportion of Hispanic residents should increase gradually. The population is also aging: Individualsover the age of 60 are the fastest-growing segment of Silicon Valley’s population. Geographically,population growth will be greatest in cities beyond Foothill-De Anza’s district boundaries, nearand south of the city of San Jose. Finally, the level of preparedness for college among SiliconValley’s younger residents has improved somewhat, particularly in math, yet large racialdisparities continue to exist. Students’ lack of preparedness for college in general remains an issuefor the region and the colleges should expect to continue to provide basic skills courses inlanguage arts and mathematics over the next decade as disparities persist among high-andlow-performing high schools. However, we can expect an increasing portion of students to enterour institutions with better preparation.
Student characteristics reflect some of these demographic trends. Hispanic and Asian studentshave increasingly comprised a larger share of the district’s students, who roughly reflect theethnic composition of cities within the district, though not that of Santa Clara County overall.The colleges draw students from throughout the Silicon Valley area; however, participation ratesare highest among cities within the district boundaries. Participation rates are also very highamong traditional “college-aged” Santa Clara County residents. The number and proportion ofolder residents is growing significantly while their share of the total enrollment of the district hasremained about the same in the past 10 years. The overall aging of the population willnecessarily be a consideration of the district as it moves into the future.

33
Planning Premise 2Knowledge-Based Industries Are Fueling the Shift from a Manufacturing- to Service-BasedEconomy
Not only is Foothill-De Anza serving a dynamically changing population, but it is also serving aregion in which there has been and will continue to be large shifts in the composition ofindustries, employment and occupations. These changes in Silicon Valley have ongoing effectsand implications for the educational needs of those preparing for careers and making careerchanges, and for the development of the employed workforce.
Changing Industry Structure
The past 30 years has brought a near tripling of employment in Silicon Valley and a rapid shiftfrom manufacturing to service-oriented and information industries. Economic growth in the1970s was largely due to expansions in manufacturing, particularly in high-tech industries, whichexpanded from 33 to 37 percent of total employment during that decade. Recent growth has beenfueled by growth in services, particularly business services during the 1990s. While servicesgrew at rate of 5.5 percent during the 1990s, manufacturing stagnated. Employment growth inother non-governmental industries such as trade, construction, finance, transportation,communication and utilities has roughly kept pace with that of the economy as a whole.The past 10 years has accelerated this transition. Manufacturing both grew more slowly duringthe boom of the late 1990s and has experienced much more severe job loss during the downturn—approximately 10 percent annually. Overall, Silicon Valley has lost 180,000 of its jobs sincepeak employment in 2000. Jobs that remain are much more likely to be in service-producingindustries.

34
0
200,000
400,000
600,000
800,000
1,000,000
1,200,000
1995 2000 2004
Figure 20 - Average Annual Non-Farm EmploymentSan Jose MSA1995 to 2004
Note: San Jose MSA includes Santa Clara and San Benito Counties. The geographic scope and industry categories are not directly comparablebetween Figures 1 and 2.SOURCE: US Bureau of Labor Statistics Current Employment Statistics program
Government
Service-ProducingAnnual GrowthRate95-00: 5%00-04: -4%
ManufacturingAnnual Growth Rate95-00: 2%00-04: -10%
Construction841,000
1,043,000
860,000
4% -5%
Total =
59%
27%
11%3%
62%
24%
9%
5%
64%
20%
11%
5%
Annual Growth Rate
0
200
400
600
800
1,000
1,200
1970 1980 1990 2000
Figure 19 - Average Annual Non-Farm EmploymentSanta Clara County1970 to 2000, thousands
SOURCE: US Bureau of Labor Statistics Current Employment Statistics program
Government
ServicesAnnual GrowthRate70-80: 6.8%80-90: 3.9%90-00: 5.5%
Transportation, Communication, Utilities
ManufacturingAnnual Growth Rate70-80: 7.2%80-90: 0.4%90-00: 0.2%
Construction
Trade
Finance
378
675
815
1,030
6.0%
1.9%
2.4%
Total =
20%
33%
19%
16%
22%
37%
19%
12%
26%
32%
21%
11%
36%
25%
19%
9%
5%
3%3%
Annual Growth Rate

35
Figure 21 divides average annual non-farm employment into three broad segments—informationtechnology (IT), non-information technology industry (non-IT) and the local service sector—anddisplays three dynamics with respect to these sectors. First, it displays the overall level of employmentfor 1995, 2000 and 2004 (as also indicated in Figure 20). In 2000, non-farm jobs numbered 1,043,000,an increase of 202,000 over the 841,000 of 1995. However, the downturn after 2000 reduced totalnon-farm employment by 186,000 to 860,000 by 2004. Figure 21 also shows the relative size of sectoremployment compared to total employment within each of the three years displayed. As total overallemployment shrank, the IT sector share of total employment also shrank, from 21 percent in 2000 to 17percent in 2004, indicating that IT lost job proportionally faster than the overall job loss. Non-ITindustry jobs also contracted from a 45 percent share to 42 percent share. However, while shrinking inabsolute numbers, the local service sector nevertheless increased its share of total employment from 34percent in 2000 to 41 percent in 2004. In addition, Figure 21 displays the average annual percentagechange in jobs for the total and for each of the three sectors. Overall, the total number of jobs increasedat a four percent average annual rate from 1995 to 2000 but decreased during the downturn after 2000 atan average annual rate of five percent. The average annual decrease in jobs during the downturn variedwithin the IT sector, losing an average of eight percent per year. The non-IT sector suffered almost asmuch, losing an average of seven percent of its jobs each year during the downturn. Meanwhile, thelocal service sector lost only an average of one percent of its jobs during the downturn, thus gainingshare of overall employment from both the IT and non-IT sectors.
While growth in IT has clearly subsided since 2000, services in the three IT categories—Internetand data services, software publishing and telecommunications—are still well above historicallevels and likely to stay there. IT-related manufacturing continues a decline apparent in the early1990s, a trend that was halted briefly during the boom. [Fig. 22]
Non-IT industry sectors have also been hit by the economic downturn, most notably inprofessional services (such as engineering, accounting and consulting) and administrativesupport services, whose major customers include many Silicon Valley technology firms.Finance, non-software publishing, and construction have all fared comparably well since thedownturn, but comprise a relatively small share of Silicon Valley employment. Non-ITmanufacturing continues to experience dramatic recent employment declines. [Fig. 23]
Employment in most of the local service sector has held steady or even improved throughout thedownturn, such as in the recreation fields, with arts and entertainment, hotel accommodation andfood service losing few jobs. The health and educational services sectors have added jobs since2000. Cuts in retail and local government have been more dramatic, although government cutsdid not begin to occur until 2003. [Fig. 24]

36
0
10,000
20,000
30,000
40,000
50,000
60,000
70,000
80,000
1990 1991 1992 1993 1994 1995 1996 1997 1998 1999 2000 2001 2002 2003 2004
Figure 22 - Average Annual Employment in Information Technology Sectors
San Jose MSA
1990 to 2004
Note: San Jose MSA includes Santa Clara and San Benito Counties
Source: California Employment Development Department, Labor Market Information Division
Semiconductor Mfg
Hardware Mfg
IT Services
Internet, Data Services
Software Publishers
Telecommunications
0
200,000
400,000
600,000
800,000
1,000,000
1,200,000
1995 2000 2004
Figure 21 - Average Annual Non-Farm Employment
San Jose MSA
1995 to 2004
Note: San Jose MSA includes Santa Clara and San Benito Counties.The geographic scope and industry categories are not directly comparable
between Figures 1 and 3.
SOURCE: US Bureau of Labor Statistics Current Employment Statistics program
Local Service Sectors
Annual Growth Rate
95-00: 3%
00-04: -1%
IT Sectors
Annual Growth Rate
95-00: 8%
00-04: -8%
Non-IT Industry Sectors
Annual Growth Rate
95-00: 4%
00-04: -7%
841,000
1,043,000
860,000
4% -5%
Total =
17%
46%
37%
21%
45%
34%
17%
42%
41%
Annual Growth Rate

37
0
20,000
40,000
60,000
80,000
100,000
120,000
140,000
160,000
1990 1991 1992 1993 1994 1995 1996 1997 1998 1999 2000 2001 2002 2003 2004
Figure 23 - Average Annual Employment in Non-IT Industry SectorsSan Jose MSA1990 to 2004
Non-IT Manufacturing
Non-IT Professional Services
ConstructionWholesaleFinance
Admin Support Services
State & Federal Gov’t
Transport, Warehouse, UtilitiesPublishing
Note: San Jose MSA includes Santa Clara and San Benito CountiesSource: California Employment Development Department, Labor Market Information Division
Mngt of Companies
0
10,000
20,000
30,000
40,000
50,000
60,000
70,000
80,000
90,000
100,000
1990 1991 1992 1993 1994 1995 1996 1997 1998 1999 2000 2001 2002 2003 2004
Figure 24 - Average Annual Employment in Local Service SectorsSan Jose MSA1990 to 2004
Retail
Food Service
Local Gov’t
Education
Arts, Entertainment
Accommodation(Hotels)
Health
Note: San Jose MSA includes Santa Clara and San Benito Counties.Source: California Employment Development Department, Labor Market Information Division
Other Services

38
Despite these employment changes, Silicon Valley remains more concentrated in manufacturingand business services than the rest of the Bay Area, California and the nation. Fully 20 percent ofSilicon Valley employment is in manufacturing, approximately twice the share of the Bay Areaas a whole and the state. Professional, scientific and technical services constitute another SiliconValley strength, with approximately 11 percent of total employment in this industry. The balanceof Silicon Valley employment is spread broadly over many industries, as is typical of a large,diverse economy. Local services such as retail trade, local government and health care aretypically large sectors in diverse metropolitan areas and this is true in Silicon Valley as well.
NOTE: Excludes Farming, Natural Resources, and Mining. Bay Area includes Oakland MSA, Napa MSA, San Francisco MSA, San Jose MSA,Santa Rosa MSA, Vallejo MSA (9 counties).SOURCE: US Bureau of Labor Statistics Current Employment Statistics program
2%
1%
1%
1%
1%
2%
3%
3%
4%
4%
4%
6%
6%
8%
9%
10%
20%
11%
5%
Financial Activities
Prof, Scientific, Tech Services
Food Service
Retail TradeLocal Government
Admin Support, Building ServicesHealth Care and Social Assistance
State Government
Other Services
Information (Publishing, Internet, Comm.)
Accommodation (Hotels)
Transportation, Warehousing, Utilities
Construction
Federal Government
Figure 25 - Share of Total Employment by IndustryAnnual Average, 2004
San Jose MSA
Higher share ofemployment vs
Bay Area
11%
9%
10%
10%
9%
6%
7%
6%
7%
4%
4%
2%
4%
2%
3%
2%
2%
3%
1%
Management of Companies
Manufacturing
Wholesale Trade
Educational Services
Arts and Entertainment
Bay Area
39
Occupational Structure
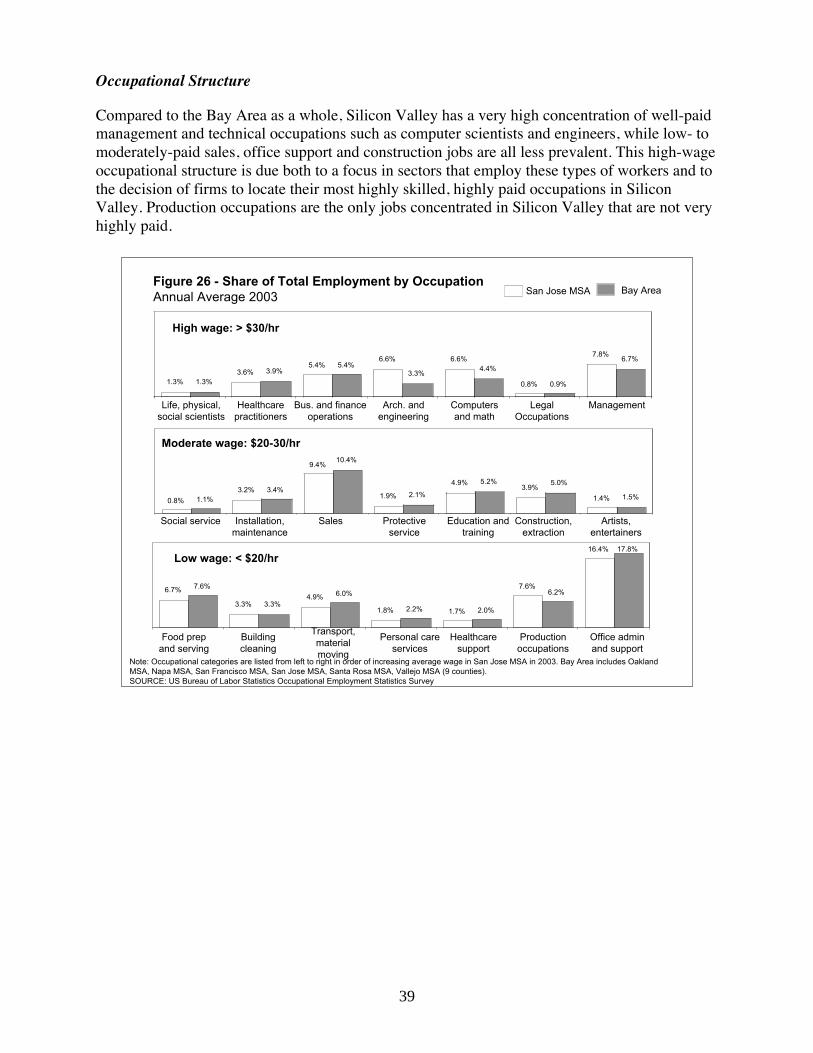
Compared to the Bay Area as a whole, Silicon Valley has a very high concentration of well-paidmanagement and technical occupations such as computer scientists and engineers, while low- tomoderately-paid sales, office support and construction jobs are all less prevalent. This high-wageoccupational structure is due both to a focus in sectors that employ these types of workers and tothe decision of firms to locate their most highly skilled, highly paid occupations in SiliconValley. Production occupations are the only jobs concentrated in Silicon Valley that are not veryhighly paid.
Figure 26 - Share of Total Employment by OccupationAnnual Average 2003
Note: Occupational categories are listed from left to right in order of increasing average wage in San Jose MSA in 2003. Bay Area includes OaklandMSA, Napa MSA, San Francisco MSA, San Jose MSA, Santa Rosa MSA, Vallejo MSA (9 counties).SOURCE: US Bureau of Labor Statistics Occupational Employment Statistics Survey
Office adminand support
Personal careservices
Transport,materialmoving
Productionoccupations
Healthcaresupport
Buildingcleaning
Food prepand serving
17.8%
6.2%
2.0%2.2%
6.0%3.3%
7.6%
16.4%
7.6%
1.7%1.8%
4.9%3.3%
6.7%
Low wage: < $20/hr
1.5%
5.0%5.2%
2.1%
10.4%
3.4%1.1% 1.4%
3.9%4.9%
1.9%
9.4%
3.2%0.8%
Artists,entertainers
Education andtraining
Construction,extraction
Protectiveservice
Installation,maintenance
Social service Sales
6.7%
0.9%
4.4%3.3%5.4%
3.9%1.3%
7.8%
0.8%
6.6%6.6%5.4%
3.6%1.3%
LegalOccupations
ManagementComputersand math
Arch. andengineering
Healthcarepractitioners
Bus. and financeoperations
Life, physical,social scientists
Moderate wage: $20-30/hr
High wage: > $30/hr
San Jose MSA Bay Area

40
The recent downturn has made predictions about future occupational growth difficult; however,healthcare, healthcare support and social service jobs look positive on several measures.Production-related jobs will continue to decline. The majority of professional and office jobs areexpected to grow but have experienced larger-than-average losses in recent years, so theimmediate outlook for these positions is less clear. Many of the occupations with a positive ormixed outlook require at least a bachelor’s degree.
Notes: Actual Occupation Change is for San Jose MSA. Projected Change is for Santa Clara County for the years 2001 to 2008 released in December 2003. Total occupational employment in San Jose MSA in 2003 was 854,720. Source: US Bureau of Labor Statistics and California Employment Development Department
-10.1%-7.9%
-3.5%-3.5%
-9.6%
-8.2%
-9.4%-6.9%
-5.2%
-0.4%
4.2%-1.2%
2.2%
-2.0%0.3%
-0.6%
Figure 27 - Actual and Projected Job Growth by Occupation San Jose MSA and Santa Clara County
Actual Annual % Change
2000 to 2003
1.0%1.1%0.9%
0.2%
-0.2%0.7%
-0.6%0.7%
1.1%3.8%
2.5%0.9%
1.4%
1.6%2.4%2.3%
1.3%1.4%
1.0%2.0%
1.8%
Legal Occupations (0.8%)Management (7.8%)
Computers and math (6.6%)
Arch. and engineering (6.6%)
Healthcare practitioners (3.6%)Bus. and finance operations (5.4%)
Life, phys., soc. scientists (1.3%)
Artists, entertainers (1.4%)Education and training (4.9%)
Construction, extraction (3.9%)Protective service (1.9%)
Installation, maintenance (3.2%)
Social service (0.8%)
Sales (9.4%)Office admin and support 16.4%)
Personal care services (1.8%)
Transport, material moving (4.9%)Production occupations (7.6%)
Healthcare support (1.7%)
Building cleaning (3.3%)Food prep and serving (6.7%)
Projected Annual % Change, 2001 to 2008
Positive Outlook
Mixed Outlook
Negative Outlook -20.6%
-15.1%-17.2%
-11.8%
Indicates > 50% of jobs require at least a Bachelor’s degree
6.8%
Occupational Group(Share of Total Employment)

41
A recent study by management consulting firm A.T. Kearney assessed the alignment of manyoccupations with the Bay Area region’s competitive strengths. The Bay Area is unique in itsability to foster entrepreneurship, enable advanced technology and interdisciplinary research,facilitate concept and market development and act as global management hub. Demand foroccupations closely related to these strengths—venture capitalists, R&D professionals, andmanagers, for example—should remain strong. However, occupations not aligned with thesestrengths—such as production occupations, office and IT support and entry-level engineers—arevulnerable to offshoring due to lower wage costs in other countries. Mass production, back officeoperations and product and process enhancement are activities companies may more profitablyconduct elsewhere.
Bay Area Strengths Bay Area Weaknesses• Entrepreneurship, New Business Creation
• Research in Advanced Technologies• Cross-Disciplinary Research
• Concept and Market Development• Global Integrated Management
• Mass Production• Back Office Operations
• Product and Process Enhancement
Occupations Aligned with Strengths• Venture capitalists, lawyers and other occupations in the entrepreneurial infrastructure
• IT, biotech and nanotech R&D professionals
• Select computer and software engineers for research and advanced development
• Select engineering including electrical, mechanical and electronics
• Strategic managers in sales and marketing
• Product marketing managers
• Managers of global teams and assets
Vulnerable Occupations• High tech manufacturing and assembly
• Office support (e.g., data entry clerks, etc.)
• Business and financial support (e.g., processing staff)
• IT support specialists and administrators
• Legal assistants
• Statistical analysts
• Entry-level computer and software engineers
• Quality assurance and test, product and process engineers
Figure 28 - Bay Area Strengths and Weaknesses and Implications for Occupational Growth
SOURCE: AT Kearney “The Future of Bay Area Jobs: The Impact of Offshoring and Other Key Trends,” sponsored by the Bay Area Economic Forum, Joint Venture:Silicon Valley Network, and SPRIE.

42
With a few exceptions, wage gains have been most significant for the most highly paid, highlyskilled jobs in Silicon Valley. Business and finance professionals, architects and engineers, andcomputer scientists all experienced above average wage growth from 2000 to 2003. Due to anincreased demand for private security services, protective service workers—i.e., securityguards—experienced rapid wage gains from a relatively low level. The well-known shortage ofhealth care professionals such as nurses and medical technicians has driven up wages in thesefields as well.
Figure 29 - Wage Levels and Growth by OccupationSan Jose MSA
SOURCE: US Bureau of Labor Statistics Occupational Employment Statistics Survey
0%
2%
4%
6%
8%
10%
12%
$0 $10 $20 $30 $40 $50 $60
Legal Occupations
ManagementComputers and math
Arch. and engineering
Healthcare practitioners
Bus. and finance operations
Life, physical, social scientistsArtists, entertainers
Education and training
Construction, extraction
Protective service
Installation, maintenance
Social service
Sales
Office admin and support
Personal care services
Transport, material moving
Production occupations
Healthcare support
Building cleaning
Food prep
Median Hourly Wage, 2003
Ann
ual %
Wag
e C
hang
e20
00 to
200
3
43
Implications for Foothill-De Anza: The Shift in the Jobs-Based Economy
The Silicon Valley economy has undergone significant structural changes over the past severaldecades; most significant has been the shift from manufacturing to service industries. The “boomand bust” of the past decade has accelerated this transition. Knowledge-based industries such asinformation technology services, data and professional business services have fueled much ofthis transition and should continue to be the significant driving industries in Silicon Valley in thefuture. While not experiencing such explosive growth, local community-serving industries suchas health care and education have also expanded steadily, even as the pace of population growthslowed with the downturn. These changes have left Silicon Valley with a relatively highconcentration of highly skilled and highly paid jobs.
As knowledge-intensive industries and occupations continue to expand and dominate the jobopportunities available to Silicon Valley workers, area colleges must continue to provide accessto and ensure success in programs that develop the skills needed by these jobs.
44
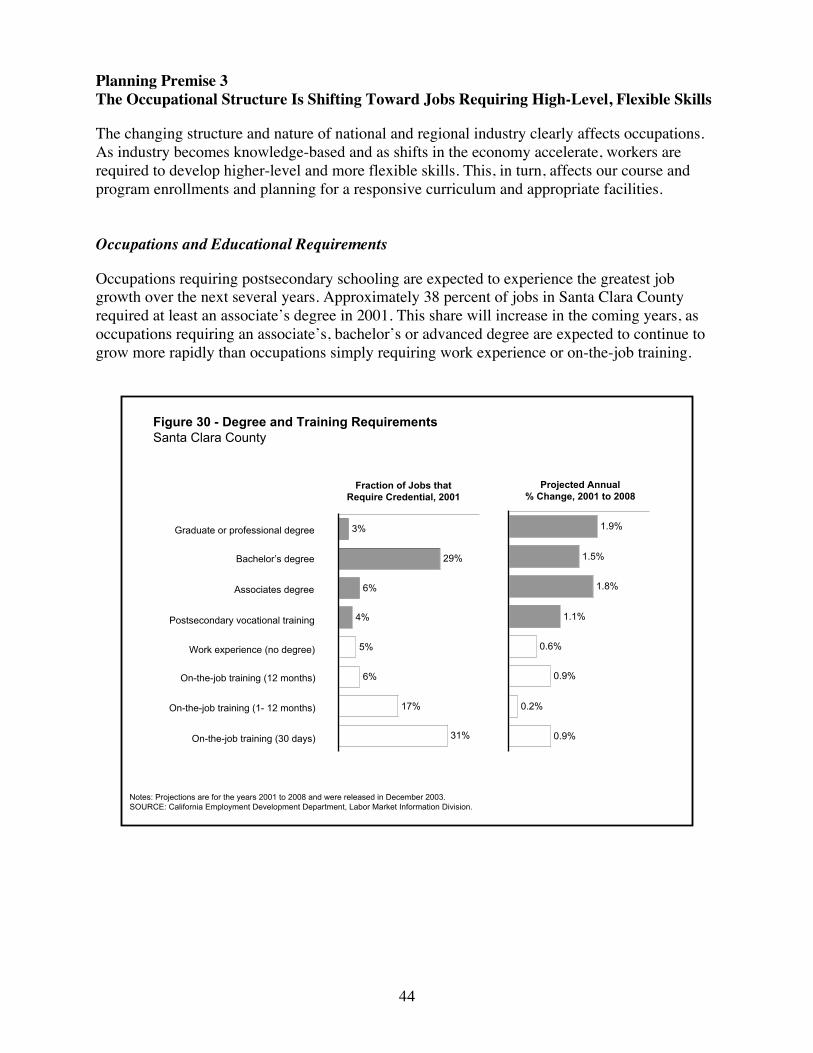
Planning Premise 3The Occupational Structure Is Shifting Toward Jobs Requiring High-Level, Flexible Skills
The changing structure and nature of national and regional industry clearly affects occupations.As industry becomes knowledge-based and as shifts in the economy accelerate, workers arerequired to develop higher-level and more flexible skills. This, in turn, affects our course andprogram enrollments and planning for a responsive curriculum and appropriate facilities.
Occupations and Educational Requirements
Occupations requiring postsecondary schooling are expected to experience the greatest jobgrowth over the next several years. Approximately 38 percent of jobs in Santa Clara Countyrequired at least an associate’s degree in 2001. This share will increase in the coming years, asoccupations requiring an associate’s, bachelor’s or advanced degree are expected to continue togrow more rapidly than occupations simply requiring work experience or on-the-job training.
Graduate or professional degree
Bachelor’s degree
Associates degree
Postsecondary vocational training
Work experience (no degree)
On-the-job training (1- 12 months)
On-the-job training (12 months)
On-the-job training (30 days)
Figure 30 - Degree and Training RequirementsSanta Clara County
Notes: Projections are for the years 2001 to 2008 and were released in December 2003.SOURCE: California Employment Development Department, Labor Market Information Division.
Fraction of Jobs thatRequire Credential, 2001
3%
29%
6%
4%
5%
6%
17%
31%
1.9%
1.5%
1.8%
1.1%
0.6%
0.9%
0.2%
0.9%
Projected Annual% Change, 2001 to 2008

45
Silicon Valley has a higher concentration of jobs requiring high levels of basic mathematics,reading comprehension and critical thinking skills than the rest of the United States, with anadditional nine to 10 percentage points of Santa Clara employment is in occupations that require60 or greater on the O*NET scale of basic math, reading, and critical thinking skills. (TheO*NET system, developed by the U.S. Department of Labor, has detailed information on theskill requirements and characteristics for more than 950 occupations.) Skill levels assigned toeach occupation reflect the abilities needed to perform the specific tasks of the occupation. Forinstance, paralegals and legal assistant jobs require above-average reading (level 63), writing(62), and speaking (61) skills. This level of reading comprehension is well above that needed toread step-by-step instructions for completing a form (low O*NET reading skill level), slightlyabove that needed to read a memo from management describing new personnel policies (averageO*NET level), but below that needed to read a scientific journal article describing surgicalprocedures (highest O*NET level). Similarly, paralegals must possess speaking skills slightlymore advanced than those needed to interview applicants to obtain personal and work history(average O*NET speaking skill level), but not as advanced as those needed to argue a legal casebefore the Supreme Court (highest speaking skill level). [Fig. 31]
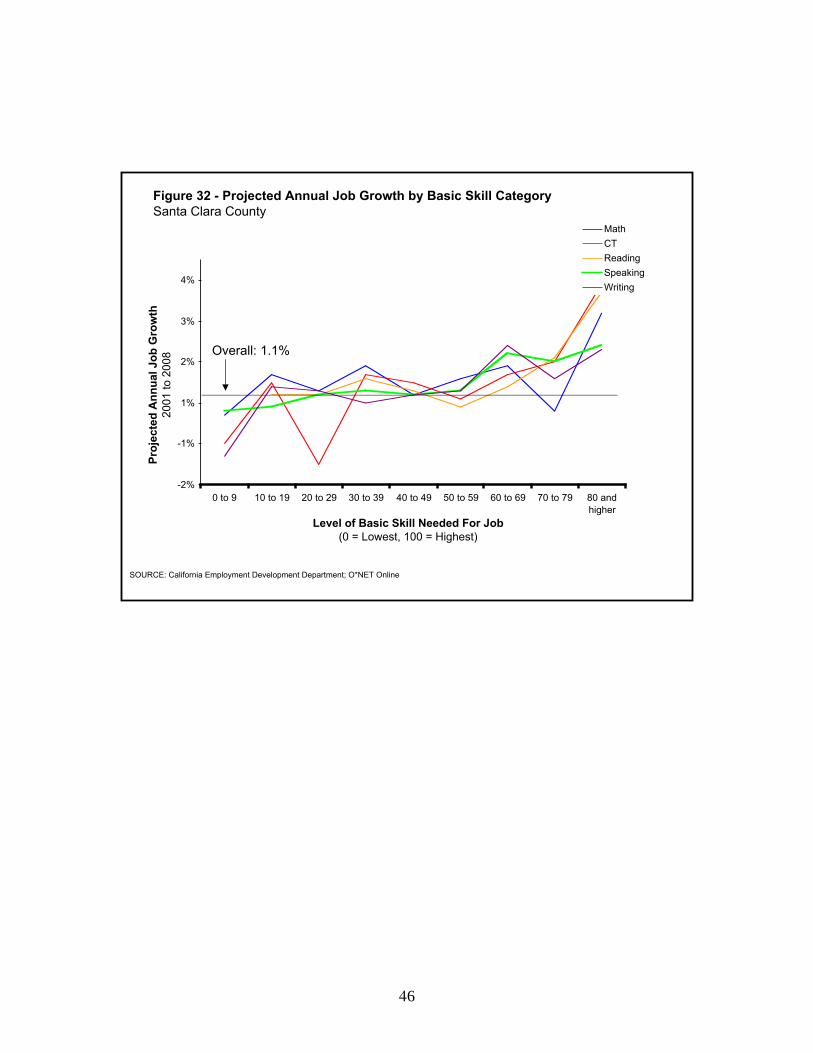
Predictably, job growth is expected to be greatest in occupations requiring high levels of basicmath, reading, critical thinking, speaking and writing skills. [Fig. 32]
10 to 19
0 to 9
20 to 29
30 to 39
50 to 59
40 to 49
60 to 69
70 to 79
80 or higher
1%
13%
4%
7%
17%
25%
22%
9%
2%
1%
11%
4%
5%
15%
23%
26%
10%
6%
Figure 31 - Share of Total Employment by Basic Skill LevelAnnual Average 2003
Note: Approximately 13% and 8% of employment in San Jose and the U.S., respectively, is not categorized into a specific occupation or skill level andwas excluded from this analysis.SOURCE: US Bureau of Labor Statistics Occupational Employment Statistics Survey; O*NET Online
San Jose MSA US
Mathematics
0%
5%
6%
11%
16%
26%
23%
10%
4%
0%
4%
4%
7%
15%
23%
25%
14%
8%
1%
7%
11%
23%
26%
19%
10%
3%
1%
0%
6%
8%
18%
26%
19%
14%
5%
4%
Reading Comprehension Critical Thinking
Leve
l of B
asic
Ski
ll N
eede
d Fo
r Job
(0 =
Low
est,
100
= H
ighe
st)
46
Figure 32 - Projected Annual Job Growth by Basic Skill CategorySanta Clara County
SOURCE: California Employment Development Department; O*NET Online
-2%
-1%
1%
2%
3%
4%
0 to 9 10 to 19 20 to 29 30 to 39 40 to 49 50 to 59 60 to 69 70 to 79 80 andhigher
MathCTReadingSpeakingWriting
Level of Basic Skill Needed For Job(0 = Lowest, 100 = Highest)
Proj
ecte
d A
nnua
l Job
Gro
wth
2001
to 2
008 Overall: 1.1%

47
Rapid Firm and Job Transition
There is a high level of transition, or “churn,” among Silicon Valley firms, with firm openingsactually outpacing firm closings since 2000. According to Joint Venture: Silicon ValleyNetwork, approximately 46 percent of all Silicon Valley firms were started from 1998 to 2002,accounting for 30 percent of total employment.
SOURCE: Joint Venture: Silicon Valley Network, 2005 Index of Silicon Valley
Figure 33 – Churn of Firms in Silicon Valley
-20,000
-15,000
-10,000
-5,000
0
5,000
10,000
15,000
20,000
25,000
30,000
Num
ber o
f Firm
s
Firm Openings/Moving In Firm Closures/Moving Out Net Firm Churn
19911990 1992 1993 1994 1995 1996 1997 1998 1999 2000 2001 2002

48
As shown in Figure 34, workers are also very likely to change industries when they are separatedfrom their jobs. Of the one million workers in California technology industries in 2000, less thanhalf were still in the technology industry by 2003. The remainder switched to non-tech industriesor dropped or moved from the California labor force altogether. This high frequency of industrytransition is not confined to economic downturns; only 41 percent of the state’s technologyworkforce in 2000 had worked in a California technology industry in 1995. Technology workerswho switched to non-tech industries experienced greater wage losses than those who remained intheir original high-tech industry [Fig. 35].
SOURCE: Dardia, Michael, Tracey Grose, Hugh Roghmann, Peggy O’Brien-Strain, “The High-Tech Downturn in Silicon Valley: What Happened to All Those Skilled Workers?” The Sphere Institute Final Report April 19, 2005.
2000 CaliforniaHigh Tech Workforce
• Semiconductors• Computer Hardware
• Electronic Components• Biomedical• Software
• Internet Publishing• Computer Services
• Engineering and Scientific Services
No CAWages
In High Tech Industry
In Non-Tech Industry
Employment Status in 1995
Employment Status in 2003
32%
26%
41% 49%
23%
28%
No CAWages
In High Tech Industry
In Non-Tech Industry
Figure 34 - Industry Changes of California High-Tech Workforce1995 to 2003
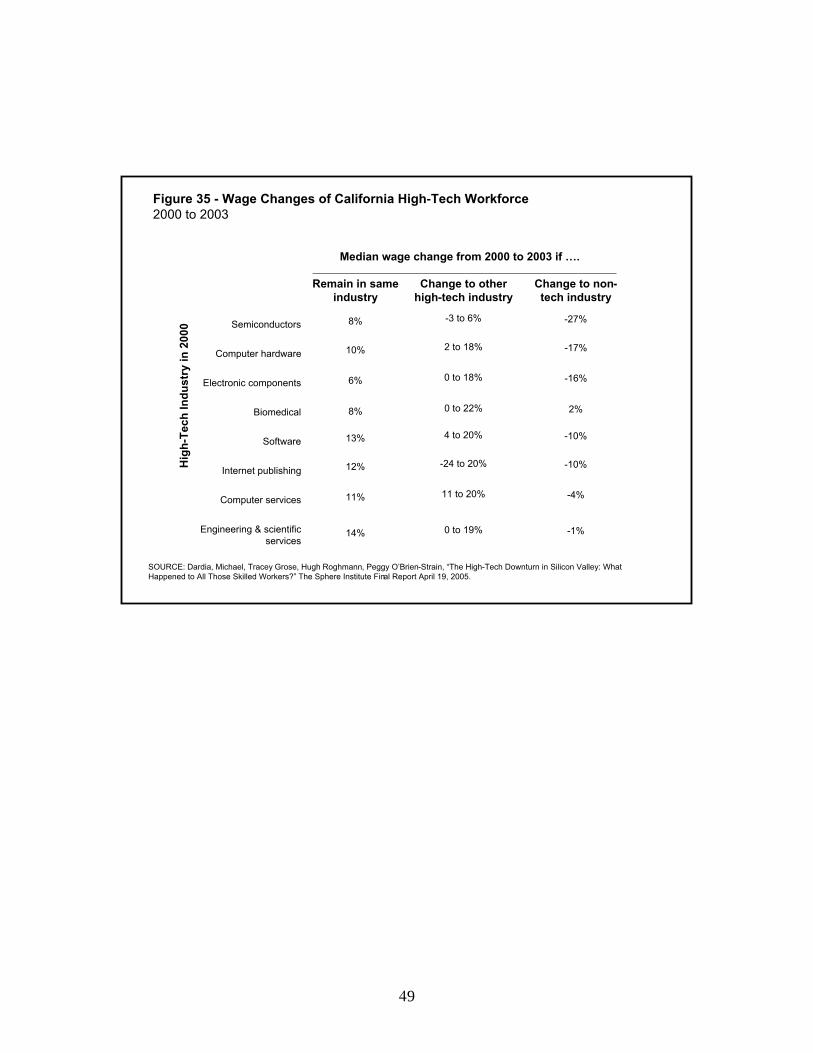
49
Engineering & scientific services
Computer services
Internet publishing
Biomedical
Software
Electronic components
Computer hardware
Semiconductors
Remain in same industry
Change to other high-tech industry
Change to non-tech industry
14%
11%
12%
8%
13%
6%
10%
8%
Median wage change from 2000 to 2003 if ….
0 to 19%
11 to 20%
-24 to 20%
0 to 22%
4 to 20%
0 to 18%
2 to 18%
-3 to 6%
-1%
-4%
-10%
2%
-10%
-16%
-17%
-27%
Hig
h-Te
ch In
dust
ry in
200
0
SOURCE: Dardia, Michael, Tracey Grose, Hugh Roghmann, Peggy O’Brien-Strain, “The High-Tech Downturn in Silicon Valley: What Happened to All Those Skilled Workers?” The Sphere Institute Final Report April 19, 2005.
Figure 35 - Wage Changes of California High-Tech Workforce2000 to 2003
50
Implications for Foothill-De Anza: The Shifting Occupational Structure
Planning Premise 3 makes clear that people with high-level, flexible skills will be critical toSilicon Valley’s future success. While the immediate short-term outlook for specific occupationsis difficult to determine, it is evident that the shift towards jobs requiring postsecondaryschooling and high levels of basic skills will continue. The occupations best aligned with SiliconValley’s economic strengths are knowledge-intensive. Routine production, process, and supportjobs have been declining. The pace of individual- and firm-level transition underlying theseaggregate shifts is even more pronounced. Companies are created and die off at a feverish rate,and workers shift jobs and industries often in Silicon Valley.
Current and projected economic trends have several implications for the role of postsecondaryeducation. First, knowledge-intensive industries and occupations will continue to dominate thejob opportunities available to Silicon Valley workers; therefore, clearly, area postsecondaryinstitutions must continue to provide access to the skills needed by these jobs. Second, these jobswill increasingly require both high levels of basic skills and formal postsecondary credentials.Basic skill proficiency, whether obtained during high school or afterward, is required of almostall workers in Silicon Valley. Lastly, fuctuating occupational demand, the frequency of firmturnover and job changes, and the importance of basic skills all underscore the importance ofworker and institutional flexibility. Workers must possess transferable skills and the ability tolearn new jobs quickly. Educational institutions and training providers must both equip workerswith this flexibility and respond to changing demand by adjusting curriculum.

51
Planning Premise 4Other Postsecondary Education and Training Providers Form a Context for Competitionand Collaboration
Foothill-De Anza is not alone in meeting the postsecondary educational and training needs ofSilicon Valley residents. The many other colleges and training providers serving the regionrepresent not only competition and but also opportunities for cooperation and collaboration inmeeting these needs successfully and efficiently.
Other Postsecondary Education and Training Providers
There are more than 100 colleges and training providers in the immediate vicinity of the district,with two-thirds of these training providers in the cities of San Jose and Santa Clara. The 23colleges in this group serve almost 300,000 residents every fall. In the Bay Area, theFoothill-De Anza Community College District serves the second-highest number of students,behind only City College of San Francisco.
4
2
1
1
5
3
6
5
19
2
9
Campbell
Cupertino
Gilroy
Los Altos
Milpitas
Morgan Hill
Mountain View
Palo Alto
San Jose
Santa Clara
Saratoga
Sunnyvale
Figure 36 - Other Local Postsecondary Education and Training Providers2003-2004
SOURCE: Chancellor’s Office, California Community Colleges. NOVA 2003 Training Directory Santa Clara County
Number of Unduplicated Students, by Bay Area Community College DistrictFall 2004
Number of Colleges and Training Providers by CitySanta Clara County, 2003
55
14,382
22,462
38,059
41,462
5,079
8,160
9,628
29,309
20,984
25,591
22,599
61,737
Cabrillo (1 college)
Chabot (2 colleges)
Contra Costa (3 colleges)
Foothill-De Anza (2 colleges)
Gavilan (1 college)
Marin (1 college)
Ohlone (1 college)
Peralta (4 colleges)
San Francisco (1 college)
San Jose/Evergreen (2 colleges)
San Mateo (3 colleges)
West Valley-Mission (2 colleges)

52
The course offerings at Foothill-De Anza are very similar to those offered at other Bay Areacommunity colleges, with social sciences, humanities, interdisciplinary studies and education(including special, physical and health education) accounting for almost half of all full-timeequivalent students (FTES) in fall 2003. Foothill-De Anza offers more instruction in computerscience and health and slightly less in consumer education, interdisciplinary studies and businessthan other colleges.
NOTES: Other Silicon Valley colleges include all colleges in the Gavilan, San Jose/Evergreen, San Mateo, and West Valley-Mission CommunityCollege Districts. All programs with fewer than 1% of FTES for both FH-DA and the rest of the Silicon Valley are omitted from chart but included inthe total. Both credit and non-credit courses are included.SOURCE: Chancellor’s Office, California Community Colleges
2%
2%
1%
2%
3%
3%
4%
4%
4%
6%
8%
8%
10%
11%
13%
13%
4%
Social Science
Humanities
Interdisciplinary Studies
Education (incl PE, Spec Ed)
Arts
Mathematics
Business
Computer Science
Health
Physical Sciences
Biological Science
Psychology
Foreign Language
Engineering, Indust Tech
Consumer Education
Communications
Public & Protective Srvs
Figure 37 - Full-Time Equivalent Students by TOP Subject CodeFall 2004
Foothill-De Anza CCD
5%
1%
3%
3%
3%
3%
4%
4%
2%
8%
9%
7%
9%
13%
11%
13%
2%
Social Science
Humanities
Interdisciplinary Studies
Education (incl PE, Spec Ed)
Arts
Mathematics
Business
Computer Science
Health
Physical Sciences
Biological Science
Psychology
Foreign Language
Engineering, Indust Tech
Consumer Education
Communications
Public & Protective Srvs
Other Silicon Valley Colleges

53
The awards granted by Foothill-De Anza are less similar to surrounding colleges than courseenrollment patterns would suggest, however. Foothill-De Anza grants far more health, computerscience, social science and agriculture degrees and fewer business, consumer education,engineering and public and protective services degrees than other nearby colleges. The districtalso grants relatively more engineering, business, computer science and communicationscertificates and relatively fewer health, consumer education, and public and protective servicescertificates. The awards offered by Foothill-De Anza generally reflect the relative needs of theSilicon Valley economy.
NOTES: Other Silicon Valley colleges include all colleges in theGavilan, San Jose/Evergreen, San Mateo, and West Valley-Mission Community College Districts. All programs with fewer than 1% of awards for both FH-DA and the rest of the Bay Area are omitted from chart but included in the total. SOURCE: Chancellor’s Office, California Community Colleges
14%
2%
1%
2%
0%
5%
4%
1%
1%
1%
3%
5%0%
1%
1%
1%
1%
2%
3%
3%
5%
5%
8%
11%
3%
6%
Interdisciplinary Studies
Health
Business
Computer Science
Social Science
Arts
Agriculture
Engineering, Indust Tech
Humanities
Psychology
Biological Science
Law
Consumer Education
Public & Protective Srvs
Figure 38 - Awards Granted by TOP Subject Codes2003-2004
AA/AS Degrees Awarded Certificates Awarded
1%
0%
22%
14%
5%
16%
18%
1%
3%
2%
0%
2%
0%
0%
10%
1%
1%
2%
18%
11%
11%
5%
4%
3%
2%
2%
2%
1%
1%
1%
5%
Engineering, Indust Tech
Business
Computer Science
Health
Humanities
Consumer Education
Communications
Law
Arts
Social Science
Commercial Services
Education (incl PE, Spec Ed)
Biological Science
Public & Protective Srvs
Foreign Language
Agriculture
Other Silicon Valley Colleges
Foothill-De Anza
36%53%51%

54
Online Education Expands
The development and expansion of online learning opportunities continues to grow significantlyeach year. Enrollment will increasingly be drawn from part-time and nontraditional studentsbeyond the traditional 18-to-24-year-olds.
Figure 39 – Distance Learning Enrollments at Foothill-De Anza CCD1996-97 to 2003-04
SOURCE: FHDA Institutional Research & Planning, Access Database,Enrollment Table
0
2,000
4,000
6,000
8,000
10,000
12,000
14,000
16,000
18,000
1996-97 1997-98 1998-99 1999-00 2000-01 2001-02 2002-03 2003-04
De Anza Foothill

55
Implications for Foothill-De Anza: Collaboration and Competition
As stated in Planning Premise 3, collaboration and competition will continue among educationalinstitutions in Silicon Valley. Foothill-De Anza is one among many postsecondary educationaland training providers serving Silicon Valley residents. The 23 area colleges serve almost300,000 residents every fall while more than 75 training providers serve thousands more.Two-thirds of these training providers are located in the cities of San Jose and Santa Clara. Asmost area community colleges serve a region beyond their district boundaries, it is not surprisingthat course offerings are similar to those offered by other Bay Area community colleges. Socialsciences, humanities, interdisciplinary studies and special, physical and health educationaccounted for almost half of all course enrollments. The degrees granted by Foothill-De Anzareflect the relative needs of Silicon Valley. The development and expansion of online learningopportunities continues to grow significantly each year, both through our colleges and those ofthe other Bay Area colleges. As workers increasingly require training to remain current and toprepare for new jobs or careers, and as their time is limited by work and family responsibilities,they will continue to take advantage of online learning opportunities.
The many other colleges and training providers serving the region represent not only competitionfor Foothill-De Anza, but also opportunities for cooperation and collaboration in meeting theeducational needs of area residents and workers successfully and efficiently. Collaborativeefforts will be necessary to address diverse and changing job and occupational skill andknowledge requirements, especially cases in which programs are very expensive, such as nursingand other allied health fields. Partnerships will increase as community colleges look foropportunities to leverage their resources with other public and private sector providers.
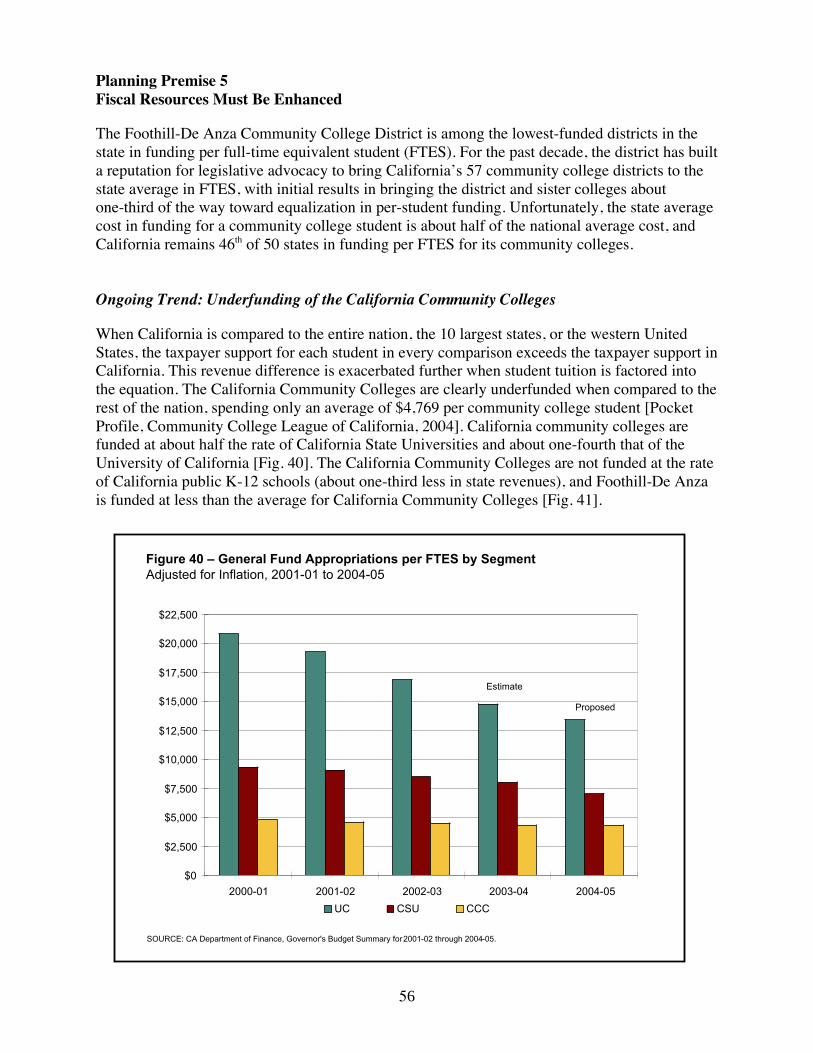
56
Planning Premise 5Fiscal Resources Must Be Enhanced
The Foothill-De Anza Community College District is among the lowest-funded districts in thestate in funding per full-time equivalent student (FTES). For the past decade, the district has builta reputation for legislative advocacy to bring California’s 57 community college districts to thestate average in FTES, with initial results in bringing the district and sister colleges aboutone-third of the way toward equalization in per-student funding. Unfortunately, the state averagecost in funding for a community college student is about half of the national average cost, andCalifornia remains 46th of 50 states in funding per FTES for its community colleges.
Ongoing Trend: Underfunding of the California Community Colleges
When California is compared to the entire nation, the 10 largest states, or the western UnitedStates, the taxpayer support for each student in every comparison exceeds the taxpayer support inCalifornia. This revenue difference is exacerbated further when student tuition is factored intothe equation. The California Community Colleges are clearly underfunded when compared to therest of the nation, spending only an average of $4,769 per community college student [PocketProfile, Community College League of California, 2004]. California community colleges arefunded at about half the rate of California State Universities and about one-fourth that of theUniversity of California [Fig. 40]. The California Community Colleges are not funded at the rateof California public K-12 schools (about one-third less in state revenues), and Foothill-De Anzais funded at less than the average for California Community Colleges [Fig. 41].
Figure 40 – General Fund Appropriations per FTES by SegmentAdjusted for Inflation, 2001-01 to 2004-05
SOURCE: CA Department of Finance, Governor's Budget Summary for 2001-02 through 2004-05.
$0
$2,500
$5,000
$7,500
$10,000
$12,500
$15,000
$17,500
$20,000
$22,500
2000-01 2001-02 2002-03 2003-04 2004-05UC CSU CCC
Estimate
Proposed

57
Implications for Foothill-De Anza: The Need for Increased Revenue
As shown in the charts associated with Planning Premise 5, California’s community colleges arechronically underfunded, and the effects of this funding inadequacy have been compounded overtime. Economic trends, notably skyrocketing health care costs as well as increasing retirementcontribution costs, further intensify the problem. In order to increase state funding,Foothill-De Anza, together with the Community College League of California and the systemoffice of California Community Colleges, must advocate legislatively for structural changes incommunity college funding. The emerging reality in public education is that fundraising must bemaximized in order to fill gaps in state funding. As noted in the previous section, we mustenhance and increase partnerships with other educational institutions as well as businesses, andfurther develop and encourage the infrastructure to pursue, support and monitor partnerships.Other internal efforts must include continued high productivity and expansion of enterpriseprograms that are self-supporting and return net income to the colleges, as well as expense-sidesuch as workflow efficiencies and energy and space management.
Another crucial element for Foothill-De Anza may be the pursuit of a future bond measure orparcel tax. Given the chronic underfunding of public education in California, these alternative
Figure 41 – Revenues per Full-Time Equivalent Student2003-04
SOURCE: CCLC Pocket Profile 2004 and FHDA Office of Business Services
$20,799
$10,734
$6,788
$4,769$4,019
$0
$2,000
$4,000
$6,000
$8,000
$10,000
$12,000
$14,000
$16,000
$18,000
$20,000
$22,000
UC CSU K-12 All CCCs Foothill- De Anza
UC CSU K-12 All CCCsFoothill-De Anza

58
revenue measures are being pursued with increasing frequency by K-12 and community collegedistricts across the state. While Measure E provided funding for facilities construction andrenovation, equipment for the new buildings, technology infrastructure and additional facilitiesremain outstanding needs.
59
Planning Premise 6We Must Respond to Overall State and National Trends Affecting the CaliforniaCommunity Colleges
Like most public entities, Foothill-De Anza must respond and react to opportunities andchallenges resulting from state and national. Community colleges have long been known as the“economic engine” of American. As a result, economic, social and political pressures bear uponthe work of Foothill-De Anza as it educates an increasingly diverse student body for transfer andcareer preparation, in addition to the lifelong learning that will be vital for Silicon Valleyresidents over the next decade.
Enrollment Demand for Higher Education Expected Over the Next Decade
Tidal Wave II, the influx of 450,000 additional college-aged students, will confront California’shigher education institutions in the next 10 years, particularly in Southern and Central California.It is expected that 400,000 of these new students will seek enrollment in community colleges.This does not include the additional 350,000 to 400,000 people who may not have completedhigh school and have minimal job skills. In order for these individuals to prosper, they will needto enter postsecondary education, most likely through the community colleges. Silicon Valley isexpected to grow between one and two percent annually over the decade. Accordingly,Foothill-De Anza will need to base its future educational and facilities needs by expanding itscapacity to serve at least a 10 percent increase in the student population over the next decade.
Retraining for New Careers and Skills Upgrades Will Be Essential for Residents
Between 2000 and 2005, industry need for IT workers dropped by half as manufacturing andsoftware production companies moved out of state or lost revenues due to the dot-com bust. TheValley lost 200,000 of its 400,000 jobs during this period; however, during this same time,start-up enterprises in bio-, info- and nano-technologies grew quickly. In 2005, SanFrancisco—with stiff competition from San Diego and several other cities—became home to theInstitute for Regenerative Medicine, California’s biotech gateway to stem-cell research, winning$3 billion in investment funds, including Proposition 71 bond funds. As The New York Timesreported on July 3, 2005, in “Profits, Not Jobs, Rebound in Silicon Valley”:
Changes in technology and business strategy are raising fundamental questionsabout the future of the valley, the nation's high technology heartland. In part, thechange is driven by the very automation that Silicon Valley has largely madepossible, allowing companies to create more value with fewer workers…Someeconomists are wondering if a larger transformation is at work—accelerating atrend in which the region's big employers keep a brain trust of creative peopleand engineers here but hire workers for lower-level tasks elsewhere.
With the rapidly aging population and six new or expanding area hospitals, jobs in allied healthfields abound. At the same time, industry analysts predict that Californians will likely change jobsfive to 10 times over their working lives. Given these trends, Foothill-De Anza should expand itscourse offerings and facilities to meet anticipated demand and promote the necessity ofpostsecondary education for residents who will need to retrain for second, third or fourth careers,or upgrade their skills in order to remain competitive.

60
Educational Achievement Gaps Persist
Our continued attention must be directed to persistent achievement gaps in postsecondarypreparation, as well as English language instruction, curriculum specifically addressing workers’needs for transferable skills and curriculum for older Silicon Valley residents.
CSU Remediation Education Goals Affect Community Colleges
The California State University Trustees and Chancellor have called for an end to all remediationcourses taught in the CSUs by the year 2007. For community colleges, this means a majorincrease in students seeking pre-collegiate or developmental level courses in mathematics andEnglish. The colleges will need to plan for and seek additional funding and partnershipagreements with San Jose State and California State University East Bay to provide moreremediation courses for CSU-bound students who are not prepared for transfer.
More Accountability Will Be Required
The national and statewide sentiment for all publicly supported institutions to be moreaccountable for their use of taxpayer's monies, especially in terms of student learning outcomes,continues to increase. Recently, for example, the state legislature required the CaliforniaCommunity Colleges system office to propose a new accountability model replacing thePartnership for Excellence model that would focus more directly on student outcomes at thedistrict level. The system of state and national accreditation is under scrutiny by the federalgovernment, which questions the effectiveness of the peer review system that has been in placefor more than a century. Governing boards—both public and private sector—are struggling toaddress the escalating costs of health care, pension fund and retiree medical benefits liabilitiesfor which state and federal agencies may not have the reserves for bail-outs. Finally, asCalifornia legislators find themselves out of office due to term limits, community colleges andtheir university and K-12 counterparts find themselves spending countless hours staving offadditional unfunded mandates approved by the legislature. For example, as this EducationalMaster Plan is being prepared in 2005, community colleges have more than 600 accountabilityreports that are submitted to the state, many of which have no bearing on the effectiveness orefficiency of serving students. Foothill-De Anza must advocate for simpler reportingrequirements and Education Code mandates as well as respond to an increasingly number ofrequirements that impinge upon time that could and should be devoted to the education ofstudents.
Digital Age Increasingly Affecting Our Quality of Life and the Way We Learn
Silicon Valley studies report that more than 90 percent of its residents use the Internet.(However, Foothill-De Anza and its sister colleges and universities must be ever mindful of thedigital divide, since the remaining 10 percent of residents still do not have access to thetechnologies needed for higher education.) The demand for wireless access, computers withaccelerated processing speeds, online courses, programs and services, facilities that allow laptopsto plug in at any time, and faculty and staff who are comfortable with a variety of technologieswill continue to be the predominant expectation of students. The need for critical thinking in theinformation age—“information literacy” skills—are embedded into the curriculum for mostcourses and into our ways of doing the business of educating students. Continuous technologyeducation and training is required, as well as systems that can accommodate learners andemployees from off-site locations. While not a panacea, technology provides useful tools for

61
learning and implementing many of the academic, human resources, and business processes ofthe district, and Foothill-De Anza will need to keep pace with the technology trends that arechanging how we live, work and learn.
Implications for Foothill-De Anza: Trends in California Community Colleges
The issues identified above will cause shifts in the quality and quantity of instructional programsand student services, as well as changes in policies and procedures that govern Foothill-De Anza.Also noted are broad responses—the specifics of which will be guided by this EducationalMaster Plan—grounded in quality, passion for learning, and collaboration as we respond todemographic, social, fiscal and political trends.


63
IV. Advancing the Legacy: Educational Master Plan
Where We’re Headed
The district’s mission emphasizes a dynamic learning environment for a diverse student bodyfocused on excellence, innovation and opportunity. Foothill College and De Anza College haveeach prepared educational master plans that inform the district’s overarching Educational MasterPlan, supported by a network of core central services. In fall 1999, each college developed itsmaster plan through 2005, knowing that the plan would be reviewed and revised by 2005-06 tochart the course of the district for the next decade. From academic years 1999-2000 through2005-06, two significant planning processes took place concurrently at both colleges in order toaddress the colleges’ accreditation requirements. Both Foothill and De Anza completedyear-long accreditation self-studies in 1999 and again in 2005. Both colleges followed the plansoutlined in both their prior accreditation self-studies and educational master plans, incorporatingthe contributions, needs and aspirations of Central Services.
This section includes charts illustrating the alignment of the college and district visions,missions, values, goals and strategies as well as the quality indicators that will measure progresstoward our goals over the next decade. Following the charts are summaries from the EducationalMaster Plan of each college and Central Services’ plans to support the colleges.
Planning informs the process of learning; meanwhile, learning occurs within the process ofplanning. Further, learning results in the need to change plans over time, as we better understandthe needs and challenges of our students, our colleges and the district as a whole. The word“dynamic” in the mission statement was a conscious choice to signify the evolving nature ofstudent learning and our colleges as we respond to the internal and external factors andconditions.
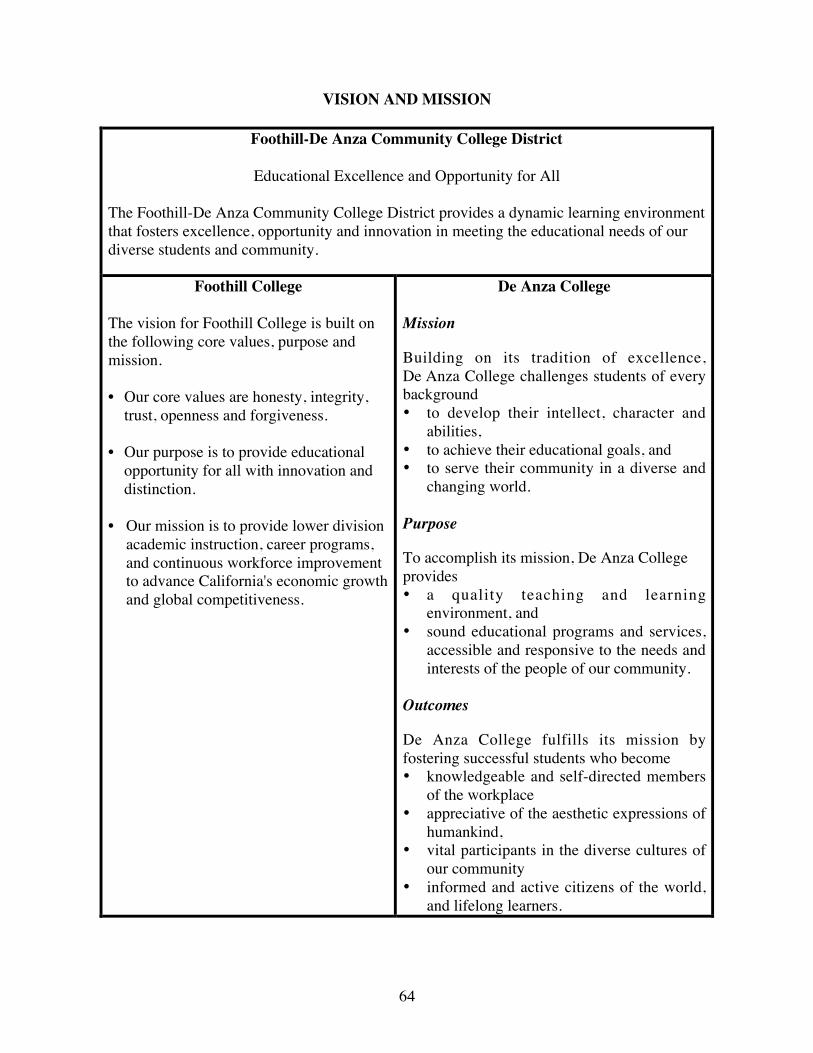
64
VISION AND MISSION
Foothill-De Anza Community College District
Educational Excellence and Opportunity for All
The Foothill-De Anza Community College District provides a dynamic learning environmentthat fosters excellence, opportunity and innovation in meeting the educational needs of ourdiverse students and community.
Foothill College
The vision for Foothill College is built onthe following core values, purpose andmission.
• Our core values are honesty, integrity,trust, openness and forgiveness.
• Our purpose is to provide educationalopportunity for all with innovation anddistinction.
• Our mission is to provide lower divisionacademic instruction, career programs,and continuous workforce improvementto advance California's economic growthand global competitiveness.
De Anza College
Mission
Building on its tradition of excellence,De Anza College challenges students of everybackground• to develop their intellect, character and
abilities,• to achieve their educational goals, and• to serve their community in a diverse and
changing world.
Purpose
To accomplish its mission, De Anza Collegeprovides• a quality teaching and learning
environment, and• sound educational programs and services,
accessible and responsive to the needs andinterests of the people of our community.
Outcomes
De Anza College fulfills its mission byfostering successful students who become• knowledgeable and self-directed members
of the workplace• appreciative of the aesthetic expressions of
humankind,• vital participants in the diverse cultures of
our community• informed and active citizens of the world,
and lifelong learners.

65
CORE VALUES
Foothill-De Anza Community College District
pursuing truth and knowledge recognizing inherent potential in all people fostering informed and responsible citizenship maintaining academic rigor and inquiry developing cultural and global awareness generating creativity and creative expression promoting ethics and ethical behavior promoting environmental sustainability
Foothill-De Anza provides: high quality educational opportunities for all our students an environment that is respectful of human dignity and diversity the resources necessary to realize the vision and mission of the district
Foothill College
Honesty Integrity Trust Openness Forgiveness
De Anza College
Institutional integrity Community Relationships Diversity Quality of student and staff life
learning Access and quality in concert Collegiality Self-assessment and innovation Student success A “Personal Best”

66
GOALS, GUIDING STRATEGIES, AND QUALITY INDICATORS
GOALS
Foothill-De Anza Community College District
Opportunity: Provide greater access for students from diverse backgrounds and cultures seekinghigher education
Quality: Increase student success by maintaining high standards and closing theperformance gaps
Accountability: Ensure fiscal stability, planned growth and the wise and careful use of district’sresources
Sustainability: Preserve the learning environment and enhance the excellence of the district forfuture generations
Foothill College
1. Transfer: Meeting the Challenge2. Degrees and Certificates Awarded3. Student Success: Successful Course
Completion and Beyond4. Basic Skills: Moving from Basic Skills to
College Level5. Workforce Development: Success after
Completion6. Enrollment Stability: Access to Learning
Opportunities7. Fiscal Soundness8. Learning Outcomes
De Anza College
1. Achieve levels of excellence in a climateof learning for a diverse student body
2. Provide effective pathways to learning forevery student
3. Improve student learning, student life, andthe management of resources through theappropriate use of technology
4. Achieve planned growth and maintainfiscal soundness
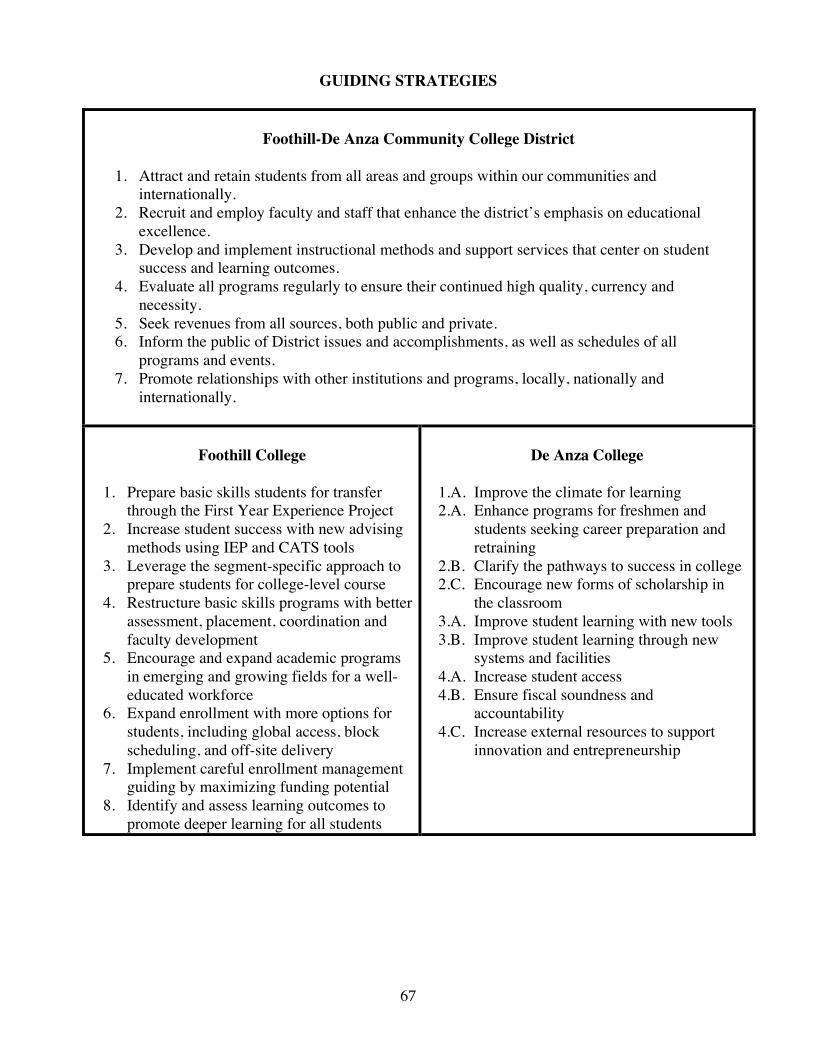
67
GUIDING STRATEGIES
Foothill-De Anza Community College District
1. Attract and retain students from all areas and groups within our communities andinternationally.
2. Recruit and employ faculty and staff that enhance the district’s emphasis on educationalexcellence.
3. Develop and implement instructional methods and support services that center on studentsuccess and learning outcomes.
4. Evaluate all programs regularly to ensure their continued high quality, currency andnecessity.
5. Seek revenues from all sources, both public and private.6. Inform the public of District issues and accomplishments, as well as schedules of all
programs and events.7. Promote relationships with other institutions and programs, locally, nationally and
internationally.
Foothill College
1. Prepare basic skills students for transferthrough the First Year Experience Project
2. Increase student success with new advisingmethods using IEP and CATS tools
3. Leverage the segment-specific approach toprepare students for college-level course
4. Restructure basic skills programs with betterassessment, placement, coordination andfaculty development
5. Encourage and expand academic programsin emerging and growing fields for a well-educated workforce
6. Expand enrollment with more options forstudents, including global access, blockscheduling, and off-site delivery
7. Implement careful enrollment managementguiding by maximizing funding potential
8. Identify and assess learning outcomes topromote deeper learning for all students
De Anza College
1.A. Improve the climate for learning2.A. Enhance programs for freshmen and
students seeking career preparation andretraining
2.B. Clarify the pathways to success in college2.C. Encourage new forms of scholarship in
the classroom3.A. Improve student learning with new tools3.B. Improve student learning through new
systems and facilities4.A. Increase student access4.B. Ensure fiscal soundness and
accountability4.C. Increase external resources to support
innovation and entrepreneurship

68
QUALITY INDICATORS
Measuring Our Improvements in Student Learning and Success
To determine how to improve student learning and success, the district and the colleges havedeveloped a broad array of measures and indicators. Reports on the progress of the previousEducational Master Plan have made extensive use of quality and improvement indicators,sometimes known as critical success factors.
The quality indicators allow us to see how we are doing and measure whether we are becomingincreasingly better at our work of enabling students to learn and succeed. The count of degreesawarded—a volume measure—tells us how many students have completed a degree program,while the percentage of entering cohorts earning degrees tells us whether we have improved ourability to enable students to complete their programs. Thus, volume indicators tell us the numberof students who are succeeding, while rate indicators measure Foothill-De Anza’s performanceas an institution over time.
The rate measures listed below do not, of course, provide a full picture of our performance inimproving student learning and success. These indicators will be combined with measures andresearch developed by the district’s Office of Institutional Research and Planning and faculty andstaff in the departments and disciplines. Local research not only enables us to track ourimprovement in a much more complete way but also provides the necessary data and analysis tohelp us determine what factors and approaches positively affect student learning.

69
Foothill-De Anza Community College DistrictSelected Quality Indicators for Measuring Results
Access and Opportunity
Enrollment distribution by ethnicity, age and sex compared to prior years and to servicearea population
Participation rates by ethnicity, age, sex and service areas
Student Progress and Achievement: Degree/Certificate/Transfer
Number and percentage of entering cohorts earning 15 credit units within three and sixyears of consistent enrollment; earning an AA/AS degree within three and six years; andearning a certificate within three and six years
Number and percentage of entering cohorts transferring to a four-year institution withinthree and six years; achieving “Transfer Directed” status within three and six years (i.e.,having successfully completed both a transfer-level math and English course); andachieving “Transfer Prepared” status within three and six years (i.e., having successfullycompleted 90 quarter units of UC/CSU transferable units with a GPA >= 2.0)
Number and percentage of entering cohorts earning at least 45 quarter units while in theCCC system within three and six years (wage studies show a positive effect with 45 ormore units)
Persistence rate of entering cohorts to the second year
Student Progress and Achievement: Vocational/Occupational/Workforce Development
Annual successful course completion rate vocational courses coded SAM A, SAM B &SAM C
Number and percentage of AA/AS/certificate completers reporting employment with oneyear
Number and enrollments of contract education sections offered to business and industryannually
Annual number of award recipients in selected occupational programs
Pre-collegiate Improvement: Basic Skills/ESL
Annual successful course completion rates in basic skills English, Math and ESL Basic skills improvement rate in reading, English and math (percent of students who
attempt/complete at least one credit basic skills course who then attempt/complete ahigher level course in reading, English or math)
ESL improvement rate, if applicable
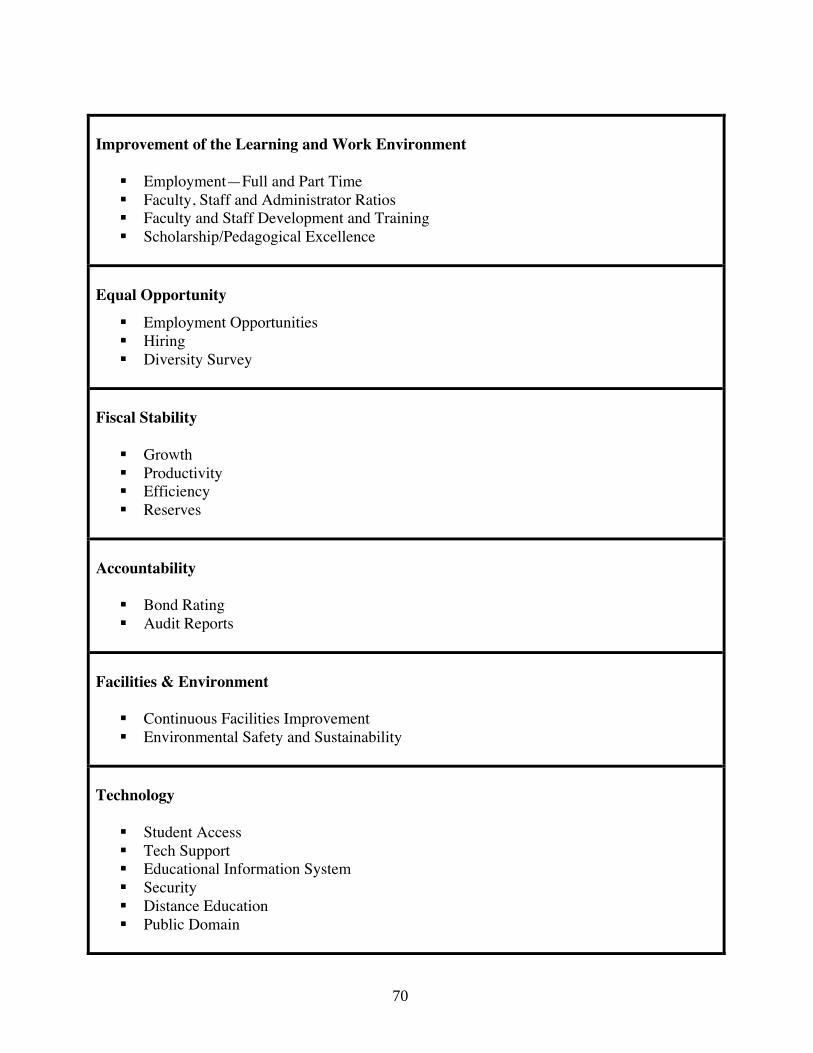
70
Improvement of the Learning and Work Environment
Employment—Full and Part Time Faculty, Staff and Administrator Ratios Faculty and Staff Development and Training Scholarship/Pedagogical Excellence
Equal Opportunity Employment Opportunities Hiring Diversity Survey
Fiscal Stability
Growth Productivity Efficiency Reserves
Accountability
Bond Rating Audit Reports
Facilities & Environment
Continuous Facilities Improvement Environmental Safety and Sustainability
Technology
Student Access Tech Support Educational Information System Security Distance Education Public Domain
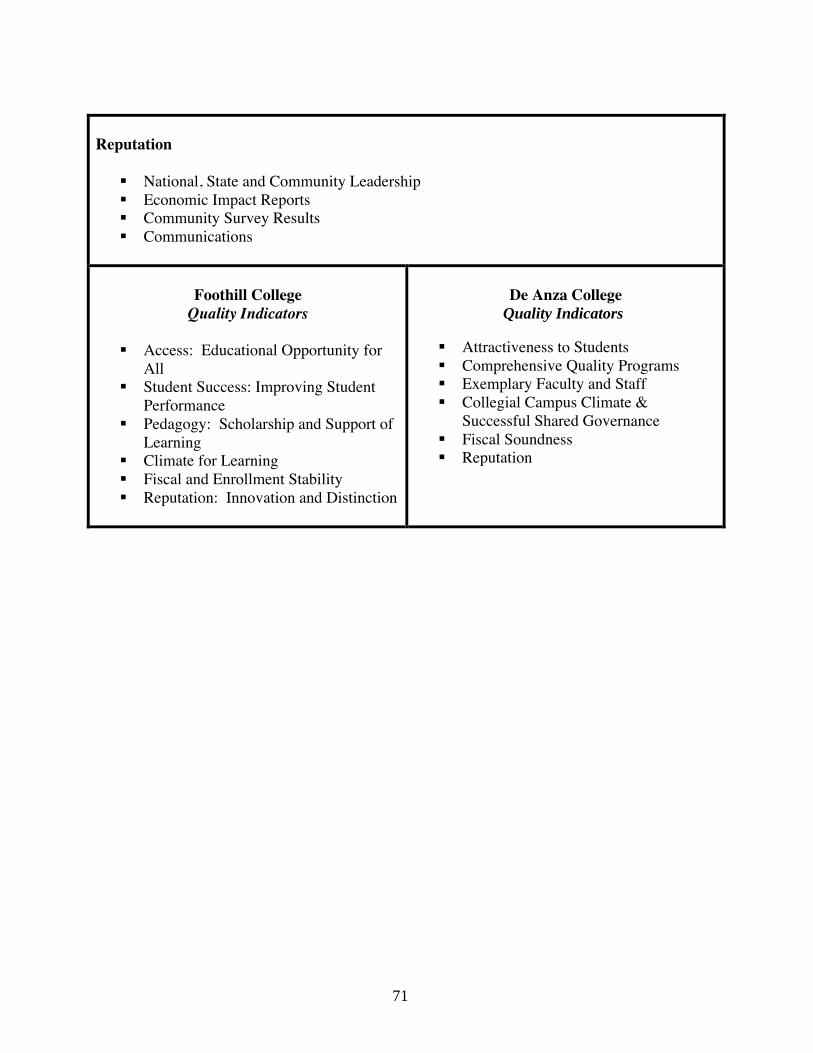
71
Reputation
National, State and Community Leadership Economic Impact Reports Community Survey Results Communications
Foothill CollegeQuality Indicators
Access: Educational Opportunity forAll
Student Success: Improving StudentPerformance
Pedagogy: Scholarship and Support ofLearning
Climate for Learning Fiscal and Enrollment Stability Reputation: Innovation and Distinction
De Anza CollegeQuality Indicators
Attractiveness to Students Comprehensive Quality Programs Exemplary Faculty and Staff Collegial Campus Climate &
Successful Shared Governance Fiscal Soundness Reputation


73
Excerpt: Foothill College Educational Master Plan 2005
Foothill College’s Vision, Core Values, Purpose, Mission, and CoreLearning Outcomes
Foothill College continues its distinctive and innovative reputation into the 21st century guidedby a vision that encompasses its core values, purpose, and mission.
Core Values Honesty, integrity, trust, openness, and forgivenessPurpose To provide educational opportunity for all with innovation and distinction.Mission To provide lower division academic instruction, career programs, and
continuous workforce improvement to advance California's economicgrowth and global competitiveness
Foothill College provides educational opportunity for all who can benefit from the instructionand support services offered. Foothill College is a multicultural institution committed to meetingthe evolving educational, economic, and cultural needs of an increasingly technology-basedglobal community. Foothill fulfills its mission by offering academic courses, programs, andservices unique to the Silicon Valley. Courses are scheduled to maximize student accessibility ina variety of settings and modes. Foothill provides the support services required to help studentswith diverse needs and learning styles succeed in reaching their educational goals.
Foothill College offers: An Associate in Arts or Associate in Science degree, or Certificates of Achievement,
Completion, and Proficiency Preparation for transfer to another college, university, or postsecondary institution Career education, training, and services Basic skills, English as a Second Language (ESL), leadership skills, and student
development Student support services to promote student success
Core Learning Outcomes Communication Computation Critical Thinking Community Responsibility Content-Based Knowledge, Skills, and Abilities
Foothill College, based on comprehensive internal and external research and using its sharedgovernance planning processes, has set the following goals in their 2005-2015 educationalmaster plans. The complete plans, with extensive context, are contained in the colleges’individual Educational Master Plan document that are accompanied by its 2005 AccreditationSelf-Study that provides a learning organization framework drawn from six themes which thecollege has addressed in its plans for the future. The specific plans that Foothill has identified

74
through its accreditation self-study are provided in the appendix to the district’s EducationalMaster Plan.
Foothill College’s Goals and Plans
1. Transfer: Meeting the Challenge2. Degrees and Certificates Awarded3. Student Success: Successful Course Completion and Beyond4. Basic Skills: Moving Students from Remedial to College-level5. Workforce Development: Success After Completion6. Enrollment Stability: Access to Learning Opportunities7. Fiscal Soundness8. Learning Outcomes
1. TRANSFER: MEETING THE CHALLENGE
Over a third of Foothill’s students declare intent to transfer upon entering Foothill College, andthe college is confident that a significant percentage of its students with undeclared intent areconsidering transfer as well. However, for a variety of reasons, the numbers that actually transferremain lower than what Foothill expects creating a conflict with the institutional commitment toensure that students are prepared for transferring and can expect to be successful upontransferring
What are our plans?
Currently, more than 75 percent of Foothill students intending to transfer are assessed as needingdevelopmental course work in mathematics, English, or both. Beginning in 2004, studentsentering Foothill for the first time and needing basic skills will be encouraged to participate in alearning community program designed to address academic preparation prior to enrolling incollege-level transfer courses. The Freshman Experience Learning Community Program isdescribed in more detail in the basic skills section (Goal 4). As this program evolves, the numberof successful transfer ready and transfer students is expected to rise.
As the number of transfer ready and transfer students grow, additional goals include: Assuring that the ethnic and gender distribution is comparable to that of the total student body Expanding the articulation listings through the Articulation System Stimulating
Interinstitutional Student Transfer (ASSIST), Online Services for Curriculum andArticulation Review (OSCAR), and California Articulation Number System (CAN) or itsCSU replacement to insure maximum transfer credits.
Exploring additional program transfer options in emerging programs as well as in established programs that traditionally are not considered transferable. An example is the agreement between Foothill and SJSU for Allied Health graduates to get a Bachelor of Science degree in Health Sciences. Increasing the level of participation in the higher education collaborative with
coterminous degrees in Bioinformatics, Informatics, and Nanoscience (BIN) curriculumas appropriate with UCSC, SJSU, and Carnegie Mellon West.
75
2. DEGREES AND CERTIFICATES AWARDED
Labor market studies comparing earnings for high school graduates, college attendees, anddegree completers consistently indicate the advantages for students earning degrees at all levels.Employers report that better jobs go to the most qualified applicant, measured in part by earneddegrees. An applicant with an earned degree or certificate has demonstrated the ability to persistin the accomplishment of a goal, and possesses a deeper and broader base of knowledge byhaving devoted more time to studying a subject than students who complete individual courseswithout completing the series of courses required for a degree. Community college students donot always see the value in persisting and earning a degree, but it is important for Foothill tooffer the programs and services to enable and encourage students to achieve a degree.
What are our plans?
Full implementation of the College Access, Transfer and Success (CATS) project may enableprograms and service providers to more adequately advise students on progress towards a degreeor certificate. Students in progress for a degree may not be aware of their eligibility for acertificate, or transfer students may accumulate enough units to earn a degree, but never realizetheir qualifications to request a degree. The individual educational planning (IEP) tool, anothercomponent of CATS, will enable students to refine their educational objectives and monitorprogress towards their goals. The degree audit program is intended to notify students of theireligibility for a degree or certificate. The Office of Outreach and Retention as well as academiccounselors and advisors are in place to proactively intervene, but need a systematic method ofidentifying which students to contact.
A combination of implementing CATS and segment concentration will allow for a more accurateresponse to developing appropriate programs and services for the student population. Instead of a“one size fits all” approach, we will be able to increase the amount of success by focusing onspecific needs in population segments. For example, the segment of Foothill students enrolling incollege for the first time has a different set of needs than the segment of students returning forclasses after having successfully completed a degree.
The basic skills focused Freshman Experience Learning Community Program is an example of asegment-specific program and should play a vital part from student retention to IEP completionin the future. Many students are assessed as academically under-prepared, but choose not toenroll in English or mathematics development courses. Lacking the academic foundation tosucceed in college-level courses, they fail to make progress on their IEP, become discouraged,and drop out. This program is designed to address this cycle by ensuring that students understandwhat it takes to succeed.
3. STUDENT SUCCESS: SUCCESSFUL COURSE COMPLETION AND BEYOND
Academic success begins with students passing courses. Courses have defined learningobjectives and students are tested to ensure a sufficient level of mastery over the stated

76
objectives in order to prepare for further study, life skills, and how to make a living after college.Degrees are granted when a student has completed an appropriate mix of courses for breadth anddepth. Assisting a student’s progress on this pathway is important to Foothill and is completedone course at a time.
What are our plans?
In addition to the response to improving campus climate, Foothill is developing a segment-specific approach to programs and services. Resources will focus on the corresponding needsof the student segments and will adjust or re-allocate accordingly. An example of a segment-specific approach is the development of the Freshman Experience Learning Community Programto promote success and retention among targeted groups of students. Described in detailelsewhere in this plan, this project teams counselors with English and mathematics faculty toteach pre-collegiate-level basic skills courses. As this program develops, and if the data warrants,enrollment blocks will be placed on appropriate college-level courses for students assessed asunprepared for college-level work.
Currently, a large segment of students are entering courses requiring a higher level of reading,writing, or computation beyond what they are capable of doing. Many of these students fail orwithdraw, only to repeat courses several times, which, because of enrollment caps, denies accessto other students. This cycle often leads to frustrated faculty and discouraged students whoultimately withdraw from school altogether. There are several activities planned that are gearedtoward breaking this cycle:
Explore various ways to enhance the curriculum to reflect the changing needs of studentsand continue to expand the use of a variety of teaching styles directed towards thedifferent learning styles of students with the intent to improve student success (StudentEquity Plan).
Expand the Learning Communities Learning Model to include areas beyond basic skills.Examples being discussed include: English 1A and a Social Science Department Course Basic Skills Math for the Sciences ESL Oral Language Acquisition and the Sciences
Use electronic portfolios to document learning from start to finish with a goal to connectstudents with faculty, advisors, and counselors reviewing their portfolios.
4. BASIC SKILLS: MOVING STUDENTS FROM REMEDIAL TO COLLEGE-LEVEL
Moving students from remedial-level to college-level is a primary concern for Foothill College.Success rates in pre-collegiate courses such as mathematics, English, and English as a SecondLanguage (ESL) correlate directly to the overall success rate of a student at the college-level.Foothill has identified several facets of this concern that it is ready to address as a college.
What are our plans?
A primary goal until the year 2015 must be to restructure our basic skills programs to increasethe success of all student groups by five percent (Student Equity Plan). The expected increase in
77
demand for basic skills courses presents a particular challenge in accomplishing this goal.Section offerings in basic skills courses may be increased, but limitations exist in funding levels,facilities, and other resources. While assuring adequate access is important, student success,particularly in underrepresented groups, is of equal concern and other solutions will be sought.
The planning agenda identified in the 2005 Educational Master Plan seems to be right on target.Since 1999, research has confirmed the severity of the problem and data analysis has pinpointedsome specific areas of focus:
There is a strong correlation between grades received in basic skills feeder courses andthe chance of success in higher-level courses.
The likelihood is greater that students with college-level English skills will succeed ingeneral education courses.
Evidence points to improvement in success rates when basic skills courses are pairedwith another course in a learning community.
At-risk and underrepresented students benefit from an experience that integratesinstruction and student support.
Emphasis should be placed on early assessment and remediation of basic skills.
The Basic Skills Task Force is continuing to explore ways to restructure the basic skillsprograms in an effort to increase student success. Some of the strategies (several of these appearin program review planning agendas) the Basic Skills Task Force recommended that Foothillpursue are to:
Increase the percentage of students being assessed upon entry for academic readiness. Determine methods for ensuring early remediation of basic skills for students who place
at pre-collegiate levels prior to their entry into higher-level courses, e.g., automaticenrollment into basic skills courses upon placement.
Establish clearly specified goals and objectives for basic skills programs. Identify exit standards for remedial courses that are consistent with entry standards for
college-level curriculum. Assure coordination among basic skills programs, college-level programs, and the
counseling division. Provide faculty development on basic skills, pedagogy, and learning styles. Develop study skills courses for students receiving C grades in feeder courses. Integrate classroom and laboratory activities for basic skills courses. Improve coordination of assessment, counseling and registration processes. Refine and streamline the assessment and placement process, e.g., consider tools such as the electronically scored direct writing assessment included with American College
Testing’s (ACT) test battery, Computer-Adaptive Placement Assessment Support System(COMPASS).
Create more learning communities, pairing basic skills courses with those from otherdisciplines.
Explore modularized course offerings. Re-assess prerequisites and strict adherence to registration holds for prerequisites. Continue to utilize research to monitor progress.
Additionally, the Mathematics Department Program Review Part A indicates the following

78
planning agenda for its basic skills courses: Upgrade course outlines. Support revisions and additions to existing curricula with manuals written by department
faculty. Try alternate approaches to a traditional lecture, discussion, and content delivery. Investigate the possible addition of a study skills course. Seek alternate ways to maintain the Math Center’s current level of service to the campus
in light of state budget reductions.
5. WORKFORCE DEVELOPMENT: LIFELONG PREPARATION FOR SUCCESS
Nearly a third of the students enrolled at Foothill are taking one or more courses designed forworkforce preparation. Students can select courses from over 90 designated degree andcertificate programs or select individual courses that best meet their evolving career developmentneeds. Highly ranked programs are offered in a wide variety of fields including the allied healthprofessions, fine and performing arts, applied business applications, travel and tourism, computerhardware and software applications, emerging technologies such as biotechnology, informatics,and nanotechnology, and plant and animal sciences including horticulture and veterinarytechnology. Because of the rapidly changing conditions in the workforce, students return toFoothill to develop cutting-edge skills. In many of Foothill’s programs more than 30 percent ofthe students already have an earned degree and are here for life long skills enhancement.
What are our plans?
Foothill assumes that enrollment increases will occur in areas of high job demand requiring somelevel of higher education. As illustrated, between 1990 and 2001, the economy affects individualprogram enrollment, and planning for the future of workforce education requires flexibility and adegree of prognostication. Job demand will remain dependent on the economy, and enrollmentdemands will follow. According to a 2003 communication from the Community College Leagueof California (CCLC), the Bay Area economy is expected to recover slowly to the year 2010,when income levels are projected to return to those of 2000. CCLC forecasts a flat economythrough 2007, and then a more rapid expansion. The enrollment projections for most workforcedevelopment programs follow this curve.
What types of academic programs will be needed to prepare the workforce for the nexteconomy? Job growth is projected to be in several areas:
Emerging fields, such as informatics, nanotechnologies, biotechnologies, and other start-ups serving these fields. Programs granting comprehensive degrees will be required forstudents entering these fields and will need to include preparation in the core lifesciences, math, and physical sciences such as chemistry and physics. Additionally, it hasbeen estimated that there are over 50,000 under or unemployed engineers in the greaterBay Area needing educational opportunities to retrain in these fields. Many of thesepotential students have completed core courses but may need alternative curriculum toupgrade their knowledge in the core sciences.
Expanding needs in existing fields, such as health care, pharmaceuticals, and relatedservices in response to the needs of the aging baby-boomers, as well as evolving IT-

79
related jobs that cannot be outsourced. Retraining the workforce for vacancies created by the large number of baby-boomers
retiring between 2005 and 2015 in traditional retail, service sector, and manufacturingjobs.
Further, employer surveys and feedback from advisory groups repeatedly indicate a continuinginterest in making sure that students possess knowledge, skills and abilities beyond those that arediscipline-specific. Foothill’s Student Learning Outcomes (SLOs) address this need, andincreasingly, curriculum for all programs will need to incorporate aspects of learning outcomes.
6. ENROLLMENT STABILITY: ACCESS TO LEARNING OPPORTUNITIES
The State uses measures to cap enrollment that have never matched Foothill’s enrollmentdemand. Changes in the high school graduation rates and adult population determine a college’sfunded growth allowance. Missing from this determination are factors such as changes in theemployment rate, local workforce development needs, college transfer rates, and what isoccurring at those transfer campuses. The later factors appear to be major forces accounting forFoothill’s enrollment demand in excess of the State’s cap allowances. Every year between 1999and 2003, Foothill enrolled 100 to 1,500 FTES over cap despite major class section reductionsimposed to balance the budget. Retraining demand for the unemployed or underemployed,emerging technologies, and changes in the academic standards, tuition costs, and enrollment capsat transfer universities are predicted to increase enrollment demand at community colleges.
In light of these issues, the Institutional Planning Committee sees the maintenance of access forstudents traditionally served by Foothill as one of the most significant problems between nowand 2015. By 2008, all Measure E building projects are scheduled to be completed, but Foothillwill only have 85 percent of the teaching space needed to serve its students at a growth rate ofonly 1.76 percent. [Goals included in the unabridged college Educational Master Plan] assumethe space issues will be resolved by 2008 through a combination of efforts including: efficienciesin schedule via “block scheduling,” increased use of the Web for instruction such as distancelearning or hybrid courses, and passage of an additional bond measure to expand facilities eitheron the campus or elsewhere.
What are our plans?
As stated elsewhere, Foothill’s ability to respond will be determined by resource allocationsincluding human resources, fiscal, and facilities. In response to need and in anticipation of thetemporary disruption of on-campus facilities, Foothill began developing ways to allow forexpanded enrollment that would not further impact facilities approaching capacity. The college'swell-developed and successful Foothill Global Access (FGA) distance learning program, whichhas continued to expand, offers courses via Easy-to-Use Distance Education Software(ETUDES) online course delivery software, as well as other Web-enhanced hybrid courses. Thenumber of students learning partially or wholly in this mode has grown to approximately 4,000in any one term, representing over 20 percent of Foothill's enrollment. The number of degreesavailable through online coursework has also expanded to now offer eight online Associate ofArts (A.A.) degrees. In addition, our students can earn a baccalaureate degree online through apartnership with Franklin University in Ohio, the University of Illinois at Springfield, and San
80
Jose State University. Through curriculum and delivery adjustments, online and hybrid coursesthat utilize Web-supported methods, faculty and students have developed alternative learningstrategies that are less constrained by place and time. FGA is playing a key role in easing thedemand-to-access ratio imbalance.
Moving workforce development programs such as Pharmacy Technology to an off-campus sitehas placed courses in the community and expanded access for students. In this way, Foothill hasbeen able to respond to the recent increased community demand for skilled health care workers.
Block scheduling–moving course meeting times from a configuration of five days a week to alonger duration two or three days each week–is another strategy Foothill is using to expandaccess. Many block-scheduled courses utilize Web-enhanced aspects of the hybrid courses tofacilitate learning. By reworking the curriculum and exploring block scheduling, Foothill hascreated increased capacity for an additional 450 FTES in 2004 depending on funded cap limits.
Clearly, providing opportunities to learning will be one of the largest problems faced by theDistrict's colleges. The College Roundtable group reviewed two facility master plan proposalsfor post 2008. After reviewing the implications of building on-campus or off-campus toaccommodate the demand, the group recommended that Foothill pursue limits to on-campusbuilding and parking space and move the balance to an off-campus site. Foothill is working withthe district’s facilities planning group on how to best accomplish this and the academic plans forwhat would be moved to an off-campus site.
7. FISCAL SOUNDNESS
Along with disciplined expense management, enrollment and productivity are two criticalelements in maintaining fiscal soundness. The majority of Foothill’s income is generated byenrollment expressed as full-time equivalent students (FTES). FTES is calculated by weeklystudent contact hours (WSCH), which are determined by course enrollment. The cost of a full-time equivalent (FTE) faculty member in a course represents the primary cost associated withproducing FTES. Productivity is expressed as WSCH/FTE. As long as the funding formula isenrollment driven, maintaining a proper balance between WSCH and all other institutionaloperational expenses is vital in all resource allocation models.
What are our plans?
Foothill's approach to the budget deficits of 2002-03 and 2003-04 was to view the institutionfrom three perspectives—academic, student, and financial—and to examine each collegeprogram to see how it fit into these three models. Programs and services continue to be reviewedon the basis of their effectiveness in contributing to our academic mission (transfer, degrees andcertificates), their ability to serve students effectively and efficiently (student success,persistence, and retention), and their cost-effectiveness (productivity and WSCH generation).
A formulaic process was developed and first applied in 2003-04 to rank WSCH-generatingprograms according to enrollment/headcount, WSCH, and productivity. These data are reviewedin a five-year average and a more recent three-year average in order to capture historical trends

81
and recent enrollment patterns related to the changing economy. The process was designed not togenerate a program elimination list, but rather to highlight programs requiring more scrutiny.Combined with narrative information from faculty, division deans, and program reviewdocuments, the program rankings offer a better understanding of what factors might becontributing to program status. Programs that rank low on the list might be asked to increaseenrollment or productivity, or consider repositioning the program to become fee-based and self-supporting.
The goal of these processes is to re-examine the institution and its individual programs, and tofind ways of restructuring to prevent unwarranted program elimination. Recognizing thatFoothill’s approach to teaching and learning has changed considerably over the last decade, thecollege will continue to search for ways of structuring curricula to better reflect the currenteducational processes. For example, the college utilizes more group work and collaborativelearning strategies and integrates more Web and online experiences into instruction than it didten years ago. The result is that students are engaging in more active, hands-on activities thatmight be better defined as laboratory experiences than lecture. One way of academicrestructuring might be to organize course hours differently to recognize and foster the moreactive engagement of students in their learning by utilizing more laboratory hours.
Roundtable Guidelines for elimination of programs and funding continue to be followedthroughout the process of academic restructuring.
Short-term plans:
Beginning with implementation in 2004-05 and continuing through the 2005-06 academicyear, some of Foothill's plans to reduce expenses by $4 million would include an academic,student, and fiscal restructuring with the following outcomes:
Maintain enrollment and WSCH to generate FTES based on state funding allocations atthe district-established goal level.
Restructure basic skills programs to increase the success of our students in all academicprograms.
Restructure our other programs to address our different student segments. Restructure high cost, low productive programs to reflect how we are funded by the state.
The strategy for achieving these outcomes involves six steps:
Step 1: The Basic Skills Task Force will continue to frame recommendations for ways to helpstudents achieve a greater degree of success. Recommendations include:a) Requiring students who test into a basic skills class to take that class the first
quarter the student is enrolledb) Providing focused counseling and learning assistance for these studentsc) Providing alternative paths for C students or those who repeat a course
Step 2: Curricula in some departments that have gravitated towards collaborative learning,group work, and use of Web-enhanced or hybrid approaches will be redesigned sothat the lecture and laboratory hours better reflect the activities of the student. These

82
changes will be effective in 2004-05 and will yield between 304 to 625 new FTESthat will compensate for the FTES we will lose when we reduce the low enrolled/lowproductive areas.
Step 3: As described above, all WSCH-generating programs will be evaluated based on aformula that ranked the programs according to their five-year average and currentenrollment, productivity, and FT/PT faculty ratios.
Step 4: Programs with lower rankings will be scrutinized and evaluated for their potential toincrease enrollment or productivity, or to be converted to fee-based, self-supportingprograms. There is an estimated reduction of 34.5 FTE in part-time faculty if theselower ranked programs were suspended or eliminated.
Steps 2-4 could yield between $1.6 to 2.8 million.
Step 5: All vacant positions were frozen. As of January 2004, these positions included sixclassified positions and three management positions. If the positions remain unfilled,the savings in salary is close to $800,000.
Step 6: Unless mandated by program accreditation, all release/reassigned time will bedrastically reduced or eliminated.
Long-term plans:
The emphasis in planning and resource allocation for the academic years from 2006-07 to 2009-10 and beyond will be on access, resource capacity, student learning outcomes, and outcomesassessment. Budget analysts around the state believe an economic rebound to the levelexperienced in 2000-01 is unlikely to occur before 2010. Experts predict a flat economy through2007 before gradually rising. Budgetary goals should be similar to these economic trends in thestate. Careful enrollment management guided by maximizing our funding potential will becritical as the state’s economic conditions improve. Alternative funding streams such as F-1 Visastudent tuition, fee-based programs, and grants should be pursued as well.
8. LEARNING OUTCOMES
Student progress on learning objectives is central to the mission of Foothill College. Foothillfaculty and staff are engaged in documenting student learning outcomes at the course content,institutional, and departmental levels. Content-specific expected outcomes are clearly defined inthe approved course outline of record for each course taught at Foothill. Foothill also identifiedcore competencies or “critical life skills” believed to be required of everyone in the 21st century.Academic departments have linked outcomes desired of all graduates to course requirementswithin the major including the analysis on the four critical life skill areas. Foothill has developeda multiple phase plan to coordinate institutional efforts around learning outcomes. Phase one iscurrently well underway with desired outcome documentation, establishing standards, anddeveloping best practices through experimental pilot projects. The second phase will focus onassessment by applying lessons learned through the pilot projects to the greater campus. The

83
third phase will focus on the evaluation of outcome data and planning to fill any gaps inexpectations at the course, departmental, and institutional level.
What are our plans?
Probably the most important academic challenges facing Foothill in the years between 2005 and2015 and beyond are maintaining student access, and identifying and assessing learningoutcomes. As an institution, we need to identify the depth of knowledge, skills, and attributes weexpect Foothill students to possess, and we need to refine our processes of evaluating outcomesin order to assess how well we are achieving our goals. Once we are comfortable with theprocess of assessment and evaluation, meaningful progress can be made on programtransformations to promote deeper learning for all of our students.
The next steps for Foothill:2004 to 2005—Create a Center for Learning to be located in the Krause Center for Innovation.
Continue to review test methods comparing one-time results to pre- and post-testresults. Participate in a program for faculty interested in electronic portfolios,begin course outline analysis to strengthen bonds between expected outcomes,course activities, and course assessment, and provide staff development for thoseinterested in advancing the activities of the Learning Center.
2005 to 2007—Evaluate the results of e-portfolios, pre- and post-testing, surveys, focus groupdiscussions, capstone assessment methods, and finalize the research methods tobe used for assessment of learning. Develop a method of reporting back theevaluation results to the academic programs for incorporation in the next cycle ofprogram review and planning. Complete course outline review as part of thethree-year Title 5 update process. Measure the institutional progress on 2015goals and adjust planning and resource allocation accordingly.
2007 to 2010—Review the assessment, evaluation, and planning process for potentialimprovements and refinements. Update program self-studies and program anddivision plans.
2010 to 2015—Repeat the above cycle.

85
Excerpt: De Anza College Educational Master Plan 2005
The mission, vision, values, purpose and outcomes of De Anza College capture the philosophicalthemes that animating the college’s plans for the future. But all of these elements rest on anethical core: that De Anza will respond in its planning efforts with generosity and imagination tothe ever changing needs of its students.
De Anza College’s Vision, Values, Purpose, Mission, and Core LearningOutcomes
Vision
Outstanding General EducationWE SEE...an outstanding general education backbone to our degree, founded oninterconnectivity and interdisciplinary course offerings.
Future-Oriented Workforce ProgramsWE SEE...clusters of occupational and technical programs which are future oriented; limitedin number; selected for high quality and market dominance; and well supported.
Success of Underprepared StudentsWE SEE...basic skills courses & programs which are also interdisciplinary, and integratedwith content courses and services. We have "the best ESL in the country."
Inviting Campus ClimateWE SEE...an inviting campus culture, climate, and physical plant - a beautiful campus inevery sense. Special aspects which include: a multicultural/international flair, "real college"elements such as carillon bells and a wide variety of student "happenings," and an active andconstructive associated student body & clubs.
Easy AccessWE SEE...easy access to the college, including simpler, clearer enrollment processes; moretargeted orientation & counseling in accordance with a student flow model; more user-friendly interface in all areas, such as our class schedule; and better connections with highschools regarding student preparedness & eligibility.
PartnershipsWE SEE...outstanding business, school and community partnerships resulting in a decreaseddependence on state funding; and built-in employment for students.
TechnologyWE SEE...outstanding technology in support of our initiatives: distance learning so that youcan get to De Anza "Anytime, Anyplace, Anywhere;" delivery of student services such as a
86
state-of-the-art degree audit checking system; curriculum management; and well-supported,integrated and useful decision and information systems.
AccountabilityWE SEE...outstanding management in support of our initiatives with improved fiscalmanagement; a grants office; excellent marketing; highly effective shared decision-making;and improved human resources.
Core Values
Institutional Integrity CollegialityCommunity Relationships Self-Assessment and InnovationDiversity Student SuccessQuality of Student and Staff Life Learning A "Personal Best"Access and Quality in Concert
Mission
Building on its tradition of excellence, De Anza College challengesstudents of every background to develop their intellect, character, and abilities, to achieve their educational goals, and to serve their community in a diverse and changing world.
Purpose
To accomplish its mission, De Anza College provides a quality teaching and learning environment and sound educational programs and services, accessible and responsive to the needs and
interests of the people of our community.
Core Learning Outcomes
De Anza College fulfills its mission by fostering successful studentswho become knowledgeable and self-directed members of the workplace, appreciative of the aesthetic expressions of humankind, vital participants in the diverse cultures of our community, informed and active citizens of the world, and lifelong learners.
Because of significant changes in administrative leadership from 2003 to 2005, De Anza Collegewill continue to follow its educational master plan “De Anza 2005” until the college concludesits strategic planning effort in 2006 to finalize its 2015 Educational Master Plan. The entirety ofDe Anza’s 2005 Educational Master Plan “Pathways to Excellence” is provided in a separatedocument complimented by its 2005 Accreditation Self-Study that identifies the philosophical
87
framework and specific plans that the college is undertaking for the next decade. The specificplans that De Anza has identified through its accreditation self-study are provided in theappendix to the district’s Educational Master Plan.
De Anza College’s Goals and Plans
In De Anza 2005, through its widespread participatory governance process, the college identifiedfour institution-wide goals that drive its institutional work plan:
Achieve levels of excellence in a climate of learning for a diverse student body. Provide effective pathways to learning for every student. Improve student learning, student life, and the management of resources through the
appropriate application of technology. Achieve planned growth and maintain fiscal soundness
GOAL 1: ACHIEVE LEVELS OF EXCELLENCE IN A CLIMATE OF LEARNINGFOR A DIVERSE STUDENT BODY.
From its inception, De Anza College has embodied the drive to be the best while providing"Educational Opportunity for All," the district's original motto. Today, we formulate that sameinstitutional challenge in a new way. To achieve excellence through diversity, we must establisha climate for learning—a college culture—which expects high levels of achievement for all ourstudents, and builds on the rich tapestry of experience each brings to De Anza.
While some commentators in higher education and the wider public see creating broad access inconflict with maintaining high standards, we consciously reject that formulation. We believe richdiversity—in viewpoint, age, cultural background, race, purpose, and social values—must be ahallmark of excellence in educational achievement. We also recognize that creating the learningconditions on campus that embody trust, equity, challenge, fairness, engagement, and a strongsense of community has not yet been fully realized. Therefore, our planning for improvementmust be directed in these areas:
Improve the climate for learning
Promote a welcoming atmosphere in all first contacts with new students, new staff, andthe public.
Improve the student success rates of all ethnic, gender, and disability groups for all majorindicators of student outcomes so that they will be comparably high with no more than a5% variance between each group. They will be guided by division and departmental plansto achieve student equity.
Clarify and raise, where appropriate, the college’s academic standards and competencies for degree, certificate, transfer, and workforce requirements to reflect the increased
knowledge and skills in both body and spirit needed for students to be current,competitive, and creative in today’s world.
Increase in the kind and number of professional development opportunities for faculty

88
and staff to work more effectively with students. Particular emphasis will be given tomulticultural teaching skills, interdisciplinary methods, collaborative teaching within andamong disciplines, and greater mastery of traditional and innovative teaching tools inboth real and virtual classrooms and labs.
Establish more effective measures of outcomes for both individual students and forprograms and departments. These include methods of feedback that promote regular andthoughtful modifications of the learning environment.
Promote collaboration between Student Services and Instruction that focuses on studentaccess, retention, and success.
GOAL 2: PROVIDE EFFECTIVE PATHWAYS TO LEARNING FOR EVERYSTUDENT.
Our mission supported by statements of purpose and outcomes gives broad direction to the futureemphasis of the college. While many students design their own unique pathways through DeAnza, our assessments show that we must meet these differing educational needs in varied andflexible ways. De Anza values the balance that is realized by offering courses that range fromcollege general education and transfer, to those specifically designed for immediate employmentinto various high-demand occupations, to those courses at the pre-collegiate level for studentswith developmental learning needs. As our student population is culturally and ethnicallydiverse, so are their interests, their levels of intellectual curiosity, and their preparedness for thedisciplines the college offers. De Anza needs to provide a full range of offerings from basic ordevelopmental classes to the more advanced courses that enable its students to succeed in theworkplace or as transfer students to a university. The college will focus its planning efforts onstrengthening its programs and services in the following areas:
Enhance programs for freshmen and students seeking career preparation and retraining
Provide full programs for recent high school graduates seeking transfer or preparation forwork (basic skills, general education, transfer/ vocational majors, A.A./A.S. degrees).
Offer focused programs for those seeking immediate employment or retraining, and forthose in the workforce upgrading their skills (certificates, weekend college, Welfare-to-Work, OTI, CACT, Business & Industry, etc.).
Deliver effective assessments, both self and institutional, using the Student EducationalPlan and provide regular updates for transfer and vocationally oriented students(registration, testing, counseling and advising, research).
Establish new and improved relationships with both feeder institutions (high schools,social agencies), transfer institutions (public and private universities, proprietaryschools), and businesses.
Clarify the pathways to success in college
Promote enhanced forms of communication that inform students of the multiple pathwaysto educational success which range from initial inquiries to orientations to reviews ofacademic progress to completion of degree and certificate requirements.
Promote flexible programs that provide practical choices for youth, parents, and oldercitizens (child care, short courses, community education).
89
Experiment with alternative load and scheduling policies to meet student needs withincreased coverage, better delivery systems, and more flexibility by working withnegotiated agreements (e.g., offer blocked and annual scheduling, assure the availabilityof courses in a sequence, provide cross training, cyber-schedules, virtual office hours,etc.).
Create strong, rich programs incorporating Instruction and Student Services based uponmutual support and shared development, delivery, and evaluation.
Encourage new forms of scholarship in the classroom
Redefine the classroom as a place for a broad range of teaching methods or pedagogies(problem analysis, collaborative learning, interdisciplinary study, role playing, gaming,and electronic interaction) and focus on "uncovering" content and arranging studentencounters with the best minds of the past and the present.
Provide new models of participation for both faculty and staff that incorporate the rolesof mentor, coach, and facilitator with those of lecturer and grade-giver.
GOAL 3: IMPROVE STUDENT LEARNING, STUDENT LIFE, AND THEMANAGEMENT OF RESOURCES THORUGH THE APPRORIATEAPPLICATION OF TECHNOLOGY.
We know the attainment of knowledge is enhanced in a congenial environment and extended bythe mastery of the tools of scholarship. The material conditions of learning make a difference,allowing students to concentrate on their learning and empowering them with access to greatideas and important information. For those reasons, we will pursue the following initiatives tocreate truly humane conditions for learning.
Improve student learning with new tools
Improve assessment, advisement, and placement by making new tools available to staffand students. Examples include risk analysis data by program for students recommendedfor basic skills courses and individualized, online student educational plans so thatstudents can determine their progress in achieving degrees, certificates, transfer, and/orcareer preparation through appropriate career-ladder pathways.
Support all courses with appropriate technology to increase student responsibility forlearning and mastery of skills. All students and staff will have online Web access thatincludes training and technical support.
Expand Internet access and enhance television services to provide learning options suchas distance learning, multimedia as a learning tool, and online information research.
Provide access to technology for students with disabilities, including alternative textformats (e.g., Braille, large-print, and audio).
Improve student learning through new systems and facilities
Annually prepare class schedules that are based on student need and determined by acomposite of student educational plans. Up-to-date schedule information such as courselocation, instructor, and available seats will be provided in real time on the Web.
90
Provide training and support to faculty, staff, and administrators on appropriatetechnological tools, databases, and software applications for their jobs as needed.Currency in these tools and tracking of key quality indicators will be an expectation ofevery employee.
Increase and improve laboratory space for both the arts and sciences areas byincorporating technological features. In addition, provide more social and meeting spacefor faculty, staff, and student gatherings as well as more areas for joint use with othercolleges and agencies.
GOAL 4: INCREASE ACCESS THROUGH PLANNED GROWTH AND FISCALSOUNDNESS.
The dual pressures to meet the growing educational needs of our community and to use our fiscalresources to the maximum effect require efficiency, productivity, and accountability. Oureducational mission drives our work, but we operate in a framework of public policy and publicsupport. We must communicate effectively what is required to meet the educational expectationsof our community, and we must wisely use the support provided by our taxpayers and legislators.Balancing the needs of students with the available resources will require these continuing efforts:
Increase student access
Use program review for the appropriate allocation and/or reallocation of resources as well asthe redesign of program mix. The goal to is to achieve proportional representation fromunderrepresented ethnic groups while attracting special populations such as older adults andworking adults, distance learners, and international students.
Construct our programs in response to the learning needs of our students while maximizingour income to meet state funding requirements for growth and retention, state initiatives forperformance funding, and increased use of categorical funding.
Carefully schedule facilities, faculty, and staff to insure an optimal FTES while realizing thatgeneral fund revenues provide the greatest flexibility in meeting student needs.
Plan for intelligent growth to include aggressive development of off-campus sites, the highschools, and business locations.
Ensure fiscal soundness and accountability
Manage our costs prudently by maintaining effective expense controls and by monitoringexpenditures to ensure accountability to our mission.
Increase financial and personnel resources for faculty and staff training, Web management,and technical support.
Increase external resources to support innovation and entrepreneurship
Develop more effective partnerships with business, industry, and community leaders. Suchalliances will establish the basis for learning competencies linked to industry standards andemployability needs and will provide a baseline for better public funding and necessaryprivate funding.
Establish a more aggressive, coordinated approach to fund-raising and an expanded Grants
91
Office. Each organizational unit will meet a target for external funding. Fundraising shouldbe done to augment our programs and services to support our mission, ensuring that we donot compromise our integrity as an educational institution.
Maintain an annual set-aside of discretionary funds to support innovation.
Time passes at a uniform, arbitrary rate. Every second, every minute may seem the same. Yetwhen we think in large units of time, we give special meanings to years, to decades,to centuries. Milestones matter. The close of this century heightens our sense of both past andfuture. We trust that all members of the De Anza community will use the heightened sense ofthis historical moment for finding ways to make our plans work. The final test of a master planlies not in how well the plan is formulated but in how the plans really work. If each of us givesour best effort to making these plans part of our daily routines and decision making, thebeneficiaries will not only be the college programs of 2005, but the students of 2025 and beyond.


93
Central Services Mission, Goals and Plans 2005
CENTRAL SERVICES’ MISSION
Central Services supports the work of Foothill and De Anza colleges by providingcomprehensive financial, human resources, facilities, technology, institutional research andfundraising leadership and support, enabling the colleges to focus on student learning andoptimizing student access and educational achievement.
The educational master plans for Foothill and De Anza—unique yet interrelated plans within thedistrict’s Educational Master Plan—guide the specific planning agendas for each CentralServices department. The following Central Services goals are intended to advance theeducational mission of the colleges in serving the community through enhanced planning efforts,along with strategies to increase funding and ensure fiscal stability and accountability.
Each department works to achieve the district’s overarching goals of providing educationalopportunity, quality, accountability and sustainability for the public benefit. As we plan for thenext decade, every department will play a special role in serving the colleges, the community, theresidents of the cities that form our district and the state of California.
CENTRAL SERVICES’ GOALS AND PLANS
Chancellor’s Office
Under the leadership of the chancellor, Central Services will continue to oversee thedevelopment and implementation of board policies as well as representing the district to thelegislature and the system office of the California Community Colleges. The chancellor’s officecoordinates and supports all board meetings and committees, follows through on board actionsand works extensively with the foundation, the external community and the media.
District Leadership
Preserve and strengthen educational opportunity and quality for studentsPurposeful collaboration with college presidents, administrators, faculty and staff will contributeto achieving the highest possible student learning outcomes in a collegial environment thatfosters engagement, curiosity, hard work and an appreciation for innovative ideas.
Promote meaningful, strong participatory governanceSuccessful constituency-based district committees of faculty, staff and administrators willcontinue to design, implement and support visionary and effective board policies that are adoptedby the board of trustees.

94
Community Leadership and Public Affairs
Strengthen key relationships and partnerships to benefit the district and therefore studentlearning and successEssential to the health and advancement of the district will be the ongoing cultivation andstewardship of relationships and partnerships with area business, government, non-profit andeducational leaders, as well as donors, through active memberships on boards and agencies,regular correspondence, meetings and events.
Legislative Advocacy
Advocate for legislation and public policy to benefit the district and its studentsKey areas will continue to include increasing state revenues, keeping college affordable,increasing student access and reducing unnecessary mandates. The annual development andimplementation of the board of trustees’ legislative goals will be the central vehicle foradvocacy. The district will continue to work collaboratively with the State Chancellor’s Office,Community College League of California and other local, state and federal agencies, policycenters and foundations to promote the public good of Foothill-De Anza and the state’scommunity college system.
Communications and Media
Open, informed and regular internal and external communications will build community,promote collegiality and enhance the district’s reputationCurrent and enhanced communication vehicles, including events, Web- and e-mail-basedpublications will keep faculty, staff, students and the community informed of opportunities andchallenges affecting the district, including board actions and policies, employee and studentaccomplishments, as well as the use of current Measure E and any future bond or parcel taxfunds. Local, state and national media will continue to be regularly informed of district news.Current relationships will be enhanced through regular contact and new relationships will bedeveloped.
Human Resources and Equal Opportunity
The department of Human Resources and Equal Opportunity provides vision and leadership indeveloping and nurturing the well being of Foothill-De Anza’s dynamic workforce. Commitmentto excellence through diversity is critical. The district continues to explore and developinnovative mutual respect activities and inclusive diversity efforts: cornerstones of all districtstaffing plans and key to advancing the legacy of excellence and opportunity.
95
Staffing
Guide staffing decisions to ensure student learning outcomes are achieved at both collegesWith limited resources to fund positions, each decision must be carefully weighed to ensure thatany open position is strategically designed to meet student needs, rather than automaticallyfilling vacancies as they occur.
Coordinate staff planning with facility and technology developmentsPlans for staffing must be closely coordinated with facility and technology developments, suchas the opening of Measure E buildings and the increased need for maintenance and technologyservices.
Consider effect of changes in learning delivery methodsDistance learning and block scheduling may have an impact on recruiting staff andaccommodating special needs. For example, the camaraderie of a work group may be affectedwhen a number of employees have fewer on-site hours, a situation that may generate differentapproaches to teambuilding and the sharing of academic expertise and mentoring opportunities.
Fund classified positions in proportion to faculty and administrative positionsIt is essential to rebuild the ranks of vital classified staff members reduced significantly throughlayoffs due to lack of funds.
Compensation
Negotiate pivotal issues regarding compensationThe district must work with employees, through their bargaining groups, to decide whether anynew revenue should go toward salary enhancements, fully paid benefits or new positions, asachieving all three is no longer possible. Possibilities include negotiating a cap (at current districtcontributions) on district-paid benefits with employees agreeing to pick up additional costs, orlimiting district-paid benefits to employees only. Discussion must also ensue regarding formulasto fund new positions, such as a set-aside of a percentage of state COLA revenue. The DistrictLegislative Committee should consider action to support revisions to the Education Coderelieving limits on the use of temporary and short-term employees and on contracting for certainservices.
Diversity
Conduct follow-up on District Diversity Climate SurveyBuilding upon the 2003 survey, Human Resources and the District Diversity AdvisoryCommittee will again conduct the Diversity Climate Survey in spring 2006. We will also assessthe progress made in developing strategies to further strengthen the district’s commitment todiversity.
96
Employee Relations
Assess and strengthen the district’s internal evaluation systemsWe must ensure that our evaluations appropriately identify the professional development needsof faculty and staff and that evaluation methods are applied fairly to all levels in theorganization. We will continue to seek ways to recognize and celebrate employee contributionsto student success in both public ceremonies and private acknowledgements. In particular, wewill work to develop more collaborative working relationships with employee groups to enhancethat recognition throughout the district.
Develop strategies and activities to strengthen respect in the workplaceAfter completing the analysis of the feedback from the staff, administrator and faculty focussessions of the Respect in the Workplace project, Human Resources will work with the HumanResources Advisory Committee and the District Diversity Committee to develop programs thatcultivate and enhance a workplace that respects and celebrates the contributions of allemployees.
Business Services
The department of Business Services assists the colleges in providing educational access andopportunity to students through ensuring the fiscal soundness of the district and the allocationand spending of resources in accordance with educational goals, accumulating and distributingdistrictwide financial information both internally and externally and ensuring a safe learningenvironment. To continue to do this, the following are necessary:
Planning
Link resource allocation decisions to the Educational Master Plan to ensure student learningoutcomes are achieved at each collegeThis goal is intended to comply with the accreditation standards that focus in many differentways on the importance of aligning the educational planning processes with the resourceallocation processes. This process needs to be identified, communicated and evaluated on aregular basis.
Grow the institution proportionately so infrastructure staffing grows with student and facilityexpansionSome progress has been made on this goal by developing a simple model illustrating how thestaffing infrastructure for classified, management and supervisory staff grows proportionatelywith student growth and facilities staff with changes in the facility growth.
Develop and report measure of productivity so the college community can assess impact ofchangesWhile the district is successful in using the academic productivity measurements of productivity(WSCH/FTE) to gauge the fiscal impact of enrollment management, similar benchmarks must be
97
developed that can be used in other support services area of the colleges’ and Central Servicesoperations.
Funding
Identify three-year revenue and expense trends each for each of the next three years, beginningearly in the 2005-2015 Educational Master Plan periodThe district must develop a forecasting model that looks at revenue and expense trends overthree years to begin to formulate an annual review of trends in state, federal and local revenuesources.
Particular focus should be directed to medical benefit increases for active employees, as thatexpense category continues to outpace the state revenue COLA adjustments. Additional focusshould be directed toward funding the district’s unfunded retiree medical liability, anotherobligation that will outpace the COLA. The district’s plan for compliance with GovernmentalAccounting Standards Board (GASB) regulations will become a major issue between 2005 and2009 and should be widely communicated to the college community on an annual basis.
Inform the district community on sources and uses of fundsAnnual presentation to the board of trustees and other key college groups should include anoverview of the sources and uses of district funds.
Support the fundraising and grant writing infrastructure to maximize outside revenuesThe goal to increase funding from sources other than the state will require infrastructure for thegrant writing and fundraising efforts of the colleges and the foundation.
Maintain balance of funding for positions and operating funds among the colleges and CentralServicesThe proportion of funding among Foothill, De Anza and Central Services should be reviewed ona regular basis to ensure that incremental financing decisions do not lead to unanticipated effectson the entities’ fund balances and therefore students.
Fiscal Stability
Provide adequate reserves to ensure fiscal stability irrespective of revenue or expense changesthat occur throughout the yearThe district staff should review on regular basis the designated reserve levels in operating, self-insured medical and retiree long-term medical funds.
Maintain strong fiscal procedures to ensure public money is spent properly and in a transparentmannerOngoing attention should be directed towards strong purchasing and fiscal controls to ensure thefinancial integrity of public funding. All spending must be open and transparent.

98
Facilities and Operations
The Foothill-De Anza Community College District entered the 21st century with a well-developed facilities master plan and $248 million in Measure E general obligation bond funds.Five years later this plan has been leveraged into $300 million in funding, 170,000 square feet ofassignable educational space and the complete renovation of more than 50 existing buildings onthe campuses. This construction is a true landmark in the district’s legacy of excellence,opportunity and innovation in educational facilities as the district plans the next phase to meet itsfacilities and operations needs.
Accommodating Growth
Provide appropriate facilities to support the educational needs of the collegesMinimal growth may be accommodated on each campus to serve students. An additional siteneeds to be fully developed by 2015-16.
Planning
Develop a facilities plan through 2015 within the overarching framework of a 20-year visionAll educational objectives must be clearly linked with funding allocations and facilitiesspending. We must ensure that the physical institutions grow in proportion to enrollmentdemand.
Staffing
Ensure maintenance of facilitiesWe must develop a realistic assessment of the level of effort and resources required to maintainexisting and new infrastructure and consider, in addition to adding staff, options includingexternal staffing sources.
Funding Growth
Explore alternative funding measuresAs this Educational Master Plan is being prepared in 2005, the board of trustees is beginning toconsider a new bond measure. The district will also continue to submit funding applications tothe state’s capital outlay program; however, lead time ranges from four to five years and isdirectly contingent on the passage of future bonds.
Educational Technology Services (ETS)
Technology is pivotal to advancing Foothill-De Anza’s legacy of excellence, opportunity andinnovation. During 2005-2015, Foothill-De Anza will face significant challenges in thetechnology arena in the form of markedly aged equipment and growing technical staffing needsin the face of recent significant reductions in budget and personnel. These challenges threaten the

99
district's legacy of excellence, opportunity, and innovation unless suitably addressed. To resolvethese challenges the district need to address the following issues:
Integrating Technology to Support Students
Provide support and guidance for continued integration of technology into the delivery ofinstruction and support services to enhance student access, success and performanceAlthough technology is always in a state of flux, various technology industry factors arecoalescing that will provide hope for the district's technology effort. For example, there areevolving technology standards, primarily around Web services, that offer opporutnities for thedistrict to provide services and information in easily accessible and secure ways. These include aconsolidation of industrywide standards and a growing acceptance of open source solutions toeducational challenges. The district should take advantage of these factors to deliver instructionand support services that meet the needs of students and employees. Manifestations of suchtechnology solutions would include providing more online self-service technologies as analternative to traditional face-to-face service; implementing personalized portal technologies;increasing the delivery of online learning and more complete integration of technology into theclassroom; and providing widespread access to district network resources via wirelesstechnologies.
Integrating Technology to Suppport Operations
Provide effective and efficient educational information systems that meet the operational needsof the district and that provide reliable, secure, and meaningful data for decision-making Our current information system is antiquated and insufficient to meet the growing data andanalytical needs of the district. It is clear that a new solution is needed. As a result, it isimportant that early in the life of this Educational Master Plan the district complete a needsassessment, investigate, recommend and implement an effective educational information system(encompassing student, financial and human resources systems and others) that will effectivelyand securely support the business operations of the district.
Staffing
Ensure sufficient staff to support current and new technologySimply acquiring technology without ensuring sufficient staff support is imprudent. We mustdetermine methods to fund, recruit and hire sufficient staff to support current needs, new andemerging technology and newly constructed buildings.
Funding
Develop an effective budgetary plan that will provide sufficient resources to maintain, upgradeand refresh all district technology (desktop computers, network and security equipment, servers,telephone system and software) on a regular basis, in line with industry standardsThe above technology integrations efforts will require more financial resources to be successful.Currently the district lacks such resources, so efforts must be made to acquire them. Theseefforts may include the bond or parcel tax measure mentioned above. Concurrently, as also noted
100
above, a method of funding, recruiting and hiring sufficient staff to support the new technologymust be determined.
To provide a five-year the blueprint for technology in the district, the Educational TechnologyAdvisory Committee (ETAC), which includes representatives from each constituency group,engaged in a strategic planning process during the 2004-05 academic year. Recommendationsincluded the above items and beyond. The complete Technology Strategic Plan may be found athttp://ets.fhda.edu/etac/policies.
Institutional Research and Planning (IR&P)
Institutional Research and Planning (IR&P) provides critical support for decision-making,planning, and improving student learning and success by organizing, designing, collecting,maintaining, analyzing, and disseminating research, information, and data about the functioningand performance of the district and its colleges. IR&P provides reports, research, andinstitutional data to administrators, faculty, staff, and state and federal agencies and providesleadership for integrating research and data into college decision-making and planning includingenrollment management, program review, curriculum development, class offerings, studentoutcomes assessment, and resource allocation. Perhaps for the first time in the history of thedistrict, IR&P has been able to conduct a large number of studies directly related to improvingstudent learning and success as well as many new studies for a myriad of decision-related issues.Achieving the following goals will expand on this progress:
Improving Student Learning
Conduct an increasing number of studies related to improving student learningAchieving this goal is essential to enabling the colleges to determine what factors and strategieswork for student learning and to obtaining reliable feedback on whether changes are having apositive effect on outcomes. Included in this goal is support for and analysis of the assessment oflearning outcomes.
Substantially increase the involvement of faculty in the assessment of learning outcomes and inresearching and responding to what works for student learningIR&P will collaborate with and support more faculty members in determining how to assesslearning outcomes and to develop and respond to research.
Lead and support efforts to determine how to “scale up” programs and factors that improvestudent success without increasing overall costsNot only must we identify and communicate best practices and factors for improving studentoutcomes but we must also find ways to “scale up” what works to include larger numbers ofstudents in a manner doesn’t increase overall costs. Some programs are very effective, such asthe Pass the Torch program or learning communities, but they are also considerably moreexpensive than traditional programs, so simply expanding them is impractical.
101
Decision and Planning Support
Increase support and analysis for planning and operational decision-making by developingspecial reports and automating report functionsProviding good data and analysis for decision-making in a timely manner improves decisionsand planning. IR&P will work with decision-makers to determine their needs and developanalysis and reporting methods, as with the new enrollment indicators report, which providesreports and analysis when it is needed and is produced as efficiently as possible, conserving stafftime for additional projects.
Develop user-friendly, Web-based query access to analytical databasesIR&P has developed an analytical data warehouse and a number of data marts that are used byresearch staff to produce data and reports efficiently. The next step is to make Web-based queryaccess available to administrators and selected staff, enabling them to conduct quick and easy ad-hoc research and operational queries and studies at their desktops.
Research Infrastructure
Develop, upgrade and expand the research infrastructure of databases, data marts, access andquery tools, query templates, servers, Web site and archives of research materialResearch infrastructure is the foundation for institutional research productivity and effectiveness.Improving this infrastructure in recent years has enabled reports and analysis that wereimpossible previously and greatly reduced the time required to produce others. Additionaldevelopment, taking advantage of the latest information technology, will further increaseresearch productivity and outputs.
Increase the amount and detail of data provided on the IR&P Web site and develop aninteractive query access for commonly used dataThis will enable faculty, staff and others, including the public, to easily obtain data they need fora wide variety of purposes, including grant writing and communications, and greatly reducedirect requests to IR&P staff, thereby enabling them to work on more complex projects.
Upgrade survey technology and training for support staffAchieving this goal will expand survey research efforts, which provide an additional avenue ofcritical data and feedback on college and district functioning as has, for example, the districtdiversity climate surveys. Training of support staff in key offices will enable faster and moreefficient scanning of surveys and report production.
Staffing
Increase staff as resources allowThis would enable a substantial leveraging of talent and a great increase in research and analysiscapacity and realize a major component of the vision for institutional research resources.
102
Identify and cultivate other resources and attract and train faculty and staff to contribute to andconduct research and analysisSince the previous Educational Master Plan, the capacity of the office has been greatly expandedby the hiring of new higher-level staff and building a strong research infrastructure. This goallaunches the next phase of expanding the district’s research capacity by attracting a range ofadditional resources, including grant funding, additional researchers and volunteers, andexpanding the range of district faculty and staff who contribute to or conduct research.
Foundation
Since the previous master plan, the Foothill-De Anza Foundation has more than tripled itsassets—from $6 million in 1999 to more than $20 million in 2005—as a result of significantmajor gifts, large bequests, returns on investments, and individual and staff fundraising.Fundraising infrastructure has been developed and implemented over the past several years. Ahighly significant change is the foundation’s status, since 2004, as a self-supporting entity.
Fundraising
Increase opportunities for students by raising $10 million per year by 2010“Excellence” (in teaching), “opportunity” (for students) and innovation (in facilities andtechnology) will be the key fundraising themes for the future. Foundation staff will continue tofocus on major gift and annual gift fundraising, involving foundation board members,commission members, administration, faculty and staff when appropriate.
Increase level of flexible fundsThe diverse nature and needs of our students require a significant level of fairly unrestrictedfunding to be used at the direction of the chancellor and college presidents to provideopportunities for students, as well as to leverage funding from local, state and federal sources.This will be achieved through board fundraising within the three themed initiatives andenhancing annual giving through the Chancellor’s Circle and new alumni and parent givingprograms.
Encourage involvement and support across the districtThis has been moderately successful to date, but advances must be made across the myriad ofconstituencies found in two colleges with a broad range of programs and services. Maximizingfaculty and staff participation in fundraising events and activities will assist in accomplishingthis.
Board of Directors Development
Transform structure of foundation boardRestructuring is necessary in order to become more effective in fundraising. Increasing diversityin order to better reflect the student body and surrounding communities will be a key element of
103
this restructuring, with recruitment focusing on community members associated with a high levelof private and corporate philanthropy who are willing to actively raise funds to benefit students.
Commission Development
Continuous upgrading of annual events and activitiesThe college commissions will continue to upgrade annual events (the Foothill Summer BenefitGala and De Anza’s “A Night of Magic”) to raise more revenue and attract more attendees,while also supporting other activities to connect the colleges with their surroundingcommunities.
Staffing
Reorganize fundraising efforts to maximize current staff; increase staff proportionally asrevenues growFundraising efforts are being reorganized so that a greater dollar benefit can be reached with thecurrent low level of staffing, while at the same time strategies are being developed to moveforward at a greater pace when hiring additional staff becomes financially feasible.


105
V. Advancing the Legacy
The hallmark of a great community college district will not be to rest on its laurels nor revel inits past, but to set and meet the highest possible goals, including those that seem especiallychallenging, and exceed them over time. Great institutions exist because they continue toimprove over time and learn to sustain themselves through upturns and downturns alike. Greatinstitutions always grow—sometimes in the number of students they educate, often in the size oftheir facilities and their endowments—but their most important growth is realized in theknowledge gained by their students and the quality of their graduates decades later. Greatinstitutions alternate between competing and partnering with other great institutions, take risksand measure and learn from successes and failures across decades. Great institutions attract greatpeople to teach and to serve their students and the community. Great institutions nourish andsupport a common spirit and work ethic that builds respect and community across and throughtheir myriad diversities. And great institutions include everyone and allow for uniqueness thatinspires creativity and accomplishment.
These characteristics describe the Foothill-De Anza Community College district as we mark ourgolden anniversary and embark on its next fifty years of educating students and this EducationalMaster Plan provides a blueprint for the next decade. Our future will depend upon our flexibilityin designing innovative programs and services that will adapt to the changing conditions of ourtime, with a perpetual focus on educating students to their fullest potential.
In the decade ahead, the Foothill-De Anza Community College District will continue to work toadvance opportunity, quality, accountability and sustainability for its diverse student body andcommunity as it aims to:
provide greater access for students from diverse backgrounds and cultures seeking highereducation;
increase student success by maintaining high standards and closing the performance gaps; ensure fiscal stability, planned growth and the wise and careful use of district’s resources;
and preserve the learning environment and enhance the excellence of the district for future
generations.
The district will use the following strategies to meet and exceed its goals:
ensure that its work is mission-critical, giving our students the finest educationalpossible;
ensure that our work is being done as effectively and efficiently as possible; identify the best practices across the district and use those to improve our programs and
services; share resources when that will achieve a greater good;

106
promote inclusive participatory governance in a pervasive culture of learning forstudents, faculty and staff;
conserve resources whenever possible; and steward learning and working environments grounded in mutual trust and respect for the
dignity, diversity and worth of students, faculty and staff.
Our ultimate vision is educational excellence and opportunity for all, advancing the legacy of theFoothill-De Anza Community College District over the next decade and beyond.