for coipamining juba-south sudan by: terracon s.r.l …
TRANSCRIPT
BY: TERRACON S.R.L Viale Giuseppe Mazzini , 40 CAP - 50132 – Firenze – Italia
TECHNICAL REPORT PREPARED
FOR COIPAMINING JUBA-SOUTH SUDAN
PRESENCE IN SOUTH SUDAN SINCE YEARS
REPUBLIC OF SOUTH SUDAN
Author: Dr. Khalid Kheiralla PhD Remote Sensing and Geological Modeling Team Leader
Approved by: Franco Caselli Exploration Manager
Report # 1 COIPA INTERNATIONAL
MINING COMPANY.
REMOTE SENSING TECHNIQUES FOR GOLD
AND ASSOSSIATED MINERALS PROSPECTING
Exploration License EL 17
EASTERN EQUATORIA STATE CONCESSION AREA
EASTERN EQUATORIA STATE
SOUTH SUDAN
July 11 2016
2
CONTENTS
1. INTRODUCTION ....................................................................................................... 4
2. DATA BASE AND PRE-PROCESSING ................................................................. 10
3. REMOTE SENSING INVESTIGATION ................................................................. 10
4. GEOLOGICAL AND STRUCTURAL SETTING ................................................... 30
4.1. Geological SETTING ......................................................................................... 30
4.2. Lithostratigraphic units ...................................................................................... 34
4.3. Geomorphology .................................................................................................. 35
5. REMOTE SENSING MINERAL PROSPECTING .................................................. 39
5.1. Band Ratio Combination .................................................................................... 39
5.2. Feature Oriented Principal Component Selection (FPCS) ................................. 39
5.3. Matched Filtering ............................................................................................... 39
6. ALTERATION ZONE SIGNATURE DETECTED OVER EL 17 .......................... 45
7. CONCLUSION & RECOMMENDATION .............................................................. 47
FIGURES
Fig. 1a Location of the study area
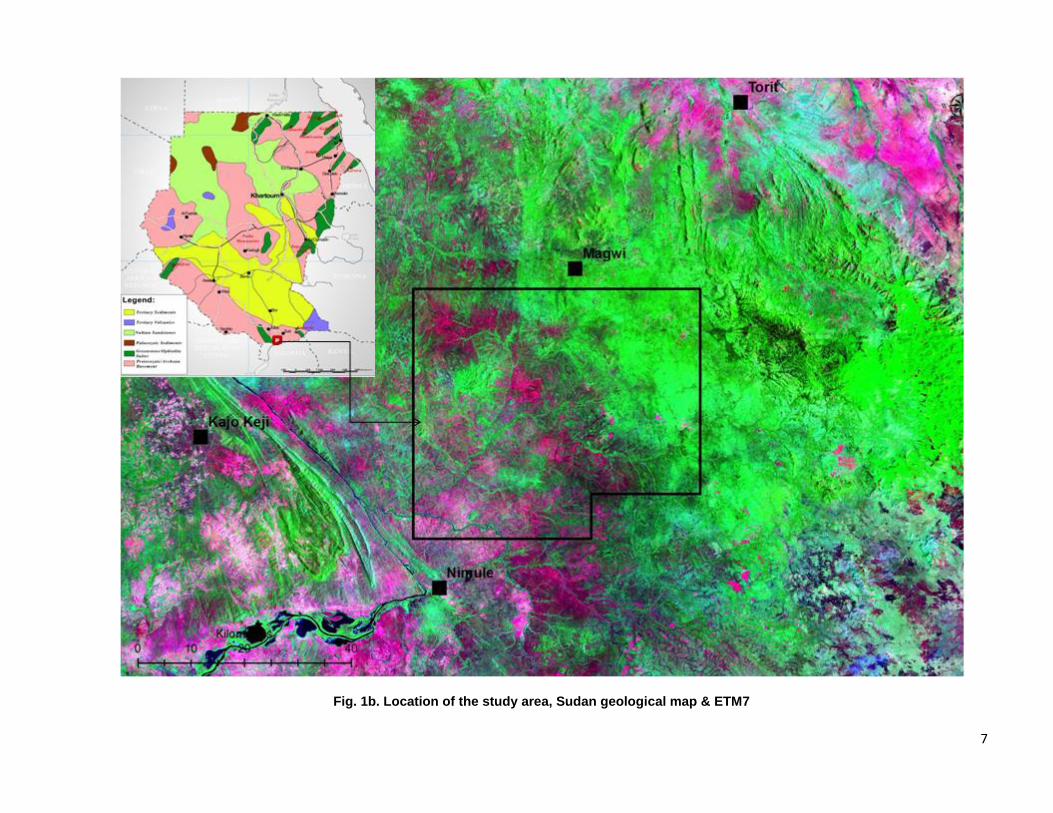
Fig. 1b. Location of the study area, Sudan geological map & ETM7
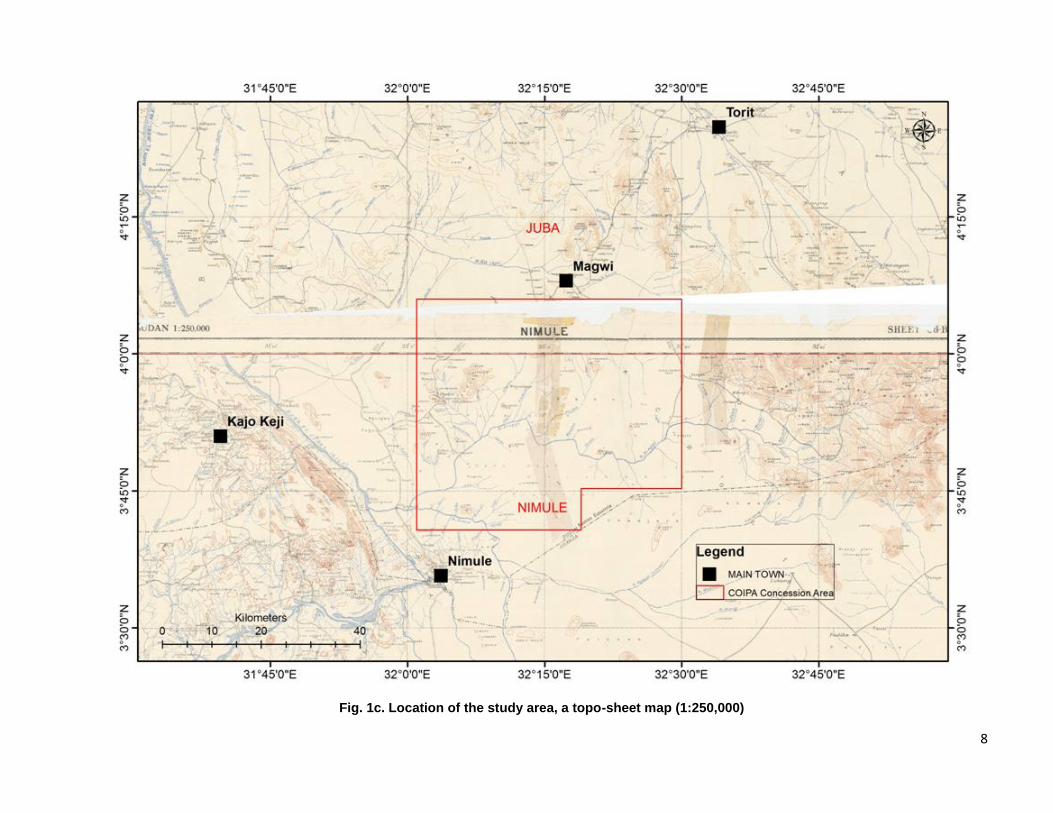
Fig. 1c. Location of the study area, topographic map (scale 1:250,000)
Fig. 2. Juba Annual Rainfall (1960-1990)
Fig. 3. Location of the concession area and Landsat scenes
Fig. 4. Band-passes of the ASTER, Landsat 8, ETM 7 and Hyperin sensor.
Fig. 5a. Landsat7 ETM+ color composite images, Linear stretched bands 7, 4, 1 in R,G,B
Fig. 5b. Landsat7 ETM+ color composite images a) Linear stretched bands 5, 3 & 1 in R,
G, B, respectively
Fig. 6a. Landsat7 ETM+ color composite images, PCA 1, 2 & 3 in R, G, B
Fig. 6b. Landsat7 ETM+ color composite images, PCA 2, 3 & 4 in R, G, B
3
Fig. 7. Landsat7 ETM+ color composite images, Fused IHS of the DC bands 7, 4 & 1
with the panchromatic band 8
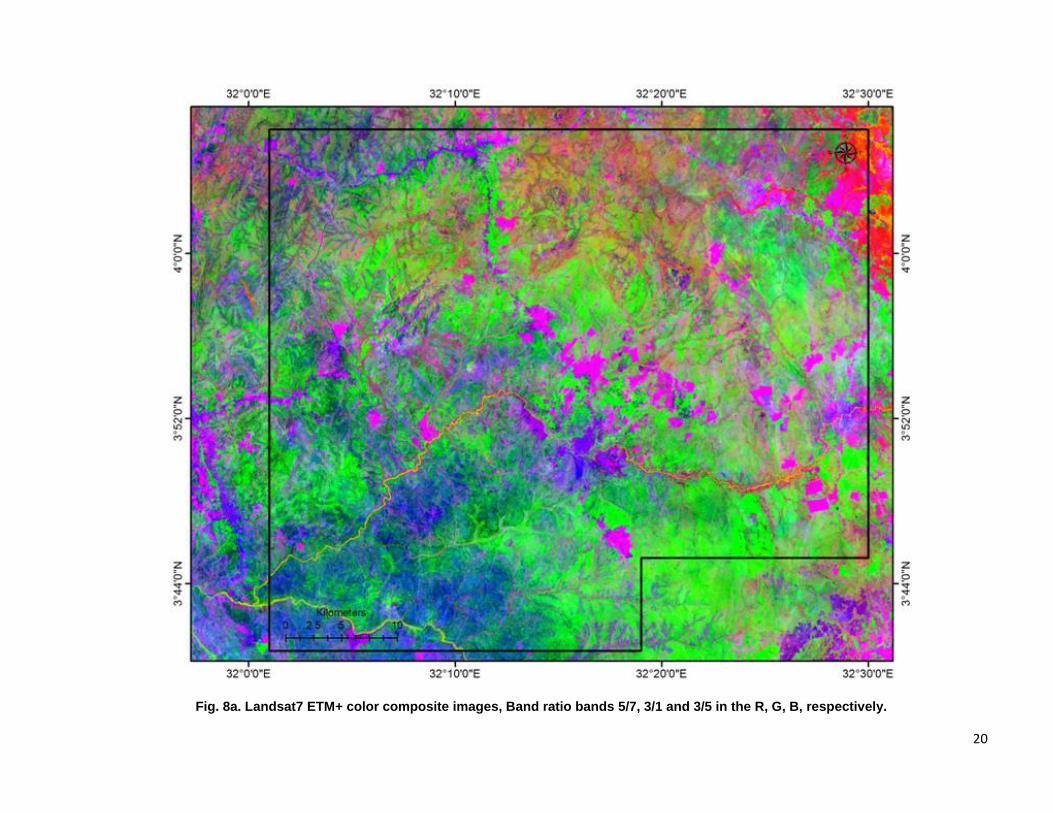
Fig. 8a. Landsat7 ETM+ color composite images, Band ratio bands 5/7, 3/1 and 3/5 in
the R, G, B, respectively.
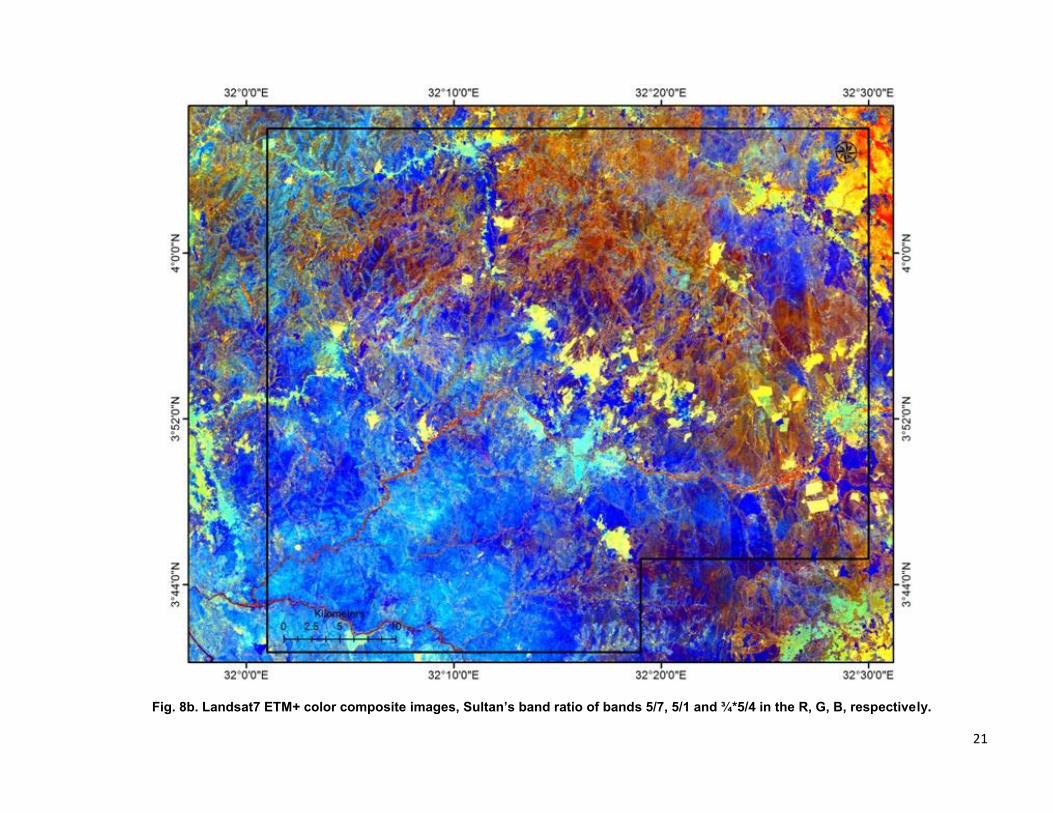
Fig. 8b. Landsat7 ETM+ color composite images, Sultan’s band ratio of bands 5/7, 5/1
and ¾*5/4 in the R, G, B
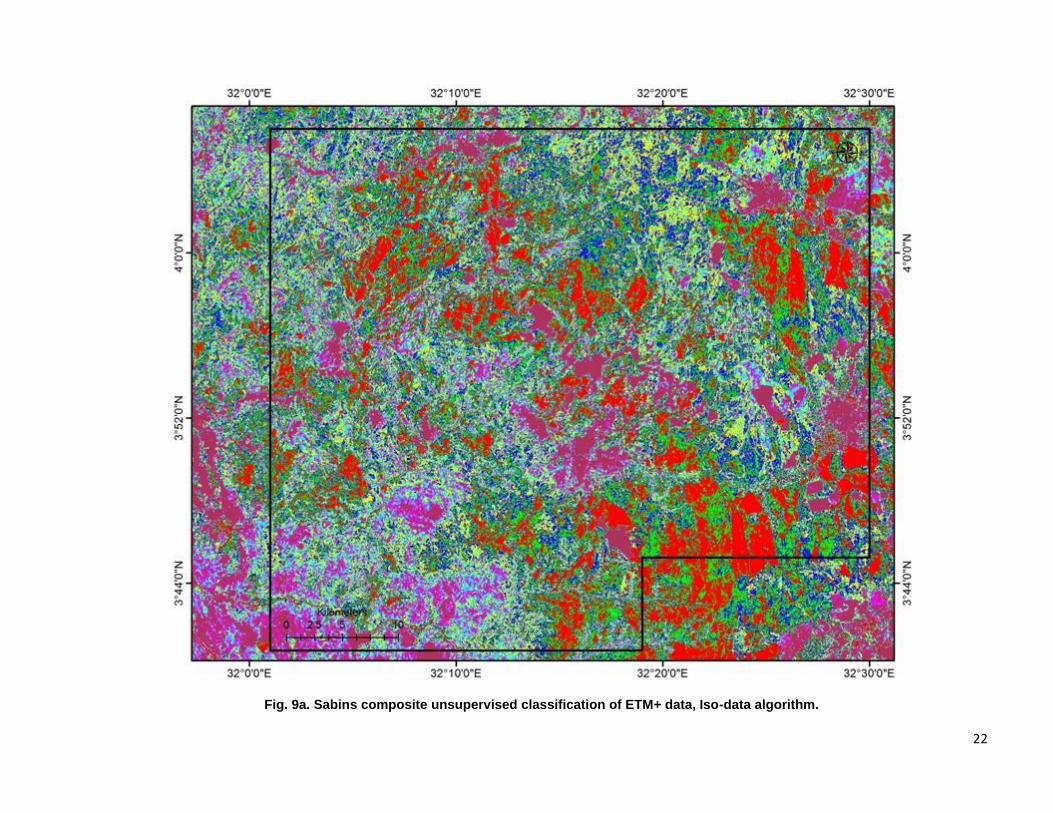
Fig. 9a. Sabins composite unsupervised classification of ETM+ data, Iso-data algorithm.
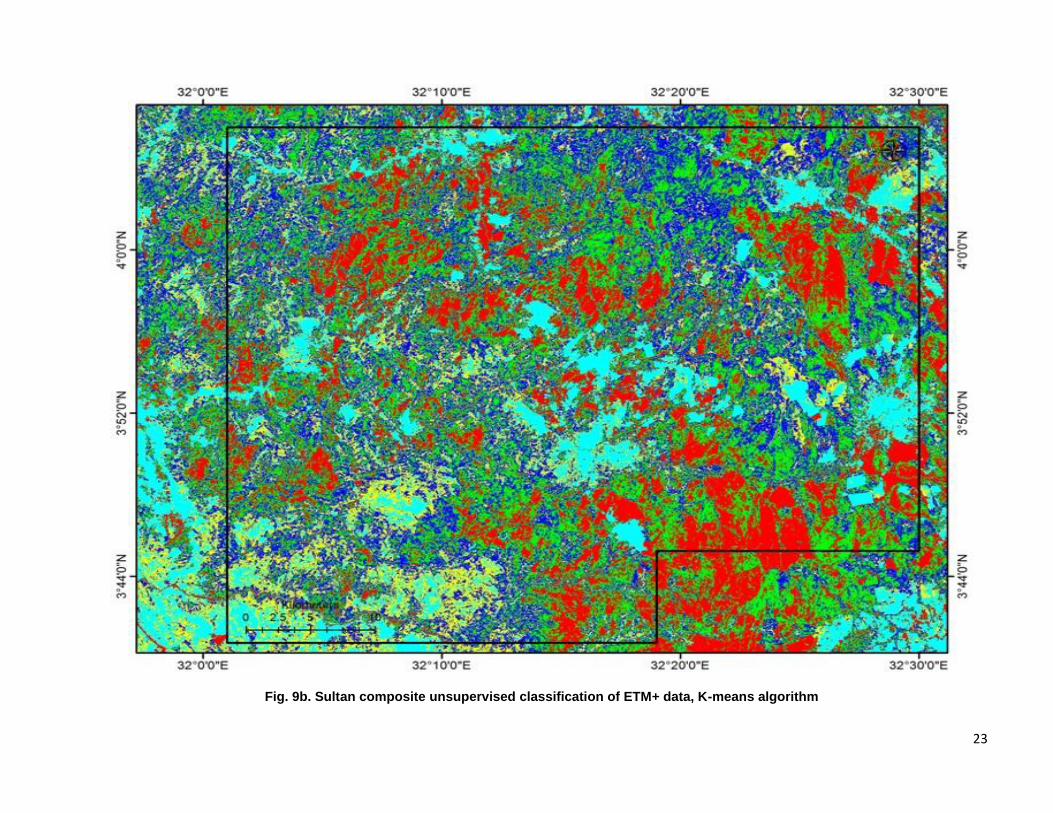
Fig. 9b. Sultan composite unsupervised classification of ETM+ data, K-means algorithm
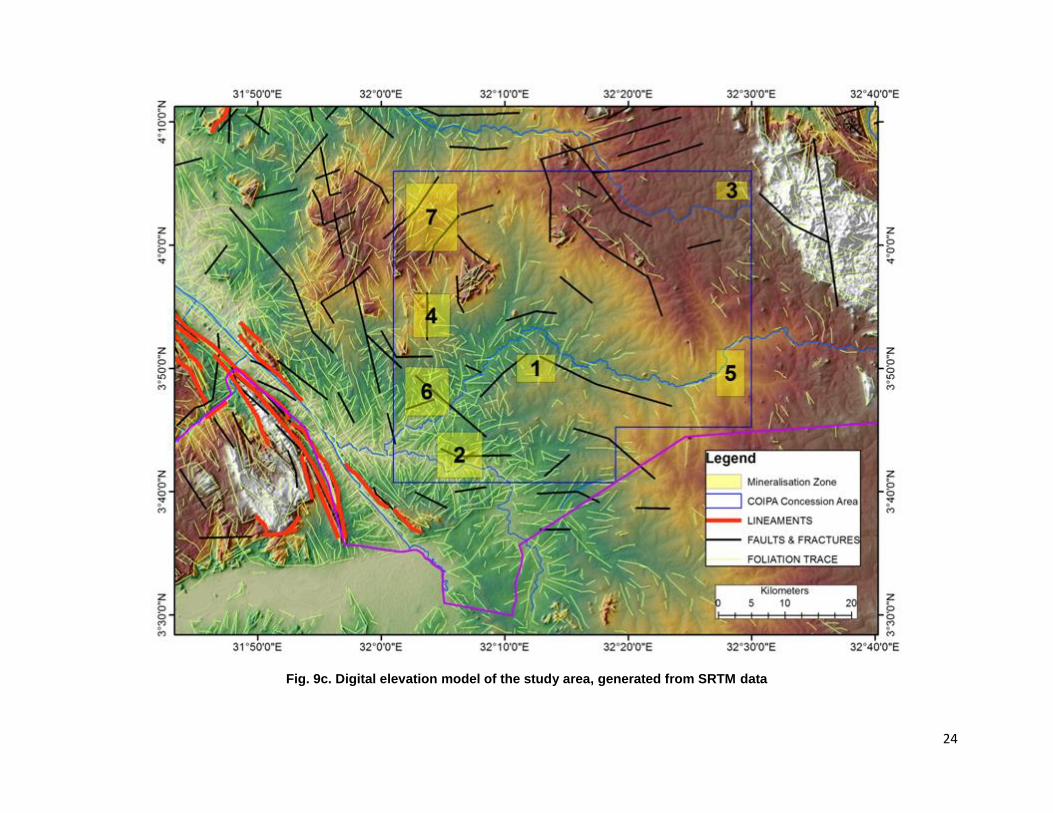
Fig. 9c. Digital elevation model of the study area, generated from SRTM data
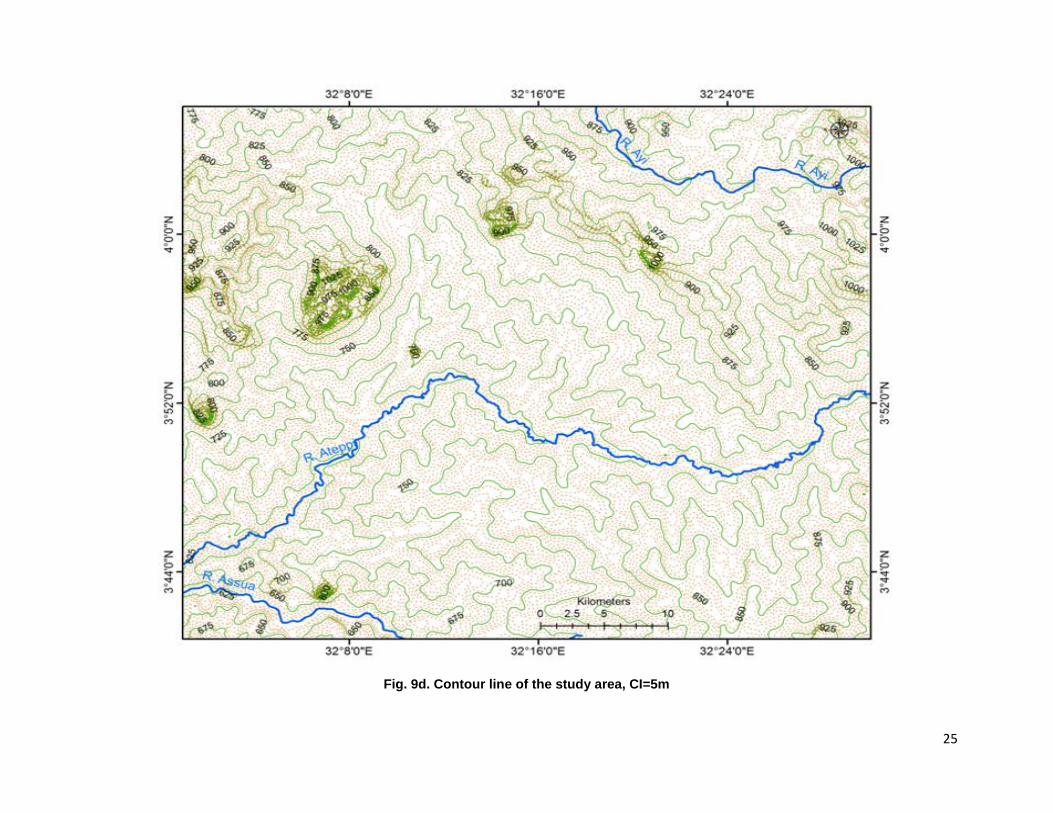
Fig. 9d. Contour line of the study area, CI=5m
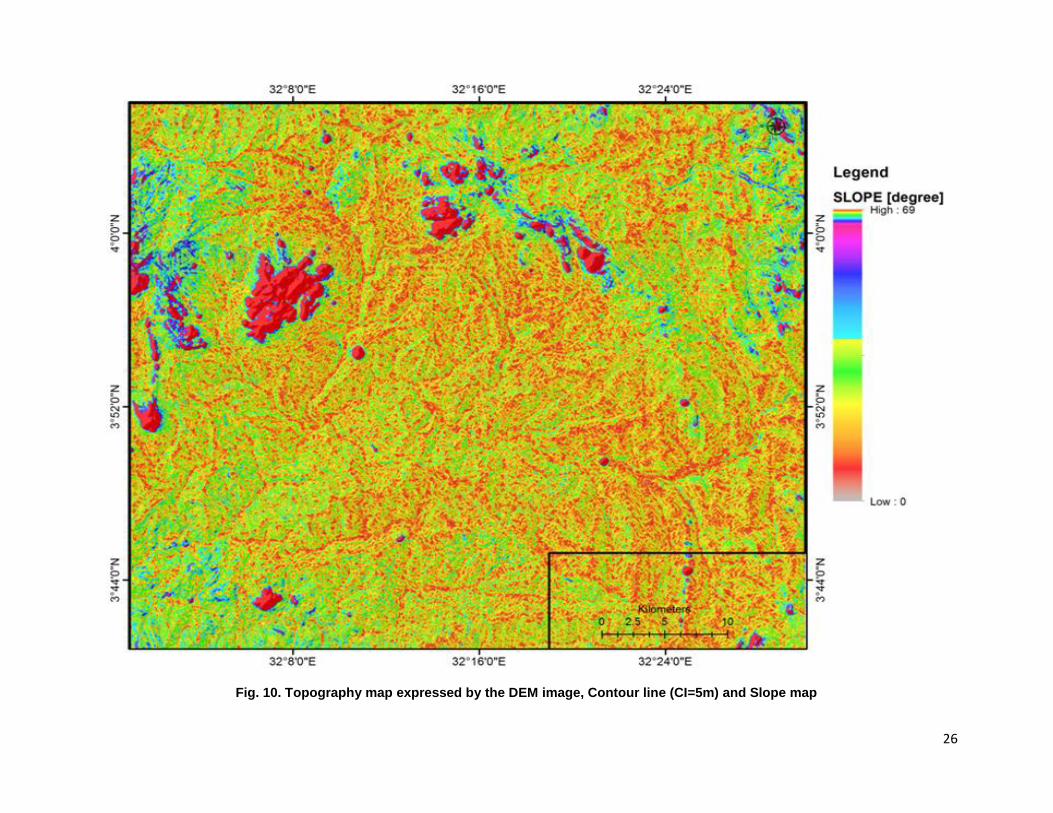
Fig. 10. Topography map by the DEM image, Contour line (CI=5m) and Slope map
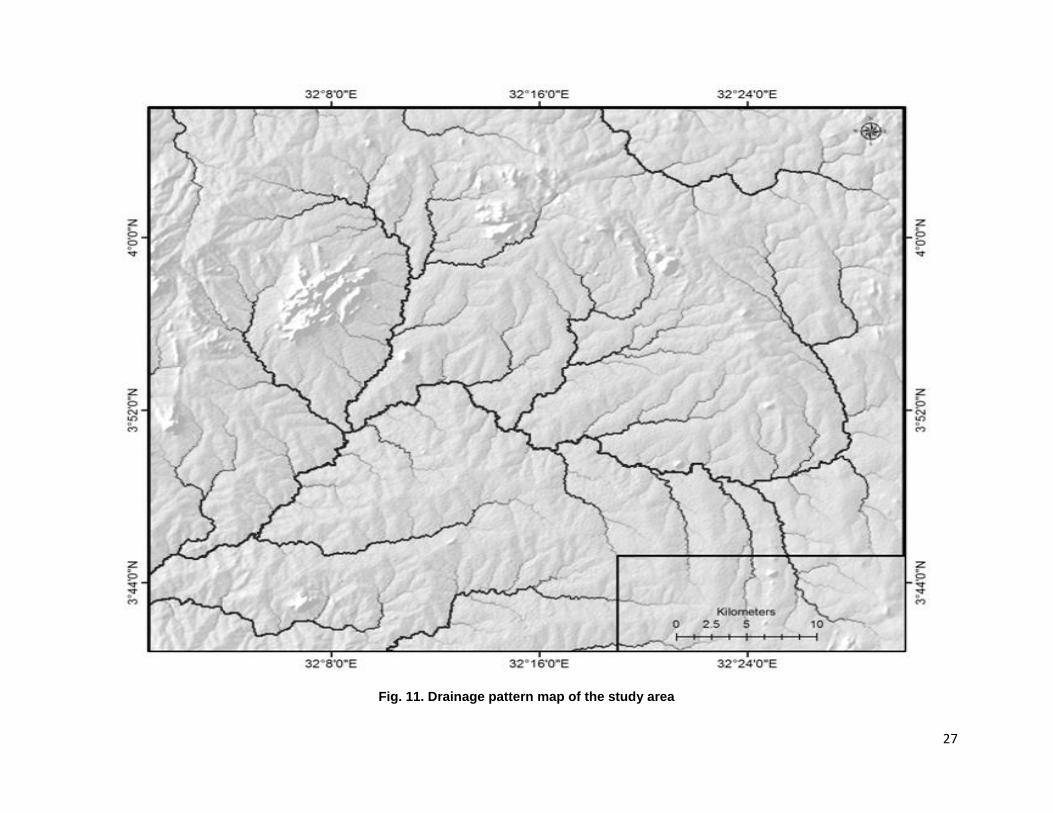
Fig. 11. Drainage pattern map of the study area
Fig. 11a. Lineaments and foliation trace of the study area
Fig. 12. Lineaments map and rose diagram of the study area
Fig. 13 Tectonic and geological setting of Sudan and South Sudan
Fig. 14. Geology and main mineralised belts of Sudan and South Sudan
Fig. 15. Geological and structural map of the study area (modified after GRAS, 2004.
Fig. 15a. Geological and structural map of EL 17 (modified after GRAS, 2004. Details
need to be checked by field work)
Fig. 16a. Density sliced F-Image
Fig. 16b. Density sliced H-Image
Fig. 17a. Satellite image mineral prospecting work (Mineral Composite)
Fig. 17b. Satellite image mineral prospecting work (Crosta Color Composite)
Fig. 17c. Satellite image mineral prospecting work (Crosta Density Sliced)
Fig. 18. Prospective mineralised zones located by remote sensing analysis
4
1. INTRODUCTION
In January 2016, COIPA International has been awarded by the Ministry of Mining of the
Republic of South Sudan the Exploration Licence 17 located in the southern part of the
country near the border with Uganda and in proximity of the town Nimule. According to
the work programme presented to the Ministry of Mining, the company has completed
this satellite study with the objective to identify the prospective areas and to proceed to
the field work and sampling in order to finalise the geochemical study.
The gold and associated minerals are common all over Aswa Shear Zone (ASZ) in the
Eastern Equatoria State and occurs in altered zones quartz vents form as a member of the
basement complex rocks. The study area is situated within the COIPA exploration area
EL 17, extending from a latitude position approximately between Juba and southwards
towards the Uganda border.
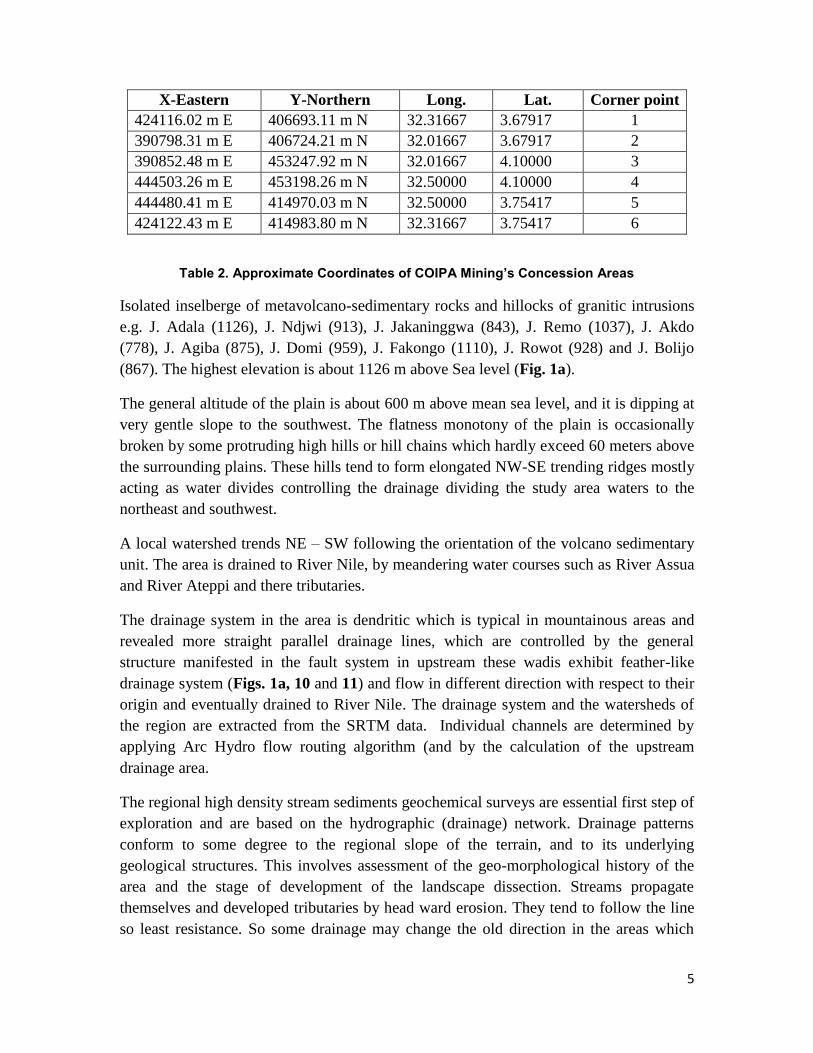
This report represents the preliminary geological findings (Phase I) from the remote
sensing study on COIPA exploration licence in South Sudan. The area under
consideration is about 2,328 km2 approximately (Fig. 1). Nimule and Torit are the main
towns in the area and the national highway between Juba and Nimule represents the main
accessible paved road to the area, which extends into the exploration licence. Within the
area, transportation is accessible by paved and dirt motor track roads (Fig. 1). The
distances between the main towns to the COIPA exploration licence (center of block) are
shown in Table 1.
Long. Lat. Town Distance from
COIPA EL 17 (km)
Direction from
COIPA EL 17
32.061505° 3.595927° Nimule 38 NE
31.580575° 4.841452° Juba 120 SE
32.568595° 4.413927° Torit 64 SW
32.290041° 4.133606° Magwi 25 S
31.659356° 3.850244° Kajo Keji 62 W
Table 1. Coordinates and distances of the main towns around the EL 17
COIPA EL 17 is defined by the following approximate geographic coordinates at their
corner points (Table 2).
The area is generally spectacular landscape rugged topography, hilly and ridges in and a
flat plain with a thick black cotton soil cover the project area. Meta-volcano sedimentary
units constitute discontinuous ridges, but the most topographically uprising features are
the granitic intrusion bodies, which are elongated in NE – SW directions
5
X-Eastern Y-Northern Long. Lat. Corner point
424116.02 m E 406693.11 m N 32.31667 3.67917 1
390798.31 m E 406724.21 m N 32.01667 3.67917 2
390852.48 m E 453247.92 m N 32.01667 4.10000 3
444503.26 m E 453198.26 m N 32.50000 4.10000 4
444480.41 m E 414970.03 m N 32.50000 3.75417 5
424122.43 m E 414983.80 m N 32.31667 3.75417 6
Table 2. Approximate Coordinates of COIPA Mining’s Concession Areas
Isolated inselberge of metavolcano-sedimentary rocks and hillocks of granitic intrusions
e.g. J. Adala (1126), J. Ndjwi (913), J. Jakaninggwa (843), J. Remo (1037), J. Akdo
(778), J. Agiba (875), J. Domi (959), J. Fakongo (1110), J. Rowot (928) and J. Bolijo
(867). The highest elevation is about 1126 m above Sea level (Fig. 1a).
The general altitude of the plain is about 600 m above mean sea level, and it is dipping at
very gentle slope to the southwest. The flatness monotony of the plain is occasionally
broken by some protruding high hills or hill chains which hardly exceed 60 meters above
the surrounding plains. These hills tend to form elongated NW-SE trending ridges mostly
acting as water divides controlling the drainage dividing the study area waters to the
northeast and southwest.
A local watershed trends NE – SW following the orientation of the volcano sedimentary
unit. The area is drained to River Nile, by meandering water courses such as River Assua
and River Ateppi and there tributaries.
The drainage system in the area is dendritic which is typical in mountainous areas and
revealed more straight parallel drainage lines, which are controlled by the general
structure manifested in the fault system in upstream these wadis exhibit feather-like
drainage system (Figs. 1a, 10 and 11) and flow in different direction with respect to their
origin and eventually drained to River Nile. The drainage system and the watersheds of
the region are extracted from the SRTM data. Individual channels are determined by
applying Arc Hydro flow routing algorithm (and by the calculation of the upstream
drainage area.
The regional high density stream sediments geochemical surveys are essential first step of
exploration and are based on the hydrographic (drainage) network. Drainage patterns
conform to some degree to the regional slope of the terrain, and to its underlying
geological structures. This involves assessment of the geo-morphological history of the
area and the stage of development of the landscape dissection. Streams propagate
themselves and developed tributaries by head ward erosion. They tend to follow the line
so least resistance. So some drainage may change the old direction in the areas which
6
have a frequent extensive heavy rainfall. The shapes of valleys in cross sections can be
important criteria identifying underlying lithologies. Similarly, the drainage density can
play an important discriminatory role. However, both are strongly affected by climate.
Surprising, drainage density in an arid area on any particular rock type is usually greater
than on developed under humid conditions.
Fig. 1a. Location of the study area, Google Earth’s image
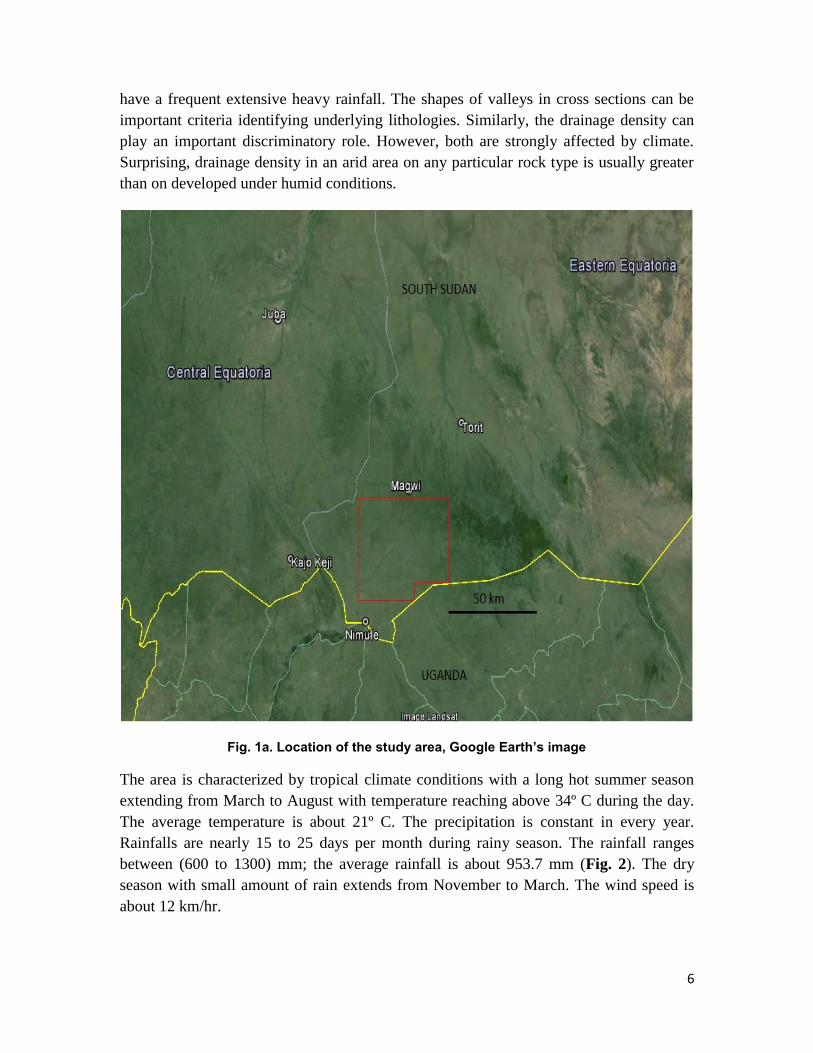
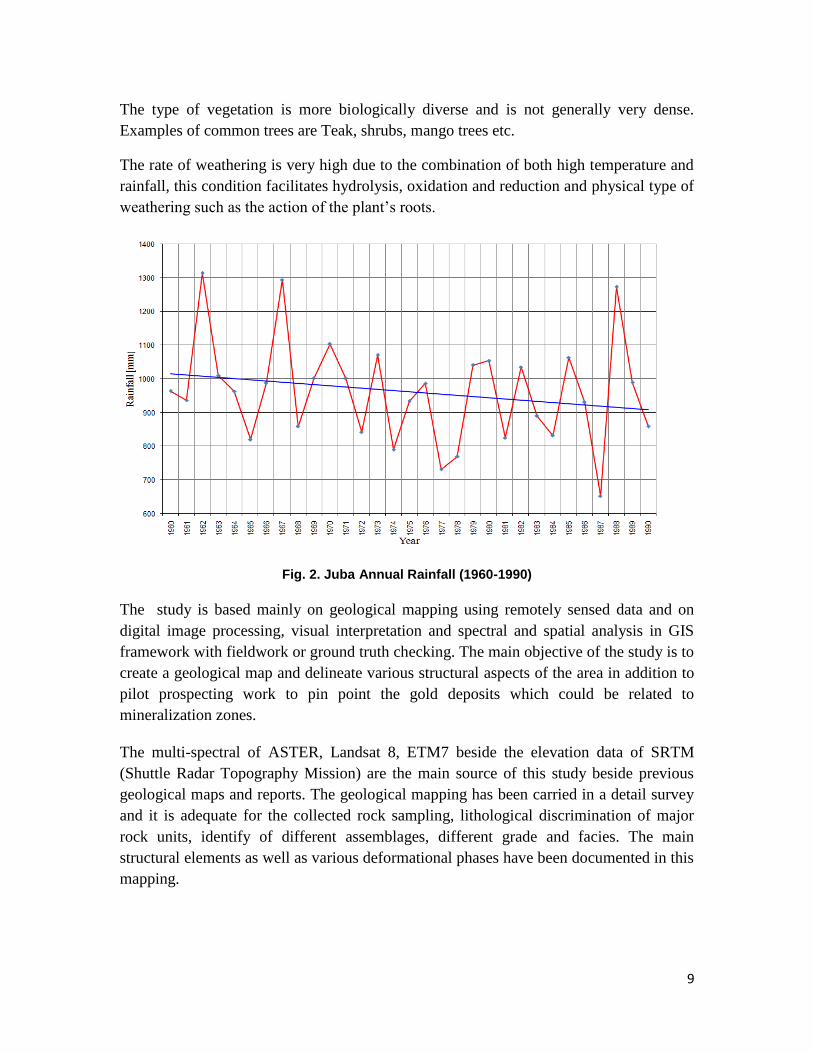
The area is characterized by tropical climate conditions with a long hot summer season
extending from March to August with temperature reaching above 34º C during the day.
The average temperature is about 21º C. The precipitation is constant in every year.
Rainfalls are nearly 15 to 25 days per month during rainy season. The rainfall ranges
between (600 to 1300) mm; the average rainfall is about 953.7 mm (Fig. 2). The dry
season with small amount of rain extends from November to March. The wind speed is
about 12 km/hr.
7
Fig. 1b. Location of the study area, Sudan geological map & ETM7
8
Fig. 1c. Location of the study area, a topo-sheet map (1:250,000)
9
The type of vegetation is more biologically diverse and is not generally very dense.
Examples of common trees are Teak, shrubs, mango trees etc.
The rate of weathering is very high due to the combination of both high temperature and
rainfall, this condition facilitates hydrolysis, oxidation and reduction and physical type of
weathering such as the action of the plant’s roots.
Fig. 2. Juba Annual Rainfall (1960-1990)
The study is based mainly on geological mapping using remotely sensed data and on
digital image processing, visual interpretation and spectral and spatial analysis in GIS
framework with fieldwork or ground truth checking. The main objective of the study is to
create a geological map and delineate various structural aspects of the area in addition to
pilot prospecting work to pin point the gold deposits which could be related to
mineralization zones.
The multi-spectral of ASTER, Landsat 8, ETM7 beside the elevation data of SRTM
(Shuttle Radar Topography Mission) are the main source of this study beside previous
geological maps and reports. The geological mapping has been carried in a detail survey
and it is adequate for the collected rock sampling, lithological discrimination of major
rock units, identify of different assemblages, different grade and facies. The main
structural elements as well as various deformational phases have been documented in this
mapping.
10
2. DATA BASE AND PRE-PROCESSING
As part of this study, archived records of the geology and mineralisation of the South
Sudan have been interrogated and inspected from the following sources:
Fugro Robertson-World Bank sponsored 1:1 million scale geological maps of the
Sudan published in 1988;
GRAS-generalised geological maps of the Sudan and some individual technical
papers on the areas close to the study area.
Whiteman (1971) summarized brief descriptions of the igneous and metamorphic
rocks at selected localities. Much of geological investigations in the country were
generally done by correlation and extrapolation with the geology of the
neighbouring countries.
For instance, in 1974, Professor Vail of the University of Khartoum prepared a
geological map of Sudan using all available information, and extrapolating data
from adjacent countries. The project area had received little detailed study by the
students of the department of geology and mining, University of Juba.
Limited systematic work was carried out in the central and parts of eastern
equatorial region. For example, Geologists from University of Khartoum studied
the gold occurrences in the Luri River basin and Kapoeta district. They also made
observations on the geology along the roads between Juba, Yei and Mundri
(Eyobo, 1973, Badri El Din).
Hunting Geology between 1976 and 1980 contracted by the regional government
of then Southern region conducted study aim at evaluating mineral resources that
includes metallic, radioactive and industrial minerals of the Juba area, and they
produced a 1:250,000 scale geological map of the project area.
In 1986-1997, Legge published his findings on copper mineralization in Eastern
Equatoria, and the importance of Aswa shear lineament. He also described the
geology of the area as covered by basement of rocks invaded by Precambrian
intrusion.
3. REMOTE SENSING INVESTIGATION
Two ASTER (Advanced Space borne Thermal Emission Radiometer) scenes were
acquired to cover the licensed area of original interest (AOI) however, following the
subsequent reduction in the AOI (Fig. 3), these images have been used for
interpretational purposes.
ASTER was launched on the Terra satellite in 1999 which was a joint mission between
NASA and the Japanese government (Fig. 3). The satellite carries three instruments for
the ASTER mission and these acquire data in the VNIR (visible near infrared), SWIR
(short-wave infrared) and the TIR (thermal infrared) parts of the electromagnetic
spectrum. ASTER has a number of benefits over Landsat, mainly because it has 14 as
11
opposed to 7 spectral channels and the near infra-red channels have 15m pixel size as
opposed to 30m for Landsat. Use of the ASTER data allows a wide range of band
combinations and ratio images can be generated to assist in the location of iron and
argillic alteration minerals which may be indicative of mineralised zones.
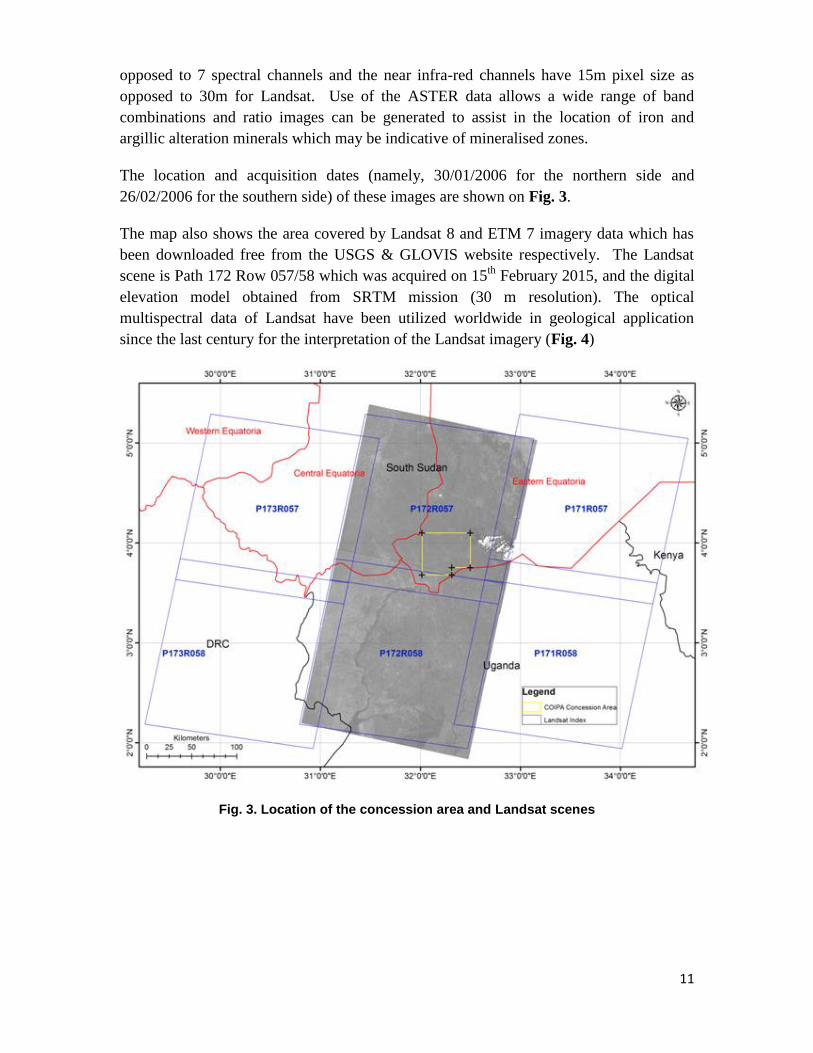
The location and acquisition dates (namely, 30/01/2006 for the northern side and
26/02/2006 for the southern side) of these images are shown on Fig. 3.
The map also shows the area covered by Landsat 8 and ETM 7 imagery data which has
been downloaded free from the USGS & GLOVIS website respectively. The Landsat
scene is Path 172 Row 057/58 which was acquired on 15th
February 2015, and the digital
elevation model obtained from SRTM mission (30 m resolution). The optical
multispectral data of Landsat have been utilized worldwide in geological application
since the last century for the interpretation of the Landsat imagery (Fig. 4)
Fig. 3. Location of the concession area and Landsat scenes
12
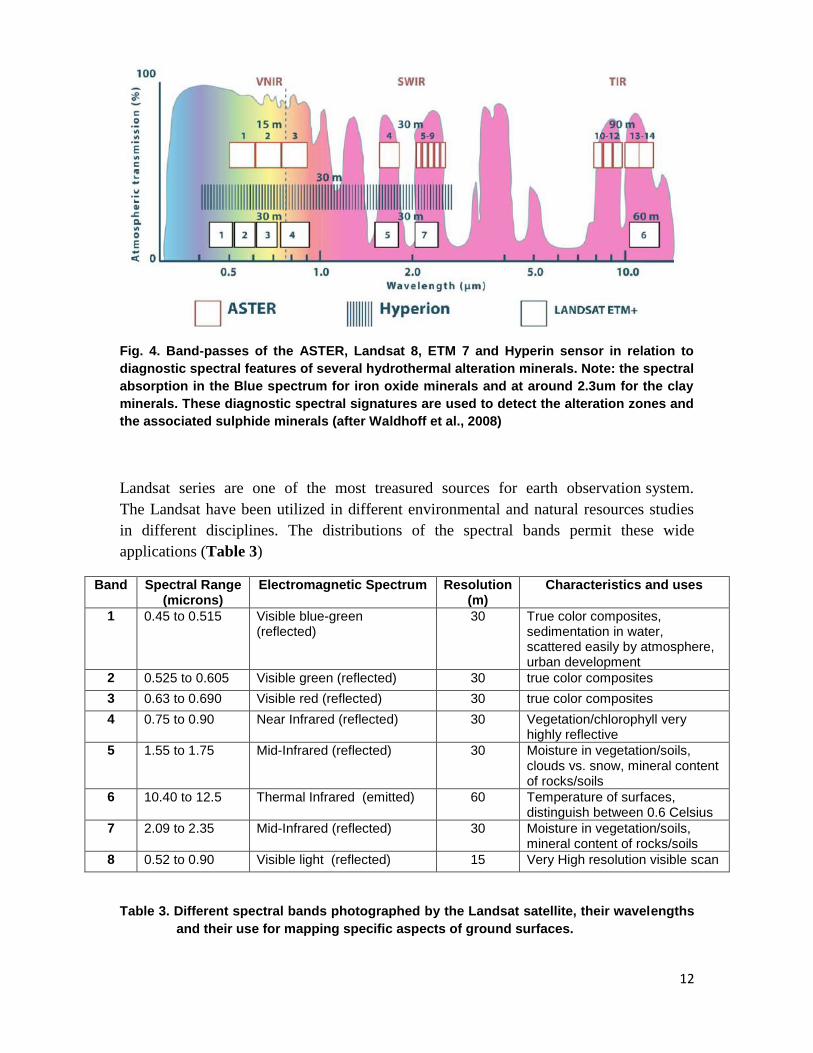
Fig. 4. Band-passes of the ASTER, Landsat 8, ETM 7 and Hyperin sensor in relation to
diagnostic spectral features of several hydrothermal alteration minerals. Note: the spectral
absorption in the Blue spectrum for iron oxide minerals and at around 2.3um for the clay
minerals. These diagnostic spectral signatures are used to detect the alteration zones and
the associated sulphide minerals (after Waldhoff et al., 2008)
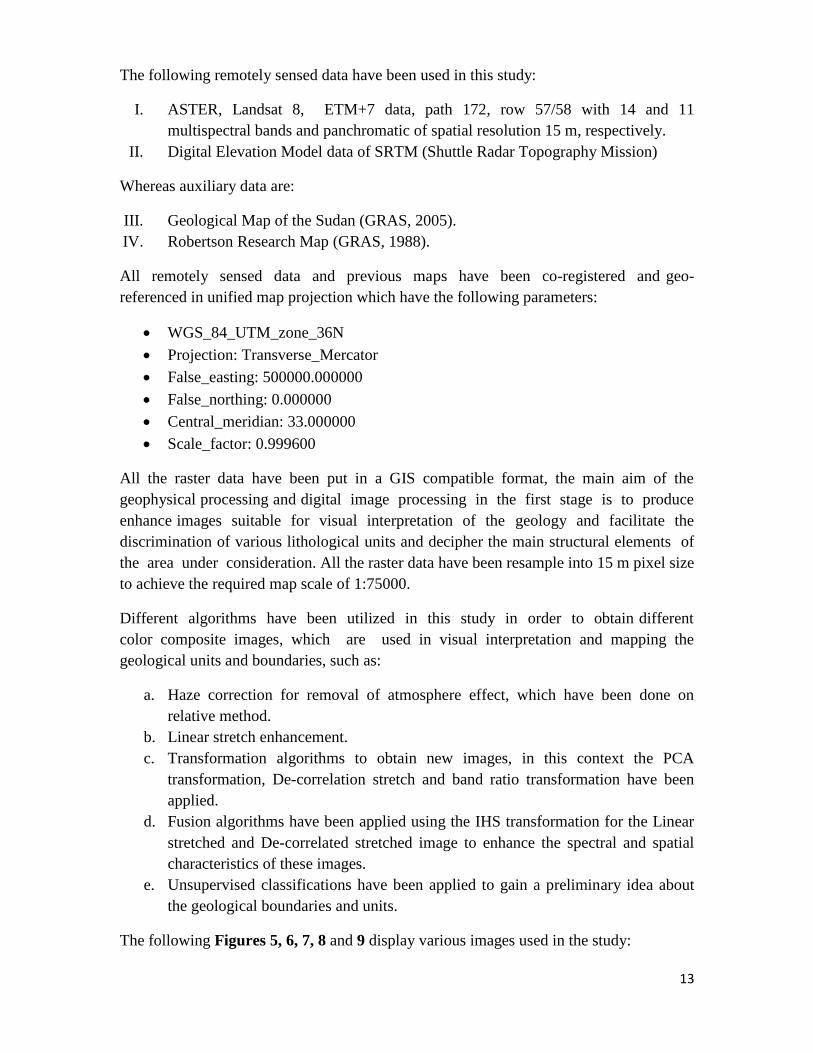
Landsat series are one of the most treasured sources for earth observation system.
The Landsat have been utilized in different environmental and natural resources studies
in different disciplines. The distributions of the spectral bands permit these wide
applications (Table 3)
Band Spectral Range (microns)
Electromagnetic Spectrum Resolution (m)
Characteristics and uses
1 0.45 to 0.515 Visible blue-green (reflected)
30 True color composites, sedimentation in water, scattered easily by atmosphere, urban development
2 0.525 to 0.605 Visible green (reflected) 30 true color composites
3 0.63 to 0.690 Visible red (reflected) 30 true color composites
4 0.75 to 0.90 Near Infrared (reflected) 30 Vegetation/chlorophyll very highly reflective
5 1.55 to 1.75 Mid-Infrared (reflected) 30 Moisture in vegetation/soils, clouds vs. snow, mineral content of rocks/soils
6 10.40 to 12.5 Thermal Infrared (emitted) 60 Temperature of surfaces, distinguish between 0.6 Celsius
7 2.09 to 2.35 Mid-Infrared (reflected) 30 Moisture in vegetation/soils, mineral content of rocks/soils
8 0.52 to 0.90 Visible light (reflected) 15 Very High resolution visible scan
Table 3. Different spectral bands photographed by the Landsat satellite, their wavelengths
and their use for mapping specific aspects of ground surfaces.
13
The following remotely sensed data have been used in this study:
I. ASTER, Landsat 8, ETM+7 data, path 172, row 57/58 with 14 and 11
multispectral bands and panchromatic of spatial resolution 15 m, respectively.
II. Digital Elevation Model data of SRTM (Shuttle Radar Topography Mission)
Whereas auxiliary data are:
III. Geological Map of the Sudan (GRAS, 2005).
IV. Robertson Research Map (GRAS, 1988).
All remotely sensed data and previous maps have been co-registered and geo-
referenced in unified map projection which have the following parameters:
WGS_84_UTM_zone_36N
Projection: Transverse_Mercator
False_easting: 500000.000000
False_northing: 0.000000
Central_meridian: 33.000000
Scale_factor: 0.999600
All the raster data have been put in a GIS compatible format, the main aim of the
geophysical processing and digital image processing in the first stage is to produce
enhance images suitable for visual interpretation of the geology and facilitate the
discrimination of various lithological units and decipher the main structural elements of
the area under consideration. All the raster data have been resample into 15 m pixel size
to achieve the required map scale of 1:75000.
Different algorithms have been utilized in this study in order to obtain different
color composite images, which are used in visual interpretation and mapping the
geological units and boundaries, such as:
a. Haze correction for removal of atmosphere effect, which have been done on
relative method.
b. Linear stretch enhancement.
c. Transformation algorithms to obtain new images, in this context the PCA
transformation, De-correlation stretch and band ratio transformation have been
applied.
d. Fusion algorithms have been applied using the IHS transformation for the Linear
stretched and De-correlated stretched image to enhance the spectral and spatial
characteristics of these images.
e. Unsupervised classifications have been applied to gain a preliminary idea about
the geological boundaries and units.
The following Figures 5, 6, 7, 8 and 9 display various images used in the study:
14
Satellite images have been utilized to digitize the lineaments and drainage of the under
consideration. Results are more or less conformable with the ones extracted from the
DEM (Digital elevation Model) image of the SRTM data and GDEM from ASTER
image. The digitized lineaments from satellite imagery have more than one trend;
major and minor trends can be structurally analyzed after field measurements.
Some topographic analysis was performed in this study. The present analysis focused
predominantly on understanding the drainage patterns of the region and their
connection to the topography as this will determine crucially the planning of future
geochemical and geophysical surveys. The results of the topographic analysis are
shown in Fig. 10.
The surface elevation range between 605 m and 1110 m, whereas the general topography
slopes towards the west. The region of highest surface elevation is located in the
northeastern part of the concession area. Topographic features like mountain ridges or
incised valleys are characterized in the DEM image by a strong brightness contrast that
is proportional to the topographic gradient and related to the direction of strike of the
feature relative to the direction of illumination. In all presented maps the topography is
illuminated by an azimuth angle of 300° and an altitude angle of 30°.
The drainage system revealed more straight parallel drainage lines, which are controlled
by the general structure manifested in the fault system in upstream these wadis exhibit
feather-like drainage system (Fig. 11). The drainage system and the watersheds of the
region are extracted from the SRTM data. Individual channels are determined by
applying Arc Hydro flow routing algorithm (and by the calculation of the upstream
drainage area.
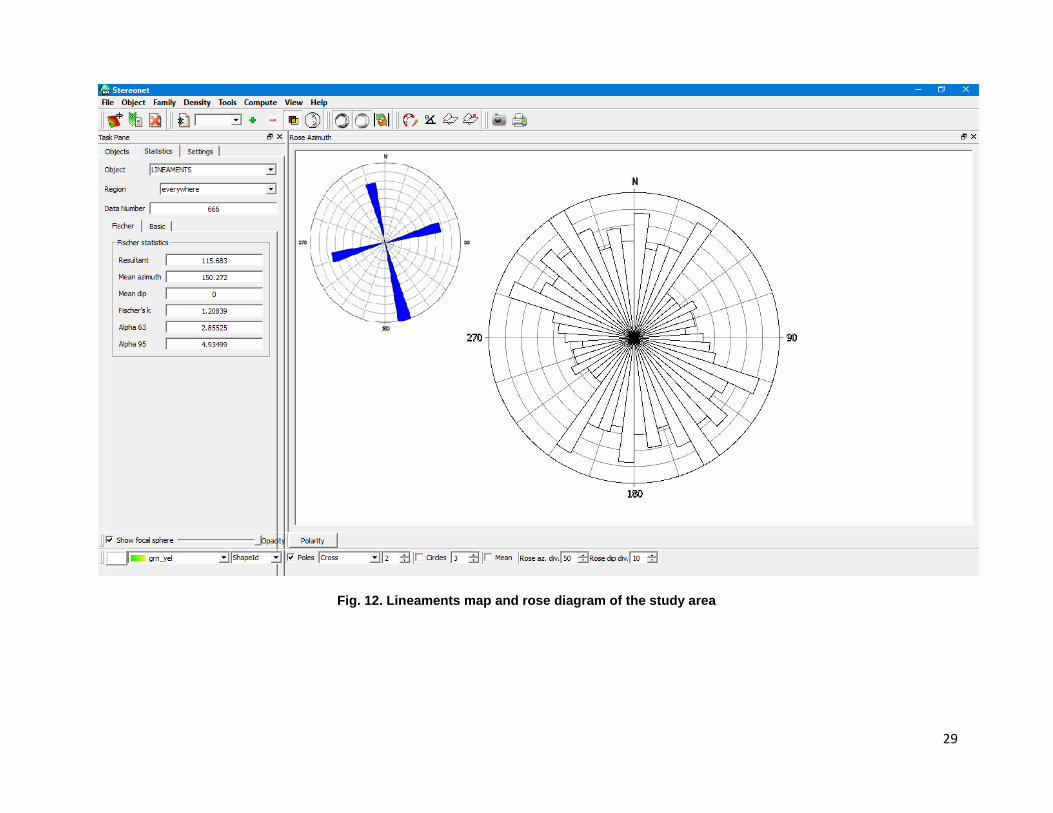
The lineaments generated from DEM using wavelet transform analysis and
skeletonization. This technique is completely automated and therefore much faster and
less subjective than traditional approaches to mapping lineaments. Preliminary results are
very encouraging and reveal lineament that are likely to be missed using traditional
lineament mapping techniques (Fig. 12).
15
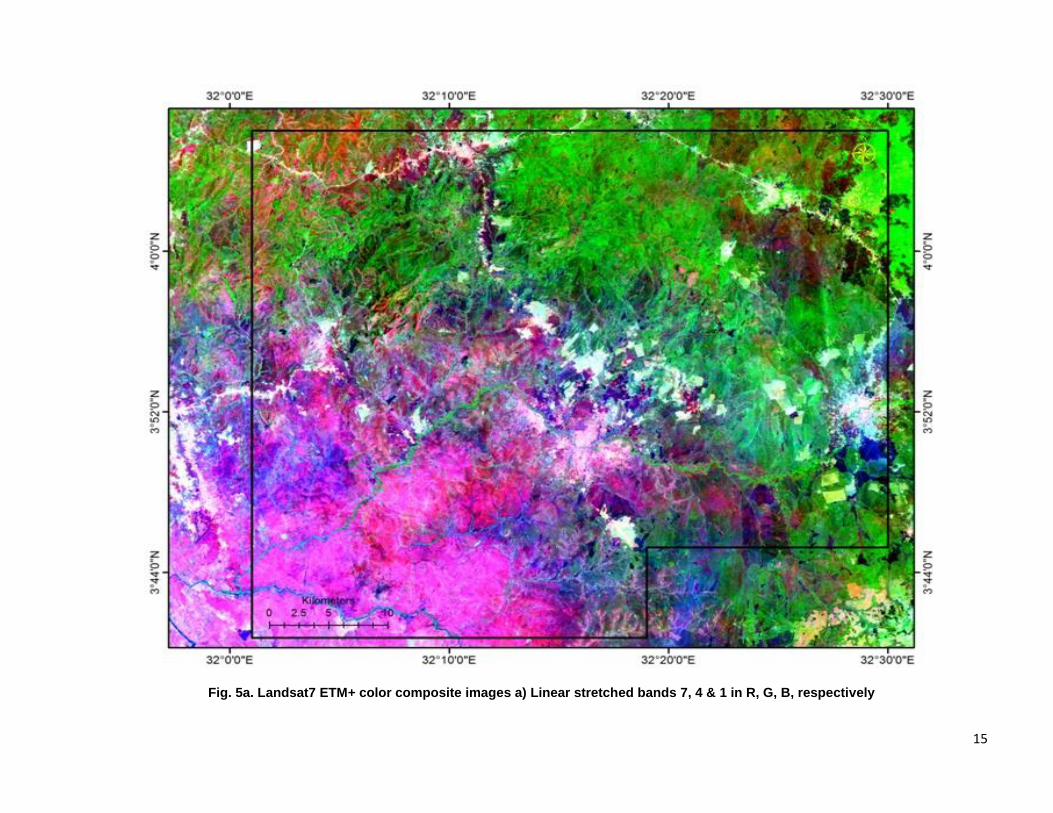
Fig. 5a. Landsat7 ETM+ color composite images a) Linear stretched bands 7, 4 & 1 in R, G, B, respectively
16
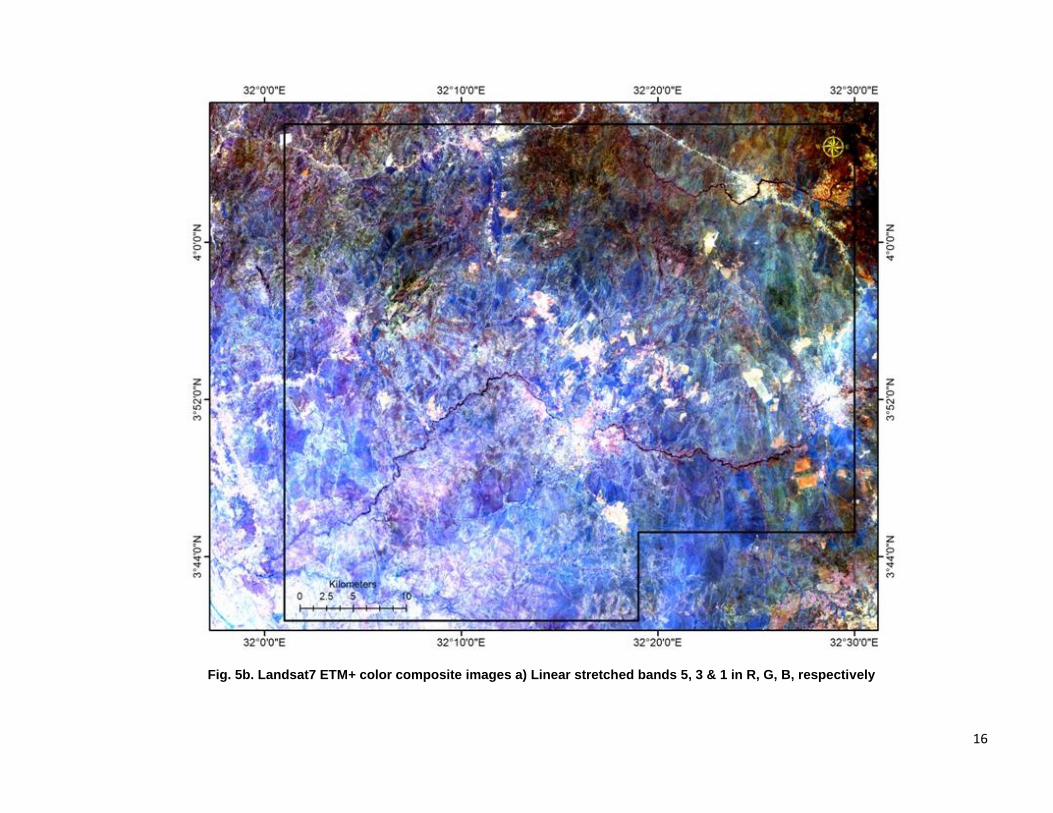
Fig. 5b. Landsat7 ETM+ color composite images a) Linear stretched bands 5, 3 & 1 in R, G, B, respectively
17
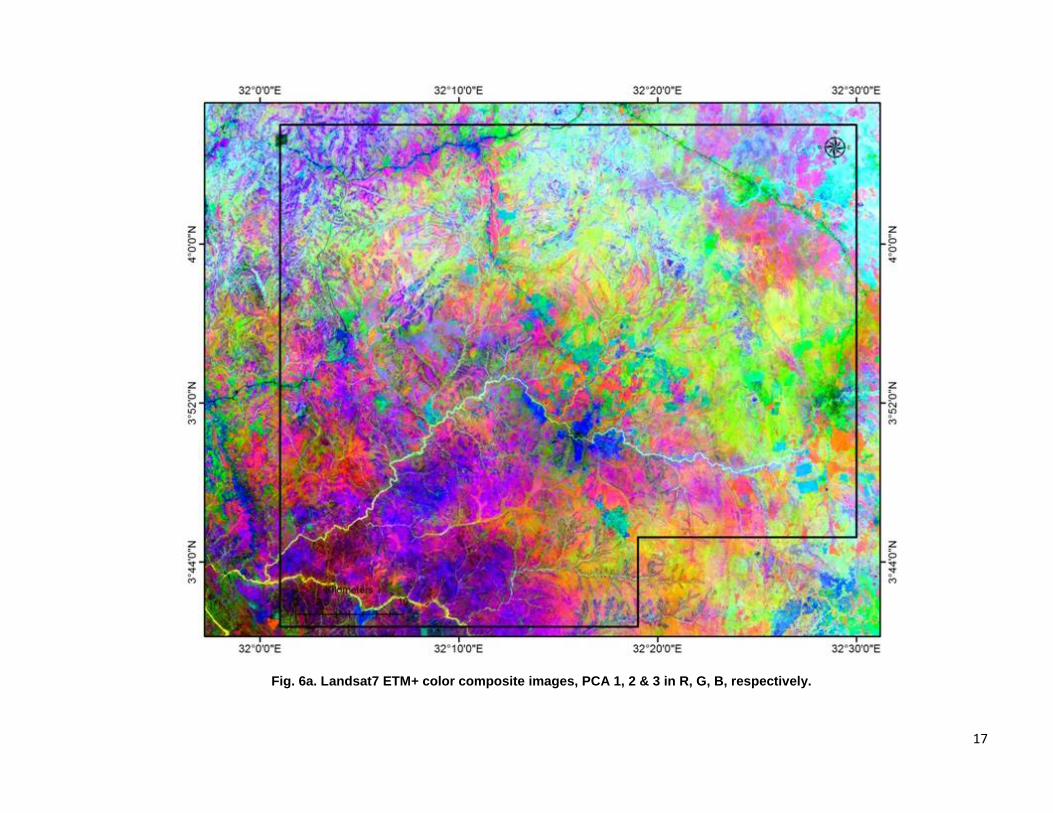
Fig. 6a. Landsat7 ETM+ color composite images, PCA 1, 2 & 3 in R, G, B, respectively.

18
Fig. 6b. Landsat7 ETM+ color composite images, PCA 2, 3 & 4 in R, G, B, respectively.
19
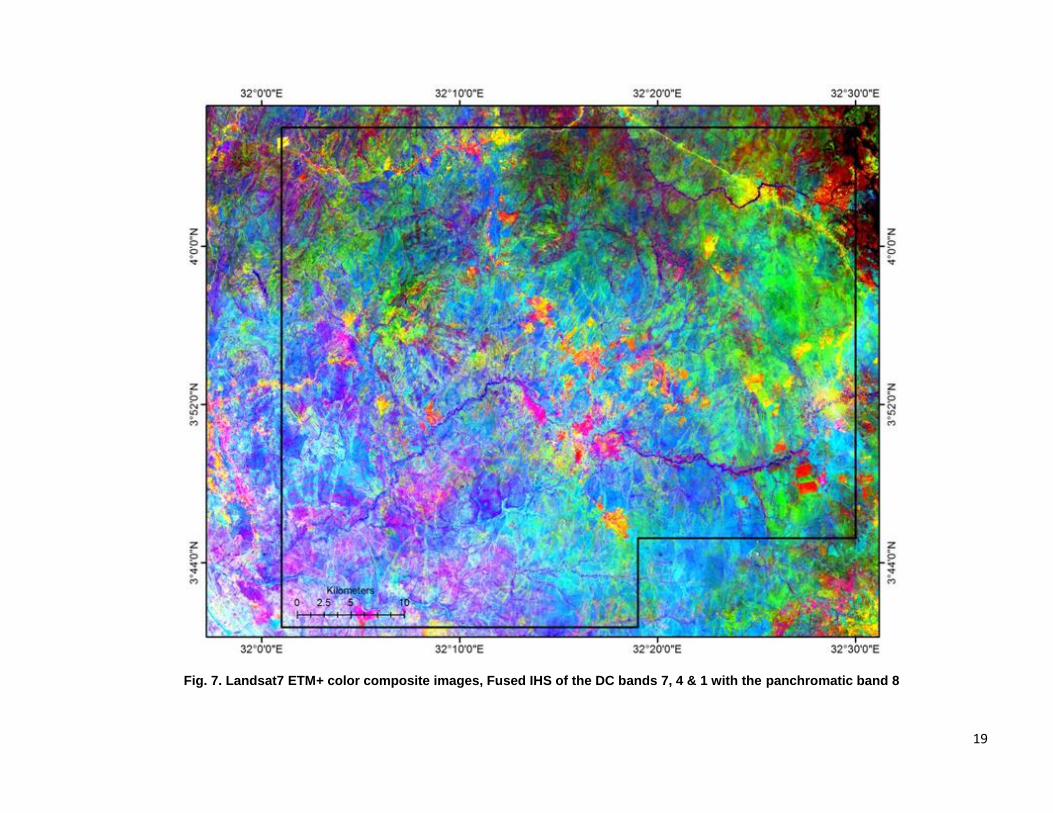
Fig. 7. Landsat7 ETM+ color composite images, Fused IHS of the DC bands 7, 4 & 1 with the panchromatic band 8
20
Fig. 8a. Landsat7 ETM+ color composite images, Band ratio bands 5/7, 3/1 and 3/5 in the R, G, B, respectively.
21
Fig. 8b. Landsat7 ETM+ color composite images, Sultan’s band ratio of bands 5/7, 5/1 and ¾*5/4 in the R, G, B, respectively.
22
Fig. 9a. Sabins composite unsupervised classification of ETM+ data, Iso-data algorithm.
23
Fig. 9b. Sultan composite unsupervised classification of ETM+ data, K-means algorithm
24
Fig. 9c. Digital elevation model of the study area, generated from SRTM data
25
Fig. 9d. Contour line of the study area, CI=5m
26
Fig. 10. Topography map expressed by the DEM image, Contour line (CI=5m) and Slope map
27
Fig. 11. Drainage pattern map of the study area
28
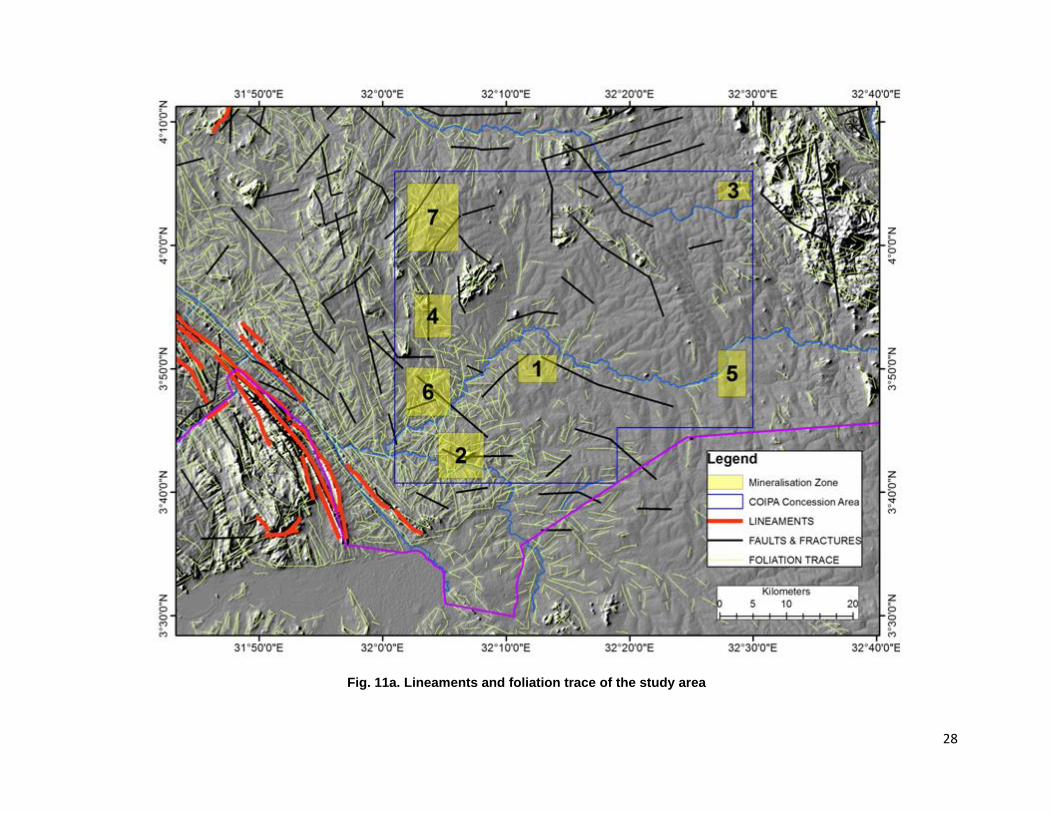
Fig. 11a. Lineaments and foliation trace of the study area
29
Fig. 12. Lineaments map and rose diagram of the study area
30
4. GEOLOGICAL AND STRUCTURAL SETTING
4.1. GEOLOGICAL SETTING
The study area falls in a Precambrian shield underlain by metamorphic rocks compose
dominantly of gneisses and granitic rocks that are of medium to high grade
metamorphism. They were deformed during end-Precambrian Pan African orogenic event
(Fig. 13).
During the Palaeozoic era, the basement Complex was intruded by granitoids of post
tectonic era. They comprise of two granitic composition exposures at Jebel Kuruk and
Kunufi along with the nepheline syenite of Jebel Narkenyi (Lado) and Jebel Bilinyang.
During Tertiary the area was subjected to tensional tectonics that opened EW fractures
which were subsequently filled by doleritic dike cutting both the basement and the major
intrusions in the area.
According to Hunting 1980, the basement under when four tectono-thermal activities.
They include Watian 2.88 Ga, Aruan, Mirian and Chuan recognised in the neighboring
Uganda. The area South and South West of Juba is underlain by Archean and Proterozoic
rocks. The basement complex here include: - the Watian which is the oldest Archean
tecto-thermal events recognised in Uganda and dated at 2.88 billion years ago. It is
recognised in Imatong Mountain area and characterised by massive unfoliated
Charnokites rocks forming mass of the upland area, there are extensive fractures. They
can also be found South of Lainya as small inliers of Charnokitic rocks.
Aruan: the younger Archean event recognised in North Uganda. It includes the Nile
gneiss West of Imatong Mountain and east of the Juba-Nimule road. Here the Nile
gneisses are composed principally of gneisses of amphibolites facies with subordinate
metasediments and amphibolite. Foliation trends are poorly defined but generally in
Northerly direction.
Miran: recognized in the banded gneisses between Yei and Lainya. This trend can be
traced to the east-northeast through the Madi meta-sediments and across the Aswa Shear
Zone towards Juba.
Chuan: Identified in South Sudan and in Uganda is represented by a series of refoliation
zones similar in photo geological expression and age and to the Mozambiquan but with
more north-westerly trend. The best established evidence is the Aswa Shear Zone,
trending from the upper reaches of the River Assua in Uganda, along the line of the Nile
from Nimule towards Juba and Continuing as far as Mvolo.
31
From Palaeozoic to present, South Sudan underwent to uplift and erosion during
Palaeozoic period as there is no evidence of sedimentation during that period. The
basement rocks were intruded by post tectonic bodies such as Jebel Luri, Jebel Kerek,
etc.
The laterisation and tilting of the land took place during the Tertiary. The area to the
South was uplifted and eroded whereas to the north of Juba the Umm Rwaba sediments
accumulation in the Sudd Region. Evidence of tilting and more extensive laterite cover
can be seen in the high level remnants of laterite found in the Koda watershed where it
has been elevated to approximately 600 meters above the present level of Juba.
Cycles of physical and chemical weathering have been occurring. The products of
weathering include silici-clastic fragments, sands and other unconsolidated materials.
These unconsolidated materials are being deposited into area north of Juba and into the
River Nile. The area north of Juba marks the periphery that lead to Umm Rwaba
Formation toward northern part of the country.
South Sudan is underlain by metamorphic and granitic rocks belonging to the northern
portion of the Tanganyika Craton bordered by gneissic rocks of heterogeneous Sudan that
were deformed during end-Precambrian Pan African orogenic event (Hunting 1980).
However, the Southern and North-western regions of the South Sudan are mainly
underlain by Archean and Proterozoic rocks which are generally of medium to high
metamorphic grades.
The Madi Sequence
The Madi rock Sequence was recognised by Berry and Whiteman in 1968 and by
HUNTING Geology in 1976. The Madi Sequence was originally described in northern
Uganda (Mathews, 1952, Hepworth and Macdonald, 1966), in the Abu Satta Hills and to
the northwest of Ragor along the boundary with the Central African Republic.
The Madi Sequence of northern Uganda continues into southern Sudan and is exposed on
the Juba - Yei road about 53 km southwest of Nimule. The Madi Sequence consists of
muscovite quartzites interbanded with muscovite schists, quartz-feldspar-biotite-
hornblende gneisses and amphibolites. The Madi Sequence originated as a succession of
arenaceous and argillaceous clastic sediments with minor calcareous beds and probably
with some volcanic rocks. Deposition age predates the Miriam and Chuan deformations,
but probably postdates Aruan (HUNTING, 1975).
Karasuk Group (Miriam Group, Hepworth, 1967)
The term Karasuk Group was used in East Africa by Macdonald (1961), Almond (1969)
and applied to the Mozambique Belt of Eastern Africa (Holmes, 1951). The Karasuk
Group of the Precambrian basement rocks occupies a broad area covering the eastern
32
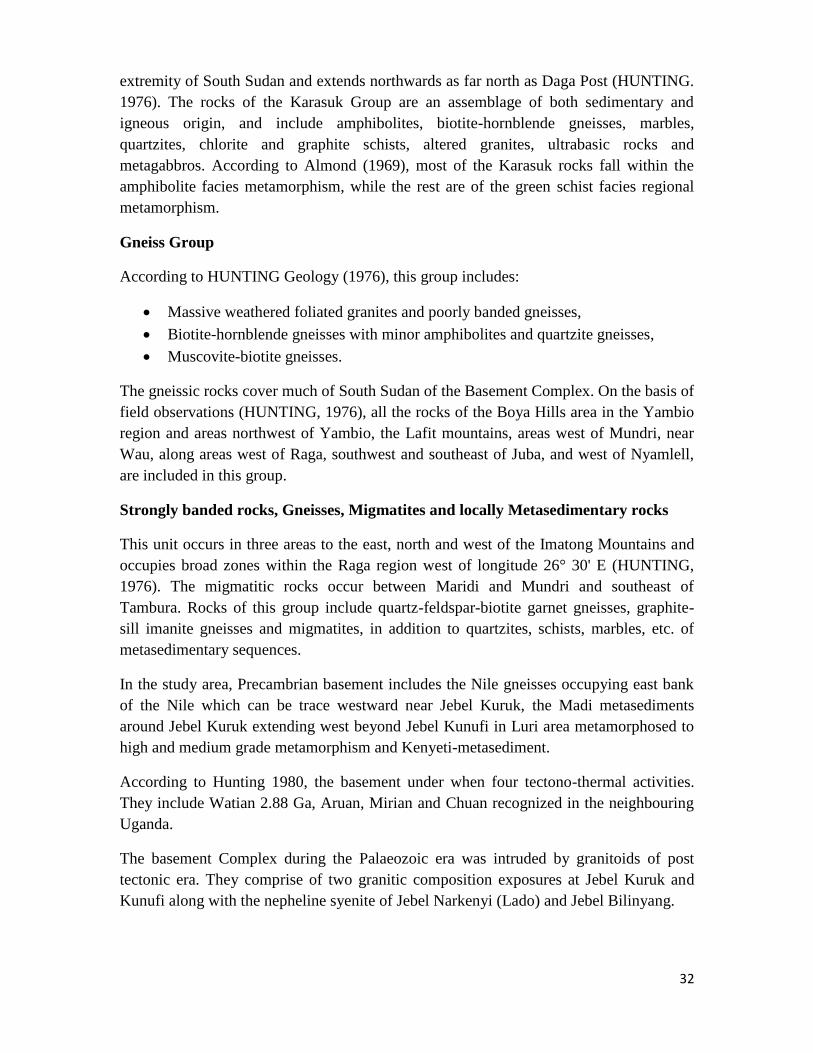
extremity of South Sudan and extends northwards as far north as Daga Post (HUNTING.
1976). The rocks of the Karasuk Group are an assemblage of both sedimentary and
igneous origin, and include amphibolites, biotite-hornblende gneisses, marbles,
quartzites, chlorite and graphite schists, altered granites, ultrabasic rocks and
metagabbros. According to Almond (1969), most of the Karasuk rocks fall within the
amphibolite facies metamorphism, while the rest are of the green schist facies regional
metamorphism.
Gneiss Group
According to HUNTING Geology (1976), this group includes:
Massive weathered foliated granites and poorly banded gneisses,
Biotite-hornblende gneisses with minor amphibolites and quartzite gneisses,
Muscovite-biotite gneisses.
The gneissic rocks cover much of South Sudan of the Basement Complex. On the basis of
field observations (HUNTING, 1976), all the rocks of the Boya Hills area in the Yambio
region and areas northwest of Yambio, the Lafit mountains, areas west of Mundri, near
Wau, along areas west of Raga, southwest and southeast of Juba, and west of Nyamlell,
are included in this group.
Strongly banded rocks, Gneisses, Migmatites and locally Metasedimentary rocks
This unit occurs in three areas to the east, north and west of the Imatong Mountains and
occupies broad zones within the Raga region west of longitude 26° 30' E (HUNTING,
1976). The migmatitic rocks occur between Maridi and Mundri and southeast of
Tambura. Rocks of this group include quartz-feldspar-biotite garnet gneisses, graphite-
sill imanite gneisses and migmatites, in addition to quartzites, schists, marbles, etc. of
metasedimentary sequences.
In the study area, Precambrian basement includes the Nile gneisses occupying east bank
of the Nile which can be trace westward near Jebel Kuruk, the Madi metasediments
around Jebel Kuruk extending west beyond Jebel Kunufi in Luri area metamorphosed to
high and medium grade metamorphism and Kenyeti-metasediment.
According to Hunting 1980, the basement under when four tectono-thermal activities.
They include Watian 2.88 Ga, Aruan, Mirian and Chuan recognized in the neighbouring
Uganda.
The basement Complex during the Palaeozoic era was intruded by granitoids of post
tectonic era. They comprise of two granitic composition exposures at Jebel Kuruk and
Kunufi along with the nepheline syenite of Jebel Narkenyi (Lado) and Jebel Bilinyang.
33
During Tertiary the area was subjected to tensional tectonics that opened EW fractures
which were subsequently filled by doleritic dike cutting both the basement and the major
intrusions in the area.
In the region where there are Precambrian outcrop, lateritic soil develop and occurs at
irregular intervals. The laterite is composed of reddish brown, sandy soils and duricrust.
The duricrust forms broken blocky outcrops composed of yellow, reddish brown or black,
spongy and more massive hydrated iron oxides with scattered included detrital silicate
grains and larger angular rock fragments.
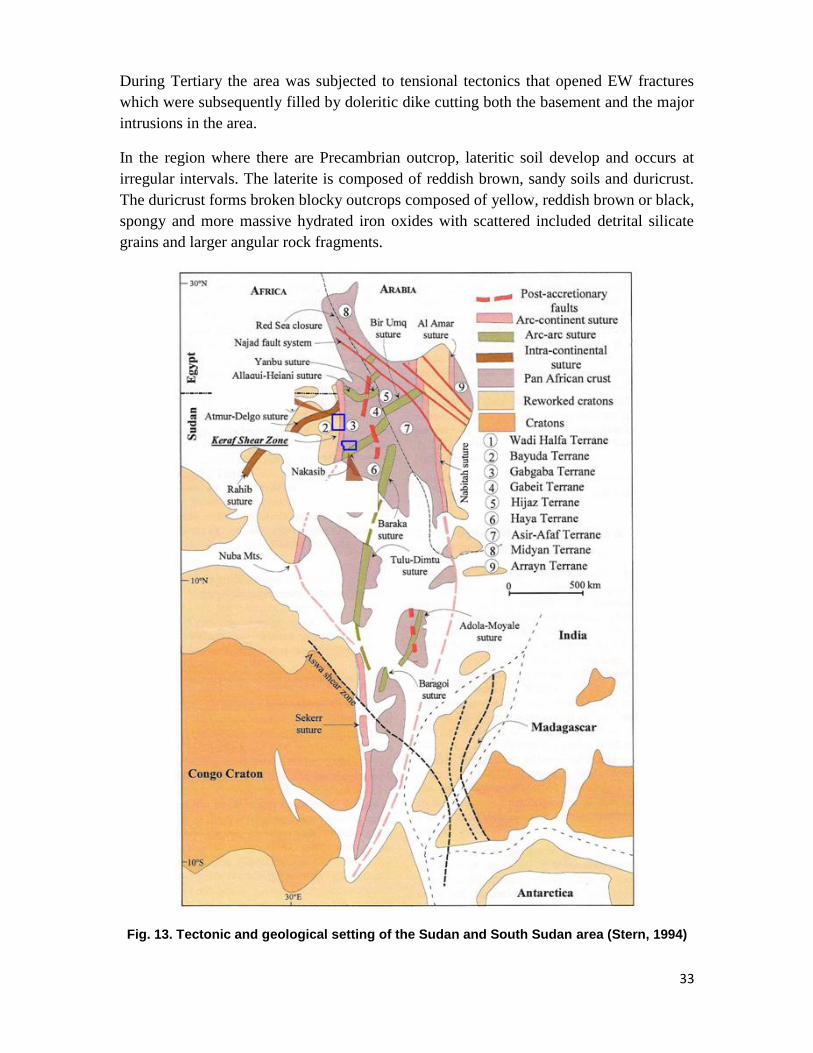
Fig. 13. Tectonic and geological setting of the Sudan and South Sudan area (Stern, 1994)
34
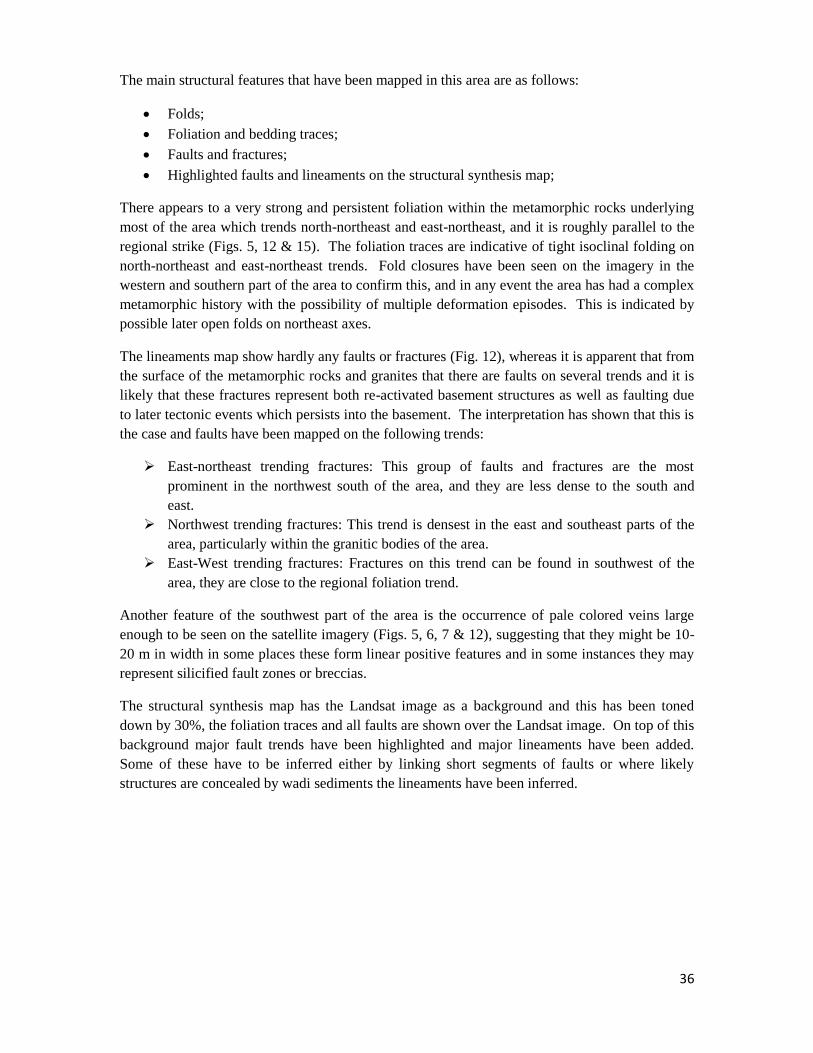
4.2. LITHOSTRATIGRAPHIC UNITS
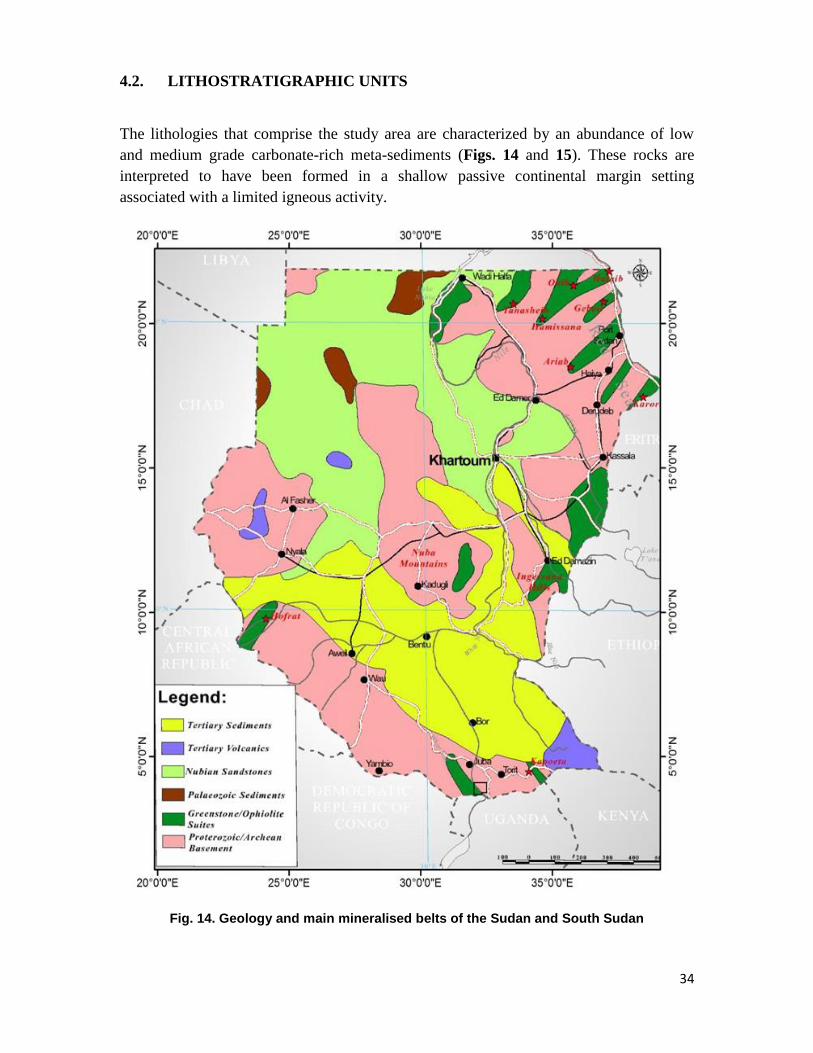
The lithologies that comprise the study area are characterized by an abundance of low
and medium grade carbonate-rich meta-sediments (Figs. 14 and 15). These rocks are
interpreted to have been formed in a shallow passive continental margin setting
associated with a limited igneous activity.
Fig. 14. Geology and main mineralised belts of the Sudan and South Sudan
35
Generally, the Aswa shear zone has revealed the following lithostratigraphic units:
Undifferentiated gneisses (Archean to middle Proterozoic)
Diorites, gabbros, granodiorites and granites (PreCambrian) (Syn-tectonic)
Upper Proterozoic (900~570 Ma) stratified metamorphic sequences (volcano-
sedimentary greenschist assemblage)
Mafic meta-volcanics ( metabasalts, amphibolites, chlorite schist)
Pelitic-psamitic meta-sediments (slates, phyllites, schists, meta-arenites)
Mixed sequences of marbles calcareous slates, calcargellites, phyllites and schists.
Phanerozoic alkali syenite-granite complexes (post-tectonic).
Umm Rwaba Sandstone Formation
Quaternary alluvial and eolian deposits
Although comparatively under-explored, it is evident that the most significant mineral
occurrences and deposits discovered in the South Sudan to date are associated with the
greenstone-ophiolite areas as presented in Fig. 14. These can be summarised from South
to North (based upon current knowledge) as:
Kapoeta Belt – a poorly explored area known for artisanal gold production.
Juba Belt – situated south of Juba this area is also known for artisanal gold
production.
4.3. GEOMORPHOLOGY
One of the main benefits of carrying out a remote sensing interpretation to construct a
lithostructural interpretation map is the improved level of structural geological detail that
is generated to place the targets which have been identified in their geological context. In
addition, these data assist in the interpretation of future geochemical and geophysical
surveys, and as it has been captured digitally on a GIS it can be added to the exploration
database for the region.
The rocks in the study area are mildly deformed, the geological structures in the area
consist of both ductile structures which include; folds, foliation, and crenulation cleavage,
and brittle structures which include joints and faults.
Geological structure is a definable shape or fabric in a rock. The geological structures are
divided into primary structures which are structures formed during or shortly after
deposition (sedimentary) or formation (igneous) of rocks while secondary structures
formed after its host rocks are formed.
36
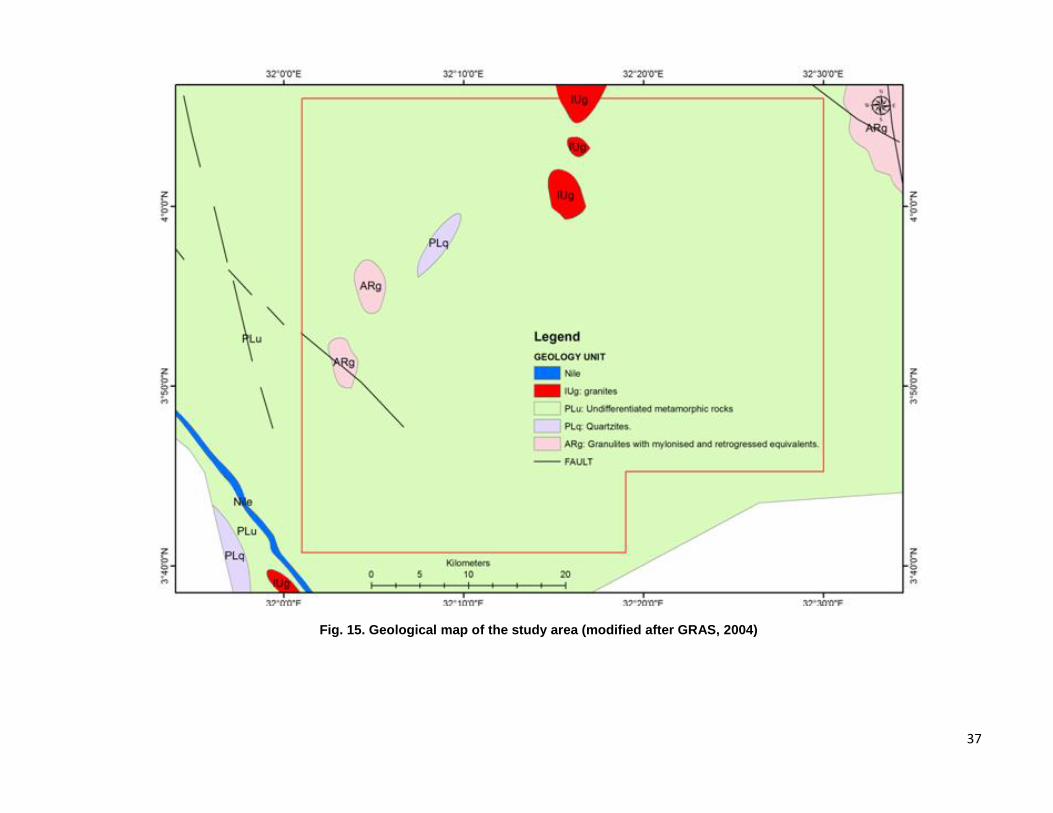
The main structural features that have been mapped in this area are as follows:
Folds;
Foliation and bedding traces;
Faults and fractures;
Highlighted faults and lineaments on the structural synthesis map;
There appears to a very strong and persistent foliation within the metamorphic rocks underlying
most of the area which trends north-northeast and east-northeast, and it is roughly parallel to the
regional strike (Figs. 5, 12 & 15). The foliation traces are indicative of tight isoclinal folding on
north-northeast and east-northeast trends. Fold closures have been seen on the imagery in the
western and southern part of the area to confirm this, and in any event the area has had a complex
metamorphic history with the possibility of multiple deformation episodes. This is indicated by
possible later open folds on northeast axes.
The lineaments map show hardly any faults or fractures (Fig. 12), whereas it is apparent that from
the surface of the metamorphic rocks and granites that there are faults on several trends and it is
likely that these fractures represent both re-activated basement structures as well as faulting due
to later tectonic events which persists into the basement. The interpretation has shown that this is
the case and faults have been mapped on the following trends:
East-northeast trending fractures: This group of faults and fractures are the most
prominent in the northwest south of the area, and they are less dense to the south and
east.
Northwest trending fractures: This trend is densest in the east and southeast parts of the
area, particularly within the granitic bodies of the area.
East-West trending fractures: Fractures on this trend can be found in southwest of the
area, they are close to the regional foliation trend.
Another feature of the southwest part of the area is the occurrence of pale colored veins large
enough to be seen on the satellite imagery (Figs. 5, 6, 7 & 12), suggesting that they might be 10-
20 m in width in some places these form linear positive features and in some instances they may
represent silicified fault zones or breccias.
The structural synthesis map has the Landsat image as a background and this has been toned
down by 30%, the foliation traces and all faults are shown over the Landsat image. On top of this
background major fault trends have been highlighted and major lineaments have been added.
Some of these have to be inferred either by linking short segments of faults or where likely
structures are concealed by wadi sediments the lineaments have been inferred.
37
Fig. 15. Geological map of the study area (modified after GRAS, 2004)
38
Fig. 15a. Geological and structural map of EL 17 (modified after GRAS, 2004. Details need to be checked by field work)
39
5. REMOTE SENSING MINERAL PROSPECTING
Mineral prospecting has been done using spectral signatures of the alteration zones
related to mineralization bodies. In this respects iron oxides mineral and the hydroxyl-
bearing minerals, clay minerals in particular have been aimed in this exercise. Spectral
signature of the iron oxide and clay minerals signature have been traced in the
transformed images of the band ratio and the PCA ones.
5.1. BAND RATIO COMBINATION
In this band ratio Sabins’s color composite image have produced after the analysis
of the primary band ratios of 3/1 for iron oxide mapping, band ratio 5/7 for clay minerals
and 3/5 for ferric oxides. The products are density sliced image for the band ratios 3/1
and 5/7 and color composite image which used in supervised classification (Fig. 8).
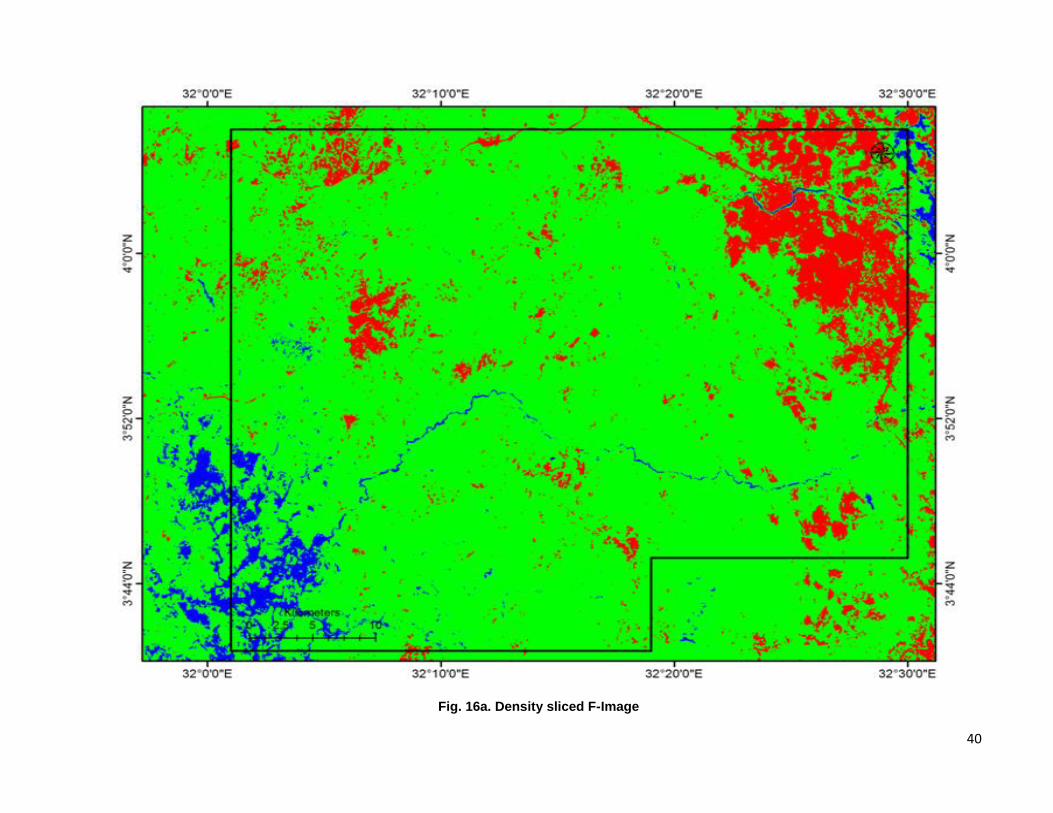
5.2. FEATURE ORIENTED PRINCIPAL COMPONENT SELECTION (FPCS)
Feature Oriented Principal Component Selection (FPCS) is a method of selection of some
the image bands. By reducing input bands into PCA analysis, the chances of defining a
unique PC for a specific mineral class will be increased. So, for an enhanced detection of
alteration zones with respect to their indicative minerals, bands 1, 4, 5, 7 and bands 1, 3,
4, 5 are used to map hydroxyl and iron oxide minerals, respectively in Crosta method.
The false color composite image obtained using hydroxyl image (PC4 extracted from
implementation of Crosta on Bands 1, 4, 5, and 7), iron oxide image (-PC4 extracted
from implementation of Crosta on Bands 1, 3, 4, and 5) and average of these two images
are depicted in red, blue and green, respectively. As it is observable in Fig. 16, yellow
pixels highlight hydrothermally altered area in study area.
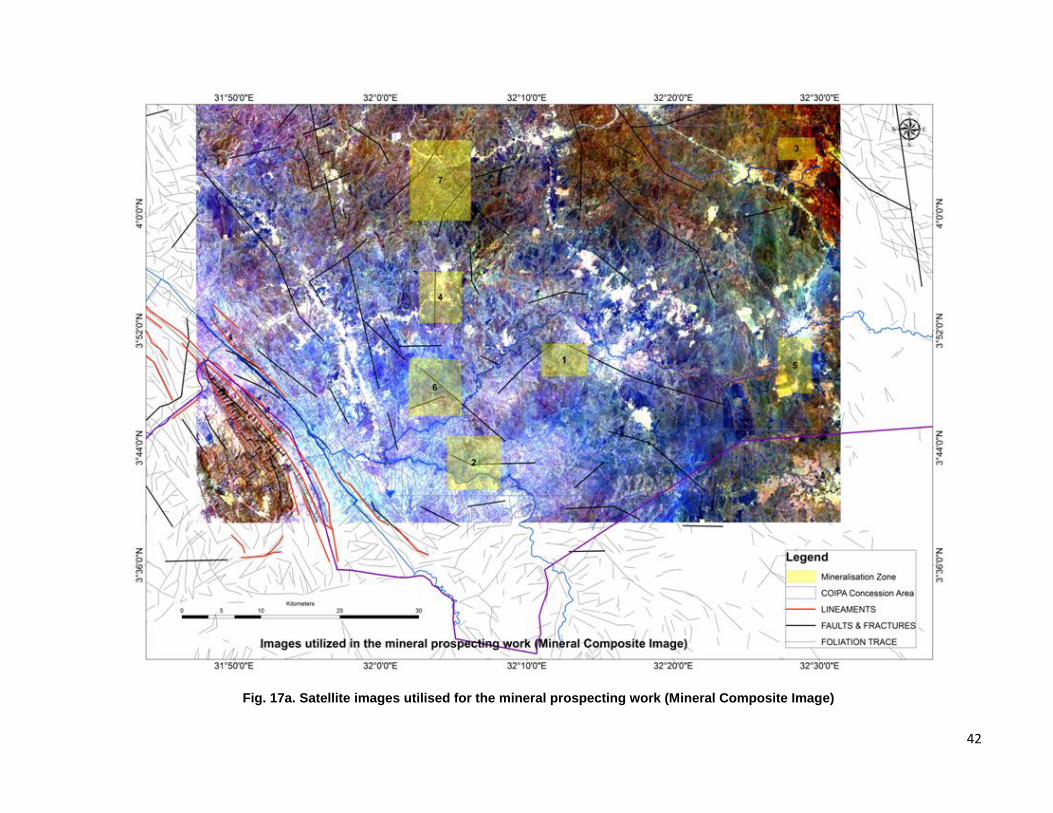
5.3. MATCHED FILTERING
Matched Filtering maximizes the spectral response of a known end member and
suppresses the response of the composite unknown background, and then computes
distribution of each endmember separately. This method does not, therefore, require
knowledge of all the endmembers within the image. MF results are grey scale images
with values from 0 to1, where 1 means perfect match (Adeli et al. 2008) (Fig. 17a).
Two produced images (spectral reflectance of Kaolinite and spectral absorption pattern of
iron oxide) in grey scale images with values from 0 to1, plus an average image of them
were used to make a color composite image to enhance hydrothermal alteration zones in
the area. For this purpose Kaolinite distribution image, iron oxide distribution image
made by MF method and average image were considered as a red, blue and green color
respectively. In this image (Fig. 17a) white pixels which are encircled by black ellipsoid.
40
Fig. 16a. Density sliced F-Image
41
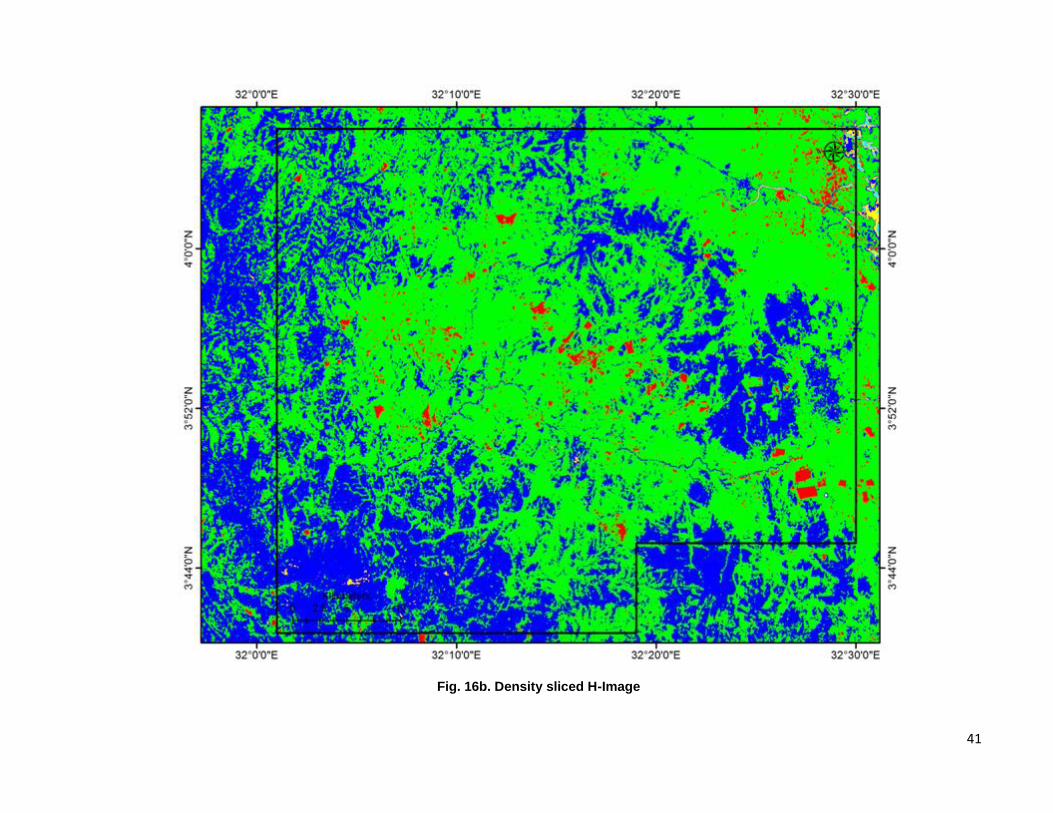
Fig. 16b. Density sliced H-Image
42
Fig. 17a. Satellite images utilised for the mineral prospecting work (Mineral Composite Image)
43
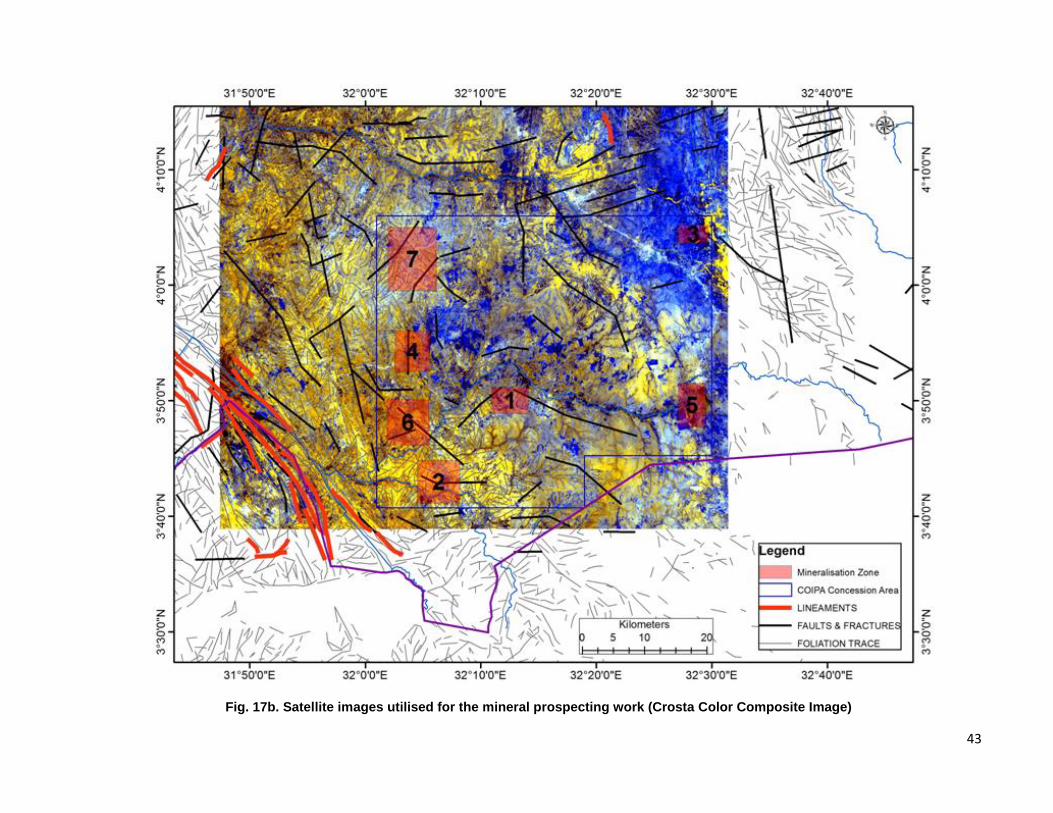
Fig. 17b. Satellite images utilised for the mineral prospecting work (Crosta Color Composite Image)
44
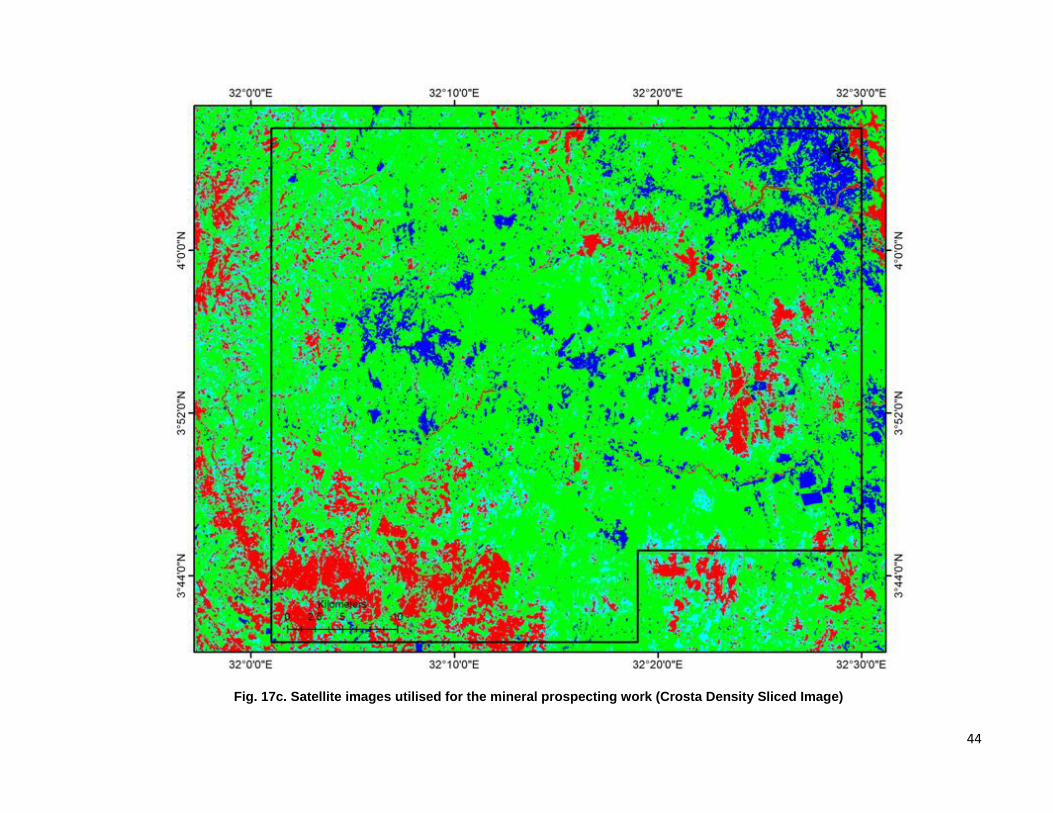
Fig. 17c. Satellite images utilised for the mineral prospecting work (Crosta Density Sliced Image)
6. ALTERATION ZONE SIGNATURE DETECTED OVER EL 17
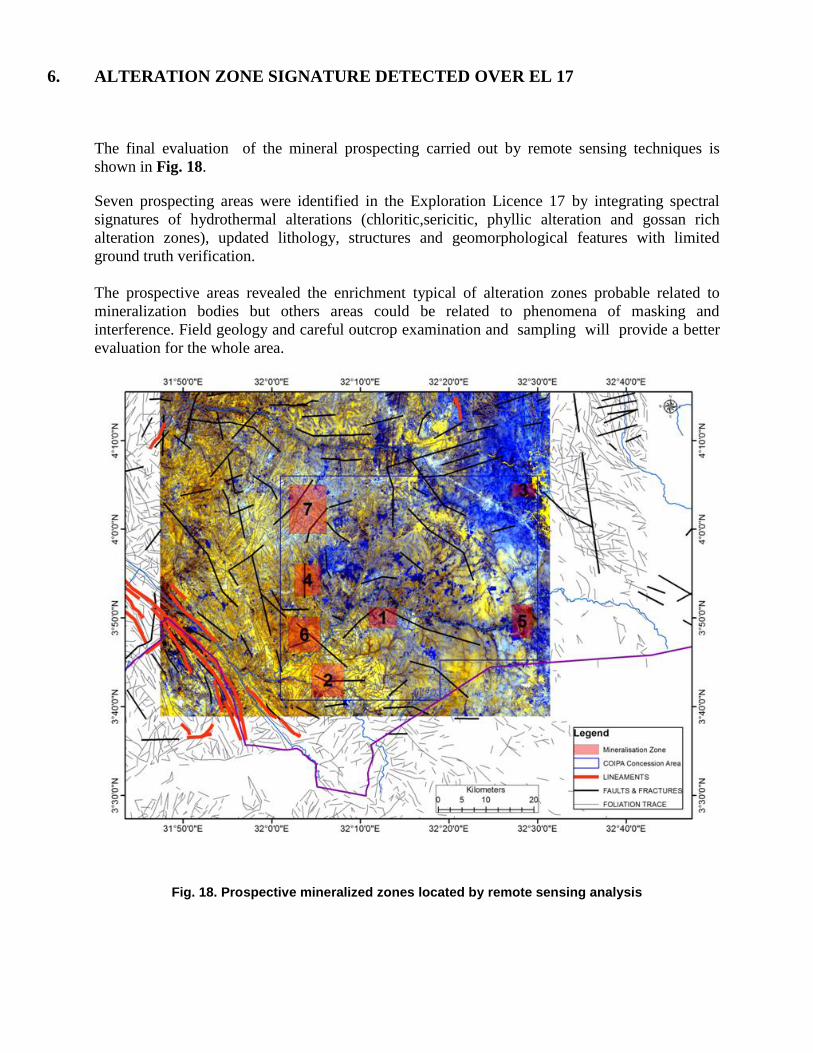
The final evaluation of the mineral prospecting carried out by remote sensing techniques is
shown in Fig. 18.
Seven prospecting areas were identified in the Exploration Licence 17 by integrating spectral
signatures of hydrothermal alterations (chloritic,sericitic, phyllic alteration and gossan rich
alteration zones), updated lithology, structures and geomorphological features with limited
ground truth verification.
The prospective areas revealed the enrichment typical of alteration zones probable related to
mineralization bodies but others areas could be related to phenomena of masking and
interference. Field geology and careful outcrop examination and sampling will provide a better
evaluation for the whole area.
Fig. 18. Prospective mineralized zones located by remote sensing analysis
46
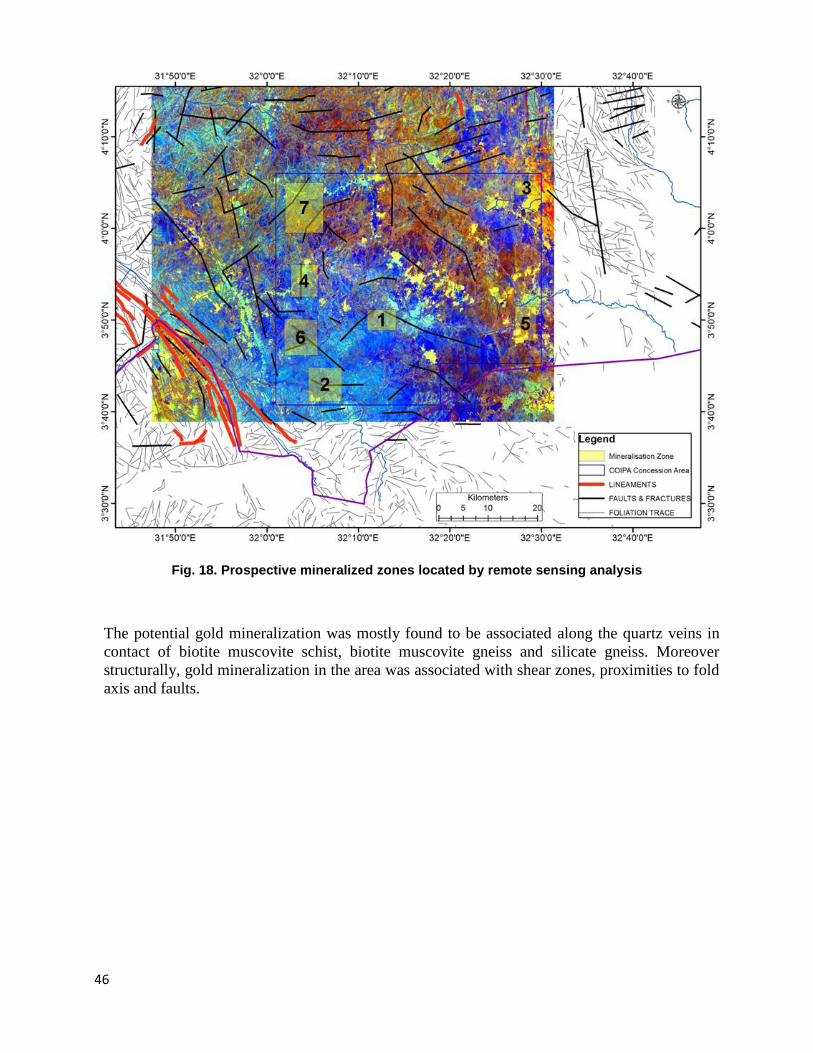
Fig. 18. Prospective mineralized zones located by remote sensing analysis
The potential gold mineralization was mostly found to be associated along the quartz veins in
contact of biotite muscovite schist, biotite muscovite gneiss and silicate gneiss. Moreover
structurally, gold mineralization in the area was associated with shear zones, proximities to fold
axis and faults.
47
7. CONCLUSION & RECOMMENDATION
I. Seven prospecting areas were identified by integrating spectral signatures of hydrothermal
alterations (chloritic,sericitic, phyllic alteration and gossan rich alteration zones), updated
lithology, structures and geomorphological features with limited ground truth verification.
The prospective areas revealed the enrichment typical of alteration zones probable related
to mineralization bodies but others areas could be related to phenomena of masking and
interference. Field geology and careful outcrop examination and sampling will provide a
better evaluation for the whole area.
II. The potential gold mineralization was mostly found to be associated along the quartz
veins in contact of biotite muscovite schist, biotite muscovite gneiss and silicate gneiss.
Moreover structurally, gold mineralization in the area was associated with shear zones,
proximities to fold axis and faults.
III. According to security situation, COIPA Intl. will send local field technicians to EL 17 to
conduct preliminary field examination (check on condition of cut grid, locate bedrock
outcrop areas and trenches, look for possible soil sample storate sites, etc.) Field work
will be carry out field work as soon as possible for updating the produced geological and
structural maps.
IV. The area defined by geospatial analysis and geological mapping will be further subjected
for geochemical studies. The results of bulk fraction of stream sediment & pitting-
trenching samples from the allotted area indicated zones of gold occurrences. In the next
exploration activity, Phase II, a geochemical sampling and study will complete the
mineral potential evaluation of Exploration Licence 17. Geologists and field technicians
will map, examine and sample bedrock and trench exposures.
V. Such an approach is basically adopted to have a focused plan of exploration and facilitate
cost and time optimization in exploration activities.
VI. Senior personnel engaged by COIPA Intl. in the proposed field work activities will be
familiar with the community they are expected to work in, and capable of communicating
effectively with stakeholders and community.
Franco Caselli
Exploration Manager
48
BIBLIOGRAPHY
Abdelsalam, M.G., Gao, S.S., Liégeois, J.P., 2011. Upper mantle structure of the Saharan
Metacraton. Journal of African Earth Sciences 60, 328–336.
Abdelsalam, M.G., Liégeois, J.P., Stern, R.J., 2002. The Saharan Metacraton. Journal of African
Earth Sciences 34, 119–136.
Abdelsalam, M.G., Stern, R.J., 1991. Comments and reply on “Ophiolites in northeast and east
Africa: implication for Proterozoic crustal growth”. Journal of the Geological Society, London
148, 600–606.
Ahmed Awadalla Yassin, Fathi Ali Khalil,Dr. Abdel Gadir El Shafie 1984 Explanatory Note To
The Geological Map At The Scale Of 1:2 000 000 Of The Democratic Republic Of The Sudan
1981 Edition. Sd - 84, 02 1984.
Albert H. Fay, Slate, A Glossary of the Mining and Mineral Industry, United States Bureau of
Mines, 1920.
Almond, D.C., 1962. Explanation of the Geology of Sheet 15 (Kitgum). Geological Survey of
Uganda Report Number 8, 55 pp.
ASTER, 2006. Advanced Spaceborne Thermal Emission Rediometer Scenes 014 and 015, 26th
February 2006.
Baker, K., 2010. Bulghah Gold Mine. Ashgill Australia Pty. Ltd.
Baker, K., 2010. Sukhaybarat Gold Mine. Ashgill Australia Pty. Ltd.
Berhe, S.M., 1990. Ophiolites in Northeast and East Africa: implications for Proterozoic crustal
growth. Journal of the Geological Society, London 147, 41–57.
Burke, K., Sengör, C., 1986. Tectonic escape in the evolution of the continental crust.
Geodynamics Series 14, 41–53.
Calais, E., Ebinger, C., Hartnady, C., Nocquet, J.M., 2006. Kinematics of the East African Rift
from GPS and earthquake slip vector data. Geological Society of London, Special Publication
259, 9–22.
Chorowicz, J., 2005. The East African rift system. Journal of African Earth Sciences 43, 379–
410.
Clemens, John (1998). "Observations on the origins and ascent mechanisms of granitic magmas".
Journal of the Geological Society of London 155 (Part 5): 843–51. Doi: 10.1144/
gsjgs.155.5.0843.
Collins, A.S., Fitzsimons, I.C.W., Hulscher, B., Razakamanana, T., 2003. Structure of the eastern
margin of the East African Orogen in central Madagascar. Precambrian Research 123, 111–133.
49
Daly, M., Chorowicz, J., Fairhead, J., 1989. Rift basin evolution in Africa: the influence of
reactivated steep basement shear zones. Geological Society of London, Special Publication 44,
309–334.
Duval, J., 1983. Composite color images of aerial gamma‐ ray spectrometric data. Geophysics
48, 722–735.
Essentials of Geology, 3rd Ed, Stephen Marshak.
Fairhead, J.D., 1980. The structure of the cross-cutting volcanic chain of northern Tanzania and
its relation to the East African rift system. Tectonophysics 65, 193–208.
Fernandez-Alonso,M., Cutten, H., DeWaele, B., Tack, L., Tahona, A., Baudet, D., Barritt, S.D.,
2012. The Mesoproterozoic Karagwe-Ankole Belt (formerly the NE Kibara Belt): the result of
prolonged extensional intracratonic basin development punctuated by two short-lived far-field
compressional events. Precambrian Research 216, 63–86.
Fritz, H., Abdelsalam, M.G., Ali, K.A., Bingen, K.A., Collins, A.S., Fowler, A.R., Ghebreab, W.,
Gaulon, R., Chorowicz, J., Vidal, G., Romanowicz, B., Rouit, G., 1992. Regional geodynamic
implications of the May–July 1990 earthquake sequence in southern Sudan. Tectonophysics 209,
87–103.
Girdler, R.W., McConnell, D.A., 1994. The 1990 to 1991 Sudan earthquake sequence and the
extent of the East African Rift System. Science 264, 67–70.
Government of South Sudan, 2015. Concession Agreement for the Exploration and Exploitation
of Gold and Associated Metals in Eastern Equatoria State (JUMANA Block). Ministry of
Minerals.
Government of South Sudan, 2015. The Mineral Resources and Mining Development Act, 2015.
GRAS, 1997. Base Metals in Sudan. Geological Research Authority of the Sudan, Khartoum.
GRAS, 1997. Gold in Sudan. Geological Research Authority of the Sudan, Khartoum.
GRAS, 2004. Geological Map of the Sudan, 1:2 million scales. Geological Research Authority
of the Sudan, Khartoum.
Harvey Blatt and Robert J. Tracy (1997). Petrology (2nd Ed.). New York: Freeman. p. 66.
ISBN0-7167-2438-3.
Hauzenberger, C.A., Johnson, P.R., Kusky, T.M., Macey, P., Muhongo, S., Stern, R.J., Viola, G.,
2013. Orogeny style in the East African Orogen: a review of the Neoproterozoic to Cambrian
tectonic evolution. Journal of African Earth Sciences 86, 65–106.
Holmes, A., 1951, The sequence of Precambrian erogenic belts in south and Central Africa: Rep.
18th Sess. int. geol. Congr., G.B., 1948, part 14, pp. 254-269.
50
Johnson, N., Newling, P., Orr, C., Morgan, D., Staples, M., and Motteram, G., 2007. Technical
Report – Sukari Gold Project, Egypt. Hellman & Schofield Pty Ltd, Roche Process Engineering
Pty Ltd, George, Orr and Associates (Australia) Pty Ltd, Knight Piésold Pty Ltd, AMC
Consultants Pty Ltd, Geomett Pty Ltd.
Katumwehe, A.B., Abdelsalam, M.G., Atekwana, E.A., 2015. The role of pre-existing
Precambrian structures in rift evolution: the Albertine and Rhino Grabens, Uganda.
Tectonophysics 646, 117–129.
Kroner, A. et al., 1987. Pan-African Crustal Evolution in the Nubian Segment of Northeast
Africa. In: Proterozoic Lithosphere Evolution. Geodynamics Series Vol. 17. p.235-257.
Landsat 8, 2015. Landsat Scene Path 172 Row 057/058, 30th
February 2014.
Meert, J.G., Lieberman, B.S., 2008. The Neoproterozoic assembly of Gondwana and its
relationship to the Ediacaran–Cambrian radiation. Gondwana Research 14, 5–21.
Mining Journal., 2011. Ethiopia – A Supplement to Mining Journal. Mining Journal Special
Publication, January 2011.
Moussa, H.H.M., 2008. Spectral P-wave magnitudes, magnitude spectra and other source
parameters for the 1990 southern Sudan and the 2005 Lake Tanganyika earthquakes. Journal of
African Earth Sciences 52, 89–96.
Nyakecho, C., Hagemann, S., 2014. An overview of gold systems in Uganda. Australian Journal
of Earth Sciences 61, 59–88.
Pradeepkumar, A., Krishnanath, R., 2000. A Pan-African ‘humite epoch’ in East Gondwana:
implications for Neoproterozoic Gondwana geometry. Journal of Geodynamics 29, 43–62.
Rasheed, A. E., Sherif, M., and Andu, A., 1995. The Main Gold Bearing Areas in the Greenstone
Ophiolite Belts of the Sudan. Geological Research Authority of the Sudan, Khartoum.
Ries, A., Vearncombe, J., Price, R.C., Shackleton, R.M., 1992. Geochronology and geochemistry
of the rocks associated with a late Proterozoic ophiolite in West Pokot, NW Kenya. Journal of
African Earth Sciences 14, 25–35.
Ruotoistenmäki, T., 2014. Geophysical characteristics of Aswa shear, Nakasongola discontinuity
and ring dyke complex in Uganda. Journal of African Earth Sciences 93, 23–41.
Stern, R.J., 1994. Arc-assembly and continental collision in the Neoproterozoic African orogen:
implications for the consolidation of Gondwanaland. Annual Review of Earth and Planetary
Sciences 22, 319–351.
Sudan Geological Survey, 1956. 1:250,000 Scale Geological Map of Nimule and Juba Areas,
Khartoum.
Tack, L., Wingate, M.T.D., De Waele, B., Meert, J., Belousova, E., Griffin, B., Tahon, A.,
Fernandez-Alonso, M., 2010. The 1375 Ma “Kibaran Event” in Central Africa: prominent
51
emplacement of bimodal magmatism under extensional regime. Precambrian Research 180, 63
84.
Tapponnier, P., Peltzer, G., Le Dain, A., Armijo, R., Cobbold, P., 1982. Propagating extrusion
tectonics in Asia: new insights from simple experiments with plasticine. Geology 10, 611–616.
Vail, J. R., 1978. Outline of the Geology and Mineral Deposits of the Democratic Republic of
the Sudan and Adjacent Areas. Overseas Geology and Mineral Resources. Vol. 49.
Vail, J. R., 1979. The Geology and Mineralisation of the Nubian Shield East of the Nile Valley,
Sudan. In: TAHON, S. A., (ed.) Evolution and Mineralisation of Arabian-Nubian Shield,
Proceed Symp. Vol. 2, p.97-107, Pergamon Press, Oxford.
Vail, J.R., 1974, Distribution of the Nubian Sandstone Formation in Sudan and vicinity : Bull.
Am. Assoc. Petrol. Geol., vol. 58, pp. 1025-1036.
Vail, J.R., in press, e. Tectonic trends and basement subdivisions, east of the Nile valley, in
Northern Africa: Rep. 2nd Conf. afr. Geo. Addis-Abeba, 1973.
Verduzco, B., Fairhead, J.D., Green, C.M., MacKenzie, C., 2004. New insights into magnetic
derivatives for structural mapping. The Leading Edge 23, 116–119.
Westerhof, A.B.P., Harma, P., Isabirye, E., Katto, E., Koistinen, T., Kuosmanen, E., Lehto, T.,
M.I. Lehtonen, M.I., Makitie, H., Manninen, T., Manttari, I., Pekkala, Y., Pkki, J., Saalmann, K.,
Virransalo, P., 2014. Geology and geodynamic development of Uganda with explanation of the
1:1,000,000 scale geological map. Geological Survey of Finland Special Paper 55, 387 pp.
Whiteman, A. J., 1971. The Geology of the Sudan Republic. Clarendon Press. Oxford.
Whiteman, A.J., 1971a, the geology of the Sudan Republic: Clarendon Press, London, 290 p.
Whiteman, A.J., 1971b, A reviev; of the Pleistocene and Recent history of Sudan Republic: Bull.
Assoc, senegal. Et. Quat. Ouest afr., vol. 29, pp. 29-101.
Whiteman, A.J., 1971c, Structural geology of Sudan, pp. 433-445: In Tectonic of Africa,
UNESCO, Earth Sci., no. 6, Paris.