for college or career school · 1st grade literacy periodic assessment (lpa) 2nd grade literacy...
TRANSCRIPT

5 6
Students in grades 2-11 are tested annually to assess their achievement of statecontent standards. California Standards Test (CST) scores fall into 1 of 5performance levels. The state’s goal is for all students to score proficient oradvanced, the top 2 performance levels.
Are students ready to move on to the nextgrade level?
READINESSFor college or career
out of students
2nd graders scoring at the proficient or advancedperformance level in English language arts
2nd graders scoring at the proficient or advancedperformance level in math
out of students
2010-11 2011-12LAUSDAverage
2010-11 2011-12LAUSDAverage
out of students
3rd graders scoring at the proficient or advancedperformance level in English language arts
3rd graders scoring at the proficient or advancedperformance level in math
out of students
2010-11 2011-12LAUSDAverage
2010-11 2011-12LAUSDAverage
A school must meet targets under No Child Left Behind (NCLB) on standardized testsand graduation rates for all students and for certain groups (economically disadvantagedstudents, students with disabilities, English learners, and students in different ethnicgroups). For information on the specific requirements for your school, visithttp://www.cde.ca.gov/ta/ac/ar/ and click on the link called School Level AYP Reports.
Did this school meet AYP requirements?How many requirements did the school meet?...out of a possible
ATitle I school is in Program Improvement (PI) status when it does not meet AYPrequirements two years in a row. When this happens, an intervention plan is designed tohelp the school meet its requirements. Parents are notified when a school enters PIstatus. You may view a copy of your school’s plan at your school.
What was the school’s PI status as of September 2012?
What is Adequate Yearly Progress (AYP) andProgram Improvement (PI) Status?
LEARNmoreAbout the school
How are English learners progressing?All students whose primary home language is not English are given the CaliforniaEnglish Language Development Test (CELDT) when they enter school.
Students are classified as English learners (ELs) if they do not receive a highenough score to be considered initially fluent in English. ELs are placed into one offive levels to indicate their current level of skill in the English language.
ELs receive support to enable them to do grade-level work in English, and re-takethe CELDT to be reclassified as proficient in the English language.
What are our students’ beginning English LanguageDevelopment (ELD) levels?
Fluent in EnglishEnglish Language Development 1
English Language Development 2
English Language Development 3English Language Development 4
2011-12
S
DOES
HOW
YOUR
SCHOOL
MEASURE
UP?
Fin
dou
tmor
eat
http://rep
ortcar
d.lau
sd.n
et
Los Angeles Unified School District
SCHOOLreportcard 11
12
SCHOOL
repor
tca
rd11 12
Developedinpartnershipwith
Dear Parent or Guardian,Our responsibility for educating ourchildren is to work together as a team—the school and district staff, parents,guardians and families, and studentsthemselves. We all need to make our bestefforts, individually and as a group, tosupport our students, believe in theirabilities and potential, and createconditions for their success.
The 2011-12 School Report Card,revised with input from various parentand community groups, is a valuable toolfor you to learn about your student’sschool. Bring this document with youwhen you visit with your student’steacher(s). Learn how your school isworking to help your student read, write,think, and speak at or above grade level.Ask questions. Find out how you canhelp. We are a team, and we need you!
Dr. John E. DeasySuperintendent
LAUSD 3rd gradersscoring proficient oradvanced in Englishlanguage arts
LAUSD 3rd gradersscoring proficient oradvanced in math
out of students
out of students
Principal
S 10/9/12 1:14 PM Page 1
ENG - P.C.
29,987
18,648
43,845
43,701
VALL
EY C
HA
RTE
R E
LEM
ENTA
RY S
CH
OO
L16
514
NO
RD
HO
FF S
TN
OR
TH H
ILLS
, CA
9134
3
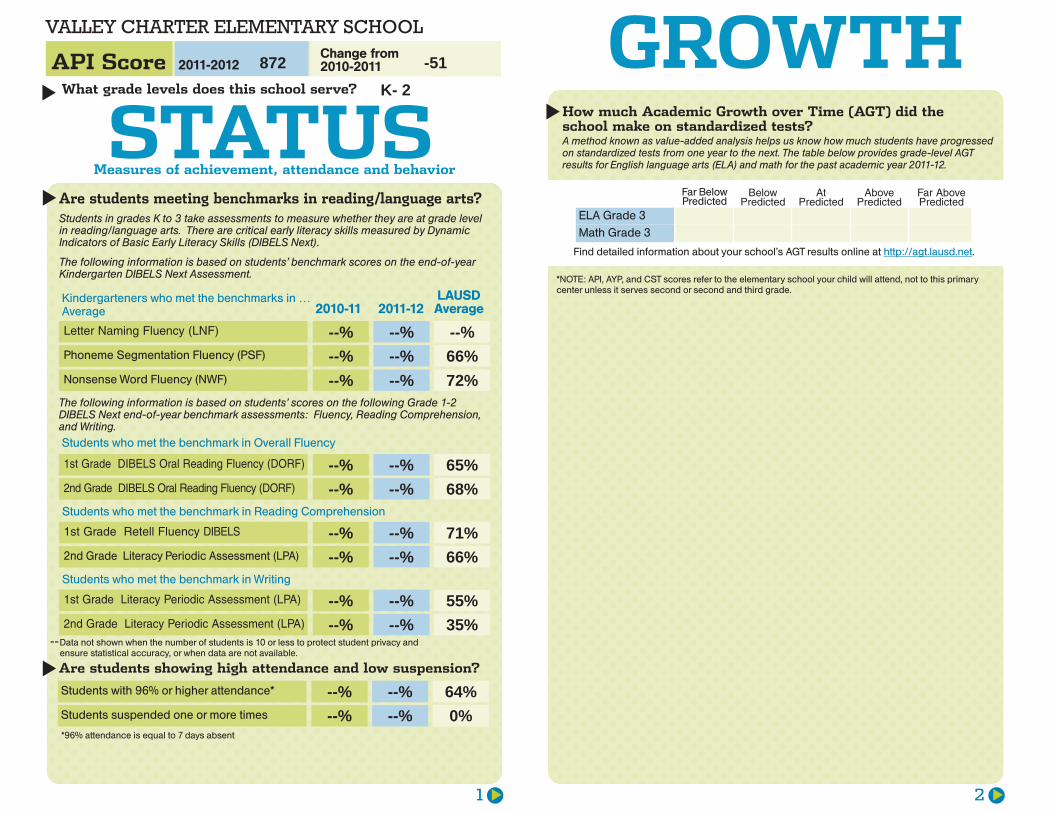
VALLEY CHARTER ELEMENTARY SCHOOL
68%
43%
21
API Score Change from2010-20112011-2012
What grade levels does this school serve?
Are students meeting benchmarks in reading/language arts?Students in grades K to 3 take assessments to measure whether they are at grade levelin reading/language arts. There are critical early literacy skills measured by DynamicIndicators of Basic Early Literacy Skills (DIBELS Next).
The following information is based on students’ benchmark scores on the end-of-yearKindergarten DIBELS Next Assessment.
The following information is based on students’ scores on the following Grade 1-2DIBELS Next end-of-year benchmark assessments: Fluency, Reading Comprehension,and Writing.
Kindergarteners who met the benchmarks in …Average
Letter Naming Fluency (LNF)
Phoneme Segmentation Fluency (PSF)
Nonsense Word Fluency (NWF)
2010-11 2011-12LAUSDAverage
Students who met the benchmark in Overall Fluency
1st Grade DIBELS Oral Reading Fluency (DORF)
2nd Grade DIBELS Oral Reading Fluency (DORF)
Students who met the benchmark in Reading Comprehension
1st Grade Retell Fluency DIBELS
2nd Grade Literacy Periodic Assessment (LPA)
Students who met the benchmark in Writing
1st Grade Literacy Periodic Assessment (LPA)
2nd Grade Literacy Periodic Assessment (LPA)
Data not shown when the number of students is 10 or less to protect student privacy andensure statistical accuracy, or when data are not available.
STATUSGROWTH
How much Academic Growth over Time (AGT) did theschool make on standardized tests?
Far BelowPredicted
BelowPredicted
AtPredicted
AbovePredicted
Far AbovePredicted
ELA Grade 3
Math Grade 3
A method known as value-added analysis helps us know how much students have progressedon standardized tests from one year to the next. The table below provides grade-level AGTresults for English language arts (ELA) and math for the past academic year 2011-12.Measures of achievement, attendance and behavior
Are students showing high attendance and low suspension?
Students with 96% or higher attendance*
Students suspended one or more times
*96% attendance is equal to 7 days absent
Find detailed information about your school’s AGT results online at http://agt.lausd.net.
*NOTE: API, AYP, and CST scores refer to the elementary school your child will attend, not to this primarycenter unless it serves second or second and third grade.
S
3 4
The goal of the primary centers across LAUSD is to support students and theirfamilies in developing a strong foundation of the educational, social, and physicalskills that children need to become lifelong learners.
What is the mission of the primary centers?
In 2011-12, parents and staff were surveyed about their experiences at this school.Here is what they told us...
What is it like to be at this school?
What percentage of students is scoring proficient oradvanced across student groups?*
All students
African American
American Indian
Asian
Filipino
Latino
Pacific Islander
White
MathELA
English learners
Students with
disablilties
Economicallydisadvantaged
For more information on the survey results, go to http://schoolsurvey.lausd.net.
2010-11 2011-12What is important to know aboutstaff at this school?
Highly qualified teachers (fully accredited,demonstrate subject area competence)
Parents: Number (percent) responding:
I feel welcome to participate at this school.
The school offers me opportunities to participate in councils, parent organizations.
I talk with the teacher about my child’s schoolwork.
My child is safe on school grounds.
Staff: Number (percent) responding:
I get the help I need to communicate with parents.
I am proud of this school.
My school is clean.
I feel safe on school grounds.
Teachers at this school for at least 3 years
Staff with 96% or higher attendance*
LAUSDAverage
*NOTE: API, AYP, and CST scores refer to the elementary school your child will attend, not to this primarycenter unless it serves second or second and third grade.
LEARNINGenvironmentWhat it’s like to be at this school
STUDENTgroupsPerformance of different groups
Percentage of students enrolled who are…
Who are the students at this school?
African American
American Indian
Asian
Filipino
Latino
Pacific Islander
White
Gifted and talented
Students with disabilities
English learners
Reclassified fluentEnglish proficient
Economically disadvantaged
Students entering and leaving
Total number of students enrolled:
*96% attendance is equal to 7 days absent
S 10/9/12 1:14 PM Page 3
ENG - P.C.
--
872 -51K- 2
--% --% --%--%--%
--%--%
66%72%
--%
--%
--%
--%
--%
--%
--%
--%
65%
71%
55%
64%
--%
--%
--%
--%
--%
--%
--%
--%
68%
66%
35%
0%
VALLEY CHARTER ELEMENTARY SCHOOL

21
API Score Change from2010-20112011-2012
What grade levels does this school serve?
Are students meeting benchmarks in reading/language arts?Students in grades K to 3 take assessments to measure whether they are at grade levelin reading/language arts. There are critical early literacy skills measured by DynamicIndicators of Basic Early Literacy Skills (DIBELS Next).
The following information is based on students’ benchmark scores on the end-of-yearKindergarten DIBELS Next Assessment.
The following information is based on students’ scores on the following Grade 1-2DIBELS Next end-of-year benchmark assessments: Fluency, Reading Comprehension,and Writing.
Kindergarteners who met the benchmarks in …Average
Letter Naming Fluency (LNF)
Phoneme Segmentation Fluency (PSF)
Nonsense Word Fluency (NWF)
2010-11 2011-12LAUSDAverage
Students who met the benchmark in Overall Fluency
1st Grade DIBELS Oral Reading Fluency (DORF)
2nd Grade DIBELS Oral Reading Fluency (DORF)
Students who met the benchmark in Reading Comprehension
1st Grade Retell Fluency DIBELS
2nd Grade Literacy Periodic Assessment (LPA)
Students who met the benchmark in Writing
1st Grade Literacy Periodic Assessment (LPA)
2nd Grade Literacy Periodic Assessment (LPA)
Data not shown when the number of students is 10 or less to protect student privacy andensure statistical accuracy, or when data are not available.
STATUSGROWTH
How much Academic Growth over Time (AGT) did theschool make on standardized tests?
Far BelowPredicted
BelowPredicted
AtPredicted
AbovePredicted
Far AbovePredicted
ELA Grade 3
Math Grade 3
A method known as value-added analysis helps us know how much students have progressedon standardized tests from one year to the next. The table below provides grade-level AGTresults for English language arts (ELA) and math for the past academic year 2011-12.Measures of achievement, attendance and behavior
Are students showing high attendance and low suspension?
Students with 96% or higher attendance*
Students suspended one or more times
*96% attendance is equal to 7 days absent
Find detailed information about your school’s AGT results online at http://agt.lausd.net.
*NOTE: API, AYP, and CST scores refer to the elementary school your child will attend, not to this primarycenter unless it serves second or second and third grade.
S
3 4
The goal of the primary centers across LAUSD is to support students and theirfamilies in developing a strong foundation of the educational, social, and physicalskills that children need to become lifelong learners.
What is the mission of the primary centers?
In 2011-12, parents and staff were surveyed about their experiences at this school.Here is what they told us...
What is it like to be at this school?
What percentage of students is scoring proficient oradvanced across student groups?*
All students
African American
American Indian
Asian
Filipino
Latino
Pacific Islander
White
MathELA
English learners
Students with
disablilties
Economicallydisadvantaged
For more information on the survey results, go to http://schoolsurvey.lausd.net.
2010-11 2011-12What is important to know aboutstaff at this school?
Highly qualified teachers (fully accredited,demonstrate subject area competence)
Parents: Number (percent) responding:
I feel welcome to participate at this school.
The school offers me opportunities to participate in councils, parent organizations.
I talk with the teacher about my child’s schoolwork.
My child is safe on school grounds.
Staff: Number (percent) responding:
I get the help I need to communicate with parents.
I am proud of this school.
My school is clean.
I feel safe on school grounds.
Teachers at this school for at least 3 years
Staff with 96% or higher attendance*
LAUSDAverage
*NOTE: API, AYP, and CST scores refer to the elementary school your child will attend, not to this primarycenter unless it serves second or second and third grade.
LEARNINGenvironmentWhat it’s like to be at this school
STUDENTgroupsPerformance of different groups
Percentage of students enrolled who are…
Who are the students at this school?
African American
American Indian
Asian
Filipino
Latino
Pacific Islander
White
Gifted and talented
Students with disabilities
English learners
Reclassified fluentEnglish proficient
Economically disadvantaged
Students entering and leaving
Total number of students enrolled:
*96% attendance is equal to 7 days absent
S 10/9/12 1:14 PM Page 3
ENG - P.C.
--
65
--
--% --% 78%
--%
--%
--%
--%
81%
100%
(--%)
(37%)
1%2%1%2%
26%0%
67%21%
0%
7%
1%
--%
9%
69% 77%--% --%--% --%--% --%--% --%45% 62%--% --%83% 85%--%
--%
36%
--%
--%
50%
175
VALL
EY C
HA
RTE
R
ELEM
ENTA
RY S
CH
OO
L16
514
NO
RD
HO
FF S
TN
OR
TH H
ILLS
, CA
9134
381
8-81
0-67
13
CH
AR
TER
SC
HO
OLS
213-
241-
0399
BO
AR
D D
ISTR
ICT
3TA
MA
R G
ALA
TZA
N21
3-24
1-63
86
PAR
ENT
SER
VIC
ES86
6-66
9-72
72
--%
100%100%57%97%
--%--%--%

5 6
Students in grades 2-11 are tested annually to assess their achievement of statecontent standards. California Standards Test (CST) scores fall into 1 of 5performance levels. The state’s goal is for all students to score proficient oradvanced, the top 2 performance levels.
Are students ready to move on to the nextgrade level?
READINESSFor college or career
out of students
2nd graders scoring at the proficient or advancedperformance level in English language arts
2nd graders scoring at the proficient or advancedperformance level in math
out of students
2010-11 2011-12LAUSDAverage
2010-11 2011-12LAUSDAverage
out of students
3rd graders scoring at the proficient or advancedperformance level in English language arts
3rd graders scoring at the proficient or advancedperformance level in math
out of students
2010-11 2011-12LAUSDAverage
2010-11 2011-12LAUSDAverage
A school must meet targets under No Child Left Behind (NCLB) on standardized testsand graduation rates for all students and for certain groups (economically disadvantagedstudents, students with disabilities, English learners, and students in different ethnicgroups). For information on the specific requirements for your school, visithttp://www.cde.ca.gov/ta/ac/ar/ and click on the link called School Level AYP Reports.
Did this school meet AYP requirements?How many requirements did the school meet?...out of a possible
ATitle I school is in Program Improvement (PI) status when it does not meet AYPrequirements two years in a row. When this happens, an intervention plan is designed tohelp the school meet its requirements. Parents are notified when a school enters PIstatus. You may view a copy of your school’s plan at your school.
What was the school’s PI status as of September 2012?
What is Adequate Yearly Progress (AYP) andProgram Improvement (PI) Status?
LEARNmoreAbout the school
How are English learners progressing?All students whose primary home language is not English are given the CaliforniaEnglish Language Development Test (CELDT) when they enter school.
Students are classified as English learners (ELs) if they do not receive a highenough score to be considered initially fluent in English. ELs are placed into one offive levels to indicate their current level of skill in the English language.
ELs receive support to enable them to do grade-level work in English, and re-takethe CELDT to be reclassified as proficient in the English language.
What are our students’ beginning English LanguageDevelopment (ELD) levels?
Fluent in EnglishEnglish Language Development 1
English Language Development 2
English Language Development 3English Language Development 4
2011-12
S
DOES
HOW
YOUR
SCHOOL
MEASURE
UP?
Fin
dou
tmor
eat
http://rep
ortcar
d.lau
sd.n
et
Los Angeles Unified School District
SCHOOLreportcard 11
12
SCHOOL
repor
tca
rd11 12
Developedinpartnershipwith
Dear Parent or Guardian,Our responsibility for educating ourchildren is to work together as a team—the school and district staff, parents,guardians and families, and studentsthemselves. We all need to make our bestefforts, individually and as a group, tosupport our students, believe in theirabilities and potential, and createconditions for their success.
The 2011-12 School Report Card,revised with input from various parentand community groups, is a valuable toolfor you to learn about your student’sschool. Bring this document with youwhen you visit with your student’steacher(s). Learn how your school isworking to help your student read, write,think, and speak at or above grade level.Ask questions. Find out how you canhelp. We are a team, and we need you!
Dr. John E. DeasySuperintendent
LAUSD 3rd gradersscoring proficient oradvanced in Englishlanguage arts
LAUSD 3rd gradersscoring proficient oradvanced in math
out of students
out of students
Principal
S 10/9/12 1:14 PM Page 1
ENG - P.C.
--
--
--
--
--
--
--
--
No45
Not in PI
--%
--%
--%
--%
--%
56%
43%
56%
68%
--%
--%
--%
--%
--%--%--%--%
0%
0%
0%
0%