for more information - rand.org · lines of stock and is replenished by commercial prime vendors....
TRANSCRIPT
This document and trademark(s) contained herein are protected by law as indicated in a notice appearing later in this work. This electronic representation of RAND intellectual property is provided for non-commercial use only. Unauthorized posting of RAND PDFs to a non-RAND Web site is prohibited. RAND PDFs are protected under copyright law. Permission is required from RAND to reproduce, or reuse in another form, any of our research documents for commercial use. For information on reprint and linking permissions, please see RAND Permissions.
Limited Electronic Distribution Rights
Visit RAND at www.rand.org
Explore the RAND Arroyo Center
View document details
For More Information
Purchase this document
Browse Books & Publications
Make a charitable contribution
Support RAND
This PDF document was made available from www.rand.org as
a public service of the RAND Corporation.
6Jump down to document
The RAND Corporation is a nonprofit research organization providing objective analysis and effective solutions that address the challenges facing the public and private sectors around the world.
THE ARTS
CHILD POLICY
CIVIL JUSTICE
EDUCATION
ENERGY AND ENVIRONMENT
HEALTH AND HEALTH CARE
INTERNATIONAL AFFAIRS
NATIONAL SECURITY
POPULATION AND AGING
PUBLIC SAFETY
SCIENCE AND TECHNOLOGY
SUBSTANCE ABUSE
TERRORISM AND HOMELAND SECURITY
TRANSPORTATION ANDINFRASTRUCTURE
WORKFORCE AND WORKPLACE

This product is part of the RAND Corporation monograph series. RAND
monographs present major research findings that address the challenges facing
the public and private sectors. All RAND monographs undergo rigorous peer
review to ensure high standards for research quality and objectivity.
Assessment of the USCENTCOM Medical Distribution Structure
William Welser IV, Keenan D. Yoho, Marc Robbins, Eric Peltz,
Ben D. Van Roo, Adam C. Resnick, Ronald E. Harper
ARROYO CENTER
Prepared for the United States ArmyApproved for public release; distribution unlimited

The RAND Corporation is a nonprofit research organization providing objective analysis and effective solutions that address the challenges facing the public and private sectors around the world. RAND’s publications do not necessarily reflect the opinions of its research clients and sponsors.
R® is a registered trademark.
© Copyright 2010 RAND Corporation
Permission is given to duplicate this document for personal use only, as long as it is unaltered and complete. Copies may not be duplicated for commercial purposes. Unauthorized posting of RAND documents to a non-RAND Web site is prohibited. RAND documents are protected under copyright law. For information on reprint and linking permissions, please visit the R AND permissions page (http://www.rand.org/publications/permissions.html).
Published 2010 by the RAND Corporation1776 Main Street, P.O. Box 2138, Santa Monica, CA 90407-2138
1200 South Hayes Street, Arlington, VA 22202-50504570 Fifth Avenue, Suite 600, Pittsburgh, PA 15213-2665
RAND URL: http://www.rand.orgTo order RAND documents or to obtain additional information, contact
Distribution Services: Telephone: (310) 451-7002; Fax: (310) 451-6915; Email: [email protected]
The research described in this report was sponsored by the United States Army under Contract No. W74V8H-06-C-0001.
Library of Congress Cataloging-in-Publication Data
Assessment of the USCENTCOM medical distribution structure / William Welser, IV [et al.]. p. cm. Includes bibliographical references. ISBN 978-0-8330-4923-0 (pbk. : alk. paper) 1. United States--Armed Forces--Medical supplies. 2. United States--Armed Forces--Supplies and stores. 3. United States. Central Command. I. Welser, William. UH443.A884 2010355.8'8--dc222
2010007761

xi
Summary
In July 2008, the Director of Logistics of the Joint Staff (JSJ4) and the U.S. Army Deputy Chief of Staff , G-4 (Army G-4) visited the U.S. Central Command (USCENTCOM) area of responsibility (AOR) to review logistics operations. One of their questions was whether effi ciencies could be gained by combining medical and nonmedical warehouse distribution with stocks consolidated at one location. RAND Arroyo Center and U.S. Army Medical Research and Materiel Command (USAM-RMC) expanded this question and explored whether there might be less costly medi-cal distribution structures for USCENTCOM that would maintain the quality of health care delivery. In this report we describe the current distribution structure for medical (Class VIII) materiel for USCENTCOM customers, a set of alternatives, and the likely performance, cost, and other eff ects of changing the current system to that of one of the alternatives.
Background: The Current Distribution Structure and Its Origins
Class VIII materiel is supplied to USCENTCOM AOR customers from two distribu-tion centers: U.S. Army Medical Materiel Center, Southwest Asia (USAMMC-SWA), located at Camp As Sayliyah, Qatar; and U.S. Army Medical Materiel Center, Europe (USAMMCE), located in Pirmasens, Germany. Approximately 60 percent of the med-ical materiel sent to USCENTCOM AOR customers comes from USAMMC-SWA, which stocks 3,000 lines of the fastest-moving items and is replenished by USAMMCE. Th e other 40 percent of the requisitions that cannot be fi lled by USAMMC-SWA are passed back to and fi lled directly by USAMMCE, which carries approximately 13,000 lines of stock and is replenished by commercial prime vendors.
Non-Class VIII materiel for USCENTCOM customers is shipped primarily from the Defense Distribution Depot Kuwait, Southwest Asia (DDKS), from continental U.S. (CONUS) distribution centers—most often Defense Distribution Depot Susque-hanna, PA (DDSP)—and directly from vendors for certain classes of items such as food. Managed by the Defense Logistics Agency (DLA), DDKS is a contractor-owned and -operated distribution center that stores and distributes supply Classes II (such as
xii Assessment of the USCENTCOM Medical Distribution Structure
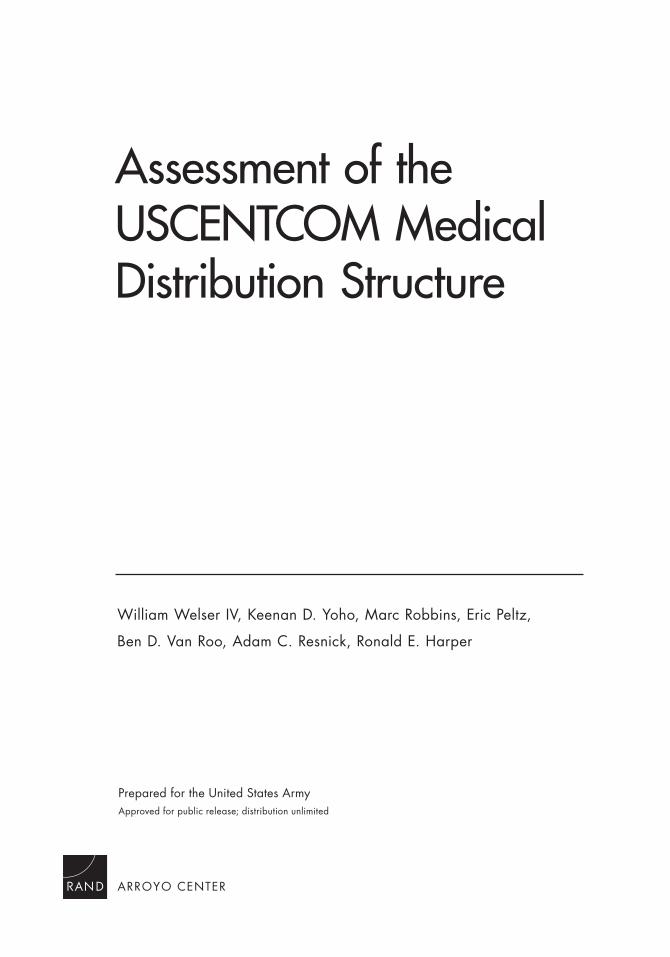
textiles, uniforms, tents), IIIp (packaged petroleum products), IV (barrier and con-struction materials), and IX (repair parts). Figure S.1 shows the locations for DDKS, USAMMCE, and USAMMC-SWA.
Initially, USCENTCOM nonmedical theater-level sustainment stocks were stored in Army general support (GS) supply support activities (SSAs), which were stood up in early 2003. When DDKS became active in 2004, the Army phased out the inven-tory levels in the Class II, IIIp, and IV and Class IX common GS SSAs so that they would not be replenished. However, a GS SSA remained in place to accept and process serviceable returns. In 2007, shipments from the GS SSA and DDKS were combined on pallets to improve distribution performance and improve transportation effi ciency through larger pallets built more quickly. In 2008, process and information system changes were made so that DDKS could take over the mission of receiving and pro-cessing serviceable returns for increased warehousing and distribution effi ciency. Th e new question was whether further effi ciencies could be gained by also consolidating distribution of non-Class VIII and Class VIII medical supplies.
Figure S.1Locations of USAMMCE, USAMMC-SWA, and DDKS
AUSTRIA
ITALY
GERMANY
FRANCE
HUNGARY
ROMANIA
BULGARIA
TURKEY
DENMARK
POLANDBELARUS
UKRAINE
CZECH
SLOVAKIA
GREECE
CYPRUS
NETH.
BELGIUM
ND
YUGOSLAVIA
ALBANIA
MOLDOVA
LITHUANIA
LATVIA
ESTONIA
LUX.
BOSNIA
CROATIASLOVENIA
SWITZERLAND
MACEDONIA
ETHIOPIA
ERITREA
SUDAN
EGYPT
SOMALIA
LIBYA
CHAD
CENTRAL AFRICAN REPUBLIC
TUNISIA
DJIBOUTI
JORDANISRAEL
LEBANON
ARMENIAAZERBAIJAN
GEORGIA
KYRGYZSTAN
TAJIKISTAN
KUWAIT
QATAR
BAHRAIN
U. A. E.
OMAN
YEMEN
SYRIA
IRAQ
IRAN
OMAN
SAUDI ARABIA
AFGHANISTAN
PAKISTAN
INDIA
KAZAKHSTAN
TURKMENISTAN
UZBEKISTAN
C H I N A
MYANMAR
NEPALBHUTAN
SRI LANKA
BANGLADESH
MONGOLIA
U. K.
MALTA
NorthSea
Mediterranean Sea
Baltic
Sea
Black Sea
Aral Sea
Arabian Sea
Bay of Bengal
Caspian Sea
Re
d
Se
a
RAND MG929-S.1
USAMMCE
DDKS
USAMMC-SWA

Summary xiii
Study Methodology and Evaluation of Options
Th e initial options were to consider supporting the USCENTCOM AOR with medi-cal materiel shipped via prime vendor support from CONUS through DDSP, stocking medical supplies at DDKS and closing the distribution center at USAMMC-SWA, and the status quo structure (see Table S.1). Two additional options were considered based upon preliminary data analysis and as a result of interviews with medical logisticians: providing all direct support of medical materiel to USCENTCOM from USAMMCE, and replicating more of the USAMMCE inventory at USAMMC-SWA so that it could directly provide most items to customers.
Th e fi rst criterion that each option had to satisfy was that of performance: Does the option maintain or improve performance with regard to how long it takes to fi ll orders? Th e medical supply chain is focused on clinical outcomes, and timely response to needs is considered critical, with current performance considered acceptable. Th us, the medical community expected that the performance for any new distribution option would be equal to or better than current performance.1 Second, is the option less costly than the status quo? If an option meets these two criteria of performance and cost, then it is considered a possible distribution option for medical materiel to the USCENT-COM AOR (see Figure S.2).
The CONUS Option
Th e best representation of the time associated with this option is the time for direct vendor delivery (DVD) shipments from CONUS, since there is no CONUS stockage of medical supplies—only prime vendor support. We compared average end-to-end distribution times for Class VIII and DVD shipments of Class IX materiel through the DDSP CCP to customers in USCENTCOM (see Figure S.3).2 Beginning at a vendor
Table S.1Medical Distribution Options Considered
Option Performance Cost Other
Status quo
Prime vendor from CONUS through DDSP CCP
Stock medical supplies at DDKS
Consolidate at USAMMCE (no USAMMC-SWA)
Replicate USAMMCE stocks at USAMMC-SWA
1 Performance is measured in terms of distribution time.2 Th e DVD model is the closest analogue to the current medical model that relies upon prime vendor support.
xiv Assessment of the USCENTCOM Medical Distribution Structure
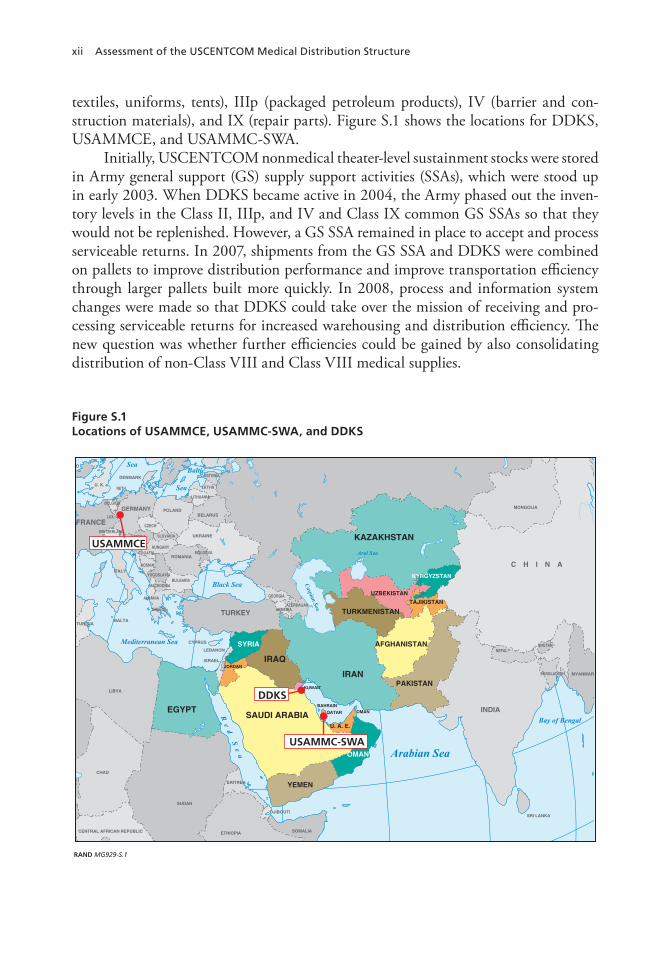
Figure S.2Decision Framework for Evaluating Distribution Options
RAND MG929-S.2
Yes
Yes
No
NoDoes the option
maintain or improveperformance?
Is the option morecost-effective?
Option is considered
Option is nolonger considered
Option is nolonger considered
Figure S.3Average Distribution Time Performance from CONUS
RAND MG929-S.3
0
5
10
15
20
25
30
Day
s
Combined documentdate to arrival
Document dateto arrival
Class IX vendor processing time may be longer than Class VIII
Ship dateto arrival
With and without vendor time, since medicalvendors may have different times
MRO to destination arrival for USAMMC-SWA and Class IX DVDs from CONUS to CENTCOM Customers
location, DVD Class IX materiel is shipped to the CCP and then forwarded on to the fi nal aerial port of debarkation (APOD). Th e average time from the moment a materiel release order (MRO) goes to the vendor for a DVD item until the materiel arrives at the customer’s APOD when originating from CONUS is 28 days, whereas Class VIII
Summary xv
average performance is 10 days total time. If we take out the vendor processing time to account for the possibility that medical prime vendors have better processes than the non-Class VIII DVD suppliers, the average time from shipment to arrival for DVD shipments is still longer than the total Class VIII average distribution time. Because the performance associated with the CONUS option is signifi cantly worse than that associated with the current medical materiel distribution structure, we did not consider this option further.
The DDKS Option
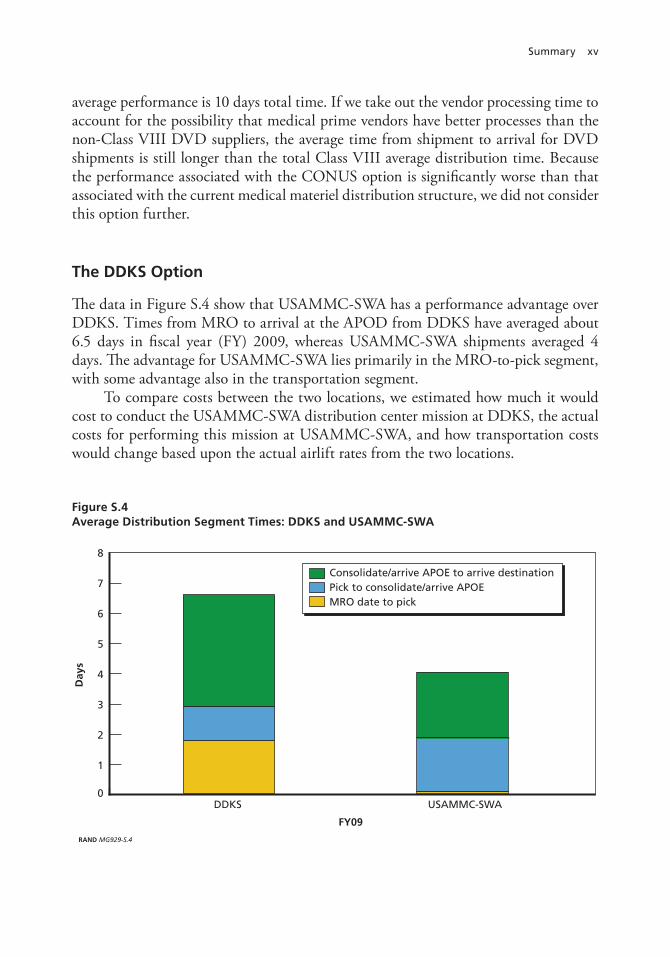
Th e data in Figure S.4 show that USAMMC-SWA has a performance advantage over DDKS. Times from MRO to arrival at the APOD from DDKS have averaged about 6.5 days in fi scal year (FY) 2009, whereas USAMMC-SWA shipments averaged 4 days. Th e advantage for USAMMC-SWA lies primarily in the MRO-to-pick segment, with some advantage also in the transportation segment.
To compare costs between the two locations, we estimated how much it would cost to conduct the USAMMC-SWA distribution center mission at DDKS, the actual costs for performing this mission at USAMMC-SWA, and how transportation costs would change based upon the actual airlift rates from the two locations.
Figure S.4Average Distribution Segment Times: DDKS and USAMMC-SWA
RAND MG929-S.4
0
1
2
3
4
7
6
5
8
Consolidate/arrive APOE to arrive destinationPick to consolidate/arrive APOEMRO date to pick
Day
s
DDKS USAMMC-SWA
FY09
xvi Assessment of the USCENTCOM Medical Distribution Structure
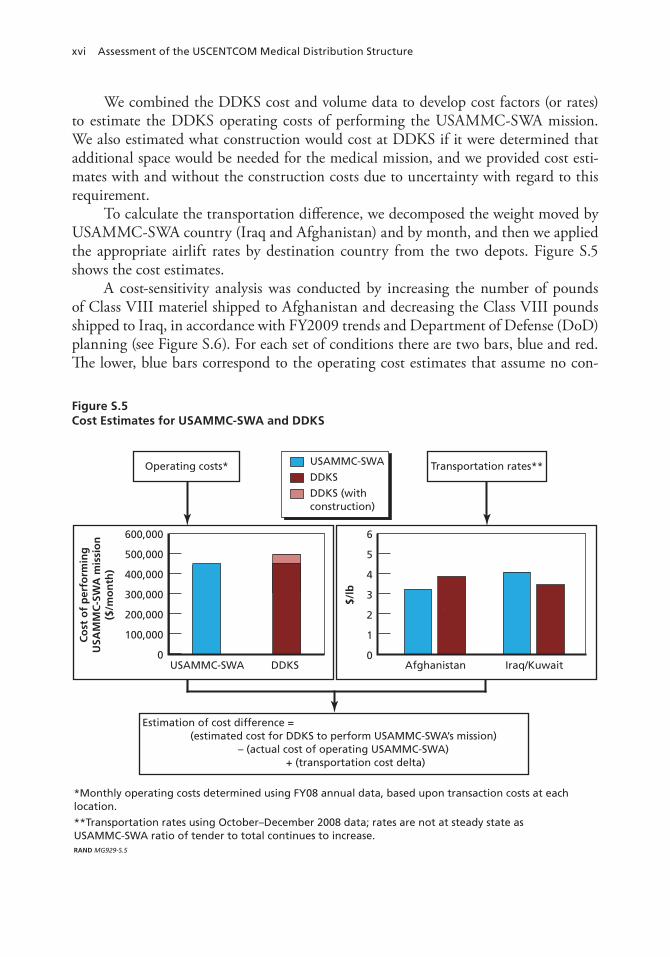
We combined the DDKS cost and volume data to develop cost factors (or rates) to estimate the DDKS operating costs of performing the USAMMC-SWA mission. We also estimated what construction would cost at DDKS if it were determined that additional space would be needed for the medical mission, and we provided cost esti-mates with and without the construction costs due to uncertainty with regard to this requirement.
To calculate the transportation diff erence, we decomposed the weight moved by USAMMC-SWA country (Iraq and Afghanistan) and by month, and then we applied the appropriate airlift rates by destination country from the two depots. Figure S.5 shows the cost estimates.
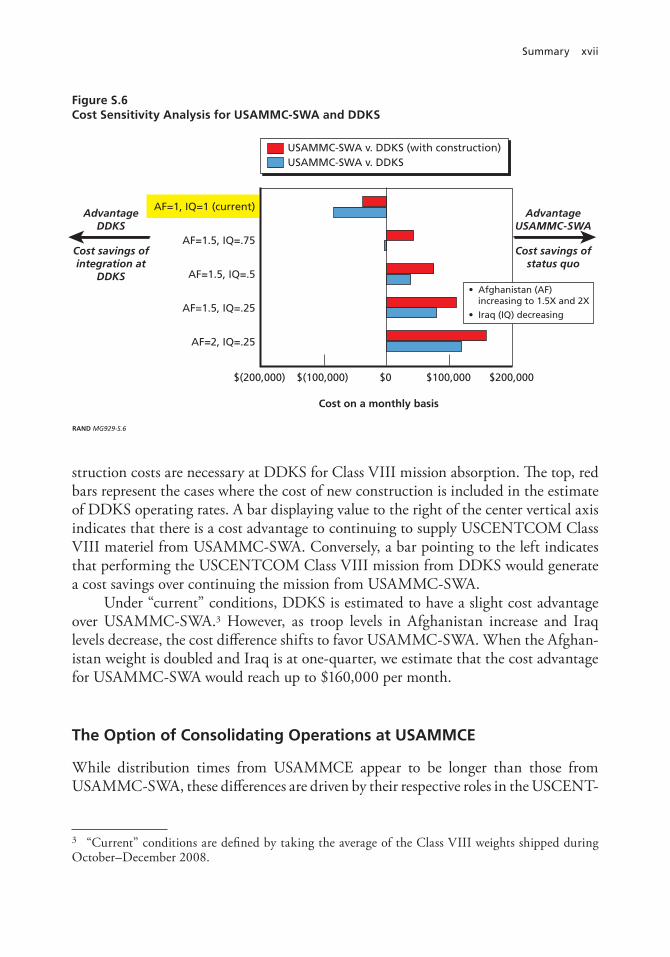
A cost-sensitivity analysis was conducted by increasing the number of pounds of Class VIII materiel shipped to Afghanistan and decreasing the Class VIII pounds shipped to Iraq, in accordance with FY2009 trends and Department of Defense (DoD) planning (see Figure S.6). For each set of conditions there are two bars, blue and red. Th e lower, blue bars correspond to the operating cost estimates that assume no con-
Figure S.5Cost Estimates for USAMMC-SWA and DDKS
RAND MG929-S.5
Estimation of cost difference = (estimated cost for DDKS to perform USAMMC-SWA’s mission) – (actual cost of operating USAMMC-SWA) + (transportation cost delta)
*Monthly operating costs determined using FY08 annual data, based upon transaction costs at each location.
**Transportation rates using October–December 2008 data; rates are not at steady state as USAMMC-SWA ratio of tender to total continues to increase.
Operating costs* Transportation rates**
400,000
300,000
200,000
100,000
600,000
500,000 5
4
3
2
1
6
00USAMMC-SWA DDKS Afghanistan Iraq/Kuwait
USAMMC-SWA
DDKS
DDKS (withconstruction)
Co
st o
f p
erfo
rmin
g
USA
MM
C-S
WA
mis
sio
n
($/m
on
th)
$/lb
Summary xvii
Figure S.6Cost Sensitivity Analysis for USAMMC-SWA and DDKS
RAND MG929-S.6
USAMMC-SWA v. DDKS (with construction)USAMMC-SWA v. DDKS
$100,000$0$(100,000)$(200,000) $200,000
AF=1, IQ=1 (current)
AF=1.5, IQ=.75
AF=1.5, IQ=.5
AF=1.5, IQ=.25
AF=2, IQ=.25
Advantage DDKS
Cost savings of integration at
DDKS
AdvantageUSAMMC-SWA
Cost savings of status quo
Cost on a monthly basis
• Afghanistan (AF) increasing to 1.5X and 2X
• Iraq (IQ) decreasing
struction costs are necessary at DDKS for Class VIII mission absorption. Th e top, red bars represent the cases where the cost of new construction is included in the estimate of DDKS operating rates. A bar displaying value to the right of the center vertical axis indicates that there is a cost advantage to continuing to supply USCENTCOM Class VIII materiel from USAMMC-SWA. Conversely, a bar pointing to the left indicates that performing the USCENTCOM Class VIII mission from DDKS would generate a cost savings over continuing the mission from USAMMC-SWA.
Under “current” conditions, DDKS is estimated to have a slight cost advantage over USAMMC-SWA.3 However, as troop levels in Afghanistan increase and Iraq levels decrease, the cost diff erence shifts to favor USAMMC-SWA. When the Afghan-istan weight is doubled and Iraq is at one-quarter, we estimate that the cost advantage for USAMMC-SWA would reach up to $160,000 per month.
The Option of Consolidating Operations at USAMMCE
While distribution times from USAMMCE appear to be longer than those from USAMMC-SWA, these diff erences are driven by their respective roles in the USCENT-
3 “Current” conditions are defi ned by taking the average of the Class VIII weights shipped during October–December 2008.
xviii Assessment of the USCENTCOM Medical Distribution Structure
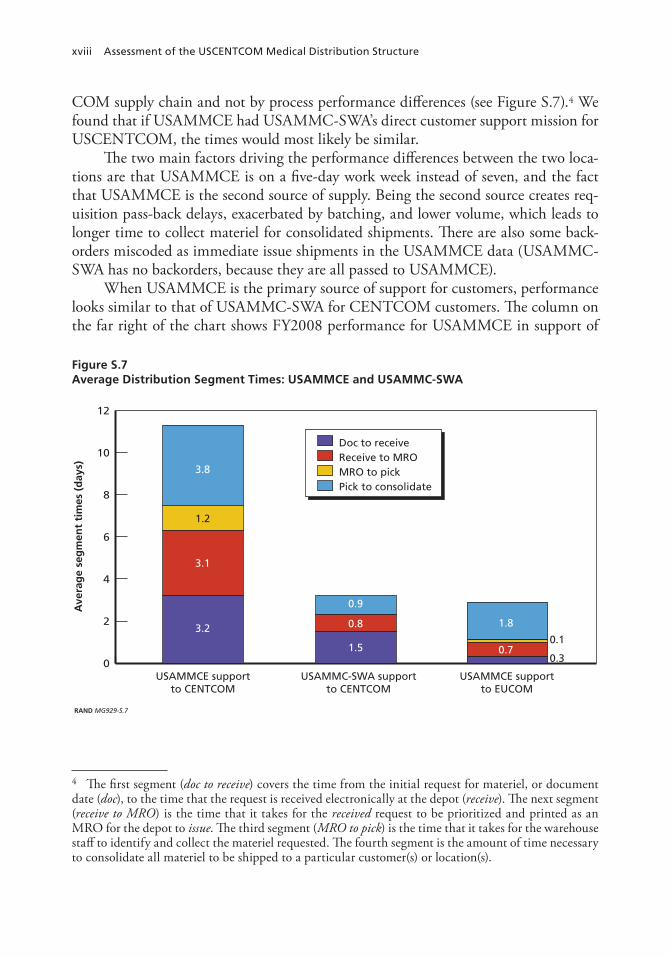
COM supply chain and not by process performance diff erences (see Figure S.7).4 We found that if USAMMCE had USAMMC-SWA’s direct customer support mission for USCENTCOM, the times would most likely be similar.
Th e two main factors driving the performance diff erences between the two loca-tions are that USAMMCE is on a fi ve-day work week instead of seven, and the fact that USAMMCE is the second source of supply. Being the second source creates req-uisition pass-back delays, exacerbated by batching, and lower volume, which leads to longer time to collect materiel for consolidated shipments. Th ere are also some back-orders miscoded as immediate issue shipments in the USAMMCE data (USAMMC-SWA has no backorders, because they are all passed to USAMMCE).
When USAMMCE is the primary source of support for customers, performance looks similar to that of USAMMC-SWA for CENTCOM customers. Th e column on the far right of the chart shows FY2008 performance for USAMMCE in support of
Figure S.7Average Distribution Segment Times: USAMMCE and USAMMC-SWA
RAND MG929-S.7
0
2
4
6
8
10
12
Doc to receiveReceive to MROMRO to pickPick to consolidate
Ave
rag
e se
gm
ent
tim
es (
day
s)
USAMMCE supportto CENTCOM
USAMMC-SWA supportto CENTCOM
USAMMCE supportto EUCOM
3.8
1.2
3.1
3.2
0.9
0.8
1.5
1.8
0.1
0.30.7
4 Th e fi rst segment (doc to receive) covers the time from the initial request for materiel, or document date (doc), to the time that the request is received electronically at the depot (receive). Th e next segment (receive to MRO) is the time that it takes for the received request to be prioritized and printed as an MRO for the depot to issue. Th e third segment (MRO to pick) is the time that it takes for the warehouse staff to identify and collect the materiel requested. Th e fourth segment is the amount of time necessary to consolidate all materiel to be shipped to a particular customer(s) or location(s).

Summary xix
major U.S. European Command (USEUCOM) customers. Overall times excluding transportation are roughly the same as for USAMMC-SWA for its USCENTCOM customers.5
Figure S.8 depicts the transportation structure for USAMMCE and USAMMC-SWA as of FY2009. USAMMCE uses a Class VIII commercial tender to move a high percentage (greater than 98 percent) of the total weight it ships to customers in USCENTCOM. USAMMC-SWA uses the Class VIII tender for roughly 40 percent of its shipments, in terms of weight. Note that the Class VIII tender shipments for both distribution centers are shipped through the same carrier hub for fi nal shipment to the destination airfi eld, and replenishments from USAMMCE to USAMMC-SWA are shipped through this same hub as well. Th e transportation structure drives most of the diff erence in the distribution costs between the two locations.
On the left-hand side of Figure S.9, we show USAMMC-SWA’s operating costs per month. In the same graph, we show the estimated monthly operating cost increase at USAMMCE were it to perform USAMMC-SWA’s mission. Th e total weight shipped would not change, because replenishment shipments would merely shift to customer issues. However, there would be an increase in transactions due to smaller
Figure S.8FY2009 Transportation Structure for USAMMCE and USAMMC-SWA
RAND MG929-S.8
NGARY
ROMANIA
BULGARIA
TURKEY
POLANDBELARUS
UKRAINESLOVAKIA
EECE
CYPRUS
SLAVIA
A
MOLDOVA
LITHUANIA
LATVIA
EDONIA
ERITREA
SUDAN
EGYPT
DJIBOUTI
JORDANISRAEL
LEBANON
ARMENIAAZERBAIJAN
GEORGIA
KYRGYZSTAN
TAJIKISTAN
KUWAIT
QATAR
BAHRAIN
U. A. E.
OMAN
YEMEN
SYRIA
IRAQ
IRAN
OMAN
SAUDI ARABIA
AFGHANISTAN
PAKISTAN
KAZAKHSTAN
TURKMENISTAN
UZBEKISTAN
an Sea
Sea
Black Sea
Aral Sea
Arabian Sea
Caspian Sea
Re
d
Se
aCENTCOM AORcustomers
Tender carrier hub
USAMMC-SWAQatar
Organicairlift
TheaterExpress
USAMMCEGermany
Al Udeid AB
Requisition
Pass
bac
k
~60%
~40%
~98%
*USAMMC-SWA ratio of tender to total rose in January–February 2009 to ~55%.
*
*
5 We have no means of measuring transportation times from USAMMCE to its USEUCOM custom-ers, so we exclude showing the transportation segment in all three cases in Figure S.7.
xx Assessment of the USCENTCOM Medical Distribution Structure
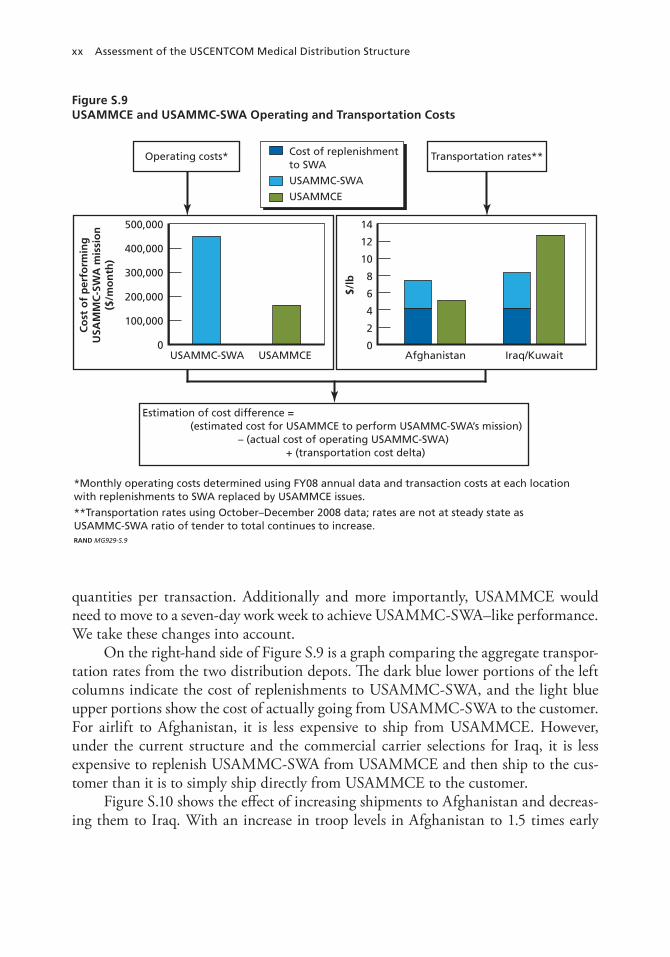
Figure S.9USAMMCE and USAMMC-SWA Operating and Transportation Costs
RAND MG929-S.9
Estimation of cost difference = (estimated cost for USAMMCE to perform USAMMC-SWA’s mission) – (actual cost of operating USAMMC-SWA) + (transportation cost delta)
*Monthly operating costs determined using FY08 annual data and transaction costs at each location with replenishments to SWA replaced by USAMMCE issues.
**Transportation rates using October–December 2008 data; rates are not at steady state as USAMMC-SWA ratio of tender to total continues to increase.
Operating costs* Transportation rates**
400,000
300,000
200,000
100,000
500,000
12
10
8
6
4
2
14
00USAMMC-SWA USAMMCE Afghanistan Iraq/Kuwait
Cost of replenishmentto SWA
USAMMC-SWA
USAMMCE
Co
st o
f p
erfo
rmin
g
USA
MM
C-S
WA
mis
sio
n
($/m
on
th)
$/lb
quantities per transaction. Additionally and more importantly, USAMMCE would need to move to a seven-day work week to achieve USAMMC-SWA–like performance. We take these changes into account.
On the right-hand side of Figure S.9 is a graph comparing the aggregate transpor-tation rates from the two distribution depots. Th e dark blue lower portions of the left columns indicate the cost of replenishments to USAMMC-SWA, and the light blue upper portions show the cost of actually going from USAMMC-SWA to the customer. For airlift to Afghanistan, it is less expensive to ship from USAMMCE. However, under the current structure and the commercial carrier selections for Iraq, it is less expensive to replenish USAMMC-SWA from USAMMCE and then ship to the cus-tomer than it is to simply ship directly from USAMMCE to the customer.
Figure S.10 shows the eff ect of increasing shipments to Afghanistan and decreas-ing them to Iraq. With an increase in troop levels in Afghanistan to 1.5 times early

Summary xxi
Figure S.10Cost Sensitivity Analysis for USAMMCE and USAMMC-SWA
RAND MG929-S.10
$200,000$0$(200,000)$(400,000) $400,000
AF=1, IQ=1 (current)
AF=1.5, IQ=.75
AF=1.5, IQ=.5
AF=1.5, IQ=.25
AF=2, IQ=.25
Advantage USAMMCE
Cost savings of consolidation at USAMMCE
AdvantageUSAMMC-SWA
Cost savings of status quo
Cost on a monthly basis
• Afghanistan (AF) increasing to 1.5X and 2X
• Iraq (IQ) decreasing
NOTE: Cost of replenishment is included for SWA for all cases.
USAMMC-SWA v. USAMMCE (with overtime)
FY2009 levels and Iraq levels decreasing in 25-percent steps from the early FY2009 levels, the cost comparison shifts from favoring the status quo to favoring consolida-tion at USAMMCE. If the troop strength in Afghanistan were to double from early FY2009 levels and troop levels in Iraq were to fall to one-quarter of early FY2009 levels, there would be an estimated savings of roughly $300,000 per month associated with consolidating distribution support for USCENTCOM at USAMMCE.
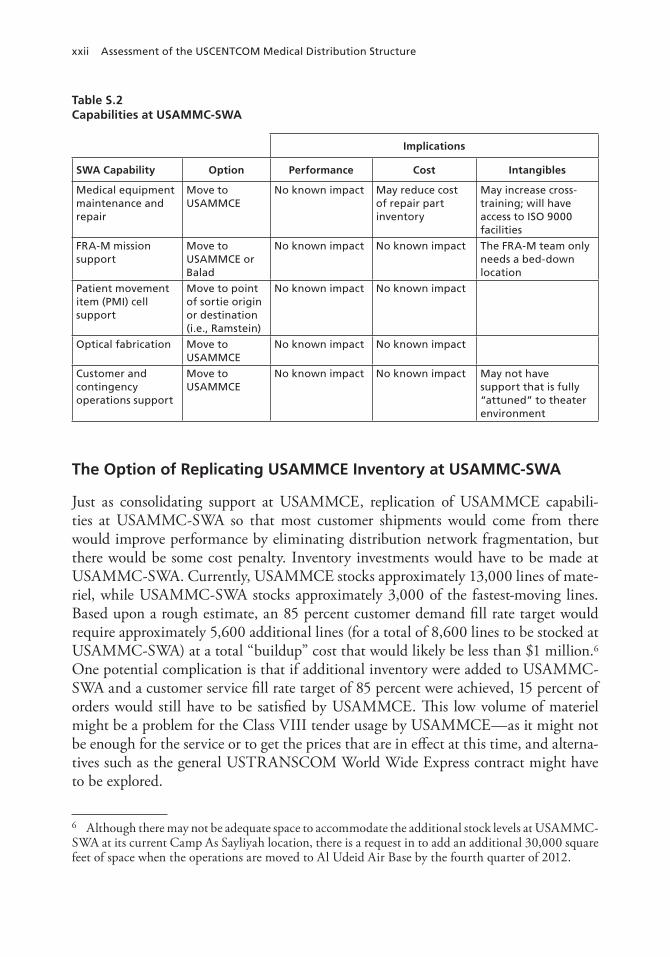
As shown in Table S.2, there are several other capabilities at USAMMC-SWA other than materiel warehousing and distribution, namely: medical equipment main-tenance/repair, forward repair activity mission (FRA-M) support, patient movement item (PMI) cell support, optical fabrication, and customer technical support. How-ever, medical maintenance actions conducted at USAMMC-SWA could probably be absorbed into the existing USAMMCE maintenance operations. Additionally, cen-tralizing repair parts inventory at one location could reduce the overall cost of this inventory. Centralizing repair technicians could also facilitate cross-training among the workforce and provide more time on equipment for repair experience. We did not fi nd any data that would indicate performance degradation or an increase in costs if the FRA-M teams, PMI cell support, optical fabrication, or customer support were not located at USAMMC-SWA.
xxii Assessment of the USCENTCOM Medical Distribution Structure
Table S.2Capabilities at USAMMC-SWA
Implications
SWA Capability Option Performance Cost Intangibles
Medical equipment maintenance and repair
Move to USAMMCE
No known impact May reduce cost of repair part inventory
May increase cross-training; will have access to ISO 9000 facilities
FRA-M mission support
Move to USAMMCE or Balad
No known impact No known impact The FRA-M team only needs a bed-down location
Patient movement item (PMI) cell support
Move to point of sortie origin or destination (i.e., Ramstein)
No known impact No known impact
Optical fabrication Move to USAMMCE
No known impact No known impact
Customer and contingency operations support
Move to USAMMCE
No known impact No known impact May not have support that is fully “attuned” to theater environment
The Option of Replicating USAMMCE Inventory at USAMMC-SWA
Just as consolidating support at USAMMCE, replication of USAMMCE capabili-ties at USAMMC-SWA so that most customer shipments would come from there would improve performance by eliminating distribution network fragmentation, but there would be some cost penalty. Inventory investments would have to be made at USAMMC-SWA. Currently, USAMMCE stocks approximately 13,000 lines of mate-riel, while USAMMC-SWA stocks approximately 3,000 of the fastest-moving lines. Based upon a rough estimate, an 85 percent customer demand fi ll rate target would require approximately 5,600 additional lines (for a total of 8,600 lines to be stocked at USAMMC-SWA) at a total “buildup” cost that would likely be less than $1 million.6 One potential complication is that if additional inventory were added to USAMMC-SWA and a customer service fi ll rate target of 85 percent were achieved, 15 percent of orders would still have to be satisfi ed by USAMMCE. Th is low volume of materiel might be a problem for the Class VIII tender usage by USAMMCE—as it might not be enough for the service or to get the prices that are in eff ect at this time, and alterna-tives such as the general USTRANSCOM World Wide Express contract might have to be explored.
6 Although there may not be adequate space to accommodate the additional stock levels at USAMMC-SWA at its current Camp As Sayliyah location, there is a request in to add an additional 30,000 square feet of space when the operations are moved to Al Udeid Air Base by the fourth quarter of 2012.
Summary xxiii
In addition to inventory, there would be a need for personnel to manage the medical air bridge supplying materiel coming out of CONUS, assuming direct replen-ishment as opposed to replenishment from USAMMCE stocks, as well as personnel to manage the new item requests (NIRs), which number in the hundreds per month at USAMMCE. An alternative to locating the vendor support and NIR processing forward could be to establish a capability within CONUS to remotely perform these activities.
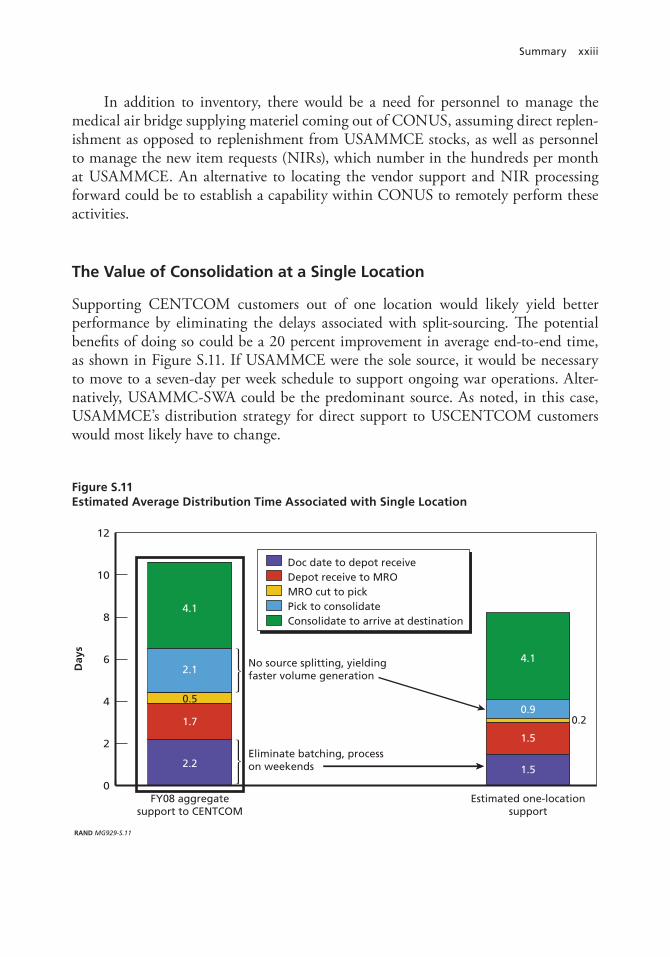
The Value of Consolidation at a Single Location
Supporting CENTCOM customers out of one location would likely yield better performance by eliminating the delays associated with split-sourcing. Th e potential benefi ts of doing so could be a 20 percent improvement in average end-to-end time, as shown in Figure S.11. If USAMMCE were the sole source, it would be necessary to move to a seven-day per week schedule to support ongoing war operations. Alter-natively, USAMMC-SWA could be the predominant source. As noted, in this case, USAMMCE’s distribution strategy for direct support to USCENTCOM customers would most likely have to change.
Figure S.11Estimated Average Distribution Time Associated with Single Location
RAND MG929-S.11
0
2
4
6
8
10
12
Doc date to depot receiveDepot receive to MROMRO cut to pickPick to consolidateConsolidate to arrive at destination
No source splitting, yielding faster volume generation
Eliminate batching, process on weekends
Day
s
FY08 aggregatesupport to CENTCOM
Estimated one-location support
4.1
2.1
0.5
2.2
1.7
1.5
0.9
4.1
0.2
1.5
xxiv Assessment of the USCENTCOM Medical Distribution Structure
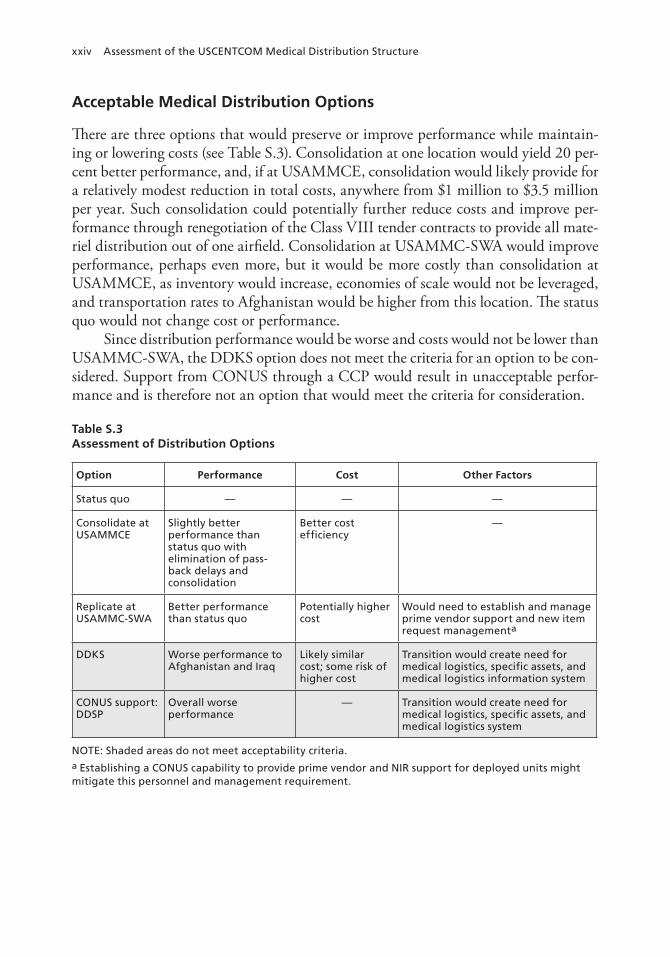
Acceptable Medical Distribution Options
Th ere are three options that would preserve or improve performance while maintain-ing or lowering costs (see Table S.3). Consolidation at one location would yield 20 per-cent better performance, and, if at USAMMCE, consolidation would likely provide for a relatively modest reduction in total costs, anywhere from $1 million to $3.5 million per year. Such consolidation could potentially further reduce costs and improve per-formance through renegotiation of the Class VIII tender contracts to provide all mate-riel distribution out of one airfi eld. Consolidation at USAMMC-SWA would improve performance, perhaps even more, but it would be more costly than consolidation at USAMMCE, as inventory would increase, economies of scale would not be leveraged, and transportation rates to Afghanistan would be higher from this location. Th e status quo would not change cost or performance.
Since distribution performance would be worse and costs would not be lower than USAMMC-SWA, the DDKS option does not meet the criteria for an option to be con-sidered. Support from CONUS through a CCP would result in unacceptable perfor-mance and is therefore not an option that would meet the criteria for consideration.
Table S.3Assessment of Distribution Options
Option Performance Cost Other Factors
Status quo — — —
Consolidate at USAMMCE
Slightly better performance than status quo with elimination of pass-back delays and consolidation
Better cost effi ciency
—
Replicate at USAMMC-SWA
Better performance than status quo
Potentially higher cost
Would need to establish and manage prime vendor support and new item request managementa
DDKS Worse performance to Afghanistan and Iraq
Likely similar cost; some risk of higher cost
Transition would create need for medical logistics, specifi c assets, and medical logistics information system
CONUS support: DDSP
Overall worse performance
— Transition would create need for medical logistics, specifi c assets, and medical logistics system
NOTE: Shaded areas do not meet acceptability criteria.a Establishing a CONUS capability to provide prime vendor and NIR support for deployed units might mitigate this personnel and management requirement.