for personal use only - asx · • net tangible assets per share as at 30 june 2017, before...
TRANSCRIPT
ABN 56 004 147 120
APPENDIX 4E STATEMENT FOR THE YEAR ENDED 30 JUNE 2017
CONTENTS
• Results for announcement to the market
• Media Release
• Appendix 4E Accounts
• Independent Audit Report
These documents comprise the preliminary final report given to ASX under Listing Rule 4.3A.
1
For
per
sona
l use
onl
y
RESULTS FOR ANNOUNCEMENT TO THE MARKET The reporting period is the year ended 30 June 2017 with the prior corresponding period being the year ended 30 June 2016.
This report is based on audited financial statements. A copy of the audit report can be found on page 39.
Results for announcement to the market
• Net profit attributable to members (excluding minority interests) was $245.0 million, 7.7%down from the prior year.
• Revenue from operating activities was $277.7 million, 5.4% down from the prior year.
• The Management Expense Ratio (“MER”) calculated as the net expenses of managing theCompany as a percentage of the average value of its investments including cash over theyear, was 0.14% for the year (2016: 0.16%).
• Net tangible assets per share as at 30 June 2017, before allowing for the final dividend, were$5.89 per share before allowing for the provision of deferred tax on unrealised gains in theinvestment portfolio (2016: $5.50).
• A fully-franked final dividend of 14 cents per share, the same as last year’s final dividend,will be paid on 30 August 2017 to shareholders on the register on 9 August 2017. The sharesare expected to trade ex-dividend on 8 August 2017. There is no conduit foreign incomecomponent of the dividend.
• NZ 3 cents of the final dividend will carry a New Zealand imputation credit.
• There is no “LIC gain’ attached to the final dividend this year.
• The interim dividend of 10 cents per share was paid to shareholders on 24 February 2017.
• The total dividend for the financial year is therefore 24 cents per share, fully-franked, thesame as last year.
• A Dividend Reinvestment Plan (DRP) and Dividend Substitution Share Plan (DSSP) areavailable, the price for both of which will be set at a nil discount to the Volume WeightedAverage Price of the Company’s shares traded on the ASX and Chi-X automated tradingsystems over the five trading days after the shares trade ex-dividend. Notices of participationin the DRP & the DSSP need to be received by the share registry by 5 pm (AEST) on 10August 2017. All shares issued under the DRP and DSSP will rank equally with existingshares.
• The 2017 AGM will be held at the RACV City Club, Melbourne, at 10.00 AM on Thursday 12October.
2
For
per
sona
l use
onl
y
Market looks to company reporting season as valuations remain high
Full Year Report to 30 June 2017 Key Themes –
AFIC invests in a diversified portfolio of Australian equities, seeking to provideshareholders attractive income and capital growth over the medium to longterm at a low cost.
Equity markets globally have been generally buoyant with the US marketreaching an all-time high in anticipation of improved economic growth there.
The Australian market has also risen strongly, led by a rebound in sentimenttoward resources and banks.
Share prices across a number of sectors in Australia, in our view, are fully priced. In this context, the upcoming reporting season will be important to support
market valuations. AFIC has cash resources available to invest in quality companies when value
presents itself.
Result Summary –
Full Year Profit of $245.3 million, down from $265.8 million in thecorresponding period last year:
- Investment income declined $15.2 million, primarily as a result of a cut individends across a broad range of large companies, including resourceand energy holdings.
- Trading income was down to $3.1 million (from $12.3 million), as largegains generated in the prior corresponding period were not repeated thisyear.
Final Dividend maintained at 14 cents per share fully franked. Total dividends of24 cents per share fully franked, the same as last year
Management expense ratio of 0.14% Twelve month portfolio return was 11.7%; including franking it was 13.7%.
3
For
per
sona
l use
onl
y
Portfolio Performance The Australian market has risen strongly over the past twelve months as investors embraced a more positive outlook for global growth. In particular this led to rising commodity prices, with the resources index up 22.9% over the period after two years of underperformance. The banking sector also enjoyed a strong rebound over the year to produce a return of 18.4%. This was somewhat surprising given the headwinds the sector appears to be facing from regulatory and economic conditions as well as new taxes/levies. However the dividend yield on offer in this sector remains attractive for income-focused investors.
AFIC’s portfolio was up 11.7% for the 12 months to 30 June 2017 compared with the S&P/ASX 200 Accumulation Index, which increased 14.1%. AFIC traditionally invests in the large resource companies such as BHP and Rio Tinto and so the portfolio was not exposed to the significant rise in the more cyclical, mid-sized resource companies which increased by approximately 76% over the period. In addition, whilst the portfolio maintains a very strong representation of the four major banks, AFIC’s exposure of 24.5% is below the 28% Index exposure to this sector.
The longer term performance of the portfolio, which is more in line with the Company’s investment timeframes, was 6.1% per annum for the 10 years to 30 June 2017, versus the Index return of 5.2% per annum (these returns include the full benefit of franking). AFIC’s performance figures are after expenses and tax paid.
Portfolio Adjustments Major purchases included Link Administration Holdings which is new to the portfolio. AFIC also added to this holding through participation in its share placement to purchase Capita Asset Services in the UK. Carsales.com and Isentia were also added to the portfolio. Other major additions were to existing holdings in CSL, Brambles (following the recent fall in its share price) and CYBG (Clydesdale Bank).
Major sales included a slight reduction in the AGL and APA Group holdings and the complete disposal of the residual position in Santos early in the year. Cover-More Group and Asciano were sold as a result of takeovers. The position in Vocus Group, which was added to during the year, was subsequently sold following a marked downturn in its outlook.
Going Forward Many sectors in the Australian market are trading at or close to the top of their long-term valuation ranges. Whilst this may be understandable against the backdrop of very low interest rates, the outlook for the Australian economy remains somewhat mixed. The outcome of the upcoming reporting season will be important in providing support for the high share prices of many companies.
On a positive note, global growth may continue to deliver a better than expected outcome for commodity prices. There has also recently been a pickup in non-mining investment. However, as a counter to these trends, high levels of household debt relative to real wages growth is producing a weak outlook for consumption.
Heightened taxation risk from federal and state governments in an environment where budgets are under pressure has unfortunately also become a recent feature of the Australian economy. The latest move to tax the five larger banks is in our view symptomatic of an opportunistic approach to policy. It is not a substitute for a more well-considered comprehensive approach to taxation and budget reform. Reforms are a difficult task for any government, but we believe they are necessary to create a more robust foundation for the Australian economy going forward. Please direct any enquiries to: Ross Barker Geoff Driver Managing Director General Manager (03) 9225 2101 (03) 9225 2102
24 July 2017
4
For
per
sona
l use
onl
y

MAJOR TRANSACTIONS IN THE INVESTMENT PORTFOLIO
Acquisitions Cost ($’000)
Link Administration Holdings (including $6.11m in 4 for 11 issue at $6.75 per share) 26,867 CSL 19,701 Carsales.com 18,537 Brambles 16,063 CYBG 12,103 Isentia Group 12,065 Vocus Group (subsequently sold) 11,831 Cochlear 11,551
Disposals Proceeds ($’000)
AGL Energy 24,835 Cover-More Group (Takeover by Zurich Insurance) # 21,568 Vocus Group# 17,154 Asciano (Takeover by Qube/Brookfield Infrastructure consortium) # 16,280 Santos# 12,385 APA Group 12,107
# complete disposal from the portfolio
New Companies Added to the Investment Portfolio
Link Administration Holdings Carsales.com
Isentia Group Altium
5
For
per
sona
l use
onl
y
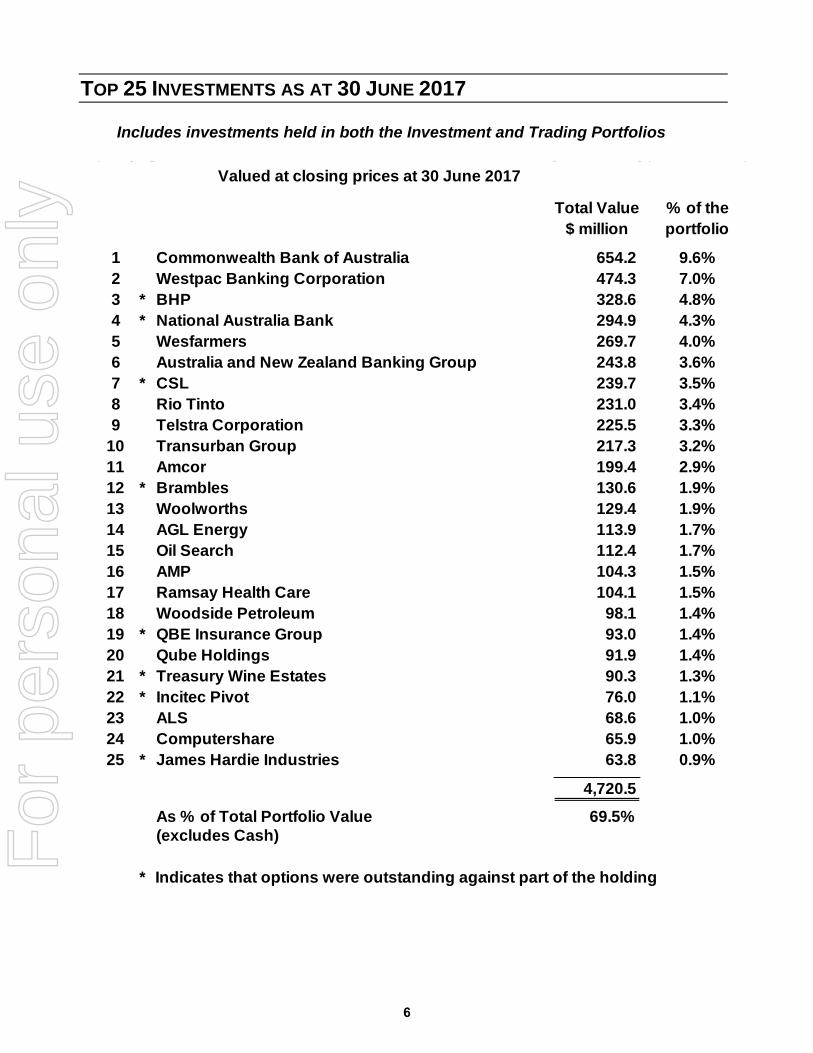
TOP 25 INVESTMENTS AS AT 30 JUNE 2017
Includes investments held in both the Investment and Trading Portfolios
Total Value$ million
1 Commonwealth Bank of Australia 654.2 9.6%2 Westpac Banking Corporation 474.3 7.0%3 * BHP 328.6 4.8%4 * National Australia Bank 294.9 4.3%5 Wesfarmers 269.7 4.0%6 Australia and New Zealand Banking Group 243.8 3.6%7 * CSL 239.7 3.5%8 Rio Tinto 231.0 3.4%9 Telstra Corporation 225.5 3.3%
10 Transurban Group 217.3 3.2%11 Amcor 199.4 2.9%12 * Brambles 130.6 1.9%13 Woolworths 129.4 1.9%14 AGL Energy 113.9 1.7%15 Oil Search 112.4 1.7%16 AMP 104.3 1.5%17 Ramsay Health Care 104.1 1.5%18 Woodside Petroleum 98.1 1.4%19 * QBE Insurance Group 93.0 1.4%20 Qube Holdings 91.9 1.4%21 * Treasury Wine Estates 90.3 1.3%22 * Incitec Pivot 76.0 1.1%23 ALS 68.6 1.0%24 Computershare 65.9 1.0%25 * James Hardie Industries 63.8 0.9%
4,720.5
As % of Total Portfolio Value 69.5%(excludes Cash)
* Indicates that options were outstanding against part of the holding
Valued at closing prices at 30 June 2017
% of the portfolio
6
For
per
sona
l use
onl
y
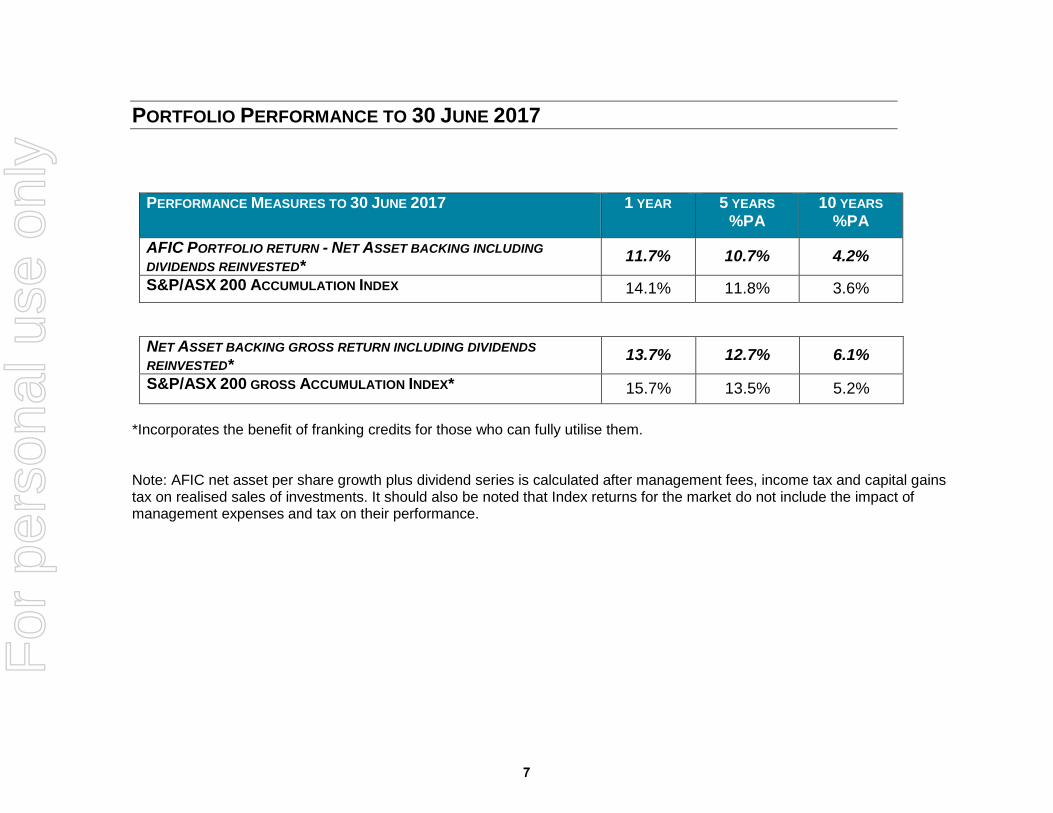
PORTFOLIO PERFORMANCE TO 30 JUNE 2017
PERFORMANCE MEASURES TO 30 JUNE 2017 1 YEAR 5 YEARS%PA
10 YEARS%PA
AFIC PORTFOLIO RETURN - NET ASSET BACKING INCLUDINGDIVIDENDS REINVESTED* 11.7% 10.7% 4.2%
S&P/ASX 200 ACCUMULATION INDEX 14.1% 11.8% 3.6%
NET ASSET BACKING GROSS RETURN INCLUDING DIVIDENDSREINVESTED* 13.7% 12.7% 6.1%
S&P/ASX 200 GROSS ACCUMULATION INDEX* 15.7% 13.5% 5.2%
*Incorporates the benefit of franking credits for those who can fully utilise them.
Note: AFIC net asset per share growth plus dividend series is calculated after management fees, income tax and capital gains tax on realised sales of investments. It should also be noted that Index returns for the market do not include the impact of management expenses and tax on their performance.
7
For
per
sona
l use
onl
y
Australian Foundation Investment Company Limited (AFIC) Consolidated Annual Financial Statements
30 June 2017
8
For
per
sona
l use
onl
y
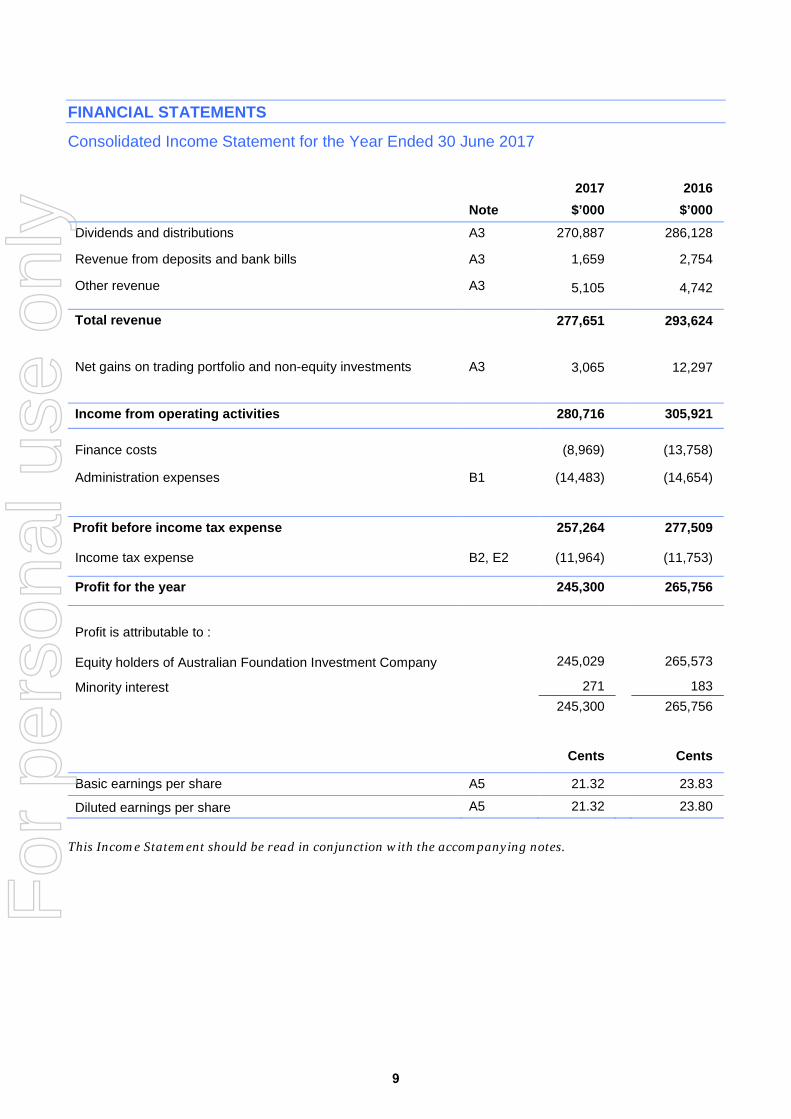
FINANCIAL STATEMENTS
Consolidated Income Statement for the Year Ended 30 June 2017
2017
2016
Note $’000 $’000 Dividends and distributions A3 270,887 286,128
Revenue from deposits and bank bills A3 1,659 2,754
Other revenue A3 5,105 4,742
Total revenue 277,651 293,624
Net gains on trading portfolio and non-equity investments A3 3,065 12,297
Income from operating activities
280,716 305,921
Finance costs (8,969) (13,758)
Administration expenses B1 (14,483) (14,654)
Profit before income tax expense 257,264 277,509
Income tax expense B2, E2 (11,964) (11,753)
Profit for the year 245,300 265,756
Profit is attributable to :
Equity holders of Australian Foundation Investment Company
245,029 265,573
Minority interest 271 183 245,300 265,756 Cents Cents
Basic earnings per share
A5 21.32 23.83
Diluted earnings per share A5 21.32 23.80
This Income Statement should be read in conjunction with the accompanying notes.
9
For
per
sona
l use
onl
y
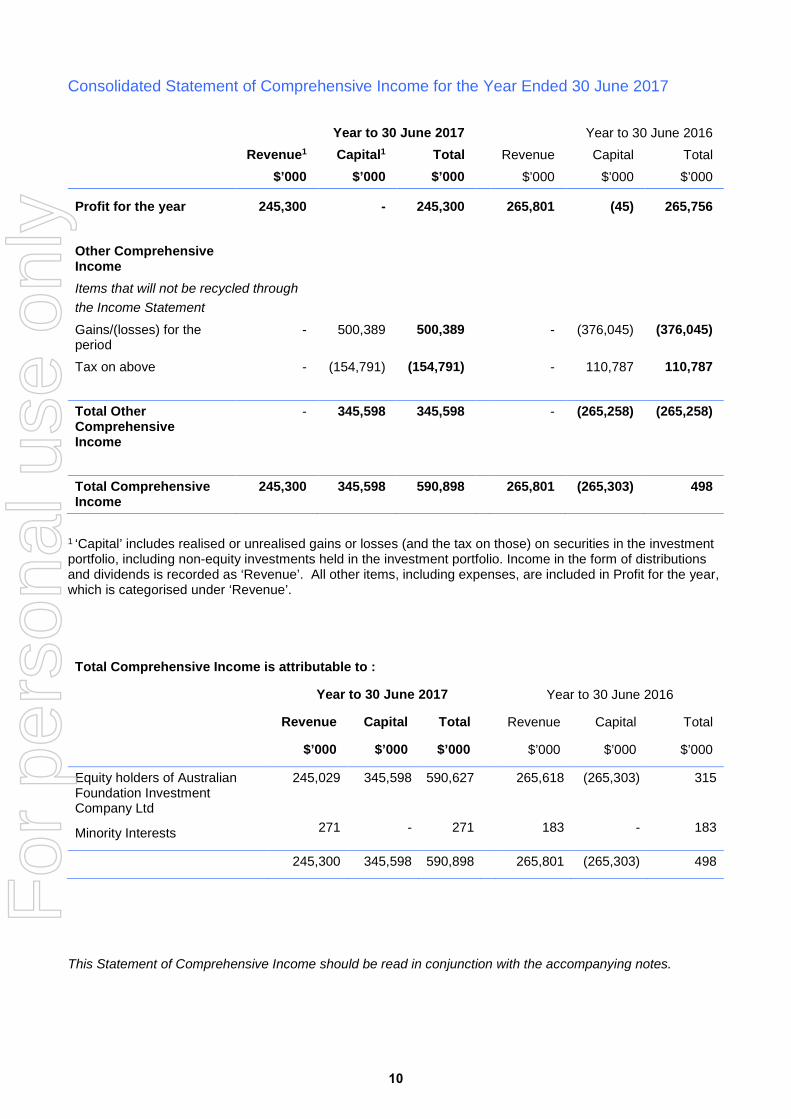
Consolidated Statement of Comprehensive Income for the Year Ended 30 June 2017
Year to 30 June 2017 Year to 30 June 2016
Revenue1 Capital1 Total Revenue Capital Total
$’000 $’000 $’000 $’000 $’000 $’000
Profit for the year 245,300 - 245,300 265,801 (45) 265,756
Other Comprehensive Income
Items that will not be recycled through the Income Statement
Gains/(losses) for the period
- 500,389 500,389 - (376,045) (376,045)
Tax on above - (154,791) (154,791) - 110,787 110,787
Total Other Comprehensive Income
- 345,598 345,598 - (265,258) (265,258)
Total Comprehensive Income
245,300 345,598 590,898 265,801 (265,303) 498
1 ‘Capital’ includes realised or unrealised gains or losses (and the tax on those) on securities in the investment portfolio, including non-equity investments held in the investment portfolio. Income in the form of distributions and dividends is recorded as ‘Revenue’. All other items, including expenses, are included in Profit for the year, which is categorised under ‘Revenue’.
Total Comprehensive Income is attributable to :
Year to 30 June 2017 Year to 30 June 2016
Revenue Capital Total Revenue Capital Total
$’000 $’000 $’000 $’000 $’000 $’000
Equity holders of Australian Foundation Investment Company Ltd
Minority Interests
245,029
271
345,598
-
590,627
271
265,618
183
(265,303)
-
315
183
245,300 345,598 590,898 265,801 (265,303) 498
This Statement of Comprehensive Income should be read in conjunction with the accompanying notes.
10
For
per
sona
l use
onl
y
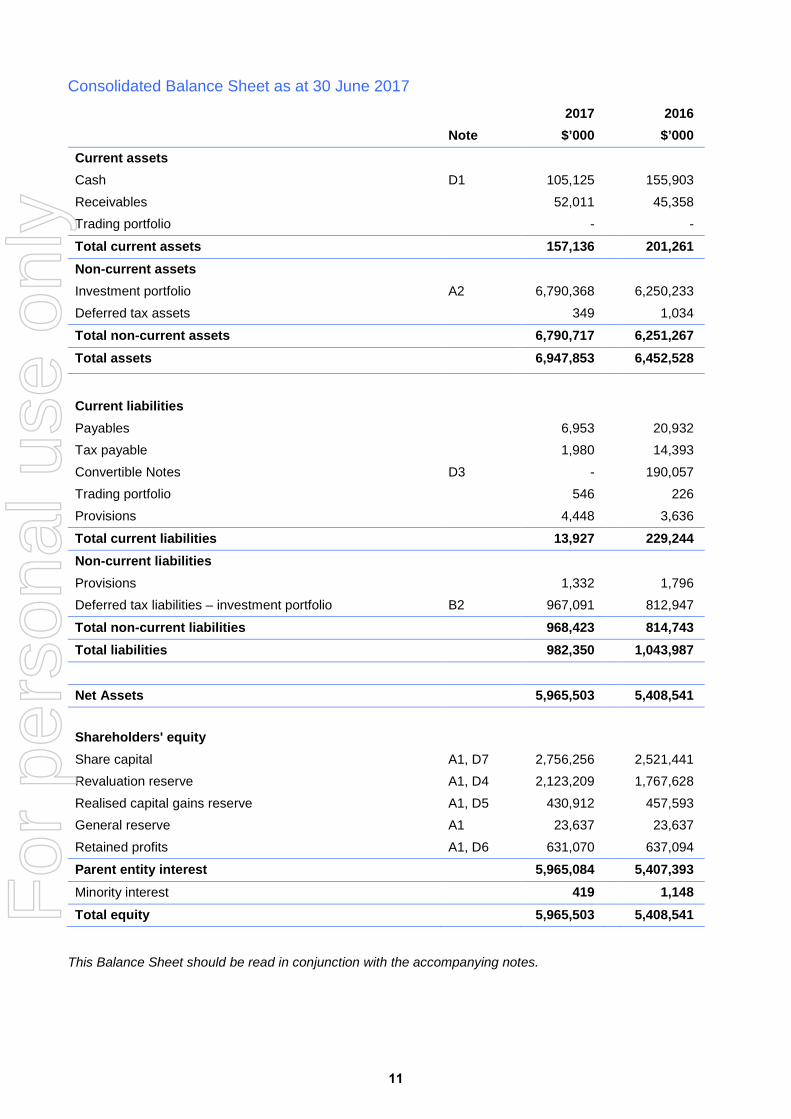
Consolidated Balance Sheet as at 30 June 2017
2017 2016 Note $’000 $’000 Current assets Cash D1 105,125 155,903 Receivables 52,011 45,358 Trading portfolio - - Total current assets 157,136 201,261 Non-current assets Investment portfolio A2 6,790,368 6,250,233 Deferred tax assets 349 1,034 Total non-current assets 6,790,717 6,251,267 Total assets 6,947,853 6,452,528
Current liabilities Payables 6,953 20,932 Tax payable 1,980 14,393 Convertible Notes D3 - 190,057 Trading portfolio 546 226 Provisions 4,448 3,636 Total current liabilities 13,927 229,244 Non-current liabilities Provisions 1,332 1,796 Deferred tax liabilities – investment portfolio B2 967,091 812,947 Total non-current liabilities 968,423 814,743 Total liabilities 982,350 1,043,987 Net Assets 5,965,503 5,408,541
Shareholders' equity
Share capital A1, D7 2,756,256 2,521,441 Revaluation reserve A1, D4 2,123,209 1,767,628 Realised capital gains reserve A1, D5 430,912 457,593 General reserve A1 23,637 23,637 Retained profits A1, D6 631,070 637,094 Parent entity interest 5,965,084 5,407,393 Minority interest 419 1,148 Total equity 5,965,503 5,408,541
This Balance Sheet should be read in conjunction with the accompanying notes.
11
For
per
sona
l use
onl
y
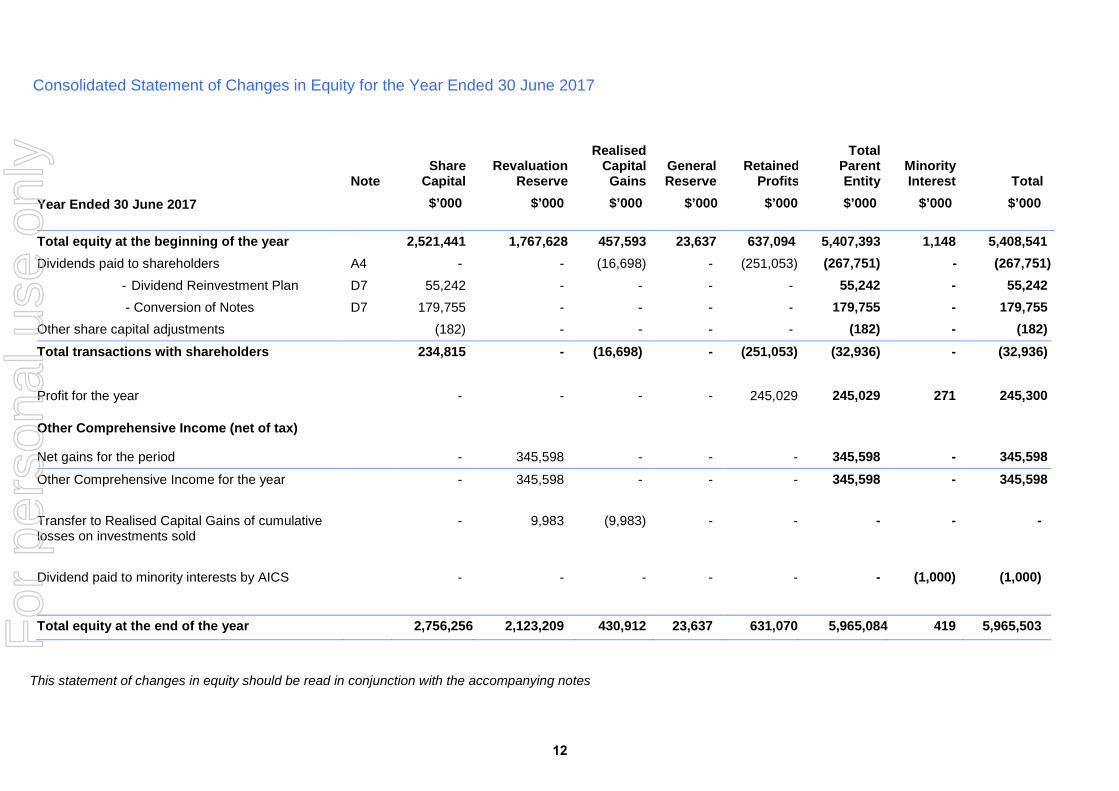
Consolidated Statement of Changes in Equity for the Year Ended 30 June 2017
Note
Share Capital
Revaluation Reserve
Realised Capital Gains
General Reserve
Retained Profits
Total Parent Entity
Minority Interest Total
Year Ended 30 June 2017 $’000 $’000 $’000 $’000 $’000 $’000 $’000 $’000
Total equity at the beginning of the year 2,521,441 1,767,628 457,593 23,637 637,094 5,407,393 1,148 5,408,541 Dividends paid to shareholders A4 - - (16,698) - (251,053) (267,751) - (267,751)
- Dividend Reinvestment Plan D7 55,242 - - - - 55,242 - 55,242 - Conversion of Notes D7 179,755 - - - - 179,755 - 179,755 Other share capital adjustments (182) - - - - (182) - (182) Total transactions with shareholders 234,815 - (16,698) - (251,053) (32,936) - (32,936)
Profit for the year - - - - 245,029 245,029 271 245,300
Other Comprehensive Income (net of tax)
Net gains for the period - 345,598 - - - 345,598 - 345,598 Other Comprehensive Income for the year
- 345,598 - - - 345,598 - 345,598
Transfer to Realised Capital Gains of cumulative losses on investments sold
- 9,983 (9,983) - - - - -
Dividend paid to minority interests by AICS - - - - - - (1,000) (1,000)
Total equity at the end of the year 2,756,256 2,123,209 430,912 23,637 631,070 5,965,084 419 5,965,503
This statement of changes in equity should be read in conjunction with the accompanying notes
12
For
per
sona
l use
onl
y
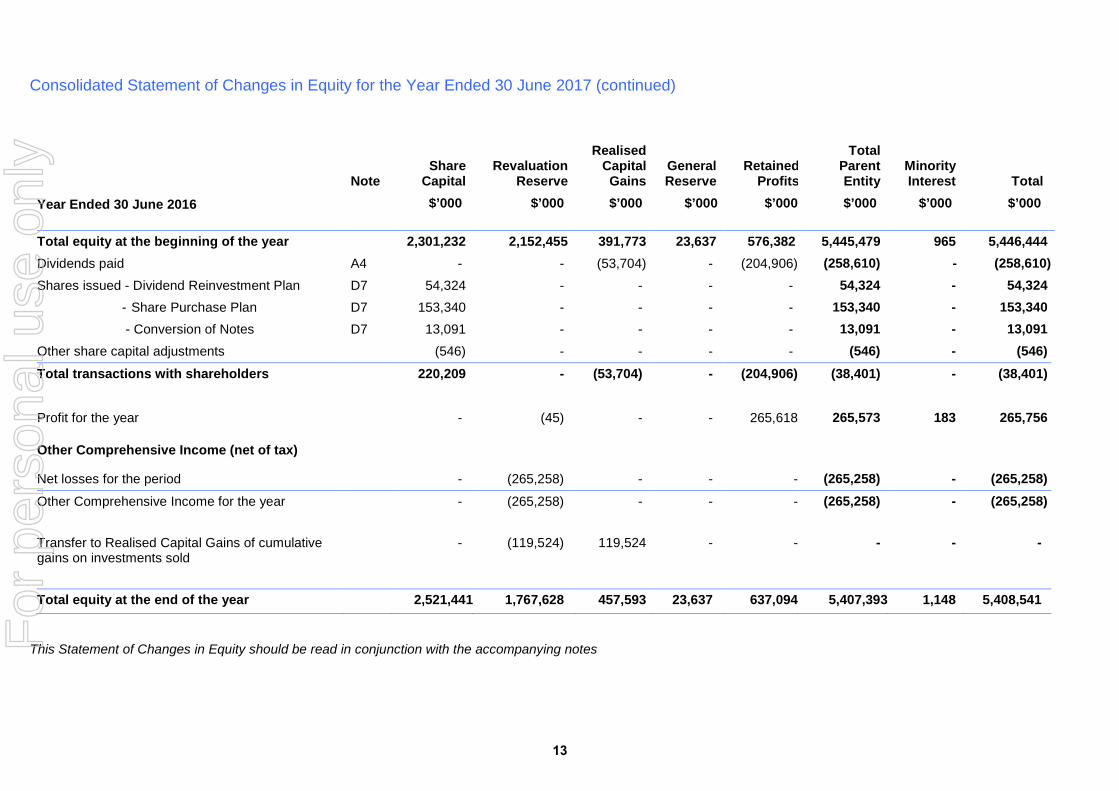
Consolidated Statement of Changes in Equity for the Year Ended 30 June 2017 (continued)
Note
Share Capital
Revaluation Reserve
Realised Capital Gains
General Reserve
Retained Profits
Total Parent Entity
Minority Interest Total
Year Ended 30 June 2016 $’000 $’000 $’000 $’000 $’000 $’000 $’000 $’000
Total equity at the beginning of the year 2,301,232 2,152,455 391,773 23,637 576,382 5,445,479 965 5,446,444 Dividends paid A4 - - (53,704) - (204,906) (258,610) - (258,610) Shares issued - Dividend Reinvestment Plan D7 54,324 - - - - 54,324 - 54,324
- Share Purchase Plan D7 153,340 - - - - 153,340 - 153,340 - Conversion of Notes D7 13,091 - - - - 13,091 - 13,091 Other share capital adjustments (546) - - - - (546) - (546) Total transactions with shareholders 220,209 - (53,704) - (204,906) (38,401) - (38,401)
Profit for the year - (45) - - 265,618 265,573 183 265,756
Other Comprehensive Income (net of tax)
Net losses for the period - (265,258) - - - (265,258) - (265,258) Other Comprehensive Income for the year
- (265,258) - - - (265,258) - (265,258)
Transfer to Realised Capital Gains of cumulative gains on investments sold
- (119,524) 119,524 - - - - -
Total equity at the end of the year 2,521,441 1,767,628 457,593 23,637 637,094 5,407,393 1,148 5,408,541
This Statement of Changes in Equity should be read in conjunction with the accompanying notes
13
For
per
sona
l use
onl
y
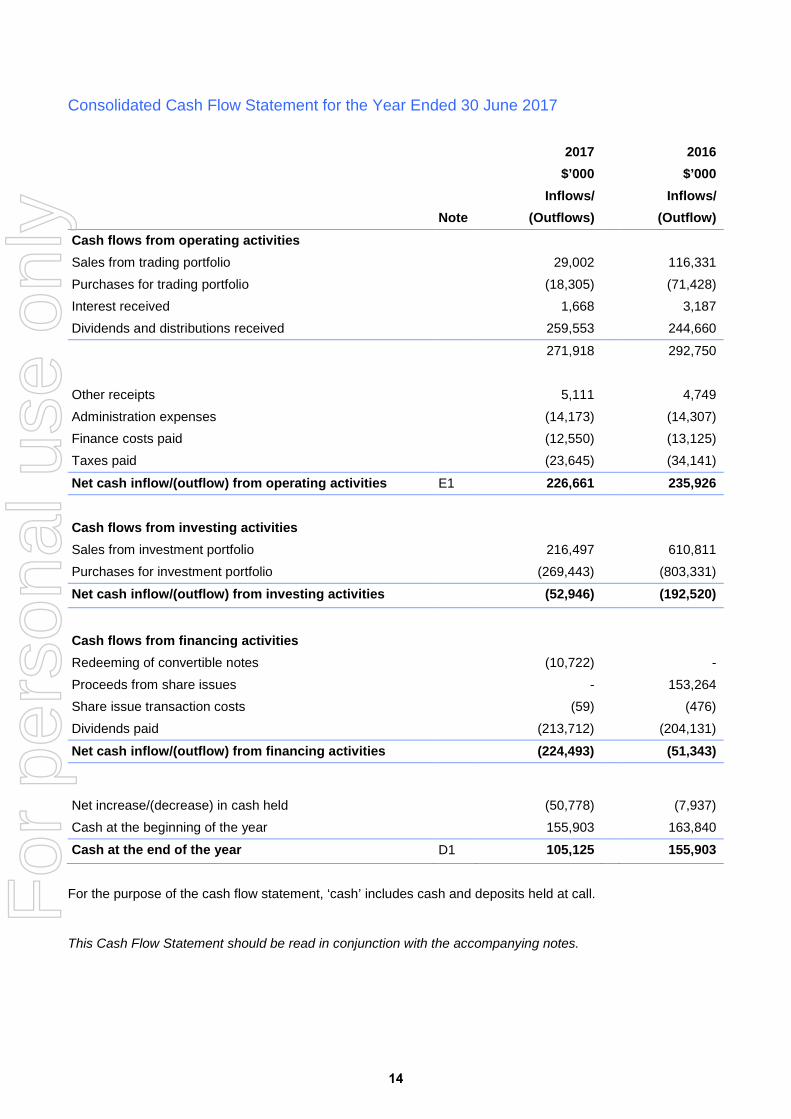
Consolidated Cash Flow Statement for the Year Ended 30 June 2017
2017 2016 $’000 $’000
Inflows/ Inflows/ Note (Outflows) (Outflow) Cash flows from operating activities Sales from trading portfolio 29,002 116,331 Purchases for trading portfolio (18,305) (71,428) Interest received 1,668 3,187 Dividends and distributions received 259,553 244,660
271,918 292,750
Other receipts 5,111 4,749 Administration expenses (14,173) (14,307) Finance costs paid (12,550) (13,125) Taxes paid (23,645) (34,141)
Net cash inflow/(outflow) from operating activities E1 226,661 235,926
Cash flows from investing activities Sales from investment portfolio 216,497 610,811 Purchases for investment portfolio (269,443) (803,331)
Net cash inflow/(outflow) from investing activities (52,946) (192,520)
Cash flows from financing activities Redeeming of convertible notes (10,722) - Proceeds from share issues - 153,264 Share issue transaction costs (59) (476) Dividends paid (213,712) (204,131)
Net cash inflow/(outflow) from financing activities (224,493) (51,343)
Net increase/(decrease) in cash held (50,778) (7,937) Cash at the beginning of the year 155,903 163,840
Cash at the end of the year D1 105,125 155,903
For the purpose of the cash flow statement, ‘cash’ includes cash and deposits held at call.
This Cash Flow Statement should be read in conjunction with the accompanying notes.
14
For
per
sona
l use
onl
y

Notes to the financial statements A. Understanding AFIC’s financial performance
A1. How AFIC manages its capital AFIC’s objective is to provide shareholders with attractive investment returns through access to a growing stream of fully-franked dividends and enhancement of capital invested.
AFIC recognises that its capital will fluctuate with market conditions. In order to manage those fluctuations, the Board may adjust the amount of dividends paid, issue new shares, buy back the Company’s shares or sell assets.
AFIC’s capital consists of its shareholders’ equity plus any net borrowings. A summary of the balances in equity is provided below:
2017 $’000
2016 $’000
Share capital 2,756,256 2,521,441 Revaluation reserve 2,123,209 1,767,628 Realised capital gains reserve 430,912 457,593 General reserve 23,637 23,637 Retained profits 631,070 637,094 5,965,084 5,407,393
Refer to notes D4-D7 for a reconciliation of movement from period to period for each equity account (except the General Reserve, which is historical, relates to past profits which can be distributed and has had no movement).
A2. Investments held and how they are measured AFIC has two portfolios of securities: the investment portfolio and the trading portfolio.
The investment portfolio holds securities which the company intends to retain on a long-term basis, and includes a small sub-component over which options may be written. The trading portfolio consist of securities that are held for short-term trading only, including call option contracts written over securities that are held in the specific sub-component of the investment portfolio and on occasion put options and is relatively small in size. The Board has therefore focused the information in this section on the investment portfolio. Details of all holdings (except for the specific option holdings) as at the end of the reporting period can be found at the end of the Annual Report.
The balance and composition of the investment portfolio was:
2017 $’000
2016 $’000
Equity instruments (excluding below) at market value 6,495,320 6,039,563 Equity instruments (over which options may be written) 282,754 198,825 Hybrids 12,294 11,845 Convertible notes that are classified as debt - -
6,790,368 6,250,233
15
For
per
sona
l use
onl
y
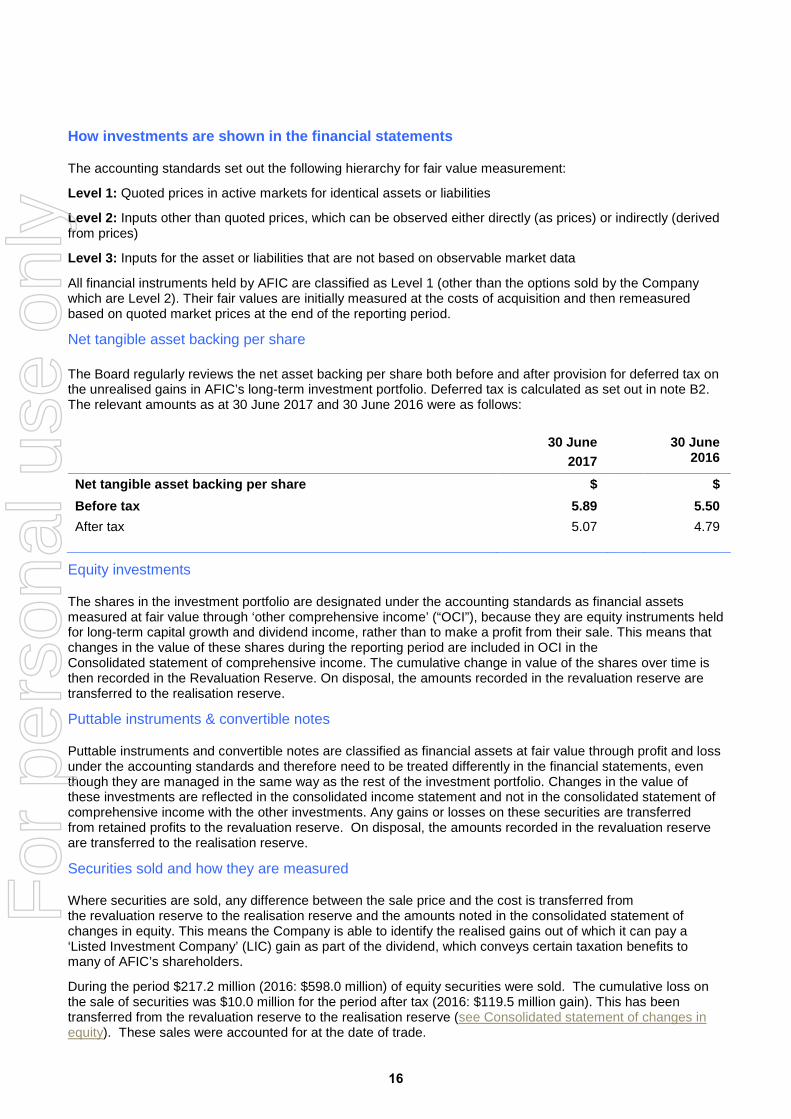
How investments are shown in the financial statements
The accounting standards set out the following hierarchy for fair value measurement:
Level 1: Quoted prices in active markets for identical assets or liabilities
Level 2: Inputs other than quoted prices, which can be observed either directly (as prices) or indirectly (derived from prices)
Level 3: Inputs for the asset or liabilities that are not based on observable market data
All financial instruments held by AFIC are classified as Level 1 (other than the options sold by the Company which are Level 2). Their fair values are initially measured at the costs of acquisition and then remeasured based on quoted market prices at the end of the reporting period.
Net tangible asset backing per share
The Board regularly reviews the net asset backing per share both before and after provision for deferred tax on the unrealised gains in AFIC’s long-term investment portfolio. Deferred tax is calculated as set out in note B2. The relevant amounts as at 30 June 2017 and 30 June 2016 were as follows:
30 June 2017
30 June 2016
Net tangible asset backing per share $ $ Before tax 5.89 5.50 After tax 5.07 4.79
Equity investments
The shares in the investment portfolio are designated under the accounting standards as financial assets measured at fair value through ‘other comprehensive income’ (“OCI”), because they are equity instruments held for long-term capital growth and dividend income, rather than to make a profit from their sale. This means that changes in the value of these shares during the reporting period are included in OCI in the Consolidated statement of comprehensive income. The cumulative change in value of the shares over time is then recorded in the Revaluation Reserve. On disposal, the amounts recorded in the revaluation reserve are transferred to the realisation reserve.
Puttable instruments & convertible notes
Puttable instruments and convertible notes are classified as financial assets at fair value through profit and loss under the accounting standards and therefore need to be treated differently in the financial statements, even though they are managed in the same way as the rest of the investment portfolio. Changes in the value of these investments are reflected in the consolidated income statement and not in the consolidated statement of comprehensive income with the other investments. Any gains or losses on these securities are transferred from retained profits to the revaluation reserve. On disposal, the amounts recorded in the revaluation reserve are transferred to the realisation reserve.
Securities sold and how they are measured
Where securities are sold, any difference between the sale price and the cost is transferred from the revaluation reserve to the realisation reserve and the amounts noted in the consolidated statement of changes in equity. This means the Company is able to identify the realised gains out of which it can pay a ‘Listed Investment Company’ (LIC) gain as part of the dividend, which conveys certain taxation benefits to many of AFIC’s shareholders.
During the period $217.2 million (2016: $598.0 million) of equity securities were sold. The cumulative loss on the sale of securities was $10.0 million for the period after tax (2016: $119.5 million gain). This has been transferred from the revaluation reserve to the realisation reserve (see Consolidated statement of changes in equity). These sales were accounted for at the date of trade.
16
For
per
sona
l use
onl
y
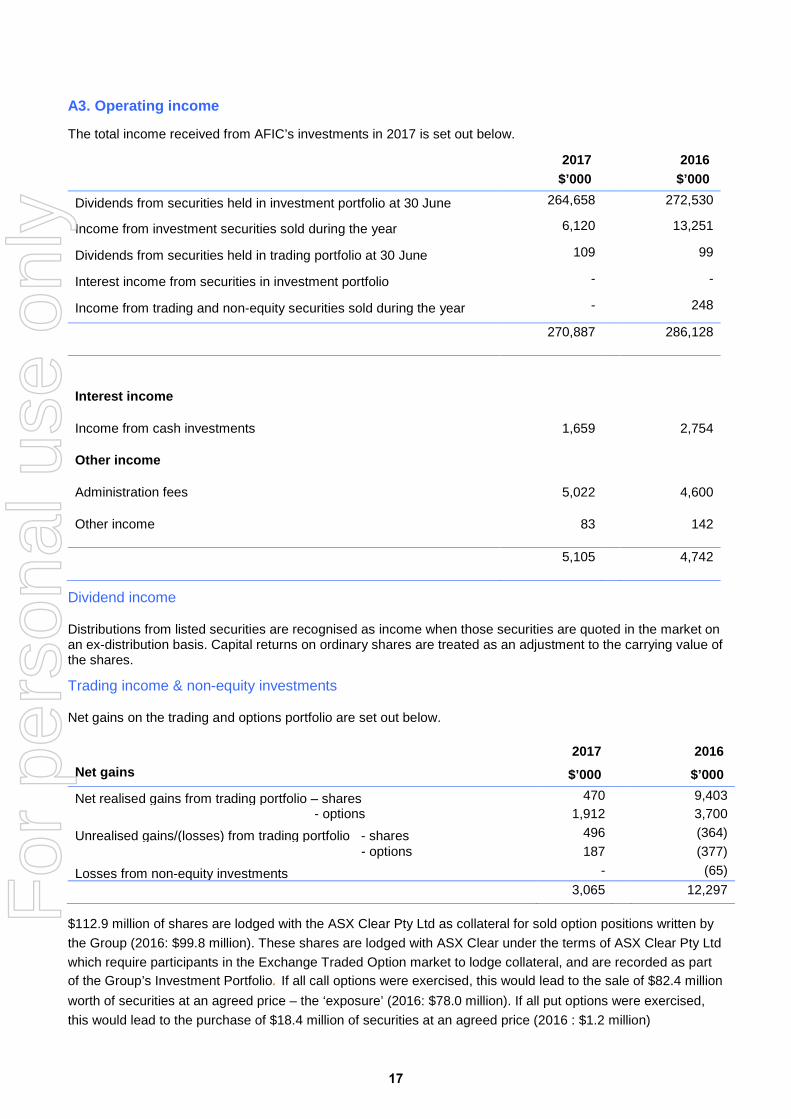
A3. Operating income
The total income received from AFIC’s investments in 2017 is set out below.
2017
$’000 2016
$’000
Dividends from securities held in investment portfolio at 30 June 264,658 272,530
Income from investment securities sold during the year 6,120 13,251
Dividends from securities held in trading portfolio at 30 June 109 99
Interest income from securities in investment portfolio - -
Income from trading and non-equity securities sold during the year - 248
270,887 286,128
Interest income
Income from cash investments 1,659 2,754
Other income
Administration fees 5,022 4,600
Other income 83 142
5,105 4,742
Dividend income
Distributions from listed securities are recognised as income when those securities are quoted in the market on an ex-distribution basis. Capital returns on ordinary shares are treated as an adjustment to the carrying value of the shares.
Trading income & non-equity investments
Net gains on the trading and options portfolio are set out below.
2017
2016 Net gains
$’000 $’000
Net realised gains from trading portfolio – shares 470 9,403 - options 1,912 3,700
Unrealised gains/(losses) from trading portfolio - shares 496 (364) - options 187 (377)
Losses from non-equity investments - (65) 3,065 12,297
$112.9 million of shares are lodged with the ASX Clear Pty Ltd as collateral for sold option positions written by the Group (2016: $99.8 million). These shares are lodged with ASX Clear under the terms of ASX Clear Pty Ltd which require participants in the Exchange Traded Option market to lodge collateral, and are recorded as part of the Group’s Investment Portfolio. If all call options were exercised, this would lead to the sale of $82.4 million worth of securities at an agreed price – the ‘exposure’ (2016: $78.0 million). If all put options were exercised, this would lead to the purchase of $18.4 million of securities at an agreed price (2016 : $1.2 million)
17
For
per
sona
l use
onl
y
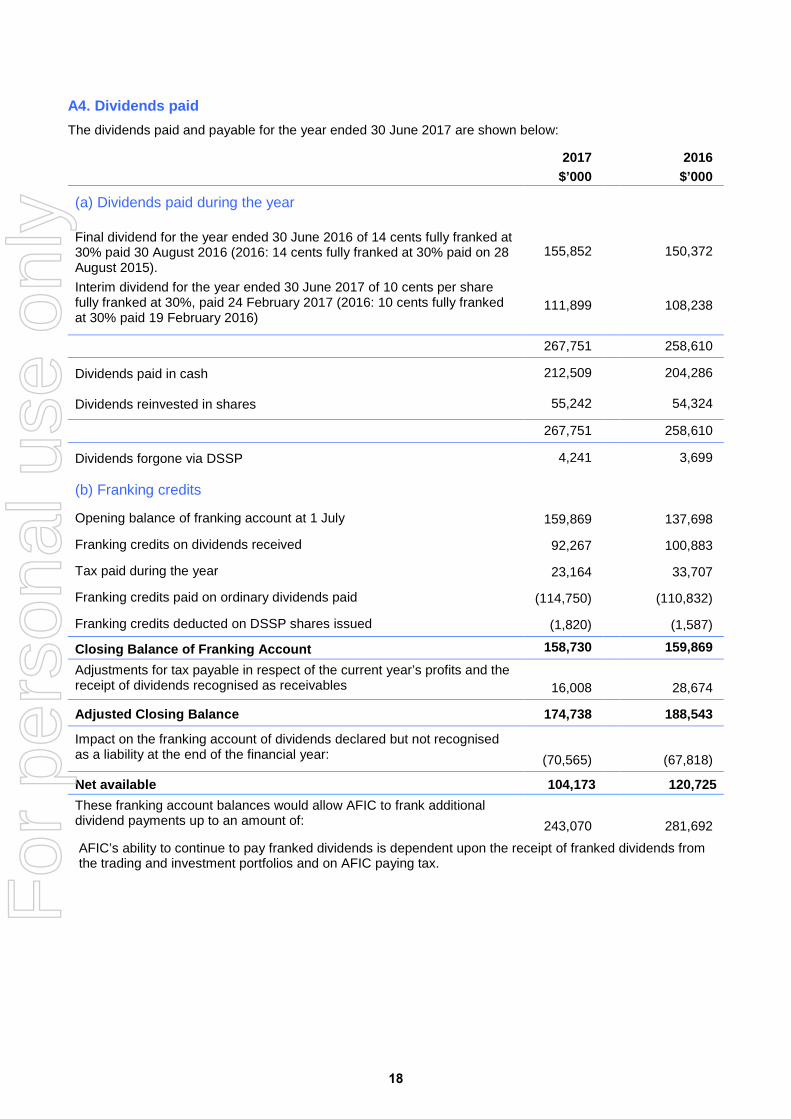
A4. Dividends paid The dividends paid and payable for the year ended 30 June 2017 are shown below:
2017 $’000
2016 $’000
(a) Dividends paid during the year
Final dividend for the year ended 30 June 2016 of 14 cents fully franked at 30% paid 30 August 2016 (2016: 14 cents fully franked at 30% paid on 28 August 2015).
155,852 150,372
Interim dividend for the year ended 30 June 2017 of 10 cents per share fully franked at 30%, paid 24 February 2017 (2016: 10 cents fully franked at 30% paid 19 February 2016)
111,899 108,238
267,751 258,610
Dividends paid in cash 212,509 204,286
Dividends reinvested in shares 55,242 54,324
267,751 258,610
Dividends forgone via DSSP 4,241 3,699
(b) Franking credits
Opening balance of franking account at 1 July 159,869 137,698
Franking credits on dividends received 92,267 100,883
Tax paid during the year 23,164 33,707
Franking credits paid on ordinary dividends paid (114,750) (110,832)
Franking credits deducted on DSSP shares issued (1,820) (1,587)
Closing Balance of Franking Account 158,730 159,869 Adjustments for tax payable in respect of the current year’s profits and the receipt of dividends recognised as receivables 16,008 28,674
Adjusted Closing Balance 174,738 188,543
Impact on the franking account of dividends declared but not recognised as a liability at the end of the financial year: (70,565) (67,818)
Net available 104,173 120,725 These franking account balances would allow AFIC to frank additional dividend payments up to an amount of: 243,070 281,692 AFIC’s ability to continue to pay franked dividends is dependent upon the receipt of franked dividends from the trading and investment portfolios and on AFIC paying tax.
18
For
per
sona
l use
onl
y
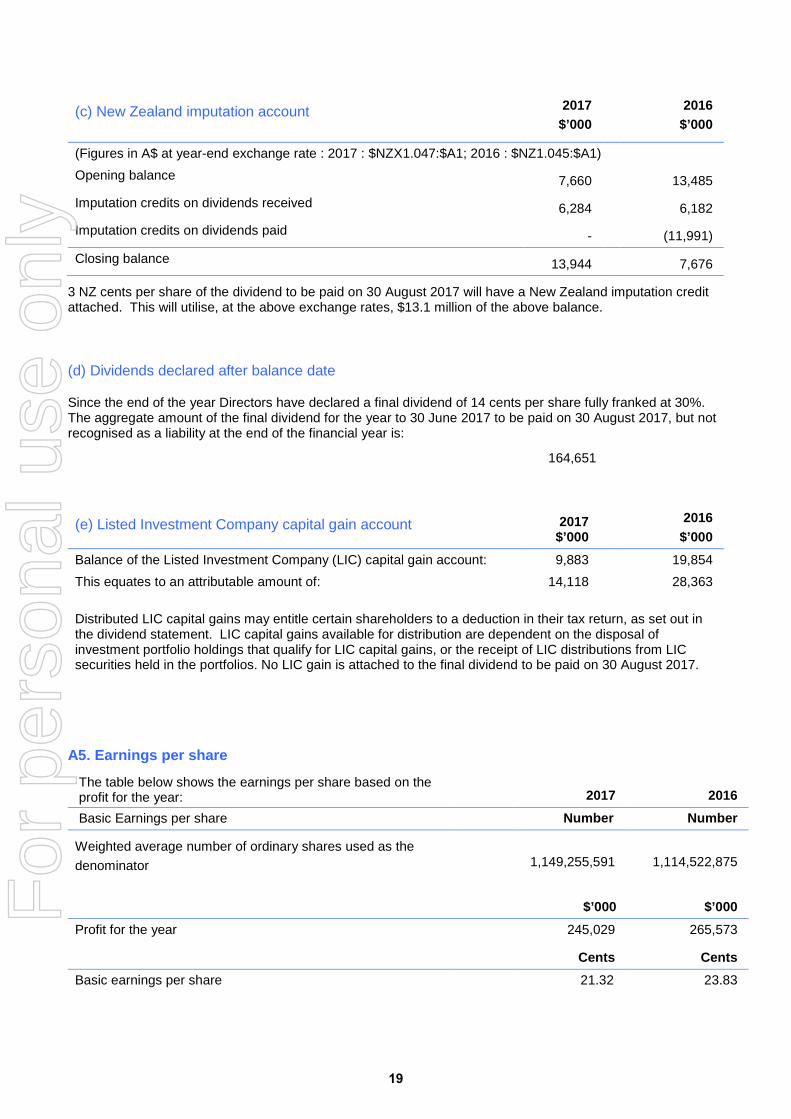
(c) New Zealand imputation account 2017 $’000
2016 $’000
(Figures in A$ at year-end exchange rate : 2017 : $NZX1.047:$A1; 2016 : $NZ1.045:$A1) Opening balance 7,660 13,485 Imputation credits on dividends received 6,284 6,182 Imputation credits on dividends paid - (11,991)
Closing balance 13,944 7,676
3 NZ cents per share of the dividend to be paid on 30 August 2017 will have a New Zealand imputation credit attached. This will utilise, at the above exchange rates, $13.1 million of the above balance.
(d) Dividends declared after balance date
Since the end of the year Directors have declared a final dividend of 14 cents per share fully franked at 30%. The aggregate amount of the final dividend for the year to 30 June 2017 to be paid on 30 August 2017, but not recognised as a liability at the end of the financial year is:
164,651
(e) Listed Investment Company capital gain account 2017 $’000
2016 $’000
Balance of the Listed Investment Company (LIC) capital gain account: 9,883 19,854 This equates to an attributable amount of: 14,118 28,363 Distributed LIC capital gains may entitle certain shareholders to a deduction in their tax return, as set out in the dividend statement. LIC capital gains available for distribution are dependent on the disposal of investment portfolio holdings that qualify for LIC capital gains, or the receipt of LIC distributions from LIC securities held in the portfolios. No LIC gain is attached to the final dividend to be paid on 30 August 2017.
A5. Earnings per share
The table below shows the earnings per share based on the profit for the year: 2017 2016 Basic Earnings per share Number Number
Weighted average number of ordinary shares used as the denominator 1,149,255,591 1,114,522,875
$’000 $’000 Profit for the year 245,029 265,573
Cents Cents Basic earnings per share
21.32 23.83
19
For
per
sona
l use
onl
y
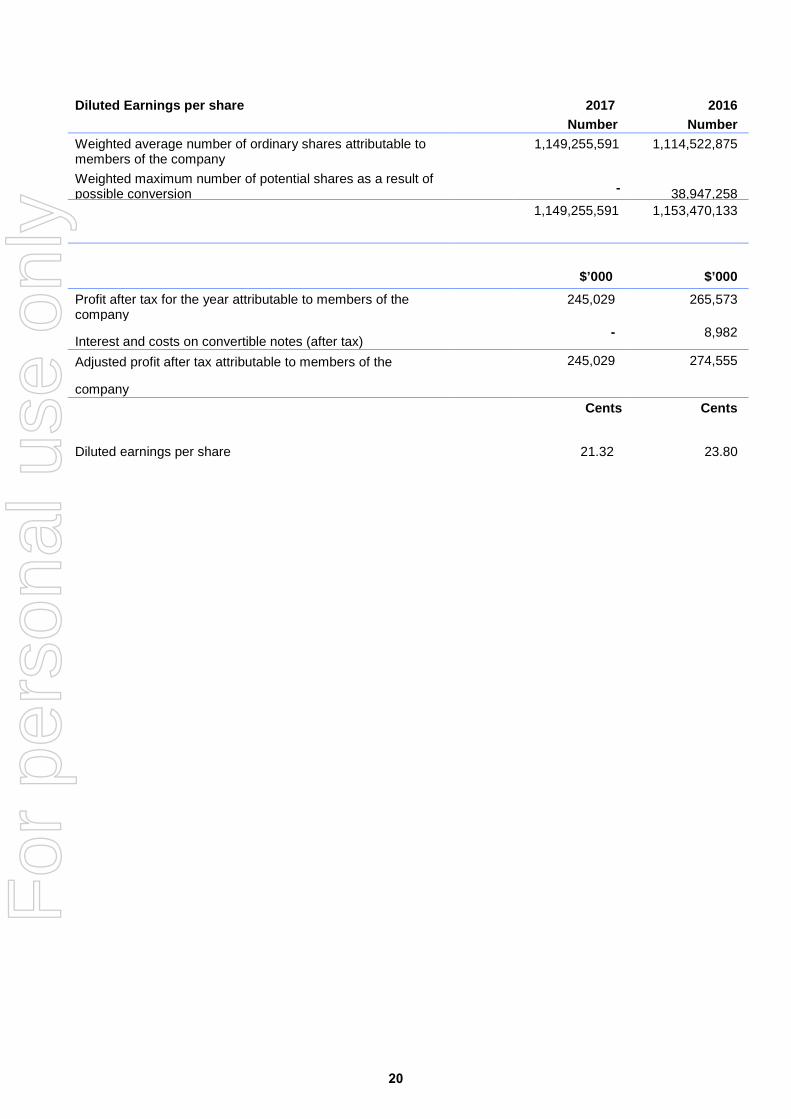
Diluted Earnings per share
2017 Number
2016 Number
Weighted average number of ordinary shares attributable to members of the company
1,149,255,591 1,114,522,875
Weighted maximum number of potential shares as a result of possible conversion
-
38,947,258 1,149,255,591 1,153,470,133
$’000 $’000 Profit after tax for the year attributable to members of the company
245,029 265,573
Interest and costs on convertible notes (after tax) - 8,982
Adjusted profit after tax attributable to members of the
company
245,029 274,555
Cents Cents
Diluted earnings per share
21.32 23.80
20
For
per
sona
l use
onl
y
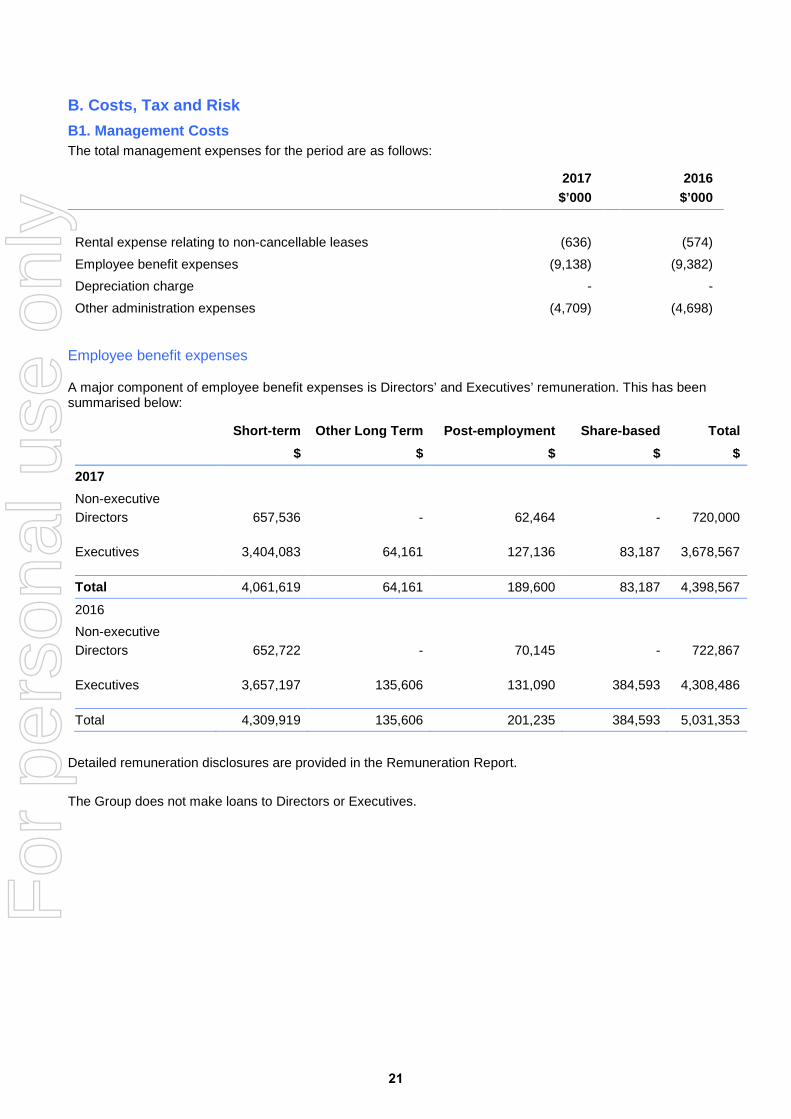
B. Costs, Tax and Risk B1. Management Costs The total management expenses for the period are as follows:
2017 $’000
2016 $’000
Rental expense relating to non-cancellable leases (636) (574) Employee benefit expenses (9,138) (9,382) Depreciation charge - - Other administration expenses
(4,709) (4,698)
Employee benefit expenses
A major component of employee benefit expenses is Directors’ and Executives’ remuneration. This has been summarised below:
Short-term
Other Long Term
Post-employment
Share-based
Total $ $ $ $ $
2017 Non-executive Directors 657,536 - 62,464 - 720,000
Executives 3,404,083 64,161 127,136 83,187 3,678,567
Total 4,061,619 64,161 189,600 83,187 4,398,567
2016 Non-executive Directors 652,722 - 70,145 - 722,867
Executives 3,657,197 135,606 131,090 384,593 4,308,486
Total 4,309,919 135,606 201,235 384,593 5,031,353
Detailed remuneration disclosures are provided in the Remuneration Report. The Group does not make loans to Directors or Executives.
21
For
per
sona
l use
onl
y
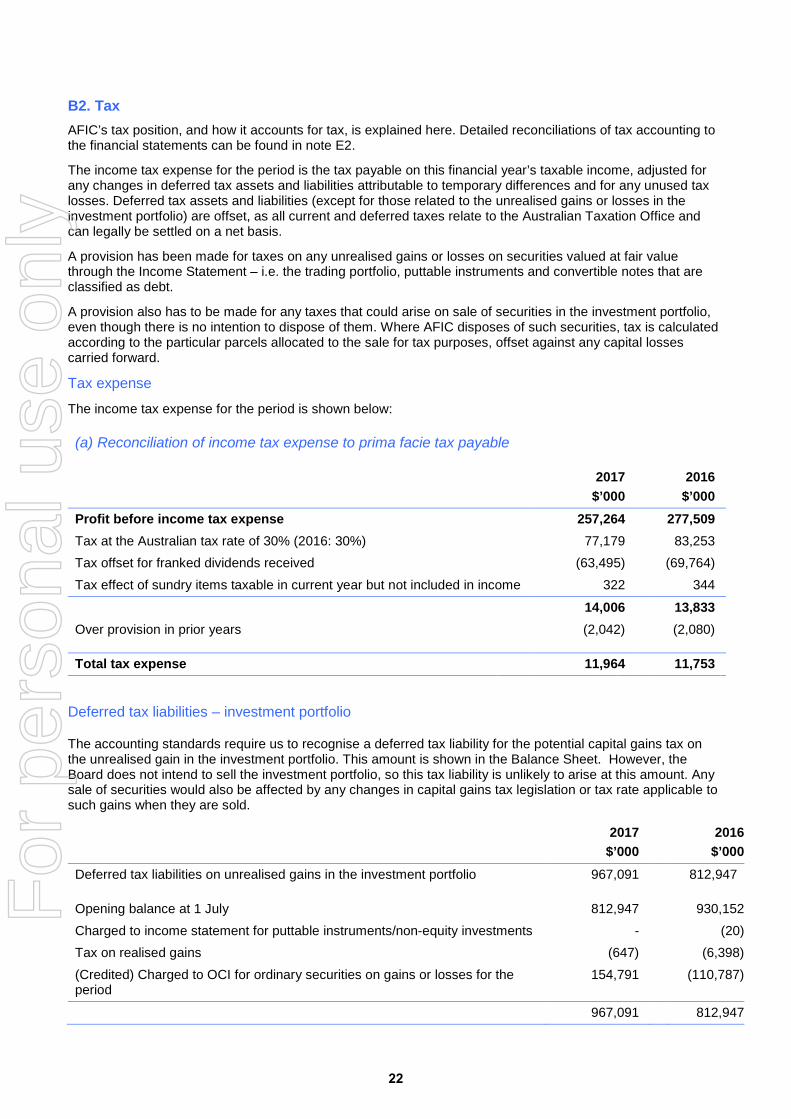
B2. Tax AFIC’s tax position, and how it accounts for tax, is explained here. Detailed reconciliations of tax accounting to the financial statements can be found in note E2.
The income tax expense for the period is the tax payable on this financial year’s taxable income, adjusted for any changes in deferred tax assets and liabilities attributable to temporary differences and for any unused tax losses. Deferred tax assets and liabilities (except for those related to the unrealised gains or losses in the investment portfolio) are offset, as all current and deferred taxes relate to the Australian Taxation Office and can legally be settled on a net basis.
A provision has been made for taxes on any unrealised gains or losses on securities valued at fair value through the Income Statement – i.e. the trading portfolio, puttable instruments and convertible notes that are classified as debt.
A provision also has to be made for any taxes that could arise on sale of securities in the investment portfolio, even though there is no intention to dispose of them. Where AFIC disposes of such securities, tax is calculated according to the particular parcels allocated to the sale for tax purposes, offset against any capital losses carried forward.
Tax expense
The income tax expense for the period is shown below:
(a) Reconciliation of income tax expense to prima facie tax payable
2017 $’000
2016 $’000
Profit before income tax expense 257,264 277,509 Tax at the Australian tax rate of 30% (2016: 30%) 77,179 83,253 Tax offset for franked dividends received (63,495) (69,764) Tax effect of sundry items taxable in current year but not included in income 322 344
14,006 13,833 Over provision in prior years (2,042) (2,080)
Total tax expense 11,964 11,753
Deferred tax liabilities – investment portfolio
The accounting standards require us to recognise a deferred tax liability for the potential capital gains tax on the unrealised gain in the investment portfolio. This amount is shown in the Balance Sheet. However, the Board does not intend to sell the investment portfolio, so this tax liability is unlikely to arise at this amount. Any sale of securities would also be affected by any changes in capital gains tax legislation or tax rate applicable to such gains when they are sold.
2017 $’000
2016 $’000
Deferred tax liabilities on unrealised gains in the investment portfolio 967,091 812,947
Opening balance at 1 July 812,947 930,152 Charged to income statement for puttable instruments/non-equity investments - (20) Tax on realised gains (647) (6,398) (Credited) Charged to OCI for ordinary securities on gains or losses for the period
154,791 (110,787)
967,091 812,947
22
For
per
sona
l use
onl
y
B3. Risk
Market risk
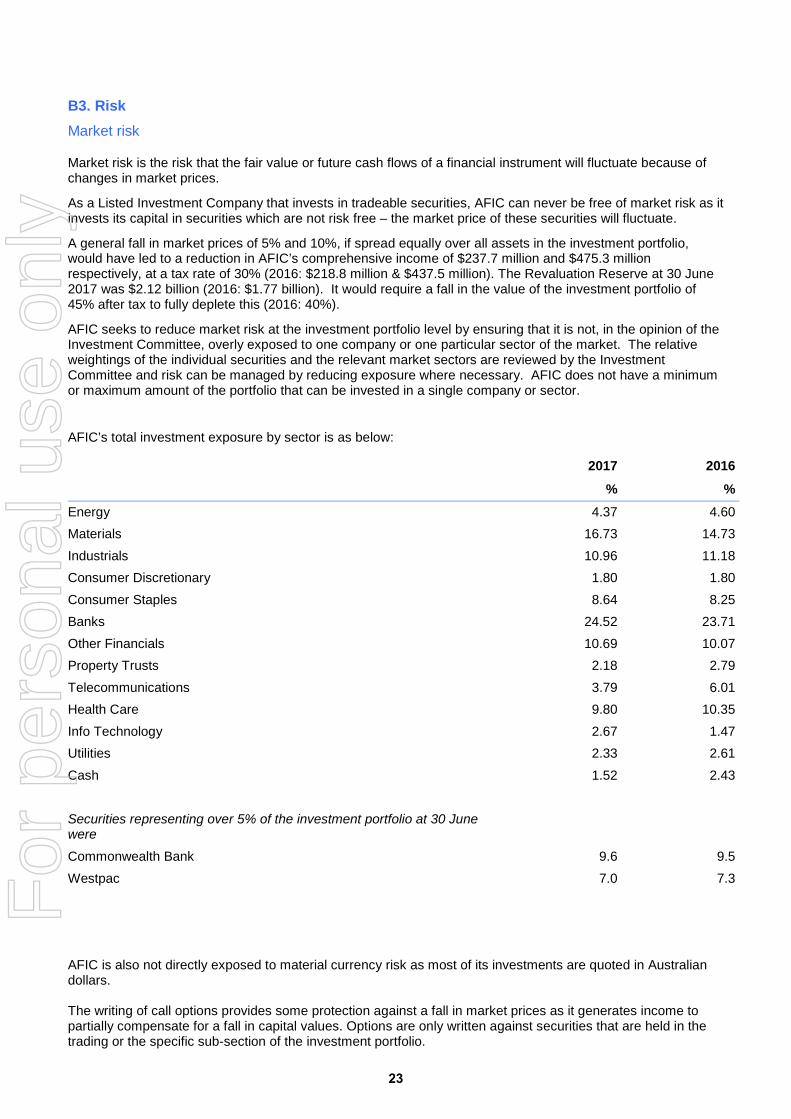
Market risk is the risk that the fair value or future cash flows of a financial instrument will fluctuate because of changes in market prices.
As a Listed Investment Company that invests in tradeable securities, AFIC can never be free of market risk as it invests its capital in securities which are not risk free – the market price of these securities will fluctuate.
A general fall in market prices of 5% and 10%, if spread equally over all assets in the investment portfolio, would have led to a reduction in AFIC’s comprehensive income of $237.7 million and $475.3 million respectively, at a tax rate of 30% (2016: $218.8 million & $437.5 million). The Revaluation Reserve at 30 June 2017 was $2.12 billion (2016: $1.77 billion). It would require a fall in the value of the investment portfolio of 45% after tax to fully deplete this (2016: 40%).
AFIC seeks to reduce market risk at the investment portfolio level by ensuring that it is not, in the opinion of the Investment Committee, overly exposed to one company or one particular sector of the market. The relative weightings of the individual securities and the relevant market sectors are reviewed by the Investment Committee and risk can be managed by reducing exposure where necessary. AFIC does not have a minimum or maximum amount of the portfolio that can be invested in a single company or sector.
AFIC’s total investment exposure by sector is as below:
2017 2016
% % Energy 4.37 4.60 Materials 16.73 14.73 Industrials 10.96 11.18 Consumer Discretionary 1.80 1.80 Consumer Staples 8.64 8.25 Banks 24.52 23.71 Other Financials 10.69 10.07 Property Trusts 2.18 2.79 Telecommunications 3.79 6.01 Health Care 9.80 10.35 Info Technology 2.67 1.47 Utilities 2.33 2.61 Cash 1.52 2.43 Securities representing over 5% of the investment portfolio at 30 June were Commonwealth Bank 9.6 9.5 Westpac 7.0 7.3 AFIC is also not directly exposed to material currency risk as most of its investments are quoted in Australian dollars. The writing of call options provides some protection against a fall in market prices as it generates income to partially compensate for a fall in capital values. Options are only written against securities that are held in the trading or the specific sub-section of the investment portfolio.
23
For
per
sona
l use
onl
y
Interest Rate Risk The Group is not currently materially exposed to interest rate risk as all its cash investments and borrowings are short term for a fixed interest rate.
Credit risk
Credit risk is the risk that one party to a financial instrument will cause a financial loss for the other party by failing to discharge an obligation. AFIC is exposed to credit risk from cash, receivables, securities in the trading portfolio and securities in the investment portfolio respectively. None of these assets are overdue. The risk in relation to each of these items is set out below.
Cash
All cash investments not held in a transactional account are invested in short-term deposits with Australia’s “Big 4” commercial banks or in cash management trusts which invest predominantly in securities with an A1+ rating. In the unlikely event of a bank default or default on the underlying securities in the cash trust, there is a risk of losing the cash deposits and any accrued unpaid interest.
Receivables
Outstanding settlements are on the terms operating in the securities industry, which usually require settlement within two days of the date of a transaction. Receivables are non-interest bearing and unsecured. In the event of a payment default, there is a risk of losing any difference between the price of the securities sold and the price of the recovered securities from the discontinued sale.
Trading and investment portfolios
Converting and convertible notes or other interest-bearing securities that are not equity securities carry credit risk to the extent of their carrying value. This risk will be realised in the event of a shortfall on winding-up of the issuing companies.
Liquidity risk
Liquidity risk is the risk that an entity will not be able to meet its financial liabilities.
AFIC monitors its cash-flow requirements daily. The Investment Committee also monitors the level of contingent payments on a regular basis by reference to known sales and purchases of securities, dividends and distributions to be paid or received, put options that may require AFIC to purchase securities, and facilities that need to be repaid. AFIC ensures that it has either cash or access to short-term borrowing facilities sufficient to meet these contingent payments.
AFIC’s inward cash flows depend upon the dividends received. Should these drop by a material amount, AFIC would amend its outward cash-flows accordingly. AFIC’s major cash outflows are the purchase of securities and dividends paid to shareholders, and both of these can be adjusted by the Board and management. Furthermore, the assets of AFIC are largely in the form of readily tradeable securities which can be sold on-market if necessary.
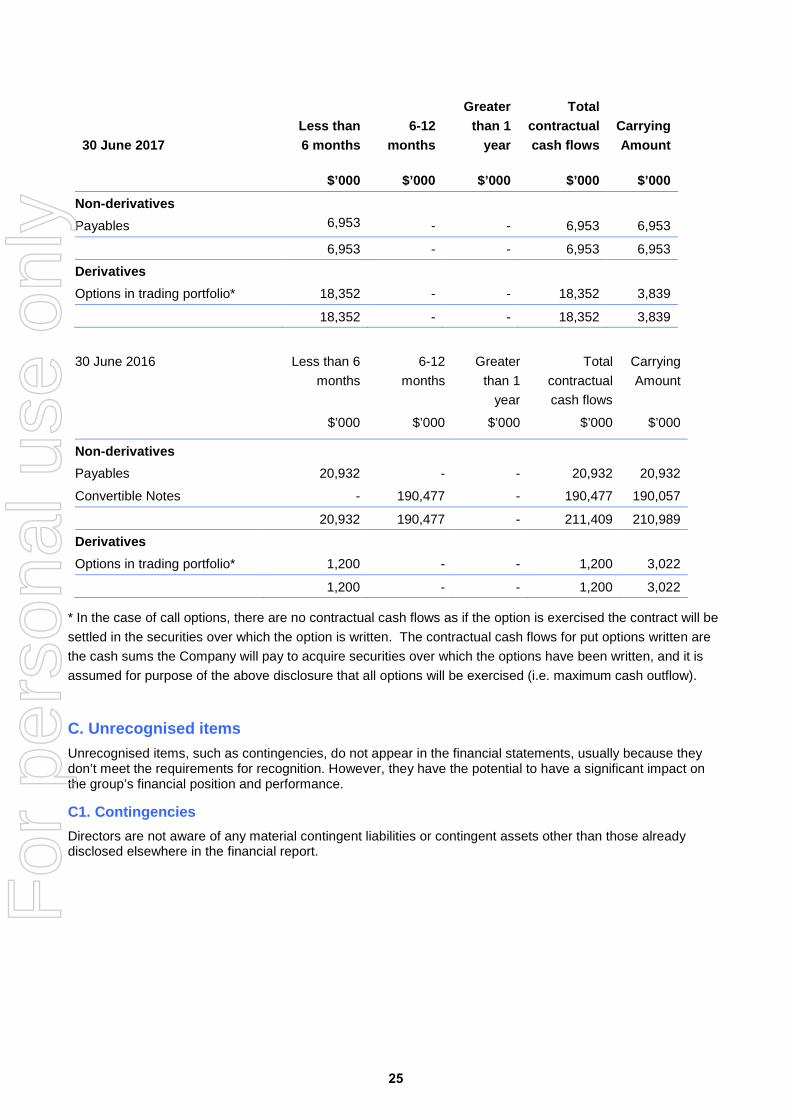
The table below analyses AFIC’s financial liabilities into relevant maturity groupings. The amounts disclosed in the table are the contractual undiscounted cash flows. Balances due within 12 months equal their carrying amounts as the impact of discounting is not significant.
24
For
per
sona
l use
onl
y
30 June 2017 Less than 6 months
6-12 months
Greater than 1
year
Total contractual cash flows
Carrying Amount
$’000 $’000 $’000 $’000 $’000
Non-derivatives Payables 6,953 - - 6,953 6,953
6,953 - - 6,953 6,953
Derivatives Options in trading portfolio* 18,352 - - 18,352 3,839
18,352 - - 18,352 3,839
30 June 2016 Less than 6 months
6-12 months
Greater than 1
year
Total contractual cash flows
Carrying Amount
$’000 $’000 $’000 $’000 $’000
Non-derivatives Payables 20,932 - - 20,932 20,932
Convertible Notes - 190,477 - 190,477 190,057
20,932 190,477 - 211,409 210,989
Derivatives
Options in trading portfolio* 1,200 - - 1,200 3,022
1,200 - - 1,200 3,022
* In the case of call options, there are no contractual cash flows as if the option is exercised the contract will be settled in the securities over which the option is written. The contractual cash flows for put options written are the cash sums the Company will pay to acquire securities over which the options have been written, and it is assumed for purpose of the above disclosure that all options will be exercised (i.e. maximum cash outflow).
C. Unrecognised items Unrecognised items, such as contingencies, do not appear in the financial statements, usually because they don’t meet the requirements for recognition. However, they have the potential to have a significant impact on the group’s financial position and performance.
C1. Contingencies Directors are not aware of any material contingent liabilities or contingent assets other than those already disclosed elsewhere in the financial report.
25
For
per
sona
l use
onl
y
Additional information Additional information that shareholder may find useful is included here. It is grouped into three sections:
D Balance sheet reconciliations
E Income statement reconciliations
F Other information
D. Balance sheet reconciliations This section provides further information about the basis of calculation of line items in the financial statements.
D1. Current assets – cash
2017 $’000
2016 $’000
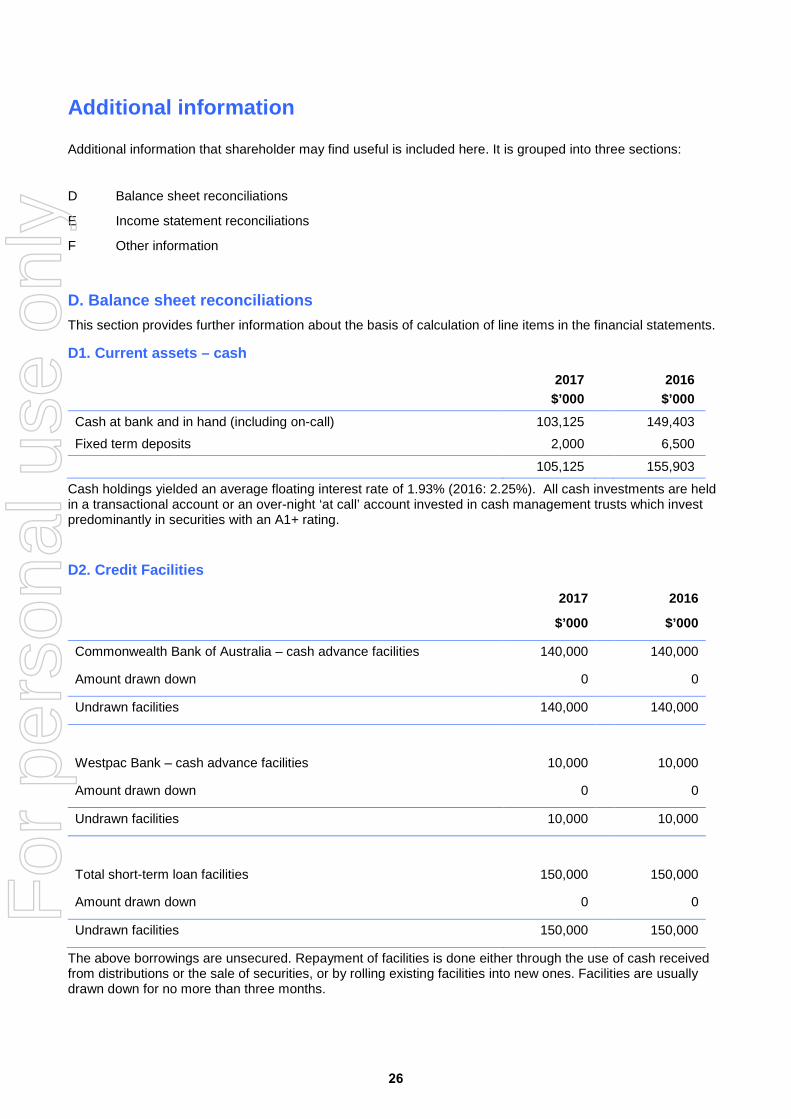
Cash at bank and in hand (including on-call) 103,125 149,403 Fixed term deposits 2,000 6,500 105,125 155,903
Cash holdings yielded an average floating interest rate of 1.93% (2016: 2.25%). All cash investments are held in a transactional account or an over-night ‘at call’ account invested in cash management trusts which invest predominantly in securities with an A1+ rating.
D2. Credit Facilities
2017
$’000
2016
$’000
Commonwealth Bank of Australia – cash advance facilities 140,000 140,000
Amount drawn down 0 0
Undrawn facilities 140,000 140,000
Westpac Bank – cash advance facilities 10,000 10,000
Amount drawn down 0 0
Undrawn facilities 10,000 10,000
Total short-term loan facilities 150,000 150,000
Amount drawn down 0 0
Undrawn facilities 150,000 150,000
The above borrowings are unsecured. Repayment of facilities is done either through the use of cash received from distributions or the sale of securities, or by rolling existing facilities into new ones. Facilities are usually drawn down for no more than three months.
26
For
per
sona
l use
onl
y
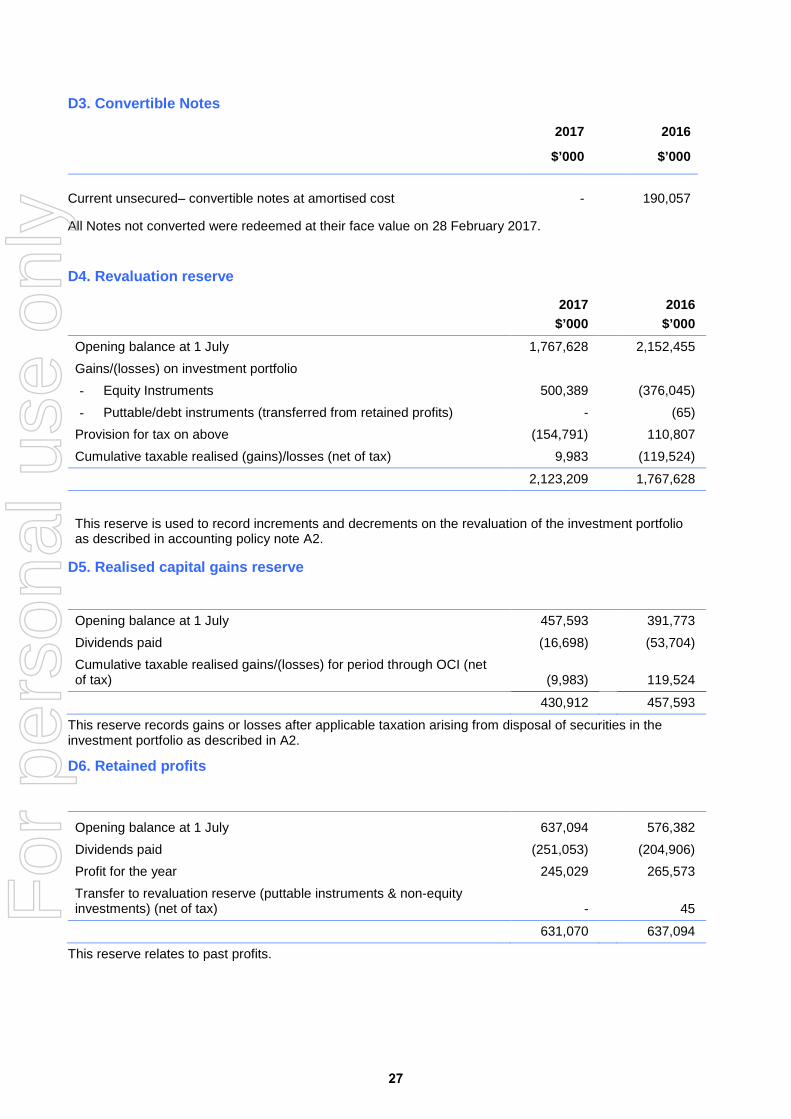
D3. Convertible Notes
2017
$’000
2016
$’000
Current unsecured– convertible notes at amortised cost -
190,057
All Notes not converted were redeemed at their face value on 28 February 2017.
D4. Revaluation reserve
2017
$’000 2016
$’000
Opening balance at 1 July 1,767,628 2,152,455 Gains/(losses) on investment portfolio - Equity Instruments 500,389 (376,045) - Puttable/debt instruments (transferred from retained profits) - (65)
Provision for tax on above (154,791) 110,807 Cumulative taxable realised (gains)/losses (net of tax) 9,983 (119,524)
2,123,209 1,767,628 This reserve is used to record increments and decrements on the revaluation of the investment portfolio as described in accounting policy note A2.
D5. Realised capital gains reserve
Opening balance at 1 July 457,593 391,773 Dividends paid (16,698) (53,704) Cumulative taxable realised gains/(losses) for period through OCI (net of tax) (9,983)
119,524
430,912 457,593 This reserve records gains or losses after applicable taxation arising from disposal of securities in the investment portfolio as described in A2.
D6. Retained profits
Opening balance at 1 July 637,094 576,382 Dividends paid (251,053) (204,906) Profit for the year 245,029 265,573 Transfer to revaluation reserve (puttable instruments & non-equity investments) (net of tax) -
45
631,070 637,094 This reserve relates to past profits.
27
For
per
sona
l use
onl
y
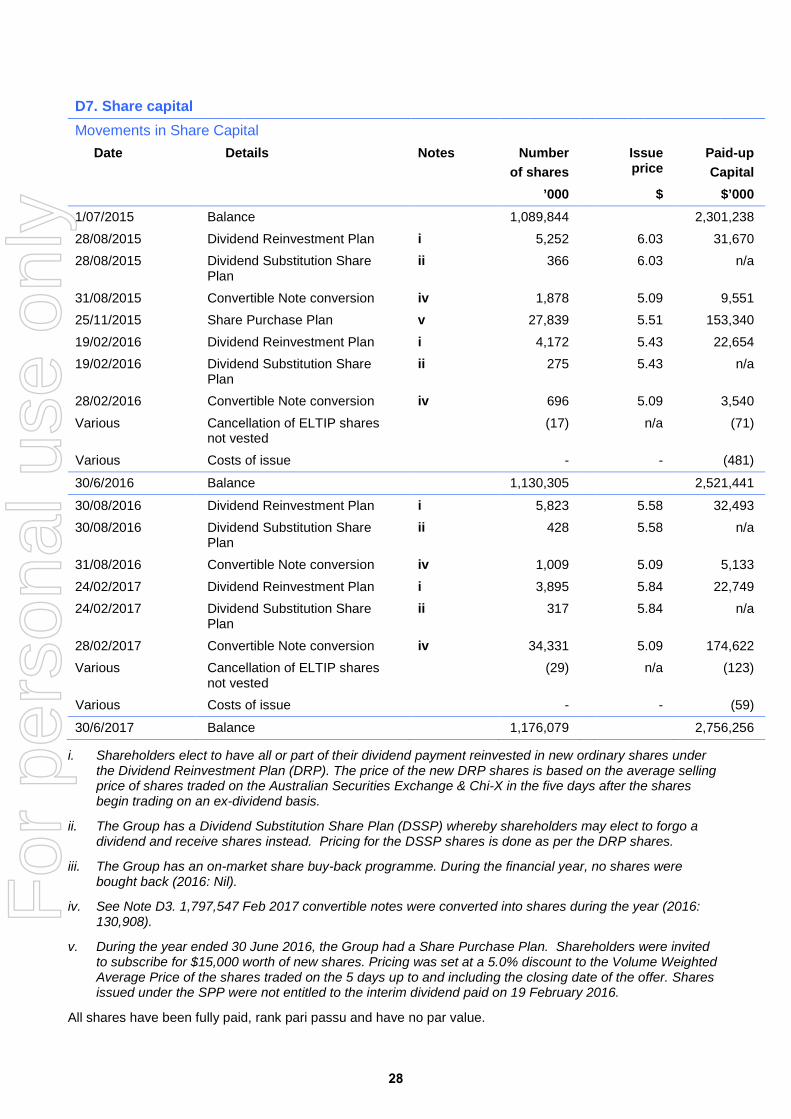
D7. Share capital
Movements in Share Capital
Date Details Notes Number of shares
Issue price
Paid-up Capital
’000 $ $’000
1/07/2015 Balance 1,089,844 2,301,238 28/08/2015 Dividend Reinvestment Plan i 5,252 6.03 31,670 28/08/2015 Dividend Substitution Share
Plan ii 366 6.03 n/a
31/08/2015 Convertible Note conversion iv 1,878 5.09 9,551 25/11/2015 Share Purchase Plan v 27,839 5.51 153,340 19/02/2016 Dividend Reinvestment Plan i 4,172 5.43 22,654 19/02/2016 Dividend Substitution Share
Plan ii 275 5.43 n/a
28/02/2016 Convertible Note conversion iv 696 5.09 3,540 Various Cancellation of ELTIP shares
not vested (17) n/a (71)
Various Costs of issue - - (481)
30/6/2016 Balance 1,130,305 2,521,441
30/08/2016 Dividend Reinvestment Plan i 5,823 5.58 32,493 30/08/2016 Dividend Substitution Share
Plan ii 428 5.58 n/a
31/08/2016 Convertible Note conversion iv 1,009 5.09 5,133 24/02/2017 Dividend Reinvestment Plan i 3,895 5.84 22,749 24/02/2017 Dividend Substitution Share
Plan ii 317 5.84 n/a
28/02/2017 Convertible Note conversion iv 34,331 5.09 174,622 Various Cancellation of ELTIP shares
not vested (29) n/a (123)
Various Costs of issue - - (59)
30/6/2017 Balance 1,176,079 2,756,256
i. Shareholders elect to have all or part of their dividend payment reinvested in new ordinary shares under the Dividend Reinvestment Plan (DRP). The price of the new DRP shares is based on the average selling price of shares traded on the Australian Securities Exchange & Chi-X in the five days after the shares begin trading on an ex-dividend basis.
ii. The Group has a Dividend Substitution Share Plan (DSSP) whereby shareholders may elect to forgo a dividend and receive shares instead. Pricing for the DSSP shares is done as per the DRP shares.
iii. The Group has an on-market share buy-back programme. During the financial year, no shares were bought back (2016: Nil).
iv. See Note D3. 1,797,547 Feb 2017 convertible notes were converted into shares during the year (2016: 130,908).
v. During the year ended 30 June 2016, the Group had a Share Purchase Plan. Shareholders were invited to subscribe for $15,000 worth of new shares. Pricing was set at a 5.0% discount to the Volume Weighted Average Price of the shares traded on the 5 days up to and including the closing date of the offer. Shares issued under the SPP were not entitled to the interim dividend paid on 19 February 2016.
All shares have been fully paid, rank pari passu and have no par value.
28
For
per
sona
l use
onl
y
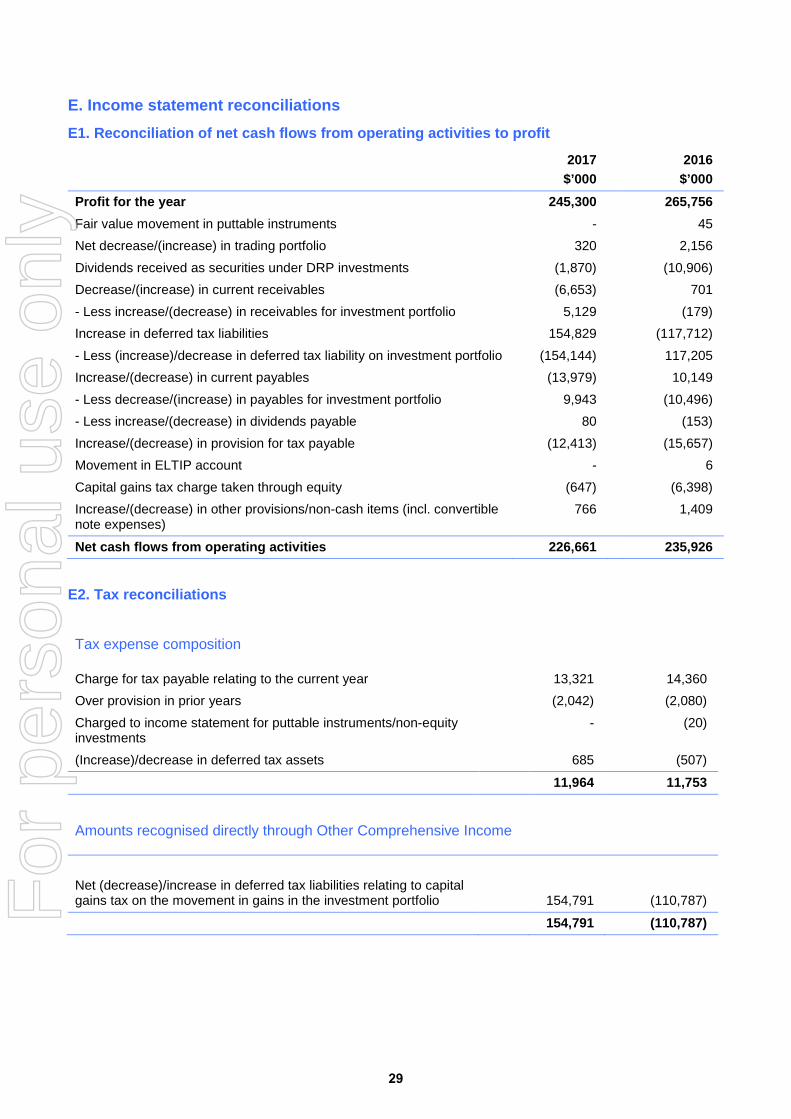
E. Income statement reconciliations E1. Reconciliation of net cash flows from operating activities to profit
2017 $’000
2016 $’000
Profit for the year 245,300 265,756 Fair value movement in puttable instruments - 45 Net decrease/(increase) in trading portfolio 320 2,156 Dividends received as securities under DRP investments (1,870) (10,906) Decrease/(increase) in current receivables (6,653) 701 - Less increase/(decrease) in receivables for investment portfolio 5,129 (179) Increase in deferred tax liabilities 154,829 (117,712) - Less (increase)/decrease in deferred tax liability on investment portfolio (154,144) 117,205 Increase/(decrease) in current payables (13,979) 10,149 - Less decrease/(increase) in payables for investment portfolio 9,943 (10,496) - Less increase/(decrease) in dividends payable 80 (153) Increase/(decrease) in provision for tax payable (12,413) (15,657) Movement in ELTIP account - 6 Capital gains tax charge taken through equity (647) (6,398) Increase/(decrease) in other provisions/non-cash items (incl. convertible note expenses)
766 1,409
Net cash flows from operating activities 226,661 235,926
E2. Tax reconciliations
Tax expense composition
Charge for tax payable relating to the current year 13,321 14,360 Over provision in prior years (2,042) (2,080) Charged to income statement for puttable instruments/non-equity investments
- (20)
(Increase)/decrease in deferred tax assets 685 (507)
11,964 11,753
Amounts recognised directly through Other Comprehensive Income
Net (decrease)/increase in deferred tax liabilities relating to capital gains tax on the movement in gains in the investment portfolio 154,791 (110,787)
154,791 (110,787)
29
For
per
sona
l use
onl
y
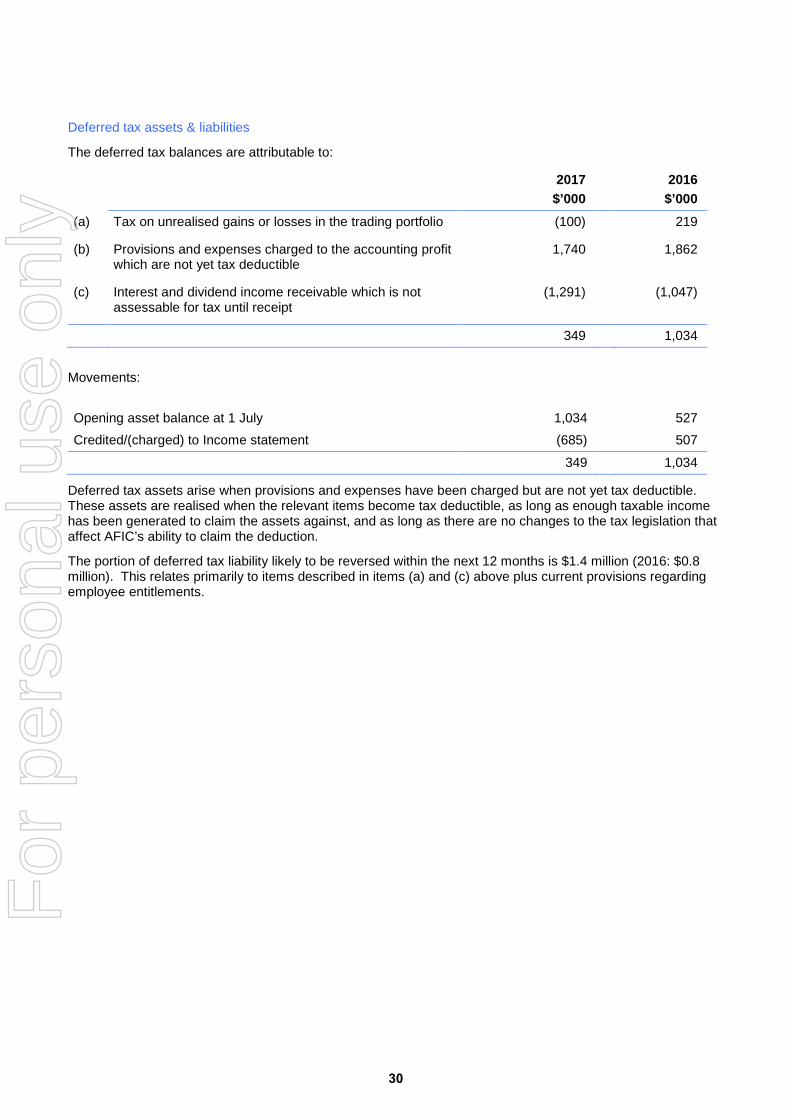
Deferred tax assets & liabilities
The deferred tax balances are attributable to:
2017 $’000
2016 $’000
(a) Tax on unrealised gains or losses in the trading portfolio (100) 219
(b) Provisions and expenses charged to the accounting profit which are not yet tax deductible
1,740 1,862
(c) Interest and dividend income receivable which is not assessable for tax until receipt
(1,291) (1,047)
349 1,034 Movements:
Opening asset balance at 1 July 1,034 527 Credited/(charged) to Income statement (685) 507 349 1,034
Deferred tax assets arise when provisions and expenses have been charged but are not yet tax deductible. These assets are realised when the relevant items become tax deductible, as long as enough taxable income has been generated to claim the assets against, and as long as there are no changes to the tax legislation that affect AFIC’s ability to claim the deduction.
The portion of deferred tax liability likely to be reversed within the next 12 months is $1.4 million (2016: $0.8 million). This relates primarily to items described in items (a) and (c) above plus current provisions regarding employee entitlements.
30
For
per
sona
l use
onl
y
F. Other information This section covers other information that is not directly related to specific line items in the financial statements, including information about related party transactions, share-based payments, assets pledged as security and other statutory information.
F1. Related parties All transactions with deemed related parties were made on normal commercial terms and conditions and approved by independent Directors.
(a) Arrangements with non-executive directors
Non-Executive Directors J Paterson and C Walter have rented office space and, for J Paterson, a parking space from the Group at commercial rates during the year. Sub-lease rental income (included in revenue) received or receivable by the Group, excluding GST, during the year was $39,945 (2016: $41,243).
(b) AICS transactions with minority interests
The below transactions were with Djerriwarrh Investments Ltd as a minority interest holder in the Company’s subsidiary.
2017
$’000
2016
$’000
Administration expenses charged for the year 2,437 2,412
(c) AICS transactions with other Listed Investment Companies
AICS had the following transactions with other Listed Investment Companies to which it provides services :
Administration expenses charged for the year to Mirrabooka Investments Ltd 1,481 1,433
Administration expenses charged for the year to AMCIL Ltd 918 780
F2. Remuneration of auditors For the year the auditor earned or will earn the following remuneration:
2017 $
2016 $
PricewaterhouseCoopers
Audit or review of financial reports 248,256 205,247 AFSL compliance audit and review 9,925 9,925
Non-Audit Services
Taxation compliance services 81,444 38,819
Total remuneration 339,625 253,991
31
For
per
sona
l use
onl
y
F3. Segment reporting Operating segments are reported in a manner consistent with the internal reporting used by the chief operating decision-maker. The Board, through its sub-committees, has been identified as the chief operating decision-maker, as it is responsible for allocating resources and assessing performance of the operating segments.
Description of segments
The Board makes the strategic resource allocations for AFIC. AFIC has therefore determined the operating segments based on the reports reviewed by the Board, which are used to make strategic decisions.
The Board is responsible for AFIC’s entire portfolio of investments and considers the business to have a single operating segment. The Board’s asset allocation decisions are based on a single, integrated investment strategy, and AFIC’s performance is evaluated on an overall basis.
Segment information provided to the Board
The internal reporting provided to the Board for AFIC’s assets, liabilities and performance is prepared on a consistent basis with the measurement and recognition principles of Australian Accounting Standards, except that net assets are reviewed both before and after the effects of capital gains tax on investments (as reported in AFIC’s Net Tangible Asset announcements to the ASX).
Other segment information
Revenues from external parties are derived from the receipt of dividend, distribution and interest income, and income arising on the trading portfolio and realised income from the options portfolio.
AFIC is domiciled in Australia and most of AFIC’s income is derived from Australian entities or entities that maintain a listing in Australia. AFIC has a diversified portfolio of investments, with only 2 investments comprising more than 10% of AFIC’s income, including realised income from the trading and options written portfolios –Commonwealth Bank (11.8%) and Westpac Bank (10.4%).
F4. Summary of other accounting policies This general purpose financial report has been prepared in accordance with Australian Accounting Standards, Interpretations issued by the Australian Accounting Standards Board and the Corporations Act 2001. This financial report has been authorised for issue and is presented in the Australian currency. AFIC has the power to amend and reissue the financial report.
AFIC has attempted to improve the transparency of its reporting by adopting ‘plain English’ where possible. Key ‘plain English’ phrases and their equivalent AASB terminology are as follows:
Phrase AASB Terminology
Market Value Fair Value for Actively Traded Securities Cash Cash & Cash Equivalents Share Capital Contributed Equity Options Hybrids
Derivatives written over equity instruments that are valued at fair value through Profit or Loss Equity instruments that have some of the characteristics of debt
AFIC complies with International Financial Reporting Standards (IFRS). AFIC is a ‘for profit’ entity.
AFIC has not applied any Australian Accounting Standards or AASB Interpretations that have been issued as at balance date but are not yet operative for the year ended 30 June 2017 (“the inoperative standards”) except for AASB 9 (2009) which was adopted on 7 December 2009. The impact of the inoperative standards has been assessed and the impact has been identified as not being material. AFIC only intends to adopt other inoperative standards at the date at which their adoption becomes mandatory.
32
For
per
sona
l use
onl
y
Basis of accounting
The financial statements are prepared using the valuation methods described in A2. All other items have been treated in accordance with the historical cost convention.
Fair value of financial assets and liabilities
The fair value of cash and cash equivalents, and non-interest bearing monetary financial assets and liabilities of AFIC approximates their carrying value.
Convertible Notes
On the issue of convertible notes, the Group estimates the fair value of the liability component of the convertible notes, being the obligation to make future payments of principal and interest to holders, using a market interest rate for a non-convertible note of similar terms and conditions. The residual amount is included in equity as other equity securities with no recognition of any change in the value of the option in subsequent periods. The liability component is then included in borrowings. Expenses incurred in connection with the issue of the notes are deducted from the total face value and the expense is then incurred over the life of the notes.
The total liability is subsequently carried on an amortised cost basis with interest on the notes recognised as finance costs on an effective yield basis until the liability is extinguished on conversion or maturity of the notes.
Employee benefits
(i) Wages, salaries and annual leave
Liabilities for wages and salaries, including annual leave, expected to be settled within 12 months of balance date are recognised as current provisions in respect of employees’ services up to balance date and are measured at the amounts expected to be paid when the liabilities are settled.
(ii) Long service leave
In calculating the value of long service leave, consideration is given to expected future wage and salary levels, experience of employee departures and periods of service. Expected future payments are discounted using market yields at balance date on national government bonds with terms to maturity and currency that match, as closely as possible, the estimated future cash outflows.
(iii) Cash incentives
Cash incentives are provided under the Senior Executive Annual Incentive Plan and are dependent upon the performance of the Group. A provision is made for the cost of unsettled cash incentives at balance date. The Investment Team Annual Incentive plans are also settled on a cash basis.
(iv) Share incentives
Share incentives are provided under the Senior Executive Annual Incentive Plan, Senior Executive Long Term Incentive Plan, Investment Team Long Term Incentive Plan and the Employee Share Acquisition Scheme.
For the Employee Share Acquisition Scheme and the Senior Executive Annual Incentive Plan, the incentives are based on the performance of the individual, the Group and investment companies to which the group provides administration services, for the financial year. For the Employee Share Acquisition Scheme and a portion of the Senior Executive Annual Incentive, the recipient agrees to purchase (or have purchased for them) shares on-market, but receives a cash amount. A provision for the amount payable under the Annual Incentive Plans is recognised on the Balance Sheet.
For the Investment Team Long Term Incentive Plan, the incentives are based on the performance of the Group and investment companies to which the group provides administration services over a four year period. The incentives may be settled in shares (but based on a cash amount) or cash. Expenses are recognised over the four year assessment period based on the amount expected to be payable under this plan, resulting in a provision for incentive payable being built up on the balance sheet over the assessment period.
Under the Senior Executive Long Term Incentive Plan which was introduced for the year ended 30 June 2013, the amount awarded is represented by Performance Shares. The 30 day Volume Weighted Average Price (VWAP) of AFIC shares up to but not including 1 July is calculated. The amount of ELTIP available is then divided by this 30-day VWAP price to determine the number of Performance Shares that may vest at the vesting point in 4 years’ time. The value of each Performance Shares will be adjusted by the accumulation return on the AFI share price (being the movement in the share price assuming the reinvestment of any
33
For
per
sona
l use
onl
y
dividends) up to vesting date, based on a final share price calculated on the 30-day VWAP price up to 30 June. Should performance conditions be met, the first vesting under this plan will occur in the year ended 30 June 2017.
The expense will be charged directly through the Group’s Profit and Loss account in the following manner – 25% of the total estimated cost in Year 1, 50% of the total estimated cost in Year 2 less the expense charged in Year 1, 75% of the total estimated cost in Year 3 less the expense charged in Years 1 and 2 and 100% of the total estimated cost in Year 4 less the expense charged in Years 1, 2 and 3.
Shares are no longer awarded under the previous Senior Executive Long Term Incentive Plan. Shares acquired to satisfy obligations under the old Senior Executive Long Term Incentive plans were recognised as an adjustment against share capital (referred to as “ELTIP shares adjustment”) as at the date of acquisition by the Group. Between the award date and the vesting date, the fair value of the ELTIP shares was expensed over the relevant period of service for each executive, and recognised in equity in the ELTIP shares adjustment account. In the event that the executive did not complete the period of service, the cumulative expense was reversed. The fair value of the shares was determined at the award date and was based on:
• the market price of the shares at award date;
• allowance for the impact of the holding restriction between award date and vesting date; and
• the expected performance of the Group in meeting the market hurdles which determine vesting.
Any shares that did not ultimately vest were cancelled by offsetting the relevant component of the ELTIP shares adjustment account against share capital. The reduction in share capital was based on that proportion of the original acquisition cost of share compensation that did not vest. Any residual element in the ELTIP shares adjustment account for the relevant award year was transferred to retained earnings.
Directors’ retirement allowances
The Group recognises as ‘amounts payable’ Directors’ retirement allowances that have been crystallised. No further amounts will be expensed as retirement allowances.
Administration fees
The Group currently provides administrative services to other Listed Investment Companies. The associated fees are recognised on an accruals basis as income throughout the year. Any amounts outstanding at balance date are recognised as receivable, subject to the assessment of recoverability by the Directors.
Operating leases
The Group currently has an operating lease in respect of its premises. Payments made under operating leases are charged to the Income Statement on a straight-line basis over the period of the lease.
Rounding of amounts
AFIC is a company of the kind referred to in the ASIC Corporations (Rounding in Financial/Directors’ Reports) Instrument 2016/191, relating to the ‘rounding off’ of amounts in the financial report. Amounts in the financial report have been rounded off in accordance with that Instrument, to the nearest thousand dollars, or in certain cases, to the nearest dollar.
F5. Performance Bond The Group’s subsidiary, AICS, has under the terms of its Australian Financial Services License in place a performance bond to the sum of $20,000 underwritten by the Commonwealth Bank of Australia in favour of the Australian Securities and Investments Commission (“ASIC”), payable on demand to ASIC.
F6. Share Based Payments Share based payments The Group has a number of share incentive arrangements. These are accounted for in accordance with note F4. Where shares are issued to employees of AICS, AICS compensates AFIC for the fair value of the shares.
34
For
per
sona
l use
onl
y
(a) Executive Incentive Plans The executives’ remuneration arrangements incorporate an ‘at risk’ component as set out in the remuneration report. Part of this ‘at risk’ component is paid in shares in the Group.
(i) Senior Executive Annual Incentive Plan
Each financial year, the Remuneration Committee sets the target (cash) amount of remuneration that could be paid should all performance targets and measures be achieved. If all are achieved, 100% of the remuneration will be awarded. If stretch levels of performance are achieved above target, then higher amounts may be paid. On the other hand there is no set minimum that will be paid regardless of performance.
The performance measures are a combination of the performance of the Group, the investment companies to which the Group provides administration services, and personal objectives.
All of the incentive remuneration awarded is paid in cash, with 50% of the after-tax amount being used by the executive to purchase shares. All remuneration under the plan, is paid in the financial year following the year of assessment.
The executive agrees to the shares being subject to being held for two years (holding term), during which they cannot be sold. Dividends are paid to executives on these shares prior to the expiry of the holding term. Should an executive leave the Group before the holding term expires, the restriction will be lifted.
14,331 shares (2016: 19,648 shares) were purchased by executives in the year (in relation to the prior year) with a fair value (being the acquisition price) of $80,048 (2016: $121,411).
(ii) Senior Executive Long Term Incentive Plan
Senior executives were awarded a number of shares equivalent to 50% of the gross amount awarded under the old Annual Incentive Plan. These shares (“Performance Shares”) were acquired on market. The award of shares to participants was made for no consideration. The shares are subject to a holding lock for a minimum of four years (the vesting period) during which time the executive will be entitled to receive dividends and hold voting rights.
The Performance Shares vested between four and five years after grant date, entirely dependent on the achievement of set quantitative measures, the Total Shareholder Return (“TSR”) and the Total Portfolio Return (“TPR”), which reflect the movement in the share price of the company (TSR) and in the portfolio of investments in which the company has invested shareholders’ funds (TPR). The number of shares that vested was based on the highest cumulative performance level achieved under each category. Shares that did not vest were transferred back to the group for no consideration and were cancelled.
Should an executive cease employment prior to the shares vesting, then all unvested shares may have been cancelled.
Details of the number of shares awarded, vested and cancelled in the year are set out in the Remuneration Report.
Under the new Senior Executive Long Term Incentive Plan, the amount awarded will be represented by Performance Rights. The 30 day Volume Weighted Average Price (VWAP) of AFIC shares up to but not including 1 July will be calculated. The amount of ELTIP available will then be divided by this 30-day VWAP price to determine the number of Performance Rights that may vest at the vesting point in four years’ time. The value of each Performance Right will be adjusted by the accumulation return on the AFI share price (being the movement in the share price assuming the reinvestment of any dividends) up to vesting date, based on a final share price calculated on the 30-day VWAP price up to 30 June.
The estimated fair value of the award will be calculated in accordance with AASB 2 – Share Based Payments at the end of each year until the final year of vesting. The liability shown after the final year of vesting will represent the actual amount being paid to eligible employees as a cash-settled share-based payment.
69,704 rights were awarded under the plan during the year ended 30 June 2017 (2016: 66,784). An expense of $437,634 (2016: $267,351) was incurred for the 2013/14, 2014/15, 2015/16 and 2016/17 plans. 53,489 rights under the 2012/13 plan were forfeited during the year.
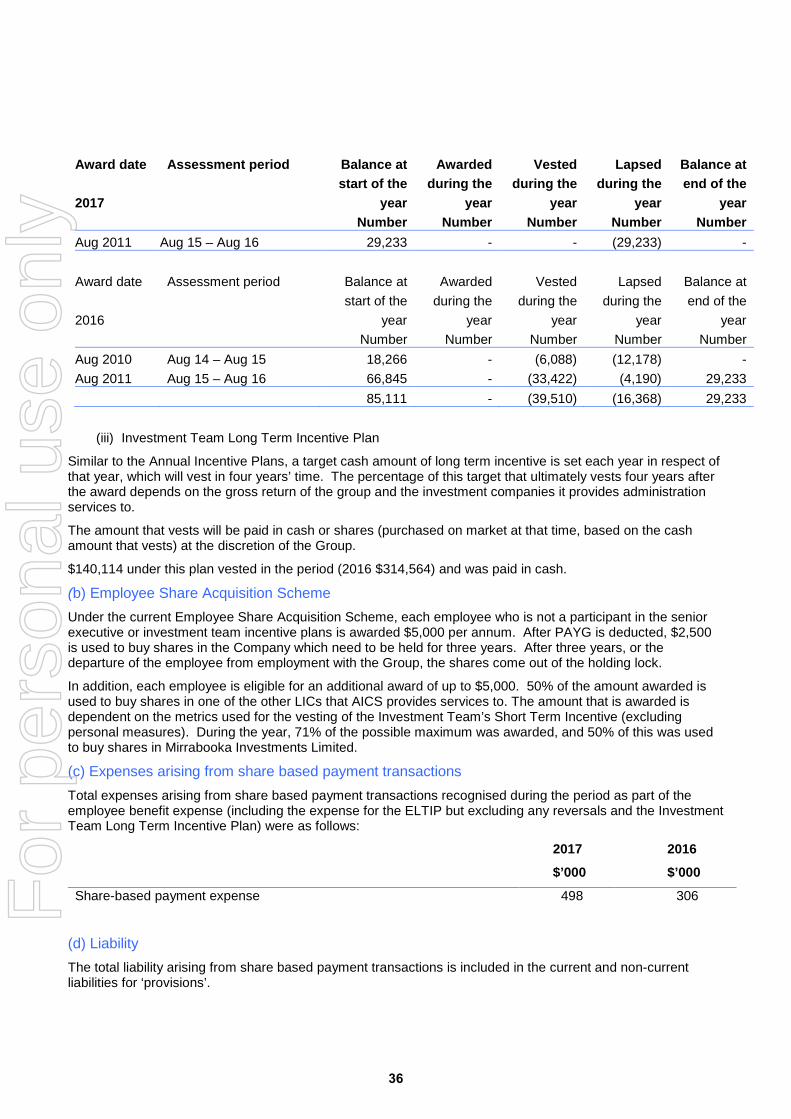
Set out below is a summary of AFIC shares awarded under the old Executive Long Term Incentive Plan:
35
For
per
sona
l use
onl
y
Award date 2017
Assessment period Balance at start of the
year Number
Awarded during the
year Number
Vested during the
year Number
Lapsed during the
year Number
Balance at end of the
year Number
Aug 2011 Aug 15 – Aug 16 29,233 - - (29,233) -
Award date 2016
Assessment period Balance at start of the
year Number
Awarded during the
year Number
Vested during the
year Number
Lapsed during the
year Number
Balance at end of the
year Number
Aug 2010 Aug 14 – Aug 15 18,266 - (6,088) (12,178) - Aug 2011 Aug 15 – Aug 16 66,845 - (33,422) (4,190) 29,233 85,111 - (39,510) (16,368) 29,233
(iii) Investment Team Long Term Incentive Plan
Similar to the Annual Incentive Plans, a target cash amount of long term incentive is set each year in respect of that year, which will vest in four years’ time. The percentage of this target that ultimately vests four years after the award depends on the gross return of the group and the investment companies it provides administration services to.
The amount that vests will be paid in cash or shares (purchased on market at that time, based on the cash amount that vests) at the discretion of the Group.
$140,114 under this plan vested in the period (2016 $314,564) and was paid in cash.
(b) Employee Share Acquisition Scheme Under the current Employee Share Acquisition Scheme, each employee who is not a participant in the senior executive or investment team incentive plans is awarded $5,000 per annum. After PAYG is deducted, $2,500 is used to buy shares in the Company which need to be held for three years. After three years, or the departure of the employee from employment with the Group, the shares come out of the holding lock.
In addition, each employee is eligible for an additional award of up to $5,000. 50% of the amount awarded is used to buy shares in one of the other LICs that AICS provides services to. The amount that is awarded is dependent on the metrics used for the vesting of the Investment Team’s Short Term Incentive (excluding personal measures). During the year, 71% of the possible maximum was awarded, and 50% of this was used to buy shares in Mirrabooka Investments Limited.
(c) Expenses arising from share based payment transactions Total expenses arising from share based payment transactions recognised during the period as part of the employee benefit expense (including the expense for the ELTIP but excluding any reversals and the Investment Team Long Term Incentive Plan) were as follows:
2017
$’000
2016
$’000
Share-based payment expense 498 306
(d) Liability The total liability arising from share based payment transactions is included in the current and non-current liabilities for ‘provisions’.
36
For
per
sona
l use
onl
y
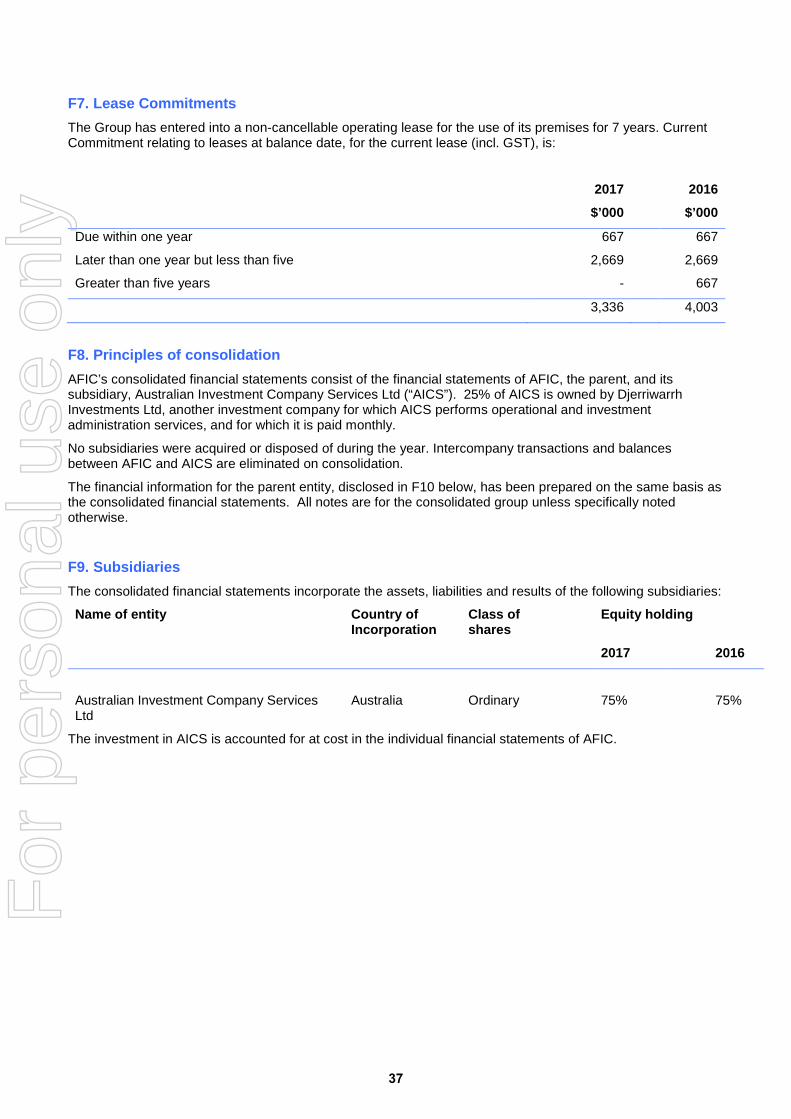
F7. Lease Commitments The Group has entered into a non-cancellable operating lease for the use of its premises for 7 years. Current Commitment relating to leases at balance date, for the current lease (incl. GST), is:
2017
$’000
2016
$’000
Due within one year 667 667
Later than one year but less than five 2,669 2,669
Greater than five years - 667
3,336 4,003
F8. Principles of consolidation AFIC’s consolidated financial statements consist of the financial statements of AFIC, the parent, and its subsidiary, Australian Investment Company Services Ltd (“AICS”). 25% of AICS is owned by Djerriwarrh Investments Ltd, another investment company for which AICS performs operational and investment administration services, and for which it is paid monthly.
No subsidiaries were acquired or disposed of during the year. Intercompany transactions and balances between AFIC and AICS are eliminated on consolidation.
The financial information for the parent entity, disclosed in F10 below, has been prepared on the same basis as the consolidated financial statements. All notes are for the consolidated group unless specifically noted otherwise.
F9. Subsidiaries The consolidated financial statements incorporate the assets, liabilities and results of the following subsidiaries:
Name of entity Country of Incorporation
Class of shares
Equity holding
2017 2016
Australian Investment Company Services Ltd
Australia
Ordinary
75%
75%
The investment in AICS is accounted for at cost in the individual financial statements of AFIC.
37
For
per
sona
l use
onl
y
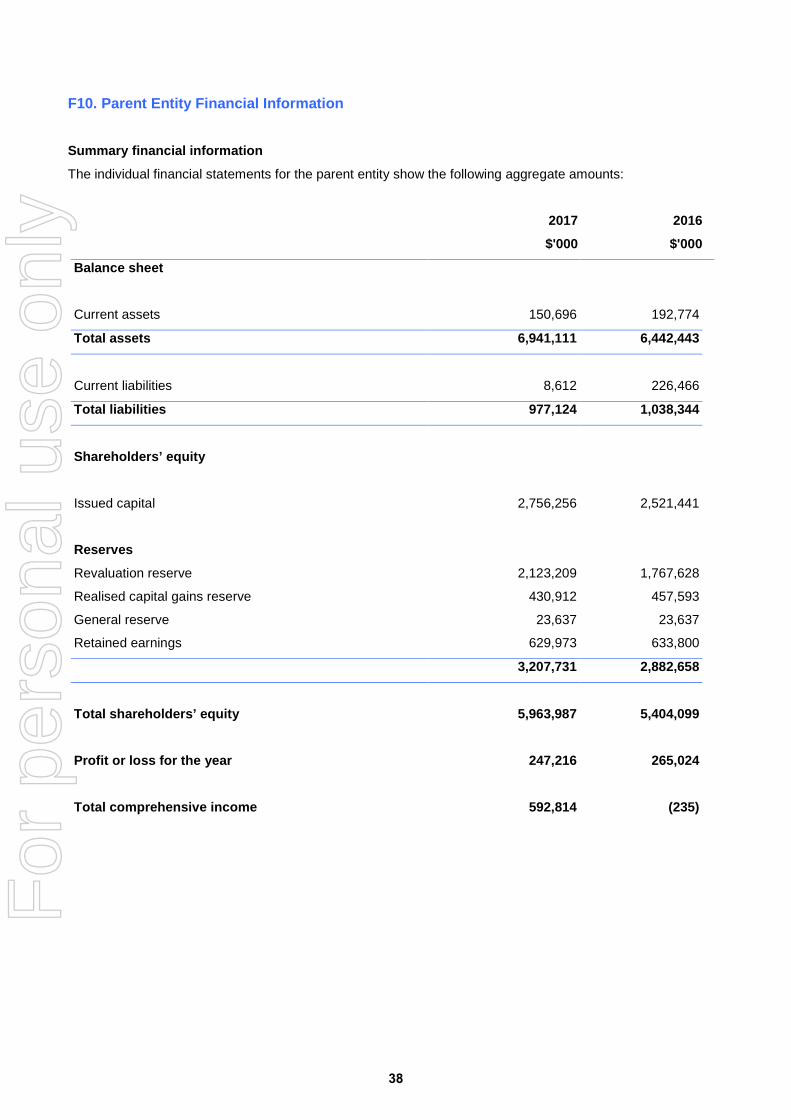
F10. Parent Entity Financial Information
Summary financial information
The individual financial statements for the parent entity show the following aggregate amounts:
2017 2016
$'000 $'000
Balance sheet
Current assets 150,696 192,774
Total assets 6,941,111 6,442,443
Current liabilities 8,612 226,466
Total liabilities 977,124 1,038,344
Shareholders’ equity
Issued capital 2,756,256 2,521,441
Reserves
Revaluation reserve 2,123,209 1,767,628
Realised capital gains reserve 430,912 457,593
General reserve 23,637 23,637
Retained earnings 629,973 633,800
3,207,731 2,882,658
Total shareholders’ equity 5,963,987 5,404,099
Profit or loss for the year 247,216 265,024
Total comprehensive income 592,814 (235)
38
For
per
sona
l use
onl
y
39
For
per
sona
l use
onl
y
40
For
per
sona
l use
onl
y
41
For
per
sona
l use
onl
y
42
For
per
sona
l use
onl
y