for personal use only - asxaug 27, 2018 · safety performance - year ended 30 june 2018 2017...
TRANSCRIPT

27 August 2018
APPENDIX 4E AND 2018 ANNUAL REPORT Attached are the following reports relating to Infigen Energy (ASX: IFN):
• Appendix 4E
• Infigen Energy 2018 Annual Report
• Infigen Energy (Bermuda) Limited 2018 General Purpose Financial Statements ENDS For further information please contact: Sarah McNally General Manager – Investor Relations Tel +61 2 8031 9901
About Infigen Energy
Infigen (ASX: IFN) is a leading Australian Securities Exchange (ASX) listed energy market participant delivering energy solutions to Australian businesses and large retailers. Infigen supplies clean energy from a combination of renewable energy generation and firming solutions available from the broader energy market to Australian business customers. Infigen is a licensed energy retailer in the National Electricity Market (NEM) regions of Queensland, New South Wales (including the Australian Capital Territory), Victoria and South Australia. The company has wind generation assets in New South Wales, South Australia and Western Australia. Infigen is also developing options for firming in the NEM to support its business strategy. Infigen is proudly Australia’s largest listed owner of wind power generators by installed capacity of 557MW, with a further 113.2MW under construction in New South Wales, and actively supports the communities in which it operates. For further information, please visit: www.infigenenergy.com
For
per
sona
l use
onl
y

INFIGEN ENERGY Appendix 4E – Preliminary Final Report for the year ended 30 June 2018
Name of entity: Infigen Energy (ASX: IFN), a stapled entity comprising Infigen Energy Limited (ABN 39 105 051 616), Infigen Energy (Bermuda) Limited (ARBN 116 360 715), and the Infigen Energy Trust (ARSN 116 244 118)
Reporting period
Current Period: 1 July 2017 – 30 June 2018 Previous Corresponding Period: 1 July 2016 – 30 June 2017
Results for announcement to the market
%
Movement 30 June 2018
$’000 30 June 2017
$’000
Revenues from ordinary activities Up 13.7% 223,755 196,664
Profit from ordinary activities after tax attributable to members Up 41.5% 45,673 32,264
Net profit for the period attributable to members Up 41.5% 45,673 32,264
Dividends or distributions
There were no dividends or distributions paid in respect of the years ended 30 June 2018 and 30 June 2017.
Net tangible asset backing per security
30 June 2018 30 June 2017
Net tangible assets per stapled security 48 cents 38 cents
Associates and joint venture entities
Name of entity Percentage holding 30 June 2018 30 June 2017
Forsayth Wind Farm Pty Limited 50% 50% Infigen Suntech Australia Pty Limited 50% 50% RPV Developments Pty Limited 32% 32%
Control gained over entities during the period
Infigen Energy NT Solar Holdings Pty Limited was incorporated on 1 December 2017 Infigen Energy NT Solar Pty Limited was incorporated on 4 December 2017 Manton Solar Pty Limited was incorporated on 4 December 2017 Batchelor Solar Pty Limited was incorporated on 4 December 2017
For all other information required by Appendix 4E, please refer to the following documents lodged with the Australian Securities Exchange (ASX) on 27 August 2018:
ASX Release Annual Report Annual Results Presentation
For
per
sona
l use
onl
y

Infigen Energy
Annual Report2018.
For
per
sona
l use
onl
y

Contents2 About Infigen Energy5 2018 Highlights7 Safety8 Chairman & Managing Director’s Report
Directors’ Report 11 Operating & Financial Review20 Corporate Structure21 Directors23 Executive Directors & Management Team25 Remuneration Report39 Other Disclosures
41 Auditor’s Independence Declaration
42 Financial Report73 Directors’ Declaration74 Auditor’s Report
81 Governance
87 Additional Information87 Investor Information92 Glossary
94 Corporate Directory
Infigen Energy LimitedACN 105 051 616
Infigen Energy TrustARSN 116 244 118
Registered officeLevel 17, 56 Pitt Street Sydney NSW 2000 Australia+61 2 8031 9900www.infigenenergy.com
Image: Alinta Wind Farm, WA1
Infigen Energy 2018 Annual ReportF
or p
erso
nal u
se o
nly

Infigen (ASX: IFN) is a leading Australian Securities Exchange (ASX) listed energy market participant delivering energy solutions to Australian businesses and large retailers.
Infigen supplies clean energy from a combination of renewable energy generation and firming solutions available from the broader energy market to Australian business customers.
Infigen is a licensed energy retailer in the National Electricity Market (NEM) regions of Queensland, New South Wales (including the Australian Capital Territory), Victoria and South Australia. The company has wind generation assets in New South Wales, South Australia and Western Australia. Infigen is also developing options for firming in the NEM to support its business strategy.
Infigen is proudly Australia’s largest listed owner of wind power generators by installed capacity of 557MW, with a further 113MW under construction in New South Wales and actively supports the communities in which it operates.
For further information, please visit: www.infigenenergy.com
About Infigen Energy.
Image: Alinta Wind Farm, WA 2
For
per
sona
l use
onl
y

Infigen assets are located across New South Wales, South Australia and Western Australia.
3
For
per
sona
l use
onl
y
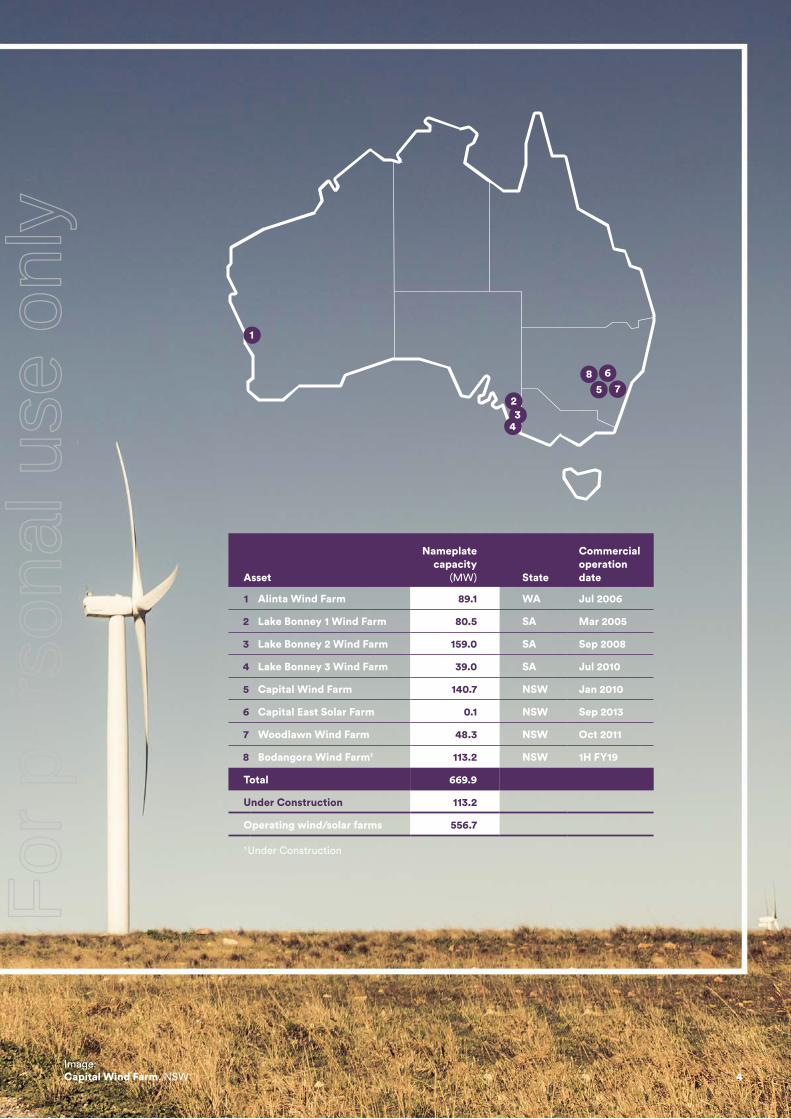
Infigen assets are located across New South Wales, South Australia and Western Australia.
Image: Capital Wind Farm, NSW 4
Asset
Nameplate capacity
(MW) State
Commercial operation date
1 Alinta Wind Farm 89.1 WA Jul 2006
2 Lake Bonney 1 Wind Farm 80.5 SA Mar 2005
3 Lake Bonney 2 Wind Farm 159.0 SA Sep 2008
4 Lake Bonney 3 Wind Farm 39.0 SA Jul 2010
5 Capital Wind Farm 140.7 NSW Jan 2010
6 Capital East Solar Farm 0.1 NSW Sep 2013
7 Woodlawn Wind Farm 48.3 NSW Oct 2011
8 Bodangora Wind Farm1 113.2 NSW 1H FY19
Total 669.9
Under Construction 113.2
Operating wind/solar farms 556.7
1 Under Construction
1
56
78
4
23
For
per
sona
l use
onl
y

2018 Highlights.
1,480
$100.4
¢60
$210.1
$149.1
$45.7
Gigawatt Hours
Million
Million
Million
MillionCents
Production sold increased 6%
Net Operating Cash Flow increased 2%
Net Assets per Security increased 20%
Net Revenue increased 7%
Underlying EBITDA increased 7%
Net Profit after Tax increased 41%
5
Infigen Energy 2018 Annual ReportF
or p
erso
nal u
se o
nly

$210.1
$149.1
$45.7
Multi-Channel Route to Market Strategy delivered a balance of price, tenor and risk for electricity and LGC revenue
Bodangora Wind Farm — Expected to be delivered on budget and due for completion 1H FY19 with the first export to the National Electricity Market on 6 August 2018
Target generation sales, with electricity revenue balanced across the portfolio: • 21% — Run of Plant power purchase agreements • 45% — C&I / Wholesale Contracts • 34% — Spot market
Infigen enters FY19 with a strong contracted sales book for expected production at 72% for electricity and 89% for LGCs
›
›
›
Successful Refinance delivered a new Corporate Facility
›››
Creates flexibility to allow Infigen to manage all assets as one portfolio
Provides liquidity facilities to support execution of the business strategy
Ensures that there is free cash flow from operations after debt service to support growth and allow consideration of the reintroduction of distributions
Will increase Infigen’s installed capacity by 20% and expected annual production by 24%
6
For
per
sona
l use
onl
y

INFIGEN ENERGY 2018 ANNUAL REPORT
7
SAFETY Infigen’s first priority is the safety of the people and the communities in which it operates. Infigen remains committed to achieving its goal of zero harm.
Infigen adopts a combination of engineering solutions, as well as human practices and behaviours, to reduce or eliminate safety risks from our operating assets. Individual responsibility for the safety of ourselves and our colleagues is at the core of our organisational values and drives our efforts to continuously improve our safety performance.
Safety performance - year ended 30 June 2018 2017 Change
Lost Time Injury (LTI) 1 1 -
Lost Time Injury Frequency Rate (LTIFR) 2.6 4.7 (2.1)
Total Recordable Injury Frequency Rate (TRIFR) 13.0 4.7 8.3
Infigen’s safety performance is measured on a rolling 12-month basis, in accordance with standards of Safe Work Australia.
The one LTI was sustained by a contract worker while performing turbine service works at the Woodlawn Wind Farm. The worker has returned to their normal duties.
Principal contractors are responsible for the management of daily operations and safety of their workers at Infigen’s sites. Infigen however, includes contractor worker recordable injuries in its statistics. There were no recordable injuries reported involving Infigen employees.
During the year the Lake Bonney 1 and Alinta Wind Farms achieved a significant milestone of being 10-years LTI free.
Infigen continues to actively engage in the management of contractor safety, using methods including workshops, monthly meetings, and audits.
For
per
sona
l use
onl
y

8
CHAIRMAN & MANAGING DIRECTOR’S REPORT
Dear Security holder,
We are pleased to present the full year results for Infigen for the 2018 financial year (FY18).
Safety continues to be our highest priority. We continued our focus on the safety at our operating assets as well as at our Bodangora wind farm which is under construction by contractors. The Board and management continue to look for opportunities to improve our systems and culture in vigilant pursuit of our goal of zero harm. During the year we had one LTI. We are pleased to report that Lake Bonney 1 Wind Farm and Alinta Wind Farm both achieved 10 years LTI free.
During FY18, the Australian energy market continued in a state of transformational change at both operational and policy development levels.
Against this backdrop, Infigen’s FY18 Financial Results have been characterised by strong financial performance and significant progress in delivering on key elements of the strategy to position our company to preserve existing and grow future value for all security holders.
Since the FY16 AGM, Infigen has been pursuing a strategy that recognised the process of transformation that is occurring in the broader Australian energy market and the inevitable rise in the significance of the role of renewables in the national energy mix. This transformation is driven by a combination of factors including:
the progressive retirement of the aged coal fired fleet;
the decline in the relative price of renewable generation;
community support for reduced carbon emissions;
the decline in power purchase agreement (PPA) prices available from large retailers (and the adoption by large retailers of new business models to meet their obligations to meet Renewable Energy targets);
a growth in demand by commercial and industrial customers to contract directly with generators (especially renewable generators) to meet their energy supply arrangements;
rising gas prices which constrains the function of gas generation as a source of base and intermediate load generation; and
in addition to the increase in gas prices, the cost of black coal has also notably increased, with both these factors flowing through to increased wholesale costs.
Infigen’s legacy fleet of assets were originally developed under long term PPAs which are at various stages of maturity - with more than half the foundation contracts having expired by 2015. Recontracting these assets under long term run of plant supply agreements to energy retailers would result in substantial erosion of security holder value based on current market prices for this product.
Over the course of the last 18 months, Infigen has sought to reduce the short term exposure of its revenues and grow our proportion of revenue under multi year contracts as well as maximise value for our security holders. We have also invested in additional production, introduced strategies to manage the risks associated with intermittent generation, and advanced consideration of several projects for future investment. We have, in particular:
invested in new capacity by commercialising certain projects within the Infigen development pipeline - by, in particular, developing the 113MW windfarm at Bodangora;
restructured our corporate debt facility to enable the company to operate the business as a portfolio of assets and to pursue a business strategy involving the diversification of our channels to market beyond large scale retailers under long term PPA style contracts;
contracted approximately one third of our capacity under multi year contracts to commercial and industrial customers to deliver a balanced portfolio comprising one third of our capacity contracted under long term PPAs, one third to C&I customers and one third available for sale in the spot market;
implemented long term service agreements with Vestas to manage our fleet optimally across its service life with the objective of maximising earnings;
enhanced our capacity (human and systems) in energy markets and project delivery;
developed a 5 Year Business Plan that involves investment in both additional energy in target markets as well as the ability to firm that supply to meet customer needs; and
undertaken a process of Board renewal over the last two years. In FY18 we were pleased to welcome Mr Mark Chellew and Ms Emma Stein to the Board.
For
per
sona
l use
onl
y
INFIGEN ENERGY 2018 ANNUAL REPORT
9
Going forward, the future market will require not only the investment in new clean sources of generation but also the ability to manage the supply risks associated with intermittent sources of generation and the implications for stability of the transmission grid of more distributed sources of generation.
A significant challenge for any market participant or investor in the current energy market is the degree of policy uncertainty that has arisen. This uncertainty is a product of the political response to the impact of the market transformation on consumers and has led to a stream of policy reviews and public debates about the future of the energy supply industry.
Virtually all reviews have concluded that Australia would benefit from having a NEM wide framework that addresses the issues of reliability, competitive price and emissions. In the last year, this has resulted in the development of the National Energy Guarantee (NEG), which had reached an advanced stage of consideration. However more recently it is now apparent that the NEG is headed for the well populated graveyard of attempts at Australian energy policy and a further period of policy uncertainty is likely. In any event, equally significant to the success of any new policy settings will be government confidence in that policy’s capacity to deliver outcomes that are market based. This requires governments to refrain from sponsoring initiatives that undermine investor confidence and heighten risk. Infigen will continue to participate in the development of sound policy and monitor the impact of these and the impact of any government initiatives on the outlook for the energy market and our business.
Infigen’s own business strategy is consistent with its underlying objectives - namely to produce and supply clean energy to consumers at affordable prices within a stable grid.
It is against this backdrop that we have carefully reviewed all our potential investment projects and examined them for the function they would perform, as part of our overall portfolio, within the future energy market. As mentioned at the FY17 AGM we have examined each of our development projects in the context of the regional energy markets in which they are located. We have also spent considerable time understanding the customer base in each of the Australian regional markets and the extent to which our existing or planned production profiles will require access to firming products to meet their needs. In circumstances where firming capacity is required we have examined the current options available and the case for direct investment in various firming options. These options include energy storage, peaking plant, insurance products and market derivatives.
Based on our analysis the market outlook presents considerable opportunity for Infigen to protect and create new value by continuing to execute our board endorsed strategy that is reflected in our 5 Year business plan.
We have continued to advance our Cherry Tree wind farm project in Victoria, including consideration as a Capital Lite project. A decision on the Cherry Tree project remains under review to take into account a range of factors including policy decisions by governments and the outworkings of the Victorian government’s tender for renewable energy. We also continue to advance the Flyers Creek project in NSW. More recently we have agreed a 5 year contract to purchase the electricity of the 31 MW Kiata Wind Farm in Victoria commencing 1 September 2018. When coupled with the execution of firming initiatives, this contract provides an ability for us to commence our C&I sales strategy in Victoria.
Following the successful contracting of production from our merchant capacity in SA and NSW we focused our attention on the options available to us to manage the supply risks associated with intermittent generation. The outcome of this process has been to favour investment in battery technology in SA in the first instance. We were therefore pleased to receive grant funding ($10,000,000) from the SA government and ARENA which enabled us to invest in a utility scale battery that can deliver 52 MWh storage capacity. This capability will enable us to confidently contract a further 18 MW of additional capacity from our Lake Bonney plants. It will also reduce our exposure to FCAS costs, create value through price arbitrage, and position us to manage the challenges of the 5 minute settlement rule - scheduled for implementation in 2021.
Over the course of recent months we have examined the original timing of the implementation of our business strategy in light of the opportunity that has been presented to us by Brookfield joining our register. As announced to the market on 16 April 2018 we have been engaged in discussion with Brookfield about how they might assist us in accelerating the implementation of this plan.
Central to our analysis of any proposal under consideration is whether it would result in the creation of additional value for existing security holders as well as preserve their existing value and protect their future interests.
For
per
sona
l use
onl
y

10
Key outcomes from any such proposal would need to include:
enhanced value by accelerated development of new renewable generation capacity;
reduction of risk to existing value by access to additional firming capacity;
stronger credit metrics; and
a high degree of certainty in relation to distribution policy
We will advise the market once the outcome of these discussions are completed. The results of those discussions will depend on whether we have been able to arrive at an arrangement that we believe is in the interests of the company and its security holders.
The initiatives that Infigen Energy has taken over the course of the past two years have transitioned the company to an active energy market participant and have created a solid foundation upon which to capture the opportunities that the future market offers and manage the risks it contains.
We thank security holders for their ongoing support and look forward to working with all our stakeholders to deliver the strategy that we have developed.
Sincerely,
Len Gill Ross Rolfe AO
Chairman Chief Executive Officer / Managing Director
For
per
sona
l use
onl
y
INFIGEN ENERGY 2018 ANNUAL REPORT
11
OPERATING AND FINANCIAL REVIEW This Operating and Financial Review (OFR) forms part of the Directors’ Report. The OFR contains forward looking statements, including statements of current intention, statements of opinion and predictions as to possible future events and future financial prospects. Such statements are not statements of fact, and there can be no certainty of outcome in relation to the matters to which the statements relate.
1. Strategy and Growth
Infigen has transitioned from a business that owned and operated wind generation assets and largely sought to sell its output of both energy and Large-Scale Generation Certificates (LGCs) to long term off takers. It is becoming an active energy markets participant that seeks to deliver a range of products and solutions to Commercial and Industrial (C&I) Customers and energy retailers through multiple routes to market.
The long-term growth of Infigen necessitates:
increasing the capacity to deliver firm supply of electricity to its customer base while managing the risks associated with intermittent renewable generation;
increasing sales at sustainable profit margins;
further diversifying the customer base; and
further enhancing its capability to service the growing customer base.
This growth is occurring within a dynamic energy market which is itself in a state of transition as aging generation exits the system and consumers more broadly are seeking clean and reliable energy supplies at competitive prices.
Infigen is well placed to deliver reliable energy to customers, to invest in new firming and generation as and when required, and to contribute to the creation of a lower emissions economy. Infigen will respond to the business and market requirements for firm capacity and the price signals for new sources of generation. It may do so by acquiring, procuring or building further firming capacity, and either building new generation capacity on balance sheet or by sponsoring certain projects through the Capital Lite strategy.
Infigen’s sales diversification strategy seeks to deliver low emissions energy to its customers, while managing the risk of intermittent production consistent with their requirements. Infigen’s risk management strategies are designed to achieve an outcome in which Infigen’s C&I Customers are not dependent for supply and price on availability of its (renewable and variable) fuel source and its security holders are protected from price risk on supply in periods where Infigen’s assets are not generating electricity. The strategy seeks to balance price, tenor and risk to preserve and create value for security holders.
Infigen’s business strategy is designed to stabilise and grow revenues while managing the risks associated with delivering firm supplies of energy
to meet customer needs. To this end, Infigen has focussed on:
deleveraging the balance sheet;
increasing generation capacity for sale; and
enhancing the ability to firm the product for sale to capture contracts from valuable C&I Customers.
The success of this strategy is demonstrated in Infigen’s FY18 results. Importantly, it is reflected in the contract book with which Infigen enters FY19. So too is it evidenced by Infigen’s investment in additional generation on balance sheet as well as its strategy to access the supply of energy from sources off balance sheet. In FY18 Infigen managed the risks around delivering firm supply to customers by accessing insurance products from the derivatives market. More recently, it complemented this strategy by investing in a Battery Energy Storage System adjacent to the Lake Bonney Wind Farm in South Australia (BESS). Infigen expects the BESS to be commissioned in 2H FY19. This will enable Infigen to manage the risks involved in contracting higher levels of production from its Lake Bonney Wind Farms to its customer base in South Australia.
Electricity and LGC Pricing
Current market prices for electricity and LGCs, in part, reflect the historical RET and ongoing regulatory uncertainty. Electricity prices were more subdued in FY18 than FY17. The market continues to be volatile but the fundamentals of supply and demand which underpin price and therefore may or may not create price signals for new investment remain strong, even without a resolution of the policy debate surrounding the interaction of energy and climate policy.
The volatility in prices further demonstrates the value of contracting with C&I Customers. Through this market strategy, it has been possible to capture the value in the forward curve. Infigen’s FY18 results demonstrated this where in a period of price decline in South Australia, Infigen’s reduced exposure to the spot market as a result of C&I contracting has meant that the average electricity price received from sales in FY18 was largely in line with FY17.
LGC prices are expected to be lower in future periods, given the general market expectation that there will be sufficient production of LGCs by CY 2020 to meet the RET obligations and increasing volumes of renewable energy entering the market after that date against a demand for LGCs which
For
per
sona
l use
onl
y

12
reaches its maximum level in 2020. The level of demand will remain static until 2030. The rate of price decline for LGCs will be influenced by future Government policy, the retirement profile of thermal plant and technology solutions for replacement capacity. In the event that the price signals for new investment do not occur, then LGC prices should settle at higher than the current forward market as a substantial oversupply may not eventuate.
Managing Risk
Infigen’s increasing C&I contract load is managed against key metrics by which Infigen seeks to appropriately balance revenue certainty and value. The focus on firming Infigen’s supply to protect against price volatility in times of non-production of Infigen’s generating assets requires the use of firming products. The value of physical firming underpinned the business case for the development of the SA battery (BESS) which was recently announced and will be operational in 2H FY19. The importance of the ability to supply firm capacity and maintain system stability will continue to evolve as part of Infigen’s overall growth strategy. The potential to create additional value from the South Australian and NSW assets through contracting to C&I Customers will continue to remain a key focus.
Market and/or generation capacity expansion
Infigen’s expansion of generation capacity will be in response to market price signals. This requires a disciplined approach to market analysis and the key assumptions that drive project economics in the process of committing capital to growth projects.
Infigen’s investment decisions have regard to a number of factors in the NEM including without limitation: demand; gas availability; expected coal fired generation retirements; customers; market liquidity; and state based policies that incentivise new renewable generation. It was against this criteria that Infigen has recently entered into a run of plant power purchase agreement for electricity in Victoria (Kiata PPA). The Kiata PPA is the first closing of the Capital Lite strategy. The transaction underpins entry into the Victorian market. Infigen continues to investigate the development of the Cherry Tree Wind Farm which would further underpin Infigen’s entry into Victoria and focus on C&I Customers.
Infigen believes that further expansion into NSW would likely be accretive to its business and security holders. With this in mind, the Flyers Creek Wind Farm (NSW - approximately 130MW)
is the next prospective development project under consideration.
Increasing Infigen’s potential C&I Customer base
In response to the continuing and growing demand for energy from C&I Customers, Infigen will further enhance its customer service capability.
With further enhanced capability, Infigen would be able to service C&I Customers with multi-sites, and manage variability in load profile. This increased capability will allow Infigen to increase the number and type of C&I Customers with which it can contract.
Financial Position
Infigen commences FY19 able to support its growth and business ambitions. This is underpinned by two factors. First was the financial close of a new syndicated corporate facility, and the repayment of the existing Global Facility and Woodlawn Facility in FY18 (Refinancing), which delevered the balance sheet and removed the cash sweep. Secondly, Infigen continues to provide strong cash flows from operations. A meaningful quantum of those cash flows are available for growth and consideration for distributions subsequent to the Refinancing.
Infigen remains in active discussions with the Brookfield Group about the manner in which it may be able to be a strategic investor and capital partner as outlined to the market earlier this year.
The Regulatory and Political Environment
Infigen believes that the energy market fundamentals continue to evolve to its potential advantage, and that while policy and sentiment are regularly debated, the reality is that Australia is transitioning to a lower emissions electricity future and substantial amounts of new generation is required.
Infigen is actively engaged with policy makers, Government and stakeholders, including energy users to articulate the important role that clean energy can play in the transition and the lowering of costs for users. There is of course a risk that regulation or law can be adverse to Infigen’s interests and in that instance it will be ready to respond thoughtfully to any such change.
In FY18 Infigen has been actively engaged with all stakeholders and expects to continue this engagement in FY19.
For
per
sona
l use
onl
y
INFIGEN ENERGY 2018 ANNUAL REPORT
13
2. Financial Overview
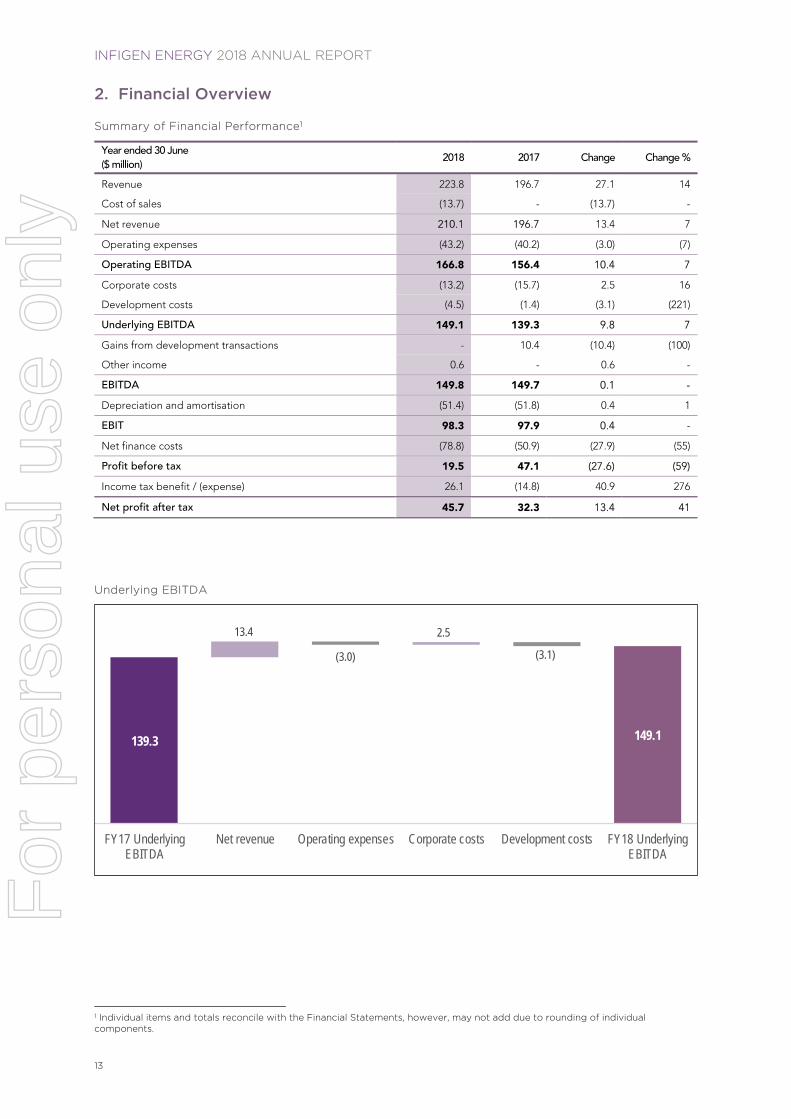
Summary of Financial Performance1
Year ended 30 June ($ million)
2018 2017 Change Change %
Revenue 223.8 196.7 27.1 14
Cost of sales (13.7) - (13.7) -
Net revenue 210.1 196.7 13.4 7
Operating expenses (43.2) (40.2) (3.0) (7)
Operating EBITDA 166.8 156.4 10.4 7
Corporate costs (13.2) (15.7) 2.5 16
Development costs (4.5) (1.4) (3.1) (221)
Underlying EBITDA 149.1 139.3 9.8 7
Gains from development transactions - 10.4 (10.4) (100)
Other income 0.6 - 0.6 -
EBITDA 149.8 149.7 0.1 -
Depreciation and amortisation (51.4) (51.8) 0.4 1
EBIT 98.3 97.9 0.4 -
Net finance costs (78.8) (50.9) (27.9) (55)
Profit before tax 19.5 47.1 (27.6) (59)
Income tax benefit / (expense) 26.1 (14.8) 40.9 276
Net profit after tax 45.7 32.3 13.4 41
Underlying EBITDA
1 Individual items and totals reconcile with the Financial Statements, however, may not add due to rounding of individual components.
139.3
13.4
(3.0)
2.5
(3.1)
149.1
FY17 UnderlyingEBITDA
Net revenue Operating expenses Corporate costs Development costs FY18 UnderlyingEBITDA
For
per
sona
l use
onl
y

14
Financial Performance Commentary
Higher Underlying EBITDA (+$9.8 million)
Primarily attributable to: Partially reduced by:
Higher net revenue (+$13.4 million) - primarily from:
6% more production sold for the year
A 5% increase in Infigen’s electricity price
Lower corporate costs (-$2.5 million) - primarily from:
Lower restructuring and transitioning costs incurred during the year
Higher operating expenses (+$3.0 million) - primarily from:
An increase in asset management and energy market expenses as Infigen continues to invest in the expansion of its internal capacity and capability during the year (+$1.2 million)
One-off costs (turbine O&M) were incurred, as anticipated, with the transition of operations and maintenance services from Suzlon to Vestas at the Capital and Woodlawn Wind Farms during the year (+$1.6 million). Partially offset by:
- net savings under these new Vestas contracts, which have lower production-linked payments (-$0.7 million)
An increase in FCAS net expenses due to the underlying increase in NEM charges allocated to market participants (+$0.7 million)
Higher development costs (+$3.1 million) - primarily from:
Infigen’s continued exploration of options for growing capacity for sale and enhancing the capacity to contract with C&I Customers in a risk managed manner, and improve revenue reliability
Higher Net Profit After Tax - non-underlying EBITDA items (+$3.6 million)
Primarily attributable to: Partially reduced by:
Higher income tax benefit (+40.9 million) - primarily from:
The recognition of previously unrecognised tax losses during the year (+$35.7 million)
Note: an income tax expense was incurred in the pcp
Higher net finance costs (+$27.9 million) - primarily from:
One-off fees incurred in exploring Refinancing options and the early expense of capitalised commitment fees during the year (+$5.1 million)
The termination of interest rate swaps at the time of Refinancing (+$43.3 million)
Partially offset by:
Lower interest expense (-$14.7 million), due in part to a lower average debt balance throughout the year as a result of the Refinancing
Higher interest income (+$3.2 million) from higher average cash balance on-hand throughout the year
No recurring gains from development transactions (-$10.4 million)
In the pcp, a gain on sale of the Manildra solar development project and the fair value uplift on the Bodangora Wind Farm acquisition was recognised F
or p
erso
nal u
se o
nly

INFIGEN ENERGY 2018 ANNUAL REPORT
15
Electricity revenue
Infigen continued to seek a balance between price, tenor and risk for electricity revenue through its Multi-Channel RTM during the year. This was evidenced by the increase in C&I and wholesale contract revenue contribution, and the decrease in net spot revenue contribution. The revenue percentage contribution from major production sales channels is provided below.
Sales channel
Description Revenue contribution (%) 2018 2017
PPAs Medium to long-term contracts where Infigen has no substantial firm delivery risk
21 20
C&I and wholesale contracts
Medium to long-term C&I contracts and short to medium-term wholesale market contracts
45 23
Net spot Spot sales through the Australian Energy Market Operator (AEMO)
34 57
100 100
Electricity price
Infigen’s NSW prices were higher, despite a flat NSW spot price. Infigen maintained its SA prices, despite declining SA spot prices. This was primarily due to additional C&I and wholesale contracts (entered during the year), higher Dispatch Weighted Average electricity prices, and electricity derivatives.
Market
Electricity Spot Price ($/MWh)
Infigen’s Electricity Price ($/MWh)
2018 2017 Change 2018 2017 Change
NSW 82.27 81.22 1.05 75.16 67.80 7.36
SA 98.10 108.66 (10.56) 78.32 78.44 (0.12)
Electricity spot price is the time weighted average of spot prices.
Infigen’s electricity price is the weighted average price of its revenue channel sales, and is net of the cost of electricity derivatives which are used to manage the risk associated with delivering firm contracted load to customers.
LGC Inventory and Price
LGC inventory
As at 30 June Unit 2018 2017 Change Change %
LGC volume certificates 581,121 374,300 206,821 55
LGC inventory $ million 43.3 27.0 16.3 60
Infigen’s average LGC price
($/LGC) 2018 2017 Change Change %
Year-ended 30 June 70.8 72.1 (1.3) (2)
An LGC represents 1 MWh generation from renewable energy generators. LGC revenue is recognised at fair value once generated and in the same period as costs are incurred. Each LGC is concurrently recognised in inventory until it is sold, at which time, the difference between the sale price and book value is recorded as a component of revenue. The increase in inventory is primarily due to an increase in contracted and forward sales with delivery dates after 30 June 2018. Contracted LGC volume is 89% (FY19); 83% (FY20); and 49% (FY21). This is based on current contract positions and historical production for operating facilities (plus expected production from the Bodangora Wind Farm).
For
per
sona
l use
onl
y

16
Operating Expenses
Year ended 30 June ($ million)
2018 2017 Change Change %
Turbine O&M 21.5 20.8 0.7 3
Asset management 7.1 6.4 0.7 11
Other direct expenses 7.2 7.1 0.1 1
Balance of plant 1.3 1.1 0.2 18
Generation expenses 37.1 35.4 1.7 5
Energy Markets 3.2 2.7 0.5 19
FCAS net expenses1 2.8 2.1 0.7 33
Operating expenses 43.2 40.2 3.0 7
Net Finance Costs
Year ended 30 June ($ million)
2018 2017 Change Change %
Interest expense 32.9 47.6 (14.7) (31) Bank and amortisation of capitalised commitment fees
3.1 2.9 0.2 7
One-off upfront and early expense of fees - associated with the Refinancing 5.1 - 5.1 -
Unwind of discount on decommissioning provisions
0.1 0.1 - -
Total borrowing costs 41.2 50.7 (9.5) (19)
Interest income (4.8) (1.6) (3.2) (200)
Net borrowing costs 36.4 49.1 (12.5) (25)
Termination of interest rate swaps 43.3 - 43.3 -
Net foreign exchange gain (0.9) (0.6) (0.3) (50) Net loss on change in fair value of interest rate swaps
- 2.4 (2.4) (100)
Net financing costs 78.8 50.9 27.9 55
Interest incurred on the Bodangora Wind Farm project finance facility (Bodangora PF) is capitalised to property, plant and equipment, consistent with applicable accounting standards.
Net Operating Cash Flow
Year ended 30 June ($ million)
2018 2017 Change Change %
Operating EBITDA 166.8 156.4 10.4 7 Corporate and development costs (17.7) (17.1) (0.6) (4) Movement in LGC inventory (16.4) (6.3) (10.1) (160) Movement in other working capital (2.1) 9.6 (11.7) (122) Proceeds from the sale of development asset - 5.1 (5.1) (100) Non-cash items (0.8) (0.1) (0.7) (700) Net finance costs paid (29.4) (48.9) 19.5 40 Net operating cash flow 100.4 98.7 1.7 2
The increase in net operating cash flow was due to an increase in revenue; an increase in inventory (due to the planned increase in contracting activity); and lower net finance costs paid.
1 Frequency control ancillary services (FCAS) charges relate to services that maintain key technical characteristics of the power
system. Reflects gross FCAS costs net of hedge payout.
For
per
sona
l use
onl
y

INFIGEN ENERGY 2018 ANNUAL REPORT
17
3. Review of Operations
Summary of Operational Performance
Year ended 30 June Unit 2018 2017 Change Change %
Production GWh 1,549 1,487 62 4
Production sold GWh 1,480 1,399 81 6
Capacity factor1 % 31.8 30.5 1.3 -
Turbine availability2 % 97.1 97.1 - -
Site availability3 % 96.6 96.4 0.2 -
Generation expenses4 $/MWh 24.0 23.9 0.1 -
Production
Year ended 30 June Production Marginal loss factors Production sold
2018 (GWh)
2017 (GWh)
% 2018 2017 %
2018 (GWh)
2017 (GWh)
%
Alinta5 316 338 (7) 0.9475 0.9519 - 316 338 (7)
Capital 374 345 8 1.0100 0.9931 2 380 343 11
Lake Bonney 1 199 181 10 0.9144 0.8768 4 177 159 11
Lake Bonney 2 405 381 6 0.9144 0.8768 4 360 334 8
Lake Bonney 3 103 95 8 0.9144 0.8768 4 91 83 10
Woodlawn 152 143 6 1.0100 0.9931 2 155 142 9
Compensated6 0.1 5 (98) - - - - - -
Total 1,549 1,487 4 0.94515 0.93218 1 1,480 1,399 6
Production increased primarily due to:
higher wind resource at Capital, Woodlawn and Lake Bonney Wind Farms (+87 GWh)
improved turbine availability at Alinta and Lake Bonney Wind Farms (+7 GWh)
This was partially offset by:
lower wind resource at Alinta Wind Farm (-26 GWh), noting the pcp experienced above average wind conditions
decreased network availability at Lake Bonney Wind Farms (-4 GWh) due to an increase in unscheduled transmission network maintenance
1 Calculated by dividing production generated over 12 months by the amount of electricity that would have been produced if all
wind turbines had been running at full capacity for the year. 2 Indicates the percentage of time wind turbines have been available to generate electricity. 3 Indicates the percentage of time wind turbines and balance of plant have been available to generate electricity. 4 Calculated by dividing generation expenses with production. Note: Infigen previously reported operating expenses ($/MWh),
calculated by dividing operating expenses with production. 5 Marginal loss factor is not relevant to electricity sold at Alinta Wind Farm. 6 Compensated production is notional production that represents compensated revenue.
For
per
sona
l use
onl
y

18
4. Balance Sheet
As at 30 June 2018 2017 Change Change %
Cash $ million 144.9 251.8 (106.9) (42)
Debt (drawn) $ million 676.1 657.3 18.8 3
Net debt $ million 531.2 405.5 125.7 31
Net assets per security $ 0.60 0.50 0.10 20
Book gearing1 % 45.8 45.5 0.3 -
Net debt / Underlying EBITDA ratio 3.6 2.9 0.7 24
Underlying EBITDA / interest ratio 4.5 2.9 1.6 55
Cash consists of:
unrestricted cash ($94.5 million) - including cash on hand and term deposits held at call
restricted cash ($50.4 million) - held in accordance with the minimum cash requirements for the Australian Financial Services Licence (AFSL) compliance and the Bodangora PF
The reduction in cash is primarily due to the Refinancing to deleverage Infigen. Debt (drawn) consists of:
a corporate facility - with a drawn balance of $517.5 million (pcp: $Nil). This facility reached financial close on 18 April 2018. The proceeds were combined with cash on-hand to repay both the Global and Woodlawn Project Finance facilities, which had a combined drawn balance prior to repayment of $609.2 million
the Bodangora PF - with a drawn balance of $158.6 million (pcp: $1.8 million). This facility is used to fund the construction of the Bodangora Wind Farm
Debt (drawn) excludes capitalised commitment fees as shown in the Financial Statements of $26.0 million (pcp $3.5 million).
5. Capital Expenditure
Year ended 30 June ($ million)
2018 2017 Change Change %
Development projects (capitalised) 1.9 3.7 (1.8) (49)
Property, plant and equipment and IT equipment 2.6 0.9 1.7 189
Assets under construction 140.6 44.1 96.5 219
Capital expenditure 145.1 48.7 96.4 198
Development projects underpin growth both in terms of additional new capacity for sale and development of options to enhance the capacity to contract with C&I Customers in a risk managed manner, and improve revenue reliability.
Property, plant and equipment expenditure for the year includes investment in an expansion of Infigen’s energy risk management system.
Assets under construction primarily consists of the Bodangora Wind Farm project, which is due for completion in 1H FY19. Expenditure includes capitalised finance costs incurred for the Bodangora PF.
1 Calculated as net debt (accounting for capitalised commitment fees) divided by the sum of net debt (accounting for capitalised
commitment fees) and net assets.
For
per
sona
l use
onl
y
INFIGEN ENERGY 2018 ANNUAL REPORT
19
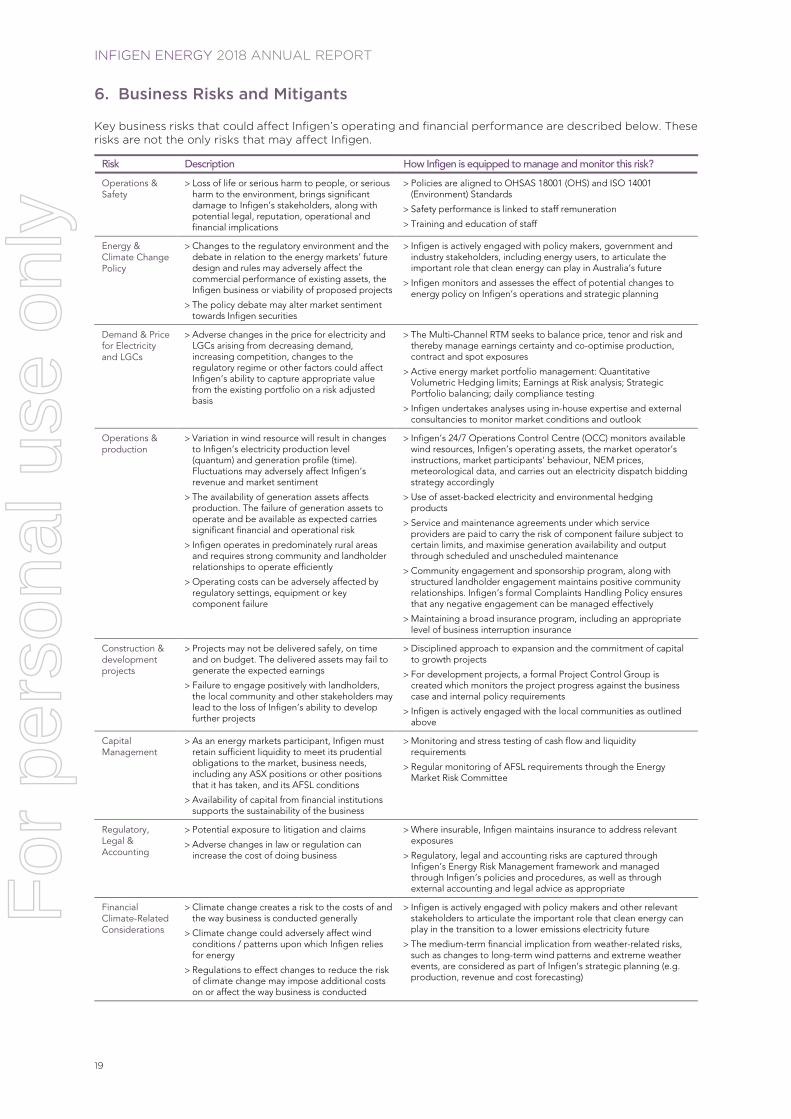
6. Business Risks and Mitigants
Key business risks that could affect Infigen’s operating and financial performance are described below. These risks are not the only risks that may affect Infigen.
Risk Description How Infigen is equipped to manage and monitor this risk?
Operations & Safety
Loss of life or serious harm to people, or serious harm to the environment, brings significant damage to Infigen’s stakeholders, along with potential legal, reputation, operational and financial implications
Policies are aligned to OHSAS 18001 (OHS) and ISO 14001 (Environment) Standards
Safety performance is linked to staff remuneration
Training and education of staff
Energy & Climate Change Policy
Changes to the regulatory environment and the debate in relation to the energy markets’ future design and rules may adversely affect the commercial performance of existing assets, the Infigen business or viability of proposed projects
The policy debate may alter market sentiment towards Infigen securities
Infigen is actively engaged with policy makers, government and industry stakeholders, including energy users, to articulate the important role that clean energy can play in Australia’s future
Infigen monitors and assesses the effect of potential changes to energy policy on Infigen’s operations and strategic planning
Demand & Price for Electricity and LGCs
Adverse changes in the price for electricity and LGCs arising from decreasing demand, increasing competition, changes to the regulatory regime or other factors could affect Infigen’s ability to capture appropriate value from the existing portfolio on a risk adjusted basis
The Multi-Channel RTM seeks to balance price, tenor and risk and thereby manage earnings certainty and co-optimise production, contract and spot exposures
Active energy market portfolio management: Quantitative Volumetric Hedging limits; Earnings at Risk analysis; Strategic Portfolio balancing; daily compliance testing
Infigen undertakes analyses using in-house expertise and external consultancies to monitor market conditions and outlook
Operations & production
Variation in wind resource will result in changes to Infigen’s electricity production level (quantum) and generation profile (time). Fluctuations may adversely affect Infigen’s revenue and market sentiment
The availability of generation assets affects production. The failure of generation assets to operate and be available as expected carries significant financial and operational risk
Infigen operates in predominately rural areas and requires strong community and landholder relationships to operate efficiently
Operating costs can be adversely affected by regulatory settings, equipment or key component failure
Infigen’s 24/7 Operations Control Centre (OCC) monitors available wind resources, Infigen’s operating assets, the market operator’s instructions, market participants’ behaviour, NEM prices, meteorological data, and carries out an electricity dispatch bidding strategy accordingly
Use of asset-backed electricity and environmental hedging products
Service and maintenance agreements under which service providers are paid to carry the risk of component failure subject to certain limits, and maximise generation availability and output through scheduled and unscheduled maintenance
Community engagement and sponsorship program, along with structured landholder engagement maintains positive community relationships. Infigen’s formal Complaints Handling Policy ensures that any negative engagement can be managed effectively
Maintaining a broad insurance program, including an appropriate level of business interruption insurance
Construction & development projects
Projects may not be delivered safely, on time and on budget. The delivered assets may fail to generate the expected earnings
Failure to engage positively with landholders, the local community and other stakeholders may lead to the loss of Infigen’s ability to develop further projects
Disciplined approach to expansion and the commitment of capital to growth projects
For development projects, a formal Project Control Group is created which monitors the project progress against the business case and internal policy requirements
Infigen is actively engaged with the local communities as outlined above
Capital Management
As an energy markets participant, Infigen must retain sufficient liquidity to meet its prudential obligations to the market, business needs, including any ASX positions or other positions that it has taken, and its AFSL conditions
Availability of capital from financial institutions supports the sustainability of the business
Monitoring and stress testing of cash flow and liquidity requirements
Regular monitoring of AFSL requirements through the Energy Market Risk Committee
Regulatory, Legal & Accounting
Potential exposure to litigation and claims
Adverse changes in law or regulation can increase the cost of doing business
Where insurable, Infigen maintains insurance to address relevant exposures
Regulatory, legal and accounting risks are captured through Infigen’s Energy Risk Management framework and managed through Infigen’s policies and procedures, as well as through external accounting and legal advice as appropriate
Financial Climate-Related Considerations
Climate change creates a risk to the costs of and the way business is conducted generally
Climate change could adversely affect wind conditions / patterns upon which Infigen relies for energy
Regulations to effect changes to reduce the risk of climate change may impose additional costs on or affect the way business is conducted
Infigen is actively engaged with policy makers and other relevant stakeholders to articulate the important role that clean energy can play in the transition to a lower emissions electricity future
The medium-term financial implication from weather-related risks, such as changes to long-term wind patterns and extreme weather events, are considered as part of Infigen’s strategic planning (e.g. production, revenue and cost forecasting)
For
per
sona
l use
onl
y

20
CORPORATE STRUCTURE Infigen comprises Infigen Energy Limited (IEL), Infigen Energy Trust (IET), Infigen Energy (Bermuda) Limited (IEBL), and the controlled entities of IEL and IET.
The Trust comprises IET and its controlled entities.
IET is a Registered Scheme (the Scheme) and Infigen Energy RE Limited (IERL) is the Responsible Entity of IET. The relationship of the Responsible Entity and the Scheme is governed by the terms and conditions specified in the Constitution of IET. IET has raised the majority of the contributed equity for Infigen. IET has also been the stapled entity through which distributions have historically been paid to security holders. During the financial year, IET held interests in financial investments.
The stapled structure was established prior to Infigen listing on the ASX in 2005. IEBL has never been used as an operating part of Infigen and it is expected to be de-stapled and wound up when feasible to do so.
The following diagram represents the structure of Infigen.
For
per
sona
l use
onl
y

INFIGEN ENERGY 2018 ANNUAL REPORT
21
DIRECTORS Appointment of New Independent Directors and Board Succession
On 21 September 2017, Mark Chellew and Emma Stein were appointed as independent non-executive directors of IEL, IEBL and IERL.
On 31 December 2017, Mike Hutchinson retired as a director and chairman of IEL, IEBL and IERL, with Len Gill being elected chairman of IEL, IEBL and IERL from that date. On 19 February 2018, Fiona Harris retired as an independent non-executive director of IEL, IEBL and IERL from that date.
The following people were Directors of IEL, IEBL and IERL during the twelve months ended 30 June 2018 and up to the date of this report (unless otherwise indicated):
Non-executive Directors
Len Gill (appointed Chairman effective 31 December 2017)
Philip Green
Mark Chellew (appointed as an independent non-executive Director on 21 September 2017)
Emma Stein (appointed as an independent non-executive Director on 21 September 2017)
Mike Hutchinson (retired as independent non-executive Chairman effective 31 December 2017)
Fiona Harris (retired as independent non-executive director on 19 February 2018)
Executive Directors
Ross Rolfe AO
Sylvia Wiggins
Directors’ Meetings
The number of Board meetings and meetings of standing Committees established by the respective Boards held during the year ended 30 June 2018, and the number of meetings attended by each Director, are set out below.
A = Number of meetings attended as a Board/Committee member.
B = Number of meetings held during the period that the person held office during the year.
Directors
Board meetings Committee meetings
IEL IERL IEBL Audit, Risk & Compliance
IEL Nomination & Remuneration
A B A B A B A B A B
L Gill 12 12 11 11 11 11 1 1 2 2
M Chellew 10 10 9 9 9 9 4 4 3 3
E Stein 10 10 9 9 9 9 4 4 2 2
P Green 12 12 11 11 11 11 5 5 2 3
R Rolfe 12 12 11 11 11 11 - - - -
S Wiggins 12 12 11 11 11 11 - - - -
M Hutchinson 5 5 5 5 5 5 1 1 2 2
F Harris 7 7 6 6 6 6 3 3 3 3
Additional meetings of committees of Directors were held during the year, but these are not included in the above table for example, where the Boards delegated authority to a committee of Directors to oversee or approve specific matters or otherwise approve documentation on behalf of the Boards.
For
per
sona
l use
onl
y

22
Non-Executive Directors
Leonard (Len) Gill
Independent Non-Executive Chairman of IEL, IEBL and IERL
Appointed to IEL, IEBL and IERL on 5 June 2017 and subsequently elected Chairman effective 31 December 2017
Member of the Nomination & Remuneration Committee
Len is a professional non-executive director with a 35-plus year career in the electricity, gas and infrastructure industries. He also provides energy and management consultancy services.
Len is currently Deputy Chair of Family Life, a community support services charity. His previous roles include Chairman of Alinta Energy, Chairman of Metgasco, Non-Executive Director of Ecogen Energy Pty Ltd, Non-Executive Director of Ampetus Energy Pty Ltd, Non-Executive Director of WDS Limited, Non-Executive Director of Verve Energy, Managing Director and CEO of TXU Australia, and Chairman of South East Australian Gas Pty Ltd.
Len holds a Bachelor of Engineering (Civil) from the University of Melbourne and is a Member of the Australian Institute of Company Directors.
Philip Green Non-Executive Director of IEL, IEBL and IERL
Appointed to IEL, IEBL and IERL on 18 November 2010
Member of the Audit, Risk & Compliance Committee
Philip is a Partner of TCI Advisory Services LLP (“TCI”), an advisor to a substantial security holder of Infigen Energy. Philip joined TCI in 2007 and his responsibilities include TCI’s global utility, renewable energy and infrastructure investments.
Prior to joining TCI, Philip led European Utilities equity research at Goldman Sachs, Merrill Lynch and Lehman Brothers over a 12-year period. Philip is a UK Chartered Accountant (ACA) and has a Bachelor of Science (Hons) in Geotechnical Engineering.
Mark Chellew Non-Executive Director of IEL, IEBL and IERL
Appointed to IEL, IEBL and IERL on 21 September 2017
Chairman of the Nomination & Remuneration Committee
Member of the Audit, Risk & Compliance Committee.
Mark has over 30 years of experience in the building materials and related industries, including roles such as Managing Director of Blue Circle Cement in the United Kingdom and senior management positions within the CSR group of companies in Australia and the United Kingdom.
Mark is the former Managing Director and Chief Executive Officer of Adelaide Brighton Limited, a position he held for over 12 years before his retirement from the role in May 2014. Mark has been an Independent Non-Executive Director of Cleanaway Waste Management Limited since March 2013 and became Chairman in September 2016. Mark is also an Independent Non-Executive Director of Virgin Australia Holdings Limited (appointed January 2018) and Caltex Australia Limited (appointed April 2018).
Mark holds a Bachelor of Science (Ceramic Engineering), Masters of Engineering (Mechanical Engineering) and Graduate Diploma in Management.
Emma Stein Non-Executive Director of IEL, IEBL and IERL
Appointed to IEL, IEBL and IERL on 21 September 2017
Chairman of the Audit, Risk & Compliance Committee
Member of the Nomination & Remuneration Committee
Emma has significant corporate and operational experience within energy, fuel and industrial markets, and was previously the UK Managing Director for French utility Gaz de France’s gas and electricity retailing operations. Prior to this, Emma was Managing Director of British Fuels - Gas, the first independent company to gain a domestic retail licence following the deregulation of the UK's energy markets in the 1990’s.
Since moving to Australia in 2003, Emma has been an independent Non-Executive Director on the boards of companies in the oil and gas, resources, energy and energy infrastructure, engineering, waste management and facility management sectors.
Emma currently serves as a Non-Executive Director of Alumina Limited (appointed February 2011) and Cleanaway Waste Management Limited (appointed August 2011). Emma is a former Non-Executive Director of Programmed Maintenance Services Limited, Transfield Services Infrastructure Fund, Clough Limited and the DUET Group.
Emma holds tertiary qualifications in Science and a Masters of Business Administration (MBA). Emma is an Honorary Fellow of the University of Western Sydney and a Fellow of the Australian Institute of Company Directors.
See page 23 for further information on Executive Directors.
For
per
sona
l use
onl
y

INFIGEN ENERGY 2018 ANNUAL REPORT
23
EXECUTIVE DIRECTORS & MANAGEMENT TEAM
Ross Rolfe AO Managing Director of IEL, IEBL and IERL
Appointed as Non-Executive Director to IEL, IEBL and IERL on 9 September 2011 and Executive Director on 17 November 2016
Ross took on the Managing Director / CEO role and initiated the transition of the business from an asset owner to an energy markets participant.
Ross has over 30 years’ experience in the Australian energy and infrastructure sectors in senior management, government and strategic roles, including in business capital restructuring.
Ross is currently Chairman of the North Queensland Airport Group and a Board member of the Northern Australia Infrastructure Facility.
Ross has held the position of Director General of a range of Queensland Government Departments, including Premier and Cabinet, State Development, Co-ordinator General of Environment and Heritage. Ross has also held the positions of Chief Executive Officer of Alinta Energy and Stanwell Corporation. Prior Board roles include Chairman of CS Energy and WDS Limited, and a non-executive director of Evans & Peck, Infigen Energy, Transurban Queensland, CMI Limited, and Thiess Pty Ltd. Ross was an inaugural member of the Board of Infrastructure Australia.
Ross was admitted as an Officer in the Order of Australia in 2008 and received the Centenary of Federation Medal in 2001.
Sylvia Wiggins Executive Director of IEL, IEBL and IERL
Appointed as Non-Executive Director to IEL, IEBL and IERL on 18 April 2016 and Executive Director on 8 May 2017
Sylvia provides leadership in ensuring Infigen creates and preserves security holder value with specific focus on finance, commercial and compliance as Infigen executes its strategy and operates as an active energy market participant. Sylvia’s experience in developing, executing and managing strategic planning, investment, commercial negotiations, and capital management in a number of international investment and advisory firms has been critical in Infigen transitioning its capital structure to better support the business strategy for growing customer numbers and volumes at sustainable profit margins, and enable it to execute the capital “lite” strategy.
Sylvia has over 20 years’ experience as a chief executive officer, executive and senior investment banker across a broad range of businesses, including energy, infrastructure, defence and structured finance areas. Sylvia previously established her own advisory firm and worked at the Alinta Energy and was the inaugural Chief Executive Officer of Global Investments Limited.
Sylvia is an external member of the Department of Defence’s Independent Assurance Review and holds Bachelors of Laws and Jurisprudence from the University of New South Wales.
Paul Simshauser Executive General Manager - Corporate Development Since November 2017
Paul is responsible for the execution of the Multi-Channel Route to Market strategy and devising energy supply options to underpin the business growth.
Paul leads risk management, IT, and people and culture.
Paul has over 25 years’ experience in energy markets, including roles in systems development, environmental markets trading, strategic and business planning, mergers and acquisitions and corporate affairs. Paul’s previous roles include Director-General of the Queensland Department of Energy & Water Supply, and Chief Economist & Group Head of Corporate Affairs at AGL Energy Ltd.
Paul holds Bachelor Degrees in Economics and in Commerce, has a Master’s Degree in Accounting & Finance, and a PhD in Economics. Paul is an FCPA and a Fellow of the Australian Institute of Company Directors.
For
per
sona
l use
onl
y

24
Owen Sela Executive General Manager - Energy Markets
Since May 2017
Owen is in charge of Infigen’s energy markets trading function and developing commercial and industrial customer initiatives.
Owen’s experience in commercial development and contract negotiations underpins developing investment proposals in each region of the NEM and introducing energy firming strategies to supplement Infigen’s portfolio.
Owen has over 18 years’ energy industry experience having held positions at CS Energy as Executive General Manager Strategy and Commercial, and at Alinta Energy as General Manager Contracts.
Owen holds a BA of Computer Science from the Griffith University.
Tony Clark Executive General Manager - Operations & Projects
Since February 2017
Tony oversees the delivery of operational performance through demonstrable strong availability of Infigen’s generation assets that are located across Australia and operated from Infigen’s 24/7 Operations Control Centre in Sydney.
Linked to the business growth of Infigen’s portfolio under Tony’s leadership is also the construction of new assets. Tony’s first project at Infigen was to deliver the Bodangora Wind Farm near Wellington, NSW.
Tony has over 20 years’ experience in the power sector having headed up operations and development roles at ERM Power and Stanwell Corporation, and held responsibility for the detailed design and construction of power projects with ABB Engineering Construction.
Tony holds Master degrees in Commercial Law from the Melbourne University, Business Administration from the Deakin University, and Engineering from the Queensland University of Technology.
For
per
sona
l use
onl
y
INFIGEN ENERGY 2018 ANNUAL REPORT
25
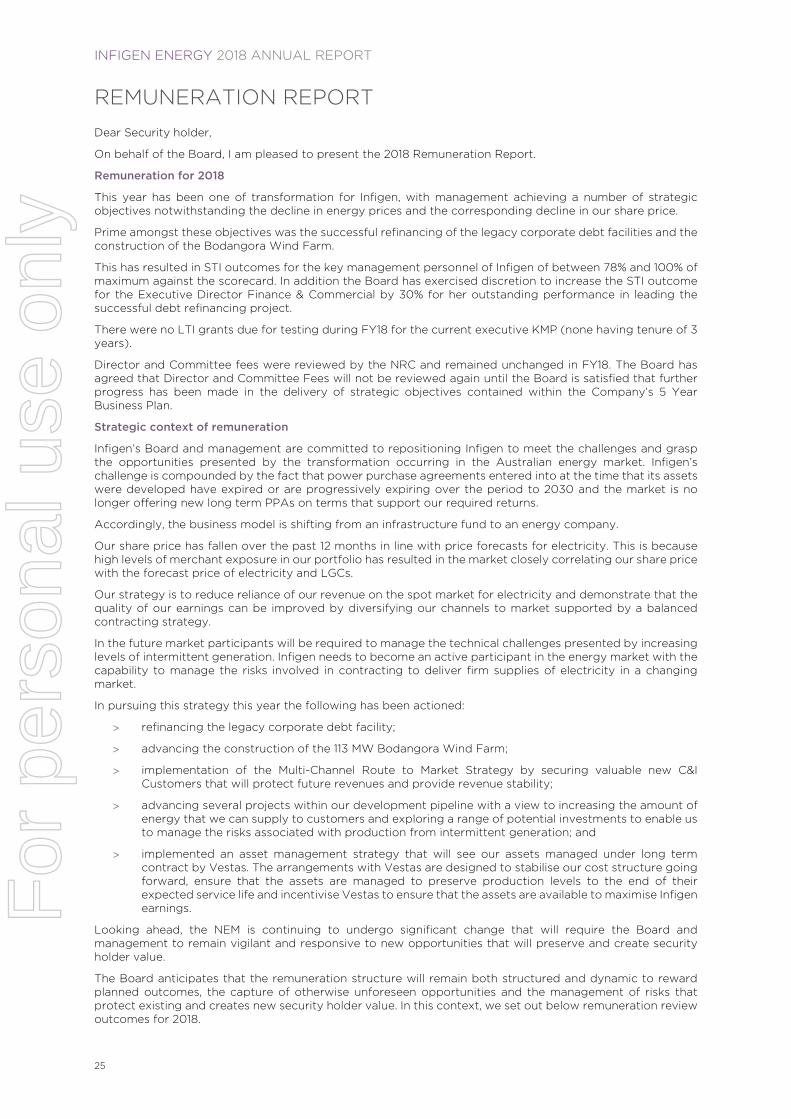
REMUNERATION REPORT Dear Security holder,
On behalf of the Board, I am pleased to present the 2018 Remuneration Report.
Remuneration for 2018
This year has been one of transformation for Infigen, with management achieving a number of strategic objectives notwithstanding the decline in energy prices and the corresponding decline in our share price.
Prime amongst these objectives was the successful refinancing of the legacy corporate debt facilities and the construction of the Bodangora Wind Farm.
This has resulted in STI outcomes for the key management personnel of Infigen of between 78% and 100% of maximum against the scorecard. In addition the Board has exercised discretion to increase the STI outcome for the Executive Director Finance & Commercial by 30% for her outstanding performance in leading the successful debt refinancing project.
There were no LTI grants due for testing during FY18 for the current executive KMP (none having tenure of 3 years).
Director and Committee fees were reviewed by the NRC and remained unchanged in FY18. The Board has agreed that Director and Committee Fees will not be reviewed again until the Board is satisfied that further progress has been made in the delivery of strategic objectives contained within the Company’s 5 Year Business Plan.
Strategic context of remuneration
Infigen’s Board and management are committed to repositioning Infigen to meet the challenges and grasp the opportunities presented by the transformation occurring in the Australian energy market. Infigen’s challenge is compounded by the fact that power purchase agreements entered into at the time that its assets were developed have expired or are progressively expiring over the period to 2030 and the market is no longer offering new long term PPAs on terms that support our required returns.
Accordingly, the business model is shifting from an infrastructure fund to an energy company.
Our share price has fallen over the past 12 months in line with price forecasts for electricity. This is because high levels of merchant exposure in our portfolio has resulted in the market closely correlating our share price with the forecast price of electricity and LGCs.
Our strategy is to reduce reliance of our revenue on the spot market for electricity and demonstrate that the quality of our earnings can be improved by diversifying our channels to market supported by a balanced contracting strategy.
In the future market participants will be required to manage the technical challenges presented by increasing levels of intermittent generation. Infigen needs to become an active participant in the energy market with the capability to manage the risks involved in contracting to deliver firm supplies of electricity in a changing market.
In pursuing this strategy this year the following has been actioned:
refinancing the legacy corporate debt facility;
advancing the construction of the 113 MW Bodangora Wind Farm;
implementation of the Multi-Channel Route to Market Strategy by securing valuable new C&I Customers that will protect future revenues and provide revenue stability;
advancing several projects within our development pipeline with a view to increasing the amount of energy that we can supply to customers and exploring a range of potential investments to enable us to manage the risks associated with production from intermittent generation; and
implemented an asset management strategy that will see our assets managed under long term contract by Vestas. The arrangements with Vestas are designed to stabilise our cost structure going forward, ensure that the assets are managed to preserve production levels to the end of their expected service life and incentivise Vestas to ensure that the assets are available to maximise Infigen earnings.
Looking ahead, the NEM is continuing to undergo significant change that will require the Board and management to remain vigilant and responsive to new opportunities that will preserve and create security holder value.
The Board anticipates that the remuneration structure will remain both structured and dynamic to reward planned outcomes, the capture of otherwise unforeseen opportunities and the management of risks that protect existing and creates new security holder value. In this context, we set out below remuneration review outcomes for 2018.
For
per
sona
l use
onl
y

26
Remuneration changes
It is within this strategic context that Infigen’s remuneration structure was reviewed by the Board during the year, with consideration given to:
whether the remuneration arrangements appropriately incentivise and reward management to deliver the Board endorsed strategy; and
the relative competitiveness of the remuneration arrangements with industry peers.
The review resulted in three key changes:
the previous deferral of 50% of the STI was not competitive in our object of attracting and retaining talent. While deferral of part of the STI is an important part of our structure, the Board has agreed to reduce this to 20% of the STI awarded to be delivered in cash in FY18;
the Board decided to rebalance the remuneration mix to increase the potential short term incentive available for achieving transformational near term goals and reduce the mix of long term incentive. For FY19 and beyond, the split between STI and LTI will be 65:35 (50:50 previously). The Board believes this split between STI and LTI better reflects the relative importance of achieving transformational short-term goals (that will generate long term benefits) that are the foundations of an enduring and sustainable business model that positions the company to protect existing and create new value for our security holders. The total quantum of at-risk remuneration is unchanged; and
The Operational Performance condition of the FY19 LTI has been updated to assess progress in implementing the Company’s 5 Year Business Plan to preserve and create security holder value while managing risk. Further detail in relation to the Operational Performance condition for FY19 will be provided in the Notice of Meeting ahead of Infigen’s AGM.
The Board believes that these changes will result in Infigen’s remuneration framework remaining market competitive and will continue to appropriately motivate and reward executives to deliver Infigen’s business strategy.
Yours faithfully
Mark Chellew Chairman
Nomination & Remuneration Committee
For
per
sona
l use
onl
y

INFIGEN ENERGY 2018 ANNUAL REPORT
27
KMP SUMMARY REPORT FOR FINANCIAL PERIOD ENDING 30 JUNE 2018
Executives
Position
R Rolfe Managing Director / CEO
S Wiggins Executive Director -Finance & Commercial
P Simshauser EGM Corporate Development
O Sela EGM Energy Markets
T Clark EGM Operations & Projects
Diversity Workforce Composition
Male Female
30 June 2018 58% 42%
30 June 2011 69% 31%
The Board adopted the Infigen Energy Diversity and Inclusion Policy in June 2011. Infigen sets and monitors progress against annual diversity objectives, which include gender diversity targets. More detailed information relating to diversity and inclusion objectives and achievements can be found in the Governance section of the Annual Report on page 81 and the online ESG Report.
KMP Remuneration Mix in FY18
Remuneration received by Executive KMP during FY18 This table includes the full year actual remuneration received by each KMP, other than P. Simshauser who commenced employment on 27 November 2017. Comparison to FY17 total remuneration is distorted by the pro-rata payments received by KMP in that year.
FY18 FY171
KMP
Fixed remun-eration
Maximum STI
opportu-nity
FY18 Awarded STI Vested LTI Total Perfor-mance related
Total Perfor-mance related Cash Deferred
($) ($) ($) ($) ($) ($) % ($) %
R Rolfe2 836,500 464,000 345,216 86,304 - 1,268,020 34% 890,768 29%
S Wiggins2 700,000 350,000 364,000 91,000 - 1,155,000 39% 159,571 33%
P Simshauser3 289,719 118,000 73,632 18,408 - 381,759 24% - 0%
O Sela2 418,000 139,500 97,092 24,273 - 539,365 23% 270,823 20%
T Clark2 392,000 111,500 80,280 20,070 - 492,350 20% 176,207 24%
2,636,219 1,183,000 960,220 240,055 - 3,836,494 1,497,369
1 Total payments are Pro-rated for part year employment as these KMP commenced employment in FY17. 2 FY17 Deferred STI will vest when the first trading window opens following the release of the FY18 financial results. 3 Commenced employment on 27 November 2017.
Remuneration Framework
The remuneration framework is designed to strike the right balance between performance and rewards for preserving, creating and delivering long term security holder value. The key features are:
Fixed Remuneration
Short Term Incentive paid in cash with 20% deferred for 12 months
Long Term Incentive with market based and operational performance conditions
Clawback mechanisms embedded within the deferred STI and LTI grants
Tailored incentives designed to attract and retain talent such as project incentives and diminishing deferred payments.
For
per
sona
l use
onl
y

28
Relationship between performance and incentive payments FY18 KPIs FY18 STI Assessment
Financial Performance (50%) EBITDA $149.1 million was substantially over budget
Strategic Objectives (50%) KPIs related to the implementation of the 5 Year Business Plan to establish a platform for the continued value accretive transition of the business.
Objectives included: Create a capital structure
to support Infigen’s business strategy;
Implement the Multi-Channel Route to Market Strategy;
Expanding the sourcing of energy supply within the portfolio;
Construction of the Bodangora Wind Farm;
Other strategic projects.
Infigen has: Diversified its sales channels to enhance the predictability and stability of revenues in a risk managed
manner, which is a crucial element of the business strategy. Refinanced its corporate debt to create a capital structure that allows the business to operate as a
single portfolio of assets which thereby supports the following priorities: Achieve appropriate value from the existing portfolio; Support growth in response to demand based price signals; and Enable the Boards’ to consider the reintroduction of sustainable distributions to security holders
Achieved our preferred diversification for sale of production across key sales channels; Progressed the firming of production through physical, financial and contractual solutions; Continued construction of Bodangora Wind Farm on budget and on track for commercial operation in
2018; Achieved an orderly transition of Operations and Maintenance from Suzlon to Vestas (Capital and
Woodlawn Wind Farms) effective 31 December 2017; and Progressed investment cases from Infigen’s development pipeline projects.
A fatality will automatically trigger Board consideration to rerate the STI Pool. The Board may also take into consideration Moderating Factors not foreseen or adequately addressed in setting the FY18 KPIs to rerate the STI.
FY18 LTI Terms and Conditions
Performance Period Performance Conditions Vesting Scale
1 July 2017 to 30 June 2020
50%
IFN TSR performance compared to ASX 200 peer group excluding financial services, real estate and the materials & resources sectors
50th to 75th Percentile of peer group
50% Operational Performance Condition measures progress in implementing the 5 Year Business Plan and business strategy
The primary assessment is based on a Matrix that rewards achievement in delivering Revenue Diversity and Growth targets. The Board has discretion to adjust the vesting outcome (both upwards and downwards).
Diminishing Deferred Payment Both R Rolfe and S Wiggins are entitled to a one off diminishing deferred payment, payable on 18 November 2019 subject to the conditions summarised below. This arrangement was structured so as to provide two highly experienced executives with confidence to forgo their significant existing Executive, Board and advisory roles to deliver the Board strategy irrespective of whether a change in control event occurred in the short term and before the value to be created through the company strategy could be realised. This formula diminishes to zero by 18 November 2019. As at the reporting date the residual value is approximately half its starting value.
Commencement date
Payment date
Commencement Value ($ million)
Annual cap ($ million)
Residual Value at 30 June 2018 ($ million)
Ross Rolfe 17 Nov 16 18 Nov 19 $3.0 $1.0 $1.5 Sylvia Wiggins 8 May 17 18 Nov 19 $2.0 $0.81 $1.1
Terms Payable on the Payment Date regardless of whether the executive
remains employed by Infigen, except if the employment is terminated for cause, or where the employment is terminated for any reason and Infigen subsequently discovers the employment could have been terminated for cause or the executive resigns (but not including where they resign due to a material adverse change) in all cases before the Payment Date.
The Deferred Payment is reduced by the fixed remuneration, STI payments or awards, vested LTI payments, payment in lieu of notice or severance/redundancy payments received by the executive prior to the Payment Date (subject to the Annual Cap).
The Annual Cap is the maximum amount by which the Deferred Payment may be reduced for each year (or part thereof) between the Commencement Date and Payment Date.
The Board retains discretion to reduce the Deferred Payment in certain circumstances related to the executive’s conduct.
Assuming the executive’s employment continues until 17 November 2019 and they have received aggregate payments and awards of equivalent value to the Deferred Payment subject to the Annual Cap, then the executive would not receive any Deferred Payment on the Payment Date.
1 Pro-rated for any part thereof.
For
per
sona
l use
onl
y

INFIGEN ENERGY 2018 ANNUAL REPORT
29
STATUTORY REMUNERATION REPORT
1. Remuneration of KMP
The remuneration framework for KMP comprises three components:
fixed pay;
STI, which is a variable payment linked to achieving specified performance measures over a 12-month period; and
LTI, which is a payment linked to meeting specified performance hurdles over a 3-year period.
Remuneration is benchmarked against industry peers within utilities, electricity generation and infrastructure, having regard to the advice of external advisers.
1.1. Fixed Pay
Fixed pay comprises a cash salary and superannuation. Infigen does not offer remuneration packaging other than superannuation salary sacrifice.
1.2. Short Term Incentives
STI is an at-risk performance-related component of remuneration. STIs are subject to performance against key performance indicators (KPIs) aligned with strategy and annual budgets. KPIs are set annually and reviewed during the year and where appropriate changed to maintain alignment with the business strategy.
The Nomination & Remuneration Committee (NRC) determines the KPIs for the KMP and reviews the KPI achievement. The NRC determines the CEO’s STI payment, reviews and approves payments made to KMP and the aggregate amount of STI payments.
The FY18 KPIs were structured to ensure all employees continue to respond to a changing energy market to preserve and create security holder value. The 5 Year Business Plan underpins the implementation of the business strategy, which forms the basis of the FY18 KPIs. The 5 Year Business Plan has three primary work streams:
1. diversifying our customer base to improve revenue certainty and stability while maximising earnings from existing assets;
2. expanding the sourcing of energy supply within the Infigen portfolio in response to market signals and enhancing Infigen’s capacity to deliver firm products to its customers; and
3. creating a capital structure to support Infigen’s business strategy.
The FY18 KPI achievements have been set out in the Executive KMP summary report tables on page 28.
The FY18 KPIs included a gateway hurdle and moderating factors as preconditions used to determine events which automatically trigger Board consideration to rerate downwards the STI pool for the whole organisation, a team or individual.
In FY18 the gateway hurdle was classified as a fatality, which would automatically trigger Board consideration to rerate the STI Pool. The Board determined that this was particularly important as Infigen commenced the high-risk activity of constructing the Bodangora Wind Farm.
Moderating factors address matters not foreseen or adequately addressed in setting the FY18 KPIs. Moderating factors may be used to determine team or individual STI outcomes irrespective of the overall achievement against the FY18 KPIs. Examples of moderating factors were: any serious safety incidents, serious regulatory or contract breaches, and actions that result in reputational damage to Infigen.
The Board determined that neither the ‘gateway hurdle’ or any ‘moderating factors’ occurred during the year. Consequently, no adjustment to the STI opportunity was applied.
When settling the STI payments for the KMP in FY18, the Board set the STI pool for KMP at $1,183,000. The aggregate amount of actual STI payments awarded to KMP was $1,200,275 (101%). Individual STI payments awarded to KMP were between 78% and 130% of the maximum STI opportunity. In determining individual STI payments, the NRC had regard to the specific KPIs established at the beginning of the year, achievement against those targets, and the achievements of management in responding to emerging threats and opportunities in the delivery of the revised business strategy.
The Board has discretion under the Infigen Short Term Incentive Plan to apply a performance factor adjustment (positive or negative) of up to 30% of the STI Payment achievement subject to the employee’s performance, which takes into consideration amongst other things the manner and substance in which the KPIs were achieved and the employee’s performance throughout the year.
1.2.1. Short Term Incentive Deferral
During the year the NRC undertook an external market review of at-risk remuneration including STI Deferral. The Board determined that while STI deferral is important, Infigen’s previous policy of 50% deferral in equity was not reflective of broader market practice by comparably sized companies and served to diminish the value of the remuneration offered. It was therefore considered appropriate to reduce the quantum deferred for 12 months to 20% of the KMP FY18 STI.
For
per
sona
l use
onl
y

30
The deferred STI will be paid in cash at the end of the deferral period provided the employee has not resigned or had their employment terminated for cause prior to the payment date. The deferred payment may be reduced or forfeited if the STI payment was associated with a materially adverse financial misstatement, or if the achievement of a personal KPI proves in hindsight to have been materially overstated.
The deferral condition will continue to include a clawback mechanism that complements the LTI clawback provision. These provisions enable forfeiture of some or all deferred STI and/or unvested LTI performance rights if a previously vested LTI grant was associated with a materially adverse financial misstatement.
The Board believes that this change will result in Infigen’s remuneration framework remaining market competitive and will continue to appropriately motivate and reward executives to deliver Infigen’s business strategy.
In FY17 deferred STIs to the value of $298,051 were awarded in the form of 398,362 performance rights at a security price of $0.7482. Infigen intends to issue 398,362 securities following the release of the FY18 financial results to satisfy vesting obligations in relation to these deferred STI amounts. It is not presently intended to clawback any STI deferred securities. Recipients of such securities will incur a taxation liability and therefore may sell some securities to fund the tax liability. Any sales are subject to Infigen's Securities Trading Policy and applicable law, including insider trading laws.
1.3. Long Term Incentives
LTIs are awarded as future rights to acquire IFN securities. Each vested performance right will entitle the participant to receive one security, or a cash amount equivalent to the market price of a security, on the vesting date. Settlement in cash or securities is determined by the Board in its absolute discretion.
The number of rights granted is based on the LTI amount divided by the reference price for Infigen securities, being the volume-weighted average ASX market price in the last five trading days of the prior financial year. For rights granted in FY18 the reference price was $0.7482.
LTI grants comprise two equal tranches, each subject to a different performance condition. Vesting of each tranche is contingent on achieving the relevant performance hurdle.
Performance Conditions FY16 & FY17 FY18
Tranche 1 Relative TSR Relative TSR
Tranche 2 EBITDA / Capital
Progress in implementing the revised business
strategy
1.3.1. FY16 & FY17 LTI Grant
The Tranche 1 performance condition is relative Total Shareholder Return (TSR). The Tranche 2 operational performance condition is a test of the cumulative growth in the ratio of earnings before interest, taxes, depreciation and amortisation (EBITDA) to capital base.
The 3-year performance period of the FY16 Grant is from 1 July 2015 to 30 June 2018. In the event that no performance rights vest after the initial 3-year performance period, then the FY16 LTI grant will be subject to a single re-test on 30 June 2019, after which all unvested rights will lapse.
The 3-year performance period of the FY17 Grant is from 1 July 2016 to 30 June 2019. In the event that no performance rights vest after the initial 3-year performance period, then the FY17 LTI grant will be subject to a single re-test on 30 June 2020, after which all unvested rights will lapse.
1.3.2. FY18 LTI Grant
The Tranche 1 performance condition is TSR.
As outlined in the 2017 Notice of AGM, the Tranche 2 operational performance condition was changed to measure progress in implementing the revised business strategy to increase sustainable value through de-risking revenue and achieving prudent growth.
The 3-year performance period of the FY18 Grant is from 1 July 2017 to 30 June 2020, after which all unvested rights will lapse.
1.3.3. TSR Performance Condition
TSR measures the change in value of a security plus cash distributions notionally reinvested in that security. For any portion of the FY16 and FY18 Tranche 1 performance rights to vest, the TSR of IFN securities must outperform that of the median company in the S&P/ASX 200 index (excluding financial services, real estate and the materials and resources sector).
The NRC last reviewed the peer group in June 2017. The analysis included peer group performance compared to a range of Indices since June 2011 and demonstrated that the current peer group had historical returns that were higher than all but the ASX Utilities Sector. The NRC concluded that there were too few relevant utilities sector companies to form a viable industry peer group for TSR benchmarking.
Following the rerating of the IFN security price in FY16, the Board amended the vesting scale of the TSR performance condition for the FY17 Tranche 1 performance rights so that vesting would occur progressively from 25% to 75% of the relevant peer group performance. It was the Board’s intention that the FY17 vesting scale would apply to the FY17 grant only.
For
per
sona
l use
onl
y

INFIGEN ENERGY 2018 ANNUAL REPORT
31
Table 1: Tranche 1 TSR Performance Rights Vest Progressively as Follows Percentile ranking
Below the
25th percentile Equal to the 25th
percentile
Between the 25th and 50th percentile
Equal to the 50th percentile
Between the 50th and 75th percentile
Between the 76th and 95th percentile
Above the 95th percentile
Perc
enta
ge o
f Aw
ards
ves
ting
FY16 0% vesting 0% vesting 0% vesting 25% vesting
An additional 2%
of the award vests for each
percentile increase
An additional 1.25% of the
award vests for each percentile
increase
100% vesting
FY17 0% vesting 25% vesting
An additional 1% of awards vest for each
percentile increase
50% vesting
An additional 2%
of the award vests for each
percentile increase
100% vesting
FY18 0% vesting 0% vesting 0% vesting 50% vesting
An additional 2%
of the award vests for each
percentile increase
100% vesting
1.3.4. Operational Performance Condition
FY16 & FY17 LTI Grant
The annual target used in respect of all LTI grants up to and including FY17 is a specified ratio of EBITDA to capital base over the year. The capital base is measured as equity (net assets) plus net debt. Both the EBITDA and capital base are measured on a proportionately consolidated basis to reflect Infigen’s economic interest in all investments.
The annual target for each financial year is established by the Board no later than the time of the release of Infigen’s annual financial results for the preceding financial year. The targets are set with reference to Infigen’s annual budgets. They are confidential to Infigen. However, each year's target and the performance against that target are disclosed retrospectively.
The FY17 LTI is the only outstanding LTI grant using the EBITDA / Capital Base measure. The initial three-year performance measurement period of the FY17 LTI grant will end 30 June 2019. As previously disclosed the EBITDA/Capital Base measure has proven to be unduly sensitive to wind conditions and to external market trends in energy and Large-scale Generation Certificate prices.
The Board decided in FY18 to replace the operational performance condition to measure progress in implementing the revised business strategy to increase sustainable value through de-risking revenue and achieving prudent growth.
Relevant metrics for the last four financial years and current period are provided in the table below.
Table 2: Five Year Financial Performance
Unit 30 June 2014 30 June 2015 30 June 2016 30 June 2017 30 June 2018
Closing security price $ 0.24 0.32 1.00 0.73 0.66
EBITDA $ ‘000 176,682 186,583 120,196 143,4121 149,102
Capital Base $ ‘000 1,733,099 1,639,635 1,021,051 1,019,834 1,153,062
EBITDA to capital base % 10.19 11.38 11.77 14.06 12.9
Target % 10.03 10.83 10.00 12.49 11.46
1 Underlying EBITDA adjusted for inclusion of profit on sale of the Manildra solar farm development project.
For
per
sona
l use
onl
y

32
Table 3: Tranche 2 EBITDA Performance Rights in FY16 and FY17 Vest Progressively as Follows
Infigen’s EBITDA performance FY16 & FY17 Grant
Percentage of Tranche 2 Performance Rights that vest
0% - 90% Nil
90% ≤ 110% of the cumulative target For every 1% increase between 90% and 110% of EBITDA target, 5% of the Tranche 2 performance rights will vest
FY18 LTI Grant
The primary assessment will be based on a matrix that rewards achievements in delivering specific targets set out in the 5 Year Business Plan. The targets are Revenue Diversity, as measured by the proportion of energy sales delivered through direct commercial and industrial customer channels, and Growth, as measured by Energy Sold volume (GWh). The matrix is aligned with and directly reflects Infigen’s business strategy to deliver a range of products and solutions to different customers: balance risk; price and tenor; secure longer-term revenue stability; and growth.
The Board has discretion to adjust the vesting outcomes (both upwards and downwards) including in the following circumstances:
a) outperformance in value creation which is not reasonably captured by the operational performance condition;
b) misstatements or misrepresentations that warrant a downward adjustment;
c) in the event of a significant corporate transaction which the Board considers has affected the achievability of the performance conditions;
d) where strict applicability of the matrix parameters would lead to an outcome that does not satisfactorily reflect the sustainable economic value created for Infigen or its security holders over the performance period including where this results in a vesting outcome that was not fair or reasonable (to either the LTI participants or Infigen) in all the circumstances; or
e) where the vesting outcome is considered inappropriate because absolute TSR is negative.
The NRC will regularly review performance against the revised business strategy, strategic objectives approved by the Board and when other events occur (whether in management control or not) that might have an effect on the delivery of the
business strategy and security holder value creation. The NRC will maintain a scorecard that will be used to inform discussion and the exercise of discretion when determining the vesting outcome at the end of the performance measurement period.
1.3.5. FY16 Long Term Incentive Performance
The initial 3-year performance period for the FY16 LTI grant ended on 30 June 2018. Infigen’s TSR performance for the 3-year measurement period was 146.9%, placing Infigen at 94.845% of the comparator group. This will result in 99.8% of the Tranche 1 performance rights vesting. The Tranche 2 operational performance condition of the FY16 LTI grant also passed the performance test as at 30 June 2018 resulting in 100% of the Tranche 2 performance rights vesting. Vesting of both tranches will occur when the first IFN employee trading window opens after 1 July 2018. A total of 2,103,333 securities in relation to the FY16 LTI are expected to be issued by Infigen prior to the trading window opening following the release of the FY18 financial results. None of the current KMP participate in the FY16 LTI grant.
1.4. Infigen Energy Equity Plan Rules
Performance rights and options are governed by the rules of the Infigen Energy Equity Plan approved by security holders in 2009 and 2011. The Infigen Energy Equity Plan includes provisions under which the Board may exercise discretion to accelerate the vesting of any performance rights or options in the event of a change in control of Infigen. In exercising its discretion, the Board would intend to have regard to the performance, duration of the performance period and the nature of the relevant transaction.
1.5. Separation Benefits
The Board intends to continue to limit any future separation benefits to a maximum of 12 months’ fixed remuneration.
For
per
sona
l use
onl
y

INFIGEN ENERGY 2018 ANNUAL REPORT
33
2. Infigen Energy - Executive KMP Statutory Remuneration Details
2.1. Statutory Remuneration Data for the Year Ended 30 June 2018
The Statutory Remuneration Data table below shows the accounting expense amounts that reflect a portion of possible future remuneration arising from prior and current year LTI grants. The year on year comparison is distorted by the management restructure that occurred in FY17, resulting in pro-rata payments received by incoming and former KMP.
Table 4: Statutory Remuneration Data for Executive KMP
Executive Year
Short-term employee benefits
Post employ-
ment benefits
Other long-term employee benefits
Share-based
payments
Salary
STI payable in
current period
Other pay-ments
Termination payments
Total of short-term employee benefits
Super-annuation LSL accrual
Equity settled1
Total
($) ($) ($) ($) ($) ($) ($) ($) ($)
R Rolfe FY18 816,451 345,216 - - 1,161,667 20,049 2,600 222,391 1,406,707
FY172 497,691 127,500 125,000 - 750,191 13,077 1,216 - 764,484
S Wiggins FY18 679,951 364,000 - - 1,043,951 20,049 2,143 51,030 1,117,173
FY172 103,802 50,000 - - 153,802 3,269 1,034 - 158,105
P Simshauser3 FY18 275,381 73,632 - - 349,013 14,338 716 15,684 379,751
FY17 - - - - - - - - -
O Sela FY18 397,951 97,092 - - 495,043 20,049 1,255 46,511 562,858
FY172 180,678 50,000 25,000 - 255,678 9,808 603 5,568 271,657
T Clark FY18 371,951 80,280 - - 452,231 20,049 1,196 15,725 489,201
FY172 124,717 43,050 - - 167,767 8,440 541 - 176,748
M George FY18 - - - - - - - - -
FY17 314,442 266,750 62,500 845,760 1,489,452 9,808 - 1,004,735 2,503,995
C Baveystock FY18 - - - - - - - - -
FY17 349,884 52,650 - - 402,534 19,616 12,161 179,069 613,380
B Hopwood FY18 - - - - - - - - -
FY17 305,027 - - 509,331 814,358 19,616 - (128,901) 705,073
S Wright FY18 - - - - - - - - -
FY17 349,884 70,650 - - 420,534 19,616 11,350 108,921 560,421
Total remuneration
FY18 2,541,685 960,220 - - 3,501,905 94,534 7,910 351,341 3,955,690
FY17 2,226,125 660,600 212,500 1,355,091 4,454,316 103,250 26,905 1,169,392 5,753,863
1 Includes deferred STI granted in the period. 2 Messrs Rolfe, Sela and Clark and Ms Wiggins were employed for part of FY17. 3 Commenced employment on 27 November 2017.
For
per
sona
l use
onl
y

34
2.2. Value of Remuneration that May Vest in Future Years
Remuneration amounts provided in the table below refer to the maximum value of performance rights relating to IFN securities. These amounts have been determined at grant date by using a pricing model and amortised in accordance with AASB 2 ‘Share Based Payments’. The minimum value of remuneration that may vest is nil.
Table 5: Remuneration that May Vest in Future Years
Executive Grant
Maximum value of remuneration which is subject to vesting in accordance with AASB 2 'Share Based Payments'
FY17 FY18 FY19 FY20
($) ($) ($) ($)
R Rolfe FY17 - 71,848 119,747 - FY18 - 65,439 109,065 109,363 FY181 - 85,104 29,922 - Total - 222,391 258,734 109,363
S Wiggins FY18 - 49,361 82,269 82,494 FY181 - 1,669 587 - Total - 51,030 82,856 82,494
P Simshauser FY18 - 15,684 28,481 28,560 Total - 15,684 28,481 28,560
O Sela FY17 6,313 23,274 23,274 - FY18 - 19,674 32,790 32,880 FY181 - 3,563 1,252 - Total 6,313 46,511 57,316 32,880
T Clark FY18 - 15,725 26,208 26,281 Total - 15,725 26,208 26,281
2.3. Unvested Performance Rights
The table below provides details of outstanding performance rights relating to IFN securities that have been granted to Executive KMP (FY17 and FY18 grants). The performance rights are valued as at the grant date even though the grant was based on the volume weighted average price of the five trading days up to 30 June in the year prior to the grant.
Table 6: Unvested Performance Rights
Executive Grant Granted number
Grant date
Value per performance right at grant
date2
Value of performance
rights granted at grant date
Potential Vesting Dates
($) ($) LTI Tranche 1 LTI Tranche 2 Deferred STI
R Rolfe FY17 369,230 23 Nov 17 0.5189 191,596 30 Jun 19 30 Jun 19 -
FY18 620,156 23 Nov 17 0.4577 283,867 30 Jun 20 30 Jun 20 -
FY181 170,409 23 Nov 17 0.6750 115,026 - - 15 Sep 18
S Wiggins FY18 467,790 23 Nov 17 0.4577 214,124 30 Jun 20 30 Jun 20 -
FY181 3,342 23 Nov 17 0.6750 2,256 - - 15 Sep 18
P Simshauser FY18 157,712 11 Dec 17 0.4611 72,725 30 Jun 20 30 Jun 20 -
O Sela FY17 68,082 23 Mar 17 0.7764 52,861 30 Jun 19 30 Jun 19 -
FY18 186,448 23 Nov 17 0.4577 85,344 30 Jun 20 30 Jun 20 -
FY181 7,134 23 Nov 17 0.6750 4,815 - - 15 Sep 18
T Clark FY18 149,025 23 Nov 17 0.4577 68,214 30 Jun 20 30 Jun 20 -
1 FY17 deferred STI. 2 Rounded down to 4 decimal places. Small variations in the ‘Value of Performance Rights granted at grant date’ will occur.
For
per
sona
l use
onl
y

INFIGEN ENERGY 2018 ANNUAL REPORT
35
Table 7: Change in Number of Performance Rights Held by Executive KMP throughout the Year.
Set out below is the change in the number of performance rights held by KMP over the period 1 July 2017 to 30 June 2018.
Balance at 30 June 2017 Granted Vested Balance at 30 June 2018
R Rolfe - 1,159,795 - 1,159,795
S Wiggins - 471,132 - 471,132
P Simshauser - 157,712 - 157,712
O Sela 68,082 193,582 - 261,664
T Clark - 149,025 - 149,025
3. Executive KMP Employment Contracts
The base salaries (excluding superannuation guarantee payments) for Executive KMP as at 30 June 2018 are as follows:
As at 30 June 2018
R Rolfe $816,451
S Wiggins $679,951
P Simshauser $459,951
O Sela $397,951
T Clark $371,951
Employment contracts relating to Executive KMP contain the following conditions:
Duration of contract Open-ended
Notice period for either party to terminate the contract
R Rolfe 12 months’ written notice by Infigen or 6 months’ by R Rolfe
S Wiggins 12 months’ written notice by Infigen or 6 months’ by S Wiggins
P Simshauser 6 months’ written notice by either party
O Sela 6 months’ written notice by either party
T Clark 3 months’ written notice by either party
Termination payments provided under the contract
Upon termination, any accrued but untaken annual and long-service (but not sickness or personal) leave entitlements, in accordance with applicable legislation, are payable. In the event of redundancy, a severance payment is payable under the Infigen Group Redundancy Policy equivalent to 4 weeks base salary for each year of service (or part thereof), up to a maximum of 36 weeks.
Termination for Material Adverse Change
Both R Rolfe and S Wiggins may terminate their employment immediately where a material adverse change to the powers, duties, responsibilities, authority and/or status of the executive’s role has occurred without the executive’s consent, provided the executive has notified Infigen in writing of such change within one month (with their reasons for such change), and Infigen has failed to remedy this within one month of receiving notice from the executive of such change.
In the event that Infigen does not remedy the material adverse change, the executive will be entitled to a severance payment of 12 months’ Fixed Remuneration or the maximum amount permitted by Part 2D.2.2 of the Corporations Act 2001 (Cth) if this is a lower amount.
The executive will not be a “Bad Leaver” under the Infigen Energy Equity Plan and is not entitled to notice of termination or severance payments under the Infigen Energy Group Redundancy policy.
Termination benefits are subject to the condition that they will not exceed the amount permitted by Part 2D.2.2 of the Corporations Act 2001 (Cth) without security holder approval.
For
per
sona
l use
onl
y

36
Diminishing Deferred Payment
Both R Rolfe and S Wiggins are entitled to a one off diminishing deferred payment, payable on 18 November 2019.
The maximum value of the diminishing deferred payment as at the executive’s commencement date was:
- R Rolfe $3,000,000
- S Wiggins $2,000,000
Payable on the Payment Date regardless of whether the executive remains employed by Infigen or not, except if the employment is terminated for cause or where the employment is terminated for any reason and Infigen subsequently discovers that the employment could have been terminated for cause or the executive resigns (but not including where they resign due to a material adverse change) in all cases before the Payment Date.
No deferred payment will be made at the Payment Date if the executive has received aggregate remuneration (including awards) equal to the value of the diminishing deferred payment from their employment with Infigen (subject to the Annual Cap) prior to the Payment Date.
The Annual Cap is the maximum amount by which the Deferred Payment may be reduced for each year (or part thereof) between the Commencement Date and Payment Date. The Annual Cap is:
- R Rolfe $1,000,000 pa
- S Wiggins $800,000 pa (Pro-rated in the final year)
The Board also has discretion to reduce the amount of the deferred payment for material underperformance or other conduct of the executive which would make it unreasonable for the executive to receive the deferred payment.
4. Remuneration of Non-Executive Directors
Non-Executive Director Fees are determined by the Boards within the aggregate amount approved by security holders. The approved aggregate fee pool for IEL and IEBL is $1,000,000.
The fee paid to Directors varies with individual Board and committee responsibilities. Director fees were not adjusted during the year and no change is proposed for FY19.
Non-Executive Directors receive a cash fee for service inclusive of statutory superannuation. Non-Executive Directors do not receive any performance-based remuneration or retirement benefits other than statutory superannuation contributions.
4.1. Board/Committee Fees
Aggregate annual fees payable to Non-Executive Directors during the year ended 30 June 2018 are set out below.
Board / Committee Role Annual Fee
Infigen Boards Chairman1 $250,000
Non-Executive Director $125,000
Infigen Audit, Risk & Compliance Committees Chairman $24,000 Member $12,000
IEL Nomination & Remuneration Committee Chairman $20,000
Member $10,000
1 No Committee fees are paid to the Chairman of Infigen Boards.
For
per
sona
l use
onl
y

INFIGEN ENERGY 2018 ANNUAL REPORT
37
4.2. Remuneration of Non-Executive Directors for the Year Ended 30 June 2018
The nature and amount of each element of fee payments to each Non-Executive Director of Infigen for the years ended 30 June 2017 and 30 June 2018 are set out in the table below.
Non-Executive Directors Year
Fees Super-
annuation Related party
payment Total
IERL IEL & IEBL
($) ($) ($) ($) ($)
L Gill1 FY18 87,067 87,067 15,644 - 189,778
FY17 4,391 4,391 834 - 9,616
M Chellew2 FY18 47,691 57,691 10,011 - 115,393
FY17 - - - - -
E Stein3 FY18 51,784 54,553 10,102 - 116,439
FY17 - - - - -
P Green4 FY18 - - - - -
FY17 - - - - -
R Rolfe5 FY18 - - - - -
FY17 23,039 33,902 5,410 - 62,351
S Wiggins5 FY18 - - - - -
FY17 67,074 93,727 14,306 450,000 625,107
M Hutchinson6 FY18 57,488 57,488 10,024 - 125,000
FY17 103,581 126,803 19,616 - 250,000
F Harris7 FY18 45,068 51,735 8,047 - 104,850
FY17 68,388 95,362 15,250 - 179,000
Total Remuneration FY18 289,098 308,534 53,828 - 651,460
FY17 266,473 354,185 55,416 450,000 1,126,074
1 L Gill was appointed as a Chairman of IEL, IEBL and IERL on 1 January 2018 and is a member of the NRC. Committee fees were
discontinued when Mr Gill was appointed Chairman of IEL, IEBL and IER. 2 M Chellew was appointed as a Non-Executive Director of IEL, IEBL and IERL on 21 September 2017. Mr Chellew became a member
of the ARCC on 24 Oct 2017 and Chairman of the NRC on 1 January 2018. 3 E Stein was appointed as a Non-Executive Director of IEL, IEBL and IERL on 21 September 2017. Ms Stein became Chairman of the
ARCC on 24 Oct 2017 and a member of the NRC on 22 March 2018. 4 P Green was appointed as a Non-Executive Director of IEL, IEBL and IERL on 18 November 2010. Mr Green is a partner of TCI
Advisor Services LLP which is a substantial shareholder of the Infigen group. Since being appointed, Mr Green has elected to receive no Director fees.
5 Fees payable to Mr Rolfe and Ms Wiggins in FY17 relate to the period when they were Non-Executive Directors. 6 Non-Executive Director fees are for the period 1 July 2017 to 31 December 2017. 7 Non-Executive Director fees are for the period 1 July 2017 to 19 February 2018.
For
per
sona
l use
onl
y
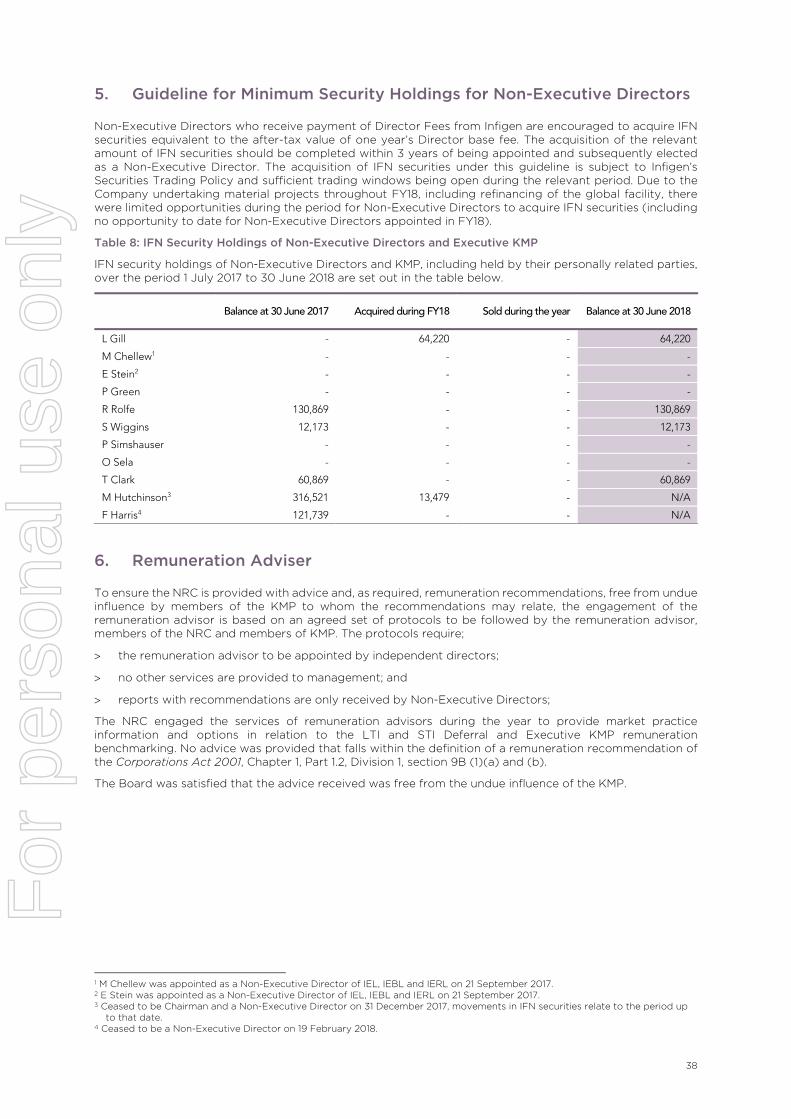
38
5. Guideline for Minimum Security Holdings for Non-Executive Directors
Non-Executive Directors who receive payment of Director Fees from Infigen are encouraged to acquire IFN securities equivalent to the after-tax value of one year’s Director base fee. The acquisition of the relevant amount of IFN securities should be completed within 3 years of being appointed and subsequently elected as a Non-Executive Director. The acquisition of IFN securities under this guideline is subject to Infigen’s Securities Trading Policy and sufficient trading windows being open during the relevant period. Due to the Company undertaking material projects throughout FY18, including refinancing of the global facility, there were limited opportunities during the period for Non-Executive Directors to acquire IFN securities (including no opportunity to date for Non-Executive Directors appointed in FY18).
Table 8: IFN Security Holdings of Non-Executive Directors and Executive KMP
IFN security holdings of Non-Executive Directors and KMP, including held by their personally related parties, over the period 1 July 2017 to 30 June 2018 are set out in the table below.
Balance at 30 June 2017 Acquired during FY18 Sold during the year Balance at 30 June 2018
L Gill - 64,220 - 64,220
M Chellew1 - - - -
E Stein2 - - - -
P Green - - - -
R Rolfe 130,869 - - 130,869
S Wiggins 12,173 - - 12,173
P Simshauser - - - -
O Sela - - - -
T Clark 60,869 - - 60,869
M Hutchinson3 316,521 13,479 - N/A
F Harris4 121,739 - - N/A
6. Remuneration Adviser
To ensure the NRC is provided with advice and, as required, remuneration recommendations, free from undue influence by members of the KMP to whom the recommendations may relate, the engagement of the remuneration advisor is based on an agreed set of protocols to be followed by the remuneration advisor, members of the NRC and members of KMP. The protocols require;
the remuneration advisor to be appointed by independent directors;
no other services are provided to management; and
reports with recommendations are only received by Non-Executive Directors;
The NRC engaged the services of remuneration advisors during the year to provide market practice information and options in relation to the LTI and STI Deferral and Executive KMP remuneration benchmarking. No advice was provided that falls within the definition of a remuneration recommendation of the Corporations Act 2001, Chapter 1, Part 1.2, Division 1, section 9B (1)(a) and (b).
The Board was satisfied that the advice received was free from the undue influence of the KMP.
1 M Chellew was appointed as a Non-Executive Director of IEL, IEBL and IERL on 21 September 2017. 2 E Stein was appointed as a Non-Executive Director of IEL, IEBL and IERL on 21 September 2017. 3 Ceased to be Chairman and a Non-Executive Director on 31 December 2017, movements in IFN securities relate to the period up
to that date. 4 Ceased to be a Non-Executive Director on 19 February 2018.
For
per
sona
l use
onl
y
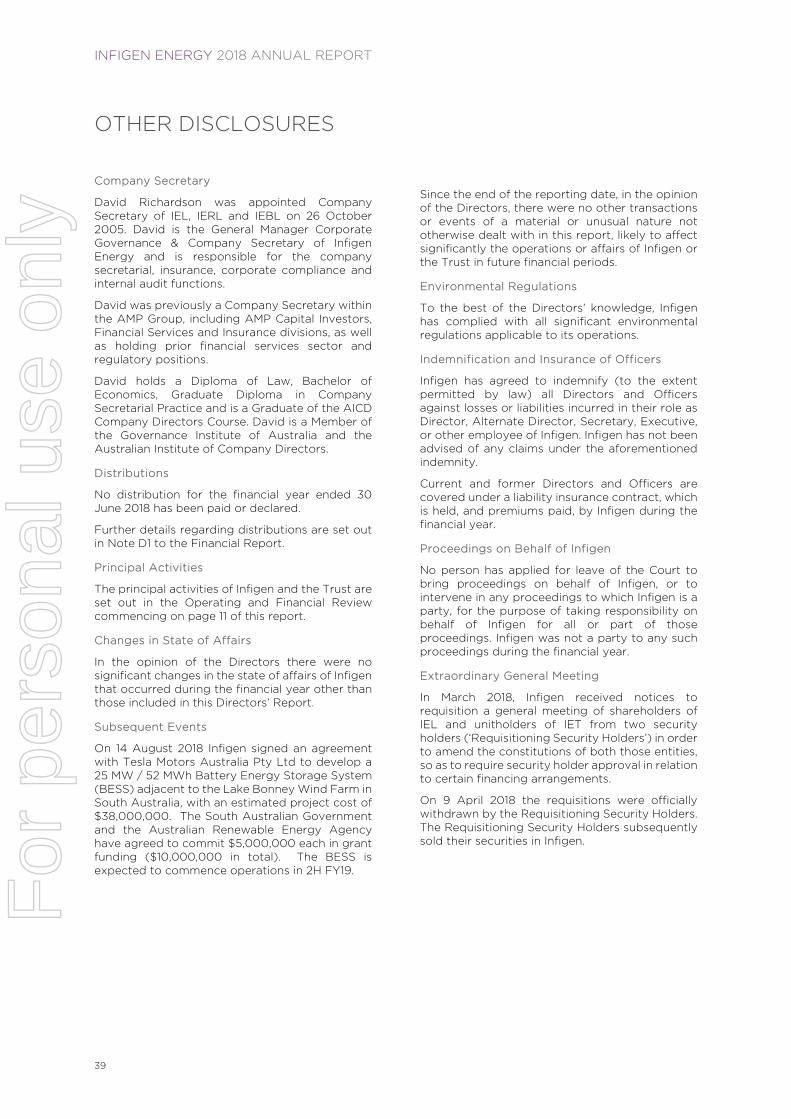
INFIGEN ENERGY 2018 ANNUAL REPORT
39
OTHER DISCLOSURES
Company Secretary
David Richardson was appointed Company Secretary of IEL, IERL and IEBL on 26 October 2005. David is the General Manager Corporate Governance & Company Secretary of Infigen Energy and is responsible for the company secretarial, insurance, corporate compliance and internal audit functions.
David was previously a Company Secretary within the AMP Group, including AMP Capital Investors, Financial Services and Insurance divisions, as well as holding prior financial services sector and regulatory positions.
David holds a Diploma of Law, Bachelor of Economics, Graduate Diploma in Company Secretarial Practice and is a Graduate of the AICD Company Directors Course. David is a Member of the Governance Institute of Australia and the Australian Institute of Company Directors.
Distributions
No distribution for the financial year ended 30 June 2018 has been paid or declared.
Further details regarding distributions are set out in Note D1 to the Financial Report.
Principal Activities
The principal activities of Infigen and the Trust are set out in the Operating and Financial Review commencing on page 11 of this report.
Changes in State of Affairs
In the opinion of the Directors there were no significant changes in the state of affairs of Infigen that occurred during the financial year other than those included in this Directors’ Report.
Subsequent Events
On 14 August 2018 Infigen signed an agreement with Tesla Motors Australia Pty Ltd to develop a 25 MW / 52 MWh Battery Energy Storage System (BESS) adjacent to the Lake Bonney Wind Farm in South Australia, with an estimated project cost of $38,000,000. The South Australian Government and the Australian Renewable Energy Agency have agreed to commit $5,000,000 each in grant funding ($10,000,000 in total). The BESS is expected to commence operations in 2H FY19.
Since the end of the reporting date, in the opinion of the Directors, there were no other transactions or events of a material or unusual nature not otherwise dealt with in this report, likely to affect significantly the operations or affairs of Infigen or the Trust in future financial periods.
Environmental Regulations
To the best of the Directors’ knowledge, Infigen has complied with all significant environmental regulations applicable to its operations.
Indemnification and Insurance of Officers
Infigen has agreed to indemnify (to the extent permitted by law) all Directors and Officers against losses or liabilities incurred in their role as Director, Alternate Director, Secretary, Executive, or other employee of Infigen. Infigen has not been advised of any claims under the aforementioned indemnity.
Current and former Directors and Officers are covered under a liability insurance contract, which is held, and premiums paid, by Infigen during the financial year.
Proceedings on Behalf of Infigen
No person has applied for leave of the Court to bring proceedings on behalf of Infigen, or to intervene in any proceedings to which Infigen is a party, for the purpose of taking responsibility on behalf of Infigen for all or part of those proceedings. Infigen was not a party to any such proceedings during the financial year.
Extraordinary General Meeting
In March 2018, Infigen received notices to requisition a general meeting of shareholders of IEL and unitholders of IET from two security holders (‘Requisitioning Security Holders’) in order to amend the constitutions of both those entities, so as to require security holder approval in relation to certain financing arrangements.
On 9 April 2018 the requisitions were officially withdrawn by the Requisitioning Security Holders. The Requisitioning Security Holders subsequently sold their securities in Infigen.
For
per
sona
l use
onl
y

40
Non-Audit Services
In accordance with internal policy, Infigen and the Trust only engage the auditor for non-audit services where the services will not compromise the auditor’s independence and where it is believed the auditor is best equipped to provide the services when considering their experience, expertise, and knowledge of Infigen and the Trust.
The Board has considered the Audit Risk and Compliance Committee’s advice and the non-audit services provided by the auditor and is satisfied that the provision of these services by the auditor is compatible with, and did not compromise the general standard of auditor independence imposed by the Corporations Act 2001.
Non-audit services provided during the financial year consist of taxation related services (including general compliance and advisory) and transaction and advisory services (including those in connection with the Refinancing). Fees paid or payable to the auditor for these services during the financial year are summarised in the below table.
Non-audit services 30 June 2018
Taxation related services 91,179
Transaction and advisory services 396,946
488,125
The non-audit services provided also do not undermine the general principles relating to auditor independence as set out in the APES 110 Code of Ethics for Professional Accountants as they did not involve reviewing or auditing the auditor’s own work or acting in a management or decision-making capacity for Infigen.
Auditor’s Independence Declaration
A copy of the Auditor’s Independence Declaration as required under section 307C of the Corporations Act 2001 is set out on page 41.
Rounding
All figures are presented in Australian Dollars with all values rounded off to the nearest thousand dollars, unless otherwise stated, in accordance with the Australian Securities and Investments Commission (ASIC) Corporations Instrument 2016/191.
Approval of Directors’ Report
Pursuant to section 298(2) of the Corporations Act 2001, this report is made in accordance with resolutions of the Directors of IEL and the Directors of IERL, the responsible entity of IET.
On behalf of the Directors of IEL and IERL:
Len Gill
Chairman
Ross Rolfe AO
Chief Executive Officer / Managing Director
For
per
sona
l use
onl
y

PricewaterhouseCoopers, ABN 52 780 433 757 One International Towers Sydney, Watermans Quay, Barangaroo, GPO BOX 2650, SYDNEY NSW 2001 T: +61 2 8266 0000, F: +61 2 8266 9999, www.pwc.com.au Level 11, 1PSQ, 169 Macquarie Street, Parramatta NSW 2150, PO Box 1155 Parramatta NSW 2124 T: +61 2 9659 2476, F: +61 2 8266 9999, www.pwc.com.au
Liability limited by a scheme approved under Professional Standards Legislation.
41
Auditor’s Independence Declaration As lead auditor for the audit of Infigen Energy Group and Infigen Energy Trust Group for the year ended 30 June 2018, I declare that to the best of my knowledge and belief, there have been:
(a) no contraventions of the auditor independence requirements of the Corporations Act 2001 in relation to the audit; and
(b) no contraventions of any applicable code of professional conduct in relation to the audit.
This declaration is in respect of Infigen Energy Group and Infigen Energy Trust Group and the entities it controlled during the period.
Marc Upcroft Sydney Partner PricewaterhouseCoopers
27 August 2018
For
per
sona
l use
onl
y

42
FINANCIAL REPORT
CONSOLIDATED FINANCIAL STATEMENTS OF: Comprehensive Income 43 Financial Position 44 Changes in Equity 45 Cash Flow 46
NOTES TO THE CONSOLIDATED FINANCIAL STATEMENTS A. REPORT OVERVIEW 47
A1 Basis of Preparation 47 A2 New and Amended Accounting Standards 48
B. RESULTS 49 B1. Segment Information 49 B2. Revenue 50 B3. Other Income 50 B4. Other Finance Costs 51 B5. Taxation 51 B6. Earnings per Stapled Security 53
C. OPERATING ASSETS 53 C1. Property, Plant and Equipment 53 C2. Intangible Assets 54 C3. Commitments 56
D. CAPITAL STRUCTURE 56 D1. Capital Management 56 D2. Cash and Cash Equivalents 56 D3. Borrowings 57 D4. Contributed Equity 58
E. FINANCIAL RISK MANAGEMENT 59 E1. Financial Risk Summary 59 E2. Market Risk - Electricity Price 60 E3. Market Risk - Interest Rate 60 E4. Liquidity Risk 61 E5. Fair Value of Financial Assets and Liabilities 61
F. GROUP STRUCTURE 63 F1. Controlled Entities 63 F2. Deed of Cross Guarantee 65 F3. Parent Entity Disclosure 67
G. OTHER DISCLOSURES 68 G1. Share-Based Payments 68 G2. Related Party Transactions 69 G3. Cash Flow Information 70 G4. Reserves 71 G5. Auditor’s Remuneration 71 G6. Inventory 71 G7. Contingent Liabilities 72 G8. Events Occurring after the Reporting Period 72 F
or p
erso
nal u
se o
nly
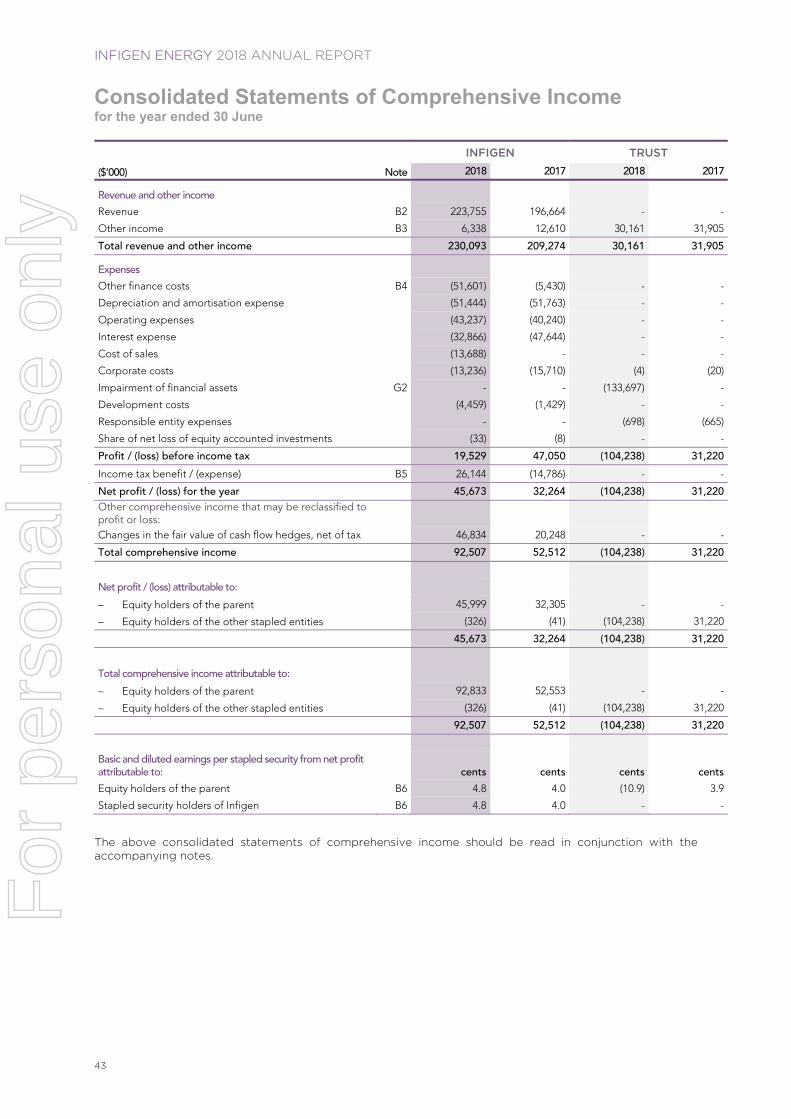
INFIGEN ENERGY 2018 ANNUAL REPORT
43
Consolidated Statements of Comprehensive Income for the year ended 30 June
INFIGEN TRUST
($’000) Note 2018 2017 2018 2017
Revenue and other income
Revenue B2 223,755 196,664 - -
Other income B3 6,338 12,610 30,161 31,905
Total revenue and other income 230,093 209,274 30,161 31,905
Expenses
Other finance costs B4 (51,601) (5,430) - -
Depreciation and amortisation expense (51,444) (51,763) - -
Operating expenses (43,237) (40,240) - -
Interest expense (32,866) (47,644) - -
Cost of sales (13,688) - - -
Corporate costs (13,236) (15,710) (4) (20)
Impairment of financial assets G2 - - (133,697) -
Development costs (4,459) (1,429) - -
Responsible entity expenses - - (698) (665)
Share of net loss of equity accounted investments (33) (8) - -
Profit / (loss) before income tax 19,529 47,050 (104,238) 31,220
Income tax benefit / (expense) B5 26,144 (14,786) - -
Net profit / (loss) for the year 45,673 32,264 (104,238) 31,220 Other comprehensive income that may be reclassified to profit or loss:
Changes in the fair value of cash flow hedges, net of tax 46,834 20,248 - -
Total comprehensive income 92,507 52,512 (104,238) 31,220
Net profit / (loss) attributable to: Equity holders of the parent 45,999 32,305 - -
Equity holders of the other stapled entities (326) (41) (104,238) 31,220
45,673 32,264 (104,238) 31,220
Total comprehensive income attributable to: Equity holders of the parent 92,833 52,553 - -
Equity holders of the other stapled entities (326) (41) (104,238) 31,220
92,507 52,512 (104,238) 31,220
Basic and diluted earnings per stapled security from net profit attributable to:
cents
cents
cents
cents
Equity holders of the parent B6 4.8 4.0 (10.9) 3.9
Stapled security holders of Infigen B6 4.8 4.0 - -
The above consolidated statements of comprehensive income should be read in conjunction with the accompanying notes.
For
per
sona
l use
onl
y

44
Consolidated Statements of Financial Position as at 30 June
INFIGEN TRUST
($’000) Note 2018 2017 2018 2017
Current assets Cash and cash equivalents D2 144,898 251,786 439 5,515 Receivables 14,935 12,416 - 24 Inventories G6 43,327 26,951 - - Derivative financial instruments E5 2,080 1,551 - -
205,240 292,704 439 5,539
Non-current assets Property, plant and equipment C1 896,431 799,937 - - Intangible assets C2 115,320 118,279 - - Deferred tax assets B5 26,376 20,315 - - Receivables 3,512 3,475 645,790 746,432 Investments accounted for using the equity method 1,244 1,209 - - Derivative financial instruments E5 10,691 2 - -
1,053,574 943,217 645,790 746,432
Total assets 1,258,814 1,235,921 646,229 751,971
Current liabilities Payables 18,254 19,786 698 5,109 Borrowings D3 41,219 83,252 - - Derivative financial instruments E5 3,250 28,118 - - Provisions 3,504 2,146 - -
66,227 133,302 698 5,109
Non-current liabilities Borrowings D3 608,880 570,600 - - Derivative financial instruments E5 2,981 44,264 - - Provisions 9,033 8,381 - -
620,894 623,245 - -
Total liabilities 687,121 756,547 698 5,109
Net assets 571,693 479,374 645,531 746,862
Equity Contributed equity D4 918,870 915,963 910,304 907,397 Reserves G4 (47,816) (91,555) - - Retained losses (299,361) (345,034) (264,773) (160,535)
Total equity 571,693 479,374 645,531 746,862
Attributable to: Equity holders of the parent Contributed equity 2,305 2,305 910,304 907,397
Reserves (47,816) (91,555) - -
Retained losses (274,821) (320,820) (264,773) (160,535)
(320,332) (410,070) 645,531 746,862
Equity holders of the other stapled entities Contributed equity 916,565 913,658 - -
Retained losses (24,540) (24,214) - -
892,025 889,444 - -
Total equity 571,693 479,374 645,531 746,862
The above consolidated statements of financial position should be read in conjunction with the accompanying notes.
For
per
sona
l use
onl
y

INFIGEN ENERGY 2018 ANNUAL REPORT
45
Consolidated Statements of Changes in Equity for the year ended 30 June
INFIGEN Attributable to: Equity holders of the parent Equity holders
of the other stapled entities
($’000) Contributed
equity Reserves Retained
losses Total Total equity
Opening balance - 2017 2,305 (106,451) (353,125) (457,271) 737,836 280,565 Net profit / (loss) for the year - - 32,305 32,305 (41) 32,264 Changes in the fair value of cash flow hedges, net of tax
- 20,248 - 20,248 - 20,248
Total comprehensive income / (loss) for the year - 20,248 32,305 52,553 (41) 52,512
Transactions with equity holders Securities issued - Infigen Energy Equity Plan - - - - 7,297 7,297
Recognition of share-based payments - (5,352) - (5,352) - (5,352) Securities issued (capital raise), net of transaction costs
- - - - 144,352 144,352
Closing balance - 2017 2,305 (91,555) (320,820) (410,070) 889,444 479,374
Opening balance - 2018 2,305 (91,555) (320,820) (410,070) 889,444 479,374 Net profit / (loss) for the year - - 45,999 45,999 (326) 45,673 Changes in the fair value of cash flow hedges, net of tax - 46,834 - 46,834 - 46,834
Total comprehensive income / (loss) for the year
- 46,834 45,999 92,833 (326) 92,507
Transactions with equity holders Securities issued - Infigen Energy Equity Plan
- - - - 2,907 2,907
Recognition of share-based payments - (3,095) - (3,095) - (3,095)
Closing balance - 2018 2,305 (47,816) (274,821) (320,332) 892,025 571,693
TRUST
($’000) Contributed
equity Reserves Retained
losses Total
Opening balance - 2017 755,748 - (191,755) 563,993
Net profit for the year - - 31,220 31,220
Total comprehensive income - - 31,220 31,220
Transactions with equity holders Securities issued - Infigen Energy Equity Plan
7,297 - - 7,297
Securities issued - capital raising, net of transaction costs 144,352 - - 144,352
Closing balance - 2017 907,397 - (160,535) 746,862
Opening balance - 2018 907,397 - (160,535) 746,862 Net loss for the year - - (104,238) (104,238)
Total comprehensive income - - (104,238) (104,238)
Transactions with equity holders Securities issued - Infigen Energy Equity Plan 2,907 - - 2,907
Closing balance - 2018 910,304 - (264,773) 645,531
The above consolidated statements of changes in equity should be read in conjunction with the accompanying notes.
For
per
sona
l use
onl
y

46
Consolidated Statements of Cash Flow for the year ended 30 June
INFIGEN TRUST ($’000) Note 2018 2017 2018 2017
Cash flows from operating activities Receipts from customers 201,678 208,346 - - Payments to suppliers and employees (71,857) (60,805) - - Interest received 5,421 1,634 36 107 Interest and other finance costs paid (34,796) (50,505) (5) -
Net cash inflow G3 100,446 98,670 31 107
Cash flows from investing activities Payments for property, plant and equipment (143,016) (39,237) - - Payments for intangible assets (602) (3,656) - - Payment for acquisition of controlled entity - (5,765) - - Payments for equity accounted investments (68) (47) - -
Gain on disposal of investments 644 - - -
Net cash outflow (143,042) (48,705) - -
Cash flows from financing activities Proceeds from borrowings 681,800 1,825 - - Repayment of borrowings (663,636) (88,499) - - Payment of new borrowings transaction costs (28,444) - - - Payment for interest rate derivatives termination (55,230) - - - Securities issued - capital raising, net of transaction costs - 144,352 - 144,352 Repayment of loan by a related party - - 184,814 8,011 Loans provided to related parties - - (189,921) (147,360)
Net cash (outflow) / inflow (65,510) 57,678 (5,107) 5,003
Net (decrease) / increase in cash and cash equivalents (108,106) 107,643 (5,076) 5,110
Opening cash and cash equivalents 251,786 147,602 5,515 405
Effects of exchange rate changes on the balance of cash held in foreign currencies 1,218 (3,459) - -
Closing cash and cash equivalents 144,898 251,786 439 5,515
The above consolidated cash flow statements should be read in conjunction with the accompanying notes.
For
per
sona
l use
onl
y

INFIGEN ENERGY 2018 ANNUAL REPORT
47
A REPORT OVERVIEW
Infigen comprises Infigen Energy Limited (IEL), Infigen Energy Trust (IET), Infigen Energy (Bermuda) Limited (IEBL) and the controlled entities of IEL and IET.
The Trust comprises IET and its controlled entities.
IEL is determined to be the parent entity of Infigen.
One share in each of IEL and IEBL and one unit in IET have been stapled together to form a single stapled security and listed on the Australian Securities Exchange (ASX) under the code “IFN”. They cannot be traded separately and can only be traded as stapled securities.
IEL is incorporated and domiciled in Australia. IET was established in and is domiciled in Australia. IEBL is incorporated in Bermuda.
Inter-entity balances and transactions (except unrealised losses that provide evidence that the asset(s) being transferred are impaired) are eliminated.
The acquisition method of accounting is used to account for business combinations by Infigen and the Trust.
Non-controlling interests in the results and equity of controlled entities are shown separately, where applicable, in the consolidated financial statements.
Trust information
IET is a Registered Scheme (the Scheme) and Infigen Energy RE Limited (IERL) is the Responsible Entity of IET. The relationship of the Responsible Entity with the Scheme is governed by the terms and conditions specified in the Constitution of IET.
Statement of compliance
As permitted by Australian Securities and Investments Commission (ASIC) Corporations Instrument 2015/843, this report consists of the consolidated financial statements and accompanying notes of both Infigen and the Trust.
As permitted by ASIC Class Order 13/1050, the consolidated financial statements treat IEL as the ‘parent’ of the stapled entities.
A1 Basis of Preparation
Infigen and the Trust are for-profit entities for the purpose of preparing consolidated financial statements.
These consolidated financial statements are general purpose financial statements, and have been prepared in accordance with the Corporations Act 2001, Australian Accounting Standards and International Financial Reporting Standards (IFRS).
These consolidated financial statements have been prepared on the basis of the legislative and regulatory regime that existed as at 30 June 2018 and at the date of this report. Changes to the regulatory regime could affect the carrying values of assets and future renewable energy project developments.
These consolidated financial statements have been prepared on the going concern basis using the historical cost conventions modified by the revaluation of financial assets and liabilities (including derivative financial instruments) measured at fair value, where applicable.
All figures are presented in Australian Dollars with all values rounded to the nearest thousand dollars, unless otherwise stated, in accordance with the ASIC Corporations Instrument 2016/191.
Critical accounting estimates and judgements
The preparation of financial statements requires estimation and judgement. The areas involving a higher degree of estimation or judgement are discussed in the following notes to the consolidated financial statements:
Note Nature of estimate and judgement
B5 Taxation - recoverability of deferred assets
C2 Intangible Assets - estimation of recoverable amounts
E5 Fair Value of Financial Assets and Liabilities - estimating the fair value of derivatives
For
per
sona
l use
onl
y

48
A2 New and Amended Accounting Standards
New and amended accounting standards adopted by Infigen or the Trust during the year did not require changes to its accounting policies or retrospective adjustments to financial results.
Certain new accounting standards not yet adopted by Infigen or the Trust are summarised in the following table.
There are no other new or amended accounting standards that may have a material effect on Infigen or the Trust.
Accounting standard Nature of change Effect on financial statements
AASB 15 Revenue from Contracts with Customers (effective for the financial year commencing 1 July 2018)
AASB 15 replaces AASB 118 Revenue and AASB 111 Construction Contracts
It is based on the principle that revenue is recognised when control of a good or service transfers to a customer. The previous revenue recognition principle focused on the transfer of significant risks and rewards of ownership
In addition, AASB 15 requires new and expanded disclosures related to the nature, amount, timing and uncertainty of revenue and cash flows arising from customers and key judgements made
The application of AASB 15 is not expected to have a material effect on the financial results of Infigen or the Trust, however some additional disclosure will be required
AASB 16 Leases (effective for the financial year commencing 1 July 2019)
AASB 16 replaces AASB 117 Leases
Under AASB 16, the distinction between operating and finance leases is removed for lessees. Contractual arrangements that meet the definition of a lease under the new standard will be recognised on the balance sheet
Specifically, a right-of-use asset and associated lease liability for the lease payments is recognised on the balance sheet. Interest expense will be recognised in the income statement using the effective interest rate method and the right-of-use asset will be depreciated
Only finance leases are recognised on balance sheet under AASB 117
The accounting for lessors will not change significantly
A full retrospective or a modified retrospective approach is permitted on adoption
Based on contractual arrangements currently in place, assets and liabilities are expected to increase by $2.6 million and $3.0 million respectively upon adoption
Infigen will use the modified retrospective approach of adoption
The Trust’s financial results are not expected to be affected by AASB 16 because the Trust has no contractual arrangements that meet the definition of a lease under AASB 16
For
per
sona
l use
onl
y

INFIGEN ENERGY 2018 ANNUAL REPORT
49
B RESULTS
B1 Segment Information
Infigen is a business actively participating in the Australian energy market. It is a developer, owner, and operator of generation assets delivering energy solutions to Australian businesses and large retailers. Revenues are derived from various channels to market within Australia. As a result of Infigen’s performance from a geographic and product perspective, Australia has been identified as Infigen’s sole reportable segment.
Only Infigen’s segment information is provided to chief operating decision-makers, defined to be the Board of Directors. Accordingly, only Infigen’s segment information has been disclosed in this section.
The Board of Directors assesses the performance of the operating segment using statutory earnings before interest, tax, depreciation and amortisation (EBITDA), adjusted to exclude certain significant non-cash and one-off items that are unrelated to the operating performance of Infigen (Underlying EBITDA). Since Infigen operates in a single segment, the assets and liabilities are those disclosed in the consolidated statements of financial position.
The segment information provided to the Board for the operating segment together with a reconciliation of Underlying EBITDA to net profit after tax is disclosed in the following table.
INFIGEN
($’000) Note 2018 2017
Revenue B2 223,755 196,664 Cost of sales (13,688) -
210,067 196,664
Operating expenses (43,237) (40,240)
Corporate costs (13,236) (15,710)
Development costs (4,459) (1,429)
Share of net loss of equity accounted investments (33) (8)
Other - 13
Underlying EBITDA 149,102 139,290
Other income 644 -
Gains from development transactions - 10,390
EBITDA 149,746 149,680
Depreciation and amortisation expense (51,444) (51,763)
Earnings before interest and tax 98,302 97,917
Net finance costs (78,773) (50,867)
Profit before tax 19,529 47,050
Income tax benefit / (expense) B5 26,144 (14,786)
Net profit after tax 45,673 32,264
Underlying EBITDA per stapled security (cents) 15.6 17.3
The reconciliation of net finance costs to the statement of comprehensive income for the purposes of the above segment information is disclosed in the following table.
INFIGEN ($’000) Note 2018 2017
Interest income B3 4,834 1,633
Foreign exchange gain B3 860 574
Interest expense (32,866) (47,644)
Other finance costs B4 (51,601) (5,430)
(78,773) (50,867)
For
per
sona
l use
onl
y

50
B2 Revenue
Revenue is recognised when it can be reliably measured and payment is probable. Measurement is at the fair value of the consideration received or receivable.
Revenue balances
INFIGEN ($’000) 2018 2017
Energy and environmental products 193,367 163,486
Lease income 30,295 32,342
Compensated revenue 93 836
223,755 196,664
B3 Other Income
($’000)
INFIGEN TRUST
2018 2017 2018 2017
Interest income 4,834 1,633 36 107
Foreign exchange gains 860 574 1 879
Gain on sale of development assets - 4,625 - -
Fair value gain on acquisition of controlled entity - 5,765 - -
Other 644 13 - -
Unwind of discount on related party loan receivables - - 30,124 30,919
6,338 12,610 30,161 31,905
Revenue type Description
Energy and environmental products
Incorporates:
Electricity Electricity generated from Infigen’s own generation (after applying marginal loss factors), sold on the
National Electricity Market (NEM) at the spot price
Electricity sold to commercial & industrial (C&I) customers under medium to long-term contracts. Where the contracted arrangement is an energy retail supply agreement, Infigen purchases the electricity volume consumed by these customers from the NEM at spot price. These purchases are recorded as cost of sales within the consolidated statements of comprehensive income
Net receipts and payments from Power Purchase Agreements (PPAs) which are accounted for as electricity derivative contracts, and which are medium to long-term in nature
Net receipts and payments from electricity derivative contracts such as ASX futures and options, and which are short to medium-term in nature
Large-scale Generation Certificates (LGCs) An LGC represents 1 MWh generation from renewable energy generators. LGC revenue is
recognised at fair value once generated and in the same period as costs are incurred. Each LGC is concurrently recognised in inventory until it is sold, upon which time, the difference between the sale price and book value is recorded as a component of revenue
Lease income Electricity and LGCs from Infigen’s own generation, sold under certain long-term contracts to one customer that has regard to actual production outcomes. Classification of this income is consistent with UIG 4 Determining whether an Asset Contains a Lease
Compensated revenue
Compensated revenue includes insurance proceeds and proceeds arising from compensation claims made against the Australian Electricity Market Operator (AEMO) or maintenance service providers
For
per
sona
l use
onl
y

INFIGEN ENERGY 2018 ANNUAL REPORT
51
B4 Other Finance Costs
INFIGEN ($’000) 2018 2017
Bank and amortisation of capitalised commitment fees 3,092 2,917
Net loss on change in fair value of derivative financial instruments - 2,392
Unwind of discount on decommissioning provisions 123 121
3,215 5,430
Termination of interest rate swaps (A) (B) 43,295 -
Fees incurred in relation to exploring refinance options (A) 2,707 -
Early expense of capitalised commitment fees (A) 2,384 -
51,601 5,430
(A) These finance costs were incurred as a result of the early refinancing of the Global Facility and the Woodlawn Project Finance (PF) Facility during the year. Refer to Note D3 for details of the refinancing.
(B) The difference between the termination of interest rate swaps expense of $43,295,000 and the total cash paid for the termination of the interest rate swaps of $55,230,000 (as shown in the statement of cash flows), represents the change in fair values of ineffective hedges recognised in prior period’s net profit / (loss).
B5 Taxation
Infigen is subject to income tax in Australia and jurisdictions where it has foreign operations.
Under current legislation, the Trust is not subject to income tax as unit holders are presently entitled to the income of the Trust.
Key principles
Income tax expense consists of current tax expense and deferred tax expense. Income tax is recognised in the consolidated statements of comprehensive income, except to the extent that it relates to items recognised directly in equity.
Current tax expense represents the expected tax payable on the taxable income for the year, in accordance with current tax rates, and any adjustments to the previous financial years’ tax payable.
Deferred tax expense is recognised in respect of temporary differences between an asset or liability’s carrying value in the consolidated financial statements and tax value.
Deferred tax is not recognised on the initial recognition of goodwill.
Deferred tax assets, including those arising from unused tax losses, are only recognised to the extent it is probable future taxable profits will be available. During the financial year, $118,851,000 of previously unrecognised tax losses were brought to account, resulting in $35,655,000 of additional deferred tax assets being recognised in the consolidated statement of financial position as at 30 June 2018.
Deferred tax liabilities are recognised for all temporary differences.
Deferred tax assets and liabilities are offset where there is a legally enforceable right to offset, they relate to income tax levied by the same tax authority, and Infigen intends to settle on a net basis or realise the asset and settle the liability simultaneously.
Significant estimate and judgement is required in assessing the timing and level of future taxable profits. This includes assumptions about a variety of general economic and business conditions outside Infigen’s control. The assumptions and projected cash flows used in this assessment are consistent with those used in assessing potential impairment of intangible assets detailed in Note C2. Changes in the underlying conditions outside Infigen’s control could have an impact on future taxable profits and the utilisation of deferred tax assets.
Tax consolidation
IEL (as head entity) and its wholly-owned Australian resident entities form the Tax Consolidated Group which is taxed as a single entity. Tax Consolidated Group members fund and share tax with IEL whilst continuing to account for their own current and deferred tax amounts. The members are identified at Note F1.
For
per
sona
l use
onl
y
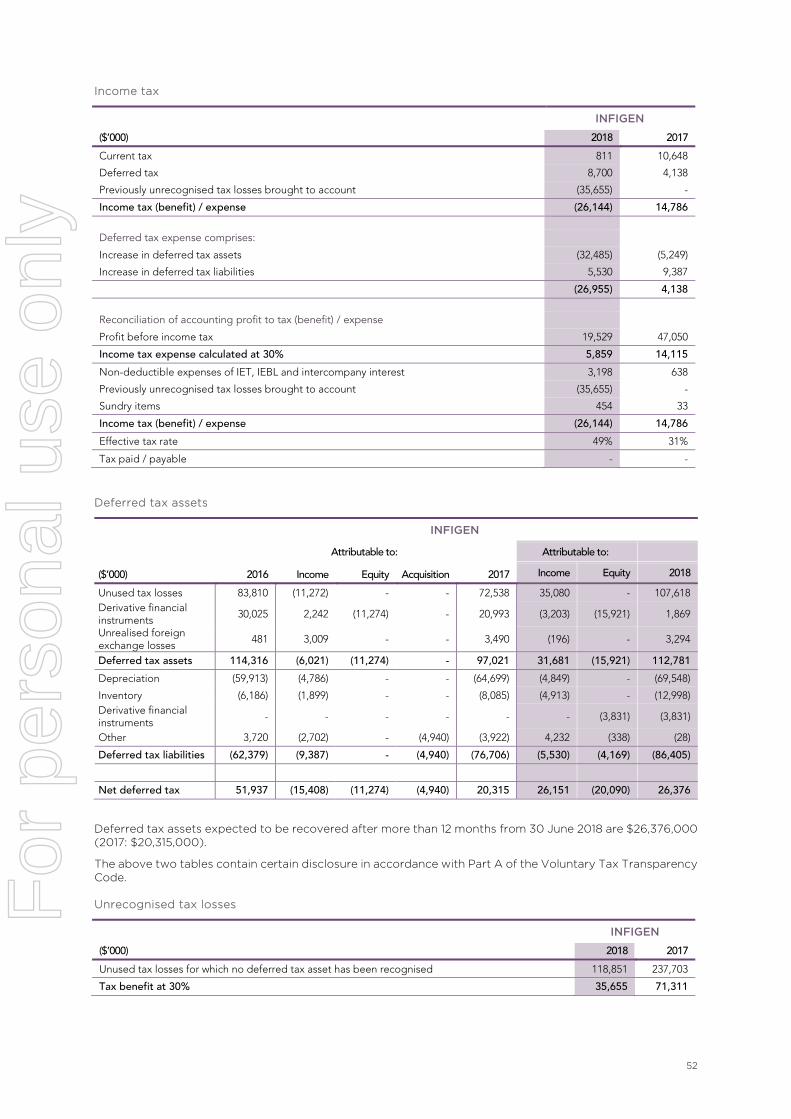
52
Income tax
($’000)
INFIGEN 2018 2017
Current tax 811 10,648
Deferred tax 8,700 4,138
Previously unrecognised tax losses brought to account (35,655) -
Income tax (benefit) / expense (26,144) 14,786
Deferred tax expense comprises: Increase in deferred tax assets (32,485) (5,249)
Increase in deferred tax liabilities 5,530 9,387
(26,955) 4,138
Reconciliation of accounting profit to tax (benefit) / expense Profit before income tax 19,529 47,050
Income tax expense calculated at 30% 5,859 14,115
Non-deductible expenses of IET, IEBL and intercompany interest 3,198 638
Previously unrecognised tax losses brought to account (35,655) -
Sundry items 454 33
Income tax (benefit) / expense (26,144) 14,786
Effective tax rate 49% 31%
Tax paid / payable - -
Deferred tax assets
($’000)
INFIGEN
Attributable to: Attributable to:
2016 Income Equity Acquisition 2017 Income Equity 2018
Unused tax losses 83,810 (11,272) - - 72,538 35,080 - 107,618 Derivative financial instruments
30,025 2,242 (11,274) - 20,993 (3,203) (15,921) 1,869
Unrealised foreign exchange losses
481 3,009 - - 3,490 (196) - 3,294
Deferred tax assets 114,316 (6,021) (11,274) - 97,021 31,681 (15,921) 112,781
Depreciation (59,913) (4,786) - - (64,699) (4,849) - (69,548)
Inventory (6,186) (1,899) - - (8,085) (4,913) - (12,998) Derivative financial instruments
- - - - - - (3,831) (3,831)
Other 3,720 (2,702) - (4,940) (3,922) 4,232 (338) (28)
Deferred tax liabilities (62,379) (9,387) - (4,940) (76,706) (5,530) (4,169) (86,405)
Net deferred tax 51,937 (15,408) (11,274) (4,940) 20,315 26,151 (20,090) 26,376
Deferred tax assets expected to be recovered after more than 12 months from 30 June 2018 are $26,376,000 (2017: $20,315,000).
The above two tables contain certain disclosure in accordance with Part A of the Voluntary Tax Transparency Code.
Unrecognised tax losses
($’000)
INFIGEN
2018 2017
Unused tax losses for which no deferred tax asset has been recognised 118,851 237,703
Tax benefit at 30% 35,655 71,311
For
per
sona
l use
onl
y

INFIGEN ENERGY 2018 ANNUAL REPORT
53
B6 Earnings per Stapled Security
Basic earnings per share (Basic EPS) is calculated by dividing net profit for the year by the Weighted Average Number of Securities (WANOS) outstanding during the period. Basic EPS is then adjusted to account for the WANOS issued under the Infigen Energy Equity Plan during the period to calculate Diluted EPS.
INFIGEN TRUST
2018 2017 2018 2017
Net profit attributable to:
- Parent equity holders ($’000) 45,999 32,305 (104,238) 31,220 - Stapled security holders ($’000) 45,673 32,264 - - WANOS: - Basic (thousands) 952,938 804,644 952,938 804,644 - Diluted (thousands) 956,915 811,375 956,915 811,375 Parent entity EPS: - Basic (cents) 4.8 4.0 (10.9) 3.9 - Diluted (cents) 4.8 4.0 (10.9) 3.9 Stapled security EPS: - Basic (cents) 4.8 4.0 - - - Diluted (cents) 4.8 4.0 - -
C OPERATING ASSETS
C1 Property, Plant and Equipment
This section contains in-use property, plant and equipment and assets under construction. In-use property, plant and equipment primarily consists wind turbines and associated plant from the 557 megawatts of installed generation capacity across New South Wales (NSW), South Australia, and Western Australia. Assets under construction primarily consists of Bodangora Wind Farm, a 113 MW wind generation asset located in central-western NSW, and scheduled for completion in 1H FY19.
Movements in carrying values
INFIGEN
2018 2017
($’000) In-use property,
plant & equipment Assets under construction Total Total
Opening balance - 1 July 738,023 61,914 799,937 783,819
Additions 2,620 134,330 136,950 43,811
Capitalised interest - 6,237 6,237 -
Acquisitions and revaluations - - - 16,472
Disposals - - - (38)
Depreciation expense (46,630) - (46,630) (46,516)
Transfers (to) / from intangible assets (63) - (63) 2,389
Closing balance - 30 June 693,950 202,481 896,431 799,937
Cost 1,162,711 202,481 1,365,192 1,222,068
Accumulated depreciation (468,761) - (468,761) (422,131)
Net book value 693,950 202,481 896,431 799,937
For
per
sona
l use
onl
y

54
Accounting treatment
In-use property, plant and equipment is measured at cost, less accumulated depreciation and impairment. Initial cost includes directly attributable acquisition expenditure. Subsequent costs are capitalised if it is probable they result in a flow of future economic benefits to Infigen, and they can be reliably measured. Other costs are expensed as incurred.
In-use plant and equipment depreciation is calculated on a straight-line basis over the estimated useful life of the relevant asset. Operating wind farms and associated plant is depreciated over 25 years. Bodangora Wind Farm, currently under construction, is anticipated to be depreciated over 30 years. Other items of plant and equipment are depreciated between three and 20 years.
Assets under construction represents direct construction costs relating to generation assets not ready for use, including interest incurred on construction facility borrowings. Assets under construction are transferred to in-use property, plant and equipment once the generation asset is ready for commercial use.
Decommissioning provision
Obligations exist to decommission Infigen’s wind farms at the end of their useful economic lives. Decommissioning includes removal of turbines, associated plant, and restoration of land.
A decommissioning provision is estimated by discounting the future decommissioning expenditure to its present value. A discount rate that considers the current market rates, adjusted for the uncertainty of the expenditure is used. The provision is reviewed, and adjusted where necessary, at the end of each financial year.
The provision is recognised as a non-current liability in the consolidated statement of financial position. At 30 June 2018 the provision balance is $8,448,000 (2017: $7,877,000).
C2 Intangible Assets
The table below discloses three types of intangible assets held by Infigen.
Intangible asset Description and accounting treatment
Licences and development rights
Certain licences and development rights are required to construct and operate Infigen’s wind farms. These include costs incurred on obtaining project approvals, land leases, and connection rights
Measurement is at cost less accumulated amortisation and impairment. Amortisation is calculated on a straight-line basis over the expected useful life of the wind farm to which the licences and development rights are attached
Development assets Development assets represent expenditure incurred prior to the commencement of a generation asset’s construction
Goodwill Goodwill is recognised upon the acquisition of certain businesses. It represents the excess of the acquisition cost over the fair value of the share of net identifiable assets, liabilities, and contingent liabilities of the acquired business
For
per
sona
l use
onl
y

INFIGEN ENERGY 2018 ANNUAL REPORT
55
Movements in carrying values
($’000)
INFIGEN
2018 2017
Licences and development
rights Development
assets Goodwill Total Total
Opening balance - 1 July 75,525 27,618 15,136 118,279 122,671
Additions 109 1,910 - 2,019 3,656
Transfers from / (to) plant and equipment 63 - - 63 (2,389)
Amortisation and impairment expense (4,814) (227) - (5,041) (5,247)
Disposals - - - - (412)
Closing balance - 30 June 70,883 29,301 15,136 115,320 118,279
Balance
Cost 117,726 29,301 15,136 162,163 160,308
Accumulated amortisation and impairment (46,843) - - (46,843) (42,029)
Net book value 70,883 29,301 15,136 115,320 118,279
Impairment
The carrying value of development assets and goodwill is tested for impairment annually.
The carrying value of licences and development rights is assessed annually for indicators of impairment. Where indicators of impairment exist, impairment testing is undertaken.
Impairment testing is undertaken by comparing an intangible asset’s carrying and recoverable amounts. Impairment losses are recognised when carrying amounts are higher than recoverable amounts. Losses are recognised in the consolidated statement of comprehensive income.
Licences, development rights, and goodwill are allocated to cash-generating-units (CGUs) for impairment testing because they do not generate cash flows independent from other assets. Recoverable amounts are determined as the higher of value-in-use or fair value less costs to sell.
Value-in-use is calculated by estimating and discounting future cash flows of Infigen’s operating assets over their estimated economic useful life to their present value. In-house expertise is combined with historic operating data, electricity and LGC prices, market rates, and independent consultants’ assessments of wind resource and availability. Price forecasts use market observable and third-party assessments of forward pricing. Where a power purchase agreement exists, the contract price is used.
A post-tax discount rate is used to discount future cash flow projections to their present value. The equivalent pre-tax rate at 30 June 2018 is 11.7% (2017: 11.6%).
The recoverable amount of development assets is measured using internal valuations. These valuations reference recent transactions where available and adjusted for any differences such as nature, location, size and consider the current and/or expected future market demand for these development assets.
Significant estimate and judgement is required in forecasting an intangible asset’s discounted future cash flows. Changes in underlying estimates and judgements may cause a variation to recoverable amounts.
Sensitivity testing was performed when calculating the recoverable amounts of intangible assets. The following sensitivity ranges were used: discount rate (+/- 1%); market prices (+/-10%); and production (+/- 5%). The testing did not indicate an impairment.
For
per
sona
l use
onl
y

56
C3 Commitments
Contracted expenditure not recognised as a liability at the reporting date is disclosed in the following table.
Commitment type Description
Capital expenditure Bodangora Wind Farm construction, wind farm spare parts, and IT projects
Repairs and maintenance Long-term contractual agreements for specific, and scheduled, service and maintenance of wind farm turbines
Transmission services Long-term contractual agreements for the transmission of electricity from Infigen’s generation assets to the NEM
Generation asset land payments
Non-cancellable operating leases with terms equating to at least the useful economic lives of the associated generation assets, and containing additional renewal option terms. Certain leases contain contingent rental components (based on generation or revenue of the associated generation assets) and CPI escalation clauses
Committed amounts
($’000)
INFIGEN
2018 2017
Capital expenditure 30,590 148,738
Repairs and maintenance 159,096 113,458
Transmission services 46,548 53,749
Operating leases:
- Not later than 1 year 4,588 4,108
- Later than 1 year and not later than 5 years 18,165 18,608
- Later than 5 years 35,260 38,719
58,013 61,435
Total 294,247 377,380
D CAPITAL STRUCTURE
D1 Capital Management
Infigen seeks a flexible capital structure that supports the preservation and creation of security holder value in a changing energy market.
In order to maintain or adjust its capital structure, Infigen may adjust its level of borrowings, issue or buy back securities, and / or consider the reintroduction of distributions.
Net debt to Underlying EBITDA ratio is a measure of Infigen’s capital structure and is monitored on a regular basis. It is calculated as net debt (gross debt less unrestricted cash) divided by Underlying EBITDA (on a 12-month look-back). Net debt to Underlying EBITDA was 3.6 (2017: 2.9).
No distributions were paid or declared in relation to the financial year (2017: Nil). The parent entity (IEL) has franking credits of $6,228,093 at the end of the reporting date (2017: $6,228,093).
D2 Cash and Cash Equivalents
Unrestricted cash includes cash on hand and term deposits held at call with financial institutions. Restricted cash is held in accordance with the minimum cash requirements for the Australian Financial Services Licence (AFSL) compliance and the Bodangora Wind Farm project finance facility (Bodangora PF).
INFIGEN TRUST
($’000) 2018 2017 2018 2017
Unrestricted cash 94,501 211,332 439 5,515
Restricted cash 50,397 40,454 - -
144,898 251,786 439 5,515
For
per
sona
l use
onl
y

INFIGEN ENERGY 2018 ANNUAL REPORT
57
D3 Borrowings
Infigen has two secured borrowing facilities: a syndicated corporate facility (Corporate Facility) and the Bodangora project finance facility (Bodangora PF).
Key changes during the financial year
The Corporate Facility reached financial close on 18 April 2018. The proceeds of the Corporate Facility and existing cash on hand were used to repay existing facilities (Global Facility and the Woodlawn project finance facility (Woodlawn PF)). Interest rate derivative contracts associated with the repaid facilities were terminated when the borrowings were repaid.
The Bodangora PF was further drawn by $156,800,000 during the financial year to fund the ongoing construction of the Bodangora Wind Farm.
Carrying values and movements
INFIGEN ($’000) 2018 2017
Current Corporate Facility 33,750 -
Bodangora PF 7,469 -
Global Facility - 78,500
Woodlawn PF - 4,752
41,219 83,252
Non-current
Corporate Facility 483,750 -
Bodangora PF 151,156 1,825
Global Facility - 543,028
Woodlawn PF - 29,253
634,906 574,106
Capitalised commitment fees (26,026) (3,506)
608,880 570,600
Total borrowings 650,099 653,852
Movement in borrowings
Opening balance - 1 July 653,852 742,490
Corporate Facility (drawdowns) 525,000 -
Corporate Facility (repayments) (7,500) -
Global Facility and Woodlawn PF (repayments) (656,136) (88,499)
Bodangora PF (drawdowns) 156,800 1,825
Other movements
Additions to capitalised commitment fees (27,273) -
Expense of capitalised commitment fees 4,747 1,556
Net foreign currency exchange differences 609 (3,520)
Closing balance - 30 June 650,099 653,852
For
per
sona
l use
onl
y
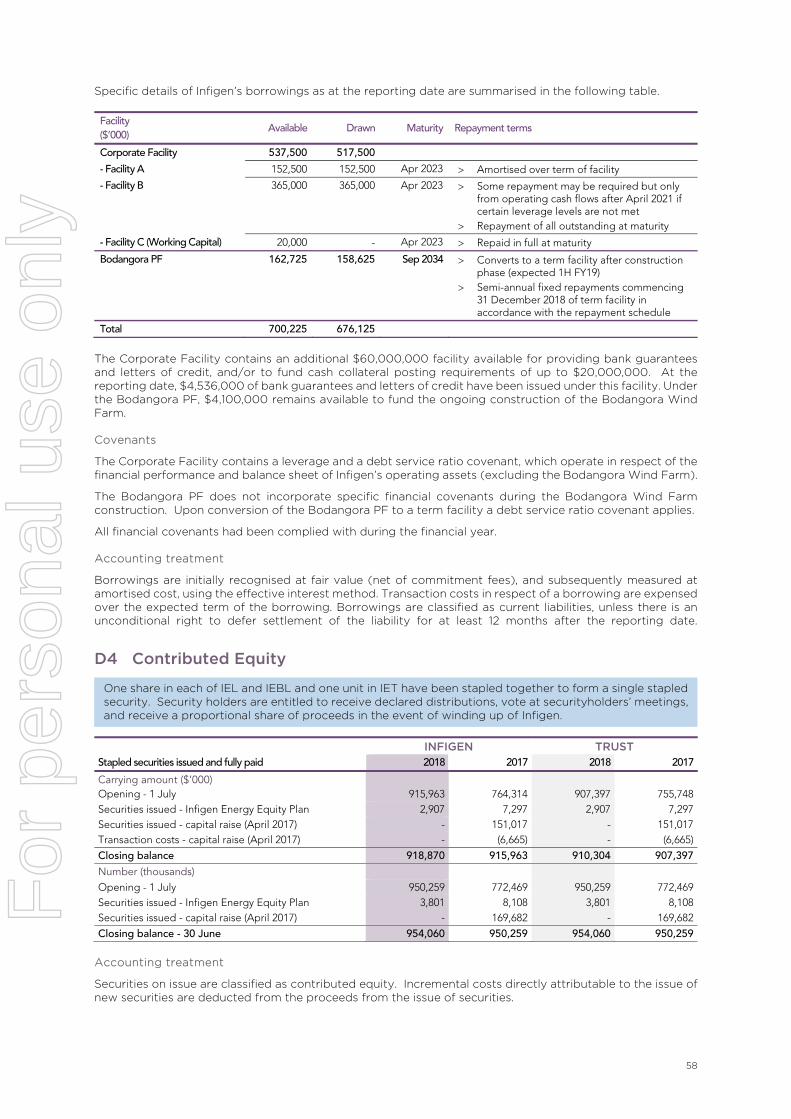
58
Specific details of Infigen’s borrowings as at the reporting date are summarised in the following table. Facility ($’000)
Available Drawn Maturity Repayment terms
Corporate Facility 537,500 517,500 - Facility A 152,500 152,500 Apr 2023 Amortised over term of facility
- Facility B 365,000 365,000 Apr 2023 Some repayment may be required but only from operating cash flows after April 2021 if certain leverage levels are not met
Repayment of all outstanding at maturity
- Facility C (Working Capital) 20,000 - Apr 2023 Repaid in full at maturity
Bodangora PF 162,725 158,625 Sep 2034 Converts to a term facility after construction phase (expected 1H FY19)
Semi-annual fixed repayments commencing 31 December 2018 of term facility in accordance with the repayment schedule
Total 700,225 676,125 The Corporate Facility contains an additional $60,000,000 facility available for providing bank guarantees and letters of credit, and/or to fund cash collateral posting requirements of up to $20,000,000. At the reporting date, $4,536,000 of bank guarantees and letters of credit have been issued under this facility. Under the Bodangora PF, $4,100,000 remains available to fund the ongoing construction of the Bodangora Wind Farm.
Covenants
The Corporate Facility contains a leverage and a debt service ratio covenant, which operate in respect of the financial performance and balance sheet of Infigen’s operating assets (excluding the Bodangora Wind Farm).
The Bodangora PF does not incorporate specific financial covenants during the Bodangora Wind Farm construction. Upon conversion of the Bodangora PF to a term facility a debt service ratio covenant applies.
All financial covenants had been complied with during the financial year.
Accounting treatment
Borrowings are initially recognised at fair value (net of commitment fees), and subsequently measured at amortised cost, using the effective interest method. Transaction costs in respect of a borrowing are expensed over the expected term of the borrowing. Borrowings are classified as current liabilities, unless there is an unconditional right to defer settlement of the liability for at least 12 months after the reporting date.
D4 Contributed Equity
One share in each of IEL and IEBL and one unit in IET have been stapled together to form a single stapled security. Security holders are entitled to receive declared distributions, vote at securityholders’ meetings, and receive a proportional share of proceeds in the event of winding up of Infigen.
INFIGEN TRUST Stapled securities issued and fully paid 2018 2017 2018 2017
Carrying amount ($’000) Opening - 1 July 915,963 764,314 907,397 755,748 Securities issued - Infigen Energy Equity Plan 2,907 7,297 2,907 7,297 Securities issued - capital raise (April 2017) - 151,017 - 151,017 Transaction costs - capital raise (April 2017) - (6,665) - (6,665)
Closing balance 918,870 915,963 910,304 907,397
Number (thousands) Opening - 1 July 950,259 772,469 950,259 772,469 Securities issued - Infigen Energy Equity Plan 3,801 8,108 3,801 8,108 Securities issued - capital raise (April 2017) - 169,682 - 169,682
Closing balance - 30 June 954,060 950,259 954,060 950,259
Accounting treatment
Securities on issue are classified as contributed equity. Incremental costs directly attributable to the issue of new securities are deducted from the proceeds from the issue of securities.
For
per
sona
l use
onl
y

INFIGEN ENERGY 2018 ANNUAL REPORT
59
E Financial Risk Management
This section discloses Infigen’s financial risk management activities. Effective financial risk management underpins Infigen’s strategic business objectives, and includes the use of financial instruments. Infigen’s business activities and use of financial instruments expose it to various risks which the Board seeks to mitigate to levels it determines appropriate by implementing specific policies and procedures.
E1 Financial Risk Summary
Risk type Definition Exposures Mitigation methods
Market risk - Electricity
The risk of fluctuations in the fair value or future cash flows of a financial instrument because of changes in electricity price
Electricity derivative contracts (including PPAs accounted for as derivative financial instruments)
The Multi-Channel RTM seeks to balance price, tenor, and risk, thereby managing earnings certainty and co-optimising production, contract, and spot exposures
Active energy market portfolio management: Quantitative Volumetric Hedging limits; Earnings at Risk analysis; strategic portfolio balancing; and daily compliance testing
Infigen undertakes analyses using in-house expertise and external consultancies to monitor market conditions and outlook
Infigen does not manage the fair value risk for electricity derivative contracts, as it does not affect the cash flows of the business
Market risk - Interest rate
The risk of fluctuations in the fair value or future cash flows of a financial instrument because of changes in market interest rates
Variable rate borrowings Interest rate derivatives
Interest rate derivative contracts to manage exposure to variable rate borrowings
Monitoring of hedge ratio Infigen does not manage the fair value risk for
interest derivative contracts, as it does not affect its cash flows
Speculative trading is prohibited
Liquidity risk The risk of not meeting obligations of financial liabilities
Payables Borrowings Derivative financial
liabilities
Monitoring and stress testing of cash flow and liquidity requirements
Consideration of refinancing options, and where appropriate, completion of refinancing in advance of maturity
Access to $94.5 million of unrestricted cash and a $20.0 million working capital facility (nil drawn at 30 June 2018)
Issue securities
Credit risk The risk of financial loss from a counterparty to a financial instrument failing to discharge an obligation
Cash and cash equivalents Trade receivables
(including the Trust’s related party loan receivable disclosed at Note G2)
Derivative financial assets
Established and regularly monitored counterparty credit rating and limit requirements
Counterparty collateral held (where appropriate) Infigen’s maximum exposure to credit risk at the
end of the reporting date is the carrying amount of financial assets (net of any allowances for losses) in the consolidated statement of financial position
For
per
sona
l use
onl
y

60
E2 Market Risk - Electricity Price
Sensitivity analysis - electricity derivative contracts
The following table discloses the sensitivity of Infigen’s other comprehensive income to a 10% change in electricity contract market futures prices (as it affects financial electricity instruments, including PPAs which are accounted for as electricity derivative contracts, and other electricity derivative contracts such as ASX futures and options) while holding all other variables constant. 10% is considered appropriate given industry standard benchmarks and historic volatility. Infigen’s electricity derivative contracts are designated as cash flow hedges. Their fair value movements are recorded in other comprehensive income.
INFIGEN ($’000) 2018 2017
Other comprehensive income - increase / (decrease): Electricity forward price +10% (13,959) (1,224) Electricity forward price -10% 13,959 1,224
E3 Market Risk - Interest Rate
Net borrowings exposure
The following table discloses the weighted average fixed rate of interest rate derivatives and fixed debt (both excluding margin) as at the reporting date and the next five reporting dates. Interest rate caps (which are out of the money) as at the reporting date are excluded from the below disclosure. As at the reporting date, the interest rate caps have a notional value of $11,200,000 and an average capped rate of 4.88%.
INFIGEN ($’000) 2018 2019 2020 2021 2022 2023
Interest rate swaps (Corporate Facility) 412,300 402,104 374,825 335,812 299,437 206,548 Interest rate swaps (Bodangora PF) 79,302 71,004 65,984 62,296 58,901 55,342 Fixed debt (Bodangora PF) 79,313 80,477 76,735 72,447 68,498 64,358
Total 570,915 553,585 517,544 470,555 426,836 326,248
Weighted average fixed rate (excluding margin) 2.44% 2.61% 2.65% 2.66% 2.67% 2.72%
Sensitivity analysis
The following table discloses the sensitivity of net profit before tax and other comprehensive income to a 100 basis points (bps) change in interest rates while holding all other variables constant. The effect on net profit is due to the exposure to variable rate borrowings offset by movements in the fair value of the ineffective portion of derivatives designated as cash flow hedges. The effect on other comprehensive income is due to the effective portion of fair value movements of derivatives designated as cash flow hedges.
INFIGEN ($’000) 2018 2017
Net profit before tax - increase / (decrease): + 100 bps (249) 1,280 - 100 bps 249 (1,280)
Other comprehensive income - increase / (decrease): + 100 bps 19,830 21,351 - 100 bps (19,830) (21,351)
For
per
sona
l use
onl
y

INFIGEN ENERGY 2018 ANNUAL REPORT
61
E4 Liquidity Risk
The following table discloses the undiscounted cash flow maturities of financial liabilities and derivative financial instruments.
Borrowings represent the contracted cash flows (including principal and interest payments) under the Corporate Facility and Bodangora PF (2017: Global Facility, Woodlawn Facility, and Bodangora PF) and have been determined by reference to the interest rate forward curves as at the reporting date.
Derivative financial instruments are presented on a net cash basis as they are settled on a net basis.
($’000) Less than
1 year 1 to 5 years Over 5 years Total
INFIGEN 2018 Borrowings 85,787 651,227 159,355 896,369 Payables 18,254 - - 18,254 Interest rate swaps (net settled) 2,260 2,682 642 5,584 Electricity derivatives (net settled) 894 - - 894
107,195 653,909 159,997 921,101
2017
Borrowings 103,597 421,863 198,329 723,789 Payables 19,786 - - 19,786 Interest rate swaps (net settled) 21,975 47,419 (514) 68,880 Electricity derivatives (net settled) 2,105 888 - 2,993
147,463 470,170 197,815 815,448
TRUST 2018 Amounts due to related parties 698 - - 698
2017
Amounts due to related parties 5,101 - - 5,101
E5 Fair Value of Financial Assets and Liabilities
Financial assets and liabilities recognised and measured at fair value on a recurring basis are disclosed in the following table. An explanation of fair value levels is provided in the following commentary.
($’000)
INFIGEN Fair value level 2018 2017
Current assets
Electricity derivative contracts 2 - 1,551 Electricity derivative contracts 3 2,080 - 2,080 1,551
Non-current assets
Electricity derivative contracts 2 1,007 - Electricity derivative contracts 3 9,684 - Interest rate derivative contracts 2 - 2 10,691 2 Current liabilities
Foreign currency derivative contracts 2 - 509 Electricity derivative contracts 2 14 2,105 Electricity derivative contracts 3 880 - Interest rate derivative contracts 2 2,356 25,504 3,250 28,118
Non-current liabilities Electricity derivative contracts 2 - 888 Interest rate derivative contracts 2 2,981 43,376
2,981 44,264
Amounts have not been offset as no legally enforceable right of set-off presently exists.
For
per
sona
l use
onl
y

62
Reconciliation of Level 3 financial assets and liabilities
INFIGEN ($’000) 2018 2017
Opening balance - 1 July - -
Net movement in fair value of new instruments recognised in other comprehensive income during the year
10,884 -
Closing balance - 30 June 10,884 -
There were no transfers between the fair value levels during the year.
Fair value levels
Financial assets and liabilities are classified and grouped according to the degree in which their calculation inputs are observable - Level 1 being completely observable (requiring no estimate and judgement) and Level 3 being unobservable (and requiring significant estimate and judgement). The levels are summarised as follows:
Level 1: measurement is derived from quoted market prices in active markets for identical assets or liabilities;
Level 2: measurement is derived from inputs not traded in active markets, but calculated with significant inputs from observable market data; and
Level 3: measurement is derived from significant inputs based on non-observable market data.
Significant estimate and judgement is required in assessing the fair value of financial assets and liabilities that use Level 2 or 3 measurements. The assumptions used in making these significant estimates is often based on long-term future events, and may therefore be subjective. Changes in the underlying estimates and judgements may cause a variation to the carrying values. The following table summarises the methods used to estimate fair value.
Instrument Fair value level Fair value methodology
Electricity derivative contracts 2 Calculates the present value of estimated future cash flows accounting for
market forward prices
Interest rate derivative contracts 2
Discounts the present value of the estimated future cash flows using the applicable observable market yield curves having regard to timing of cash flows
Electricity derivative contracts 3
Uses a discounted cash flow methodology which reflects differences in contract price and long-term forecast energy pool prices (not observable in the market), estimation of electricity volumes, the discount rate, and related credit adjustments
Accounting treatment
Financial assets and liabilities recognised and measured at fair value on a recurring basis, consist of derivative financial instruments.
Fair value gains or losses relating to designated effective hedges are recognised in other comprehensive income and held in a separate hedging reserve in equity. Fair value gains or losses on derivatives designated as ineffective hedges are recognised in net profit.
The portion of the derivative contracts expected to be settled within 12 months are classified as current assets or liabilities, and those that are not, are classified as non-current assets or liabilities.
Other financial assets and liabilities (including cash, receivables, payables, and borrowings) are not measured at fair value, but in accordance with applicable accounting standards and Infigen’s accounting policies. Infigen has assessed that their carrying values approximate their fair values.
For
per
sona
l use
onl
y

INFIGEN ENERGY 2018 ANNUAL REPORT
63
F GROUP STRUCTURE
F1 Controlled Entities
Controlled entities that form the Cross-Guarantee Group are marked as [#] and those that form the Tax Consolidated Group are marked as [*]. Additional disclosure is located at Note F2 and B5 respectively.
Name of entity Key Country of incorporation
Ownership interest
2018 2017
Parent entity
Infigen Energy Limited * # Australia
Other stapled entities
Infigen Energy (Bermuda) Limited Bermuda
Infigen Energy Trust Australia
Subsidiaries of the parent and other stapled entities
Batchelor Solar Pty Limited * Australia 100% -
BBWP Holdings (Bermuda) Limited Bermuda 100% 100%
Bluff Solar Farm Pty Limited * Australia 100% 100%
Bodangora Wind Farm Pty Limited * Australia 100% 100%
Bogan River Solar Farm Pty Ltd * Australia 100% 100%
Bowen Solar Farm Pty Limited * Australia 100% 100%
BWF Finance Pty Limited * Australia 100% 100%
BWF Holdings Pty Limited * Australia 100% 100%
Capital East Solar Pty Limited * Australia 100% 100%
Capital Solar Farm Pty Limited * Australia 100% 100%
Capital Wind Farm (BB) Trust * Australia 100% 100%
Capital Wind Farm 2 Pty Limited * Australia 100% 100%
Capital Wind Farm Holdings Pty Limited * # Australia 100% 100%
Cherry Tree Wind Farm Pty Ltd * Australia 100% 100%
CREP Land Holdings Pty Limited * Australia 100% 100%
CS CWF Trust * Australia 100% 100%
Flyers Creek Wind Farm Pty Ltd * Australia 100% 100%
Infigen Energy (Malta) Limited Malta 100% 100%
Infigen Energy (US) Pty Limited * Australia 100% 100%
Infigen Energy (US) 2 Pty Limited * Australia 100% 100%
Infigen Energy Custodian Services Pty Limited * Australia 100% 100%
Infigen Energy Development Holdings Pty Limited * Australia 100% 100%
Infigen Energy Development Pty Ltd * Australia 100% 100%
Infigen Energy Europe Pty Limited * Australia 100% 100%
Infigen Energy Europe 2 Pty Limited * Australia 100% 100%
Infigen Energy Europe 3 Pty Limited * Australia 100% 100%
Infigen Energy Europe 4 Pty Limited * Australia 100% 100%
Infigen Energy Europe 5 Pty Limited * Australia 100% 100%
Infigen Energy Finance (Australia) Pty Limited * Australia 100% 100%
Infigen Energy Finance (Germany) Pty Limited * Australia 100% 100%
Infigen Energy Finance (Lux) S.à.r.l Luxembourg 100% 100%
Infigen Energy Germany Holdings Pty Limited * Australia 100% 100%
Infigen Energy Germany Holdings 2 Pty Limited * Australia 100% 100%
Infigen Energy Germany Holdings 3 Pty Limited * Australia 100% 100%
Infigen Energy Holdings Pty Limited * Australia 100% 100%
For
per
sona
l use
onl
y

64
Name of entity Key Country of incorporation
Ownership interest
2018 2017
Infigen Energy Holdings S.à.r.l. Luxembourg 100% 100%
Infigen Energy Investments Pty Limited * Australia 100% 100%
Infigen Energy Markets Pty Limited * Australia 100% 100%
Infigen Energy Niederrhein Pty Limited * Australia 100% 100%
Infigen Energy NT Solar Holdings Pty Limited * Australia 100% -
Infigen Energy NT Solar Pty Limited * Australia 100% -
Infigen Energy RE Limited * Australia 100% 100%
Infigen Energy Services Holdings Pty Limited * Australia 100% 100%
Infigen Energy Services Pty Limited * Australia 100% 100%
Infigen Energy T Services Pty Limited * Australia 100% 100%
Infigen Energy US Corporation USA 100% 100%
Infigen Energy US Holdings LLC USA 100% 100%
Infigen Energy US Development Corporation USA 100% 100%
Infigen Energy US Holdings Pty Limited * Australia 100% 100%
Infigen Energy US Partnership USA 100% 100%
Lake Bonney Holdings Pty Limited * # Australia 100% 100%
Lake Bonney 2 Holdings Pty Limited * Australia 100% 100%
Lake Bonney Wind Power Pty Limited * Australia 100% 100%
Lake Bonney Wind Power 2 Pty Limited * Australia 100% 100%
Lake Bonney Wind Power 3 Pty Limited * Australia 100% 100%
Manton Solar Pty Limited * Australia 100% -
NPP LB2 LLC * USA 100% 100%
NPP Projects I, LLC * USA 100% 100%
NPP Projects V, LLC * USA 100% 100%
NPP Walkaway Pty Limited * Australia 100% 100%
NPP Walkaway Trust * Australia 100% 100%
Renewable Energy Constructions Pty Limited * Australia 100% 100%
Renewable Power Ventures Pty Ltd * # Australia 100% 100%
RPV Investment Trust * Australia 100% 100%
Walkaway (BB) Pty Limited * Australia 100% 100%
Walkaway (CS) Pty Limited * Australia 100% 100%
Walkaway Wind Power Pty Limited * # Australia 100% 100%
Woakwine Wind Farm Pty Ltd * Australia 100% 100%
Woodlawn Wind Pty Ltd * Australia 100% 100%
WWCS Finance Pty Limited * Australia 100% 100%
WWCS Holdings Pty Limited * Australia 100% 100%
WWP Holdings Pty Limited * # Australia 100% 100%
Subsidiaries of the Trust
CS Walkaway Trust Australia 100% 100%
Walkaway (BB) Trust Australia 100% 100%
For
per
sona
l use
onl
y

INFIGEN ENERGY 2018 ANNUAL REPORT
65
F2 Deed of Cross Guarantee
Certain Infigen entities are party to a deed of cross guarantee made in accordance with the terms of ASIC Corporations (Wholly-owned Companies) Instrument 2016/785 (Cross-Guarantee Group). Cross-Guarantee Group members are granted relief from the requirement to prepare and lodge individual audited financial reports and legally guarantee the liabilities and obligations of each other.
Changes during the year
On 17 April 2018, a revocation deed was lodged with ASIC to remove Renewable Power Ventures Pty Ltd and Walkaway Wind Power Pty Limited from the Cross-Guarantee Group. Under the terms of the ASIC Corporations (Wholly-owned Companies) Instrument 2016/785, the deed becomes effective six months from the lodgement date. Accordingly, these two entities continue to be included in the financial information of the Cross-Guarantee Group for the financial year 2018.
Financial information of the Cross-Guarantee Group
Consolidated statement of comprehensive income
CROSS-GUARANTEE GROUP
($’000) 2018 2017
Revenue 74,618 73,588
Related party payable forgiven 16,091 -
Operating expenses (16,798) (15,399)
Unrealised foreign exchange (loss) / gain (3,202) 2,708
Depreciation and amortisation expense (23,157) (23,146)
Interest expense - (18,160)
Other finance costs (728) (282)
Profit before income tax 46,824 19,309
Income tax benefit / (expense) 25,800 (7,141)
Net profit for the year 72,624 12,168
Other comprehensive income that may not be reclassified to net profit: Changes in the fair value of cash flow hedges, net of tax 510 -
Total comprehensive income for the year, net of tax 73,134 12,168
For
per
sona
l use
onl
y

66
Consolidated statement of financial position
CROSS-GUARANTEE GROUP ($’000) 2018 2017
Current assets Cash and cash equivalents 110 -
Receivables 1,368 16,280
Inventories 7,189 7,106
Total current assets 8,667 23,386
Non-current assets
Receivables 773,574 810,229
Shares in controlled entities 73,559 73,559
Property, plant and equipment 312,274 332,937
Deferred tax assets 61,671 45,774
Intangible assets 52,918 55,150
Total non-current assets 1,273,996 1,317,649
Total assets 1,282,663 1,341,035
Current liabilities Payables 1,155 563
Derivative financial instruments - 509
Total current liabilities 1,155 1,072
Non-current liabilities Payables 1,426,893 1,558,543
Provisions 4,062 3,999
Total non-current liabilities 1,430,955 1,562,542
Total liabilities 1,432,110 1,563,614
Net assets (149,447) (222,579)
Equity Contributed equity 2,305 2,305
Reserves (23,005) (23,513)
Retained losses (128,747) (201,371)
Total equity (149,447) (222,579)
For
per
sona
l use
onl
y

INFIGEN ENERGY 2018 ANNUAL REPORT
67
F3 Parent Entity Disclosure
IEL is the parent of the Infigen stapled structure and for the purposes of preparing Infigen’s consolidated financial statements.
The following table discloses IEL’s financial information, which has been prepared on a basis consistent with Infigen’s consolidated financial statements.
($’000)
IEL 2018 2017
Assets
Current assets - -
Non-current assets 886,128 728,716
886,128 728,716
Liabilities Current liabilities - -
Non-current liabilities 1,129,204 1,003,627
1,129,204 1,003,627
Equity Issued capital 2,305 2,305
Reserves - (356)
Retained losses (245,380) (276,860)
(243,075) (274,911)
Net profit for the year 31,480 324
Total comprehensive income 31,124 324
Additional disclosure
IEL has a net asset deficiency of $243,075,000 at 30 June 2018 (2017: $274,911,000). This is principally due to $849,712,000 (2017: $659,791,000) of undiscounted long-term funding provided by IET. When combined with the other stapled entities, IEL has positive net current assets and net total assets.
IEL is part of the Cross-Guarantee Group, the parties of which, legally guarantee the liabilities and obligations of each other. Additional disclosure is located at Note F2.
The Trust
IET is the parent of the Trust for the purposes of preparing the Trust’s consolidated financial statements. IET’s controlled entities contain no material assets or liabilities. The Trust’s consolidated financial information shown in the consolidated financial statements therefore reflect IET standalone financial information.
For
per
sona
l use
onl
y
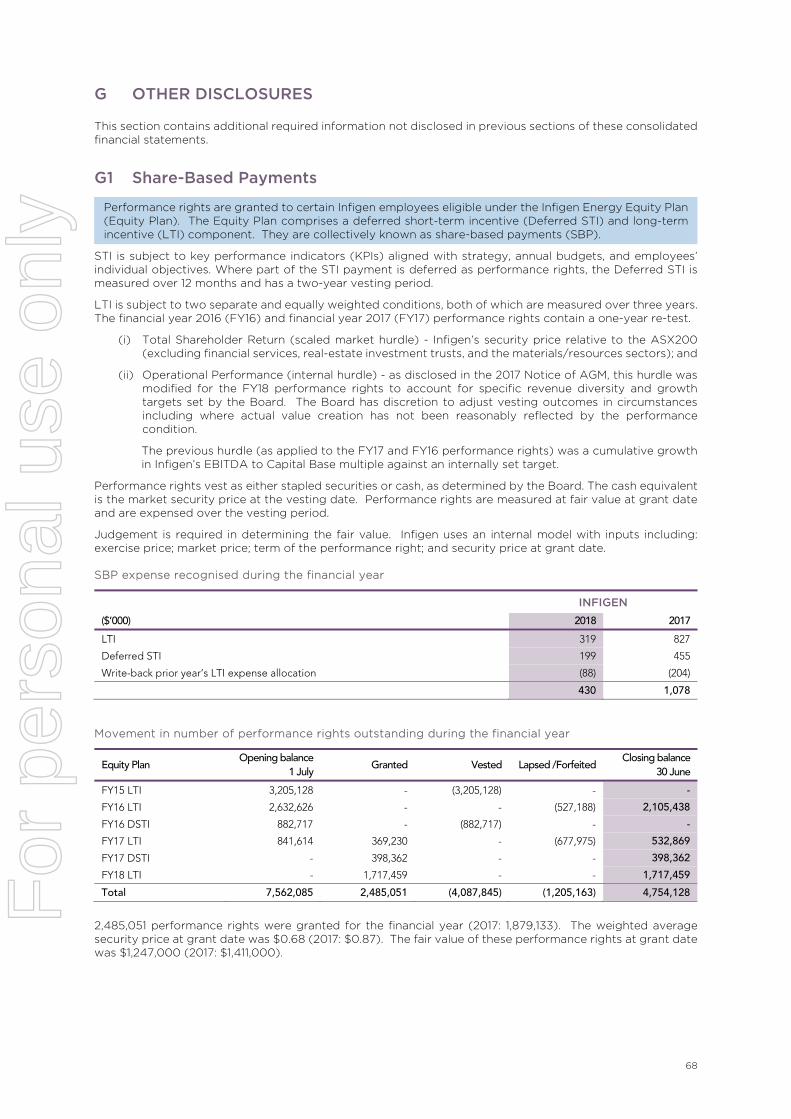
68
G OTHER DISCLOSURES
This section contains additional required information not disclosed in previous sections of these consolidated financial statements.
G1 Share-Based Payments
Performance rights are granted to certain Infigen employees eligible under the Infigen Energy Equity Plan (Equity Plan). The Equity Plan comprises a deferred short-term incentive (Deferred STI) and long-term incentive (LTI) component. They are collectively known as share-based payments (SBP).
STI is subject to key performance indicators (KPIs) aligned with strategy, annual budgets, and employees’ individual objectives. Where part of the STI payment is deferred as performance rights, the Deferred STI is measured over 12 months and has a two-year vesting period.
LTI is subject to two separate and equally weighted conditions, both of which are measured over three years. The financial year 2016 (FY16) and financial year 2017 (FY17) performance rights contain a one-year re-test.
(i) Total Shareholder Return (scaled market hurdle) - Infigen’s security price relative to the ASX200 (excluding financial services, real-estate investment trusts, and the materials/resources sectors); and
(ii) Operational Performance (internal hurdle) - as disclosed in the 2017 Notice of AGM, this hurdle was modified for the FY18 performance rights to account for specific revenue diversity and growth targets set by the Board. The Board has discretion to adjust vesting outcomes in circumstances including where actual value creation has not been reasonably reflected by the performance condition.
The previous hurdle (as applied to the FY17 and FY16 performance rights) was a cumulative growth in Infigen’s EBITDA to Capital Base multiple against an internally set target.
Performance rights vest as either stapled securities or cash, as determined by the Board. The cash equivalent is the market security price at the vesting date. Performance rights are measured at fair value at grant date and are expensed over the vesting period.
Judgement is required in determining the fair value. Infigen uses an internal model with inputs including: exercise price; market price; term of the performance right; and security price at grant date.
SBP expense recognised during the financial year
($’000)
INFIGEN 2018 2017
LTI 319 827
Deferred STI 199 455
Write-back prior year’s LTI expense allocation (88) (204)
430 1,078
Movement in number of performance rights outstanding during the financial year
Equity Plan Opening balance
1 July Granted Vested Lapsed /Forfeited
Closing balance 30 June
FY15 LTI 3,205,128 - (3,205,128) - -
FY16 LTI 2,632,626 - - (527,188) 2,105,438
FY16 DSTI 882,717 - (882,717) - -
FY17 LTI 841,614 369,230 - (677,975) 532,869
FY17 DSTI - 398,362 - - 398,362
FY18 LTI - 1,717,459 - - 1,717,459
Total 7,562,085 2,485,051 (4,087,845) (1,205,163) 4,754,128
2,485,051 performance rights were granted for the financial year (2017: 1,879,133). The weighted average security price at grant date was $0.68 (2017: $0.87). The fair value of these performance rights at grant date was $1,247,000 (2017: $1,411,000).
For
per
sona
l use
onl
y
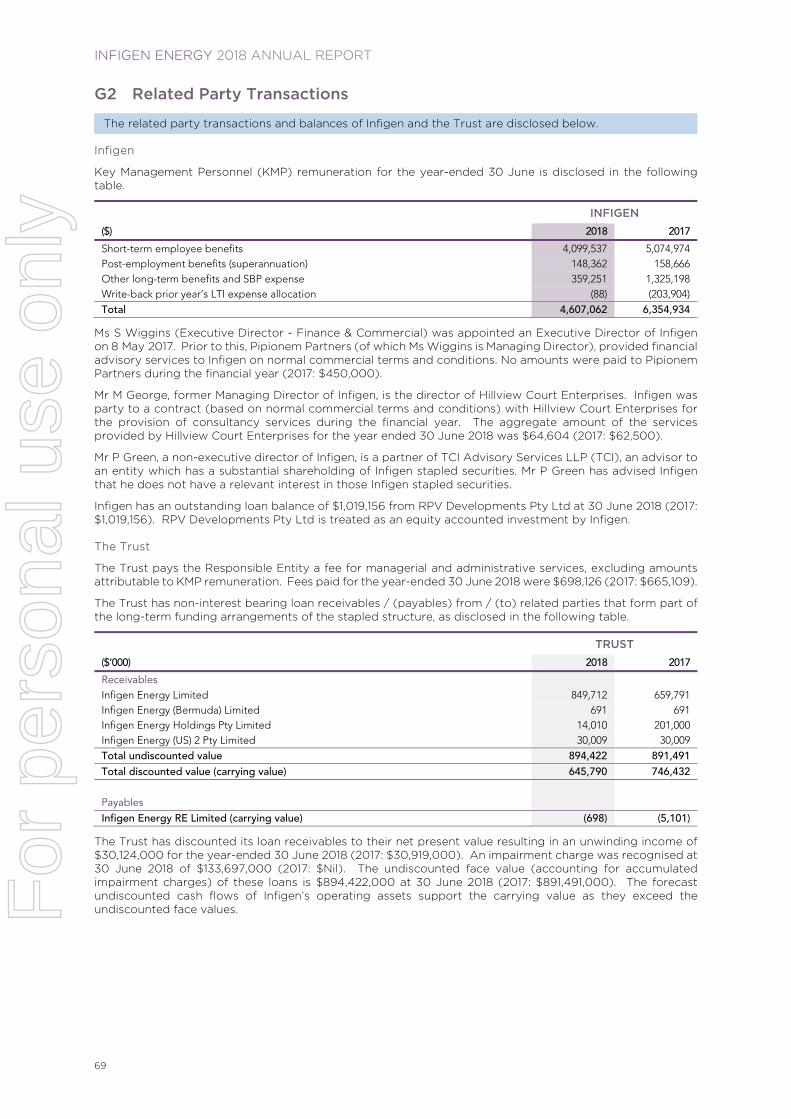
INFIGEN ENERGY 2018 ANNUAL REPORT
69
G2 Related Party Transactions
The related party transactions and balances of Infigen and the Trust are disclosed below.
Infigen
Key Management Personnel (KMP) remuneration for the year-ended 30 June is disclosed in the following table.
INFIGEN ($) 2018 2017
Short-term employee benefits 4,099,537 5,074,974 Post-employment benefits (superannuation) 148,362 158,666 Other long-term benefits and SBP expense 359,251 1,325,198 Write-back prior year’s LTI expense allocation (88) (203,904) Total 4,607,062 6,354,934
Ms S Wiggins (Executive Director - Finance & Commercial) was appointed an Executive Director of Infigen on 8 May 2017. Prior to this, Pipionem Partners (of which Ms Wiggins is Managing Director), provided financial advisory services to Infigen on normal commercial terms and conditions. No amounts were paid to Pipionem Partners during the financial year (2017: $450,000).
Mr M George, former Managing Director of Infigen, is the director of Hillview Court Enterprises. Infigen was party to a contract (based on normal commercial terms and conditions) with Hillview Court Enterprises for the provision of consultancy services during the financial year. The aggregate amount of the services provided by Hillview Court Enterprises for the year ended 30 June 2018 was $64,604 (2017: $62,500).
Mr P Green, a non-executive director of Infigen, is a partner of TCI Advisory Services LLP (TCI), an advisor to an entity which has a substantial shareholding of Infigen stapled securities. Mr P Green has advised Infigen that he does not have a relevant interest in those Infigen stapled securities.
Infigen has an outstanding loan balance of $1,019,156 from RPV Developments Pty Ltd at 30 June 2018 (2017: $1,019,156). RPV Developments Pty Ltd is treated as an equity accounted investment by Infigen.
The Trust
The Trust pays the Responsible Entity a fee for managerial and administrative services, excluding amounts attributable to KMP remuneration. Fees paid for the year-ended 30 June 2018 were $698,126 (2017: $665,109).
The Trust has non-interest bearing loan receivables / (payables) from / (to) related parties that form part of the long-term funding arrangements of the stapled structure, as disclosed in the following table.
TRUST
($’000) 2018 2017
Receivables Infigen Energy Limited 849,712 659,791 Infigen Energy (Bermuda) Limited 691 691 Infigen Energy Holdings Pty Limited 14,010 201,000 Infigen Energy (US) 2 Pty Limited 30,009 30,009 Total undiscounted value 894,422 891,491 Total discounted value (carrying value) 645,790 746,432 Payables
Infigen Energy RE Limited (carrying value) (698) (5,101)
The Trust has discounted its loan receivables to their net present value resulting in an unwinding income of $30,124,000 for the year-ended 30 June 2018 (2017: $30,919,000). An impairment charge was recognised at 30 June 2018 of $133,697,000 (2017: $Nil). The undiscounted face value (accounting for accumulated impairment charges) of these loans is $894,422,000 at 30 June 2018 (2017: $891,491,000). The forecast undiscounted cash flows of Infigen’s operating assets support the carrying value as they exceed the undiscounted face values. F
or p
erso
nal u
se o
nly

70
G3 Cash Flow Information
Reconciliation of net profit to net cash inflow from operating activities
INFIGEN TRUST
($’000) 2018 2017 2018 2017
Net profit for the year 45,673 32,264 (104,238) 31,220
Adjustments
Early termination of interest rate swaps 43,295 - - -
Depreciation and amortisation 51,444 51,763 - -
Fair value gain on acquisition of controlled entity - (5,765) - -
Unwind of discount on related party loan receivables - - (30,124) (30,919)
Impairment of financial assets - - 133,697 -
Impairment of development assets 227 - - -
Unrealised foreign exchange (gain) / loss (735) (346) (1) 843
Amortisation of share based payments expense 430 1,078 - - Amortisation of borrowing costs, and one-off upfront and early expense of fees associated with the Refinancing 7,456 1,505 - -
Share of profits of equity accounted investments 33 8 - -
Accretion of decommissioning provisions 123 121 - -
Income tax (benefit) / expense (26,144) 14,786 - -
Net cash inflow/(outflow) from operating activities before changes in working capital 121,802 95,414 (666) 1,144
Changes in working capital
(Increase) / decrease in receivables and inventory (19,556) 1,622 - (24)
(Decrease) / increase in payables (1,800) 1,634 697 (1,013)
Net cash inflow from operating activities 100,446 98,670 31 107
Net debt reconciliation
($’000) Cash
Borrowings due:
within 1 year after 1 year Total
Opening balance - 1 July 2017 251,786 (83,252) (574,106) (405,572)
Cash flows (106,888) 42,033 (60,197) (125,052)
Other non-cash movements - - (603) (603)
Closing balance - 30 June 2018 144,898 (41,219) (634,906) (531,227)
For
per
sona
l use
onl
y

INFIGEN ENERGY 2018 ANNUAL REPORT
71
G4 Reserves
Infigen’s three reserves accounts are summarised in the following table.
Carrying values
($’000)
INFIGEN
2018 2017
Hedging reserve 4,460 (42,374)
Acquisition reserve (47,675) (47,675)
SBP reserve (4,601) (1,506) (47,816) (91,555)
G5 Auditor’s Remuneration
PricewaterhouseCoopers (PwC) continue to act as the independent auditor and has provided audit and other services to Infigen and the Trust during the financial year. Fees paid or payable to PwC for services provided are disclosed in the following table.
Amounts paid or payable
INFIGEN TRUST
($) 2018 2017 2018 2017
Audit and other assurance services
Audit of financial statements 184,000 196,000 18,857 20,000
Audit of subsidiaries’ financial statements 161,000 162,000 - -
Other assurance services 30,000 32,000 - - 375,000 390,000 18,857 20,000
Non-audit services
Taxation related services 91,179 73,435 - -
Transaction and advisory services 396,946 372,193 - 229,393 488,125 445,628 - 229,393
Total auditor’s remuneration 863,125 835,628 18,857 249,393
G6 Inventory
One LGC represents 1 MWh of generation from renewable energy generators.
INFIGEN LGCs 2018 2017
Carrying value ($’000) 43,327 26,951
Volume 581,121 374,300
Reserve Description and accounting treatment
Hedging reserve Records fair value movements in cash flow hedges to the extent the cash flow hedges are deemed effective. The balance is reclassified to net profit when the hedged expense is recognised. Ineffective portions of cash flow hedges are recognised in net profit immediately.
Acquisition reserve Records the acquisition of non-controlling interests in entities over which Infigen already exerted control. The carrying value is the difference between the purchase consideration and the amount by which the non-controlling interest is adjusted.
SBP reserve Recognises the SBP expense. Amounts are transferred to contributed equity upon the performance rights vesting.
For
per
sona
l use
onl
y

72
G7 Contingent Liabilities
Contingent liabilities not recognised in the consolidated statement of financial position primarily comprise financial guarantees for AEMO, counterparties and for certain grid connections.
($’000)
INFIGEN
2018 2017
Letters of credit 14,156 7,964
The Trust
The Trust had no contingent liabilities as at 30 June 2018 (2017: Nil).
G8 Events Occurring after the Reporting Period
On 14 August 2018 Infigen signed an agreement with Tesla Motors Australia Pty Ltd to develop a 25 MW / 52 MWh Battery Energy Storage System (BESS) adjacent to the Lake Bonney Wind Farm in South Australia, with an estimated project cost of $38,000,000. The South Australian Government and the Australian Renewable Energy Agency have agreed to commit $5,000,000 each in grant funding ($10,000,000 in total). The BESS is expected to commence operations in 2H FY19.
There were no other transactions or events of a material or unusual nature, not otherwise dealt with in this report, likely to affect significantly the operations or affairs of Infigen or the Trust in future financial periods.
For
per
sona
l use
onl
y

INFIGEN ENERGY 2018 ANNUAL REPORT
73
DIRECTORS’ DECLARATION In the opinion of the Directors of Infigen Energy Limited and the Directors of the Responsible Entity of Infigen Energy Trust, Infigen Energy RE Limited (collectively referred to as ‘the Directors’):
a) the financial statements and notes of Infigen and the Trust set out on pages 43 to 72 are in accordance with the Corporations Act 2001, including:
(i) complying with Accounting Standards, the Corporations Regulations 2001 and other mandatory professional reporting requirements; and
(ii) giving a true and fair view of Infigen’s and the Trust’s consolidated financial position as at 30 June 2018 and of their performance for the year ended on that date;
b) there are reasonable grounds to believe that both Infigen and the Trust will be able to pay their debts as and when they become due and payable; and
c) the financial statements also comply with International Financial Reporting Standards as issued by the International Accounting Standards Board.
The Directors have been given the declarations of the Chief Executive Officer and the Chief Financial Officer required by section 295A of the Corporations Act 2001.
This declaration is made in accordance with a resolution of the Directors pursuant to section 295(5) of the Corporations Act 2001.
On behalf of the Directors of IEL and IERL:
Leonard Gill
Chairman
Ross Rolfe AO
Chief Executive Officer / Managing Director
For
per
sona
l use
onl
y

PricewaterhouseCoopers, ABN 52 780 433 757 One International Towers Sydney, Watermans Quay, Barangaroo, GPO BOX 2650, SYDNEY NSW 2001 T: +61 2 8266 0000, F: +61 2 8266 9999, www.pwc.com.au Level 11, 1PSQ, 169 Macquarie Street, Parramatta NSW 2150, PO Box 1155 Parramatta NSW 2124 T: +61 2 9659 2476, F: +61 2 8266 9999, www.pwc.com.au
Liability limited by a scheme approved under Professional Standards Legislation.
Independent auditor’s report To the stapled security holders of Infigen Energy Limited and the unit holders of Infigen Energy Trust
Report on the audit of the financial reports
Our opinion In our opinion:
The accompanying financial reports of Infigen Energy Limited (“the Company” or “IEL”) and its controlled entities (together “Infigen” or “the Group”), and Infigen Energy Trust and its controlled entities (together “Trust”) are in accordance with the Corporations Act 2001, including::
(a) giving a true and fair view of the financial positions of Infigen and Trust as at 30 June 2018 and their financial performance for the year then ended
(b) complying with Australian Accounting Standards and the Corporations Regulations 2001.
What we have audited The financial reports of Infigen and Trust comprises:
• the consolidated statements of financial position as at 30 June 2018 • the consolidated statements of comprehensive income for the year then ended • the consolidated statements of changes in equity for the year then ended • the consolidated statements of cash flow for the year then ended • the notes to the consolidated financial statements, which include a summary of significant
accounting policies • the directors’ declaration.
Basis for opinion We conducted our audit in accordance with Australian Auditing Standards. Our responsibilities under those standards are further described in the Auditor’s responsibilities for the audit of the financial report section of our report.
We believe that the audit evidence we have obtained is sufficient and appropriate to provide a basis for our opinion.
Independence We are independent of the Group and the Trust in accordance with the auditor independence requirements of the Corporations Act 2001 and the ethical requirements of the Accounting Professional and Ethical Standards Board’s APES 110 Code of Ethics for Professional Accountants (the Code) that are relevant to our audit of the financial reports in Australia. We have also fulfilled our other ethical responsibilities in accordance with the Code.
74
For
per
sona
l use
onl
y

Our audit approach An audit is designed to provide reasonable assurance about whether the financial report is free from material misstatement. Misstatements may arise due to fraud or error. They are considered material if individually or in aggregate, they could reasonably be expected to influence the economic decisions of users taken on the basis of the financial report.
We tailored the scope of our audit to ensure that we performed enough work to be able to give an opinion on the financial report as a whole, taking into account the geographic and management structure of Infigen and Trust, their accounting processes and controls and the industry in which they operate.
The structure of Infigen is commonly referred to as a 'stapled group.' In a stapled group the securities of two or more entities are 'stapled' together and cannot be traded separately. In the case of Infigen, the shares in IEL have been stapled to the units in Trust. For the purposes of consolidation accounting, IEL is 'deemed' the parent and the consolidated report reflects the consolidation of IEL and its controlled entities, and Trust.
75
For
per
sona
l use
onl
y

Materiality of the Group Audit scope of the Group Key audit matters
• For the purpose of our audit of the Group we used overall materiality of $4.0 million, which represents approximately 2.5% of earnings before interest, tax, depreciation and amortization (EBITDA) of Infigen.
• We applied this threshold, together with qualitative considerations, to determine the scope of our audit and the nature, timing and extent of our audit procedures and to evaluate the effect of misstatements on the financial report as a whole.
• We chose EBITDA because, in our view, it is the benchmark against which performance is most commonly measured. It also closely represents operating cash flow and underlying earnings. EBITDA is a generally accepted benchmark.
• We chose a 2.5% threshold based on our professional judgement, noting it is within the range of commonly acceptable thresholds.
• Our audit focused on where the Group made subjective judgements; for example, significant accounting estimates involving assumptions and inherently uncertain future events.
• Amongst other relevant topics, we communicated the following key audit matters to the Audit and Risk Committee:
Infigen
− Recoverability of the net deferred tax asset
− Recoverability of development assets
− Valuation of electricity derivatives
Trust − Recoverability of related
party receivables
• These are further described in the Key audit matters section of our report.
76
For
per
sona
l use
onl
y

Key audit matters Key audit matters are those matters that, in our professional judgement, were of most significance in our audit of the financial reports for the current period and were determined separately for Infigen and Trust. Relevant amounts listed for each part of the stapled group represent balances as they are presented in the financial reports and should not be aggregated. The key audit matters were addressed in the context of our audit of the financial reports as a whole, and in forming our opinions thereon, and we do not provide a separate opinion on these matters. Further, any commentary on the outcomes of a particular audit procedure are made in that context. Key audit matter How our audit addressed the key audit matter
Recoverability of the net deferred tax asset Refer to note B5
Infigen - $26.4m Trust - the KAM is not applicable as the Trust distributes any income at the end of each year and is taxed in the hands of the unitholders as a Trust Distribution
The recognition and measurement of deferred tax assets was a key audit matter as there was significant judgement required by Infigen in assessing whether there will be sufficient future taxable profits to utilise the available tax losses. Additional tax losses have been recognised as deferred tax assets during the year.
We obtained the Group’s model for forecast taxable income supporting the recognition of the deferred tax asset and assessed whether the key assumptions were consistent with the Group’s strategy. We tested selected inputs used in the model regarding production, pricing and expenses. We also checked the consistency of the forecast taxable income with the Board approved budgets. We assessed the contributing factors for recognition of previously unrecognised tax losses by evaluating Infigen’s assessment.
Recoverability of development assets Refer to note C2 Infigen - $29.3m Trust - the KAM is not applicable as the Trust does not invest in development assets
Australian Accounting Standards require an annual assessment of whether there should be an impairment of a development asset. This requirement is based on development assets not being ready for use, and classified as an intangible asset. There were significant judgements made by Infigen during the impairment assessment about the future results of the business and the wider economic environment in which Infigen operates.
We evaluated Infigen’s estimate of the recoverable amount in order to challenge Infigen’s assumptions. Specific work included:
• Evaluated the appropriateness of existing approvals for the continuing development of projects.
• Assessed the valuation model developed by
Infigen to evaluate the recoverable value of the projects.
77
For
per
sona
l use
onl
y
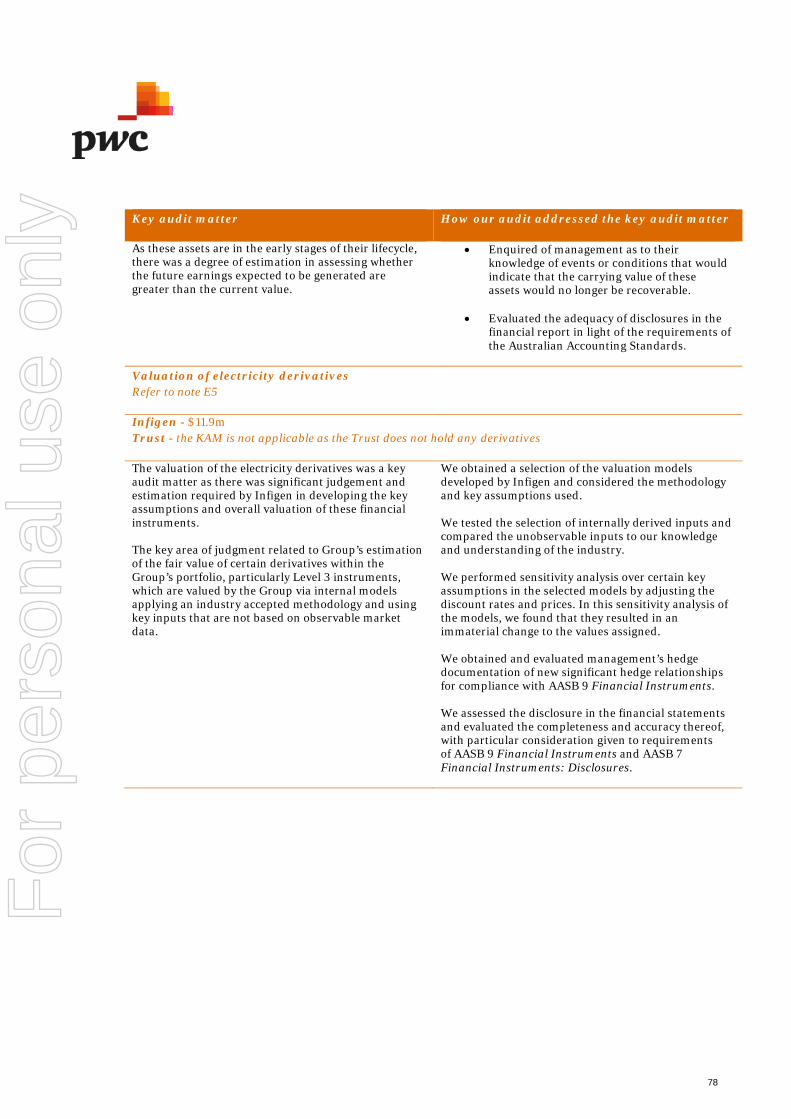
Key audit matter How our audit addressed the key audit matter
As these assets are in the early stages of their lifecycle, there was a degree of estimation in assessing whether the future earnings expected to be generated are greater than the current value.
• Enquired of management as to their knowledge of events or conditions that would indicate that the carrying value of these assets would no longer be recoverable.
• Evaluated the adequacy of disclosures in the
financial report in light of the requirements of the Australian Accounting Standards.
Valuation of electricity derivatives Refer to note E5
Infigen - $11.9m Trust - the KAM is not applicable as the Trust does not hold any derivatives
The valuation of the electricity derivatives was a key audit matter as there was significant judgement and estimation required by Infigen in developing the key assumptions and overall valuation of these financial instruments. The key area of judgment related to Group’s estimation of the fair value of certain derivatives within the Group’s portfolio, particularly Level 3 instruments, which are valued by the Group via internal models applying an industry accepted methodology and using key inputs that are not based on observable market data.
We obtained a selection of the valuation models developed by Infigen and considered the methodology and key assumptions used. We tested the selection of internally derived inputs and compared the unobservable inputs to our knowledge and understanding of the industry. We performed sensitivity analysis over certain key assumptions in the selected models by adjusting the discount rates and prices. In this sensitivity analysis of the models, we found that they resulted in an immaterial change to the values assigned. We obtained and evaluated management’s hedge documentation of new significant hedge relationships for compliance with AASB 9 Financial Instruments. We assessed the disclosure in the financial statements and evaluated the completeness and accuracy thereof, with particular consideration given to requirements of AASB 9 Financial Instruments and AASB 7 Financial Instruments: Disclosures.
78
For
per
sona
l use
onl
y

Recoverability of the related party receivables Refer to note G2
Infigen - the KAM is not applicable as Infigen’s related party receivable is immaterial Trust - $645.8m
The existence of the related party receivables was a key audit matter because of the size of the balance in the Trust’s statement of financial position.
We agreed a sample of transactions relating to the receivables of Trust to source documentation and to the corresponding liability in the accounting records of the relevant related counterparty. We considered whether there were any factors indicating the receivables may not be fully recoverable.
Other information The directors of IEL and the directors of Infigen Energy RE Limited, the Responsible Entity of Trust, collectively referred to as “the directors”, are responsible for the other information. The other information comprises the information included in the annual report for the year ended 30 June 2018, including the Directors' Report, Governance, Investor Information, Glossary and Corporate Directory, but does not include the financial report and our auditor’s report thereon. Our opinion on the financial report does not cover the other information and accordingly we do not express any form of assurance conclusion thereon.
In connection with our audit of the financial report, our responsibility is to read the other information identified above and, in doing so, consider whether the other information is materially inconsistent with the financial report or our knowledge obtained in the audit, or otherwise appears to be materially misstated.
If, based on the work we have performed, we conclude that there is a material misstatement of this other information, we are required to report that fact. We have nothing to report in this regard.
Responsibilities of the directors for the financial report The directors are responsible for the preparation of the financial report that gives a true and fair view in accordance with Australian Accounting Standards and Corporations Act 2001 and for such internal control as the directors determine is necessary to enable the preparation of the financial report that gives a true and fair view and is free from material misstatement, whether due to fraud or error.
In preparing the financial reports, the directors are responsible for assessing the ability of Infigen and Trust to continue as a going concern, disclosing, as applicable, matters related to going concern and using the going concern basis of accounting unless the directors either intend to liquidate Infigen or Trust or to cease operations, or have no realistic alternative but to do so.
79
For
per
sona
l use
onl
y

Auditor’s responsibilities for the audit of the financial report Our objectives are to obtain reasonable assurance about whether the financial report as a whole is free from material misstatement, whether due to fraud or error, and to issue an auditor’s report that includes our opinion. Reasonable assurance is a high level of assurance, but is not a guarantee that an audit conducted in accordance with the Australian Auditing Standards will always detect a material misstatement when it exists. Misstatements can arise from fraud or error and are considered material if, individually or in the aggregate, they could reasonably be expected to influence the economic decisions of users taken on the basis of the financial report.
A further description of our responsibilities for the audit of the financial report is located at the Auditing and Assurance Standards Board website at: http://www.auasb.gov.au/auditors_responsibilities/ar1.pdf. This description forms part of our auditor's report.
Report on the remuneration report
Our opinion on the remuneration report We have audited the remuneration report included in pages 25 to 38 of the directors’ report for the year ended 30 June 2018.
In our opinion, the remuneration report of Infigen Energy Limited for the year ended 30 June 2018 complies with section 300A of the Corporations Act 2001.
Responsibilities The directors of the Company are responsible for the preparation and presentation of the remuneration report in accordance with section 300A of the Corporations Act 2001. Our responsibility is to express an opinion on the remuneration report, based on our audit conducted in accordance with Australian Auditing Standards.
PricewaterhouseCoopers
Marc Upcroft Sydney Partner 27 August 2018
80
For
per
sona
l use
onl
y
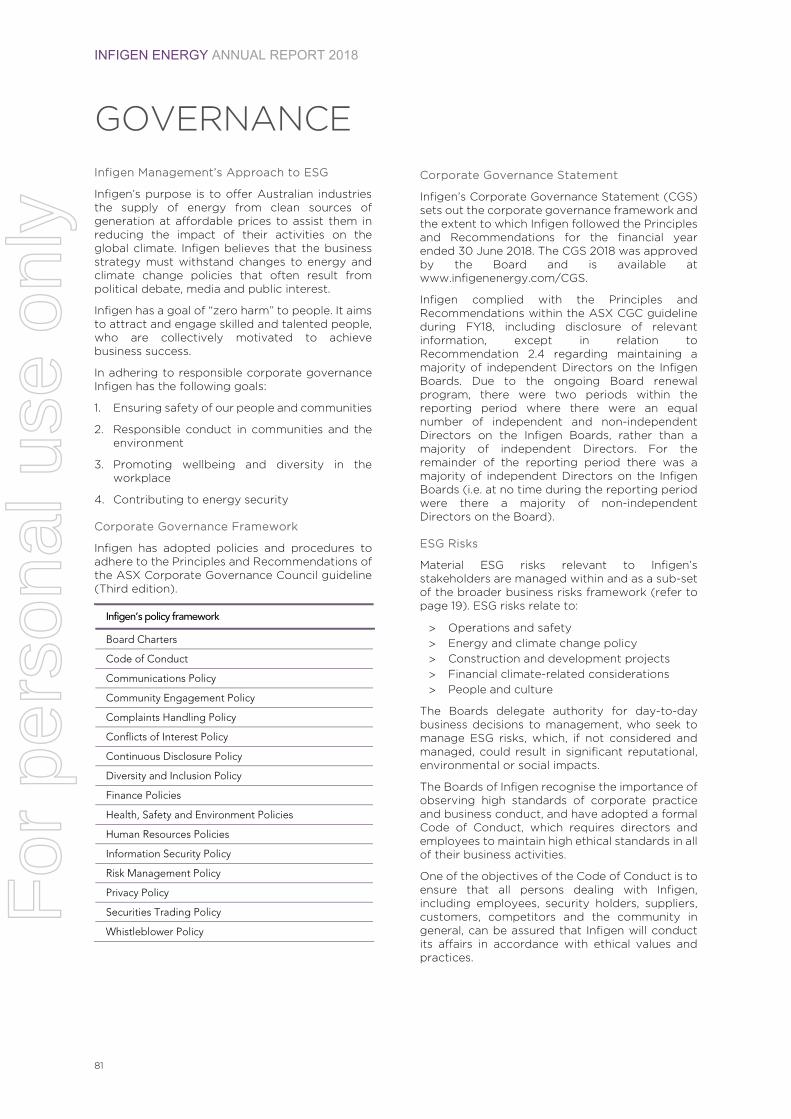
INFIGEN ENERGY ANNUAL REPORT 2018
81
GOVERNANCE Infigen Management’s Approach to ESG
Infigen’s purpose is to offer Australian industries the supply of energy from clean sources of generation at affordable prices to assist them in reducing the impact of their activities on the global climate. Infigen believes that the business strategy must withstand changes to energy and climate change policies that often result from political debate, media and public interest.
Infigen has a goal of “zero harm” to people. It aims to attract and engage skilled and talented people, who are collectively motivated to achieve business success.
In adhering to responsible corporate governance Infigen has the following goals:
1. Ensuring safety of our people and communities
2. Responsible conduct in communities and the environment
3. Promoting wellbeing and diversity in the workplace
4. Contributing to energy security
Corporate Governance Framework
Infigen has adopted policies and procedures to adhere to the Principles and Recommendations of the ASX Corporate Governance Council guideline (Third edition).
Infigen’s policy framework
Board Charters
Code of Conduct
Communications Policy
Community Engagement Policy
Complaints Handling Policy
Conflicts of Interest Policy
Continuous Disclosure Policy
Diversity and Inclusion Policy
Finance Policies
Health, Safety and Environment Policies
Human Resources Policies
Information Security Policy
Risk Management Policy
Privacy Policy
Securities Trading Policy
Whistleblower Policy
Corporate Governance Statement
Infigen’s Corporate Governance Statement (CGS) sets out the corporate governance framework and the extent to which Infigen followed the Principles and Recommendations for the financial year ended 30 June 2018. The CGS 2018 was approved by the Board and is available at www.infigenenergy.com/CGS.
Infigen complied with the Principles and Recommendations within the ASX CGC guideline during FY18, including disclosure of relevant information, except in relation to Recommendation 2.4 regarding maintaining a majority of independent Directors on the Infigen Boards. Due to the ongoing Board renewal program, there were two periods within the reporting period where there were an equal number of independent and non-independent Directors on the Infigen Boards, rather than a majority of independent Directors. For the remainder of the reporting period there was a majority of independent Directors on the Infigen Boards (i.e. at no time during the reporting period were there a majority of non-independent Directors on the Board).
ESG Risks
Material ESG risks relevant to Infigen’s stakeholders are managed within and as a sub-set of the broader business risks framework (refer to page 19). ESG risks relate to:
Operations and safety Energy and climate change policy Construction and development projects Financial climate-related considerations People and culture
The Boards delegate authority for day-to-day business decisions to management, who seek to manage ESG risks, which, if not considered and managed, could result in significant reputational, environmental or social impacts.
The Boards of Infigen recognise the importance of observing high standards of corporate practice and business conduct, and have adopted a formal Code of Conduct, which requires directors and employees to maintain high ethical standards in all of their business activities.
One of the objectives of the Code of Conduct is to ensure that all persons dealing with Infigen, including employees, security holders, suppliers, customers, competitors and the community in general, can be assured that Infigen will conduct its affairs in accordance with ethical values and practices.
For
per
sona
l use
onl
y

82
Infigen follows the guidelines, best practices and standards outlined in:
Australian National Wind Farm Commissioner’s Observations and Recommendations
Community Consultative Committee Guidelines (relevant to New South Wales)
ISO 14001 (Environment) Standards ISO 31000 (Risk Management) Standards New Zealand Standard 6808:2018,
Acoustics - Wind Farm Noise (relevant to Victoria)
OHSAS 18001 (Occupational Health and Safety Standard)
Task Force on Climate-related Financial Disclosures
The Safe Work Australia’s Code of Practice The Clean Energy Council’s Community
Engagement Guidelines SA EPA Wind Farm Noise Guidelines
(relevant to South Australia, New South Wales, Western Australia)
Following these guidelines and standards helps ensure compliance with the federal and state legislation which govern the activities to supply energy.
Ethical and Responsible Decision-Making
Infigen’s Code of Conduct sets out processes for employees and directors regarding safety, workplace bullying, equal employment opportunity, sexual harassment, confidentiality, IT security, conflicts of interest, and securities trading. Infigen encourages ethical behaviour and, in accordance with Infigen’s Whistleblower Policy, provides protection for those who raise genuine concerns and report any actual or potential breach of legal requirements, the Code of Conduct or other Infigen business policies.
Infigen’s Securities Trading Policy regulates the manner in which directors and employees can trade in IFN stapled securities and other financial products relating to the performance of IFN stapled securities, and to ensure that their investment activity is conducted in a manner that is lawful and avoids conflicts of interests between their personal interests and the interests of Infigen.
Continuous Disclosure
Infigen is committed to providing equal and timely access to material information concerning Infigen to all investors. The Continuous Disclosure Policy is designed to ensure that material price sensitive information arising from any part of the business is notified to the ASX in a complete, balanced and timely manner.
Board Oversight
Infigen’s Boards operate in accordance with the respective Constitutions and Bye-Laws of IEL, IERL and IEBL. The Boards have adopted formal Board Charters which detail the Boards’ functions and responsibilities. The Charters set out clear expectations of Directors and the Boards to act honestly, fairly and diligently in all respects in accordance with applicable laws, as well as acting
in the best interests of Infigen.
Infigen recognises that independent directors have an important role in assuring security holders that the Boards act in the best interests of Infigen and independently of management.
A Director will be considered independent if they are not a member of management and if they are free of any interests or relationships that could materially interfere with their ability to constructively challenge and independently contribute to the work of the Board.
Due to the appointment and retirement of independent Directors during FY18, there were two periods during the year where there were an equal number of independent and non-independent Directors, with a majority of independent Directors for the remainder of the reporting period. From 1 July 2017 until the appointment of Ms Stein and Mr Chellew as Directors on 21 September 2017, there were three independent and three non-independent Directors on each of the Infigen Boards. Upon Ms Harris retiring on 19 February 2018, the Infigen Boards were again reduced to three independent and three non-independent Directors, and that was the position for the remainder of the reporting period. For the period 21 September 2017 to 19 February 2018, there was a majority of independent Directors on each Infigen Board.
The Board is undertaking a process in FY19 to identify a suitably qualified and experienced candidate to be appointed as an independent Director on each of the Infigen Boards. Upon successful completion of that process, the Infigen Boards will have a majority of independent Directors.
Board Committees
The Boards have established the following standing committees: an Audit, Risk & Compliance Committee (ARCC) for each of IEL, IERL and IEBL and a Nomination & Remuneration Committee (NRC). The ARCCs oversee the implementation and ongoing management of systems of internal control and risk management at Infigen, ensuring that management has processes in place to identify, assess and properly manage risks. In addition to its nomination, succession and general human resource responsibilities, the NRC is responsible for monitoring and recommending the level of remuneration for Directors, as well as providing advice in relation to the level of remuneration for other Key Management Personnel. The Committee Charters detail the responsibilities of each Committee and how they exercise their authority.
During FY18 the ARCCs comprised at least three members, all of whom were Non-Executive Directors and a majority of whom were independent Directors. The Chair of the ARCCs throughout the period was an independent Director.
The NRC was comprised of three Non-Executive Directors throughout the reporting period, a majority of whom were independent Directors.
For
per
sona
l use
onl
y

INFIGEN ENERGY 2018 ANNUAL REPORT
83
The Chair of the NRC throughout the period was an independent Director.
The number of ARCC and NRC meetings during FY18 and the attendance of Committee members at those meetings is provided in the Directors’ Report (page 21).
Board Renewal and Performance
The Boards, with the assistance of the NRC, regularly assess the skills required by Directors to competently discharge the Boards’ obligations to consider the strategic direction of Infigen, review potential candidates for appointment to the Boards, provide confirmation of the Directors to retire annually by rotation, and have oversight of the Boards’ regular performance evaluation process.
During FY18 two independent Directors retired and two further independent Directors were appointed to fill casual vacancies (and subsequently elected as Directors by security holders at the AGM on 22 November 2017). A new Board Chairman was also elected. With such change occurring at Board level during FY18, it was considered that it would be more productive to defer the performance evaluation of the Board to the following year.
Responsibilities of Management
The Boards have reserved certain matters for approval as set out in the Board Charters. In addition to delegating specific responsibilities to Board Committees, the Boards also determine delegations to management, approve relevant delegation limits and review business developments for consistency with the Enterprise Risk Management framework for Infigen. That framework is consistent with International Standard ISO 31000 and is monitored by the ARCC.
The CEO has been granted authority for those matters not reserved for the Boards or a Board Committee. Infigen’s management committees assist in the exercise of the CEO’s delegated authority. The CEO and other senior management report to the Boards at each Board meeting. In addition to regular reporting from management, the Boards have access to management as well as external advisors when required.
Stakeholder engagement
Infigen places a high priority on addressing feedback received from our stakeholders. Maintaining an effective and collaborative relationship with suppliers and contractors, emergency services, landowners, and the local community is important to ensuring ethical business conduct and that people and the environment are not harmed by Infigen’s activities.
Stakeholders are identified within the risk management framework taking into account stakeholders’ interests in Infigen and their influence on Infigen’s operations and reputation.
Infigen’s stakeholders
Employees and directors Full-time and part-time employees Executive and non-executive Directors
Investor community Security holders and fund managers Analysts and brokers Lenders Potential investors and financiers
Customers Commercial and industrial customers Electricity retailers Wholesale electricity market participants
Suppliers Service and maintenance contractors Energy and Financial modelling consultants Engineering, procurement and construction
contractors Legal and investment advisors Transmission & distribution network operators Emergency services
Government and regulators Federal and state governments Energy regulators Energy markets operator Financial services industry regulators Planning authorities Environment & heritage authorities Local councils
Community & non-government organisations Landowners & neighbours Community consultation committees Traditional owners Local councils Social & environmental interest groups Social media
An extensive program of information is made available to our stakeholders throughout the year, including via ASX/market releases, direct mailing, electronic alerts, briefings, presentations and via Infigen’s website.
In addition to encouraging stakeholders to utilise Infigen’s website to access investor information and disclosures, the annual reports provide stakeholders with detailed information in respect of the major achievements, financial results and the strategic direction of Infigen.
Notice of significant group briefings and details regarding the various methods to access and participate in those briefings is circulated broadly. Records are kept in relation to investor and analyst briefings.
Infigen acts on feedback because we recognise that the long-term sustainability of Infigen is closely linked with the actions of our stakeholders and their continuing support for our operations and future developments.
When developing new projects, Infigen informs, consults and gives the community the opportunity to have a say in each of Infigen’s development projects. Infigen has identified key stakeholder
For
per
sona
l use
onl
y

84
groups with whom we engage to maintain community support for projects.
Community committees are formalised to discuss concerns and provide feedback. Establishing community committees may not be appropriate for all projects or operating assets, and is considered on a community and site basis.
Memberships
During FY18 Infigen held corporate memberships with the following industry organisations:
Australasian Investor Relations Association Australian Energy Council Australian Financial Markets Association Australian Information Security Association
Australian Institute of Energy Clean Energy Council Committee for Economic Development of
Australia Energy Users Association of Australia The Hawthorn Club
Reporting
Infigen uses the Global Reporting Initiative (GRI) Standards and the GRI Sector Disclosure (Electric Utilities) to disclose its governance approach, and environmental, economic, social and general outcomes of its operations. The latest report is available at www.infigenenergy.com/ESG.
The ESG targets are set for each financial year in the areas of health, safety and environment; people and culture; and conduct in the communities. Progress is reported to the Board periodically in relevant reports.
FY18 ESG Highlights
Safety
Achieving our safety target strives for year-on-year safety performance improvements, and we remain committed to building the processes and relationships with our suppliers to support the achievement of our “zero harm” goal.
Our contractors - service and maintenance providers at operating sites and EPC contractors at construction sites - are responsible for safety and day-to-day management of operations at those sites. At the Lake Bonney 1 and Alinta Wind Farms the service and maintenance contractors achieved 10 years without a Lost Time Injury.
During the year, the Total Recordable Injury Frequency Rate for the year increased to 13.0, from 4.7 as at the end of FY17. There were no recordable injuries reported involving direct Infigen employees. Refer to page 7 for reported safety performance in FY18.
Throughout FY18, Infigen actively consulted, cooperated and coordinated on safety matters with its contractors through safety workshops, monthly meetings, and audits. Infigen completed the transition of maintenance service providers at Capital and Woodlawn Wind Farms incident-free.
In FY19 the safety focus will be on critical safety risks and the effectiveness of the mitigation measures in place to manage those risks. Our suppliers at the wind farms implement a range of administrative controls and procedures to mitigate these high risks. During FY19 Infigen will accommodate an ongoing program of audits designed to monitor contractor compliance and prepare for the transition from construction to operations at the Bodangora Wind Farm.
Currandooley Fire
A fire occurred in the vicinity of the Capital and Woodlawn Wind Farms on 17 January 2017. As a result of the fire, a number of private properties in the surrounding areas suffered loss and damage. Infigen has fully cooperated with independent investigations into the cause of the fire. There are two sets of legal proceedings relating to the fire currently underway, seeking to recover loss and damage suffered as a result of the fire from Infigen.
People and culture
At the core of Infigen’s culture are people who share and embrace our values. Our commitment to our people and responsible corporate governance drives the Diversity Objectives in accordance with the ASX Corporate Governance Principles and Recommendations (ASX Principles).
As at 30 June 2018 Infigen’s workforce included 67 employees and 4 Non-Executive Directors.
Occupational categories as at 30 June 2018 2017
Non-Executive Directors 4 4
Executives 5 4
Senior Management 7 6
Middle Management 16 19
Professional 28 23
Field 4 3
Support 7 6
Employees and directors 71 65
For
per
sona
l use
onl
y

INFIGEN ENERGY 2018 ANNUAL REPORT
85
Infigen’s NRC has approved four Diversity Objectives for the period 1 July 2017 to 30 June 2019. Diversity Objectives and the outcomes in FY18 are as follows.
Two-year Diversity Objectives to 30 June 2019 & FY18 outcomes
1. Maintain progress towards achieving an equal proportion of workplace participation of females and males by:
Increasing the total number of females employed (baseline as at 30 June 2017 is 26 females and 39 males including non-executive directors)
Increasing the proportion of females in Senior and Middle Management roles (baseline as at 30 June 2017 is nine females and 20 males excluding non-executive directors)
Maintaining an environment where flexible work arrangements are supported
In FY18: Workforce participation of females increased by
2%. Voluntary employee turnover was 12% (25%
females and 75% males). Number of females in the workforce increased
from 26 to 30, and number of males increased from 39 to 41.
Two roles were filled with female employees returning from maternity leave. Of the remaining five positions two roles were filled by female employees and three by male employees.
2. Implement an emerging leader mentor program to attract, develop and retain emerging leaders.
In FY18, Infigen contributed over $103,000 to enable scholarships through: The Career Trackers indigenous scholarship
program (one place available to be filled in FY19). The UNSW Co-op program (three students). The Macquarie Graduate School of Management
Women in MBA scholarship (one employee). The UNSW Women in Engineering program (two
students).
3. Implement a lesbian, gay, bisexual, transgender and intersex (LGBTI) Diversity and Inclusion Plan.
In preparation for release in FY19.
4. Achieve gender pay equality within each occupational group.
FY18 is the fourth year that Infigen has measured pay equity between females and males. As at 30 June 2018 there was pay equity across 72% of the organisation.
Pay gaps range from 10-15% in two occupational categories (favoring females in the first instance and males in the other). The pay gaps were due to the diversity of roles and experience, not gender. When analysing the occupational groups based on experience the pay gap narrows or disappears.
Our efforts to achieve gender balance have been successful with an equal proportion of males and females across the Middle Management and Professional occupational categories as at 30 June 2018, representing 64% of employees, and directors. Infigen employed 18 engineers (Operations and the Operational Control Centre), of whom an equal proportion were males and females. This level of gender diversity was achieved through our engagement with the UNSW to build brand recognition, talent pipelines in support of graduate recruitment and initiatives to support professional development, and career progression.
The focus moving forward is on retaining and developing our emerging leaders and attracting talent in under-represented categories. Recruitment decisions will continue to be based on merit and external recruiters are required to present a shortlist that is ethnically and gender diverse.
Our primary objective of measuring pay equity is to ensure that pay gaps are not a result of gender. Infigen regularly measures and analyses gender pay data to determine the cause and will take action to close the pay gap if the only possible conclusion for the pay gap is gender. Management are confident that gender is not a cause for the pay gap and will continue to monitor remuneration in each category to ensure that we know when a pay gap occurs and why. Females in the workforce by occupational categories:
For
per
sona
l use
onl
y

86
Carbon footprint & energy security
Infigen is a signatory to the We Mean Business Coalition Commitments and participates in the Australian Science Based Targets Initiative Community of Practice. Progress in FY18 is reported in the table below.
We Mean Business Commitments & FY18 outcomes
1. Set an internal carbon price.
Infigen incorporates a carbon price in its trading strategy and budget forecasting.
Infigen communicated policy considerations, including the proposed National Energy Guarantee, in investor reports.
To date Infigen has not implemented an ESG-based criteria in its procurement policy, however, it promotes sourcing locally where possible.
2. Commit to responsible corporate engagement in climate policy and communicate on actions and outcomes via public statements
Infigen advocates for regulation that enables renewable energy to supply reliable affordable and clean energy.
Infigen’s Regulatory Affairs Manager was seconded to support the COAG’s Energy Security Board in developing the National Energy Guarantee
Infigen reported the relevant greenhouse gas emissions and its approach to climate change risk management to the CDP 2017.
3. Adopt and announce a science-based emissions reduction target via the global organisation Science Based Targets.
To ensure the quality of data when determining our carbon footprint from wind farm construction, Infigen committed to undertake an emissions life-cycle assessment study of the Bodangora Wind Farm.
4. Commit to implement the recommendations of the Task Force on Climate-related Financial Disclosures.
The recommendations relating to the governance, strategy, risk management, and metrics and targets have been implemented by reporting to the CDP 2017 and in the ESG Report 2017.
5. Committing to source 100% from renewable power by 2020.
Electricity at site offices and wind farms is generated at the wind farm or drawn from the grid. All electricity that is consumed from the grid is offset by additional wind farm generation, since renewable energy generators are not allowed under the Renewable Energy Target legislation to earn LGCs for generation that is offsetting energy consumed at times of low wind resource.
Infigen consumed 100% of its office based energy consumption from certified renewables sources.
Infigen contributed to the project of installing a solar panel system for the Wellington Men’s Shed as part of the Bodangora Community Benefit Fund.
Our strategy in managing energy security and climate change risks is informed and underpinned by technology developments, scientific knowledge from external consultants, and engagement with key stakeholders. We recognise the integration of variable renewable generation in the physical and financial markets is not without its challenges. We examined a range of storage
and dispatchable generation options as part of our plans for future growth and core business strategy. We are focussed on working with policy makers and regulatory authorities to ensure our strategy responds to changing energy markets.
Infigen reports its electricity consumption and production, and scope 1 and scope 2 emissions to the Clean Energy Regulator (CER) under the National Greenhouse and Energy Reporting Act 2007 (NGER Act). NGER reports are reviewed and assessed by the CER for compliance with legislative obligations. FY18 emissions reported to the CER will be available in the ESG Report on Infigen’s website at www.infigenenergy.com/ESG.
Conduct in the community
In July 2017 Infigen started construction of the Bodangora Wind Farm, creating over 40 local jobs during that stage. The construction activities of the Bodangora Wind Farm disturbed a small amount of native vegetation. In order to offset this impact and as part of the project approval conditions, Infigen has committed to make a contribution to the NSW Biodiversity Conservation Trust.
In FY18 Infigen awarded the first half of the $50,000 annual fund to eight projects ranging from supporting the local touch footy, soccer and cricket teams, upgrading the local community centre, supporting St John’s Ambulance, the Senior Citizens Trust, Historical Society, and purchasing equipment for the walking trails maintained by the Mt Arthur Reserve Trust. Direct investment into the community will be approximately $3 million through the Community Benefit Fund and the Community Enhancement Fund.
In total Infigen contributed over $115,000 to 44 local community projects or organisations sponsoring sports teams, education programs and fundraising events. This year we had an exciting opportunity to join a partnership funding the construction of a new mobile tower in Cadia Valley (near the community of the proposed Flyers Creek Wind Farm) to improve access to mobile phone reception and mobile data to offer a vital service for agribusinesses and local operators.
Infigen hosted the Run with the Wind open day at the Woodlawn Wind Farm for the sixth year to raise funds for local community organisations. Proceeds from this event went towards the Tarago Landcare Group, the Tarago Rural Fire Brigade, and purchasing training equipment for the Goulburn Mulwaree Junior Fire Brigade. On other operating wind farms and development projects Infigen held over 90 community consultation meetings and site visits.
Infigen continued to support community advocacy and industry groups with over $99,000 spent in the current financial year. In FY18 the focus of those groups was on the proposed National Energy Guarantee and on enhancing community engagement between wind developers and operators in regional Australia.
For
per
sona
l use
onl
y
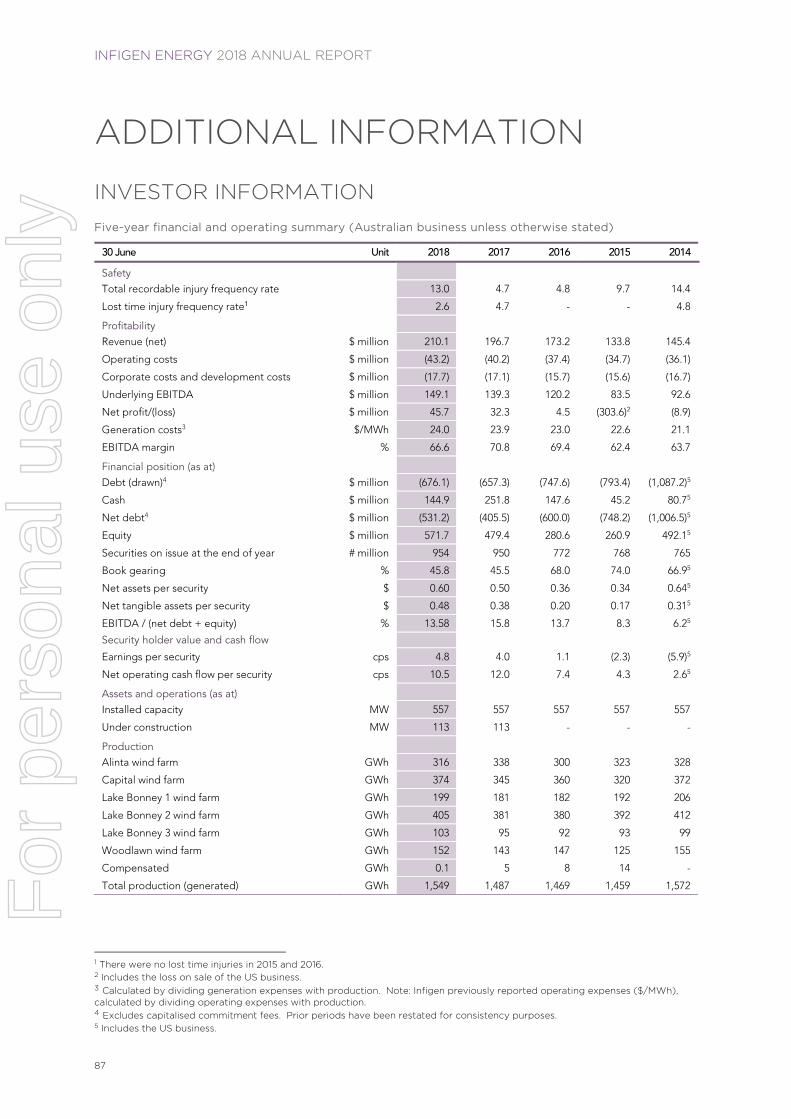
INFIGEN ENERGY 2018 ANNUAL REPORT
87
ADDITIONAL INFORMATION
INVESTOR INFORMATION Five-year financial and operating summary (Australian business unless otherwise stated)
30 June Unit 2018 2017 2016 2015 2014
Safety
Total recordable injury frequency rate 13.0 4.7 4.8 9.7 14.4
Lost time injury frequency rate1 2.6 4.7 - - 4.8
Profitability
Revenue (net) $ million 210.1 196.7 173.2 133.8 145.4
Operating costs $ million (43.2) (40.2) (37.4) (34.7) (36.1)
Corporate costs and development costs $ million (17.7) (17.1) (15.7) (15.6) (16.7)
Underlying EBITDA $ million 149.1 139.3 120.2 83.5 92.6
Net profit/(loss) $ million 45.7 32.3 4.5 (303.6)2 (8.9)
Generation costs3 $/MWh 24.0 23.9 23.0 22.6 21.1
EBITDA margin % 66.6 70.8 69.4 62.4 63.7
Financial position (as at)
Debt (drawn)4 $ million (676.1) (657.3) (747.6) (793.4) (1,087.2)5
Cash $ million 144.9 251.8 147.6 45.2 80.75
Net debt4 $ million (531.2) (405.5) (600.0) (748.2) (1,006.5)5
Equity $ million 571.7 479.4 280.6 260.9 492.15
Securities on issue at the end of year # million 954 950 772 768 765
Book gearing % 45.8 45.5 68.0 74.0 66.95
Net assets per security $ 0.60 0.50 0.36 0.34 0.645
Net tangible assets per security $ 0.48 0.38 0.20 0.17 0.315
EBITDA / (net debt + equity) % 13.58 15.8 13.7 8.3 6.25
Security holder value and cash flow
Earnings per security cps 4.8 4.0 1.1 (2.3) (5.9)5
Net operating cash flow per security cps 10.5 12.0 7.4 4.3 2.65
Assets and operations (as at)
Installed capacity MW 557 557 557 557 557
Under construction MW 113 113 - - -
Production
Alinta wind farm GWh 316 338 300 323 328
Capital wind farm GWh 374 345 360 320 372
Lake Bonney 1 wind farm GWh 199 181 182 192 206
Lake Bonney 2 wind farm GWh 405 381 380 392 412
Lake Bonney 3 wind farm GWh 103 95 92 93 99
Woodlawn wind farm GWh 152 143 147 125 155
Compensated GWh 0.1 5 8 14 -
Total production (generated) GWh 1,549 1,487 1,469 1,459 1,572
1 There were no lost time injuries in 2015 and 2016. 2 Includes the loss on sale of the US business. 3 Calculated by dividing generation expenses with production. Note: Infigen previously reported operating expenses ($/MWh), calculated by dividing operating expenses with production. 4 Excludes capitalised commitment fees. Prior periods have been restated for consistency purposes. 5 Includes the US business.
For
per
sona
l use
onl
y

88
Bermuda Law Issues
Incorporation: Infigen Energy (Bermuda) Limited (IEBL) is incorporated in Bermuda.
Takeovers: Unlike IEL and IET, IEBL is not subject to the sections in Chapter 6 of the Corporations Act dealing with the acquisition of shares (including substantial holdings and takeovers).
Bermuda company law does not have a takeover code, which effectively means that as an ASX listed entity with IEL and IET, a takeover of IEBL will be regulated under Australian takeover law. However, Section 102 of the Bermuda Companies Act provides that where an offer is made for shares of a company and, within four months of the offer the holders of not less than 90% of the shares that are the subject of such offer accept, the offeror may by notice require the non-tendering shareholders to transfer their shares on the terms of the offer. Dissenting shareholders may apply to the court within one month of the notice, objecting to the transfer. The test is one of fairness to the body of the shareholders and not to individuals, and the burden is on the dissentient shareholder to prove unfairness, not merely that the scheme is open to criticism.
An alternative mechanism for the compulsory acquisition of shares arises in Section 103 of the Bermuda Companies Act. Under that section, the holder of not less than 95% of the shares may compulsorily acquire the remainder from the remaining shareholders. The offeror must give notice to all remaining shareholders of its intention to acquire all, and not some, of the shares on the terms set out in the notice. Dissenting shareholders can only apply to the court within one month of the notice for a valuation of their shares. Within one month of the valuation, the offeror may either acquire the shares at the valuation price fixed by the court or cancel the transaction.
Number of Stapled Securities and Holders
IFN stapled securities are listed and traded on the Australian Securities Exchange.
Each stapled security is made up of one IEL share, one IET unit and one IEBL share which, under each of the Constitutions and Bye-Laws respectively, are stapled together and cannot be traded or dealt with separately. In accordance with its requirements in respect of listed stapled securities, ASX reserves the right to remove any or all of IEL, IEBL and IET from the Official List if, while the stapling arrangements apply, the securities in one of these entities cease to be stapled to the securities in the other entities or one of these entities issues securities that are not then stapled to the relevant securities in the other entities.
The following additional investor information is current as at 31 July 2018.
The total number of IFN stapled securities on issue is 954,060,175 and the number of holders of these stapled securities is 18,234.
Substantial Security Holders
The substantial security holders who have notified Infigen in accordance with section 671B of the Corporations Act 2001 are set out below.
Substantial security holder Date of initial notice Date of most recent notice Number of IFN stapled
securities advised in most recent notice
The Childrens Investment Fund1 26 Sep 2008 1 Jul 2015 250,453,481
Brookfield Asset Management Inc
11 Apr 2018 11 Apr 2018 86,424,171
Morgan Stanley 3 Aug 2017 14 Jun 2018 56,639,727
1 Security holder acquired additional securities as part of Infigen’s equity capital raising in April 2017 but the number acquired was
such that the security holder did not need to notify Infigen of a change in the percentage in their substantial holding.
For
per
sona
l use
onl
y

INFIGEN ENERGY 2018 ANNUAL REPORT
89
Voting Rights
It is generally expected that General Meetings of shareholders of IEL, shareholders of IEBL and unitholders of IET will be held concurrently where proposed resolutions relate to all three Infigen entities. At these General Meetings of IEL, IEBL and IET, the voting rights outlined below will apply.
Voting rights in relation to General Meetings of IEL and IEBL:
on a show of hands, each shareholder of IEL and IEBL, who is present in person and each other person who is present as a proxy, attorney or duly appointed corporate representative of a shareholder, has one vote; and
on a poll, each shareholder of IEL and IEBL, who is present in person, has one vote for each share they hold. Also, each person present as a proxy, attorney or duly appointed corporate representative of a shareholder has one vote for each share held by the shareholder that the person represents.
Voting rights in relation to General Meetings of IET:
on a show of hands, each unitholder who is present in person and each other person who is present as a proxy, attorney or duly appointed corporate representative of a unitholder has one vote; and
on a poll, each unitholder who is present in person has one vote for each one dollar of the value of the units in IET held by the unitholder. Also, each person present as proxy, attorney or duly appointed corporate representative of a unitholder has one vote for each one dollar of the value of the units in IET held by the unitholder that the person represents.
Stapled Securities that Are Restricted or Subject to Voluntary Escrow
There are currently no IFN stapled securities that are restricted or subject to voluntary escrow.
On-Market Security Buy-Back
There is no current on-market buy-back of IFN stapled securities.
Distribution of IFN Stapled Securities as at 31 July 2018
The distribution of IFN stapled securities amongst IFN security holders is set out below.
Category Securities Security holders
100,001 and over 877,567,442 199
10,001-100,000 44,334,538 1,624
5,001-10,000 10,378,016 1,413
1,001-5,000 18,198,247 7,166
1-1,000 3,581,932 7,832
Total 954,060,175 18,234
The number of security holders holding less than a marketable parcel of IFN stapled securities as at 31 July 2018 was 6,548.
For
per
sona
l use
onl
y

90
Top Infigen Security Holders
The largest Infigen security holders as at 31 July 2018 are set out below.
Rank Security holder IFN stapled
securities held Number Percentage
1 HSBC CUSTODY NOMINEES (AUSTRALIA) LIMITED 409,513,432 42.92
2 CITICORP NOMINEES PTY LIMITED 96,758,507 10.14
3 J P MORGAN NOMINEES AUSTRALIA LIMITED 94,851,753 9.94
4 BIF III LOGAN AGGREGATOR LP 86,424,171 9.06
5 HSBC CUSTODY NOMINEES (AUSTRALIA) LIMITED - A/C 2 34,842,595 3.65
6 NATIONAL NOMINEES LIMITED 31,809,001 3.33
7 HSBC CUSTODY NOMINEES (AUSTRALIA) LIMITED - GSCO ECA 10,178,921 1.07
8 BNP PARIBAS NOMINEES PTY LTD - AGENCY LENDER DRP A/C 9,592,946 1.01
9 BNP PARIBAS NOMS PTY LTD 5,874,252 0.62
10 BRISPOT NOMINEES PTY LTD 4,904,757 0.51
11 CS FOURTH NOMINEES PTY LIMITED 4,607,894 0.48
12 BNP PARIBAS NOMINEES PTY LTD 4,021,000 0.42
13 EASYTONE COMMUNICATIONS PTY LTD 3,944,006 0.41
14 AMP LIFE LIMITED 3,327,576 0.35
15 CITICORP NOMINEES PTY LIMITED - COLONIAL FIRST STATE INV A/C 3,291,467 0.34
16 MR TREVOR YUEN 2,822,963 0.30
17 ECAPITAL NOMINEES PTY LIMITED 2,387,550 0.25
18 TAPPET HOLDINGS PTY LTD 2,336,521 0.24
19 CAMBROSE PTY LIMITED 2,000,000 0.21
20 BRYN INVESTMENT CO PTY LIMITED 1,735,743 0.18
20 OWEN INVESTMENT CO PTY LIMITED 1,735,743 0.18
20 HUW INVESTMENT CO PTY LIMITED 1,735,743 0.18
Total top security holders 818,696,541 85.81
Total of other security holders 135,363,634 14.19
Total IFN stapled securities 954,060,175 100.00
For
per
sona
l use
onl
y

INFIGEN ENERGY 2018 ANNUAL REPORT
91
Key ASX Announcements
The key announcements lodged with the ASX and released to the market throughout FY18 are listed below.
2017
31 July Fourth Quarter FY17 Production and Revenue
24 August FY17 Full Year Results
8 September Monthly Production - August 2017
21 September Infigen Appoints New Independent Directors
26 September Annual Report 2017
3 October NZ Rapid Insights Conference Presentation
9 October Monthly Production - September 2017
26 October Appendix 4G and FY17 Corporate Governance Statement
31 October First Quarter FY18 Production and Revenue
9 November Australia Rapid Insights Conference Presentation
9 November Monthly Production - October 2017
22 November Presentations and Results of the 2017 AGM
5 December ABC: Adelaide Brighton Strengthens Energy Supply Portfolio
8 December Monthly Production - November 2017
29 December Board Succession
2018
9 January Monthly Production - December 2017
31 January Second Quarter FY18 Production and Revenue
9 February Monthly Production - January 2018
19 February FY18 Interim Results and Early Refinancing
19 February Non-Executive Director Retirement
9 March Monthly Production - February 2018
21 March Resolutions Requisitioned by Security Holders
9 April Execution of A$605M Syndicated Facility Agreement
9 April Withdrawal of EGM Requisitions by Security Holders
10 April Monthly Production - March 2018
16 April Market Update - New Substantial Holder
18 April Financial Close on A$605M Syndicated Facilities Achieved
30 April Third Quarter FY18 Production and Revenue
9 May Monthly Production - April 2018
12 June Monthly Production - May 2018
A comprehensive list and full details of all publications can be found on the Infigen website: www.infigenenergy.com, and the ASX website: www.asx.com.au.
For
per
sona
l use
onl
y

92
GLOSSARY
AEMO Australian Energy Market Operator; responsible for operating the NEM and the Wholesale Electricity Market (WA).
AFSL Australian Financial Services Licence
AGM Annual General Meeting
ARCC Audit, Risk & Compliance Committees of IEL, IERL and IEBL
ASIC Australian Securities & Investments Commission
ASX Australian Securities Exchange Limited (ABN 98 008 624 691) or Australian Securities Exchange as the context requires.
BESS Battery Energy Storage System
BOARD or BOARDS
Unless otherwise stated, the Boards of IEL, IERL and IEBL.
BPS Basis points
CAPACITY The maximum power that a wind turbine generator was designed to produce.
CAPACITY FACTOR
A measure of the productivity of a wind turbine, calculated by the amount of power that a wind turbine produces over a set time period, divided by the amount of power that would have been produced if the turbine had been running at full capacity during that same time period.
CGS Corporate Governance Statement
C&I Commercial & Industrial
DEVELOPMENT PIPELINE
Infigen’s prospective renewable energy projects that are in various stages of development prior to commencing construction. Stages of development include: landowner negotiations; wind and solar monitoring; project feasibility and investment evaluation; community consultation; cultural heritage assessment; environmental assessment; and design, supplier and connection negotiations.
EARNINGS AT RISK ANALYSIS
Measuring potential changes in revenue in a given period having regard to relevant factors and varying degrees of confidence.
EBITDA Earnings before interest, tax, depreciation and amortisation
ESG Environmental, social and governance
FY or FINANCIAL YEAR
A period of 12 months starting on 1 July and ending on 30 June in the next calendar year.
GRID The network of power lines and associated equipment required to deliver electricity from generators to consumers.
GW Gigawatt. One billion watts of electricity.
GWh Gigawatt hour. One billion watt hours of electricity.
HSE Health, Safety & Environment
IEBL Infigen Energy (Bermuda) Limited (ARBN 116 360 715).
IEL Infigen Energy Limited (ABN 39 105 051 616).
IERL Infigen Energy RE Limited (ACN 113 813 997) (AFSL 290 710), the responsible entity of IET.
IET Infigen Energy Trust (ARSN 116 244 118).
IFN The code for the trading of listed IFN stapled securities on the ASX.
INFIGEN Infigen Energy, comprising IEL, IEBL, IET and their respective subsidiary entities from time to time.
KMP Key Management Personnel
KPI Key Performance Indicator
For
per
sona
l use
onl
y

INFIGEN ENERGY 2018 ANNUAL REPORT
93
LGC Large-scale Generation Certificate. The certificates are created by large-scale renewable energy generators and each certificate represents 1 MWh of generation from renewable resources.
LSL Long service leave
LTI Long term incentive
MARGINAL LOSS As electricity flows through the transmission and distribution networks, energy is lost due to electrical priority resistance and the heating of conductors. Revenue is subject to marginal loss factors that are fixed annually by AEMO to account for network losses.
Multi-Channel Route to Market Strategy
Infigen’s sales diversification strategy.
MW Megawatt. One million watts of electricity.
MWh Megawatt hour. One million watt hours of electricity.
NEM National Electricity Market; the interconnected power system of five regional market jurisdictions - Queensland, New South Wales (including the Australian Capital Territory), Victoria, South Australia, and Tasmania.
NRC Nomination & Remuneration Committee of IEL.
O&M Operations and maintenance
OCC Operations Control Centre. A centrally located business function within Infigen that monitors and directs the operations of Infigen’s wind and solar farms.
OPERATING EBITDA
EBITDA, excluding corporate costs, non-operating costs and non-operating income.
PPA Power Purchase Agreement
QUANTITATIVE VOLUMETRIC HEDGING LIMITS
Maximum volume based trading limits, determined having regard to known historical generation profiles and a predictable seasonality of operating performance from the operating assets.
RET Renewable Energy Target
RUN OF PLANT Type of contract for the sale of electricity whereby the offtaker (customer) buys 100% of the amount of electricity generated by the plant as generated in each trading interval.
STI Short term incentive
SPOT PRICE Wholesale electricity market price
TSR Total Shareholder Return; measures the change in value of a security plus cash distributions notionally reinvested in that security.
UNDERLYING EBITDA
Operating EBITDA, including corporate and development costs.
For
per
sona
l use
onl
y

94
CORPORATE DIRECTORY
Infigen Energy
Level 17, 56 Pitt Street Sydney NSW 2000 Australia +61 2 8031 9900 www.infigenenergy.com
Directors
Len Gill (Non-Executive Chairman)
Mark Chellew (Non-Executive Director)
Emma Stein (Non-Executive Director)
Philip Green (Non-Executive Director)
Ross Rolfe AO (Chief Executive Officer / Managing Director)
Sylvia Wiggins (Executive Director - Finance & Commercial)
Company Secretary
David Richardson
Annual General Meeting
Infigen Energy’s 2018 Annual General Meeting will be held on 16 November 2018
IFN Stapled Securities
One share in each of IEL and IEBL and one unit in IET have been stapled together to form a single stapled security and listed on the ASX under the code “IFN”. They cannot be traded separately and can only be traded as stapled securities.
Responsible Entity for Infigen Energy Trust
Infigen Energy RE Limited Level 17, 56 Pitt Street Sydney NSW 2000 Australia +61 2 8031 9900
Auditor
PricewaterhouseCoopers One International Towers Sydney Watermans Quay Barangaroo NSW 2000 Australia
Registry
Link Market Services Limited Locked Bag A14 Sydney South NSW 1235 Australia +61 1800 226 671 (toll free within Australia)
www.linkmarketservices.com.au
Disclaimer
This publication is issued by Infigen Energy Limited (IEL), Infigen Energy (Bermuda) Limited (IEBL) and Infigen Energy RE Limited as responsible entity for Infigen Energy Trust (collectively Infigen). To the maximum extent permitted by law, Infigen and its respective related entities, Directors, officers and employees (collectively Infigen Entities) do not accept, and expressly disclaim, any liability whatsoever (including for negligence) for any loss howsoever arising from any use of this publication or its contents. This publication is not intended to constitute legal, tax or accounting advice or opinion. No representation, warranty or other assurance is made or given by or on behalf of the Infigen Entities that any projection, forecast, forward-looking statement or estimate contained in this publication should or will be achieved. None of the Infigen Entities or any member of the Infigen Group guarantees the performance of Infigen, the repayment of capital or a particular rate of return on Infigen stapled securities. IEL and IEBL are not licensed to provide financial product advice. This publication is for general information only and does not constitute financial product advice, including personal financial product advice, or an offer, invitation or recommendation in respect of securities, by IEL, IEBL or any other Infigen Entities. Note that, in providing this publication, the Infigen Entities have not considered the objectives, financial position or needs of the recipient. The recipient should obtain and rely on its own professional advice from its tax, legal, accounting and other professional advisers in respect of the recipient’s objectives, financial position or needs. All amounts expressed in dollars ($) in this Annual Report are Australian dollars, unless otherwise specified.
For
per
sona
l use
onl
y

INFIGEN ENERGY (BERMUDA) LIMITED
ARBN 116 360 715
FINANCIAL REPORT 30 JUNE 2018
For
per
sona
l use
onl
y

CONTENTS
1
Independent Auditor’s Report 2
Financial Statements
- Statement of Comprehensive Income 5
- Statement of Financial Position 6
- Statement of Changes in Equity 7
- Statement of Cash Flow 8
Notes to the Financial Statements 9
The responsibility for preparation of the consolidated financial statements and any financial information contained in
this financial report rests solely with the Directors of the Company. This financial report for the year ended 30 June
2018 was authorised for issue in accordance with a resolution of the Company’s directors. The Company has the
power to amend and reissue this financial report.For
per
sona
l use
onl
y

}
pwc
Indep endent auditor's r ep ortTo the shareholders of Infigen Energy (Bermuda) Limited
Our opinion
In our opinion the accompanying financial report presents fairly, in all material respects, the financialposition of Infigen Energy (Bermuda) Limited (the Company) as at 30 June zor8 and its financialperformance and its cash flows for the year then ended in accordance with Australian AccountingStandards.
Whstwe hsue sudited.The financial report comprises:
o the statement of financial position as at 30 June zor8o the statement of comprehensive income for the year then ended
. the statement of changes in equity for the year then ended
o the statement of cash flows for the year then ended
o the notes to the financial statements, which include a summary of significant accountingpolicies
o thedirectors'declaration.
Basis for opinion
We conducted our audit in accordance with Australian Auditing Standards. Our responsibilities underthose standards are further described in the Audito r's responsibilities for the audit of the financialreport section of our report.
We believe that the audit evidence we have obtained is sufficient and appropriate to provide a basis forour opinion.
Ind.epend.enceWe are independent of the Company in accordance with the ethical requirements of the AccountingProfessional and Ethical Standards Board's APES rro Code of Ethics for Professional Accountants(the Code) that are relevant to our audit of the financial report in Australia. We have also fulfilled ourother ethical responsibilities in accordance with the Code.
Key audit mattersKey audit matters are those matters that, in our professional judgement, were of most significance inour audit of the financial report for the current period. The key audit matters were addressed in thecontext of our audit of the financial report as a whole, and in forming our opinion therbon, and we donot provide a separate opinion on these matters. Further, any commentary on the outcomes of aparticular audit procedure are made in that context.
PricewsterhouseCoopers, ABN 5z 78o 4Sg 757One InternationalTowers Sydney, Watermans Quay, Barangaroo, GPO BOX z65o, SYDNEY NSW zootT: +6t z 8266 oooo, F: +6t z 8266 9999,www.purc.com.auLeuel tt, IPSQ, t6g Macquarie Street, Parramatta NSW ztgo, PO Box tt55 Parramatta NSW ztz4T: +6t z 9659 2476, F: +6t z 8266 9999,wuD.pwc.com.au
Liability limited by a scheme approved under Professional Standards Legislation
For
per
sona
l use
onl
y

pwe
flow our qudit sddressedthe keg auclitmstte?
Key <tuditmo'tter
Basis of prepan'ation offinancial repot'tRefer to note z
Assessing the appropriateness ofthe Company's basisofpreparation for the financial report was a key auditmatter due to its importance to the financial reportand the level ofjudgement involved in assessingfuture funding and operational status.
In assessing the appropriateness ofthe Company'sgoing concern basis of preparation for the financialreport, we:
Evaluated the appropriateness of theCompany's assessment of their ability tocontinue as a going concern, includingwhether the level of analysis is appropriategiven the nature of the Company, the periodcovered is at least tz months from the dateof our auditor's report and relevantinformation of which we are aware as aresult ofthe audit has been included.
a
a Enquired of management and the board ofdirectors as to its knowledge of events orconditions that may cast significant doubt onthe Company's ability to continue as a goingconcern.
Evaluated the Company's plans for futureactions (including continued fi nancialguarantee from the related parties).
Evaluated whether, in view oftherequirements of Australian AccountingStandards, the financial report providesadequate disclosures.
Responsibilities of the directors for the financial reportThe directors of the Company are responsible for the preparation and fair presentation of the financialreport in accordance with Australian Accounting Standards, and for such internal control as thedirectors determine is necessary to enable the preparation ofthe financial report that is free frommaterial misstatement, whether due to fraud or error.
In preparing the financial report, the directors are responsible for assessing the ability of the Companyto continue as a going concern, disclosing, as applicable, matters related to going concern and usingthe going concern basis of accounting unless the directors either intend to liquidate the Company or tocease operations, or have no realistic alternative but to do so.
Auditor's responsibilities for the audit of the financial reportOur objectives are to obtain reasonable assurance about whether the financial report as a whole is freefrom material misstatement, whether due to fraud or error, and to issue an auditor's report thatincludes our opinion. Reasonable assurance is a high level ofassurance, but is not a guarantee that anaudit conducted in accordance with the Australian Auditing Standards will always detect a materialmisstatement when it exists. Misstatements can arise from fraud or error and are considered materialif, individually or in the aggregate, they could reasonably be expected to influence the economicdecisions ofusers taken on the basis ofthe financial report.
a
For
per
sona
l use
onl
y

IpwcA further description of our responsibilities for the audit of the financial report is located at theAuditing and Assurance Standards Board website at:http://www.auasb.gov.au/auditors_responsibilities/arz.pdf. This description forms part of ourauditor's report.
PricewaterhouseCoopersfi"^""t
/,MMardUpcroftPartner
Sydney27 August 2o1B
For
per
sona
l use
onl
y

FINANCIAL STATEMENTS
5
STATEMENT OF COMPREHENSIVE INCOME FOR THE YEAR ENDED 30 JUNE
Note 2018
$ 2017
$
Finance (costs) / income 4 (3,921) 3,180
Directors’ fees 8 - (106,491)
Net loss before income tax expense (3,921) (103,311)
Income tax expense 6 - -
Net loss for the year (3,921) (103,311)
Other comprehensive income - -
Total comprehensive loss for the year, net of tax (3,921) (103,311) The above statement of comprehensive income should be read in conjunction with the accompanying notes to the financial statements.
For
per
sona
l use
onl
y

FINANCIAL STATEMENTS
6
STATEMENT OF FINANCIAL POSITION AS AT 30 JUNE
Note 2018
$ 2017
$
Non-current liabilities
Related party payables 8 2,136,901 2,132,980
Total non-current liabilities 2,136,901 2,132,980
Total liabilities 2,136,901 2,132,980
Net liabilities (2,136,901) (2,132,980)
Equity
Contributed equity 7 6,261,203 6,261,203
Accumulated losses (8,398,104) (8,394,183)
Total equity (2,136,901) (2,132,980)
The above statement of financial position should be read in conjunction with the accompanying notes to the financial statements.
The notes are an integral part of the financial statements.
Signed on behalf of the Board:
_________________________ Director _________________________ Director
Sydney, 27 August 2018 For
per
sona
l use
onl
y
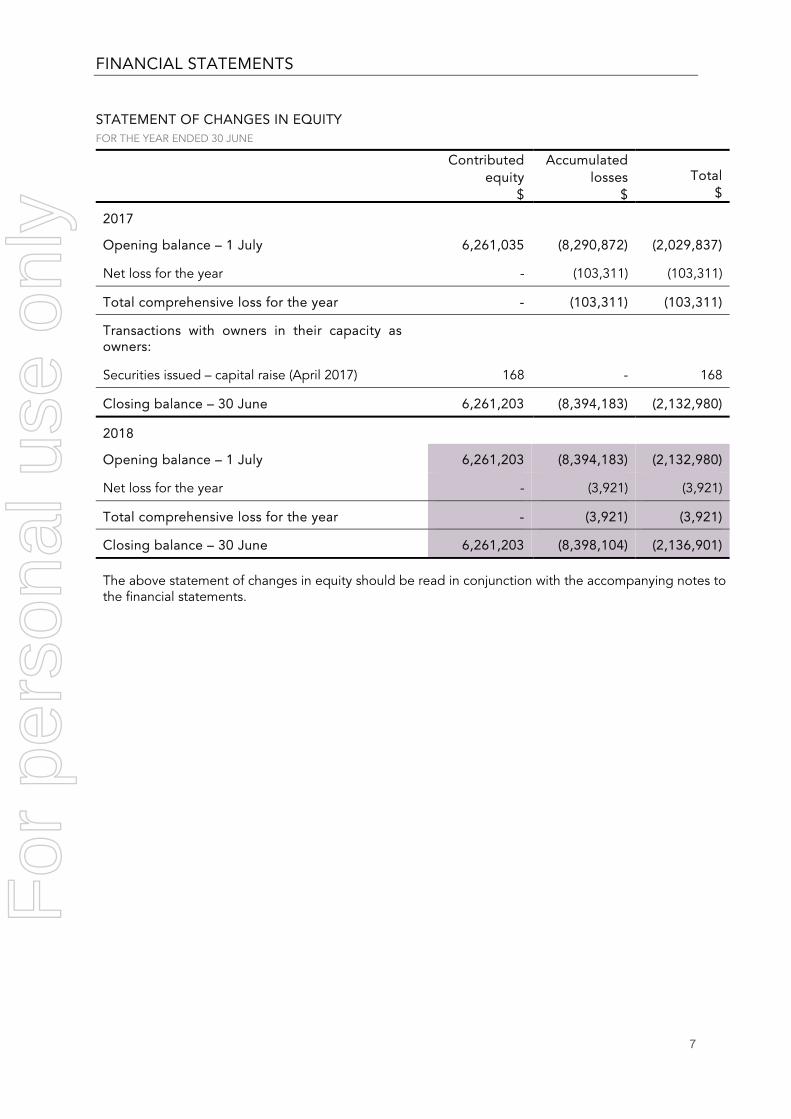
FINANCIAL STATEMENTS
7
STATEMENT OF CHANGES IN EQUITY FOR THE YEAR ENDED 30 JUNE
Contributed equity
$
Accumulated losses
$ Total
$
2017
Opening balance – 1 July 6,261,035 (8,290,872) (2,029,837)
Net loss for the year - (103,311) (103,311)
Total comprehensive loss for the year - (103,311) (103,311)
Transactions with owners in their capacity as owners:
Securities issued – capital raise (April 2017) 168 - 168
Closing balance – 30 June 6,261,203 (8,394,183) (2,132,980)
2018
Opening balance – 1 July 6,261,203 (8,394,183) (2,132,980)
Net loss for the year - (3,921) (3,921)
Total comprehensive loss for the year - (3,921) (3,921)
Closing balance – 30 June 6,261,203 (8,398,104) (2,136,901)
The above statement of changes in equity should be read in conjunction with the accompanying notes to the financial statements.
For
per
sona
l use
onl
y

FINANCIAL STATEMENTS
8
STATEMENT OF CASH FLOW FOR THE YEAR ENDED 30 JUNE
2018
$ 2017
$
Cash flows from operating activities
Loss for the year (3,921) (103,311)
Adjustments for:
Increase in related party payables 3,921 103,311
Net cash flow from operating activities - -
Net movement in cash and cash equivalents - -
Opening cash and cash equivalents - -
Closing cash and cash equivalents - -
The above statement of cash flow should be read in conjunction with the accompanying notes to the financial statements.
For
per
sona
l use
onl
y
NOTES TO THE FINANCIAL STATEMENTS
9
1. Report overview
This financial report consists of the financial statements and accompanying notes of Infigen Energy (Bermuda) Limited (IEBL or the Company).
The Company forms part of a stapled structure, comprising Infigen Energy Limited (IEL), Infigen Energy Trust (IET), and the Company. One share in each of IEL and the Company, and one unit in IET have been stapled together to form a single stapled security traded on the ASX under the code ‘IFN’.
The Company is limited by shares and incorporated in Bermuda.
2. Basis of preparation
The Company is a for-profit entity for the purposes of preparing financial statements.
These financial statements are general purpose financial statements, and have been prepared in accordance with the Australian Accounting Standards and Section 14(1)(a) of the Investments Funds Act 2006 of Bermuda that requires preparation of audited annual financial statements.
These financial statements comply with the International Financial Reporting Standards (IFRS) as issued by the International Accounting Standards Board (IASB).
Key accounting policies used in the preparation of these consolidated financial statements are disclosed throughout the accompanying notes. These accounting policies have been consistently applied to the current and prior financial year, unless otherwise stated.
Where necessary, comparative information has been reclassified to achieve consistency in disclosure with current financial year amounts.
All figures are presented in Australian Dollars with all values rounded to the nearest dollar, unless otherwise stated, in accordance with the ASIC Corporations Instrument 2016/191.
Going concern
These financial statements have been prepared on the going concern basis using the historical cost conventions.
As at the reporting date, the Company had a deficiency of capital of $2,136,901 (2017: $2,132,980) representing its related party loans payable. Included in the Company’s non-current liabilities are amounts totalling $2,136,901 (2017: $2,132,980) to IEL and IET. A related party has provided a financial guarantee of at least this amount for going concern purposes.
Refer to Note 8 for details of the related party transactions.
Critical accounting estimates and judgements
The preparation of these financial statements requires estimation and judgement. The Company has assessed that there were no estimates and assumptions made during the financial year that have a significant risk of causing a material adjustment to the financial statements.
For
per
sona
l use
onl
y
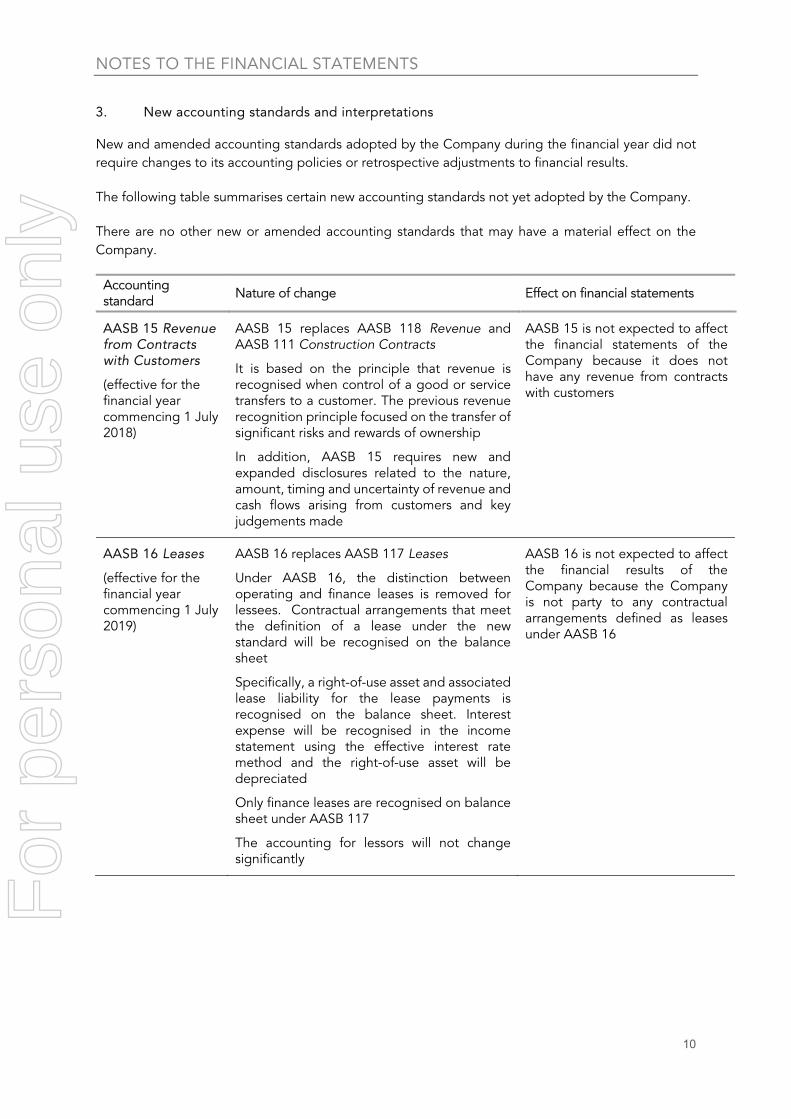
NOTES TO THE FINANCIAL STATEMENTS
10
3. New accounting standards and interpretations
New and amended accounting standards adopted by the Company during the financial year did not require changes to its accounting policies or retrospective adjustments to financial results.
The following table summarises certain new accounting standards not yet adopted by the Company.
There are no other new or amended accounting standards that may have a material effect on the Company.
Accounting standard Nature of change Effect on financial statements
AASB 15 Revenue from Contracts with Customers
(effective for the financial year commencing 1 July 2018)
AASB 15 replaces AASB 118 Revenue and AASB 111 Construction Contracts
It is based on the principle that revenue is recognised when control of a good or service transfers to a customer. The previous revenue recognition principle focused on the transfer of significant risks and rewards of ownership
In addition, AASB 15 requires new and expanded disclosures related to the nature, amount, timing and uncertainty of revenue and cash flows arising from customers and key judgements made
AASB 15 is not expected to affect the financial statements of the Company because it does not have any revenue from contracts with customers
AASB 16 Leases
(effective for the financial year commencing 1 July 2019)
AASB 16 replaces AASB 117 Leases
Under AASB 16, the distinction between operating and finance leases is removed for lessees. Contractual arrangements that meet the definition of a lease under the new standard will be recognised on the balance sheet
Specifically, a right-of-use asset and associated lease liability for the lease payments is recognised on the balance sheet. Interest expense will be recognised in the income statement using the effective interest rate method and the right-of-use asset will be depreciated
Only finance leases are recognised on balance sheet under AASB 117
The accounting for lessors will not change significantly
AASB 16 is not expected to affect the financial results of the Company because the Company is not party to any contractual arrangements defined as leases under AASB 16
For
per
sona
l use
onl
y

NOTES TO THE FINANCIAL STATEMENTS
11
4. Finance (costs) / income
The Company recognises gains and losses in relation to related party loans which are denominated in foreign currency.
2018 $
2017 $
Net unrealised foreign exchange (loss) / gain (3,921) 3,180
5. Auditor’s remuneration
PricewaterhouseCoopers (PwC) continues to act as the independent auditor to the Company and has provided audit services during the year. The Company’s audit fees are borne by a related party entity within the stapled structure.
2018 $
2017 $
Audit of financial statements 7,000 7,000
6. Income tax
Income tax expense is the tax payable on the financial year’s taxable income based on the tax rate of the applicable jurisdiction. The Company does not recognise deferred tax assets in connection with losses recognised for current and prior financial years because there is no expectation to realise the benefits in the foreseeable future.
7. Contributed equity
Contributed equity consists of fully-paid ordinary shares.
Shareholders are entitled to receive declared dividends, vote at shareholders’ meetings, and receive a proportional share of proceeds in the event of winding up of the Company.
No shares were issued or capital returned to shareholders during the financial year (2017: Nil).
Ordinary shares on issue and fully paid 2018 2017
Carrying amount ($)
Opening – 1 July 6,261,203 6,261,035
Securities issued – capital raise (April 2017) - 168
Closing balance – 30 June 6,261,203 6,261,203
Number
Opening – 1 July 950,259,000 772,469,000
Securities issued – capital raise (April 2017) - 177,790,000
Closing balance – 30 June 950,259,000 950,259,000
For
per
sona
l use
onl
y
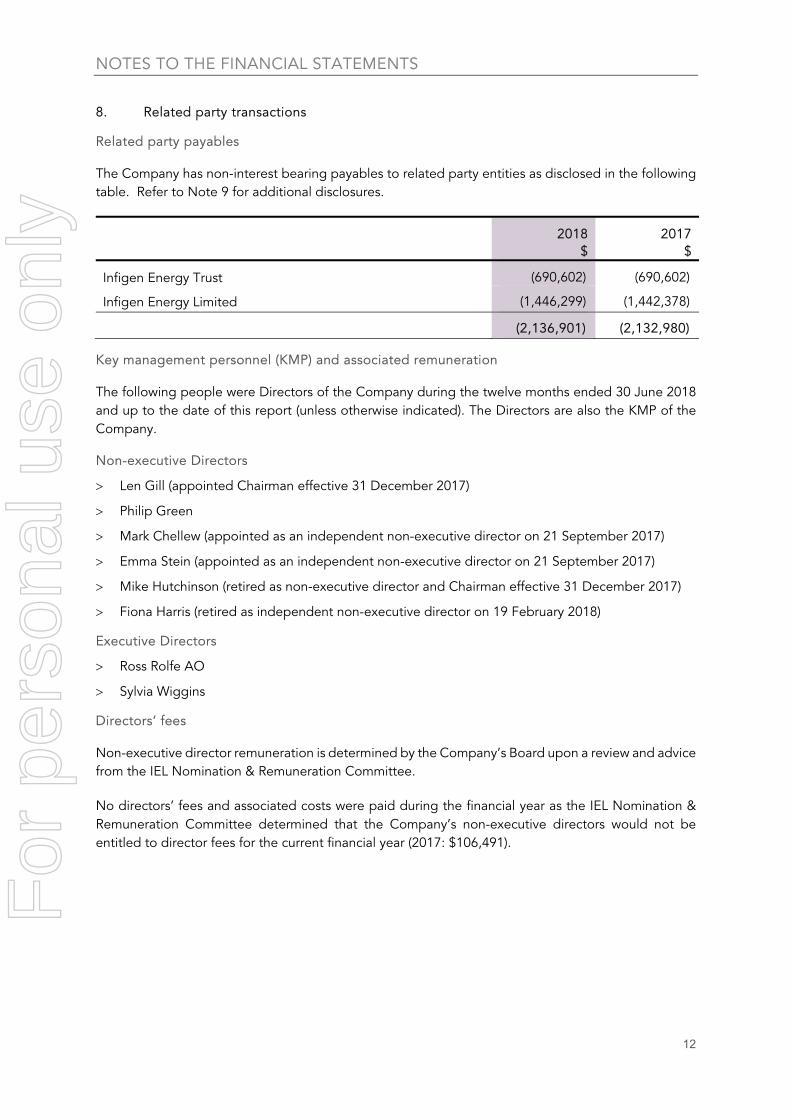
NOTES TO THE FINANCIAL STATEMENTS
12
8. Related party transactions
Related party payables
The Company has non-interest bearing payables to related party entities as disclosed in the following table. Refer to Note 9 for additional disclosures.
2018 $
2017 $
Infigen Energy Trust (690,602) (690,602)
Infigen Energy Limited (1,446,299) (1,442,378)
(2,136,901) (2,132,980)
Key management personnel (KMP) and associated remuneration
The following people were Directors of the Company during the twelve months ended 30 June 2018 and up to the date of this report (unless otherwise indicated). The Directors are also the KMP of the Company.
Non-executive Directors
Len Gill (appointed Chairman effective 31 December 2017)
Philip Green
Mark Chellew (appointed as an independent non-executive director on 21 September 2017)
Emma Stein (appointed as an independent non-executive director on 21 September 2017)
Mike Hutchinson (retired as non-executive director and Chairman effective 31 December 2017)
Fiona Harris (retired as independent non-executive director on 19 February 2018)
Executive Directors
Ross Rolfe AO
Sylvia Wiggins
Directors’ fees
Non-executive director remuneration is determined by the Company’s Board upon a review and advice from the IEL Nomination & Remuneration Committee.
No directors’ fees and associated costs were paid during the financial year as the IEL Nomination & Remuneration Committee determined that the Company’s non-executive directors would not be entitled to director fees for the current financial year (2017: $106,491).
For
per
sona
l use
onl
y

NOTES TO THE FINANCIAL STATEMENTS
13
9. Financial risk management
Risk management is facilitated by IEL’s centralised treasury function using specific policies and procedures approved by the IEL board.
The Company is subject to liquidity risk, which is the risk of not meeting obligations of financial liabilities.
The Company has non-interest bearing related party payables classified as non-current in the statement of financial position as at the reporting date, and as disclosed in Note 8. On 24 August 2017, a related party provided a financial guarantee to the Company to pay its debts when they become due and payable up to a maximum amount of $2,200,000.
10. Commitments and contingencies
The Company has no commitments or contingent assets / liabilities which are individually or categorically material (2017: Nil).
11. Events occurring after the reporting period
There were no transactions or events of a material or unusual nature, not otherwise dealt with within this report, likely to affect significantly the operations or affairs of the Company in future financial periods.
For
per
sona
l use
onl
y