for personal use only - home - australian securities ...ˆ’introduced new international bank...
TRANSCRIPT

Charter Hall Retail REIT
FY16 Half Year Results
18 February 2016
For
per
sona
l use
onl
y

1 FY16 Half Year Results
2 Operational Performance
3 Portfolio Investments
4 Financial Performance
5 Strategy and Outlook
2
Agenda
Charter Hall Retail REIT | Half Year Results | 31 December 2015
Scott Dundas Fund Manager
Philip Schretzmeyer Group Treasurer
Christine Kelly Head of Retail Finance F
or p
erso
nal u
se o
nly

FY16 Half Year Results F
or p
erso
nal u
se o
nly

Operating earnings of 15.18 cpu, growth of
2.1% on pcp NTA per unit up 4.2%
to $3.74 15% increase
in portfolio value to $2.5 billion
Weighted average debt maturity of 6.7 years
Look through gearing 35.4%
Same property NOI growth of 2.4%
4
Key Achievements Half Year Ended 31 December 2015
Charter Hall Retail REIT | Half Year Results | 31 December 2015
For
per
sona
l use
onl
y

Strategy Achievements Active management • Occupancy maintained at 98.4%
• Same property NOI growth of 2.4% • Specialty rent growth of 1.4% achieved from 61 renewals and 901 new leases
• Specialty MAT growth of 3.5% reflecting continued focus on specialty leasing
Enhancing the portfolio quality • Portfolio valued at $2.5 billion, a 15% increase since June 2015
• Focus on recycling from non-core properties to larger, higher growth properties
− Acquired four properties in 1H 16 for $227.8 million at a yield of 7.0% − Contracted to dispose of two non-core properties for $20.3 million
• Redevelopment work at Secret Harbour commenced
Prudent capital management • Look through gearing of 35.4%, in the middle of the target range of 30% - 40%
• Increasing debt diversity for the REIT
− Second US Private Placement market issuance
− Introduced new international bank lender to the REIT
• Weighted average debt maturity of 6.72 years
• Moody’s Baa1 credit rating assigned to CQR
5
1. Includes 64 non-comparable new lease deals that do not impact specialty rent growth 2. Includes post balance date debt extensions completed. See debt maturity slide for more details All values represent CQR’s ownership share
Consistent Delivery on Strategy Highlights
Charter Hall Retail REIT | Half Year Results | 31 December 2015
For
per
sona
l use
onl
y

6
1. Operating earnings is a financial measure which represents the net profit under Australian Accounting Standards adjusted for certain unrealised and non-cash items, reserve transfers, capital transactions and other non-core items. Operating earnings is equivalent to the Property Council definition of Funds from Operations
2. Calculated on a cents per unit basis 3. Includes $9.0 million raised from the February 2016 DRP, $20.3 million in proceeds from the sale of Ballajura in February 2016 and Collie in March 2016 and $50 million of additional bank debt funding, terms agreed post balance date 4. Calculated as distributions plus NTA growth for the 12 month period divided by NTA at 31 December 2014
Half Year Results 31 December 2015 Key metrics 1H 16 1H 15 Movement
Statutory profit $104.4m $84.3m +23.8%
Operating earnings1 $58.9m $55.3m +6.5%
Operating earnings1 per unit 15.18 cents 14.87 cents +2.1%
Distributions per unit 14.00 cents 13.70 cents +2.2%
Payout ratio2 92.2% 92.1% +0.1%
Dec 15 Jun 15 Movement
Net tangible assets per unit $3.74 $3.59 +4.2%
Property portfolio $2,484m $2,163m +14.8%
Look through gearing 35.4% 33.6% +1.8%
Balance sheet gearing 31.3% 31.3% -
Weighted average debt maturity 6.7 years 5.8 years +15.5%
Cash and undrawn debt capacity3 $177m $142m +24.6%
Charter Hall Retail REIT | Half Year Results | 31 December 2015
Delivered total return of 18.2%4 for the 12 months to December 2015 For
per
sona
l use
onl
y

Operational Performance Active Management
For
per
sona
l use
onl
y

8
1. Excludes properties under redevelopment WALE calculated by weighting the REIT’s share of base rent
Portfolio Summary
Summary by Asset Type # GLA (‘000sqm) Occupancy1 Same Property
NOI Growth
Sub-regional shopping centres 20 287.4 98.8% 2.6%
Neighbourhood shopping centres 39 224.6 97.5% 2.1%
Freestanding supermarkets 17 56.1 100.0% 3.1%
Total 76 568.1 98.4% 2.4%
Portfolio and anchor WALE of 6.8 and 10.3 years
NSW 42%
ACT 4%
Qld 20%
NT 1%
Vic 11%
SA 6%
WA 15%
Tas 1%
Asset Value by State
Metropolitan 42%
Non-Metropolitan
58%
Asset Value by Location
Charter Hall Retail REIT | Half Year Results | 31 December 2015
For
per
sona
l use
onl
y

0.6%
0.7%
0.7%
0.8%
0.9%
1.2%
1.5%
1.6%
24.1%
26.1%
St George Bank
Specialty FashionGroup*****
Pretty Girl FashionGroup****
Sigma Pharmaceuticals***
Commonwealth Bank
Retail Food Group**
Australian PharmaceuticalIndustries*
The Reject Shop
Wesfarmers subsidiaries
Woolworths
Top ten tenants by base rent • Wesfarmers and Woolworths businesses represent 50% of base rent
− 39% from Supermarkets and Liquor − 11% from Discount Department Stores
• 41% of anchor tenants are paying turnover rent
• 22% are within 10% of their turnover threshold
• Anchor tenant MAT growth of 1.2%1
• Total turnover rent represents 2.9% of total net rent
• After the top two tenants, the next eight tenants combined represent only 8% of base rent
9
1. Calculated on a 12 month rolling basis for stores in turnover, excluding redevelopments
Anchor Tenants
*including Soul Pattinson, Priceline **including Brumby’s, Donut King, Michel’s Patisserie ***Including Amcal Pharmacy ****Including Rockmans, Be Me and W Lane *****Including Crossroads, Millers, Katies, Autograph, City Chic
For
per
sona
l use
onl
y

• Average specialty gross rent $849/sqm
• Weighted average rent reviews of 4.1%
• Specialty rent growth of +1.4%:
− +0.4% on 61 renewals − +4.3% on 26 new leases
• Specialty retention rate of 86%
• National specialty retailers represent 59% of the REIT’s specialty tenants
10
1. 54% of the REIT’s specialty tenants by ABR have reported sales for 24 months
Specialty Tenants Summary by State and Location MAT Growth1 Occupancy Cost1 MAT/sqm
New South Wales & ACT 3.1% 10.8% $8,752
Queensland 7.4% 8.0% $9,333
Victoria 5.3% 12.3% $8,094
South Australia 0.6% 8.6% $7,598
Western Australia 0.1% 6.6% $10,687
Metropolitan 2.8% 11.0% $9,177
Non-Metropolitan 4.0% 8.4% $8,926
Total 3.5% 9.4% $9,020
Charter Hall Retail REIT | Half Year Results | 31 December 2015
For
per
sona
l use
onl
y

Portfolio Investments Enhancing the Portfolio Quality
11
For
per
sona
l use
onl
y

12
• Property valuations increased by $59.5 million or 2.5% over the half year
• Weighted average cap rates continued to firm at December, with half year compression of 26 basis points driving NTA growth for the REIT
• Value uplift driven by cap rates with adopted valuation rents remaining flat
1. Represents June 2015 book value adjusted for capital expenditure, acquisitions and disposals over the six month period 2. Excludes acquisition costs of $7.2m and revaluation adjustments relating to straightlining of rental income, amortisation of lease incentives and capitalisation of leasing fees
Revaluations
Six months to December 2015 Freestanding Neighbourhood Sub-regional Total
Number of properties 17 39 20 76 December 2015 valuation (A$m) 213.6 1,103.3 1,167.1 2,484.0 Prior book value1 (A$m) 203.9 1,071.9 1,148.7 2,424.5 Movement in book value2 (A$m) 9.7 31.4 18.4 59.5 Variance (%) 4.8% 2.9% 1.6% 2.5% Weighted avg cap rates – December 2015 6.62% 6.95% 6.88% 6.89% Weighted avg cap rates – June 2015 6.89% 7.20% 7.16% 7.15%
Charter Hall Retail REIT | Half Year Results | 31 December 2015
For
per
sona
l use
onl
y

13
• Continues strategy of enhancing the REIT’s portfolio quality by recycling out of non-core properties into larger, higher growth potential properties
• Average asset value has increased from $32.7 million at June 2015 to $37.6 million at December 2015
1. Values reflect CQR’s ownership share, GLA reflects 100% interest
Capital Transactions Capital Recycling
GLA (sqm) Value $m Yield Settlement
Acquisitions
Brickworks Marketplace, SA1 (50% interest) 16,896 37.9 6.9% July 2015
Goulburn Plaza, NSW & Katherine Central, NT 21,082 94.9 7.2% August 2015
Bateau Bay Square, NSW1 (47.5% interest) 29,062 95.0 6.8% November 2015
Total 67,040 227.8 7.0%
Disposals
Ballajura Central, WA 4,680 13.5 6.5% February 2016
Collie Central, WA 4,508 6.8 6.4% March 2016 (est.)
Total 9,118 20.3 6.5%
Charter Hall Retail REIT | Half Year Results | 31 December 2015
For
per
sona
l use
onl
y
14
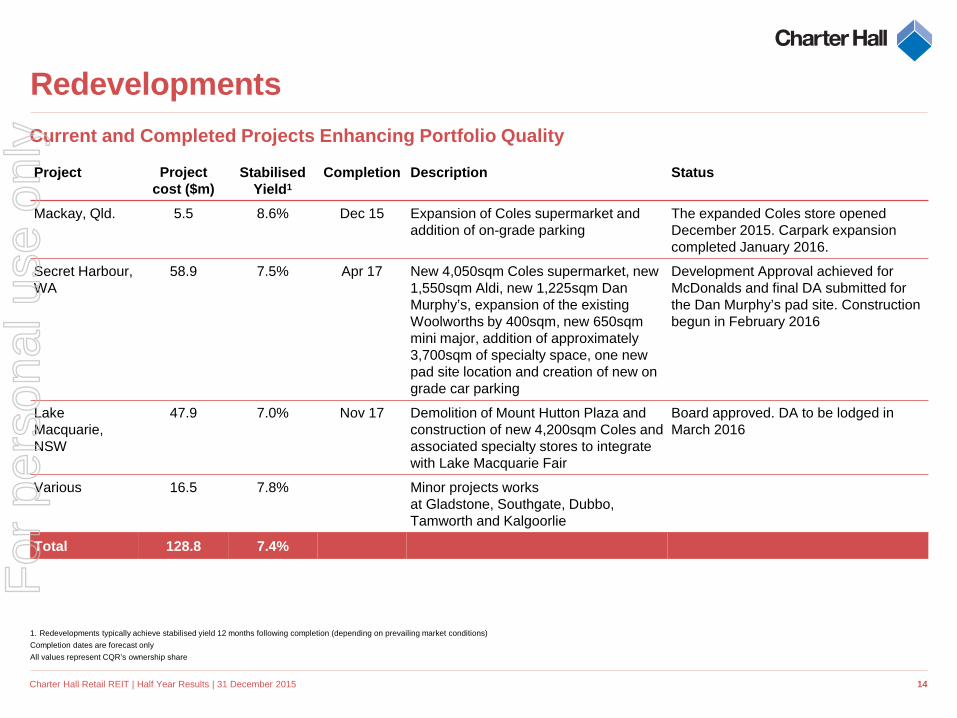
1. Redevelopments typically achieve stabilised yield 12 months following completion (depending on prevailing market conditions) Completion dates are forecast only All values represent CQR’s ownership share
Redevelopments Current and Completed Projects Enhancing Portfolio Quality
Project Project cost ($m)
Stabilised Yield1
Completion Description Status
Mackay, Qld. 5.5 8.6% Dec 15 Expansion of Coles supermarket and addition of on-grade parking
The expanded Coles store opened December 2015. Carpark expansion completed January 2016.
Secret Harbour, WA
58.9 7.5% Apr 17 New 4,050sqm Coles supermarket, new 1,550sqm Aldi, new 1,225sqm Dan Murphy’s, expansion of the existing Woolworths by 400sqm, new 650sqm mini major, addition of approximately 3,700sqm of specialty space, one new pad site location and creation of new on grade car parking
Development Approval achieved for McDonalds and final DA submitted for the Dan Murphy’s pad site. Construction begun in February 2016
Lake Macquarie, NSW
47.9 7.0% Nov 17 Demolition of Mount Hutton Plaza and construction of new 4,200sqm Coles and associated specialty stores to integrate with Lake Macquarie Fair
Board approved. DA to be lodged in March 2016
Various 16.5 7.8% Minor projects works at Gladstone, Southgate, Dubbo, Tamworth and Kalgoorlie
Total 128.8 7.4%
Charter Hall Retail REIT | Half Year Results | 31 December 2015
For
per
sona
l use
onl
y

Financial Performance Prudent Capital Management
For
per
sona
l use
onl
y
16
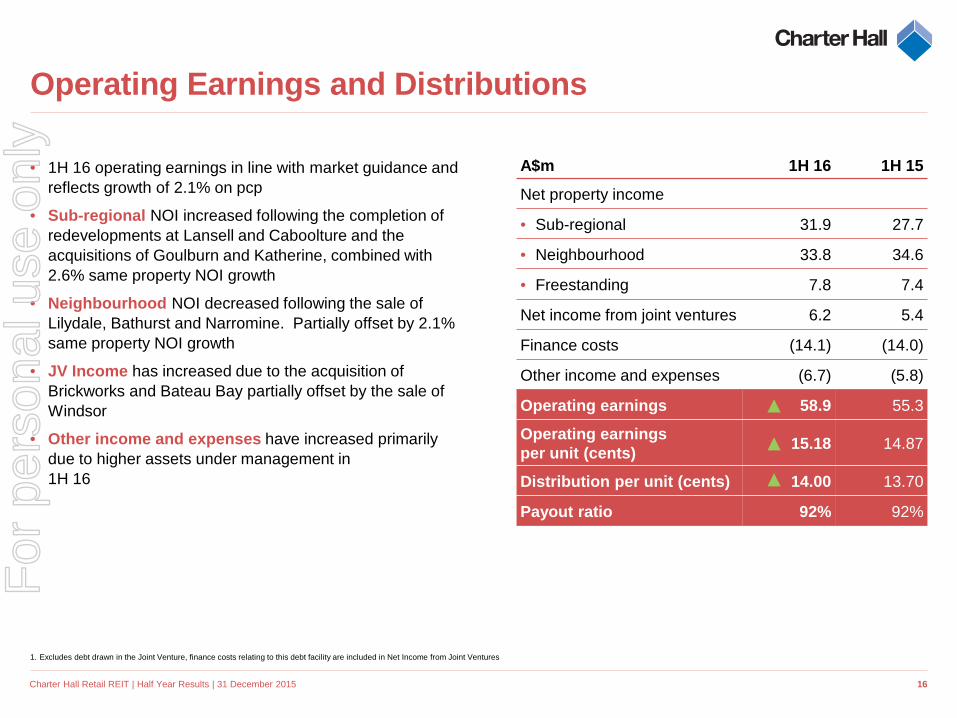
• 1H 16 operating earnings in line with market guidance and reflects growth of 2.1% on pcp
• Sub-regional NOI increased following the completion of redevelopments at Lansell and Caboolture and the acquisitions of Goulburn and Katherine, combined with 2.6% same property NOI growth
• Neighbourhood NOI decreased following the sale of Lilydale, Bathurst and Narromine. Partially offset by 2.1% same property NOI growth
• JV Income has increased due to the acquisition of Brickworks and Bateau Bay partially offset by the sale of Windsor
• Other income and expenses have increased primarily due to higher assets under management in 1H 16
1. Excludes debt drawn in the Joint Venture, finance costs relating to this debt facility are included in Net Income from Joint Ventures
Operating Earnings and Distributions
A$m 1H 16 1H 15
Net property income
• Sub-regional 31.9 27.7
• Neighbourhood 33.8 34.6
• Freestanding 7.8 7.4
Net income from joint ventures 6.2 5.4
Finance costs (14.1) (14.0)
Other income and expenses (6.7) (5.8)
Operating earnings 58.9 55.3
Operating earnings per unit (cents) 15.18 14.87
Distribution per unit (cents) 14.00 13.70
Payout ratio 92% 92%
Charter Hall Retail REIT | Half Year Results | 31 December 2015
For
per
sona
l use
onl
y

• Properties under management increased due to:
− Development, maintenance capex and lease incentives totaling $34 million
− Acquisitions of $228 million − Revaluation uplift of $59 million
• Total debt has increased due to acquisitions and capital expenditure offset by equity raised during the period ($108 million) and FX revaluations on USPP (offset by derivative movements below)
• Other assets have increased primarily due to cross currency swap derivative revaluations
• NTA growth from positive revaluations across the portfolio (+13cpu), retained operating earnings (+1cpu) and acquisitions (+4cpu) was offset by negative derivative valuation movements (-3cpu)
• Look through gearing is in the middle of the target range of 30%-40%
17
All values presented on a look through basis and net of cash
Balance Sheet
Dec 15 Jun 15
Wholly owned properties 2,121 1,938
Debt (750) (658)
JV properties 363 225
JV Debt (150) (73)
Other assets 31 12
Other liabilities (113) (94)
Net assets 1,502 1,350
Units on issue (millions) 402 376
NTA per unit ($) 3.74 3.59
Look through gearing 35.4% 33.6%
Charter Hall Retail REIT | Half Year Results | 31 December 2015
For
per
sona
l use
onl
y

18
Case Study – Debt Restructure
• Following the completion of the restructure of the REIT’s debt platform in
July 2015 the focus has continued on diversifying and extending the
REIT’s debt profile
• Bank debt expiry in January 2017 represented next opportunity to further
implement this strategy
• As recently announced the REIT will issue a second USPP with a 10 year
tranche of US$125m (A$177m) to refinance this facility well ahead of
expiry
• To further improve the REIT’s liquidity terms have been agreed for a
A$50m five year bi-lateral bank debt facility with an international lender
• The REIT has also restructured its hedge book as part of these
transactions resulting in a:
– Reduction to the overall cost of debt
– Extension of the weighted average debt and hedge maturity to 6.7
years and 4.5 years respectively
December 20151 Syndicated Bank debt -
$585m
USPP – A$252m
Post initiatives1 Syndicated Bank debt -
$435m
USPP #1 – A$252m
USPP #2 – A$177m
Bi-lateral bank facility - $50m
Charter Hall Retail REIT | Half Year Results | 31 December 2015
1. Balance sheet debt only
For
per
sona
l use
onl
y

• Debt maturity profile reflects defensive nature of the REIT’s portfolio which now has a weighted average debt maturity of 6.7 years
• No debt maturities until FY19 removes all short term refinance risk for the REIT
• Weighted average hedge expiry of 4.5 years also aligned with objective to remove finance cost volatility from the REIT’s earnings growth profile
19
1. Includes line fee (including cost of undrawn debt) and usage fee and excludes amortisation of upfront debt costs 2. Incorporates February 2016 USPP, new $50m bilateral debt facility and swap restructure, post balance date events 3. For the next 12 month period
Debt Maturity Profile
Key metrics Dec 15 Jun 15 Average interest cost1 4.5% 4.6%
Weighted average debt maturity2 6.7 years 5.8 years
Weighted average hedge maturity2 4.5 years 3.5 years
Interest rate hedging3 75% 81%
ICR 4.6x 4.6x
Debt Maturity Profile2
0
50
100
150
200
250
300
350
400
450
USPP Non-recourse JV A$ bank debtBi-lateral Bank Debt Facility Syndicated Bank Debt FacilityUndrawn
Charter Hall Retail REIT | Half Year Results | 31 December 2015
For
per
sona
l use
onl
y

Strategy and Outlook F
or p
erso
nal u
se o
nly

21
Goal
Active management • Maintaining strong
tenant relationships • Optimising tenancy mix
through proactive leasing
• Enhancing the overall shopper experience
The pre-eminent owner and manager of Australian neighbourhood and sub-regional
supermarket anchored shopping centres that optimises returns for our investors
Key drivers
Enhance portfolio quality • Value enhancing
redevelopment • Selective acquisitions • Non-core disposals
Prudent capital management • Strong and flexible
balance sheet • Prudent gearing • Sustainable payout ratio
REIT Strategy
Charter Hall Retail REIT | Half Year Results | 31 December 2015
For
per
sona
l use
onl
y

22
Retail Environment
• Australian retail sales have been improving over the past 12 months with NSW and Vic recording the highest level of sales growth
• Continued falls in both the AUD and the household savings ratio continue to provide tailwinds for the sector
• The REIT’s specialty tenants have benefited from this trend, with MAT growth up from 1.5% at June 2014 to 3.5% at December 2015
• Supermarket operators have reacted to increased competition by increasing refurbishments and expansions which have typically delivered a higher return for capital employed than achieved for new supermarket openings
• Woolworths have announced a new strategy which includes focusing on store refurbishments rather than opening new stores and disbanding the Masters brand to focus on their core supermarkets business
Retail Sales Growth1
1. Source: ABS
Charter Hall Retail REIT | Half Year Results | 31 December 2015
0.0%
1.0%
2.0%
3.0%
4.0%
5.0%
6.0%
NSW VIC QLD SA WA
1-yr Growth % 5-yr CAGR % 10-yr CAGR % 20-yr CAGR %
For
per
sona
l use
onl
y

• We confirm that, barring unforeseen events, the REIT’s FY16 guidance for operating earnings remains unchanged between 30.25 cents and 30.75 cents per unit
• Distribution payout ratio range is expected to be between 90% and 95% of operating earnings
Sydney Street Markets, QLD
FY16 Outlook F
or p
erso
nal u
se o
nly

Questions F
or p
erso
nal u
se o
nly

25
Annexures
1 Detailed Earnings 26
2 Funds from Operations (FFO) 27
3 NTA & Cash flow Reconciliation 28
4 Debt & Interest Rate Management 29
5 Capital Expenditure & Redevelopment Pipeline 30
6 Lease Expiry Profiles 32
7 Property Valuations 33
8 Industry & Market Overview 37
9 Typical Lease Structures 39
10 Historical Performance 40
11 Glossary 41
Charter Hall Retail REIT | Half Year Results | 31 December 2015
For
per
sona
l use
onl
y

26
Annexure 1 Detailed Earnings
(All Values in A$m) Share of profits from investment in JV’s
Dec 2015
Statutory Profit
Dec 2015 Unrealised & Capital Items
Dec 2015
Operating Earnings
Dec 2014
Operating Earnings Net property income • Sub-regional 5.9 - 5.9 4.2 • Neighbourhood 3.1 - 3.1 3.5 Property valuation gains 8.3 (8.3) - - Finance costs (2.7) - (2.7) (2.2) Net unrealised gain on derivative financial instruments 0.6 (0.6) - - Other expenses (0.1) - (0.1) (0.1) Total 15.1 (8.9) 6.2 5.4 Net property income • Sub-regional 31.4 0.5 31.9 27.7 • Neighbourhood 32.6 1.2 33.8 34.6 • Freestanding 7.7 0.1 7.8 7.4 Property valuation gains 44.5 (44.5) - - Loss on disposal of investment properties (0.3) 0.3 - - Other income 0.1 - 0.1 0.2 Unrealised loss from derivative financial instruments (5.3) 5.3 - - Management fees (5.1) - (5.1) (4. 5) Finance costs (14.6) 0.5 (14.1) (14.0) Trust expenses (1.7) - (1.7) (1.5) Earnings 104.4 (45.5) 58.9 55.3 Operating earnings per unit (cents) 15.18 14.87 Distribution per unit (cents) 14.00 13.70
Charter Hall Retail REIT | Half Year Results | 31 December 2015
For
per
sona
l use
onl
y

27
Annexure 2 Funds from Operations (FFO)
Charter Hall Retail REIT | Half Year Results | 31 December 2015
1H 16 ($m) 1H 16 (cpu) Statutory Profit 104.4 26.90 Net valuation gains on investment properties (60.0) (15.45)
Write off of acquisition costs incurred on investment properties 7.2 1.85
Unrealised losses on derivatives 4.7 1.21
Net loss on disposal of investment properties 0.3 0.08
Write off of capitalised borrowing costs related to extinguished debt costs 0.5 0.13
Other 1.8 0.46
Funds from Operations (FFO) / Operating Earnings 58.9 15.18 Less: Maintenance capex (2.3) (0.59)
Less: Lease incentives paid/accrued (2.7) (0.70)
Adjusted Funds from Operations (AFFO) 53.9 13.89
Distribution 56.3 14.00
For
per
sona
l use
onl
y

28
Annexure 3
$3.59 (0.03)
$3.74
+0.04
+0.01 +0.13
NTA at30 Jun 2015
Derivative MtMmovement
Acquisitions Property revaluationuplift
Operating earnings(net of distribution)
NTA at31 Dec 2015
NTA per unit reconciliation
Operating earnings to operating cash flows reconciliation
$58.9m ($2.4m) $56.5m
Operatingearnings 1H 16
Change in working capital balances Net cash flows fromoperating activities 1H 16
Charter Hall Retail REIT | Half Year Results | 31 December 2015
For
per
sona
l use
onl
y

29
Debt maturities & covenants
1. Indicative drawn balance based on proforma 31 December position adjusted for receipt of USPP proceeds and drawdown of bilateral bank debt facility 2. Excludes line fee on undrawn debt and assumes all debt refinanced at constant margin at maturity
Annexure 4 Debt and Interest Rate Management
Post refinance initiatives (All Values CQR Share)
Limit (A$m)
Drawn (A$m) Rate Maturity Financial Covenants Covenant Actual
JV debt – CHRP1 117.5 109.3 Floating Jul-18 LVR ICR
55.0% 2.0x
40.5% 3.5x
JV debt – CHRP2 47.5 42.4 Floating Oct-20 LVR ICR
60.0% 1.5x
44.7% 2.9x
Syndicated bank debt facility 435.0 274.41 Floating $150m Jul-18 $285m Jul-20
LVR
ICR 50.0%
2.0x 39.1%
4.6x
Bi-lateral bank debt facility 50.0 50.0 Floating Feb-21
USPP – May 2016 177.4 177.4 Floating May-26
USPP – July 2015 251.6 251.6 Floating Jul-27
Grand total 1,079.0 905.1
Interest rate risk management 2H 16 FY17 FY18 FY19
Weighted average hedge book (A$m) 679 679 599 449
Weighted average debt margin2 1.7% 1.7% 1.7% 1.7%
Weighted average hedge rate 2.5% 2.5% 2.3% 2.3%
Charter Hall Retail REIT | Half Year Results | 31 December 2015
For
per
sona
l use
onl
y

30
(A$m, CQR Share) Maintenance
Lease Incentives
Total Maintenance and Incentives Redevelopment
1H 16 2.3 2.7 5.0 28.5
FY15 6.1 3.8 9.9 51.3
FY14 7.8 2.3 10.1 59.4
Annexure 5 Capital Expenditure
Charter Hall Retail REIT | Half Year Results | 31 December 2015
For
per
sona
l use
onl
y

18
21
21
25
27
36
36
42
Caboolture | $17.8m
Lansell Plaza | $42.6m
Sydney Street Markets | $5.5m
Secret Harbour | $58.9m
Lake Macquarie | $47.9m
Albany Plaza | $8.6m
Allenstown (Stage 2) | $27.4m
Murwillumbah | $12.3m
Rosebud | $44.8m
Wanneroo | $20.4m
Carnes Hill | $29.2m
Erindale | $24.1m
Complete Underway Opportunities
31
All values represent CQR share
Annexure 5 Major Projects Redevelopment Pipeline
FY16 FY17 FY15 FY18
Charter Hall Retail REIT | Half Year Results | 31 December 2015
FY19
For
per
sona
l use
onl
y

0.8% 5.2% 4.4%
1.2% 4.7% 8.7% 6.5% 9.1%
59.4%
0%
10%
20%
30%
40%
50%
60%
70%
80%
2H 16 FY17 FY18 FY19 FY20 FY21 FY22 FY23 FY24+
32
Excludes properties under redevelopment
Annexure 6 Lease Expiry Profile
8.5%
16.5% 18.0% 15.8%
13.0% 13.8%
5.8% 3.8% 4.8%
0%
5%
10%
15%
20%
25%
30%
2H 16 FY17 FY18 FY19 FY20 FY21 FY22 FY23 FY24+
Anchor tenant expiry WALE 10.3 years
Portfolio WALE of 6.8 years
Specialty tenant expiry WALE 3.4 years
Charter Hall Retail REIT | Half Year Results | 31 December 2015
For
per
sona
l use
onl
y

33
All values represent CQR ownership share
Annexure 7 Property Valuations as at 31 December 2015
State Property Location Asset Type Interest % Book Value
($m) Cap Rate ACT Dickson Woolworths Dickson Freestander 100% 16.5 6.50% Erindale Shopping Centre Wanniassa Neighbourhood 100% 35.5 7.00% Manuka Terrace Manuka Neighbourhood 100% 45.0 6.75% ACT Total 97.0 NSW Balo Square Moree Neighbourhood 100% 14.8 7.75%
Bateau Bay Square Bateau Bay Sub-regional 47.5% 93.3 6.50% Carnes Hill Marketplace Horningsea Park Sub-regional 50% 55.7 6.00% Cooma Woolworths Cooma Freestander 100% 13.3 6.75% Cootamundra Woolworths Cootamundra Freestander 100% 12.3 7.50% Dubbo Square Dubbo Sub-regional 100% 42.1 7.50% Earlwood Coles Earlwood Freestander 100% 19.8 5.75% Goonellabah Village Goonellabah Neighbourhood 100% 14.0 7.75% Gordon Village Centre Gordon Neighbourhood 100% 98.5 6.53%
Goulburn Shopping Centre Goulburn Sub-regional 100% 69.0 6.75% Highlands Marketplace Mittagong Sub-regional 50% 32.5 6.50% Jerrabomberra Village Jerrabomberra Neighbourhood 100% 21.8 6.75% Kings Langley Shopping Centre Kings Langley Neighbourhood 100% 34.8 6.50% Lake Macquarie Fair Mount Hutton Sub-regional 100% 65.1 6.75% Morisset Shopping Centre Morisset Neighbourhood 100% 36.4 7.00% Mount Hutton Plaza Mount Hutton Neighbourhood 100% 10.3 8.50% Mudgee Metroplaza Mudgee Neighbourhood 100% 22.8 7.00% Narrabri Coles Narrabri Freestander 100% 10.4 7.25% Orange Central Square Orange Neighbourhood 100% 48.5 6.75% Parkes Metroplaza Parkes Neighbourhood 100% 20.0 7.00%
Charter Hall Retail REIT | Half Year Results | 31 December 2015
For
per
sona
l use
onl
y

34
1. Asset currently classified as redevelopment All values represent CQR ownership share
Annexure 7
State Property Location Asset Type Interest % Book Value
($m) Cap Rate NSW Pemulwuy Marketplace Greystanes Neighbourhood 50% 13.1 6.75% Rosehill Woolworths Rosehill Freestander 100% 11.5 6.00% Rutherford Marketplace Rutherford Neighbourhood 50% 16.5 6.75% Singleton Plaza1 and Square Singleton Sub-regional 100% 118.2 6.75%
Sunnyside Mall Murwillumbah Neighbourhood 100% 36.1 7.75% Tamworth City Plaza Tamworth Sub-regional 100% 40.9 7.25%
Thornleigh Marketplace Thornleigh Neighbourhood 50% 18.1 6.50% Tumut Coles Tumut Freestander 100% 8.3 6.25% West Ryde Marketplace West Ryde Neighbourhood 50% 21.5 6.50% Young Woolworths Young Freestander 100% 15.5 6.75% NSW Total 1,035.1 NT Katherine Central Katherine Sub-regional 100% 28.6 8.25% NT Total 28.6 Qld Albany Creek Square Brisbane Neighbourhood 100% 56.4 6.75% Allenstown Square Rockhampton Neighbourhood 100% 47.8 7.25% Bribie Island Shopping Centre Bribie Island Sub-regional 100% 50.9 6.75%
Coomera Square Coomera Neighbourhood 100% 61.2 6.50% Currimundi Markets Currimundi Neighbourhood 100% 33.5 6.50% Gatton Plaza Gatton Neighbourhood 100% 18.8 7.00% Gladstone Square1 Gladstone Neighbourhood 50% 14.6 n/a Bay Plaza Hervey Bay Neighbourhood 100% 18.8 7.25% Kallangur Fair Kallangur Neighbourhood 100% 16.9 7.50% Mareeba Square Mareeba Neighbourhood 100% 16.4 7.25% Moranbah Fair Moranbah Neighbourhood 100% 23.5 8.25%
Springfield Fair Springfield Neighbourhood 100% 20.5 7.00%
Charter Hall Retail REIT | Half Year Results | 31 December 2015
Property Valuations as at 31 December 2015
For
per
sona
l use
onl
y

35
1. Asset currently classified as redevelopment All values represent CQR ownership share
Annexure 7
State Property Location Asset Type Interest % Book Value
($m) Cap Rate Sydney Street Markets1 Mackay Neighbourhood 100% 45.3 n/a Tablelands Square Atherton Neighbourhood 100% 32.0 7.00%
Qld Total 456.6 SA Brickworks Marketplace Torrensville Sub-regional 50% 37.9 6.50%
Renmark Plaza Renmark Sub-regional 100% 27.6 7.75% Southgate Plaza1 Morphett Vale Sub-regional 100% 65.5 n/a Wharflands Plaza Port Augusta Sub-regional 100% 21.8 8.00%
SA Total 152.8 TAS Newstead Coles Newstead Freestander 100% 7.8 7.50% Smithton Woolworths Smithton Freestander 100% 7.1 7.00% Wynyard Woolworths Wynyard Freestander 100% 10.0 7.00% TAS Total 24.9 Vic Bairnsdale Coles Bairnsdale Freestander 100% 12.9 6.25% Kerang Safeway Kerang Freestander 100% 14.1 7.25% Kyneton Shopping Centre Kyneton Neighbourhood 100% 16.4 6.75% Lansell Square1 Kangaroo Flat Sub-regional 100% 91.3 6.50% Moe Coles Moe Freestander 100% 17.2 6.25% Moe Kmart Moe Freestander 100% 10.9 7.00% Pakington Strand Geelong West Neighbourhood 50% 12.5 6.50% Rosebud Plaza Rosebud Sub-regional 100% 108.8 6.75% Vic Total 284.1
Charter Hall Retail REIT | Half Year Results | 31 December 2015
Property Valuations as at 31 December 2015
For
per
sona
l use
onl
y

36
Annexure 7
State Property Location Asset Type Interest % Book Value
($m) Cap Rate WA Albany Plaza Albany Sub-regional 100% 60.0 7.00% Carnarvon Central Carnarvon Neighbourhood 100% 18.1 7.75% Esperance Boulevard Esperance Neighbourhood 100% 27.8 7.25% Kalgoorlie Central Kalgoorlie Neighbourhood 100% 36.1 7.25% Maylands Coles Maylands Freestander 100% 14.7 6.25% Narrogin Coles Narrogin Freestander 100% 11.1 6.50% Secret Harbour Shopping Centre1 Secret Harbour Neighbourhood 100% 41.7 n/a South Hedland Square South Hedland Sub-regional 100% 77.2 7.50% Swan View Shopping Centre Swan View Neighbourhood 100% 17.2 6.50% Wanneroo Central Wanneroo Sub-regional 50% 47.4 6.50% WA Total 351.3 Assets held for sale 53.6 Total CQR Portfolio 2,484.0
1. Asset currently classified as redevelopment All values represent CQR ownership share
Charter Hall Retail REIT | Half Year Results | 31 December 2015
Property Valuations as at 31 December 2015
For
per
sona
l use
onl
y

Annexure 8 Industry and market overview - Australian retail market
Type (excl freestanding supermarkets) Total centres Total GLA (sqm) Average GLA (sqm)
City Centre 110 946,827 8,608
Super Regional 24 2,418,546 100,773
Major Regional 47 2,892,986 61,553
Regional 55 2,071,411 37,662
Sub-regional GLA >25,000sqm 19 541,519 28,501
Sub-regional GLA <25,000sqm 230 3,556,748 15,464
Neighbourhood Centre 848 3,591,992 4,236
Bulky Goods and Outlet Centres 139 2,517,469 18,111
Themed 14 111,592 7,971
Market 6 45,772 7,629
Total 1,492 18,694,862 12,530 Source: PCA
37
Charter Hall Retail REIT | Half Year Results | 31 December 2015
For
per
sona
l use
onl
y

Neighborhood centres
Total centres
Total GLA (‘000 sqm)
Proportion of total
(by GLA)
Private Investors 615 2,652.4 73.8%
Public Companies 43 239.1 6.7%
Listed Property Trusts
77 210.4 5.9%
Strata Plan 52 186.3 5.2%
Unlisted Funds 33 162.0 4.5%
Syndicates 18 107.8 3.0%
Other 10 34.0 0.9%
Total 848 3,592.0 100.0%
Sub-regional GLA <25,000sqm
Total centres
Total GLA (‘000 sqm)
Proportion of total
(by GLA)
Private Investors 94 1,458.4 41.0%
Listed Property Trusts 70 973.8 27.4%
Unlisted Funds 25 428.4 12.0%
Super/Insurance Funds
16 267.4 7.5%
Syndicates 15 252.1 7.1%
Public Companies 5 88.4 2.5%
Other 5 88.2 2.5%
Total 230 3,556.7 100.0%
Source: PCA
38
Annexure 8 Industry and market overview - Australian retail market – current owners
Charter Hall Retail REIT | Half Year Results | 31 December 2015
For
per
sona
l use
onl
y

39
Attributes vary across different leases however key characteristics of supermarket and specialty leases are outlined below:
Annexure 9 Typical lease structures
Supermarket tenant leases Specialty tenant leases
Lease term 15 - 20 years with options Typically average 5 years
Rent Base rent + % of turnover over threshold (2.0 - 2.5%)
Base rent with fixed/CPI increases at an average of 4.2% p.a.
Recovery of outgoings Typically gross leases, recover increase in statutory charges
Net leases
Average GLA 3,519 sqm 121 sqm (incl. Mini majors)
Average gross rent $308/sqm $849/sqm
Charter Hall Retail REIT | Half Year Results | 31 December 2015
For
per
sona
l use
onl
y

Jun-10
Dec-10
Jun-11
Dec-11
Jun-12
Dec-12
Jun-13
Dec-13
Jun-14
Dec-14
Jun-15
Dec-15
Number of properties 63 64 71 72 74 75 74 77 77 78 73 76
Occupancy 99.1% 98.9% 98.8% 98.7% 98.6% 98.5% 98.2% 98.2% 98.5% 98.5% 98.4% 98.4%
Same property NOI growth 4.7% 3.2% 3.8% 3.5% 3.5% 3.0% 2.8% 2.5% 2.0% 3.4% 2.4% 2.4%
Anchor tenant MAT growth 4.1% 5.1% 4.7% 4.6% 4.4% 4.5% 3.7% 3.6% 3.7% 2.2% 1.0% 1.2%
Specialty rent growth 5.3% 7.2% 7.3% 4.1% 4.9% 3.7% 3.1% 3.3% 2.6% 2.0% 1.5% 1.4%
Renewals 6.4% 7.8% 7.5% 5.1% 5.9% 3.7% 3.5% 1.5% 2.8% 1.8% 1.9% 0.4%
New leases 2.8% 5.4% 6.9% 3.1% 3.7% 3.7% 2.4% 7.5% 2.0% 2.6% 0.1% 4.3%
Number of leasing transactions
65 82 98 159 82 165 202 103 232 138 169 151
Average specialty gross rent psqm
$517 $520 $586 $719 $689 $728 $737 $770 $776 $813 $812 $849
Average specialty sales psqm $7,768 $7,659 $8,071 $8,100 $8,107 $8,091 $8,246 $8,354 $8,642 $8,658 $8,741 $9,020
Average specialty occupancy costs
7.8% 7.8% 8.4% 8.2% 8.5% 8.9% 8.9% 9.2% 9.0% 9.4% 9.3% 9.4%
40
Proven and consistent performance over time
Annexure 10 CQR Australian portfolio – historical performance
Charter Hall Retail REIT | Half Year Results | 31 December 2015
For
per
sona
l use
onl
y

41
• ABR: Annual base rent – base rent only, excludes outgoings and turnover rent
• GLA: Gross lettable area
• Gross rent: Base rent and outgoings
• MAT: Moving annual turnover – calculated as a sum of rolling 12 month sales
• Occupancy cost: Calculated as the sum of actual gross rent and percentage rent divided by actual sales for the 12 months ended 31 December 2015
• Other A$ bank debt: CHRP1 and CHRP2 non-recourse secured bank debt
• Rental rate growth: Percentage movement in base rent on new lease and renewal transactions
• Specialty retail categories:
− Leisure: includes music and games, newsagents, books and sport tenancies − Services: includes hairdressers, drycleaners, optometrists, gyms and other retail services − General retail: includes discount variety stores, gift shops and florists
• Stabilisation period: Redevelopments typically achieve stabilised yield 12 months following completion (depending on prevailing market conditions)
• Total Australian rent: Represents base rent and turnover rent from anchors and specialties
Annexure 11 Glossary
Charter Hall Retail REIT | Half Year Results | 31 December 2015
For
per
sona
l use
onl
y

42
Further Information
Scott Dundas Fund Manager
Charter Hall Retail REIT
T: +61 2 8651 9273 [email protected]
Christine Kelly Head of Retail Finance
Charter Hall Retail REIT
T: +61 2 8651 9401 [email protected]
Richard Stacker Head of Investor Relations
Charter Hall
T: +61 2 8651 9260 [email protected]
Charter Hall Retail REIT | Half Year Results | 31 December 2015
For
per
sona
l use
onl
y

43
Charter Hall Retail Management Limited ABN 46 069 709 468; AFSL 246996 (“CHRML”) has issued this presentation in its capacity as the responsible entity of Charter Hall Retail REIT
ARSN 093 143 965 (“CQR” or “the REIT”). This presentation has been prepared for general information purposes only and is not an offer or invitation for subscription or purchase of, or
recommendation of, securities. It does not take into account any potential investors’ personal objectives, financial situation or needs. Before investing, you should consider your own
objectives, financial situation and needs or you should obtain financial, legal and/or taxation advice.
CHRML does not receive fees in respect of the general financial product advice it may provide, however it will receive fees relating to the management of CQR which, in accordance with
CQR’s constitution, are calculated by reference to the value of the assets and the performance of CQR. Entities within the Charter Hall Group may also receive fees for managing the assets
of, and providing resources to CQR. For more details on fees, see CQR’s latest annual report. The information contained in this presentation has been prepared by CQR in good faith. No
representation or warranty, express or implied, is made as to the accuracy, adequacy, reliability or completeness of any statements, estimates, opinions or other information contained in this
presentation, any of which may change without notice. This includes, without limitation, any historical financial information and any estimates and projections and other financial information
derived from them (including any forward-looking statement). Nothing contained in this presentation is, or may be relied upon, as a promise or representation, whether as to the past or the
future. To the maximum extent permitted by law, CQR (including its respective unitholders, shareholders, directors, officers, employees, affiliates and advisers) disclaim and exclude all
liability for any loss or damage suffered or incurred by any person as a result of their reliance on the information contained in this presentation or any errors in or omissions from this
presentation. This presentation contains information as to past performance of CQR. Such information is given for illustrative purposes only, and is not – and should not be relied upon as –
an indication of future performance of CQR. The historical information in this presentation is, or is based upon, information contained in previous announcements made by CQR to the
market. These announcements are available at www.asx.com.au. This presentation contains certain “forward looking statements”. Forward looking words such as “expect”, “should”, “could”,
“may”, “will”, “believe”, “forecast”, “estimate” and other similar expressions are intended to identify forward-looking statements. Such statements are subject to various known and unknown
risks, uncertainties and other factors that are in some cases beyond CQR's control. These risks, uncertainties and factors may cause actual results, performance or achievements to differ
materially from those expressed or implied by the forward-looking statements and from past results, performance or achievements. CQR cannot give any assurance or guarantee that the
assumptions upon which management based its forward-looking statements will prove to be correct or exhaustive beyond the date of its making, or that CQR's business and operations will
not be affected by other factors not currently foreseeable by management or beyond its control. Such forward-looking statements only speak as at the date of this announcement and CQR
assumes no obligation to update such information.
All information contained herein is current as at 31 December 2015 unless otherwise stated. All references to dollars ($) are to Australian dollars, unless otherwise stated.
Important Notice
Charter Hall Retail REIT | Half Year Results | 31 December 2015
For
per
sona
l use
onl
y

Sydney Head Office Level 20, No.1 Martin Place, Sydney, NSW, 2000
T: +61 2 8651 9000
Melbourne Level 18, 570 Bourke Street, Melbourne VIC 3000
T: +61 3 9903 6100
Brisbane Level 22, Northbank Plaza, 69 Ann Street, Brisbane QLD 4000
T: +61 7 3228 2000
Perth Level 11, St Georges Square, 225 St Georges Terrace, Perth WA 6000
T: +61 8 9269 5900
Adelaide Suite 604, 147 Pirie Street, Adelaide SA 5000
T: +61 8 8417 5900
www.charterhall.com
For
per
sona
l use
onl
y