for the fiscal year ended september 30, 2012 commission file number 1-4802 becton...
TRANSCRIPT

As filed with the Securities and Exchange Commission on November 21, 2012
UNITED STATES SECURITIES AND EXCHANGE COMMISSIONWashington, D.C. 20549
Form 10-KANNUAL REPORT PURSUANT TO SECTION 13 OR 15(d)
OF THE SECURITIES EXCHANGE ACT OF 1934
FOR THE FISCAL YEAR ENDED SEPTEMBER 30, 2012
COMMISSION FILE NUMBER 1-4802
BECTON, DICKINSON AND COMPANY(Exact name of registrant as specified in its charter)
New Jersey 22-0760120(State or other jurisdiction of
incorporation or organization)(I.R.S. Employer
Identification No.)
1 Becton DriveFranklin Lakes, New Jersey
(Address of principal executive offices)
07417-1880(Zip code)
(201) 847-6800(Registrant’s telephone number, including area code)
Securities registered pursuant to Section 12(b) of the Act:
Title of Each Class Name of Each Exchange on Which Registered
Common Stock, par value $1.00 New York Stock Exchange
Securities registered pursuant to Section 12(g) of the Act:None
Indicate by check mark if the registrant is a well-known seasoned issuer, as defined in Rule 405 of the SecuritiesAct. Yes Í No ‘
Indicate by check mark if the registrant is not required to file reports pursuant to Section 13 or Section 15(d) of theAct. Yes ‘ No Í
Indicate by check mark whether the registrant (1) has filed all reports required to be filed by Section 13 or 15(d) of the SecuritiesExchange Act of 1934 during the preceding 12 months (or for such shorter period that the registrant was required to file such reports),and (2) has been subject to such filing requirements for the past 90 days. Yes Í No ‘
Indicate by check mark whether the registrant has submitted electronically and posted on its corporate Website, if any, everyInteractive Data File required to be submitted and posted pursuant to Rule 405 of Regulation S-T during the preceding 12 months (orfor such shorter period that the registrant was required to submit and post such files). Yes Í No ‘
Indicate by check mark if disclosure of delinquent filers pursuant to Item 405 of Regulation S-K is not contained herein, and willnot be contained, to the best of registrant’s knowledge, in definitive proxy or information statements incorporated by reference inPart III of this Form 10-K or any amendment to this Form 10-K. ‘
Indicate by check mark whether the registrant is a large accelerated filer, an accelerated filer, a non-accelerated filer, or a smallerreporting company. See the definitions of “large accelerated filer,” “accelerated filer” and “smaller reporting company” in Rule 12b-2of the Exchange Act. (Check one):
Large accelerated filer Í Accelerated filer ‘ Non-accelerated filer ‘ Smaller reporting company ‘
(Do not check if a smaller reporting company)
Indicate by check mark whether the registrant is a shell company (as defined in Rule 12b-2 of the Act). Yes ‘ No Í
As of March 31, 2012, the aggregate market value of the registrant’s outstanding common stock held by non-affiliates of theregistrant was approximately $15,700,984,058.
As of October 31, 2012, 196,957,804 shares of the registrant’s common stock were outstanding.
Documents Incorporated by Reference
Portions of the registrant’s Proxy Statement for the Annual Meeting of Shareholders to be held January 29, 2013 are incorporatedby reference into Part III hereof.

TABLE OF CONTENTS
PART I . . . . . . . . . . . . . . . . . . . . . . . . . . . . . . . . . . . . . . . . . . . . . . . . . . . . . . . . . . . . . . . . . . . . . . . . . . . . . . . . 3
Item 1. Business . . . . . . . . . . . . . . . . . . . . . . . . . . . . . . . . . . . . . . . . . . . . . . . . . . . . . . . . . . . . . . . . . . . . . . . 3
Item 1A. Risk Factors . . . . . . . . . . . . . . . . . . . . . . . . . . . . . . . . . . . . . . . . . . . . . . . . . . . . . . . . . . . . . . . . . . . 7
Item 1B. Unresolved Staff Comments . . . . . . . . . . . . . . . . . . . . . . . . . . . . . . . . . . . . . . . . . . . . . . . . . . . . . . 12
Item 2. Properties . . . . . . . . . . . . . . . . . . . . . . . . . . . . . . . . . . . . . . . . . . . . . . . . . . . . . . . . . . . . . . . . . . . . . . 12
Item 3. Legal Proceedings . . . . . . . . . . . . . . . . . . . . . . . . . . . . . . . . . . . . . . . . . . . . . . . . . . . . . . . . . . . . . . . . 13
Item 4. Mine Safety Disclosures . . . . . . . . . . . . . . . . . . . . . . . . . . . . . . . . . . . . . . . . . . . . . . . . . . . . . . . . . . . 16
Executive Officers of the Registrant . . . . . . . . . . . . . . . . . . . . . . . . . . . . . . . . . . . . . . . . . . . . . . . . . . . . . . . . 16
PART II . . . . . . . . . . . . . . . . . . . . . . . . . . . . . . . . . . . . . . . . . . . . . . . . . . . . . . . . . . . . . . . . . . . . . . . . . . . . . . . . 17
Item 5. Market for Registrant’s Common Equity, Related Stockholder Matters and Issuer Purchases ofEquity Securities . . . . . . . . . . . . . . . . . . . . . . . . . . . . . . . . . . . . . . . . . . . . . . . . . . . . . . . . . . . . . . . . . . . . . . . 17
Item 6. Selected Financial Data . . . . . . . . . . . . . . . . . . . . . . . . . . . . . . . . . . . . . . . . . . . . . . . . . . . . . . . . . . . 18
Item 7. Management’s Discussion and Analysis of Financial Condition and Results of Operations . . . . . . . 19
Item 7A. Quantitative and Qualitative Disclosures About Market Risk . . . . . . . . . . . . . . . . . . . . . . . . . . . . . 38
Item 8. Financial Statements and Supplementary Data . . . . . . . . . . . . . . . . . . . . . . . . . . . . . . . . . . . . . . . . . 39
Item 9. Changes in and Disagreements With Accountants on Accounting and Financial Disclosure . . . . . . 88
Item 9A. Controls and Procedures . . . . . . . . . . . . . . . . . . . . . . . . . . . . . . . . . . . . . . . . . . . . . . . . . . . . . . . . . 88
Item 9B. Other Information . . . . . . . . . . . . . . . . . . . . . . . . . . . . . . . . . . . . . . . . . . . . . . . . . . . . . . . . . . . . . . . 88
PART III . . . . . . . . . . . . . . . . . . . . . . . . . . . . . . . . . . . . . . . . . . . . . . . . . . . . . . . . . . . . . . . . . . . . . . . . . . . . . . . 88
Item 10. Directors, Executive Officers and Corporate Governance . . . . . . . . . . . . . . . . . . . . . . . . . . . . . . . . 88
Item 11. Executive Compensation . . . . . . . . . . . . . . . . . . . . . . . . . . . . . . . . . . . . . . . . . . . . . . . . . . . . . . . . . 88
Item 12. Security Ownership of Certain Beneficial Owners and Management and Related StockholderMatters . . . . . . . . . . . . . . . . . . . . . . . . . . . . . . . . . . . . . . . . . . . . . . . . . . . . . . . . . . . . . . . . . . . . . . . . . . . . . . . 88
Item 13. Certain Relationships and Related Transactions, and Director Independence . . . . . . . . . . . . . . . . . 88
Item 14. Principal Accounting Fees and Services . . . . . . . . . . . . . . . . . . . . . . . . . . . . . . . . . . . . . . . . . . . . . . 89
PART IV . . . . . . . . . . . . . . . . . . . . . . . . . . . . . . . . . . . . . . . . . . . . . . . . . . . . . . . . . . . . . . . . . . . . . . . . . . . . . . . 89
Item 15. Exhibits, Financial Statement Schedules . . . . . . . . . . . . . . . . . . . . . . . . . . . . . . . . . . . . . . . . . . . . . 89
SIGNATURES . . . . . . . . . . . . . . . . . . . . . . . . . . . . . . . . . . . . . . . . . . . . . . . . . . . . . . . . . . . . . . . . . . . . . . . . . . 90
EXHIBIT INDEX . . . . . . . . . . . . . . . . . . . . . . . . . . . . . . . . . . . . . . . . . . . . . . . . . . . . . . . . . . . . . . . . . . . . . . . . 92
2
PART I
Item 1. Business.
General
Becton, Dickinson and Company (also known as “BD”) was incorporated under the laws of the State ofNew Jersey in November 1906, as successor to a New York business started in 1897. BD’s executive offices arelocated at 1 Becton Drive, Franklin Lakes, New Jersey 07417-1880, and its telephone number is (201) 847-6800.All references in this Form 10-K to “BD” refer to Becton, Dickinson and Company and its domestic and foreignsubsidiaries, unless otherwise indicated by the context.
BD is a global medical technology company engaged principally in the development, manufacture and saleof medical devices, instrument systems and reagents used by healthcare institutions, life science researchers,clinical laboratories, the pharmaceutical industry and the general public.
Business Segments
BD’s operations consist of three worldwide business segments: BD Medical, BD Diagnostics and BDBiosciences. Information with respect to BD’s business segments is included in Note 6 to the consolidatedfinancial statements contained in Item 8, Financial Statements and Supplementary Data, and is incorporatedherein by reference.
BD Medical
BD Medical produces a broad array of medical devices that are used in a wide range of healthcare settings.BD Medical’s principal product lines include needles, syringes and intravenous catheters for medication delivery(including safety-engineered and auto-disable devices); prefilled IV flush syringes; syringes and pen needles forthe self-injection of insulin and other drugs used in the treatment of diabetes; prefillable drug delivery systemsprovided to pharmaceutical companies and sold to end-users as drug/device combinations; regional anesthesianeedles and trays; sharps disposal containers; and closed-system transfer devices. The primary customers servedby BD Medical are hospitals and clinics; physicians’ office practices; consumers and retail pharmacies;governmental and nonprofit public health agencies; pharmaceutical companies; and healthcare workers.
BD Diagnostics
BD Diagnostics provides products for the safe collection and transport of diagnostics specimens, as well asinstruments and reagent systems to detect a broad range of infectious diseases, healthcare-associated infections(“HAIs”) and cancers. BD Diagnostics’ principal products include integrated systems for specimen collection;safety-engineered blood collection products and systems; automated blood culturing systems; molecular testingsystems for infectious diseases and women’s health; microorganism identification and drug susceptibilitysystems; liquid-based cytology systems for cervical cancer screening; rapid diagnostic assays; microbiologylaboratory automation; and plated media. BD Diagnostics serves hospitals, laboratories and clinics; referencelaboratories; blood banks; healthcare workers; public health agencies; physicians’ office practices; and industrialand food microbiology laboratories.
BD Biosciences
BD Biosciences produces research and clinical tools that facilitate the study of cells, and the components ofcells, to gain a better understanding of normal and disease processes. That information is used to aid thediscovery and development of new drugs and vaccines, and to improve the diagnosis and management ofdiseases. BD Biosciences’ principal product lines include fluorescence-activated cell sorters and analyzers;monoclonal antibodies and kits for performing cell analysis; reagent systems for life science research; cellimaging systems; diagnostic assays; and cell culture media supplements for biopharmaceutical manufacturing.The primary customers served by BD Biosciences are research and clinical laboratories; academic andgovernment institutions; pharmaceutical and biotechnology companies; hospitals; and blood banks.
3

Acquisitions
During the second quarter of 2012, BD acquired a 100% interest in KIESTRA Lab Automation BV, aNetherlands-based company that manufactures and sells innovative lab automation solutions for themicrobiology lab. The fair value of consideration transferred was $59 million, which consisted of $51 million incash, net of cash acquired, as well as $8 million in contingent consideration.
During the fourth quarter of 2012, BD acquired a 100% interest in Sirigen Group Limited, a developer ofunique polymer dyes that are used in flow cytometry. The fair value of consideration transferred was $64 million,which consisted of $52 million in cash, net of cash acquired, as well as $12 million in contingent consideration.
Additional information regarding these acquisitions is contained in Note 9 to the consolidated financialstatements contained in Item 8, Financial Statements and Supplementary Data, which is incorporated herein byreference.
Divestitures
During the first quarter of 2013, BD completed the sale of its BD Biosciences — Discovery Labware unit,excluding its Advanced Bioprocessing platform. Gross cash proceeds from the sale were approximately $728million, subject to post-closing adjustments. Additional information regarding this divestiture is contained inNote 10 to the consolidated financial statements contained in Item 8, Financial Statements and SupplementaryData, which is incorporated herein by reference.
International Operations
BD’s products are manufactured and sold worldwide. For reporting purposes, we organize our operationsoutside the United States as follows: Europe (which includes the Middle East and Africa); Greater Asia (whichincludes Japan and Asia Pacific); Latin America (which includes Mexico and Brazil) and Canada. The principalproducts sold by BD outside the United States are needles and syringes; insulin syringes and pen needles;diagnostic systems; BD VacutainerTM brand blood collection products; BD HypakTM brand prefillable syringesystems; infusion therapy products; flow cytometry instruments and reagents; and disposable laboratoryproducts. BD has manufacturing operations outside the United States in Brazil, Canada, China, France, Germany,Hungary, India, Ireland, Japan, Mexico, the Netherlands, Pakistan, Singapore, Spain, Sweden and theUnited Kingdom. Geographic information with respect to BD’s operations is included under the heading“Geographic Information” in Note 6 to the consolidated financial statements included in Item 8, FinancialStatements and Supplementary Data, and is incorporated herein by reference.
Foreign economic conditions and exchange rate fluctuations have caused the profitability related to foreignrevenues to fluctuate more than the profitability related to domestic revenues. BD believes its activities in somecountries outside the United States involve greater risk than its domestic business due to the factors cited herein,as well as the economic environment, local commercial and economic policies and political uncertainties. Seefurther discussion of this risk in Item 1A. Risk Factors.
Distribution
BD’s products are marketed in the United States and internationally through independent distributionchannels and directly to end-users by BD and independent sales representatives. Order backlog is not material toBD’s business inasmuch as orders for BD products generally are received and filled on a current basis, except foritems temporarily out of stock. BD’s worldwide sales are not generally seasonal, with the exception of certainmedical devices in the BD Medical segment, and respiratory and flu diagnostic products in the BD Diagnosticssegment, that relate to seasonal diseases such as influenza.
Raw Materials
BD purchases many different types of raw materials, including plastics, glass, metals, textiles, paperproducts, agricultural products, electronic and mechanical sub-assemblies and various biological, chemical andpetrochemical products. BD seeks to ensure continuity of raw material supply by securing multiple options for
4

sourcing. However, there are situations where raw materials are only available from one supplier, which arereferred to as sole sourced. The use of sole sourced materials may be due to sourcing of proprietary and/orpatented technology and processes that are intended to provide a unique market differentiation to our product. Inother cases, while a raw material can be sourced from multiple manufacturers, only one supplier is qualified dueto quality assurance, cost or other considerations. In order to provide alternate sources of raw materials, BD mustcomplete a rigorous qualification process, which most often includes completion of regulatory registration andapproval. If clinical trials are not required, this qualification process can take 3-18 months depending on thecriticality of the change. When clinical trials are required, this process may lengthen the qualification phase forone to three years. BD continuously assesses its sole sourced raw materials and maintains business continuityplans with our suppliers. BD’s continuity plans may include securing secondary supply with alternate suppliers,qualification of alternate manufacturing facilities, maintaining contingency stock, internal development of supplyand establishment of technology escrow accounts. While BD works closely with its suppliers, there maynonetheless be events that cause supply interruption, reduction or termination that adversely impacts BD’s abilityto manufacture and sell certain products.
Research and Development
BD conducts its research and development (“R&D”) activities at its operating units and at BD Technologiesin Research Triangle Park, North Carolina. The majority of BD’s R&D activities are conducted in theUnited States. Outside the United States, BD conducts R&D activities at BD Diagnostic Systems in Quebec City,Canada and Suzhou, China, BD Pharmaceutical Systems in Pont de Claix, France, BD Technologies in Biopolis,Singapore and BD Medical Surgical Systems in Tuas, Singapore. BD also collaborates with certain universities,medical centers and other entities on R&D programs, and retains individual consultants to support its efforts inspecialized fields. BD spent approximately $472 million, $470 million and $423 million on research anddevelopment during the fiscal years ended September 30, 2012, 2011, and 2010, respectively.
Intellectual Property and Licenses
BD owns significant intellectual property, including patents, patent applications, technology, trade secrets,know-how, copyrights and trademarks in the United States and other countries. BD is also licensed underdomestic and foreign patents, patent applications, technology, trade secrets, know-how, copyrights andtrademarks owned by others. In the aggregate, these intellectual property assets and licenses are of materialimportance to BD’s business. BD believes, however, that no single patent, technology, trademark, intellectualproperty asset or license is material in relation to BD’s business as a whole, or to any business segment.
Competition
BD operates in the increasingly complex and challenging medical technology marketplace. Technologicaladvances and scientific discoveries have accelerated the pace of change in medical technology, the regulatoryenvironment of medical products is becoming more complex and vigorous, and economic conditions haveresulted in a challenging market. Companies of varying sizes compete in the global medical technology field.Some are more specialized than BD with respect to particular markets, and some have greater financial resourcesthan BD. New companies have entered the field, particularly in the areas of molecular diagnostics, safety-engineered devices and in the life sciences, and established companies have diversified their business activitiesinto the medical technology area. Other firms engaged in the distribution of medical technology products havebecome manufacturers of medical devices and instruments as well. Acquisitions and collaborations by andamong companies seeking a competitive advantage also affect the competitive environment. In addition, theentry into the market of manufacturers located in China and other low-cost manufacturing locations are creatingincreased pricing pressures, particularly in developing markets. Some competitors have also establishedmanufacturing sites or have contracted with suppliers located in these countries as a means to lower their costs.
BD competes in this evolving marketplace on the basis of many factors, including price, quality, innovation,service, reputation, distribution and promotion. The impact of these factors on BD’s competitive position variesamong BD’s various product offerings. In order to remain competitive in the industries in which it operates, BDcontinues to make investments in research and development, quality management, quality improvement, product
5

innovation and productivity improvement in support of its core strategy — to increase revenue growth byfocusing on products that deliver greater benefits to patients, healthcare workers and researchers.
Third-Party Reimbursement
Healthcare providers and related facilities are generally reimbursed for their services through numerouspayment systems managed by various governmental agencies worldwide (e.g., Medicare and Medicaid in theUnited States, the National Health Service in the United Kingdom, the Joint Federal Committee in Germany, theCommission d’Evaluation des Produits et prestations in France, the Ministry for Health, Labor and Welfare inJapan, the Ministry of Health and the National Development and Reform Commission in China, among manyothers), private insurance companies, and managed care organizations. The manner and level of reimbursementin any given case may depend on the site of care, the procedure(s) performed, the final patient diagnosis, thedevice(s) and/or drug(s) utilized, the available budget, or a combination of these factors, and coverage andpayment levels are determined at each payer’s discretion. The coverage policies and reimbursement levels ofthese third-party payers may impact the decisions of healthcare providers and facilities regarding which medicalproducts they purchase and the prices they are willing to pay for those products. Thus, changes in reimbursementlevels or methods may either positively or negatively impact sales of BD products.
While BD is actively engaged in promoting the value propositions of its products for payer, provider, andpatient stakeholders, and it employs various efforts and resources to positively impact coverage, coding andpayment processes in this regard, it has no direct control over payer decision-making with respect to coverageand payment levels for BD products. Additionally, we expect many payers to continue to explore cost-containment strategies (e.g., comparative and cost-effectiveness analyses, so-called “pay-for-performance”programs implemented by various public and private payers, and expansion of payment bundling schemes suchas Accountable Care Organizations (ACOs), DRG programs, and other such methods that shift medical cost riskto providers) that could potentially impact coverage and/or payment levels for current or future BD products.
As BD’s product offerings are diverse across many healthcare settings, they are affected to varying degreesby the many payment systems. Therefore, individual countries, product lines or product classes may be impactedby changes to these systems. Notably the Patient Protection and Affordable Care Act (“PPACA”) provides fornumerous, substantive changes to U.S. healthcare payment systems. Many of the changes set forth in this statutehave only recently been promulgated through formal regulations and most of them have yet to be implemented.At this time, it remains unclear whether, or how, the implementation of regulations pursuant to the PPACA mightaffect payments for BD products. See Item 1A. Risk Factors for a further discussion.
Regulation
BD’s medical technology products and operations are subject to regulation by the U.S. Food and DrugAdministration (“FDA”) and various other federal and state agencies, as well as by foreign governmentalagencies. These agencies enforce laws and regulations that govern the development, testing, manufacturing,labeling, advertising, marketing and distribution, and market surveillance of BD’s medical products. The scopeof the activities of these agencies, particularly in the Europe, Japan and Asia Pacific regions in which BDoperates, has been increasing.
BD actively maintains FDA/ISO Quality Systems that establish standards for its product design,manufacturing, and distribution processes. Prior to marketing or selling most of its products, BD must secureapproval from the FDA and counterpart non-U.S. regulatory agencies. Following the introduction of a product,these agencies engage in periodic reviews of BD’s quality systems, as well as product performance andadvertising and promotional materials. These regulatory controls, as well as any changes in FDA policies, canaffect the time and cost associated with the development, introduction and continued availability of newproducts. Where possible, BD anticipates these factors in its product development and planning processes. Theseagencies possess the authority to take various administrative and legal actions against BD, such as productrecalls, product seizures and other civil and criminal sanctions. BD also undertakes voluntary compliance actionssuch as voluntary recalls.
6
BD also is subject to various federal and state laws, and laws outside the United States, concerninghealthcare fraud and abuse (including false claims laws and anti-kickback laws), global anti-corruption,transportation, safety and health, and customs and exports. Many of the agencies enforcing these laws haveincreased their enforcement activities with respect to medical device manufacturers in recent years. This appearsto be part of a general trend toward increased regulation and enforcement activity within and outside theUnited States.
BD believes it is in compliance in all material respects with applicable law and the regulations promulgatedby the applicable agencies (including, without limitation, environmental laws and regulations), and that suchcompliance has not had, and will not have, a material adverse effect on our operations or results. See Item 3.Legal Proceedings.
Employees
As of September 30, 2012, BD had 29,555 employees, of whom 11,915 were employed in the U.S. (includingPuerto Rico). BD believes that its employee relations are satisfactory.
Available Information
BD maintains a website at www.bd.com. BD also makes available its Annual Reports on Form 10-K, itsQuarterly Reports on Form 10-Q, and its Current Reports on Form 8-K (and amendments to those reports) assoon as reasonably practicable after those reports are electronically filed with, or furnished to, the Securities andExchange Commission (“SEC”). These filings may be obtained and printed free of charge at www.bd.com/investors. In addition, the written charters of the Audit Committee, the Compensation and Benefits Committee,the Corporate Governance and Nominating Committee, the Executive Committee and the Science, Innovationand Technology Committee of the Board of Directors, BD’s Corporate Governance Principles and its Code ofConduct, are available at BD’s website at www.bd.com/investors/corporate_governance/. Printed copies of thesematerials, this 2012 Annual Report on Form 10-K, and BD’s reports and statements filed with, or furnished to,the SEC, may be obtained, without charge, by contacting the Corporate Secretary, BD, 1 Becton Drive, FranklinLakes, New Jersey 07417-1880, telephone 201-847-6800. In addition, the SEC maintains an internet site thatcontains reports, proxy and information statements, and other information regarding issuers that fileelectronically with the SEC at www.sec.gov.
BD also routinely posts important information for investors on its website at www.bd.com/investors. BDmay use this website as a means of disclosing material, non-public information and for complying with itsdisclosure obligations under Regulation FD adopted by the SEC. Accordingly, investors should monitor theInvestor Relations portion of BD’s website noted above, in addition to following BD’s press releases, SECfilings, and public conference calls and webcasts. Our website and the information contained therein orconnected thereto shall not be deemed to be incorporated into this Annual Report.
Forward-Looking Statements
BD and its representatives may from time-to-time make certain forward-looking statements in publicly-released materials, both written and oral, including statements contained in filings with the SEC and in ourreports to shareholders. Additional information regarding our forward-looking statements is contained in Item 7,Management’s Discussion and Analysis of Financial Condition and Results of Operations.
Item 1A. Risk Factors.
An investment in BD involves a variety of risks and uncertainties. The following describes some of thesignificant risks that could adversely affect BD’s business, financial condition, operating results or cash flows.
Global economic conditions could continue to adversely affect our operations.
In recent years, we have been faced with very challenging global economic conditions. Further deteriorationin the global economic environment may result in decreased demand for our products and services, increasedcompetition, downward pressure on the prices for our products, longer sales cycles, and slower adoption of new
7
technologies. During fiscal year 2012, our revenue growth was adversely affected by conditions in the healthcareindustry, including lower healthcare utilization, particularly in the U.S. and Western Europe, increased pricingpressure for certain products in our Medical segment and an uncertain academic research spending environmentfor high-end instruments in our Biosciences segment. We anticipate that these industry conditions will continuefor the foreseeable future. In addition, there can be no assurance that these conditions will not adversely affectour ability to do so in the future. Weakening macroeconomic conditions may also adversely affect our suppliers,and there can be no assurances that BD will not experience any interruptions in supply in the future. We havealso experienced delays in collecting receivables in certain countries in Western Europe, and we may experiencesimilar delays in these and other jurisdictions experiencing liquidity problems. The continued weakness in worldeconomies makes the strength and timing of economic recovery uncertain, and there can be no assurance thatglobal economic conditions will not deteriorate further.
We are subject to foreign currency exchange risk.
About 57% of our fiscal year 2012 revenues were derived from international operations, and we anticipatethat a significant portion of our sales will continue to come from our international operations in the future. Therevenues we report with respect to our operations outside the United States may be adversely affected byfluctuations in foreign currency exchange rates. A discussion of the financial impact of exchange ratefluctuations and the ways and extent to which we may attempt to address any impact is contained in Item. 7,Management’s Discussion of Financial Condition and Results of Operations. Any hedging activities we engagein may only offset a portion of the adverse financial impact resulting from unfavorable changes in foreigncurrency exchange rates. We cannot predict with any certainty changes in foreign currency exchange rates or thedegree to which we can address these risks.
Changes in reimbursement practices of third-party payers could affect the demand for our products andthe prices at which they are sold.
Our sales depend, in part, on the extent to which healthcare providers and facilities are reimbursed bygovernment authorities, private insurers and other third-party payers for the costs of our products. The coveragepolicies and reimbursement levels of third-party payers, which can vary among public and private sources and bycountry, may affect which products customers purchase and the prices they are willing to pay for those products in aparticular jurisdiction. Reimbursement rates can also affect the acceptance rate of new technologies. Legislative oradministrative reforms to reimbursement systems in the United States or abroad, or changes in reimbursement ratesby private payers, could significantly reduce reimbursement for procedures using BD products or result in denial ofreimbursement for those products, which would adversely affect customer demand or the price customers arewilling to pay for such products. See “Third-Party Reimbursement” under Item 1. Business.
Federal healthcare reform may adversely affect our results of operations.
The Patient Protection and Affordable Care Act (the “PPACA”) was enacted in March 2010. Under thePPACA, beginning in 2013, medical device manufacturers, such as BD, will pay a 2.3% excise tax on U.S. sales ofcertain medical devices. We currently estimate that our fiscal 2013 excise tax (impacting only three quarters forfiscal year 2013) will be between $40 million to $50 million. We cannot predict with any certainty what otherimpact the PPACA may have on our business. The PPACA reduces Medicare and Medicaid payments to hospitals,clinical laboratories and pharmaceutical companies, and could otherwise reduce the volume of medical procedures.These factors, in turn, could result in reduced demand for our products and increased downward pricing pressure. Itis also possible that the PPACA will result in lower reimbursements for our products. Other provisions in the lawmay significantly change the practice of health care and could adversely affect aspects of our business. While thePPACA is intended to expand health insurance coverage to uninsured persons in the United States, the impact ofany overall increase in access to healthcare on sales of BD’s products remains uncertain.
Efforts to reduce the U.S. federal deficit could adversely affect our results of operations.
As part of the Budget Control Act passed in August 2011 to extend the federal debt limit and reducegovernment spending, $1.2 trillion in automatic spending cuts (known as sequestration) over the next decade are
8

due to go into effect, beginning in 2013, in the absence of further legislative action. Half of the automaticreductions would come from lowering the caps imposed on non-defense discretionary spending and cuttingdomestic entitlement programs, including reductions in payments to Medicare providers. Government researchfunding could also be impacted as part of any deficit reduction. Any such reductions in government healthcarespending or research funding could result in reduced demand for our products or additional pricing pressure.
Price volatility could adversely affect costs associated with our operations.
Our results of operations could be negatively impacted by price volatility in the cost of raw materials,components, freight and energy. In particular, BD purchases supplies of resins, which are oil-based componentsused in the manufacture of certain products. Any significant increases in resin costs could adversely impactfuture operating results. Increases in the price of oil can also increase BD’s costs for packaging andtransportation. New laws or regulations adopted in response to climate change could also increase energy costsand the costs of certain raw materials and components.
BD’s future growth is dependent upon the development of new products, and there can be no assurancethat such products will be developed.
A significant element of our strategy is to increase revenue growth by focusing on products that delivergreater benefits to patients, healthcare workers and researchers. The development of these products requiressignificant research and development, clinical trials and regulatory approvals. The results of our productdevelopment efforts may be affected by a number of factors, including BD’s ability to innovate, develop andmanufacture new products, complete clinical trials, obtain regulatory approvals and reimbursement in theUnited States and abroad, or gain and maintain market approval of our products. In addition, patents attained byothers can preclude or delay our commercialization of a product. There can be no assurance that any productsnow in development or that we may seek to develop in the future will achieve technological feasibility, obtainregulatory approval or gain market acceptance.
We cannot guarantee that any of BD’s strategic acquisitions, investments or alliances will be successful.
As part of our strategy to increase revenue growth, we seek to supplement our internal growth throughstrategic acquisitions, investments and alliances. Such transactions are inherently risky. The success of anyacquisition, investment or alliance may be affected by a number of factors, including our ability to properlyassess and value the potential business opportunity or to successfully integrate any business we may acquire intoour existing business. There can be no assurance that any past or future transaction will be successful.
The medical technology industry is very competitive.
The medical technology industry is subject to rapid technological changes, and we face significant competitionacross our product lines and in each market in which our products are sold on the basis of product features, clinicaloutcomes, price, services and other factors. In addition, increasing customer demand for more environmentally-friendly products is creating another basis on which BD must compete. We face this competition from a wide rangeof companies. These include large medical device companies, some of which may have greater financial andmarketing resources than we do, and firms that are more specialized than we are with respect to particular markets.Other firms engaged in the distribution of medical technology products have become manufacturers of medicaldevices and instruments as well. In some instances, competitors, including pharmaceutical companies, also offer, orare attempting to develop, alternative therapies for disease states that may be delivered without a medical device.The development of new or improved products, processes or technologies by other companies (such as needle-freeinjection technology) may render our products or proposed products obsolete or less competitive. The entry into themarket of manufacturers located in China and other low-cost manufacturing locations is also creating pricingpressure, particularly in developing markets. Some competitors have also established manufacturing sites or havecontracted with suppliers located in these countries as a means to lower their costs.
Consolidation in the healthcare industry could adversely affect BD’s future revenues and operating income.
The medical technology industry has experienced a significant amount of consolidation. As a result of thisconsolidation, competition to provide goods and services to customers has increased. In addition, group
9

purchasing organizations and integrated health delivery networks have served to concentrate purchasingdecisions for some customers, which has also placed pricing pressure on medical device suppliers. Furtherconsolidation in the industry could exert additional pressure on the prices of our products.
The international operations of BD’s business may subject BD to certain business risks.
The majority of our sales come from our operations outside the United States, and we intend to continue topursue growth opportunities in foreign markets, especially in emerging markets. BD operations outside theUnited States subject BD to certain risks, including the effects of fluctuations in foreign currency exchange(discussed above), the effects of local economic conditions, changes in foreign regulatory requirements, localproduct preferences and product requirements, difficulty in establishing, staffing and managing foreignoperations, differing labor regulations, changes in tax laws, potential political instability, trade barriers,weakening or loss of the protection of intellectual property rights in some countries, and restrictions on thetransfer of capital across borders. The success of our operations outside the United States will depend, in part, onour ability to acquire or form and maintain alliances with local companies and make necessary infrastructureenhancements to, among other things, our production facilities and distribution networks.
In addition, under the U.S. tax code, we may be subject to additional taxation to the extent we repatriateearnings from our foreign operations to the U.S. In the event we require more capital in the United States than isgenerated by our U.S. operations to fund acquisitions or other activities and elect to repatriate earnings fromforeign jurisdictions, our effective tax rate may be higher as a result.
Reductions in customers’ research budgets or government funding may adversely affect our BDBiosciences segment.
Our BD Biosciences segment sells products to researchers at pharmaceutical and biotechnology companies,academic institutions, government laboratories and private foundations. Research and development spending of ourcustomers can fluctuate based on spending priorities and general economic conditions. A number of these customersare also dependent for their funding upon grants from U.S. government agencies, such as the U.S. NationalInstitutes of Health (“NIH”) and agencies in other countries. The level of government funding of research anddevelopment is unpredictable. There have been instances where NIH grants have been frozen or otherwiseunavailable for extended periods. The availability of governmental research funding may also continue to beadversely affected by the current economic conditions and governmental spending reductions. Any reduction ordelay in governmental funding could cause our customers to delay or forego purchases of our products.
A reduction or interruption in the supply of certain raw materials and components would adversely affectBD’s manufacturing operations and related product sales.
BD purchases many different types of raw materials and components. Certain raw materials (primarilyrelated to the BD Biosciences segment) and components are not available from multiple sources. In addition, forquality assurance, cost-effectiveness and other reasons, BD elects to purchase certain raw materials andcomponents from sole suppliers. The supply of these materials can be disrupted for a number of reasons,including economic conditions as described above. While we work with suppliers to ensure continuity of supply,no assurance can be given that these efforts will be successful. In addition, due to regulatory requirementsrelating to the qualification of suppliers, we may not be able to establish additional or replacement sources on atimely basis or without excessive cost. The termination, reduction or interruption in supply of these sole-sourcedraw materials and components could adversely impact our ability to manufacture and sell certain of our products.
Interruption of our manufacturing operations could adversely affect BD’s future revenues and operatingincome.
We have manufacturing sites all over the world. In some instances, the manufacturing of certain of ourproduct lines is concentrated in one or more of our plants. Weather, natural disasters (including pandemics),
10

terrorism, political change, failure to follow specific internal protocols and procedures, equipment malfunction,environmental factors or damage to one or more of our facilities could adversely affect our ability to manufactureour products.
BD is subject to a number of pending lawsuits.
BD is a defendant in a number of pending lawsuits, including purported class action lawsuits for, amongother things, alleged antitrust violations and suits alleging patent infringement, and could be subject to additionallawsuits in the future. A more detailed description of these lawsuits is contained in Item 3. Legal Proceedings.Given the uncertain nature of litigation generally, we are not able in all cases to estimate the amount or range ofloss that could result from an unfavorable outcome of the litigation to which we are a party. In view of theseuncertainties, we could incur charges in excess of any currently established accruals and, to the extent available,excess liability insurance. Any such future charges, individually or in the aggregate, could have a materialadverse affect on BD’s results of operations and cash flows.
BD is subject to extensive regulation.
BD is subject to extensive regulation by the FDA pursuant to the Federal Food, Drug and Cosmetic Act, bycomparable agencies in foreign countries, and by other regulatory agencies and governing bodies. Most of BD’sproducts must receive clearance or approval from the FDA or counterpart regulatory agencies in other countriesbefore they can be marketed or sold. The process for obtaining marketing approval or clearance may take asignificant period of time and require the expenditure of substantial resources, and these have been increasingdue to increased requirements from the FDA for supporting data for submissions. The process may also requirechanges to our products or result in limitations on the indicated uses of the products. Also, governmentalagencies may impose new requirements regarding registration, labeling or prohibited materials that may requireus to modify or re-register products already on the market or otherwise impact our ability to market our productsin those countries. Once clearance or approval has been obtained for a product, there is an obligation to ensurethat all applicable FDA and other regulatory requirements continue to be met.
Following the introduction of a product, these agencies also periodically review our manufacturingprocesses and product performance. Our failure to comply with the applicable good manufacturing practices,adverse event reporting, clinical trial and other requirements of these agencies could delay or prevent theproduction, marketing or sale of our products and result in fines, delays or suspensions of regulatory clearances,closure of manufacturing sites, seizures or recalls of products and damage to our reputation. Recent changes inenforcement practice by the FDA and other agencies have resulted in increased enforcement activity, whichincreases the compliance risk for BD and other companies in our industry.
Product defects could adversely affect the results of our operations.
The design, manufacture and marketing of medical devices involve certain inherent risks. Manufacturing ordesign defects, unanticipated use of our products, or inadequate disclosure of risks relating to the use of ourproducts can lead to injury or other adverse events. These events could lead to recalls or safety alerts relating toour products (either voluntary or required by the FDA or similar governmental authorities in other countries), andcould result, in certain cases, in the removal of a product from the market. A recall could result in significantcosts, as well as negative publicity and damage to our reputation that could reduce demand for our products.Personal injuries relating to the use of our products can also result in product liability claims being broughtagainst us. In some circumstances, such adverse events could also cause delays in new product approvals.
We may experience difficulties implementing our enterprise resource planning system.
We are engaged in a project to upgrade our enterprise resource planning (“ERP”) system. Our ERP systemis critical to our ability to accurately maintain books and records, record transactions, provide importantinformation to our management and prepare our financial statements. The implementation of the new ERPsystem has required, and will continue to require, the investment of significant financial and human resources. In
11
addition, we may not be able to successfully complete the implementation of the new ERP system withoutexperiencing difficulties. Any disruptions, delays or deficiencies in the design and implementation of the newERP system could adversely affect our ability to process orders, ship products, provide services and customersupport, send invoices and track payments, fulfill contractual obligations or otherwise operate our business.
Our operations are dependent in part on patents and other intellectual property assets.
Many of BD’s businesses rely on patent, trademark and other intellectual property assets. These intellectualproperty assets, in the aggregate, are of material importance to our business. BD can lose the protection affordedby these intellectual property assets through patent expirations, legal challenges or governmental action. Patentsattained by competitors, particularly as patents on our products expire, may also adversely affect our competitiveposition. In addition, competitors may claim that BD products infringe upon their intellectual property, andresolving any intellectual property claim can be costly and time-consuming. The loss of a significant portion ofour portfolio of intellectual property assets may have an adverse effect on our earnings, financial condition orcash flows.
Breaches of our information technology systems could have a material adverse effect on our operations.
We rely on information technology systems to process, transmit, and store electronic information in ourday-to-day operations. Our information technology systems have been, and will likely continue to be, subjectedto computer viruses or other malicious codes, unauthorized access attempts, and cyber- or phishing-attacks. Ifsuccessful, these cyber-attacks could compromise our confidential information and disrupt our operations. Cyber-attacks are becoming more sophisticated and frequent, and there can be no assurances that our protectivemeasures will prevent future security breaches that could have a significant impact on our business.
Natural disasters, war and other events could adversely affect BD’s future revenues and operating income.
Natural disasters (including pandemics), war, terrorism, labor disruptions and international conflicts, andactions taken by the United States and other governments or by our customers or suppliers in response to suchevents, could cause significant economic disruption and political and social instability in the United States and inareas outside of the United States in which we operate. These events could result in decreased demand for ourproducts, adversely affect our manufacturing and distribution capabilities, or increase the costs for or causeinterruptions in the supply of materials from our suppliers.
We need to attract and retain key employees to be competitive.
Our ability to compete effectively depends upon our ability to attract and retain executives and other keyemployees, including people in technical, marketing, sales and research positions. Competition for experiencedemployees, particularly for persons with specialized skills, can be intense. BD’s ability to recruit such talent willdepend on a number of factors, including compensation and benefits, work location and work environment. If wecannot effectively recruit and retain qualified executives and employees, our business could be adverselyaffected.
Item 1B. Unresolved Staff Comments.
None.
Item 2. Properties.
BD’s executive offices are located in Franklin Lakes, New Jersey. As of November 1, 2012, BD owned orleased 169 facilities throughout the world comprising approximately 16,290,676 square feet of manufacturing,warehousing, administrative and research facilities. The U.S. facilities, including Puerto Rico, compriseapproximately 6,836,839 square feet of owned and 1,768,655 square feet of leased space. The internationalfacilities comprise approximately 6,121,996 square feet of owned and 1,563,186 square feet of leased space.Sales offices and distribution centers included in the total square footage are also located throughout the world.
12

Operations in each of BD’s business segments are conducted at both U.S. and international locations.Particularly in the international marketplace, facilities often serve more than one business segment and are usedfor multiple purposes, such as administrative/sales, manufacturing and/or warehousing/distribution. BD generallyseeks to own its manufacturing facilities, although some are leased. The following table summarizes propertyinformation by business segment.
Sites Corporate BD Biosciences BD Diagnostics BD Medical Mixed(A) Total
Leased . . . . . . . . . . . . . . . . . . . 3 7 6 56 46 118
Owned . . . . . . . . . . . . . . . . . . . 2 4 12 24 9 51
Total . . . . . . . . . . . . . . . . . . . . . 5 11 18 80 55 169
Square feet . . . . . . . . . . . . . . . . 1,003,808 800,093 2,707,529 7,718,416 4,060,830 16,290,676
(A) Facilities used by more than one business segment.
BD believes that its facilities are of good construction and in good physical condition, are suitable andadequate for the operations conducted at those facilities, and are, with minor exceptions, fully utilized andoperating at normal capacity.
The U.S. facilities are located in Arizona, California, Connecticut, Florida, Georgia, Illinois, Indiana,Maryland, Massachusetts, Michigan, Minnesota, Nebraska, New Jersey, North Carolina, Pennsylvania,South Carolina, Tennessee, Texas, Utah, Washington, D.C., Washington, Wisconsin and Puerto Rico.
The international facilities are as follows:
— Europe, which includes facilities in Austria, Belgium, the Czech Republic, Denmark, England,Finland, France, Germany, Ghana, Greece, Hungary, Ireland, Italy, Kenya, Norway, Poland, Russia,Saudi Arabia, South Africa, Spain, Sweden, Switzerland, Turkey the United Arab Emirates and Zambia.
— Greater Asia, which includes facilities in Australia, China, India, Indonesia, Japan, Malaysia,New Zealand, Pakistan, the Philippines, Singapore, South Korea, Taiwan, Thailand and Vietnam.
— Latin America, which includes facilities in Argentina, Brazil, Chile, Colombia, Costa Rica, Mexico,Peru and Venezuela.
— Canada.
Item 3. Legal Proceedings.
Given the uncertain nature of litigation generally, BD is not able in all cases to estimate the amount or rangeof loss that could result from an unfavorable outcome of the litigation to which BD is a party. In accordance withU.S. generally accepted accounting principles, BD establishes accruals to the extent probable future losses areestimable (in the case of environmental matters, without considering possible third-party recoveries). In view ofthe uncertainties discussed below, BD could incur charges in excess of any currently established accruals and, tothe extent available, excess liability insurance. In the opinion of management, any such future charges,individually or in the aggregate, could have a material adverse effect on BD’s consolidated results of operationsand consolidated cash flows.
13

BD is named as a defendant in the following purported class action suits brought on behalf of distributorsand other entities that purchase BD’s products (the “Distributor Plaintiffs”), alleging that BD violated federalantitrust laws, resulting in the charging of higher prices for BD’s products to the plaintiffs and other purportedclass members.
Case Court Date Filed
Louisiana Wholesale Drug Company,Inc., et. al. vs. Becton Dickinson andCompany
U.S. District Court, Newark,New Jersey
March 25, 2005
SAJ Distributors, Inc. et. al. vs. BectonDickinson & Co.
U.S. District Court, Eastern Districtof Pennsylvania
September 6, 2005
Dik Drug Company, et. al. vs. Becton,Dickinson and Company
U.S. District Court, Newark,New Jersey
September 12, 2005
American Sales Company, Inc. et. al. vs.Becton, Dickinson & Co.
U.S. District Court, Eastern Districtof Pennsylvania
October 3, 2005
Park Surgical Co. Inc. et. al. vs. Becton,Dickinson and Company
U.S. District Court, Eastern Districtof Pennsylvania
October 26, 2005
These actions have been consolidated under the caption “In re Hypodermic Products Antitrust Litigation.”
BD is also named as a defendant in the following purported class action suits brought on behalf ofpurchasers of BD’s products, such as hospitals (the “Hospital Plaintiffs”), alleging that BD violated federal andstate antitrust laws, resulting in the charging of higher prices for BD’s products to the plaintiffs and otherpurported class members.
Case Court Date Filed
Jabo’s Pharmacy, Inc., et. al. v. BectonDickinson & Company
U.S. District Court, Greenville,Tennessee
June 3, 2005
Drug Mart Tallman, Inc., et. al. v. BectonDickinson and Company
U.S. District Court, Newark,New Jersey
January 17, 2006
Medstar v. Becton Dickinson U.S. District Court, Newark,New Jersey
May 18, 2006
The Hebrew Home for the Aged atRiverdale v. Becton Dickinson andCompany
U.S. District Court, Southern Districtof New York
March 28, 2007
The plaintiffs in each of the above antitrust class action lawsuits seek monetary damages. All of the antitrustclass action lawsuits have been consolidated for pre-trial purposes in a Multi-District Litigation in Federal courtin New Jersey.
On April 27, 2009, BD entered into a settlement agreement with the Distributor Plaintiffs in these actions.The settlement agreement provides for, among other things, the payment by BD of $45,000,000 in exchange for arelease by all potential class members of the direct purchaser claims under federal antitrust laws related to theproducts and acts enumerated in the complaint, and a dismissal of the case with prejudice, insofar as it relates todirect purchaser claims. The release would not cover potential class members that affirmatively opt out of thesettlement or indirect purchaser claims. On September 30, 2010, the District Court denied a motion to approvethe settlement agreement, ruling that the Hospital Plaintiffs, and not the Distributor Plaintiffs, are the directpurchasers with standing to sue under federal antitrust laws. On June 5, 2012, the U.S. Court of Appeals for theThird Circuit reversed the District Court’s standing decision and ruled that the Distributor Plaintiffs, not theHospital Plaintiffs, are direct purchasers entitled to pursue damages. The Hospital Plaintiffs requested that theruling be reconsidered, but that request was denied. The settlement agreement thus remains in effect, subject tocertain termination provisions, and must be approved as to fairness by the District Court. The DistributorPlaintiffs have filed a motion requesting that the settlement agreement be preliminarily approved as fair andreasonable. Certain of the Hospital Plaintiffs have opposed that motion. BD currently cannot estimate the rangeof reasonably possible losses with respect to these class action matters beyond the $45,000,000 already accrued
14

and changes to the amount already recognized may be required in the future as additional information becomesavailable.
In June 2007, Retractable Technologies, Inc. (“RTI”) filed a complaint against BD under the captionRetractable Technologies, Inc. vs. Becton Dickinson and Company (Civil Action No. 2:07-cv-250, U.S. DistrictCourt, Eastern District of Texas). RTI alleges that the BD IntegraTM syringes infringe patents licensed exclusivelyto RTI. In its complaint, RTI also alleges that BD engaged in false advertising with respect to certain of BD’ssafety-engineered products in violation of the Lanham Act; acted to exclude RTI from various product marketsand to maintain its market share through, among other things, exclusionary contracts in violation of state andfederal antitrust laws; and engaged in unfair competition. In January 2008, the court severed the patent andnon-patent claims into separate cases, and stayed the non-patent claims during the pendency of the patent claimsat the trial court level. RTI seeks money damages and injunctive relief. On April 1, 2008, RTI filed a complaintagainst BD under the caption Retractable Technologies, Inc. and Thomas J. Shaw v. Becton Dickinson andCompany (Civil Action No.2:08-cv-141, U.S. District Court, Eastern District of Texas). RTI alleges that theBD IntegraTM syringes infringe another patent licensed exclusively to RTI. RTI seeks money damages andinjunctive relief. On August 29, 2008, the court ordered the consolidation of the patent cases. On November 9,2009, at a trial of these consolidated cases, the jury rendered a verdict in favor of RTI on all but one of itsinfringement claims, but did not find any willful infringement, and awarded RTI $5,000,000 in damages. OnMay 19, 2010, the court granted RTI’s motion for a permanent injunction against the continued sale by BD of itsBD IntegraTM products in their current form, but stayed the injunction for the duration of BD’s appeal. At thesame time, the court lifted a stay of RTI’s non-patent claims. On July 8, 2011, the Court of Appeals for theFederal Circuit reversed the District Court judgment that BD’s 3ml BD IntegraTM products infringed the assertedRTI patents and affirmed the District Court judgment of infringement against BD’s discontinued 1ml BDIntegraTM products. On October 31, 2011, the Federal Circuit Court of Appeals denied RTI’s request for an enbanc rehearing. RTI has filed a petition for review with the U.S. Supreme Court. The trial on RTI’s antitrust andfalse advertising claims has been postponed pending resolution of RTI’s appeal of the patent ruling.
With respect to RTI’s antitrust and false advertising claims, BD cannot estimate the possible loss or range ofpossible loss as there are significant legal and factual issues to be resolved. These include discovery regarding RTI’salleged damages and liability theories, which has not been completed. Each party has filed motions seeking toexclude portions of the other party’s expert testimony and to preclude the other party from introducing certain otherevidence at trial. RTI’s appeal of the appellate court’s patent ruling to the U.S. Supreme Court adds furtheruncertainty to the possible future outcomes of RTI’s antitrust and false advertising claims. In the event that RTIultimately succeeds at trial and subsequent appeals on its antitrust and false advertising claims, any potential losscould be material as RTI is seeking to recover substantial damages, including disgorgement of profits and damagesunder the federal antitrust laws, which are trebled. BD believes RTI’s allegations are without merit.
On October 19, 2009, Gen-Probe Incorporated (“Gen-Probe”) filed a patent infringement action againstBD in the U.S. District Court for the Southern District of California. The complaint alleges that the BD ViperTM
and BD ViperTM XTRTM systems and BD ProbeTecTM specimen collection products infringe certain U.S. patents ofGen-Probe. On March 23, 2010, Gen-Probe filed a complaint, also in the U.S. District Court for the SouthernDistrict of California, alleging that the BD MaxTM instrument infringes Gen-Probe patents. The patents alleged tobe infringed are a subset of the Gen-Probe patents asserted against BD in the October 2009 suit. On June 8, 2010,the court consolidated these cases. In a decision dated September 28, 2012, the District Court for the SouthernDistrict of California issued a ruling on pre-trial summary judgment motions. The court ruled that some ofGen-Probe’s asserted patent claims are infringed, but other claims are not infringed, thus reducing from six tofour the number of patents to be contested at the trial and significant defense issues relating to patent invalidity,inequitable conduct and standing, remain to be adjudicated. Gen-Probe is seeking monetary damages andinjunctive relief. BD currently cannot estimate the range of reasonably possible losses for this matter as there aresignificant issues to be resolved either prior to, or at, trial, including issues regarding patent invalidity,inequitable conduct and standing, as well as motions seeking to exclude portions of the other party’s experttestimony and to preclude the other party from introducing certain other evidence at trial.
BD believes that it has meritorious defenses to each of the above-mentioned suits pending against BD and isengaged in a vigorous defense of each of these matters.
15

BD is also involved both as a plaintiff and a defendant in other legal proceedings and claims that arise in theordinary course of business.
BD is a party to a number of Federal proceedings in the United States brought under the ComprehensiveEnvironment Response, Compensation and Liability Act, also known as “Superfund,” and similar state laws. Theaffected sites are in varying stages of development. In some instances, the remedy has been completed, while inothers, environmental studies are commencing. For all sites, there are other potentially responsible parties thatmay be jointly or severally liable to pay all cleanup costs.
Item 4. Mine Safety Disclosures.
Not applicable.
Executive Officers of the Registrant
The following is a list of the executive officers of BD, their ages and all positions and offices held by eachof them during the past five years. There is no family relationship between any executive officer or director ofBD.
Name Age Position
Vincent A. Forlenza . . . . . . . . 59 Chairman since July 2012; Director and ChiefExecutive Officer since October 2011; President sinceJanuary 2009; Chief Operating Officer from July 2010 toOctober 2011; and Executive Vice President fromJune 2006 to January 2009.
Donna M. Boles . . . . . . . . . . . 59 Senior Vice President — Human Resources.
Gary M. Cohen . . . . . . . . . . . . 53 Executive Vice President.
Alexandre Conroy . . . . . . . . . . 49 President, Europe, EMA and the Americas since June2012; President, Western Europe from August 2009 toJune 2012; and prior thereto, President, PharmaceuticalSystems.
William A. Kozy . . . . . . . . . . . 60 Chief Operating Officer since November 2012; andExecutive Vice President since June 2006.
James Lim . . . . . . . . . . . . . . . . 48 President, Greater Asia since June 2012; Vice President/General Manager, Central Asia Pacific and Operationsfrom April 2008 to June 2012; and prior thereto, Directorof Operations, Asia Pacific.
William E. Rhodes . . . . . . . . . 58 Senior Vice President, Corporate Strategy andDevelopment since October 2011; President — BDBiosciences from January 2009 to October 2011; andPresident — BD Biosciences, Cell Analysis fromFebruary 2006 to January 2009.
Jeffrey S. Sherman . . . . . . . . . 57 Senior Vice President and General Counsel.
Stephen Sichak . . . . . . . . . . . . 55 Senior Vice President, Integrated Supply Chain sinceJanuary 2009; and prior thereto, President — BDDiagnostics, Preanalytical Systems.
Suketu Upadhyay(1) . . . . . . . . . 43 Acting Chief Financial Officer since November 2012;Senior Vice President and Controller since November2011; Vice President of Finance – International fromAugust 2010 to November 2011; and prior thereto, GlobalHead of R&D Finance and Senior Director of Finance forthe CNS Franchise at AstraZeneca.
(1) As publicly indicated previously, our former Chief Executive Officer, David V. Elkins, resigned effectiveNovember 9, 2012, and Suketu Upadhyay was appointed Acting Chief Financial Officer effectiveNovember 9, 2012.
16

PART II
Item 5. Market for Registrant’s Common Equity, Related Stockholder Matters and Issuer Purchases ofEquity Securities.
BD’s common stock is listed on the New York Stock Exchange. As of October 31, 2012, there wereapproximately 8,679 shareholders of record.
Market and Market Prices of Common Stock (per common share)
2011 2012By Quarter High Low High Low
First . . . . . . . . . . . . . . . . . . . . . . . . . . . . . . . . . . . . . . . . . . . . . $85.32 $73.67 $79.64 $70.65
Second . . . . . . . . . . . . . . . . . . . . . . . . . . . . . . . . . . . . . . . . . . . 85.64 76.51 80.53 72.69
Third . . . . . . . . . . . . . . . . . . . . . . . . . . . . . . . . . . . . . . . . . . . . 89.58 83.39 78.45 72.18
Fourth . . . . . . . . . . . . . . . . . . . . . . . . . . . . . . . . . . . . . . . . . . . 89.74 73.25 79.49 73.17
Dividends (per common share)
By Quarter 2011 2012
First . . . . . . . . . . . . . . . . . . . . . . . . . . . . . . . . . . . . . . . . . . . . . . . . . . . . . . . . . . . . . . . . $0.41 $0.45
Second . . . . . . . . . . . . . . . . . . . . . . . . . . . . . . . . . . . . . . . . . . . . . . . . . . . . . . . . . . . . . . 0.41 0.45
Third . . . . . . . . . . . . . . . . . . . . . . . . . . . . . . . . . . . . . . . . . . . . . . . . . . . . . . . . . . . . . . . 0.41 0.45
Fourth . . . . . . . . . . . . . . . . . . . . . . . . . . . . . . . . . . . . . . . . . . . . . . . . . . . . . . . . . . . . . . 0.41 0.45
Issuer Purchases of Equity Securities
The table below sets forth certain information regarding BD’s purchases of its common stock during thefiscal quarter ended September 30, 2012.
Period
Total Number ofShares
Purchased(1)
AveragePricePaid
per Share
Total Number of SharesPurchased as Part ofPublicly Announced
Plans or Programs(2)
Maximum Numberof Shares thatMay Yet be
Purchased Under thePlans or Programs
July 1-31, 2012 . . . . . . . . . . . . . . . . . . . . . — $ — — 11,477,345
August 1-31, 2012 . . . . . . . . . . . . . . . . . . . 2,212,534 $75.86 2,210,000 9,267,345
September 1-30, 2012 . . . . . . . . . . . . . . . . 1,065,037 $77.57 1,061,439 8,205,906
Total . . . . . . . . . . . . . . . . . . . . . . . . . . . 3,277,571 $76.42 3,271,439 8,205,906
(1) Includes 6,132 shares purchased during the quarter in open market transactions by the trust relating to BD’sDeferred Compensation and Retirement Benefit Restoration Plan and 1996 Directors’ Deferral Plan.
(2) The repurchases were made pursuant to a repurchase program covering 18 million shares authorized by theBoard of Directors on July 26, 2011, for which there is no expiration date.
17

Item 6. Selected Financial Data.
FIVE-YEAR SUMMARY OF SELECTED FINANCIAL DATA
Becton, Dickinson and Company
Years Ended September 302012 2011 2010 2009 2008
Dollars in millions, except per share amounts
Operations
Revenues . . . . . . . . . . . . . . . . . . . . . . . . . . . . . . . . . . . . . . . . . 7,708.4 7,584.0 7,124.4 6,746.7 6,657.4
Gross Margin . . . . . . . . . . . . . . . . . . . . . . . . . . . . . . . . . . . . . . 3,953.0 3,958.9 3,696.1 3,554.6 3,415.6
Research and Development Expense . . . . . . . . . . . . . . . . . . . 471.8 469.5 422.8 395.9 373.2
Operating Income . . . . . . . . . . . . . . . . . . . . . . . . . . . . . . . . . . 1,557.9 1,665.9 1,582.4 1,508.4 1,403.5
Interest Expense (Income), Net . . . . . . . . . . . . . . . . . . . . . . . . 84.3 40.8 16.1 7.2 (3.0)
Income From Continuing Operations Before Income Taxes . . 1,472.4 1,617.9 1,566.7 1,497.3 1,405.0
Income Tax Provision . . . . . . . . . . . . . . . . . . . . . . . . . . . . . . . 362.9 417.0 451.9 382.8 382.1
Income from Continuing Operations . . . . . . . . . . . . . . . . . . . 1,109.5 1,200.9 1,114.8 1,114.5 1,022.9
Net Income . . . . . . . . . . . . . . . . . . . . . . . . . . . . . . . . . . . . . . . 1,169.9 1,271.0 1,317.6 1,231.6 1,127.0
Basic Earnings Per Share from Continuing Operations . . . . . 5.40 5.43 4.76 4.63 4.19
Diluted Earnings Per Share from Continuing Operations . . . . 5.30 5.31 4.64 4.52 4.05
Dividends Per Common Share . . . . . . . . . . . . . . . . . . . . . . . . 1.80 1.64 1.48 1.32 1.14
Financial Position
Total Current Assets . . . . . . . . . . . . . . . . . . . . . . . . . . . . . . . . 5,322.1 4,668.3 4,505.3 4,647.0 3,614.7
Total Current Liabilities . . . . . . . . . . . . . . . . . . . . . . . . . . . . . 1,978.1 1,823.2 1,671.7 1,777.1 1,416.6
Total PPE, Net . . . . . . . . . . . . . . . . . . . . . . . . . . . . . . . . . . . . . 3,303.9 3,211.2 3,100.5 2,966.6 2,744.5
Total Assets . . . . . . . . . . . . . . . . . . . . . . . . . . . . . . . . . . . . . . . 11,360.9 10,430.4 9,650.7 9,304.6 7,912.9
Total Long-Term Debt . . . . . . . . . . . . . . . . . . . . . . . . . . . . . . 3,761.1 2,484.7 1,495.4 1,488.5 953.2
Total Shareholders’ Equity . . . . . . . . . . . . . . . . . . . . . . . . . . . 4,135.9 4,828.2 5,434.6 5,142.7 4,935.6
Book Value Per Common Share . . . . . . . . . . . . . . . . . . . . . . . 21.00 22.48 23.65 21.69 20.30
Financial Relationships
Gross Profit Margin . . . . . . . . . . . . . . . . . . . . . . . . . . . . . . . . . 51.3% 52.2% 51.9% 52.7% 51.3%
Return on Revenues(C) . . . . . . . . . . . . . . . . . . . . . . . . . . . . . . 14.4% 15.8% 15.6% 16.5% 15.4%
Return on Total Assets(A)(C) . . . . . . . . . . . . . . . . . . . . . . . . . 14.7% 17.0% 17.1% 17.9% 18.9%
Return on Equity(C) . . . . . . . . . . . . . . . . . . . . . . . . . . . . . . . . 24.8% 23.4% 21.1% 22.1% 22.0%
Debt to Capitalization(B)(C) . . . . . . . . . . . . . . . . . . . . . . . . . . 49.7% 35.8% 23.7% 26.8% 18.8%
Additional Data
Number of Employees . . . . . . . . . . . . . . . . . . . . . . . . . . . . . . . 29,600 29,400 28,800 29,100 28,300
Number of Shareholders . . . . . . . . . . . . . . . . . . . . . . . . . . . . . 8,696 8,713 8,887 8,930 8,820
Average Common and Common Equivalent Shares . . . . . . . .Outstanding — Assuming Dilution (millions) . . . . . . . . . . . . 209.2 226.3 240.1 246.8 252.7
Depreciation and Amortization . . . . . . . . . . . . . . . . . . . . . . . . 510.9 493.8 491.4 454.9 462.7
Capital Expenditures . . . . . . . . . . . . . . . . . . . . . . . . . . . . . . . . 487.4 508.8 531.0 575.3 562.4
(A) Earnings before interest expense and taxes as a percent of average total assets.
(B) Total debt as a percent of the sum of total debt, shareholders’ equity and non-current deferred income taxliabilities.
(C) Excludes discontinued operations.
18

Item 7. Management’s Discussion and Analysis of Financial Condition and Results of Operations.
FINANCIAL REVIEW
Company Overview
Description of the Company and Business Segments
Becton, Dickinson and Company (“BD”) is a global medical technology company engaged principally in thedevelopment, manufacture and sale of medical devices, instrument systems and reagents used by healthcareinstitutions, life science researchers, clinical laboratories, the pharmaceutical industry and the general public. Ourbusiness consists of three worldwide business segments — BD Medical (“Medical”), BD Diagnostics (“Diagnostics”)and BD Biosciences (“Biosciences”). Our products are marketed in the United States and internationally throughindependent distribution channels and directly to end-users by BD and independent sales representatives. References toyears throughout this discussion relate to our fiscal years, which end on September 30.
Strategic Objectives
BD remains focused on delivering sustainable growth and shareholder value, while making appropriateinvestments for the future. BD management operates the business consistent with the following core strategies:
• To increase revenue growth by focusing on our core products that deliver greater benefits to patients,healthcare workers and researchers;
• To increase investment in research and development for platform extensions and innovative new products;
• To make significant investments in growing our operations in emerging markets;
• To improve operating effectiveness and balance sheet productivity;
• To drive an efficient capital structure and strong shareholder returns.
Our strategy focuses on four specific areas within healthcare and life sciences:
• Enabling safer, simpler and more effective parenteral drug delivery;
• Improving clinical outcomes through new, accurate and faster diagnostics;
• Providing tools and technologies to the research community that facilitates the understanding of the cell,cellular diagnostics and cell therapy;
• Enhancing disease management in diabetes, women’s health and cancer, and infection control.
We continue to strive to improve the efficiency of our capital structure and follow these guiding principles:
• To maintain an investment grade rating;
• To ensure access to the debt market for strategic opportunities;
• To optimize the cost of capital based on market conditions.
In assessing the outcomes of these strategies as well as BD’s financial condition and operating performance,management generally reviews quarterly forecast data, monthly actual results, segment sales and other similarinformation. We also consider trends related to certain key financial data, including gross profit margin, sellingand administrative expense, investment in research and development, return on invested capital, and cash flows.
Summary of Financial Results
Worldwide revenues in 2012 of $7.7 billion increased 1.6% from the prior year and reflected estimatedvolume increases of 5.2%, which included growth from acquisitions of 1.1%, partially offset by estimatedunfavorable foreign exchange translation of 2.7%, and estimated price decreases of 0.9%. Solid growth from our
19

Medical and Diagnostics segments was primarily driven by new product launches and growth from recentacquisitions, safety-engineered products and emerging markets. Revenues in the United States in 2012 of $3.3billion increased 1%, reflecting pricing pressures for certain Medical Surgical Systems products and anincreasingly competitive market for microbiology products. In addition, Biosciences revenue in the U.S. declineddue to reduced research funding and constrained demand for high-end instruments. International revenues in2012 of $4.4 billion increased 2%, which reflected an estimated impact of unfavorable foreign currencytranslation of 5%. International revenues for 2012 reflected growth from all segments, including growthattributable to emerging markets, as well as strong sales of safety-engineered products. Sales in the United Statesof safety-engineered devices grew 3% to $1.15 billion in 2012 from $1.12 billion in 2011. International sales ofsafety-engineered devices were $834 million in 2012 compared with $755 million in 2011, or 10.5% growthwhich included an estimated 5% negative impact due to unfavorable foreign currency translation. Internationalsafety-engineered device revenue growth continues to be driven by strong sales in the Medical Segment, with thelargest growth in emerging markets, including China and Latin America.
We continue to invest in research and development spending, geographic expansion, and new productpromotions to drive further revenue and profit growth. Our ability to sustain our long-term growth will depend ona number of factors, including our ability to expand our core business (including geographical expansion),develop innovative new products with higher gross profit margins across our business segments, and continue toimprove operating efficiency and organizational effectiveness. The healthcare industry continues to face achallenging economic environment. The current economic conditions and other circumstances have resulted inpricing pressures for some of our products. As mentioned above, our Biosciences segment continues to beimpacted by an uncertain research spending environment and lack of overall demand for instruments andresearch reagents. In other areas of our U.S. business, healthcare utilization is stable but constrained.Additionally, uncertainty in Europe due to continued macroeconomic challenges has resulted in constrainedhealthcare utilization in that region.
In addition to the economic conditions in the United States and elsewhere, numerous other factors can affectour ability to achieve our goals including, without limitation, increased competition and healthcare reforminitiatives. For example, the U.S. healthcare reform law contains certain tax provisions that will affect BD. Themost significant impact is the medical device excise tax, which imposes a 2.3% tax on certain U.S. sales ofmedical devices, beginning in January 2013. We currently estimate that our fiscal 2013 excise tax (impactingonly three quarters for fiscal year 2013) will be between $40 million to $50 million and will be recorded inselling and administrative expense.
Our financial position remains strong, with cash flows from operating activities totaling $1.7 billion in 2012.At September 30, 2012, we had $2.2 billion in cash and equivalents and short-term investments. Cash outflowsrelating to acquisitions included the purchase of KIESTRA Lab Automation BV (“KIESTRA”), a Netherlands-based company that manufactures and sells innovative lab automation solutions for the microbiology lab, for $51million, net of cash acquired. The Company also paid $52 million, net of cash acquired, for Sirigen Group Limited(“Sirigen”), a developer of unique polymer dyes that are used in flow cytometry. Capital expenditures were $487million in 2012 as we continue to invest in capacity across our segments to support future growth. In November2011, we issued $500 million of 5-year 1.75% notes and $1 billion of 10-year 3.125% notes, as discussed furtherbelow. Also, we continued to return value to our shareholders in the form of share repurchases and dividends.During 2012, we repurchased $1.5 billion of our common stock and paid cash dividends of $368 million.
We face currency exposure each reporting period that arises from translating the results of our worldwideoperations to the U.S. dollar at exchange rates that fluctuate from the beginning of such period. We evaluate ourresults of operations on both an as reported and a foreign currency-neutral basis, which excludes the impact offluctuations in foreign currency exchange rates. We calculate foreign currency-neutral percentages by convertingour current-period local currency financial results using the prior-period foreign currency exchange rates andcomparing these adjusted amounts to our current-period reported results. From time to time, we may purchaseforward contracts and options to partially protect against adverse foreign exchange rate movements. Gains or losseson our derivative instruments are largely offset by the gains or losses on the underlying hedged transactions. We donot enter into derivative instruments for trading or speculative purposes. For further discussion refer to Note 12 tothe consolidated financial statements contained in Item 8. Financial Statements and Supplementary Data.
20
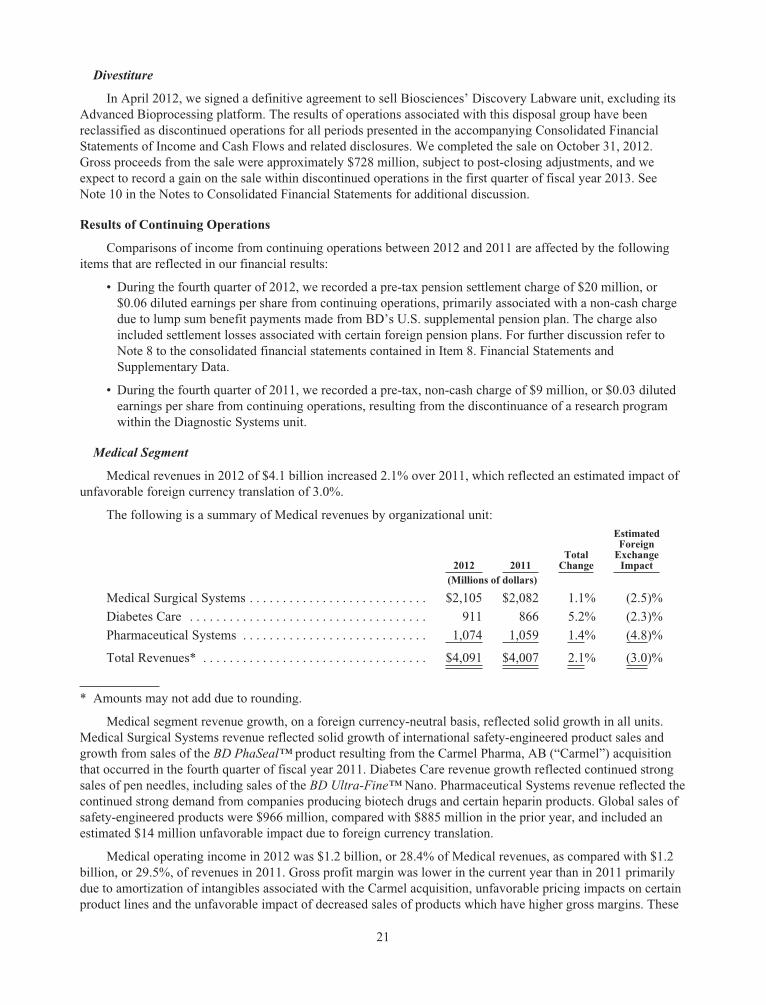
Divestiture
In April 2012, we signed a definitive agreement to sell Biosciences’ Discovery Labware unit, excluding itsAdvanced Bioprocessing platform. The results of operations associated with this disposal group have beenreclassified as discontinued operations for all periods presented in the accompanying Consolidated FinancialStatements of Income and Cash Flows and related disclosures. We completed the sale on October 31, 2012.Gross proceeds from the sale were approximately $728 million, subject to post-closing adjustments, and weexpect to record a gain on the sale within discontinued operations in the first quarter of fiscal year 2013. SeeNote 10 in the Notes to Consolidated Financial Statements for additional discussion.
Results of Continuing Operations
Comparisons of income from continuing operations between 2012 and 2011 are affected by the followingitems that are reflected in our financial results:
• During the fourth quarter of 2012, we recorded a pre-tax pension settlement charge of $20 million, or$0.06 diluted earnings per share from continuing operations, primarily associated with a non-cash chargedue to lump sum benefit payments made from BD’s U.S. supplemental pension plan. The charge alsoincluded settlement losses associated with certain foreign pension plans. For further discussion refer toNote 8 to the consolidated financial statements contained in Item 8. Financial Statements andSupplementary Data.
• During the fourth quarter of 2011, we recorded a pre-tax, non-cash charge of $9 million, or $0.03 dilutedearnings per share from continuing operations, resulting from the discontinuance of a research programwithin the Diagnostic Systems unit.
Medical Segment
Medical revenues in 2012 of $4.1 billion increased 2.1% over 2011, which reflected an estimated impact ofunfavorable foreign currency translation of 3.0%.
The following is a summary of Medical revenues by organizational unit:
2012 2011Total
Change
EstimatedForeign
ExchangeImpact
(Millions of dollars)
Medical Surgical Systems . . . . . . . . . . . . . . . . . . . . . . . . . . . $2,105 $2,082 1.1% (2.5)%
Diabetes Care . . . . . . . . . . . . . . . . . . . . . . . . . . . . . . . . . . . . 911 866 5.2% (2.3)%
Pharmaceutical Systems . . . . . . . . . . . . . . . . . . . . . . . . . . . . 1,074 1,059 1.4% (4.8)%
Total Revenues* . . . . . . . . . . . . . . . . . . . . . . . . . . . . . . . . . . $4,091 $4,007 2.1% (3.0)%
* Amounts may not add due to rounding.
Medical segment revenue growth, on a foreign currency-neutral basis, reflected solid growth in all units.Medical Surgical Systems revenue reflected solid growth of international safety-engineered product sales andgrowth from sales of the BD PhaSeal™ product resulting from the Carmel Pharma, AB (“Carmel”) acquisitionthat occurred in the fourth quarter of fiscal year 2011. Diabetes Care revenue growth reflected continued strongsales of pen needles, including sales of the BD Ultra-Fine™ Nano. Pharmaceutical Systems revenue reflected thecontinued strong demand from companies producing biotech drugs and certain heparin products. Global sales ofsafety-engineered products were $966 million, compared with $885 million in the prior year, and included anestimated $14 million unfavorable impact due to foreign currency translation.
Medical operating income in 2012 was $1.2 billion, or 28.4% of Medical revenues, as compared with $1.2billion, or 29.5%, of revenues in 2011. Gross profit margin was lower in the current year than in 2011 primarilydue to amortization of intangibles associated with the Carmel acquisition, unfavorable pricing impacts on certainproduct lines and the unfavorable impact of decreased sales of products which have higher gross margins. These
21

unfavorable impacts on gross profit margin were partially offset by favorable foreign currency translation andlower manufacturing costs resulting from Project ReLoCo, a global, cross-functional business initiative to drivesustained low-cost capability, primarily benefitting Medical Surgical Systems. See further discussion on grossprofit margin below. Selling and administrative expense as a percentage of Medical revenues in 2012 increasedto 17.7% of revenues from 17.5% of revenues in 2011, primarily due to increased spending for expansion inemerging markets and higher expenses resulting from the Carmel acquisition as compared with the prior year’speriod, partially offset by continued spending controls and favorable foreign currency translation. Research anddevelopment expenses in 2012 increased $11 million, or 8%, and reflected continued investment in thedevelopment of new products and platforms, including new diabetes care and closed system transfer devices.
Diagnostics Segment
Diagnostics revenues in 2012 of $2.5 billion increased 2.3% over 2011, which reflected an estimated impactof unfavorable foreign currency translation of 2.2%.
The following is a summary of Diagnostics revenues by organizational unit:
2012 2011Total
Change
EstimatedForeign
ExchangeImpact
(Millions of dollars)
Preanalytical Systems . . . . . . . . . . . . . . . . . . . . . . . . . . . . . . $1,301 $1,278 1.8% (2.5%)
Diagnostic Systems . . . . . . . . . . . . . . . . . . . . . . . . . . . . . . . . 1,237 1,203 2.9% (1.8%)
Total Revenues* . . . . . . . . . . . . . . . . . . . . . . . . . . . . . . . . . . $2,538 $2,480 2.3% (2.2%)
* Amounts may not add due to rounding.
Revenue growth in the Preanalytical Systems unit, on a foreign currency-neutral basis, was driven by salesof safety-engineered products. Sales of safety-engineered products grew 2% in the United States, driven by BDVacutainerTM Push Button Blood Collection Set sales, and 4% internationally, which included an estimatedunfavorable foreign exchange impact of 5%. The Diagnostic Systems unit experienced growth in worldwide salesof its automated diagnostic platforms, including the molecular BD ProbeTecTM, BD ViperTM and BD AffirmTM
systems, along with solid growth of its BD BACTECTM blood culture and TB systems and the BD PhoenixTM
ID/AST platform and its SurePath products. Diagnostics revenues in 2012 also reflected a favorable comparisonto the prior-year period due to new product launches and the KIESTRA acquisition.
Diagnostics operating income in 2012 was $653 million, or 25.7% of Diagnostics revenues, compared with$636 million, or 25.7% of revenues, in 2011. Gross profit margin in the Diagnostics segment was down ascompared to the prior year and reflected unfavorable foreign currency translation, higher raw material costs, andthe unfavorable impact of decreased sales of products which have higher gross margins. See further discussion ongross profit margin below. Selling and administrative expense as a percentage of Diagnostics revenues increasedby 10 basis points in 2012 to 21.6%, primarily due to investments in emerging markets, partially offset bycontinued spending controls and favorable foreign currency translation. Research and development expensedecreased $9 million, or 5% from 2011 reflecting a program termination in 2011. Current year R&D spendingreflected our continued investment in the development of new products and platforms, including the BD MAX™and new BD Viper™ platforms and menus.
Biosciences Segment
Biosciences revenues, which include the Cell Analysis unit and the Advanced Bioprocessing platform, of$1.1 billion in 2012 decreased 1.5% from 2011, and reflected an estimated impact of unfavorable foreigncurrency translation of 2.2%. Biosciences revenue growth, on a foreign currency-neutral basis, was primarilydriven by instrument and reagent sales in emerging markets, partially offset by declines in the U.S. due toconstrained research spending.
22

Biosciences operating income in 2012 was $262 million, or 24.2% of Biosciences revenues, compared with$278 million, or 25.4%, in 2011. The Segment’s operating income in 2012 reflected a lower gross profit marginthan 2011 primarily due to the unfavorable impact of foreign currency translation and amortization of capitalizedsoftware as well as intangibles associated with the 2011 acquisition of Accuri Cytometers, Inc. (“Accuri”). TheSegment’s gross profit margin was also unfavorably impacted by increases in certain raw material costs. Seefurther discussion on gross profit margin below. Selling and administrative expense as a percentage ofBiosciences revenues was 24.4% in 2012 as compared with 24.5% in 2011 and reflected continued spendingcontrols partially offset by unfavorable foreign currency translation. Research and development spending wasrelatively flat to prior year and reflects spending on new products and platforms, including next generation cellsorters and analyzers.
Geographic Revenues
Revenues in the United States in 2012 of $3.3 billion increased 1%. Growth in U.S. Medical revenuesreflected strong sales of Pharmaceutical Systems and Diabetes Care products, which were partially offset bypricing pressures for certain Medical Surgical Systems products. Diagnostic Systems revenue growth in the U.S.was unfavorably affected by an increasingly competitive market for microbiology products and weak sales fromour GeneOhm™ healthcare-associated infections (“HAI”) platform, also due to a challenging competitiveenvironment. Biosciences revenues in the U.S. declined in the current year compared with the prior year due toreduced research funding, as we continue to experience constrained demand for high-end instruments due tocontinued funding concerns in the pharmaceutical and biotech research markets as well as in the academicmarkets.
International revenues in 2012 of $4.4 billion increased 2%, which reflected an estimated impact ofunfavorable foreign currency translation of 5%. International revenues for 2012 reflected growth from allsegments, including growth attributable to emerging markets, as well as strong sales of safety-engineeredproducts.
Gross Profit Margin
Gross profit margin was 51.3% in 2012, compared with 52.2% in 2011. The decrease in gross profit marginreflected the estimated net unfavorable impact of 70 basis points relating to operating performance, an estimated10 basis points relating to unfavorable foreign currency translation and an estimated 10 basis points relating topension settlements. Operating performance was adversely affected by an estimated 50 basis points due to theimpact of decreased sales of products which have higher gross margins. Operating performance also reflected theestimated impacts of 50 basis points due to unfavorable pricing impacts on certain product lines as well as 20basis points due to increases in certain raw material costs. Operating performance was also adversely impactedby approximately 10 basis points due to amortization of intangibles associated with recent acquisitions,approximately 20 basis points due to Biosciences software amortization and approximately 30 basis points due toother unfavorable one-time impacts. The unfavorable impacts on operating performance for the current year werepartially offset by an estimated 80 basis points due to lower manufacturing costs from continuous improvementprojects, such as Project ReLoCo, and lower pension costs. Operating performance was also favorably impactedby approximately 30 basis points due to the change in useful lives of certain machinery and equipment assets.See Note 2 to the consolidated financial statements contained in Item 8 for additional discussion.
Operating Expenses
Selling and administrative expense in 2012 was $1.9 billion, or 25% of revenues, compared with $1.8billion, or 24% of revenues in 2011. Aggregate expenses for 2012 reflected an increase in core spending of $105million, primarily relating to expansion of our business in emerging markets, transactions costs relating to theKIESTRA acquisition and higher expenses resulting from the Carmel and KIESTRA acquisitions. Aggregateexpenses for the current year also included increased spending of $23 million related to our global enterpriseresource planning initiative to update our business information systems and $8 million related to pensionsettlements. Additionally, aggregate expenses in the current year included a $16 million increase in the deferredcompensation plan liability, as further discussed below. These increases were partially offset by favorable foreigncurrency translation of $41 million and lower pension expense of $11 million.
23

Research and development (“R&D”) expense in 2012 was $472 million, or 6.1% of revenues, comparedwith $470 million, or 6.2% of revenues, in 2011. The increase in R&D expenditures includes spending for newproducts and platforms in each of our segments, as previously discussed. Current year expense also includes $2million associated with pension settlements. R&D expense in 2011 included a non-cash impairment charge of $9million resulting from the discontinuance of a research program within the Diagnostic Systems unit.
Non-Operating Expense and Income
Interest expense in 2012 was $135 million, compared with $84 million in 2011. The increase reflectedhigher levels of long-term fixed-rate debt, partially offset by lower average interest rates on this debt, as well as areduction in the amount of capitalized interest. The reduction in capitalized interest was attributable to a loweraverage interest rate on the overall debt portfolio. Interest income was $50 million in 2012, compared with $43million in 2011. The increase was largely the result of investment gains on assets related to our deferredcompensation plan, offset partially by the impact of lower interest rates and lower investment levels in certainnon-U.S. locations. The offsetting movements in the deferred compensation plan liability were recorded inselling and administrative expenses.
Income Taxes
The effective tax rate in 2012 of 24.6% was lower compared with the 2011 rate of 25.8%. The 2012rate reflected the favorable impact of various tax settlements in multiple jurisdictions, while 2011 reflected thefavorable impact due to the timing of certain tax benefits resulting from the retroactive extension of the U.S.research tax credit and a European restructuring transaction.
Income and Diluted Earnings per Share from Continuing Operations
Income from continuing operations and diluted earnings per share from continuing operations in 2012 were$1.1 billion and $5.30, respectively. The charge related to pension settlements decreased income from continuingoperations in 2012 by $13 million, or $0.06 per share. Earnings in 2012 also reflected an estimated overall netunfavorable impact of foreign currency fluctuations of $0.21 per share. Income from continuing operations anddiluted earnings per share from continuing operations in 2011 were $1.2 billion and $5.31, respectively. Thecharge related to the discontinuance of a research program decreased income from continuing operations in 2011by $6 million, or $0.03 per share.
Financial Instrument Market Risk
We selectively use financial instruments to manage market risk, primarily foreign currency exchange riskand interest rate risk relating to our ongoing business operations. The counterparties to these contracts are highlyrated financial institutions. We do not enter into financial instruments for trading or speculative purposes.
Foreign Exchange Risk
BD and its subsidiaries transact business in various foreign currencies throughout Europe, Asia Pacific,Canada, Japan and Latin America. We face foreign currency exposure from the effect of fluctuating exchangerates on payables and receivables relating to transactions that are denominated in currencies other than ourfunctional currency. These payables and receivables primarily arise from intercompany transactions. We hedgesubstantially all such exposures, primarily through the use of forward contracts. We also face currency exposurethat arises from translating the results of our worldwide operations, including sales, to the U.S. dollar at exchangerates that have fluctuated from the beginning of a reporting period. From time to time, we purchase forwardcontracts and options to hedge certain forecasted sales that are denominated in foreign currencies in order topartially protect against a reduction in the value of future sales resulting from adverse foreign exchange ratemovements. Gains or losses on our derivative instruments are largely offset by the gains or losses on theunderlying hedged transactions. We did not enter into contracts to hedge cash flows in fiscal year 2012.
24

Derivative financial instruments are recorded on our balance sheet at fair value. For foreign currencyderivatives, market risk is determined by calculating the impact on fair value of an assumed change in foreignexchange rates relative to the U.S. dollar. Fair values were estimated based upon observable inputs, specificallyspot currency rates and foreign currency prices for similar assets and liabilities. With respect to the derivativeinstruments outstanding at September 30, 2012, a 10% appreciation of the U.S. dollar over a one-year periodwould decrease pre-tax earnings by $8 million, while a 10% depreciation of the U.S. dollar would increasepre-tax earnings by $8 million. Comparatively, considering our derivative instruments outstanding atSeptember 30, 2011, a 10% appreciation of the U.S. dollar over a one-year period would have decreased pre-taxearnings by $23 million, while a 10% depreciation of the U.S. dollar would have increased pre-tax earnings by$23 million. These calculations do not reflect the impact of exchange gains or losses on the underlyingtransactions that would substantially offset the results of the derivative instruments.
Interest Rate Risk
Our primary interest rate exposure results from changes in short-term U.S. dollar interest rates. Our debt andinterest-bearing investments at September 30, 2012 are substantially all U.S. dollar-denominated. Therefore,transaction and translation exposure relating to such instruments is minimal. When managing interest rateexposures, we strive to achieve an appropriate balance between fixed and floating rate instruments. We may enterinto interest rate swaps to help maintain this balance and manage debt and interest-bearing investments intandem, since these items have an offsetting impact on interest rate exposure. For interest rate derivativeinstruments, fair values are provided by the financial institutions that are counterparties to these arrangements.Market risk for these instruments is determined by calculating the impact to fair value of an assumed change ininterest rates across all maturities. A change in interest rates on short-term debt and interest-bearing investmentsimpacts our earnings and cash flow, but not the fair value of these instruments because of their limited duration.A change in interest rates on long-term debt is assumed to impact the fair value of the debt, but not our earningsor cash flow because the interest on such obligations is fixed. Based on our overall interest rate exposure atSeptember 30, 2012 and 2011, a change of 10% in interest rates would not have a material effect on our earningsor cash flows over a one-year period. An increase of 10% in interest rates would decrease the aggregate fair valueof our long-term debt and related fair value hedges at September 30, 2012 and 2011 by approximately $109million and $90 million, respectively. A 10% decrease in interest rates would increase the aggregate fair value ofthese same financial instruments at September 30, 2012 and 2011 by approximately $115 million and $96million, respectively.
Liquidity and Capital Resources
Net Cash Flows from Continuing Operating Activities
Net cash provided by continuing operating activities in 2012 was $1.7 billion, compared with $1.6 billion in2011. The current year change in operating assets and liabilities resulted in a net use of cash and primarilyreflected higher levels of inventory and accounts receivables, substantially offset by lower levels of prepaidexpenses. Net cash provided by continuing operating activities in 2012 was reduced by changes in the pensionobligation resulting primarily from a discretionary cash contribution of $100 million. An additional discretionarycontribution of $100 million was made to the U.S. pension plan in October 2012.
Net Cash Flows from Continuing Investing Activities
Capital Expenditures
Our investments in capital expenditures are focused on projects that enhance our cost structure andmanufacturing capabilities, and support our strategy of geographic expansion with select investments in growingmarkets. Capital expenditures were $487 million in 2012, compared with $509 million in 2011. Capital spendingfor the Medical, Diagnostics and Biosciences segments in 2012 was $363 million, $101 million and $14 million,respectively, and related primarily to manufacturing capacity expansions.
25

Acquisitions of Businesses
Cash outflows relating to acquisitions of $103 million in 2012 were comprised of $51 million relating to theKIESTRA acquisition and $52 million associated with the acquisition of Sirigen. Acquisitions of businesses of$492 million in 2011 were comprised of $287 million associated with Carmel and $205 million relating toAccuri. For further discussion, refer to Note 9 in the notes to consolidated financial statements contained inItem 8, Financial Statements and Supplementary Data. On June 29, 2012, the Company entered into a definitiveagreement to acquire Safety Syringes, Inc., a privately held California-based company that specializes in thedevelopment of anti-needlestick devices for prefilled syringes. The acquisition, which is subject to thesatisfaction of customary closing conditions, including regulatory approvals, is expected to close by the end ofthe Company’s first fiscal quarter of 2013.
Net Cash Flows from Continuing Financing Activities
Debt Issuances and Payments of Obligations
On November 3, 2011, we issued $500 million of 5-year 1.75% Notes and $1 billion of 10-year 3.125%Notes. Short-term debt increased to 9.7% of total debt at the end of 2012, from 8.6% at the end of 2011. Floatingrate debt was 9.7% of total debt at the end of 2012 and 16% at the end of 2011. Our weighted average cost oftotal debt at the end of 2012 was 3.7%, down from 4.9% at the end of 2011. Debt-to-capitalization (ratio of totaldebt to the sum of total debt, shareholders’ equity and net non-current deferred income tax liabilities) atSeptember 30, 2012 was 49.7% compared with 35.8% at September 30, 2011.
Repurchase of Common Stock
We repurchased approximately 19.9 million shares of our common stock for $1.5 billion in 2012 and18.4 million shares for $1.5 billion in 2011. A total of approximately 8.2 million common shares remainavailable for purchase at September 30, 2012 under the Board of Directors’ July 2011 repurchase authorization.We plan on share repurchases of approximately $500 million in 2013, subject to market conditions.
Cash and Short-term Investments
At September 30, 2012, total worldwide cash and short-term investments were $2.18 billion, of which $1.75billion was held in jurisdictions outside of the United States. We regularly review the amount of cash and short-term investments held outside the United States and currently intend to use most of such amounts to fund ourinternational operations and their growth initiatives. However, if these amounts were moved out of thesejurisdictions or repatriated to the United States, there could be tax consequences.
Government Receivables
Accounts receivable balances include sales to government-owned or government-supported healthcarefacilities in several countries, which are subject to delays. Payment is dependent upon the financial stability andcreditworthiness of those countries’ national economies. Deteriorating credit and economic conditions in parts ofWestern Europe, particularly in Italy and Spain, may continue to increase the average length of time it takes us tocollect our accounts receivable in certain regions within these countries. Outstanding governmental receivablebalances, net of reserves, in Italy and Spain at September 30, 2012 were $71 million and $43 million,respectively.
We continually evaluate all governmental receivables for potential collection risks associated with theavailability of government funding and reimbursement practices. We believe the current reserves related to allgovernmental receivables are adequate and that this concentration of credit risk will not have a material adverseimpact on our financial position or liquidity.
Credit Facilities
We have in place a commercial paper borrowing program that is available to meet our short-term financingneeds, including working capital requirements. Borrowings outstanding under this program were $200 million at
26

September 30, 2012. During the third quarter, we established a $1 billion syndicated credit facility with anexpiration date of May 2017, replacing a $1 billion facility due to expire in December 2012. This new creditfacility, under which there were no borrowings outstanding at September 30, 2012, provides backup support forour commercial paper program and can also be used for other general corporate purposes. It includes a provisionthat enables BD, subject to additional commitments made by the lenders, to access up to an additional $500million in financing through the facility, for a maximum aggregate commitment of $1.5 billion. The creditfacility includes a single financial covenant that requires BD to maintain an interest expense coverage ratio (ratioof earnings before income taxes, depreciation and amortization to interest expense) of not less than 5-to-1 for themost recent four consecutive fiscal quarters. On the last eight measurement dates, this ratio has ranged from13-to-1 to 26-to-1. In addition, we have informal lines of credit outside the United States.
Access to Capital and Credit Ratings
Our ability to generate cash flow from operations, issue debt, enter into other financing arrangements andattract long-term capital on acceptable terms could be adversely affected in the event there was a material declinein the demand for our products, deterioration in our key financial ratios or credit ratings, or other significantlyunfavorable changes in conditions.
BD’s credit ratings at September 30, 2012, which reflect an action by Moody’s on September 12, 2012, thatplaced our ratings under review for downgrade, were as follows:
Standard & Poor’s Moody’s
Ratings:
Senior Unsecured Debt . . . . . . . . A+ A2
Commercial Paper . . . . . . . . . . . A-1+ P-1
Outlook . . . . . . . . . . . . . . . . . . . . . . . . Stable Under review for downgrade
On October 3, 2012, Moody’s downgraded BD’s Senior Unsecured Debt rating to A3 and lowered itsCommercial Paper rating to Prime-2, while changing its outlook to “Stable”.
While further deterioration in our credit ratings would increase the costs associated with maintaining andborrowing under our existing credit arrangements, such a downgrade would not affect our ability to draw onthese credit facilities, nor would it result in an acceleration of the scheduled maturities of any outstanding debt.We believe that given our debt ratings, our conservative financial management policies, our ability to generatecash flow and the non-cyclical, geographically diversified nature of our businesses, we would have access toadditional short-term and long-term capital should the need arise.
Contractual Obligations
In the normal course of business, we enter into contracts and commitments that obligate us to makepayments in the future. The table below sets forth BD’s significant contractual obligations and related scheduledpayments:
Total 20132014 to
20152016 to
20172018 and
Thereafter(Millions of dollars)
Short-term debt . . . . . . . . . . . . . . . . . . . . . . . . . . . . . . . . . . . . . . . . . $ 406 $406 $ — $ — $ —
Long-term debt(A) . . . . . . . . . . . . . . . . . . . . . . . . . . . . . . . . . . . . . . . 5,683 150 301 793 4,439
Operating leases . . . . . . . . . . . . . . . . . . . . . . . . . . . . . . . . . . . . . . . . . 211 50 78 49 34
Purchase obligations(B) . . . . . . . . . . . . . . . . . . . . . . . . . . . . . . . . . . . 506 295 155 56 —
Unrecognized tax benefits(C) . . . . . . . . . . . . . . . . . . . . . . . . . . . . . . — — — — —
Total (D) . . . . . . . . . . . . . . . . . . . . . . . . . . . . . . . . . . . . . . . . . . $6,806 $901 $534 $898 $4,473
(A) Long-term debt obligations include expected principal and interest obligations.
27

(B) Purchase obligations are for purchases made in the normal course of business to meet operational andcapital requirements.
(C) Unrecognized tax benefits at September 30, 2012 of $123 million were all long-term in nature. Due to theuncertainty related to the timing of the reversal of these tax positions, the related liability has been excludedfrom the table.
(D) Required funding obligations for 2013 relating to pension and other postretirement benefit plans are notexpected to be material. In October 2012, a discretionary cash contribution of $100 million was made to theU.S. pension plan.
2011 Compared With 2010
Results of Continuing Operations
Comparisons of income from continuing operations between 2011 and 2010 are affected by the followingitems that are reflected in our financial results:
• During the fourth quarter of 2011, we recorded a pre-tax non-cash charge of $9 million, or $0.03 dilutedearnings per share from continuing operations, resulting from the discontinuance of a research programwithin the Diagnostics Systems unit.
• During the second quarter of 2010, we recorded a non-cash charge of $9 million, or $0.04 diluted earningsper share from continuing operations, related to the elimination of the employer deduction of the MedicarePart D retiree drug subsidy under the U.S. healthcare reform law.
Medical Segment
Medical revenues in 2011 of $4.0 billion increased 5.6% over 2010, which reflected an estimated impact offavorable foreign currency translation of 3.3%.
The following is a summary of Medical revenues by organizational unit:
2011 2010Total
Change
EstimatedForeign
ExchangeImpact
(Millions of dollars)
Medical Surgical Systems . . . . . . . . . . . . . . . . . . . . . . . . . . . . . . . . . . . . . . . $2,082 $2,010 3.6% 3.2%
Diabetes Care . . . . . . . . . . . . . . . . . . . . . . . . . . . . . . . . . . . . . . . . . . . . . . . . 866 786 10.3% 3.5%
Pharmaceutical Systems . . . . . . . . . . . . . . . . . . . . . . . . . . . . . . . . . . . . . . . . 1,059 1,001 5.8% 3.4%
Total Revenues* . . . . . . . . . . . . . . . . . . . . . . . . . . . . . . . . . . . . . . . . . . . . . . $4,007 $3,796 5.6% 3.3%
* Amounts may not add due to rounding.
Revenue growth in the Medical Segment reflected strong growth of Pharmaceutical Systems andinternational safety-engineered product sales. Revenues of safety-engineered products increased 33.4%internationally, which included an estimated favorable foreign exchange impact of 9.7%. Revenue growth in thePharmaceutical Systems unit was driven by double-digit growth in the United States, Japan and Latin America.U.S. revenue growth in the Pharmaceutical Systems unit in 2011 was aided by strong sales to companiesproducing certain generic heparin products. Revenue growth in the Diabetes Care unit resulted primarily fromcontinued strong growth in worldwide pen needle sales. Medical revenues in 2011 also reflected an unfavorablecomparison to the prior-year period that included strong sales related to the H1N1 flu pandemic primarily in thefirst half of the year. We estimate that this unfavorable comparison negatively impacted Medical’s revenuegrowth rate by approximately 2.2 percentage points.
Medical operating income in 2011 was $1.2 billion, or 29.5% of Medical revenues, as compared with $1.1billion, or 29.5% of revenues, in 2010. Gross profit margin was higher in the current year than 2010 due toincreased sales of products with relatively high gross margins as well as continued manufacturing productivity
28

and lower manufacturing start-up costs. These favorable impacts on gross profit margin were partially offset byincreases in certain raw material costs and higher pension costs allocated to the Segment. See further discussionon gross profit margin below. Selling and administrative expense as a percentage of Medical revenues in 2011increased to 17.5% of revenues from 17.3% of revenues in 2010, primarily due to the acquisition of Carmel andunfavorable foreign currency translation, partially offset by continued spending controls. Research anddevelopment expenses in 2011 increased $17 million, or 13%, and reflected continued investment in thedevelopment of new products and platforms, including new infusion therapy products and new pen needleintroductions.
Diagnostics Segment
Diagnostics revenues in 2011 of $2.5 billion increased 7.0% over 2010, which reflected an estimated impactof favorable foreign currency translation of 3.1%.
The following is a summary of Diagnostics revenues by organizational unit:
2011 2010Total
Change
EstimatedForeign
ExchangeImpact
(Millions of dollars)
Preanalytical Systems . . . . . . . . . . . . . . . . . . . . . . . . . . . . . . $1,278 $1,198 6.7% 3.0%
Diagnostic Systems . . . . . . . . . . . . . . . . . . . . . . . . . . . . . . . . 1,203 1,121 7.3% 3.1%
Total Revenues* . . . . . . . . . . . . . . . . . . . . . . . . . . . . . . . . . . $2,480 $2,319 7.0% 3.1%
* Amounts may not add due to rounding.
Revenue growth in the Preanalytical Systems unit was driven by sales of safety-engineered products. Salesof safety-engineered products grew 3% in the United States, driven by BD VacutainerTM Push Button BloodCollection Set sales, and 15% internationally, which included an estimated favorable foreign exchange impact of7%. The Diagnostic Systems unit experienced growth in worldwide sales of its automated diagnostic platforms,including the molecular BD ProbeTecTM, BD ViperTM and BD AffirmTM systems, along with solid growth of itsBD BACTECTM blood culture and TB systems and the BD PhoenixTM ID/AST platform and its HAI productofferings. Diagnostics revenues in 2011 also reflected an unfavorable comparison to the prior-year period thatincluded strong sales related to the flu pandemic in 2010. We estimate that this unfavorable comparisonnegatively impacted Diagnostics’ revenue growth rate by approximately 0.6 percentage points.
Diagnostics operating income in 2011 was $636 million, or 25.7% of Diagnostics revenues, compared with$607 million, or 26.2% of revenues, in 2010. Gross profit margin in the Diagnostics segment was relatively flatas compared to the prior year and reflected favorable foreign currency translation, offset by higher raw materialcosts, primarily resin. See further discussion on gross profit margin below. Selling and administrative expense asa percentage of Diagnostics revenues increased by 30 basis points in 2011 to 21.5%, primarily due to investmentsin emerging markets and unfavorable foreign currency translation, partially offset by continued spendingcontrols. Research and development expense increased $13 million, or 9% over 2010, and reflected continuedinvestment in the development of new products and platforms, including the BD MAX™ and new BD Viper™platforms and menus.
Biosciences Segment
Biosciences revenues in 2011 of $1.1 billion increased 8.6%, over 2010, which reflected an estimatedimpact of favorable foreign currency translation of 3.5%.
Biosciences revenue growth was primarily driven by instrument and reagent sales. Revenue growth in 2011was also negatively impacted by approximately 3.6 percentage points due to an unfavorable comparison to 2010,which included strong sales from U.S. stimulus spending and supplemental spending in Japan.
29
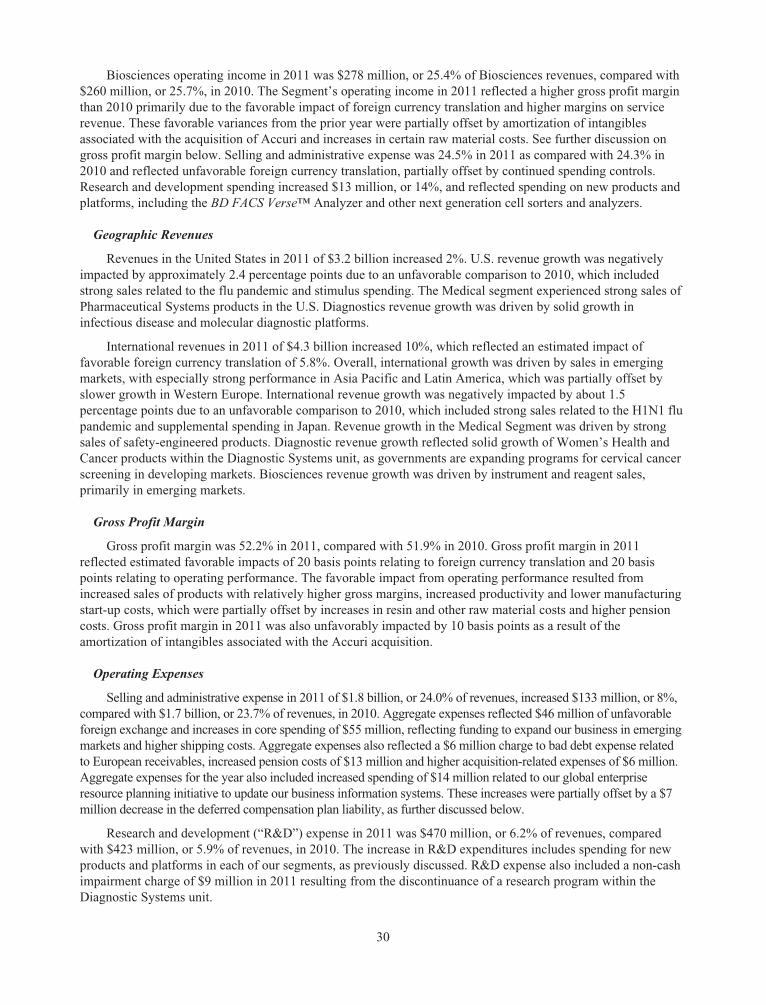
Biosciences operating income in 2011 was $278 million, or 25.4% of Biosciences revenues, compared with$260 million, or 25.7%, in 2010. The Segment’s operating income in 2011 reflected a higher gross profit marginthan 2010 primarily due to the favorable impact of foreign currency translation and higher margins on servicerevenue. These favorable variances from the prior year were partially offset by amortization of intangiblesassociated with the acquisition of Accuri and increases in certain raw material costs. See further discussion ongross profit margin below. Selling and administrative expense was 24.5% in 2011 as compared with 24.3% in2010 and reflected unfavorable foreign currency translation, partially offset by continued spending controls.Research and development spending increased $13 million, or 14%, and reflected spending on new products andplatforms, including the BD FACS Verse™ Analyzer and other next generation cell sorters and analyzers.
Geographic Revenues
Revenues in the United States in 2011 of $3.2 billion increased 2%. U.S. revenue growth was negativelyimpacted by approximately 2.4 percentage points due to an unfavorable comparison to 2010, which includedstrong sales related to the flu pandemic and stimulus spending. The Medical segment experienced strong sales ofPharmaceutical Systems products in the U.S. Diagnostics revenue growth was driven by solid growth ininfectious disease and molecular diagnostic platforms.
International revenues in 2011 of $4.3 billion increased 10%, which reflected an estimated impact offavorable foreign currency translation of 5.8%. Overall, international growth was driven by sales in emergingmarkets, with especially strong performance in Asia Pacific and Latin America, which was partially offset byslower growth in Western Europe. International revenue growth was negatively impacted by about 1.5percentage points due to an unfavorable comparison to 2010, which included strong sales related to the H1N1 flupandemic and supplemental spending in Japan. Revenue growth in the Medical Segment was driven by strongsales of safety-engineered products. Diagnostic revenue growth reflected solid growth of Women’s Health andCancer products within the Diagnostic Systems unit, as governments are expanding programs for cervical cancerscreening in developing markets. Biosciences revenue growth was driven by instrument and reagent sales,primarily in emerging markets.
Gross Profit Margin
Gross profit margin was 52.2% in 2011, compared with 51.9% in 2010. Gross profit margin in 2011reflected estimated favorable impacts of 20 basis points relating to foreign currency translation and 20 basispoints relating to operating performance. The favorable impact from operating performance resulted fromincreased sales of products with relatively higher gross margins, increased productivity and lower manufacturingstart-up costs, which were partially offset by increases in resin and other raw material costs and higher pensioncosts. Gross profit margin in 2011 was also unfavorably impacted by 10 basis points as a result of theamortization of intangibles associated with the Accuri acquisition.
Operating Expenses
Selling and administrative expense in 2011 of $1.8 billion, or 24.0% of revenues, increased $133 million, or 8%,compared with $1.7 billion, or 23.7% of revenues, in 2010. Aggregate expenses reflected $46 million of unfavorableforeign exchange and increases in core spending of $55 million, reflecting funding to expand our business in emergingmarkets and higher shipping costs. Aggregate expenses also reflected a $6 million charge to bad debt expense relatedto European receivables, increased pension costs of $13 million and higher acquisition-related expenses of $6 million.Aggregate expenses for the year also included increased spending of $14 million related to our global enterpriseresource planning initiative to update our business information systems. These increases were partially offset by a $7million decrease in the deferred compensation plan liability, as further discussed below.
Research and development (“R&D”) expense in 2011 was $470 million, or 6.2% of revenues, comparedwith $423 million, or 5.9% of revenues, in 2010. The increase in R&D expenditures includes spending for newproducts and platforms in each of our segments, as previously discussed. R&D expense also included a non-cashimpairment charge of $9 million in 2011 resulting from the discontinuance of a research program within theDiagnostic Systems unit.
30

Non-Operating Expense and Income
Interest expense in 2011 was $84 million, compared with $51 million in 2010. This increase reflected higherlevels of long-term fixed rate debt, partially offset by lower average interest rates on the overall long-term debtportfolio. Interest income was $43 million in 2011, compared with $35 million in 2010. This increase resultedfrom higher interest rates and levels of investments outside the United States, net of investment losses on assetsrelated to our deferred compensation plan. The related decrease in the deferred compensation plan liability wasrecorded as a decrease in selling and administrative expenses.
Income Taxes
The effective tax rate in 2011 of 25.8% was lower compared with the 2010 rate of 28.8% and reflected afavorable impact of 1.4 percentage points due to certain tax benefits. These benefits resulted from the retroactiveextension of the U.S. research tax credit as well as a European restructuring transaction. In addition, the 2010 ratewas unfavorably impacted by 0.6 percentage points from the expiration of the R&D tax credit, and by 0.5percentage points from the non-cash charge related to healthcare reform impacting Medicare Part Dreimbursements.
Income and Diluted Earnings per Share from Continuing Operations
Income from continuing operations and diluted earnings per share from continuing operations in 2011 were$1.2 billion and $5.31, respectively. The charge related to the discontinuance of a research program decreasedincome from continuing operations in 2011 by $6 million, or $0.03 per share. Earnings in 2011 also reflected anoverall net favorable impact of foreign currency fluctuations of $0.28 per share. Income from continuingoperations and diluted earnings per share from continuing operations in 2010 were $1.1 billion and $4.64,respectively. The charge related to healthcare reform decreased income from continuing operations in 2010 by $9million, or $0.04 per share.
Liquidity and Capital Resources
Net Cash Flows from Continuing Operating Activities
Net cash provided by continuing operating activities in 2011 was $1.6 billion, unchanged from 2010. Thechange in operating assets and liabilities resulted from a net use of cash and primarily reflected higher levels ofinventory and prepaid expenses. Net cash provided by continuing operating activities in 2010 was reduced bydiscretionary cash contributions to the U.S. pension plan of $175 million.
Net Cash Flows from Continuing Investing Activities
Capital Expenditures
Capital expenditures were $509 million in 2011, compared with $531 million in 2010. Capital spending forthe Medical, Diagnostics and Biosciences segments in 2011 was $367 million, $93 million and $31 million,respectively, and related primarily to manufacturing capacity expansions.
Acquisitions of Businesses
Cash outflows relating to acquisitions of $492 million in 2011 were comprised of $287 million associatedwith the acquisition of Carmel and $205 million associated with the acquisition of Accuri. Cash outflows relatingto acquisitions of $281 million in 2010 primarily related to $275 million associated with the acquisition ofHandyLab, Inc. For further discussion, refer to Note 9 to the consolidated financial statements contained inItem 8, Financial Statements and Supplementary Data.
31

Divestiture of Businesses
On July 30, 2010, the Company sold the Ophthalmic Systems unit and the surgical blades platform. The saleof the critical care and extended dwell catheter product platforms was completed on September 30, 2010. Cashproceeds received in the fourth quarter 2010 from these divestitures were $260 million, net of working capitaladjustments. For further discussion refer to Note 10 to the consolidated financial statements contained in Item 8,Financial Statements and Supplementary Data.
Net Cash Flows from Continuing Financing Activities
Debt Issuances and Payments of Obligations
On November 8, 2010, we issued $700 million of 10-year 3.25% Notes and $300 million of 30-year 5.00%Notes. Short-term debt decreased to 8.6% of total debt at the end of 2011, from 12% at the end of 2010. Floatingrate debt was 16% of total debt at the end of 2011 and 24% at the end of 2010. Our weighted average cost of totaldebt at the end of 2011 was 4.9%, up from 4.6% at the end of 2010. Debt-to-capitalization (ratio of total debt tothe sum of total debt, shareholders’ equity and net non-current deferred income tax liabilities) at September 30,2011 was 35.8%, compared with 23.7% at September 30, 2010.
Critical Accounting Policies
The preparation of the consolidated financial statements requires management to use estimates andassumptions that affect the reported amounts of assets, liabilities, revenues and expenses, as well as thedisclosure of contingent assets and liabilities at the date of the consolidated financial statements. Some of thosejudgments can be subjective and complex and, consequently, actual results could differ from those estimates.Management bases its estimates and judgments on historical experience and on various other factors that arebelieved to be reasonable under the circumstances, the results of which form the basis for making judgmentsabout the carrying values of assets and liabilities that are not readily apparent from other sources. For any givenestimate or assumption made by management, it is possible that other people applying reasonable judgment tothe same facts and circumstances could develop different estimates. Actual results that differ from management’sestimates could have an unfavorable effect on our consolidated financial statements. Management believes thefollowing critical accounting policies reflect the more significant judgments and estimates used in the preparationof the consolidated financial statements:
Revenue Recognition
Revenue from product sales is typically recognized when all of the following criteria have been met:persuasive evidence of an arrangement exists; delivery has occurred or services have been rendered; productprice is fixed or determinable; and collection of the resulting receivable is reasonably assured.
For certain instruments sold from the Biosciences segment, we recognize revenue upon installation at acustomer’s site, as installation of these instruments is considered a significant post-delivery obligation. Forcertain sales arrangements, primarily in the U.S., with multiple deliverables, revenue and cost of products soldare recognized at the completion of each deliverable: shipment, installation and training. These sales agreementsare divided into separate units of accounting and revenue is recognized upon the completion of each deliverablebased on its relative selling price. The relative selling prices of installation and training are determined based onthe prices at which these deliverables would be regularly sold on a standalone basis. The relative selling prices ofinstruments are based on estimated selling prices. These estimates represent the quoted sales contract price ineach arrangement.
BD’s domestic businesses sell products primarily to distributors who resell the products to end-usercustomers. We provide rebates to distributors that sell to end-user customers at prices determined under acontract between BD and the end-user customer. Provisions for rebates, which are based on historicalinformation for all rebates that have not yet been processed, as well as sales discounts and returns, are accountedfor as a reduction of revenues when revenue is recognized.
32

Impairment of Assets
Goodwill and in-process research and development assets are subject to impairment reviews at leastannually, or whenever indicators of impairment arise. Intangible assets with finite lives, including core anddeveloped technology, and other long-lived assets, are periodically reviewed for impairment when impairmentindicators are present.
We assess goodwill for impairment at the reporting unit level, which is defined as an operating segment orone level below an operating segment, referred to as a component. Our reporting units generally represent onelevel below reporting segments and we aggregate components within an operating segment that have similareconomic characteristics. Potential impairment of goodwill is identified by comparing the fair value of areporting unit with its carrying value. Our annual goodwill impairment test for 2012 did not result in anyimpairment charges, as the fair value of each reporting unit exceeded its carrying value.
We generally use the income approach to derive the fair value for impairment assessments. This approachcalculates fair value by estimating future cash flows attributable to the assets and then discounting these cashflows to a present value using a risk-adjusted discount rate. We selected this method because we believe theincome approach most appropriately measures our income producing assets. This approach requires significantmanagement judgment with respect to future volume, revenue and expense growth rates, changes in workingcapital use, appropriate discount rates and other assumptions and estimates. The estimates and assumptions usedare consistent with BD’s business plans. The use of alternative estimates and assumptions could increase ordecrease the estimated fair value of the asset, and potentially result in different impacts to BD’s results ofoperations. Actual results may differ from management’s estimates.
Income Taxes
BD maintains valuation allowances where it is more likely than not that all or a portion of a deferred taxasset will not be realized. Changes in valuation allowances are included in our tax provision in the period ofchange. In determining whether a valuation allowance is warranted, management evaluates factors such as priorearnings history, expected future earnings, carry back and carry forward periods, and tax strategies that couldpotentially enhance the likelihood of realization of a deferred tax asset.
BD conducts business and files tax returns in numerous countries and currently has tax audits in progress ina number of tax jurisdictions. In evaluating the exposure associated with various tax filing positions, we recordaccruals for uncertain tax positions based on the technical support for the positions, our past audit experiencewith similar situations, and the potential interest and penalties related to the matters. BD’s effective tax rate inany given period could be impacted if, upon resolution with taxing authorities, we prevailed in positions forwhich reserves have been established, or we were required to pay amounts in excess of established reserves.
BD has reviewed its needs in the U.S. for possible repatriation of undistributed earnings of its foreignsubsidiaries and, with exception for certain countries, continues to invest foreign subsidiaries earnings outside ofthe U.S. to fund foreign investments or meet foreign working capital and property, plant and equipmentexpenditure needs. Deferred taxes are not provided on undistributed earnings of foreign subsidiaries that areindefinitely reinvested. At September 30, 2012, the cumulative amount of such undistributed earningsindefinitely reinvested outside the United States was $4.4 billion. The determination of the amount of theunrecognized deferred tax liability related to the undistributed earnings is not practicable because of thecomplexities associated with its hypothetical calculation.
Contingencies
We are involved, both as a plaintiff and a defendant, in various legal proceedings that arise in the ordinarycourse of business, including, without limitation, product liability, antitrust and environmental matters, as furtherdiscussed in Note 5 to the consolidated financial statements contained in Item 8, Financial Statements andSupplementary Data. We assess the likelihood of any adverse judgments or outcomes to these matters as well aspotential ranges of probable losses. We establish accruals to the extent probable future losses are estimable (inthe case of environmental matters, without considering possible third-party recoveries). A determination of the
33

amount of accruals, if any, for these contingencies is made after careful analysis of each individual issue and,when appropriate, is developed after consultation with outside counsel. The accruals may change in the futuredue to new developments in each matter or changes in our strategy in dealing with these matters.
Given the uncertain nature of litigation generally, we are not able in all cases to estimate the amount orrange of loss that could result from an unfavorable outcome of the litigation to which we are a party. In view ofthese uncertainties, we could incur charges in excess of any currently established accruals and, to the extentavailable, excess liability insurance. In the opinion of management, any such future charges, individually or inthe aggregate, could have a material adverse effect on BD’s consolidated results of operations and consolidatednet cash flows.
Benefit Plans
We have significant net pension and other postretirement benefit costs that are measured using actuarialvaluations. Pension benefit costs include assumptions for the discount rate and expected return on plan assets.Other postretirement benefit plan costs include assumptions for the discount rate and healthcare cost trend rates.These assumptions have a significant effect on the amounts reported. In addition to the analysis below, see Note8 to the consolidated financial statements contained in Item 8, Financial Statements and Supplementary Data foradditional discussion.
The discount rate is selected each year based on investment grade bonds and other factors as of themeasurement date (September 30). For the U.S. pension plan, we will use a discount rate of 3.9% for 2013,which was based on an actuarially-determined, company-specific yield curve. The rate selected is used tomeasure liabilities as of the measurement date and for calculating the following year’s pension expense. Theexpected long-term rate of return on plan assets assumption, although reviewed each year, changes lessfrequently due to the long-term nature of the assumption. This assumption does not impact the measurement ofassets or liabilities as of the measurement date; rather, it is used only in the calculation of pension expense. Todetermine the expected long-term rate of return on pension plan assets, we consider many factors, including ourhistorical assumptions compared with actual results; benchmark data; expected returns on various plan assetclasses, as well as current and expected asset allocations. We will use a long-term expected rate of return on planassets assumption of 7.75% for the U.S. pension plan in 2013. We believe our discount rate and expected long-term rate of return on plan assets assumptions are appropriate based upon the above factors.
Sensitivity to changes in key assumptions for our U.S. pension and other postretirement plans are asfollows:
• Discount rate — A change of plus (minus) 25 basis points, with other assumptions held constant, wouldhave an estimated $5 million favorable (unfavorable) impact on the total U.S. net pension and otherpostretirement benefit plan cost.
• Expected return on plan assets — A change of plus (minus) 25 basis points, with other assumptions heldconstant, would have an estimated $3 million favorable (unfavorable) impact on U.S. pension plan cost.
Share-Based Compensation
Compensation cost relating to share-based payment transactions is recognized in net income using a fairvalue measurement method. All share-based payments to employees, including grants of employee stock options,are recognized in the statement of operations as compensation expense (based on their fair values) over thevesting period of the awards. We determine the fair value of certain share-based awards using a lattice-basedbinomial option valuation model that incorporates certain assumptions, such as the risk-free interest rate,expected volatility, expected dividend yield and expected life of the options. See Note 7 to the consolidatedfinancial statements contained in Item 8, Financial Statements and Supplementary Data for additional discussion.
34

Cautionary Statement Regarding Forward-Looking Statements
BD and its representatives may from time to time make certain forward-looking statements in publiclyreleased materials, both written and oral, including statements contained in filings with the Securities andExchange Commission, press releases, and our reports to shareholders. Forward-looking statements may beidentified by the use of words such as “plan,” “expect,” “believe,” “intend,” “will,” “anticipate,” “estimate” andother words of similar meaning in conjunction with, among other things, discussions of future operations andfinancial performance, as well as our strategy for growth, product development, regulatory approvals, marketposition and expenditures. All statements that address operating performance or events or developments that weexpect or anticipate will occur in the future — including statements relating to volume growth, sales and earningsper share growth, cash flows or uses, and statements expressing views about future operating results — areforward-looking statements.
Forward-looking statements are based on current expectations of future events. The forward-lookingstatements are, and will be, based on management's then-current views and assumptions regarding future eventsand operating performance, and speak only as of their dates. Investors should realize that if underlyingassumptions prove inaccurate or unknown risks or uncertainties materialize, actual results could vary materiallyfrom our expectations and projections. Investors are therefore cautioned not to place undue reliance on anyforward-looking statements. Furthermore, we undertake no obligation to update or revise any forward-lookingstatements after the date they are made, whether as a result of new information, future events and developmentsor otherwise, except as required by applicable law or regulations.
The following are some important factors that could cause our actual results to differ from our expectationsin any forward-looking statements. For further discussion of certain of these factors, see Item 1A. Risk Factors.
• The current conditions in the global economy and financial markets, and the potential adverse effect onthe cost of operating our business, the demand for our products and services, prices for our products andservices due to increases in pricing pressure, or our ability to produce our products, including the impacton developing countries. Also, the increase in sovereign debt during the financial crisis as a result ofgovernmental intervention in the world economy poses additional risks to the global financial system andeconomic recovery. In particular, deficit reduction efforts or other adverse changes in the availability ofgovernment funding for healthcare and research, particularly in the U.S. and Europe, could further weakendemand for our products and result in additional pricing pressures, as well as create potential collectionrisks associated with such sales. In that regard, in the U.S., automatic spending cuts, or sequestration, thatcould affect government healthcare spending and research funding are set to go into effect January 2013 inthe absence of further legislative action.
• The consequences of the healthcare reform in the United States, which implemented an excise tax on U.S.sales of certain medical devices, and which could result in reduced demand for our products, increasedpricing pressures or otherwise adversely affect BD’s business.
• Future healthcare reform in the countries in which we do business may also involve changes ingovernment pricing and reimbursement policies or other cost containment reforms.
• Changes in domestic and foreign healthcare industry practices that result in a reduction in proceduresusing our products or increased pricing pressures, including the continued consolidation among healthcareproviders and trends toward managed care and healthcare cost containment (including changes inreimbursement practices by third party payors).
• Our ability to penetrate developing and emerging markets, which depends on local economic and politicalconditions and how well we are able to acquire or form strategic business alliances with local companiesand make necessary infrastructure enhancements to production facilities, distribution networks, salesequipment and technology.
• Regional, national and foreign economic factors, including inflation, deflation, fluctuations in interestrates and, in particular, foreign currency exchange rates, and the potential effect on our revenues,expenses, margins and credit ratings.
35

• New or changing laws and regulations affecting our domestic and foreign operations, or changes inenforcement practices, including laws relating to trade, monetary and fiscal policies, taxation (includingtax reforms that could adversely impact multinational corporations), sales practices, price controls andlicensing and regulatory requirements for new products and products in the postmarketing phase. Inparticular, the U.S. and other countries may impose new requirements regarding registration, labeling orprohibited materials that may require us to re-register products already on the market or otherwise impactour ability to market our products. Environmental laws, particularly with respect to the emission ofgreenhouse gases, are also becoming more stringent throughout the world, which may increase our costsof operations or necessitate changes in our manufacturing plants or processes or those of our suppliers, orresult in liability to BD.
• Product efficacy or safety concerns regarding our products resulting in product recalls, regulatory actionon the part of the U.S. Food and Drug Administration (FDA) or foreign counterparts, declining sales andproduct liability claims, particularly in light of the current regulatory environment, including increasedenforcement activity by the FDA.
• Competitive factors that could adversely affect our operations, including new product introductions (forexample, new forms of drug delivery) by our current or future competitors, increased pricing pressure dueto the impact of low-cost manufacturers as certain competitors have established manufacturing sites orhave contracted with suppliers in low-cost manufacturing locations as a means to lower their costs, patentsattained by competitors (particularly as patents on our products expire), and new entrants into our markets.
• The effects of events that adversely impact our ability to manufacture our products (particularly whereproduction of a product line is concentrated in one or more plants) or our ability to source materials orcomponents from suppliers that are needed for such manufacturing, including pandemics, naturaldisasters, or environmental factors.
• Fluctuations in the cost and availability of oil-based resins and other raw materials, as well as certainsub-assemblies and finished goods, the ability to maintain favorable supplier arrangements andrelationships (particularly with respect to sole-source suppliers), and the potential adverse effects of anydisruption in the availability of such items.
• Difficulties inherent in product development, including the potential inability to successfully continuetechnological innovation, complete clinical trials, obtain regulatory approvals in the United States andabroad, obtain coverage and adequate reimbursement for new products, or gain and maintain marketapproval of products, as well as the possibility of infringement claims by competitors with respect topatents or other intellectual property rights, all of which can preclude or delay commercialization of aproduct. Delays in obtaining necessary approvals or clearances from the FDA or other regulatory agenciesor changes in the regulatory process (including potential 510(k) reforms) may also delay product launchesand increase development costs.
• Fluctuations in the demand for products we sell to pharmaceutical companies that are used tomanufacture, or are sold with, the products of such companies, as a result of funding constraints,consolidation or otherwise.
• Fluctuations in university or U.S. and international governmental funding and policies for life sciencesresearch.
• Our ability to achieve our projected level or mix of product sales. Our earnings forecasts are based onprojected volumes and sales of many product types, some of which are more profitable than others.
• Our ability to implement our ongoing upgrade of our enterprise resource planning system, as any delays ordeficiencies in the design and implementation of our upgrade could adversely affect our business.
• Security breaches of our computer and communications systems, including computer viruses, “hacking”and “cyber-attacks,” which could impair our ability to conduct business, or result in the loss of BD tradesecrets or otherwise compromise sensitive information of BD or its customers, suppliers and otherbusiness partners.
36

• Pending and potential future litigation or other proceedings adverse to BD, including antitrust claims,product liability claims and patent infringement claims, and the availability or collectibility of insurancerelating to any such claims.
• The effect of adverse media exposure or other publicity regarding BD’s business or operations, includingthe effect on BD’s reputation or demand for its products.
• The effects, if any, of governmental and media activities regarding the business practices of grouppurchasing organizations, which negotiate product prices on behalf of their member hospitals with BD andother suppliers.
• The effect of market fluctuations on the value of assets in BD’s pension plans and on actuarial interest rateand asset return assumptions, which could require BD to make additional contributions to the plans orincrease our pension plan expense.
• Political conditions in international markets, including civil unrest, terrorist activity, governmentalchanges, restrictions on the ability to transfer capital across borders and expropriation of assets by agovernment, including the recent civil unrest in parts of the Middle East.
• The impact of business combinations, including any volatility in earnings relating to acquired in-processresearch and development assets, and our ability to successfully integrate any business we may acquire.
• Our ability to obtain the anticipated benefits of restructuring programs, if any, that we may undertake.
• Issuance of new or revised accounting standards by the Financial Accounting Standards Board or theSecurities and Exchange Commission.
The foregoing list sets forth many, but not all, of the factors that could impact our ability to achieve resultsdescribed in any forward-looking statements. Investors should understand that it is not possible to predict oridentify all such factors and should not consider this list to be a complete statement of all potential risks anduncertainties.
37

Item 7A. Quantitative and Qualitative Disclosures About Market Risk.
The information required by this item is included in Item 7, Management’s Discussion and Analysis ofFinancial Condition and Results of Operations, and in Notes 1, 12 and 13 to the consolidated financial statementscontained in Item 8, Financial Statements and Supplementary Data, and is incorporated herein by reference.
38

Item 8. Financial Statements and Supplementary Data.
Reports of Management
Management’s Responsibilities
The following financial statements have been prepared by management in conformity with U.S. generallyaccepted accounting principles and include, where required, amounts based on the best estimates and judgmentsof management. The integrity and objectivity of data in the financial statements and elsewhere in this AnnualReport are the responsibility of management.
In fulfilling its responsibilities for the integrity of the data presented and to safeguard the Company’s assets,management employs a system of internal accounting controls designed to provide reasonable assurance, atappropriate cost, that the Company’s assets are protected and that transactions are appropriately authorized,recorded and summarized. This system of control is supported by the selection of qualified personnel, byorganizational assignments that provide appropriate delegation of authority and division of responsibilities, andby the dissemination of written policies and procedures. This control structure is further reinforced by a programof internal audits, including a policy that requires responsive action by management.
The Board of Directors monitors the internal control system, including internal accounting and financialreporting controls, through its Audit Committee, which consists of seven independent Directors. The AuditCommittee meets periodically with the independent registered public accounting firm, the internal auditors andmanagement to review the work of each and to satisfy itself that they are properly discharging theirresponsibilities. The independent registered public accounting firm and the internal auditors have full and freeaccess to the Audit Committee and meet with its members, with and without management present, to discuss thescope and results of their audits including internal control, auditing and financial reporting matters.
Management’s Report on Internal Control Over Financial Reporting
Management is responsible for establishing and maintaining adequate internal control over financialreporting, as defined in Rule 13a-15(f) under the Securities Act of 1934. Management conducted an assessmentof the effectiveness of internal control over financial reporting based on the criteria established in InternalControl-Integrated Framework issued by the Committee of Sponsoring Organizations of the TreadwayCommission (COSO). Based on this assessment and those criteria, management concluded that internal controlover financial reporting was effective as of September 30, 2012.
The financial statements and internal control over financial reporting have been audited by Ernst & YoungLLP, an independent registered public accounting firm. Ernst & Young’s reports with respect to fairness of thepresentation of the financial statements, and the effectiveness of internal control over financial reporting, areincluded herein.
Vincent A. Forlenza Suketu UpadhyayChairman, Chief Executive Officer and Acting Chief Financial Officer, SeniorPresident Vice President and Controller
39

Report of Independent Registered Public Accounting Firm
To the Shareholders and Board of Directors ofBecton, Dickinson and Company
We have audited the accompanying consolidated balance sheets of Becton, Dickinson and Company as ofSeptember 30, 2012 and 2011, and the related consolidated statements of income, comprehensive income, andcash flows for each of the three years in the period ended September 30, 2012. These financial statements are theresponsibility of the Company’s management. Our responsibility is to express an opinion on these financialstatements based on our audits.
We conducted our audits in accordance with the standards of the Public Company Accounting OversightBoard (United States). Those standards require that we plan and perform the audit to obtain reasonable assuranceabout whether the financial statements are free of material misstatement. An audit includes examining, on a testbasis, evidence supporting the amounts and disclosures in the financial statements. An audit also includesassessing the accounting principles used and significant estimates made by management, as well as evaluatingthe overall financial statement presentation. We believe that our audits provide a reasonable basis for ouropinion.
In our opinion, the financial statements referred to above present fairly, in all material respects, theconsolidated financial position of Becton, Dickinson and Company at September 30, 2012 and 2011, and theconsolidated results of its operations and its cash flows for each of the three years in the period endedSeptember 30, 2012, in conformity with U.S. generally accepted accounting principles.
We also have audited, in accordance with the standards of the Public Company Accounting Oversight Board(United States), Becton, Dickinson and Company’s internal control over financial reporting as of September 30,2012, based on criteria established in Internal Control-Integrated Framework issued by the Committee ofSponsoring Organizations of the Treadway Commission and our report dated November 21, 2012 expressed anunqualified opinion thereon.
/S/ ERNST & YOUNG LLPNew York, New YorkNovember 21, 2012
40

Report of Independent Registered Public Accounting Firm
To the Shareholders and Board of Directors ofBecton, Dickinson and Company
We have audited Becton, Dickinson and Company’s internal control over financial reporting as ofSeptember 30, 2012, based on criteria established in Internal Control-Integrated Framework issued by theCommittee of Sponsoring Organizations of the Treadway Commission (the COSO criteria). Becton, Dickinsonand Company’s management is responsible for maintaining effective internal control over financial reporting,and for its assessment of the effectiveness of internal control over financial reporting included in theaccompanying Management’s Report on Internal Control Over Financial Reporting. Our responsibility is toexpress an opinion on the company’s internal control over financial reporting based on our audit.
We conducted our audit in accordance with the standards of the Public Company Accounting OversightBoard (United States). Those standards require that we plan and perform the audit to obtain reasonable assuranceabout whether effective internal control over financial reporting was maintained in all material respects. Ouraudit included obtaining an understanding of internal control over financial reporting, assessing the risk that amaterial weakness exists, testing and evaluating the design and operating effectiveness of internal control basedon the assessed risk, and performing such other procedures as we considered necessary in the circumstances. Webelieve that our audit provides a reasonable basis for our opinion.
A company’s internal control over financial reporting is a process designed to provide reasonable assuranceregarding the reliability of financial reporting and the preparation of financial statements for external purposes inaccordance with generally accepted accounting principles. A company’s internal control over financial reportingincludes those policies and procedures that (1) pertain to the maintenance of records that, in reasonable detail,accurately and fairly reflect the transactions and dispositions of the assets of the company; (2) provide reasonableassurance that transactions are recorded as necessary to permit preparation of financial statements in accordancewith generally accepted accounting principles, and that receipts and expenditures of the company are being madeonly in accordance with authorizations of management and directors of the company; and (3) provide reasonableassurance regarding prevention or timely detection of unauthorized acquisition, use, or disposition of thecompany’s assets that could have a material effect on the financial statements.
Because of its inherent limitations, internal control over financial reporting may not prevent or detectmisstatements. Also, projections of any evaluation of effectiveness to future periods are subject to the risk thatcontrols may become inadequate because of changes in conditions, or that the degree of compliance with thepolicies or procedures may deteriorate.
In our opinion, Becton, Dickinson and Company maintained, in all material respects, effective internalcontrol over financial reporting as of September 30, 2012, based on the COSO criteria.
We also have audited, in accordance with the standards of the Public Company Accounting Oversight Board(United States), the consolidated balance sheets of Becton, Dickinson and Company as of September 30, 2012and 2011, and the related consolidated statements of income, comprehensive income, and cash flows for each ofthe three years in the period ended September 30, 2012 of Becton, Dickinson and Company, and our report datedNovember 21, 2012 expressed an unqualified opinion thereon.
/S/ ERNST & YOUNG LLPNew York, New YorkNovember 21, 2012
41

Becton, Dickinson and Company
Consolidated Statements of Income
Years Ended September 302012 2011 2010
Thousands of dollars, except per share amounts
Operations
Revenues . . . . . . . . . . . . . . . . . . . . . . . . . . . . . . . . . . . . . . . . . . . . . . . . $7,708,382 $7,584,037 $7,124,385
Cost of products sold . . . . . . . . . . . . . . . . . . . . . . . . . . . . . . . . . . . . . . . 3,755,388 3,625,122 3,428,308
Selling and administrative expense . . . . . . . . . . . . . . . . . . . . . . . . . . . . 1,923,354 1,823,537 1,690,932
Research and development expense . . . . . . . . . . . . . . . . . . . . . . . . . . . 471,755 469,517 422,767
Total Operating Costs and Expenses . . . . . . . . . . . . . . . . . . . . . . . . . 6,150,497 5,918,176 5,542,007
Operating Income . . . . . . . . . . . . . . . . . . . . . . . . . . . . . . . . . . . . . . . . . 1,557,885 1,665,861 1,582,378
Interest expense . . . . . . . . . . . . . . . . . . . . . . . . . . . . . . . . . . . . . . . . . . . (134,658) (84,019) (51,263)
Interest income . . . . . . . . . . . . . . . . . . . . . . . . . . . . . . . . . . . . . . . . . . . 50,333 43,209 35,129
Other (expense) income, net . . . . . . . . . . . . . . . . . . . . . . . . . . . . . . . . . (1,152) (7,164) 497
Income From Continuing Operations
Before Income Taxes . . . . . . . . . . . . . . . . . . . . . . . . . . . . . . . . . . . . 1,472,408 1,617,887 1,566,741
Income tax provision . . . . . . . . . . . . . . . . . . . . . . . . . . . . . . . . . . . . . . . 362,880 417,004 451,897
Income from Continuing Operations . . . . . . . . . . . . . . . . . . . . . . . . . . 1,109,528 1,200,883 1,114,844
Income from Discontinued Operations
Net of income tax provision of $31,268, $35,199 and $73,626 . . . . 60,399 70,111 202,766
Net Income . . . . . . . . . . . . . . . . . . . . . . . . . . . . . . . . . . . . . . . . . . . . . . $1,169,927 $1,270,994 $1,317,610
Basic Earnings per Share
Income from Continuing Operations . . . . . . . . . . . . . . . . . . . . . . . . . . $ 5.40 $ 5.43 $ 4.76
Income from Discontinued Operations . . . . . . . . . . . . . . . . . . . . . . . . . $ 0.29 $ 0.32 $ 0.87
Basic Earnings per Share (A) . . . . . . . . . . . . . . . . . . . . . . . . . . . . . . . . $ 5.69 $ 5.75 $ 5.62
Diluted Earnings per Share
Income from Continuing Operations . . . . . . . . . . . . . . . . . . . . . . . . . . $ 5.30 $ 5.31 $ 4.64
Income from Discontinued Operations . . . . . . . . . . . . . . . . . . . . . . . . . $ 0.29 $ 0.31 $ 0.84
Diluted Earnings per Share (A) . . . . . . . . . . . . . . . . . . . . . . . . . . . . . . . $ 5.59 $ 5.62 $ 5.49
(A) Total per share amounts may not add due to rounding.
See notes to consolidated financial statements
42

Becton, Dickinson and Company
Consolidated Statements of Comprehensive Income
Years Ended September 302012 2011 2010
Thousands of dollars
Net Income . . . . . . . . . . . . . . . . . . . . . . . . . . . . . . . . . . . . . . . . . . . . . . . . $1,169,927 $1,270,994 $1,317,610
Other Comprehensive (Loss) Income, Net of Tax
Foreign currency translation adjustments . . . . . . . . . . . . . . . . . . . . . . . (18,435) (117,083) 330
Defined benefit pension and postretirement plans . . . . . . . . . . . . . . . . (118,115) (62,228) (130,461)
Unrealized gain on investments, net of amounts recognized . . . . . . . . 26 420 —
Unrealized gains (losses) on cash flow hedges, net of amountsrealized . . . . . . . . . . . . . . . . . . . . . . . . . . . . . . . . . . . . . . . . . . . . . . . 4,713 (33,200) 44,884
Other Comprehensive Loss, Net of Tax . . . . . . . . . . . . . . . . . . . . . . . . . . (131,811) (212,091) (85,247)
Comprehensive Income . . . . . . . . . . . . . . . . . . . . . . . . . . . . . . . . . . . . . . . $1,038,116 $1,058,903 $1,232,363
See notes to consolidated financial statements
43

Becton, Dickinson and Company
Consolidated Balance Sheets
September 302012 2011
Thousands of dollars, exceptper share amounts and
numbers of shares
ASSETSCurrent Assets
Cash and equivalents . . . . . . . . . . . . . . . . . . . . . . . . . . . . . . . . . . . . . . . . . . . . . . . . $ 1,671,165 $ 1,175,282Short-term investments . . . . . . . . . . . . . . . . . . . . . . . . . . . . . . . . . . . . . . . . . . . . . . 509,566 388,031Trade receivables, net . . . . . . . . . . . . . . . . . . . . . . . . . . . . . . . . . . . . . . . . . . . . . . . 1,249,549 1,228,637Inventories . . . . . . . . . . . . . . . . . . . . . . . . . . . . . . . . . . . . . . . . . . . . . . . . . . . . . . . . 1,240,679 1,244,972Prepaid expenses, deferred taxes and other . . . . . . . . . . . . . . . . . . . . . . . . . . . . . . . 515,255 631,409Assets held for sale . . . . . . . . . . . . . . . . . . . . . . . . . . . . . . . . . . . . . . . . . . . . . . . . . 135,857 —
Total Current Assets . . . . . . . . . . . . . . . . . . . . . . . . . . . . . . . . . . . . . . . . . . . . . . 5,322,071 4,668,331Property, Plant and Equipment, Net . . . . . . . . . . . . . . . . . . . . . . . . . . . . . . . . . . . . . . 3,303,928 3,211,197Goodwill . . . . . . . . . . . . . . . . . . . . . . . . . . . . . . . . . . . . . . . . . . . . . . . . . . . . . . . . . . . 1,076,077 991,121Core and Developed Technology, Net . . . . . . . . . . . . . . . . . . . . . . . . . . . . . . . . . . . . 511,674 380,899Other Intangibles, Net . . . . . . . . . . . . . . . . . . . . . . . . . . . . . . . . . . . . . . . . . . . . . . . . . 301,010 417,636Capitalized Software, Net . . . . . . . . . . . . . . . . . . . . . . . . . . . . . . . . . . . . . . . . . . . . . . 346,182 316,634Other . . . . . . . . . . . . . . . . . . . . . . . . . . . . . . . . . . . . . . . . . . . . . . . . . . . . . . . . . . . . . . 499,967 444,610
Total Assets . . . . . . . . . . . . . . . . . . . . . . . . . . . . . . . . . . . . . . . . . . . . . . . . . . . . . . . . . $11,360,909 $10,430,428
LIABILITIES AND SHAREHOLDERS’ EQUITYCurrent Liabilities
Short-term debt . . . . . . . . . . . . . . . . . . . . . . . . . . . . . . . . . . . . . . . . . . . . . . . . . . . . $ 405,142 $ 234,932Accounts payable . . . . . . . . . . . . . . . . . . . . . . . . . . . . . . . . . . . . . . . . . . . . . . . . . . 350,455 304,836Accrued expenses . . . . . . . . . . . . . . . . . . . . . . . . . . . . . . . . . . . . . . . . . . . . . . . . . . 740,636 795,224Salaries, wages and related items . . . . . . . . . . . . . . . . . . . . . . . . . . . . . . . . . . . . . . 477,940 477,198Income taxes . . . . . . . . . . . . . . . . . . . . . . . . . . . . . . . . . . . . . . . . . . . . . . . . . . . . . . 3,882 11,038
Total Current Liabilities . . . . . . . . . . . . . . . . . . . . . . . . . . . . . . . . . . . . . . . . . . . 1,978,055 1,823,228Long-Term Debt . . . . . . . . . . . . . . . . . . . . . . . . . . . . . . . . . . . . . . . . . . . . . . . . . . . . . 3,761,112 2,484,665Long-Term Employee Benefit Obligations . . . . . . . . . . . . . . . . . . . . . . . . . . . . . . . . . 1,224,148 1,068,483Deferred Income Taxes and Other . . . . . . . . . . . . . . . . . . . . . . . . . . . . . . . . . . . . . . . 261,705 225,877Commitments and Contingencies . . . . . . . . . . . . . . . . . . . . . . . . . . . . . . . . . . . . . . . . — —Shareholders’ EquityCommon stock — $1 par value: authorized — 640,000,000 shares; issued —
332,662,160 shares in 2012 and 2011 . . . . . . . . . . . . . . . . . . . . . . . . . . . . . . . . . . . 332,662 332,662Capital in excess of par value . . . . . . . . . . . . . . . . . . . . . . . . . . . . . . . . . . . . . . . . . . . 1,920,035 1,793,160Retained earnings . . . . . . . . . . . . . . . . . . . . . . . . . . . . . . . . . . . . . . . . . . . . . . . . . . . . 10,435,378 9,633,584Deferred compensation . . . . . . . . . . . . . . . . . . . . . . . . . . . . . . . . . . . . . . . . . . . . . . . . 18,917 18,875Common stock in treasury — at cost — 135,751,039 shares in 2012 and
117,844,159 shares in 2011 . . . . . . . . . . . . . . . . . . . . . . . . . . . . . . . . . . . . . . . . . . . (7,769,292) (6,280,106)Accumulated other comprehensive loss . . . . . . . . . . . . . . . . . . . . . . . . . . . . . . . . . (801,811) (670,000)
Total Shareholders’ Equity . . . . . . . . . . . . . . . . . . . . . . . . . . . . . . . . . . . . . . . . . 4,135,889 4,828,175
Total Liabilities and Shareholders’ Equity . . . . . . . . . . . . . . . . . . . . . . . . . . . . . . . . . $11,360,909 $10,430,428
See notes to consolidated financial statements
44

Becton, Dickinson and Company
Consolidated Statements of Cash FlowsYears Ended September 30
2012 2011 2010Thousands of dollars
Operating ActivitiesNet income . . . . . . . . . . . . . . . . . . . . . . . . . . . . . . . . . . . . . . . . . . . . . . . . . . . . $ 1,169,927 $ 1,270,994 $ 1,317,610Less: Income from discontinued operations, net . . . . . . . . . . . . . . . . . . . . . . . 60,399 70,111 202,766
Income from continuing operations, net . . . . . . . . . . . . . . . . . . . . . . . . . . . . . . 1,109,528 1,200,883 1,114,844Adjustments to income from continuing operations to derive net cash
provided by continuing operating activities, net of amounts acquired:Depreciation and amortization . . . . . . . . . . . . . . . . . . . . . . . . . . . . . . . . . . . 510,938 493,768 491,416Share-based compensation . . . . . . . . . . . . . . . . . . . . . . . . . . . . . . . . . . . 89,045 73,363 79,374Deferred income taxes . . . . . . . . . . . . . . . . . . . . . . . . . . . . . . . . . . . . . . . . . 22,147 30,047 28,055Change in operating assets and liabilities:
Trade receivables, net . . . . . . . . . . . . . . . . . . . . . . . . . . . . . . . . . . . . . . . . (30,069) (26,515) (73,933)Inventories . . . . . . . . . . . . . . . . . . . . . . . . . . . . . . . . . . . . . . . . . . . . . . . . (92,413) (116,776) (116,841)Prepaid expenses, deferred taxes and other . . . . . . . . . . . . . . . . . . . . . . . 101,863 (238,777) (33,936)Accounts payable, income taxes and other liabilities . . . . . . . . . . . . . . . . 17,142 128,627 155,995
Pension obligation . . . . . . . . . . . . . . . . . . . . . . . . . . . . . . . . . . . . . . . . . (38,428) 80,837 (102,967)Other, net . . . . . . . . . . . . . . . . . . . . . . . . . . . . . . . . . . . . . . . . . . . . . . . . 3,611 12,611 44,852
Net Cash Provided by Continuing Operating Activities . . . . . . . . . . . . . . . . . 1,693,364 1,638,068 1,586,859
Investing ActivitiesCapital expenditures . . . . . . . . . . . . . . . . . . . . . . . . . . . . . . . . . . . . . . . . . . . . . (487,430) (508,817) (530,969)Capitalized software . . . . . . . . . . . . . . . . . . . . . . . . . . . . . . . . . . . . . . . . . . . . . (66,214) (89,872) (95,159)Change in short-term investments . . . . . . . . . . . . . . . . . . . . . . . . . . . . . . . . . . (137,855) 120,445 34,550Sales of long-term investments . . . . . . . . . . . . . . . . . . . . . . . . . . . . . . . . . . . . — 1,144 963Acquisitions of businesses, net of cash acquired . . . . . . . . . . . . . . . . . . . . . . . (103,424) (492,081) (281,367)Divestiture of businesses . . . . . . . . . . . . . . . . . . . . . . . . . . . . . . . . . . . . . . . . . — — 259,990Other, net . . . . . . . . . . . . . . . . . . . . . . . . . . . . . . . . . . . . . . . . . . . . . . . . . . . . . (99,206) (63,588) (81,636)
Net Cash Used for Continuing Investing Activities . . . . . . . . . . . . . . . . . . . . . (894,129) (1,032,769) (693,628)
Financing ActivitiesChange in short-term debt . . . . . . . . . . . . . . . . . . . . . . . . . . . . . . . . . . . . . . . . 1,595 34,251 (200,193)Proceeds from long-term debt . . . . . . . . . . . . . . . . . . . . . . . . . . . . . . . . . . . . . 1,488,285 991,265 —Payments of debt . . . . . . . . . . . . . . . . . . . . . . . . . . . . . . . . . . . . . . . . . . . . . . . (42,346) (35) (76)Repurchase of common stock . . . . . . . . . . . . . . . . . . . . . . . . . . . . . . . . . . . . . . (1,500,000) (1,500,001) (750,000)Issuance of common stock and other, net . . . . . . . . . . . . . . . . . . . . . . . . . . . . . 35,051 84,148 50,093Excess tax benefit from payments under share-based compensation plans . . . 14,854 37,189 23,202Dividends paid . . . . . . . . . . . . . . . . . . . . . . . . . . . . . . . . . . . . . . . . . . . . . . . . . (367,611) (361,199) (345,713)
Net Cash Used for Continuing Financing Activities . . . . . . . . . . . . . . . . . . . . (370,172) (714,382) (1,222,687)
Discontinued Operations:Net cash provided by operating activities . . . . . . . . . . . . . . . . . . . . . . . . . . 66,864 77,932 157,409Net cash used for investing activities . . . . . . . . . . . . . . . . . . . . . . . . . . . . . . (5,983) (6,741) (11,998)
Net Cash Provided by Discontinued Operations . . . . . . . . . . . . . . . . . . . . . . . 60,881 71,191 145,411
Effect of exchange rate changes on cash and equivalents . . . . . . . . . . . . . . . . 5,939 (2,815) 5,790
Net Increase (Decrease) in Cash and Equivalents . . . . . . . . . . . . . . . . . . . . . . 495,883 (40,707) (178,255)Opening Cash and Equivalents . . . . . . . . . . . . . . . . . . . . . . . . . . . . . . . . . . . . . 1,175,282 1,215,989 1,394,244
Closing Cash and Equivalents . . . . . . . . . . . . . . . . . . . . . . . . . . . . . . . . . . . . . $ 1,671,165 $ 1,175,282 $ 1,215,989
See notes to consolidated financial statements
45

Becton, Dickinson and Company
Notes to Consolidated Financial StatementsThousands of dollars, except per share amounts and numbers of shares
Note 1 — Summary of Significant Accounting Policies
Principles of Consolidation
The consolidated financial statements include the accounts of Becton, Dickinson and Company and itsmajority-owned subsidiaries (the “Company”) after the elimination of intercompany transactions. The Companyhas no material interests in variable interest entities.
Cash Equivalents
Cash equivalents consist of all highly liquid investments with a maturity of three months or less at time ofpurchase.
Short-Term Investments
Short-term investments consist of time deposits with maturities greater than three months and less than oneyear when purchased.
Inventories
Inventories are stated at the lower of first-in, first-out cost or market.
Property, Plant and Equipment
Property, plant and equipment are stated at cost, less accumulated depreciation and amortization.Depreciation and amortization are principally provided on the straight-line basis over estimated useful lives,which range from 20 to 45 years for buildings, four to 13 years for machinery and equipment and one to 12 yearsfor leasehold improvements. Depreciation and amortization expense was $321,294, $339,707 and $338,178 infiscal years 2012, 2011 and 2010, respectively.
Goodwill and Other Intangible Assets
Goodwill, core and developed technology, and in-process research and development assets arise fromacquisitions. Goodwill is reviewed at least annually for impairment. Goodwill is quantitatively assessed forimpairment at the reporting unit level, which is defined as an operating segment or one level below an operatingsegment, referred to as a component. The Company’s reporting units generally represent one level belowreporting segments, and components within an operating segment that have similar economic characteristics areaggregated. Potential impairment of goodwill is identified by comparing the fair value of a reporting unit,estimated using an income approach, with its carrying value. The annual impairment review performed in fiscalyear 2012 indicated that all identified reporting units’ fair values exceeded their respective carrying values.
The review for impairment of in-process research and development assets compares the fair value of thetechnology or project assets, estimated using an income approach, with their carrying value. In-process researchand development assets are considered indefinite-lived assets until projects are completed or abandoned, andthese assets are reviewed at least annually for impairment. Core and developed technology assets are generallyamortized over periods ranging from 15 to 20 years, using the straight-line method, and are periodically reviewedfor impairment when impairment indicators are present.
Other intangibles with finite useful lives, which include patents, are amortized over periods principallyranging from one to 40 years, using the straight-line method. These intangibles, including core and developedtechnology, are periodically reviewed when impairment indicators are present to assess recoverability fromfuture operations using undiscounted cash flows. To the extent carrying value exceeds the undiscounted cashflows, an impairment loss is recognized in operating results based upon the excess of the carrying value over fair
46

Becton, Dickinson and Company
Notes to Consolidated Financial Statements — (Continued)
value. Other intangibles also include certain trademarks that are considered to have indefinite lives, as they areexpected to generate cash flows indefinitely, and are reviewed annually for impairment.
Capitalized Software
Capitalized software, including costs for software developed or obtained for internal use, is stated at cost,less accumulated amortization. Amortization expense is principally provided on the straight-line basis overestimated useful lives, which do not exceed 10 years. The current balance primarily includes capital softwareinvestments related to a global enterprise resource planning initiative to upgrade the Company’s businessinformation systems. Amortization for this project commenced in the third quarter of fiscal year 2012.Amortization expense related to capitalized software was $35,552, $23,106 and $32,146 for 2012, 2011 and2010, respectively.
Foreign Currency Translation
Generally, foreign subsidiaries’ functional currency is the local currency of operations and the net assets offoreign operations are translated into U.S. dollars using current exchange rates. The U.S. dollar results that arisefrom such translation, as well as exchange gains and losses on intercompany balances of a long-term investmentnature, are included in the foreign currency translation adjustments in Accumulated other comprehensive (loss)income.
Revenue Recognition
Revenue from product sales is typically recognized when all of the following criteria have been met:persuasive evidence of an arrangement exists; delivery has occurred or services have been rendered; productprice is fixed or determinable; collection of the resulting receivable is reasonably assured. The Companyrecognizes revenue for certain instruments sold from the Biosciences segment upon installation at a customer’ssite, as installation of these instruments is considered a significant post-delivery obligation. For certaininstrument sales arrangements, primarily in the U.S., with multiple deliverables, revenue and cost of productssold are recognized at the completion of each deliverable: instrument shipment, installation and training.Installation and training typically occur within one month after an instrument is shipped. These sales agreementsare divided into separate units of accounting and revenue is recognized upon the completion of each deliverablebased on its relative selling price. The relative selling prices of installation and training are determined based onthe prices at which these deliverables would be regularly sold on a standalone basis. The relative selling prices ofinstruments are based on estimated selling prices. These estimates represent the quoted sales contract price ineach arrangement.
The Company’s domestic businesses sell products primarily to distributors that resell the products toend-user customers. Rebates are provided to distributors that sell to end-user customers at prices determinedunder a contract between the Company and the end-user customer. Provisions for rebates, as well as salesdiscounts and returns, are based upon estimates and are accounted for as a reduction of revenues when revenue isrecognized.
Shipping and Handling Costs
Shipping and handling costs are included in Selling and administrative expense. Shipping expense was$280,945, $268,988 and $247,929 in 2012, 2011 and 2010, respectively.
Derivative Financial Instruments
All derivatives are recorded in the balance sheet at fair value and changes in fair value are recognizedcurrently in earnings unless specific hedge accounting criteria are met.
47

Becton, Dickinson and Company
Notes to Consolidated Financial Statements — (Continued)
From time to time, derivative financial instruments are utilized by the Company in the management of itsforeign currency, interest rate and commodity price exposures. The Company periodically hedges forecastedsales denominated in foreign currencies using forward and option contracts to protect against the reduction invalue of forecasted foreign currency cash flows resulting from export sales. The Company also periodicallyutilizes interest rate swaps to maintain a balance between fixed and floating rate instruments. Additionally, theCompany has managed price risks associated with resin purchase costs through commodity derivative forwardcontracts. The Company does not enter into derivative financial instruments for trading or speculative purposes.
Any deferred gains or losses associated with derivative instruments are recognized in income in the periodin which the underlying hedged transaction is recognized. In the event a designated hedged item is sold,extinguished or matures prior to the termination of the related derivative instrument, such instrument would beclosed and the resultant gain or loss would be recognized in income.
Income Taxes
United States income taxes are not provided on undistributed earnings of foreign subsidiaries where suchundistributed earnings are indefinitely reinvested outside the United States. Deferred taxes are provided forearnings of foreign subsidiaries when those earnings are not considered indefinitely reinvested. Income taxes areprovided and tax credits are recognized based on tax laws enacted at the dates of the financial statements.
The Company conducts business and files tax returns in numerous countries and currently has tax audits inprogress in a number of tax jurisdictions. In evaluating the exposure associated with various tax filing positions,the Company records accruals for uncertain tax positions, based on the technical support for the positions, pastaudit experience with similar situations, and the potential interest and penalties related to the matters.
The Company maintains valuation allowances where it is more likely than not that all or a portion of adeferred tax asset will not be realized. Changes in valuation allowances are included in the tax provision in theperiod of change. In determining whether a valuation allowance is warranted, management evaluates factors suchas prior earnings history, expected future earnings, carry back and carry forward periods and tax strategies thatcould potentially enhance the likelihood of the realization of a deferred tax asset.
Earnings per Share
Basic earnings per share are computed based on the weighted average number of common sharesoutstanding. Diluted earnings per share reflect the potential dilution that could occur if securities or othercontracts to issue common stock were exercised or converted into common stock.
Use of Estimates
The preparation of financial statements in conformity with U.S. generally accepted accounting principlesrequires management to make estimates and assumptions. These estimates or assumptions affect reported assets,liabilities, revenues and expenses as reflected in the consolidated financial statements. Actual results could differfrom these estimates.
Share-Based Compensation
The Company recognizes the fair value of share-based compensation in net income. Compensation expenseis recognized on a straight-line basis over the requisite service period, which is generally the vesting period.
48

Becton, Dickinson and Company
Notes to Consolidated Financial Statements — (Continued)
Note 2 — Accounting Changes
Change in Accounting Principles
In June 2011, the FASB issued revised guidance to require items of net income and other comprehensiveincome to be presented in either one continuous statement or in two separate, but consecutive statements of netincome and other comprehensive income. The revised presentation requirements are effective for fiscal yearsbeginning after December 15, 2011 and early adoption is permitted. The Company early-adopted the revisedpresentation requirements, which did not impact the recognition of items in its consolidated financial statements,on September 30, 2012.
In September 2011, the FASB issued revised annual goodwill impairment testing guidance. The revisedrequirements allow entities to first qualitatively assess whether it is necessary to perform the two-stepquantitative goodwill impairment test. Further testing of goodwill for impairment under the quantitative model isrequired only if an entity determines, through the qualitative assessment, that it is more likely than not that agiven reporting unit’s fair value is less than its carrying amount. The revised goodwill impairment testingrequirements are effective for fiscal years beginning after December 15, 2011 and early adoption is permitted.The Company early-adopted the revised requirements, which did not impact its consolidated financial statements,for its fiscal year 2012 goodwill impairment review processes.
In May 2011, the Financial Accounting Standards Board (“FASB”) issued amendments to clarify guidancerelating to fair value measurements. The amendments also expand the disclosure requirements for entities’ fairvalue measurements, particularly those relating to measurements based upon significant unobservable inputs. TheCompany adopted the amended fair value measurement guidance, which did not have an impact on theconsolidated financial statements, on January 1, 2012.
Change in Accounting Estimates
During the second quarter of fiscal year 2012, the Company changed the useful lives of certain machineryand equipment assets used in production processes from 10 years to 13 years, to better reflect the estimatedperiod during which these assets will remain in service. This change resulted from continuous improvementproject evaluations, which included a review of assumptions related to the expected utilization of machinery andequipment assets. The Company accounted for the change in useful lives as a change in estimate prospectivelyeffective January 1, 2012 and this change in estimate resulted in an increase in operating income ofapproximately $26,200 for fiscal year 2012.
49

Becton, Dickinson and Company
Notes to Consolidated Financial Statements — (Continued)
Note 3 — Shareholders’ Equity
Changes in certain components of shareholders’ equity were as follows:
CommonStock Issuedat Par Value
Capital inExcess ofPar Value
RetainedEarnings
DeferredCompensation
Treasury StockShares Amount
Balance at September 30, 2009 . . . . . . . . $332,662 $1,485,674 $ 7,752,831 $17,906 (95,579,970) $(4,073,699)
Net income . . . . . . . . . . . . . . . . . . . . . . . . 1,317,610
Cash dividends:
Common ($1.48 per share) . . . . . . . . . . (346,213)
Common stock issued for:
Share-based compensation plans, net . . 59,866 2,758,391 16,624
Share-based compensation . . . . . . . . . . . . 79,228
Common stock held in trusts, net . . . . . . . (742) 34,790 742
Repurchase of common stock . . . . . . . . . (10,058,820) (750,000)
Balance at September 30, 2010 . . . . . . . . $332,662 $1,624,768 $ 8,724,228 $17,164 (102,845,609) $(4,806,333)
Net income . . . . . . . . . . . . . . . . . . . . . . . . 1,270,994
Cash dividends:
Common ($1.64 per share) . . . . . . . . . . (361,638)
Common stock issued for:
Share-based compensation plans, net . . 95,227 3,432,415 27,939
Share-based compensation . . . . . . . . . . . . 73,165
Common stock held in trusts, net . . . . . . . 1,711 3,316 (1,711)
Repurchase of common stock . . . . . . . . . (18,434,281) (1,500,001)
Balance at September 30, 2011 . . . . . . . . $332,662 $1,793,160 $ 9,633,584 $18,875 (117,844,159) $(6,280,106)
Net income . . . . . . . . . . . . . . . . . . . . . . . . 1,169,927
Cash dividends:
Common ($1.80 per share) . . . . . . . . . . (368,133)
Common stock issued for:
Share-based compensation plans, net . . 38,540 1,972,763 10,856
Share-based compensation . . . . . . . . . . . . 88,335
Common stock held in trusts, net . . . . . . . 42 65,764 (42)
Repurchase of common stock . . . . . . . . . (19,945,407) (1,500,000)
Balance at September 30, 2012 . . . . . . . . $332,662 $1,920,035 $10,435,378 $18,917 (135,751,039) $(7,769,292)
Common stock held in trusts represents rabbi trusts in connection with deferred compensation under theCompany’s employee salary and bonus deferral plan and directors’ deferral plan.
50

Becton, Dickinson and Company
Notes to Consolidated Financial Statements — (Continued)
The components and changes of Accumulated other comprehensive (loss) income were as follows:
Total
ForeignCurrency
TranslationAdjustments(A)
Benefit PlansAdjustment(B)
UnrealizedGain (Loss) onInvestments(B)
UnrealizedLosses onCash FlowHedges(B)
Balance at September 30, 2011 . . . . . . $(670,000) $ 69,694 $(696,624) $(161) $(42,909)
Other comprehensive (loss) income . . . (131,811) (18,435) (118,115) 26 4,713
Balance at September 30, 2012 . . . . . . $(801,811) $ 51,259 $(814,739) $(135) $(38,196)
(A) Foreign currency translation adjustments that were attributable to goodwill in fiscal years 2012 and 2011were $13,657 and $(12,525), respectively. The adjustments primarily affected goodwill reported within theMedical segment.
(B) Amounts are net of tax.
The loss in foreign currency translation adjustments in fiscal year 2012 mainly represented lossesattributable to the weakening of the Euro, as well as certain currencies in Latin America, against the U.S. dollarduring fiscal year 2012. These losses were partially offset by gains attributable to the strengthening of certaincurrencies in Asia Pacific against the U.S. dollar during fiscal year 2012. Income taxes are generally not providedfor translation adjustments.
The income tax benefit recorded in fiscal years 2012, 2011, and 2010 for defined benefit pension,postretirement plans and postemployment plans was $47,727, $47,575 and $67,829, respectively. The benefitplans adjustment included in other comprehensive (loss) income for 2012, 2011 and 2010 is net reclassificationadjustments of $40,448, $43,230 and $32,186, net of tax, respectively. These reclassifications represent theamortization of prior service credit and amortization of net actuarial losses and have been included inAccumulated other comprehensive (loss) income in prior periods. The taxes associated with these reclassificationadjustments in 2012, 2011 and 2010 were $22,750, $23,749 and $17,980, respectively.
The income tax provision (benefit) recorded in fiscal years 2012, 2011 and 2010 for unrealized gains(losses) on cash flow hedges was $2,889, $(20,348) and $27,510, respectively. The unrealized losses on cashflow hedges included in other comprehensive (loss) income for 2012, 2011 and 2010 are net of reclassificationadjustments of $4,880, $1,027, and $20,771, net of tax, respectively, for realized net hedge losses recorded toRevenues and Interest expense. These amounts had been included in Accumulated other comprehensive (loss)income in prior periods. The tax benefit associated with these reclassification adjustments in 2012, 2011 and2010 was $2,991, $629 and $12,731, respectively. Additional disclosures regarding derivatives are included inNote 12.
Note 4 — Earnings per Share
The weighted average common shares used in the computations of basic and diluted earnings per share(shares in thousands) for the years ended September 30 were as follows:
2012 2011 2010
Average common shares outstanding . . . . . . . . . . . . . . . . . . . . . . . . . 205,460 221,175 234,328
Dilutive share equivalents from share-based plans . . . . . . . . . . . . . . 3,721 5,105 5,808
Average common and common equivalent shares outstanding —assuming dilution . . . . . . . . . . . . . . . . . . . . . . . . . . . . . . . . . . . . . . 209,181 226,280 240,136
Options to purchase shares of common stock are excluded from the calculation of diluted earnings per sharewhen their inclusion would have an anti-dilutive effect on the calculation. Options to purchase 4.8 million shares,1.2 million shares and 1.3 million shares of the Company’s common stock were excluded from the calculation ofdiluted earnings per share in 2012, 2011 and 2010, respectively.
51

Becton, Dickinson and Company
Notes to Consolidated Financial Statements — (Continued)
Note 5 — Commitments and Contingencies
Commitments
Rental expense for all operating leases amounted to $65,941 in 2012, $68,545 in 2011, and $63,794 in 2010.Future minimum rental commitments on noncancelable leases are as follows: 2013 — $50,353; 2014 — $42,967;2015 — $35,267; 2016 — $26,830; 2017 — $22,065 and an aggregate of $33,531 thereafter.
As of September 30, 2012, the Company has certain future purchase commitments aggregating toapproximately $505,676, which will be expended over the next several years.
Contingencies
Given the uncertain nature of litigation generally, the Company is not able in all cases to estimate theamount or range of loss that could result from an unfavorable outcome of the litigation to which the Company isa party. In accordance with U.S. generally accepted accounting principles, the Company establishes accruals tothe extent probable future losses are estimable (in the case of environmental matters, without consideringpossible third-party recoveries). In view of the uncertainties discussed below, the Company could incur chargesin excess of any currently established accruals and, to the extent available, excess liability insurance. In theopinion of management, any such future charges, individually or in the aggregate, could have a material adverseeffect on the Company’s consolidated results of operations and consolidated cash flows.
The Company is named as a defendant in the following purported class action suits brought on behalf ofdistributors and other entities that purchase the Company’s products (the “Distributor Plaintiffs”), alleging thatthe Company violated federal antitrust laws, resulting in the charging of higher prices for the Company’sproducts to the plaintiffs and other purported class members.
Case Court Date Filed
Louisiana Wholesale Drug Company, Inc.,et. al. vs. Becton Dickinson and Company
U.S. District Court, Newark, New Jersey March 25, 2005
SAJ Distributors, Inc. et. al. vs. BectonDickinson & Co.
U.S. District Court, Eastern District ofPennsylvania
September 6, 2005
Dik Drug Company, et. al. vs. Becton,Dickinson and Company
U.S. District Court, Newark, New Jersey September 12, 2005
American Sales Company, Inc. et. al. vs.Becton, Dickinson & Co.
U.S. District Court, Eastern District ofPennsylvania
October 3, 2005
Park Surgical Co. Inc. et. al. vs. Becton,Dickinson and Company
U.S. District Court, Eastern District ofPennsylvania
October 26, 2005
These actions have been consolidated under the caption “In re Hypodermic Products Antitrust Litigation.”
The Company is also named as a defendant in the following purported class action suits brought on behalfof purchasers of the Company’s products, such as hospitals (the “Hospital Plaintiffs”), alleging that the Companyviolated federal and state antitrust laws, resulting in the charging of higher prices for the Company’s products tothe plaintiffs and other purported class members.
Case Court Date Filed
Jabo’s Pharmacy, Inc., et. al. v. BectonDickinson & Company
U.S. District Court, Greenville, Tennessee June 3, 2005
Drug Mart Tallman, Inc., et. al. v. BectonDickinson and Company
U.S. District Court, Newark, New Jersey January 17, 2006
Medstar v. Becton Dickinson U.S. District Court, Newark, New Jersey May 18, 2006
The Hebrew Home for the Aged at Riverdale v.Becton Dickinson and Company
U.S. District Court, Southern District ofNew York
March 28, 2007
52

Becton, Dickinson and Company
Notes to Consolidated Financial Statements — (Continued)
The plaintiffs in each of the above antitrust class action lawsuits seek monetary damages. All of the antitrustclass action lawsuits have been consolidated for pre-trial purposes in a Multi-District Litigation in Federal courtin New Jersey.
On April 27, 2009, the Company entered into a settlement agreement with the Distributor Plaintiffs in theseactions. The settlement agreement provides for, among other things, the payment by the Company of $45,000 inexchange for a release by all potential class members of the direct purchaser claims under federal antitrust lawsrelated to the products and acts enumerated in the complaint, and a dismissal of the case with prejudice, insofaras it relates to direct purchaser claims. The release would not cover potential class members that affirmatively optout of the settlement or indirect purchaser claims. On September 30, 2010, the District Court denied a motion toapprove the settlement agreement, ruling that the Hospital Plaintiffs, and not the Distributor Plaintiffs, are thedirect purchasers with standing to sue under federal antitrust laws. On June 5, 2012, the U.S. Court of Appealsfor the Third Circuit reversed the District Court’s standing decision and ruled that the Distributor Plaintiffs, notthe Hospital Plaintiffs, are direct purchasers entitled to pursue damages. The Hospital Plaintiffs requested that theruling be reconsidered, but that request was denied. The settlement agreement thus remains in effect, subject tocertain termination provisions, and must be approved as to fairness by the District Court. The DistributorPlaintiffs have filed a motion requesting that the settlement agreement be preliminarily approved as fair andreasonable. Certain of the Hospital Plaintiffs have opposed that motion. The Company currently cannot estimatethe range of reasonably possible losses with respect to these class action matters beyond the $45,000 alreadyaccrued and changes to the amount already recognized may be required in the future as additional informationbecomes available.
In June 2007, Retractable Technologies, Inc. (“RTI”) filed a complaint against the Company under thecaption Retractable Technologies, Inc. vs. Becton Dickinson and Company (Civil Action No. 2:07-cv-250, U.S.District Court, Eastern District of Texas). RTI alleges that the BD IntegraTM syringes infringe patents licensedexclusively to RTI. In its complaint, RTI also alleges that the Company engaged in false advertising with respectto certain of the Company’s safety-engineered products in violation of the Lanham Act; acted to exclude RTIfrom various product markets and to maintain its market share through, among other things, exclusionarycontracts in violation of state and federal antitrust laws; and engaged in unfair competition. In January 2008, thecourt severed the patent and non-patent claims into separate cases, and stayed the non-patent claims during thependency of the patent claims at the trial court level. RTI seeks money damages and injunctive relief. On April 1,2008, RTI filed a complaint against BD under the caption Retractable Technologies, Inc. and Thomas J. Shaw v.Becton Dickinson and Company (Civil Action No.2:08-cv-141, U.S. District Court, Eastern District of Texas).RTI alleges that the BD IntegraTM syringes infringe another patent licensed exclusively to RTI. RTI seeks moneydamages and injunctive relief. On August 29, 2008, the court ordered the consolidation of the patent cases. OnNovember 9, 2009, at a trial of these consolidated cases, the jury rendered a verdict in favor of RTI on all but oneof its infringement claims, but did not find any willful infringement, and awarded RTI $5,000 in damages. OnMay 19, 2010, the court granted RTI’s motion for a permanent injunction against the continued sale by theCompany of its BD IntegraTM products in their current form, but stayed the injunction for the duration of theCompany’s appeal. At the same time, the court lifted a stay of RTI’s non-patent claims. On July 8, 2011, theCourt of Appeals for the Federal Circuit reversed the District Court judgment that the Company’s 3ml BDIntegra™ products infringed the asserted RTI patents and affirmed the District Court judgment of infringementagainst the Company’s discontinued 1ml BD Integra™ products. On October 31, 2011, the Federal Circuit Courtof Appeals denied RTI’s request for an en banc rehearing. RTI has filed a petition for review with the U.S.Supreme Court. The trial on RTI’s antitrust and false advertising claims has been postponed pending resolutionof RTI’s appeal of the patent ruling.
With respect to RTI’s antitrust and false advertising claims, BD cannot estimate the possible loss or range ofpossible loss as there are significant legal and factual issues to be resolved. These include discovery regardingRTI’s alleged damages and liability theories, which has not been completed. Each party has filed motionsseeking to exclude portions of the other party’s expert testimony and to preclude the other party from introducing
53

Becton, Dickinson and Company
Notes to Consolidated Financial Statements — (Continued)
certain other evidence at trial. RTI’s appeal of the appellate court’s patent ruling to the U.S. Supreme Court addsfurther uncertainty to the possible future outcomes of RTI’s antitrust and false advertising claims. In the eventthat RTI ultimately succeeds at trial and subsequent appeals on its antitrust and false advertising claims, anypotential loss could be material as RTI is seeking to recover substantial damages including disgorgement ofprofits and damages under the federal antitrust laws, which are trebled. BD believes RTI’s allegations are withoutmerit.
On October 19, 2009, Gen-Probe Incorporated (“Gen-Probe”) filed a patent infringement action against BDin the U.S. District Court for the Southern District of California. The complaint alleges that the BD Viper™ andBD Viper™ XTR™ systems and BD ProbeTec™ specimen collection products infringe certain U.S. patents ofGen-Probe. On March 23, 2010, Gen-Probe filed a complaint, also in the U.S. District Court for the SouthernDistrict of California, alleging that the BD MaxTM instrument infringes Gen-Probe patents. The patents alleged tobe infringed are a subset of the Gen-Probe patents asserted against the Company in the October 2009 suit. OnJune 8, 2010, the court consolidated these cases. In a decision dated September 28, 2012, the District Court forthe Southern District of California issued a ruling on pre-trial summary judgment motions. The court ruled thatsome of Gen-Probe’s asserted patent claims are infringed, but other claims are not infringed, thus reducing fromsix to four the number of patents to be contested at the trial and significant defense issues relating to patentinvalidity, inequitable conduct and standing, remain to be adjudicated. Gen-Probe is seeking monetary damagesand injunctive relief. The Company currently cannot estimate the range of reasonably possible losses for thismatter as there are significant issues to be resolved either prior to, or at, trial, including patent invalidity,inequitable conduct and standing issues as well as motions seeking to exclude portions of the other party’s experttestimony and to preclude the other party from introducing certain other evidence at trial.
The Company believes that it has meritorious defenses to each of the above-mentioned suits pending againstthe Company and is engaged in a vigorous defense of each of these matters.
The Company is also involved both as a plaintiff and a defendant in other legal proceedings and claims thatarise in the ordinary course of business.
The Company is a party to a number of Federal proceedings in the United States brought under theComprehensive Environment Response, Compensation and Liability Act, also known as “Superfund,” andsimilar state laws. The affected sites are in varying stages of development. In some instances, the remedy hasbeen completed, while in others, environmental studies are commencing. For all sites, there are other potentiallyresponsible parties that may be jointly or severally liable to pay all cleanup costs.
Note 6 — Segment Data
The Company’s organizational structure is based upon its three principal business segments: BD Medical(“Medical”), BD Diagnostics (“Diagnostics”) and BD Biosciences (“Biosciences”). These segments are strategicbusinesses that are managed separately because each one develops, manufactures and markets distinct productsand services.
The Medical segment produces a broad array of medical devices that are used in a wide range of healthcaresettings. The principal product lines in the Medical segment include needles, syringes and intravenous cathetersfor medication delivery (including safety-engineered and auto-disable devices); prefilled IV flush syringes;syringes and pen needles for the self-injection of insulin and other drugs used in the treatment of diabetes;prefillable drug delivery devices provided to pharmaceutical companies and sold to end-users as drug/devicecombinations; regional anesthesia needles and trays; sharps disposal containers; and closed-system transferdevices.
54

Becton, Dickinson and Company
Notes to Consolidated Financial Statements — (Continued)
The Diagnostics segment produces products for the safe collection and transport of diagnostic specimens, aswell as instrument systems and reagents to detect a broad range of infectious diseases, healthcare-associatedinfections (“HAIs”) and cancers. The principal products and services in the Diagnostics segment includeintegrated systems for specimen collection; safety-engineered blood collection products and systems; automatedblood culturing systems; molecular testing systems for infectious diseases and women’s health; microorganismidentification and drug susceptibility systems; liquid-based cytology systems for cervical cancer screening; rapiddiagnostic assays; plated media; and microbiology laboratory automation.
The Biosciences segment produces research and clinical tools that facilitate the study of cells, and thecomponents of cells, to gain a better understanding of normal and disease processes. The principal product linesin the Biosciences segment include fluorescence-activated cell sorters and analyzers; monoclonal antibodies andkits for performing cell analysis; reagent systems for life science research; cell imaging systems; laboratoryproducts for tissue culture and fluid handling; diagnostic assays; and cell culture media supplements forbiopharmaceutical manufacturing.
The Company evaluates performance of its business segments and allocates resources to them primarilybased upon operating income. Segment operating income represents revenues reduced by product costs andoperating expenses. From time to time, the Company hedges against certain forecasted sales of U.S.-producedproducts sold outside the United States. Gains and losses associated with these foreign currency translationhedges are reported in segment revenues based upon their proportionate share of these international sales of U.S.-produced products.
Distribution of products is primarily through independent distribution channels, and directly to end-users byBD and independent sales representatives. No customer accounted for 10% or more of revenues in any of thethree years presented.
Revenues(A) 2012 2011 2010
Medical . . . . . . . . . . . . . . . . . . . . . . . . . . . . . . . . . . . . $ 4,090,693 $ 4,007,304 $3,796,432
Diagnostics . . . . . . . . . . . . . . . . . . . . . . . . . . . . . . . . . 2,538,055 2,480,477 2,318,879
Biosciences . . . . . . . . . . . . . . . . . . . . . . . . . . . . . . . . . 1,079,634 1,096,256 1,009,074
$ 7,708,382 $ 7,584,037 $7,124,385
Segment Operating Income
Medical . . . . . . . . . . . . . . . . . . . . . . . . . . . . . . . . . . . . $ 1,162,466 $ 1,181,404 $1,118,319
Diagnostics . . . . . . . . . . . . . . . . . . . . . . . . . . . . . . . . . 652,873 636,361 607,411
Biosciences . . . . . . . . . . . . . . . . . . . . . . . . . . . . . . . . . 261,692 278,013 259,810
Total Segment Operating Income . . . . . . . . . . . . . . . . 2,077,031 2,095,778 1,985,540
Unallocated Expenses(B) . . . . . . . . . . . . . . . . . . . . . . (604,623) (477,891) (418,799)
Income From Continuing Operations Before IncomeTaxes . . . . . . . . . . . . . . . . . . . . . . . . . . . . . . . . . . . . $ 1,472,408 $ 1,617,887 $1,566,741
Segment Assets
Medical . . . . . . . . . . . . . . . . . . . . . . . . . . . . . . . . . . . . $ 4,244,652 $ 3,928,241 $3,527,457
Diagnostics . . . . . . . . . . . . . . . . . . . . . . . . . . . . . . . . . 2,461,925 2,269,797 2,301,586
Biosciences . . . . . . . . . . . . . . . . . . . . . . . . . . . . . . . . . 1,407,096 1,332,246 1,059,774
Total Segment Assets . . . . . . . . . . . . . . . . . . . . . . . . . 8,113,673 7,530,284 6,888,817
Corporate and All Other(C) . . . . . . . . . . . . . . . . . . . . . 3,247,236 2,900,144 2,761,877
$11,360,909 $10,430,428 $9,650,694
55

Becton, Dickinson and Company
Notes to Consolidated Financial Statements — (Continued)
2012 2011 2010
Capital Expenditures
Medical . . . . . . . . . . . . . . . . . . . . . . . . . . . . . . . . . . . . $363,426 $366,915 $368,857
Diagnostics . . . . . . . . . . . . . . . . . . . . . . . . . . . . . . . . . 100,512 93,435 108,941
Biosciences . . . . . . . . . . . . . . . . . . . . . . . . . . . . . . . . . 13,883 30,652 43,484
Corporate and All Other . . . . . . . . . . . . . . . . . . . . . . . 9,609 17,815 9,687
$487,430 $508,817 $530,969
Depreciation and Amortization
Medical . . . . . . . . . . . . . . . . . . . . . . . . . . . . . . . . . . . . $239,591 $248,091 $253,109
Diagnostics . . . . . . . . . . . . . . . . . . . . . . . . . . . . . . . . . 174,974 163,313 163,392
Biosciences . . . . . . . . . . . . . . . . . . . . . . . . . . . . . . . . . 78,558 66,540 61,622
Corporate and All Other . . . . . . . . . . . . . . . . . . . . . . . 17,815 15,824 13,293
$510,938 $493,768 $491,416
(A) Intersegment revenues are not material.
(B) Includes primarily interest, net; foreign exchange; corporate expenses; and share-based compensationexpense.
(C) Includes cash and investments and corporate assets.
Revenues by Organizational Units 2012 2011 2010
BD Medical
Medical Surgical Systems . . . . . . . . . . . . . . . . . . . . . . . . $2,105,288 $2,081,733 $2,010,009
Diabetes Care . . . . . . . . . . . . . . . . . . . . . . . . . . . . . . . . . 911,276 866,477 785,759
Pharmaceutical Systems . . . . . . . . . . . . . . . . . . . . . . . . . 1,074,129 1,059,094 1,000,664
4,090,693 4,007,304 3,796,432
BD Diagnostics
Preanalytical Systems . . . . . . . . . . . . . . . . . . . . . . . . . . . 1,300,892 1,277,793 1,197,807
Diagnostic Systems . . . . . . . . . . . . . . . . . . . . . . . . . . . . . 1,237,163 1,202,684 1,121,072
2,538,055 2,480,477 2,318,879
BD Biosciences . . . . . . . . . . . . . . . . . . . . . . . . . . . . . . . . . . 1,079,634 1,096,256 1,009,074
$7,708,382 $7,584,037 $7,124,385
Geographic Information
The countries in which the Company has local revenue-generating operations have been combined into thefollowing geographic areas: the United States (including Puerto Rico), Europe, Asia Pacific and Other, which iscomprised of Latin America, Canada, and Japan.
56

Becton, Dickinson and Company
Notes to Consolidated Financial Statements — (Continued)
Revenues to unaffiliated customers are based upon the source of the product shipment. Long-lived assets,which include net property, plant and equipment, are based upon physical location.
2012 2011 2010
Revenues
United States . . . . . . . . . . . . . . . . . . . . . . . . . . . . . . . . . . $3,287,715 $3,247,555 $3,168,723
Europe . . . . . . . . . . . . . . . . . . . . . . . . . . . . . . . . . . . . . . . 2,378,746 2,430,939 2,322,030
Asia Pacific . . . . . . . . . . . . . . . . . . . . . . . . . . . . . . . . . . . 883,293 792,933 663,023
Other . . . . . . . . . . . . . . . . . . . . . . . . . . . . . . . . . . . . . . . . 1,158,628 1,112,610 970,609
$7,708,382 $7,584,037 $7,124,385
Long-Lived Assets
United States . . . . . . . . . . . . . . . . . . . . . . . . . . . . . . . . . . $3,155,804 $3,140,395 $2,841,639
Europe . . . . . . . . . . . . . . . . . . . . . . . . . . . . . . . . . . . . . . . 1,558,882 1,461,085 1,145,043
Asia Pacific . . . . . . . . . . . . . . . . . . . . . . . . . . . . . . . . . . . 397,226 300,006 258,879
Other . . . . . . . . . . . . . . . . . . . . . . . . . . . . . . . . . . . . . . . . 623,974 590,544 617,323
Corporate . . . . . . . . . . . . . . . . . . . . . . . . . . . . . . . . . . . . . 302,952 270,067 282,560
$6,038,838 $5,762,097 $5,145,444
Note 7 — Share-Based Compensation
The Company grants share-based awards under the 2004 Employee and Director Equity-BasedCompensation Plan (“2004 Plan”), which provides long-term incentive compensation to employees and directorsconsisting of: stock appreciation rights (“SARs”), stock options, performance-based restricted stock units,time-vested restricted stock units and other stock awards.
The amounts and location of compensation cost relating to share-based payments included in consolidatedstatements of income is as follows:
2012 2011 2010
Cost of products sold . . . . . . . . . . . . . . . . . . . . . . . . . . . . . . . . . . . . . $17,864 $14,440 $15,128
Selling and administrative expense . . . . . . . . . . . . . . . . . . . . . . . . . . 59,201 49,536 54,423
Research and development expense . . . . . . . . . . . . . . . . . . . . . . . . . . 11,980 9,387 9,823
$89,045 $73,363 $79,374
The associated income tax benefit recognized was $32,075, $26,342 and $28,532, respectively. Share-basedcompensation attributable to discontinued operations was not material.
Stock Appreciation Rights
SARs represent the right to receive, upon exercise, shares of common stock having a value equal to thedifference between the market price of common stock on the date of exercise and the exercise price on the date ofgrant. SARs vest over a four-year period and have a ten-year term. The fair value was estimated on the date of
57

Becton, Dickinson and Company
Notes to Consolidated Financial Statements — (Continued)
grant using a lattice-based binomial option valuation model that uses the following weighted-averageassumptions:
2012 2011 2010
Risk-free interest rate . . . . . . . . . . . . . . . . . . . . . . . . . . . . . . . . . . . 1.67% 2.40% 2.60%
Expected volatility . . . . . . . . . . . . . . . . . . . . . . . . . . . . . . . . . . . . . 22.0% 24.0% 28.0%
Expected dividend yield . . . . . . . . . . . . . . . . . . . . . . . . . . . . . . . . . 2.50% 2.14% 1.96%
Expected life . . . . . . . . . . . . . . . . . . . . . . . . . . . . . . . . . . . . . . . . . 7.9 years 7.8 years 6.5 years
Fair value derived . . . . . . . . . . . . . . . . . . . . . . . . . . . . . . . . . . . . . $12.61 $16.80 $19.70
Expected volatility is based upon historical volatility for the Company’s common stock and other factors.The expected life of SARs granted is derived from the output of the lattice-based model, using assumed exerciserates based on historical exercise and termination patterns, and represents the period of time that SARs grantedare expected to be outstanding. The risk-free interest rate used is based upon the published U.S. Treasury yieldcurve in effect at the time of grant for instruments with a similar life. The dividend yield is based upon the mostrecently declared quarterly dividend as of the grant date. The total intrinsic value of SARs exercised during 2012,2011 and 2010 was $3,934, $9,185, and $2,831, respectively. The Company issued 51,594 shares during 2012 tosatisfy the SARs exercised. The actual tax benefit realized during 2012, 2011 and 2010 for tax deductions fromSAR exercises totaled $2,866, $3,459 and $1,031, respectively. The total fair value of SARs vested during 2012,2011 and 2010 was $36,512, $31,992 and $33,640, respectively.
A summary of SARs outstanding as of September 30, 2012 and changes during the year then ended is asfollows:
SARs
WeightedAverage
Exercise Price
WeightedAverage
RemainingContractual Term
(Years)
AggregateIntrinsic
Value
Balance at October 1 . . . . . . . . . . . . . . . . . 9,027,037 $72.14
Granted . . . . . . . . . . . . . . . . . . . . . . . . . . . 1,431,558 72.12
Exercised . . . . . . . . . . . . . . . . . . . . . . . . . . (351,857) 65.28
Forfeited, canceled or expired . . . . . . . . . (324,726) 75.42
Balance at September 30 . . . . . . . . . . . . . . 9,782,012 $72.28 6.52 $68,123
Vested and expected to vest atSeptember 30 . . . . . . . . . . . . . . . . . . . . 9,418,066 $72.23 6.46 $66,275
Exercisable at September 30 . . . . . . . . . . . 6,142,551 $71.56 5.55 $49,643
58

Becton, Dickinson and Company
Notes to Consolidated Financial Statements — (Continued)
Stock options
The Company has not granted stock options since 2005. All outstanding stock option grants are fully vestedand have a ten-year term.
A summary of stock options outstanding as of September 30, 2012 and changes during the year then endedis as follows:
StockOptions
WeightedAverage
Exercise Price
Weighted AverageRemaining
Contractual Term(Years)
AggregateIntrinsic
Value
Balance at October 1 . . . . . . . . . . . . . . . . 3,457,351 $40.61
Exercised . . . . . . . . . . . . . . . . . . . . . . . . . (1,451,952) 36.14
Forfeited, canceled or expired . . . . . . . . . (36,777) 32.89
Balance at September 30 . . . . . . . . . . . . . 1,968,622 $44.06 1.42 $67,920
Vested at September 30 . . . . . . . . . . . . . . 1,968,622 $44.06 1.42 $67,920
Exercisable at September 30 . . . . . . . . . . 1,968,622 $44.06 1.42 $67,920
Cash received from the exercising of stock options in 2012, 2011 and 2010 was $52,470, $103,267 and$72,770, respectively. The actual tax benefit realized for tax deductions from stock option exercises totaled$11,944, $45,829 and $28,660, respectively. The total intrinsic value of stock options exercised during the years2012, 2011 and 2010 was $57,907, $137,720 and $89,943, respectively.
Performance-Based Restricted Stock Units
Performance-based restricted stock units cliff vest three years after the date of grant. These units are tied tothe Company’s performance against pre-established targets, including its average growth rate of consolidatedrevenues and average return on invested capital, over a three-year performance period. Under the Company’slong-term incentive program, the actual payout under these awards may vary from zero to 200% of anemployee’s target payout, based on the Company’s actual performance over the three-year performance period.The fair value is based on the market price of the Company’s stock on the date of grant. Compensation costinitially recognized assumes that the target payout level will be achieved and is adjusted for subsequent changesin the expected outcome of performance-related conditions.
A summary of performance-based restricted stock units outstanding as of September 30, 2012 and changesduring the year then ended is as follows:
StockUnits
WeightedAverage GrantDate Fair Value
Balance at October 1 . . . . . . . . . . . . . . . . . . . . . . . . . . . . . . . . . . . . . . . . 2,902,934 $70.96
Granted . . . . . . . . . . . . . . . . . . . . . . . . . . . . . . . . . . . . . . . . . . . . . . . . . . . 501,054 72.12
Distributed . . . . . . . . . . . . . . . . . . . . . . . . . . . . . . . . . . . . . . . . . . . . . . . . (78,086) 62.54
Forfeited or canceled . . . . . . . . . . . . . . . . . . . . . . . . . . . . . . . . . . . . . . . . (1,140,514) 63.84
Balance at September 30(A) . . . . . . . . . . . . . . . . . . . . . . . . . . . . . . . . . . 2,185,388 $75.24
Expected to vest at September 30(B) . . . . . . . . . . . . . . . . . . . . . . . . . . . . 329,711 $73.67
(A) Based on 200% of target payout.
(B) Net of expected forfeited units and units in excess of the expected performance payout of 131,872 and1,723,805, respectively.
59

Becton, Dickinson and Company
Notes to Consolidated Financial Statements — (Continued)
The weighted average grant date fair value of performance-based restricted stock units granted during theyears 2011 and 2010 was $76.64 and $75.63, respectively. The total fair value of performance-based restrictedstock units vested during 2012, 2011 and 2010 was $7,358, $15,430 and $24,357, respectively. At September 30,2012, the weighted average remaining vesting term of performance-based restricted stock units is .97 years.
Time-Vested Restricted Stock Units
Time-vested restricted stock units generally cliff vest three years after the date of grant, except for certainkey executives of the Company, including the executive officers, for which such units generally vest one yearfollowing the employee’s retirement. The related share-based compensation expense is recorded over therequisite service period, which is the vesting period or in the case of certain key executives is based on retirementeligibility. The fair value of all time-vested restricted stock units is based on the market value of the Company’sstock on the date of grant.
A summary of time-vested restricted stock units outstanding as of September 30, 2012 and changes duringthe year then ended is as follows:
StockUnits
WeightedAverage GrantDate Fair Value
Balance at October 1 . . . . . . . . . . . . . . . . . . . . . . . . . . . . . . . . . . . . . . . . . 1,910,670 $70.59
Granted . . . . . . . . . . . . . . . . . . . . . . . . . . . . . . . . . . . . . . . . . . . . . . . . . . . 1,149,053 72.27
Distributed . . . . . . . . . . . . . . . . . . . . . . . . . . . . . . . . . . . . . . . . . . . . . . . . . (404,254) 64.04
Forfeited or canceled . . . . . . . . . . . . . . . . . . . . . . . . . . . . . . . . . . . . . . . . . (265,341) 68.00
Balance at September 30 . . . . . . . . . . . . . . . . . . . . . . . . . . . . . . . . . . . . . . 2,390,128 $72.79
Expected to vest at September 30 . . . . . . . . . . . . . . . . . . . . . . . . . . . . . . . 2,151,115 $72.79
The weighted average grant date fair value of time-vested restricted stock units granted during the years2011 and 2010 was $76.97 and $75.58, respectively. The total fair value of time-vested restricted stock unitsvested during 2012, 2011 and 2010 was $38,105, $36,009 and $36,675, respectively. At September 30, 2012, theweighted average remaining vesting term of the time-vested restricted stock units is 1.44 years.
The amount of unrecognized compensation expense for all non-vested share-based awards as ofSeptember 30, 2012, is approximately $94,744, which is expected to be recognized over a weighted-averageremaining life of approximately 1.96 years. At September 30, 2012, 5,776,296 shares were authorized for futuregrants under the 2004 Plan.
The Company has a policy of satisfying share-based payments through either open market purchases orshares held in treasury. At September 30, 2012, the Company has sufficient shares held in treasury to satisfythese payments in 2012.
Other Stock Plans
The Company has a Stock Award Plan, which allows for grants of common shares to certain key employees.Distribution of 25% or more of each award is deferred until after retirement or involuntary termination, uponwhich the deferred portion of the award is distributable in five equal annual installments. The balance of theaward is distributable over five years from the grant date, subject to certain conditions. In February 2004, thisplan was terminated with respect to future grants upon the adoption of the 2004 Plan. At September 30, 2012 and2011, awards for 88,692 and 97,705 shares, respectively, were outstanding.
The Company has a Directors’ Deferral Plan, which provides a means to defer director compensation, fromtime to time, on a deferred stock or cash basis. As of September 30, 2012, 99,557 shares were held in trust, of
60

Becton, Dickinson and Company
Notes to Consolidated Financial Statements — (Continued)
which 5,414 shares represented Directors’ compensation in 2012, in accordance with the provisions of the plan.Under this plan, which is unfunded, directors have an unsecured contractual commitment from the Company.
The Company also has a Deferred Compensation Plan that allows certain highly-compensated employees,including executive officers, to defer salary, annual incentive awards and certain equity-based compensation. Asof September 30, 2012, 440,451 shares were issuable under this plan.
Note 8 — Benefit Plans
The Company has defined benefit pension plans covering substantially all of its employees in the UnitedStates and certain foreign locations. The Company also provides certain postretirement healthcare and lifeinsurance benefits to qualifying domestic retirees. Postretirement healthcare and life insurance benefit plans inforeign countries are not material. The measurement date used for the Company’s employee benefit plans isSeptember 30.
On November 30, 2011, the Company remeasured its U.S. defined pension plan as a result of amendmentsto this plan that were approved and communicated to affected employees during the first quarter of fiscal year2012. Effective January 1, 2013, all plan participants’ benefits in the defined benefit traditional pension plan willbe converted to a defined benefit cash balance pension plan. The November 30, 2011 remeasurement was basedupon a discount rate of 5.1%, compared with the discount rate of 4.9% used on the September 30, 2011measurement date. The increase in the discount rate reduced total fiscal year 2012 net pension cost by $5,300. Anincrease in plan assets held as of November 30, 2011 compared with assets held as of September 30, 2011 alsoreduced total fiscal year 2012 net pension cost by $6,200. The total reduction in fiscal year 2012 net pension costresulting from the remeasurement was $40,200.
Net pension and other postretirement cost for the years ended September 30 included the followingcomponents:
Pension Plans Other Postretirement Benefits2012 2011 2010 2012 2011 2010
Service cost . . . . . . . . . . . . . . . . . . . . . . . . . . $ 74,560 $ 88,692 $ 72,901 $ 5,870 $ 5,842 $ 5,007
Interest cost . . . . . . . . . . . . . . . . . . . . . . . . . . 91,181 93,228 90,432 12,755 13,143 14,190
Expected return on plan assets . . . . . . . . . . . (103,624) (103,081) (99,199) — — —
Amortization of prior service (credit)cost . . . . . . . . . . . . . . . . . . . . . . . . . . . . . . (11,049) (1,294) (1,091) (690) (686) 4
Amortization of loss . . . . . . . . . . . . . . . . . . . 56,416 55,735 41,812 4,632 4,465 3,408
Amortization of net asset . . . . . . . . . . . . . . . (11) (34) (47) — — —
Curtailment/settlement loss . . . . . . . . . . . . . 20,466 1,096 — (1,135) — —
$ 127,939 $ 134,342 $104,808 $21,432 $22,764 $22,609
Net pension cost attributable to foreign plans included in the preceding table was $31,085, $34,429 and$25,820 in 2012, 2011 and 2010, respectively.
The settlement loss recorded in 2012 included lump sum benefit payments associated with the Company’ssupplemental pension plan. The Company recognizes pension settlements when payments from the supplementalplan exceed the sum of service and interest cost components of net periodic pension cost associated with this planfor the fiscal year. The settlement loss recorded in 2012 also included settlements associated with certain foreignplans.
61

Becton, Dickinson and Company
Notes to Consolidated Financial Statements — (Continued)
The change in benefit obligation, change in fair value of plan assets, funded status and amounts recognizedin the Consolidated Balance Sheets for these plans were as follows:
Pension PlansOther Postretirement
Benefits2012 2011 2012 2011
Change in benefit obligation:
Beginning obligation . . . . . . . . . . . . . . . . . $ 1,996,441 $1,911,295 $ 269,458 $ 260,124
Service cost . . . . . . . . . . . . . . . . . . . . . . . . 74,560 88,692 5,870 5,842
Interest cost . . . . . . . . . . . . . . . . . . . . . . . . 91,181 93,228 12,755 13,143
Plan amendments . . . . . . . . . . . . . . . . . . . . (124,048) (3,683) (5,042) —
Benefits paid . . . . . . . . . . . . . . . . . . . . . . . (124,309) (108,381) (27,065) (25,776)
Actuarial loss . . . . . . . . . . . . . . . . . . . . . . . 439,082 22,146 5,384 8,277
Settlements . . . . . . . . . . . . . . . . . . . . . . . . (45,496) — — —
Other, includes translation . . . . . . . . . . . . 105 (6,856) 5,841 7,848
Benefit obligation at September 30 . . . . . . $ 2,307,516 $1,996,441 $ 267,201 $ 269,458
Change in fair value of plan assets:
Beginning fair value . . . . . . . . . . . . . . . . . $ 1,352,730 $1,413,848 $ — $ —
Actual return on plan assets . . . . . . . . . . . 223,483 1,391 — —
Employer contribution . . . . . . . . . . . . . . . 166,367 53,505 — —
Benefits paid . . . . . . . . . . . . . . . . . . . . . . . (124,309) (108,381) — —
Settlements . . . . . . . . . . . . . . . . . . . . . . . . (45,496) — — —
Other, includes translation . . . . . . . . . . . . 567 (7,633) — —
Plan assets at September 30 . . . . . . . . . . . $ 1,573,342 $1,352,730 $ — $ —
Funded Status at September 30:
Unfunded benefit obligation . . . . . . . . . . . $ (734,174) $ (643,711) $(267,201) $(269,458)
Amounts recognized in the ConsolidatedBalance Sheets at September 30:
Other . . . . . . . . . . . . . . . . . . . . . . . . . . . . . $ 51 $ 3,217 $ — $ —
Salaries, wages and related items . . . . . . . (5,856) (6,042) (17,590) (18,188)
Long-term Employee BenefitObligations . . . . . . . . . . . . . . . . . . . . . . (728,369) (640,886) (249,611) (251,270)
Net amount recognized . . . . . . . . . . . . . . . $ (734,174) $ (643,711) $(267,201) $(269,458)
Amounts recognized in Accumulatedother comprehensive (loss) incomebefore income taxes at September 30:
Net transition asset . . . . . . . . . . . . . . . . . . $ 357 $ 398 $ — $ —
Prior service credit . . . . . . . . . . . . . . . . . . 122,235 9,193 10,365 6,013
Net actuarial loss . . . . . . . . . . . . . . . . . . . . (1,152,948) (911,146) (70,949) (70,653)
Net amount recognized . . . . . . . . . . . . . . . $(1,030,356) $ (901,555) $ (60,584) $ (64,640)
62

Becton, Dickinson and Company
Notes to Consolidated Financial Statements — (Continued)
Foreign pension plan assets at fair value included in the preceding table were $466,450 and $419,452 atSeptember 30, 2012 and 2011, respectively. The foreign pension plan projected benefit obligations were$632,442 and $500,969 at September 30, 2012 and 2011, respectively.
Pension plans with accumulated benefit obligations in excess of plan assets and plans with projected benefitobligations in excess of plan assets consist of the following at September 30:
Accumulated BenefitObligation Exceeds the
Fair Value of Plan Assets
Projected BenefitObligation Exceeds the
Fair Value of Plan Assets2012 2011 2012 2011
Projected benefit obligation . . . . . . . . . . . . $2,054,644 $1,616,534 $2,307,472 $1,862,441
Accumulated benefit obligation . . . . . . . . . $1,999,604 $1,338,643
Fair value of plan assets . . . . . . . . . . . . . . . $1,364,169 $ 989,043 $1,573,247 $1,215,513
The estimated net actuarial loss and prior service credit for pension benefits that will be amortized fromAccumulated other comprehensive (loss) income into net pension costs over the next fiscal year are expected tobe $(75,524) and $13,130, respectively. The estimated net actuarial loss and prior service credit for otherpostretirement benefits that will be amortized from Accumulated other comprehensive (loss) income into netother postretirement costs over the next fiscal year are expected to be $(3,911) and $1,139, respectively.
The weighted average assumptions used in determining pension plan information were as follows:
2012 2011 2010
Net Cost
Discount rate:
U.S. plans(A)(B) . . . . . . . . . . . . . . . . . . . . . . . . . . . . . . . . . . . . . . . . . . . . . . . 4.90% 5.20% 5.90%
Foreign plans . . . . . . . . . . . . . . . . . . . . . . . . . . . . . . . . . . . . . . . . . . . . . . . . . . 5.26 4.68 5.63
Expected return on plan assets:
U.S. plans . . . . . . . . . . . . . . . . . . . . . . . . . . . . . . . . . . . . . . . . . . . . . . . . . . . . . 7.75 8.00 8.00
Foreign plans . . . . . . . . . . . . . . . . . . . . . . . . . . . . . . . . . . . . . . . . . . . . . . . . . . 6.06 6.31 6.38
Rate of compensation increase:
U.S. plans(A) . . . . . . . . . . . . . . . . . . . . . . . . . . . . . . . . . . . . . . . . . . . . . . . . 4.25 4.50 4.50
Foreign plans . . . . . . . . . . . . . . . . . . . . . . . . . . . . . . . . . . . . . . . . . . . . . . . . 3.61 3.56 3.35
Benefit Obligation
Discount rate:
U.S. plans(A) . . . . . . . . . . . . . . . . . . . . . . . . . . . . . . . . . . . . . . . . . . . . . . . . 3.90 4.90 5.20
Foreign plans . . . . . . . . . . . . . . . . . . . . . . . . . . . . . . . . . . . . . . . . . . . . . . . . 3.94 5.26 4.68
Rate of compensation increase:
U.S. plans(A) . . . . . . . . . . . . . . . . . . . . . . . . . . . . . . . . . . . . . . . . . . . . . . . . 4.25 4.25 4.50
Foreign plans . . . . . . . . . . . . . . . . . . . . . . . . . . . . . . . . . . . . . . . . . . . . . . . . 3.28 3.61 3.56
(A) Also used to determine other postretirement and postemployment benefit plan information.
(B) On November 30, 2011, the Company remeasured its U.S. defined benefit pension plan based upon a 5.10%discount rate compared to the discount rate of 4.90% used on September 30, 2011. All other U.S. plansremained at 4.90%.
At September 30, 2012 the assumed healthcare trend rates were 7.5% pre and post age 65, graduallydecreasing to an ultimate rate of 5.0% beginning in 2024. At September 30, 2011 the corresponding assumed
63

Becton, Dickinson and Company
Notes to Consolidated Financial Statements — (Continued)
healthcare trend rates were 7.6% pre and post age 65, gradually decreasing to an ultimate rate of 5.0% beginningin 2024. A one percentage point increase in assumed healthcare cost trend rates in each year would increase theaccumulated postretirement benefit obligation as of September 30, 2012 by $11,526 and the aggregate of theservice cost and interest cost components of 2012 annual expense by $638. A one percentage point decrease inthe assumed healthcare cost trend rates in each year would decrease the accumulated postretirement benefitobligation as of September 30, 2012 by $9,527 and the aggregate of the 2012 service cost and interest costby $480.
Expected Rate of Return on Plan Assets
The expected rate of return on plan assets is based upon expectations of long-term average rates of return tobe achieved by the underlying investment portfolios. In establishing this assumption, the Company considersmany factors, including historical assumptions compared with actual results; benchmark data; expected returnson various plan asset classes, as well as current and expected asset allocations.
Expected Funding
The Company’s funding policy for its defined benefit pension plans is to contribute amounts sufficient tomeet legal funding requirements, plus any additional amounts that may be appropriate considering the fundedstatus of the plans, tax consequences, the cash flow generated by the Company and other factors. While theCompany does not anticipate any significant required contributions to its pension plans in 2013, the Companymade a discretionary contribution of $100,000 to its U.S. pension plan in October 2012.
Expected benefit payments are as follows:
PensionPlans
OtherPostretirement
Benefits
2013 . . . . . . . . . . . . . . . . . . . . . . . . . . . . . . . . . . . . . . . . . . . . . . . . . . . . . . . $149,098 $17,590
2014 . . . . . . . . . . . . . . . . . . . . . . . . . . . . . . . . . . . . . . . . . . . . . . . . . . . . . . . 148,264 17,942
2015 . . . . . . . . . . . . . . . . . . . . . . . . . . . . . . . . . . . . . . . . . . . . . . . . . . . . . . . 154,868 18,348
2016 . . . . . . . . . . . . . . . . . . . . . . . . . . . . . . . . . . . . . . . . . . . . . . . . . . . . . . . 159,853 18,658
2017 . . . . . . . . . . . . . . . . . . . . . . . . . . . . . . . . . . . . . . . . . . . . . . . . . . . . . . . 167,326 18,774
2018-2022 . . . . . . . . . . . . . . . . . . . . . . . . . . . . . . . . . . . . . . . . . . . . . . . . . . 862,741 92,863
Expected receipts of the subsidy under the Medicare Prescription Drug Improvement and Modernization Actof 2003, which are not reflected in the expected other postretirement benefit payments included in the precedingtable, are as follows: 2013, $1,417; 2014, $1,404; 2015, $1,382; 2016, $1,353; 2017, $1,315; 2018-2022, $5,751.
Investments
The Company’s primary objective is to achieve returns sufficient to meet future benefit obligations. It seeksto generate above market returns by investing in more volatile asset classes such as equities while at the sametime controlling risk with allocations to more stable asset classes like fixed income.
U.S. Plans
The Company’s U.S. plans comprise 70% of total benefit plan investments, based on September 30, 2012market values, and have a target asset mix of 65% equities and 35% fixed income. This mix was establishedbased on an analysis of projected benefit payments and estimates of long-term returns, volatilities andcorrelations for various asset classes. The mix is reviewed periodically by the named fiduciary of the plans and isintended to provide above-market returns at an acceptable level of risk over time.
64

Becton, Dickinson and Company
Notes to Consolidated Financial Statements — (Continued)
The established target mix includes ranges by which the target may deviate in order to accommodate normalmarket fluctuations. Routine cash flows are used to bring the mix closer to target and a move outside of theacceptable ranges will signal the potential for a formal rebalancing, based on an assessment of current marketconditions and transaction costs. Any tactical deviations from the established asset mix require the approval ofthe named fiduciary.
The U.S. plans may enter into both exchange traded and non-exchange traded derivative transactions inorder to manage interest rate exposure, volatility, term structure of interest rates, and sector and currencyexposures within the fixed income portfolios. The Company has established minimum credit quality standardsfor counterparties in such transactions.
The following table provides the fair value measurements of U.S. plan assets, as well as the measurementtechniques and inputs utilized to measure fair value of these assets, at September 30, 2012 and 2011.
Total U.S.Plan AssetBalances at
September 30,2012
Quoted Prices inActive Markets
for IdenticalAssets (Level 1)
SignificantOther
ObservableInputs (Level 2)
SignificantUnobservable
Inputs (Level 3)
Fixed Income:
Mortgage and asset-backed securities(A) . . . . . $ 137,064 $ — $137,064 $ —
Corporate bonds(B) . . . . . . . . . . . . . . . . . . . . . . 106,981 — 106,981 —
Government and agency-U.S.(C) . . . . . . . . . . . 74,641 57,401 17,240 —
Government and agency-Foreign(D) . . . . . . . . . 5,696 — 5,696 —
Other(E) . . . . . . . . . . . . . . . . . . . . . . . . . . . . . . . 8,964 — 8,964 —
Equity securities(F) . . . . . . . . . . . . . . . . . . . . . . . . 724,447 639,646 84,801 —
Cash and cash equivalents(G) . . . . . . . . . . . . . . . . 49,099 49,099 — —
Fair value of plan assets . . . . . . . . . . . . . . . . . . . . . $1,106,892 $746,146 $360,746 $ —
Total U.S.Plan AssetBalances at
September 30,2011
Quoted Prices inActive Markets
for IdenticalAssets (Level 1)
SignificantOther
ObservableInputs (Level 2)
SignificantUnobservable
Inputs (Level 3)
Fixed Income:
Mortgage and asset-backed securities(A) . . . . . $165,042 $ — $165,042 $ —
Corporate bonds(B) . . . . . . . . . . . . . . . . . . . . . . 111,954 — 111,954 —
Government and agency-U.S.(C) . . . . . . . . . . . 41,885 26,577 15,308 —
Government and agency-Foreign(D) . . . . . . . . . 6,836 — 6,836 —
Other(E) . . . . . . . . . . . . . . . . . . . . . . . . . . . . . . . 8,277 — 8,277 —
Equity securities(F) . . . . . . . . . . . . . . . . . . . . . . . . 562,047 435,847 126,200 —
Cash and cash equivalents(G) . . . . . . . . . . . . . . . . 37,237 37,237 — —
Fair value of plan assets . . . . . . . . . . . . . . . . . . . . . $933,278 $499,661 $433,617 $ —
(A) Values are based upon a combination of observable prices, independent pricing services and relevant brokerquotes.
(B) Values are based upon comparable securities with similar yields and credit ratings.
(C) Values of instruments classified as Level 1 are based on the closing price reported on the major market onwhich the investments are traded. Values of instruments classified as Level 2 are based upon quoted marketprices from observable pricing sources.
65

Becton, Dickinson and Company
Notes to Consolidated Financial Statements — (Continued)
(D) Values are based upon quoted market prices from observable pricing sources.
(E) Classification contains various immaterial investments and valuation varies by investment type. Values areprimarily based upon quoted market prices from observable pricing sources.
(F) Values of instruments classified as Level 1 are based on the closing price reported on the major market onwhich the investments are traded. Values of instruments classified as Level 2 are based on the net assetvalue provided by the fund administrator, which is based on the value of the underlying assets owned by thefund, less its liabilities and then divided by the number of fund units outstanding.
(G) Values are based upon quoted market prices or broker/dealer quotations.
The U.S. portion of fixed income assets is invested in mortgage-backed, corporate, government and agencyand asset-backed instruments. Mortgage-backed securities consist of residential mortgage pass-throughcertificates. Corporate bonds are diversified across industry and sector and, while consisting primarily ofinvestment grade instruments, include an allocation to high-yield debt as well. U.S. government investmentsconsist of obligations of the U.S. Treasury and its agencies.
The non-U.S. portion of fixed income investments consists primarily of corporate bonds in developedmarkets but includes an allocation to emerging markets debt as well. The value of derivative instruments is notmaterial and is included in the “Other” category provided in the table above.
Equity securities included within the plans’ assets consist of publicly-traded U.S. and non-U.S. equitysecurities. In order to achieve appropriate diversification, these portfolios are allocated among multiple assetmanagers and invested across market sectors, investment styles, capitalization weights and geographic regions.
A portion of the U.S. plans’ assets consists of investments in cash and cash equivalents, primarily toaccommodate liquidity requirements relating to trade settlement and benefit payment activity.
Foreign Plans
Foreign plan assets comprise 30% of the Company’s total benefit plan assets, based on market value atSeptember 30, 2012. Such plans have local independent fiduciary committees, with responsibility fordevelopment and oversight of investment policy, including asset allocation decisions. In making such decisions,consideration is given to local regulations, investment practices and funding rules.
The following table provides the fair value measurements of foreign plan assets, as well as the measurementtechniques and inputs utilized to measure fair value of these assets, at September 30, 2012 and 2011.
Total ForeignPlan AssetBalances at
September 30,2012
Quoted Prices inActive Markets
for IdenticalAssets (Level 1)
SignificantOther
ObservableInputs (Level 2)
SignificantUnobservable
Inputs (Level 3)
Fixed Income:
Corporate bonds(A) . . . . . . . . . . . . . . . . . . . . . . $ 36,612 $ — $36,612 $ —
Government and agency-U.S.(B) . . . . . . . . . . . 3,230 3,230 — —
Government and agency-Foreign(C) . . . . . . . . . 75,667 35,317 40,350 —
Equity securities(D) . . . . . . . . . . . . . . . . . . . . . . . . 244,418 229,672 14,649 97
Cash and cash equivalents(E) . . . . . . . . . . . . . . . . 17,443 17,443 — —
Real estate(F) . . . . . . . . . . . . . . . . . . . . . . . . . . . . . 9,058 — 6,017 3,041
Insurance contracts(G) . . . . . . . . . . . . . . . . . . . . . . 80,022 — — 80,022
Fair value of plan assets . . . . . . . . . . . . . . . . . . . . . $466,450 $285,662 $97,628 $83,160
66

Becton, Dickinson and Company
Notes to Consolidated Financial Statements — (Continued)
Total ForeignPlan AssetBalances at
September 30,2011
Quoted Prices inActive Markets
for IdenticalAssets (Level 1)
SignificantOther
ObservableInputs (Level 2)
SignificantUnobservable
Inputs (Level 3)
Fixed Income:
Corporate bonds(A) . . . . . . . . . . . . . . . . . . . . . . $ 34,905 $ — $34,905 $ —
Government and agency-U.S.(B) . . . . . . . . . . . 1,065 1,065 — —
Government and agency-Foreign(C) . . . . . . . . . 77,949 36,687 41,262 —
Equity securities(D) . . . . . . . . . . . . . . . . . . . . . . . . 215,309 201,325 13,726 258
Cash and cash equivalents(E) . . . . . . . . . . . . . . . . 1,191 1,191 — —
Real estate(F) . . . . . . . . . . . . . . . . . . . . . . . . . . . . . 10,688 — — 10,688
Insurance contracts(G) . . . . . . . . . . . . . . . . . . . . . . 78,345 — — 78,345
Fair value of plan assets . . . . . . . . . . . . . . . . . . . . . $419,452 $240,268 $89,893 $89,291
(A) Values are based upon comparable securities with similar yields and credit ratings.
(B) Values are based on the closing price reported on the major market on which the investments are traded.
(C) Values of instruments classified as Level 1 are based on the closing price reported on the major market onwhich the investments are traded. Values of instruments classified as Level 2 are based upon quoted marketprices from observable pricing sources.
(D) Values of instruments classified as Level 1 are based on the closing price reported on the major market onwhich the investments are traded. Values of instruments classified as Level 2 are based on the net assetvalue provided by the fund administrator, which is based on the value of the underlying assets owned by thefund, less its liabilities and then divided by the number of fund units outstanding.
(E) Values are based upon quoted market prices or broker/dealer quotations.
(F) Values represent the estimated fair value based on the fair value of the underlying investment value or cost,adjusted for any accumulated earnings or losses.
(G) Values approximately represent cash surrender value.
Fixed income investments include corporate, U.S. government and non-U.S. government securities. Equitysecurities included in the foreign plan assets consist of publicly-traded U.S. and non-U.S. equity securities. Realestate investments consist of investments in funds holding an interest in real properties. The foreign plans alsohold a portion of assets in cash and cash equivalents, in order to accommodate liquidity requirements.
67

Becton, Dickinson and Company
Notes to Consolidated Financial Statements — (Continued)
The following table summarizes the changes, for the years ended September 30, 2012 and 2011, in the fairvalue of foreign pension assets measured using Level 3 inputs:
EquitySecurities
RealEstate
InsuranceContracts
TotalAssets
Balance at September 30, 2010 . . . . . . . . . . . . . . . . . . . . . . . . . . . . . . . $ 267 $ 9,486 $62,244 $71,997
Actual return on plan assets:
Relating to assets held at September 30, 2010 . . . . . . . . . . . . . . . . . . (4) 46 2,613 2,655
Purchases, sales and settlements, net . . . . . . . . . . . . . . . . . . . . . . . . . . . — 1,363 14,710 16,073
Transfers in (out) from other categories . . . . . . . . . . . . . . . . . . . . . . . . . — — 92 92
Exchange rate changes . . . . . . . . . . . . . . . . . . . . . . . . . . . . . . . . . . . . . . (5) (207) (1,314) (1,526)
Balance at September 30, 2011 . . . . . . . . . . . . . . . . . . . . . . . . . . . . . . . $ 258 10,688 $78,345 $89,291
Actual return on plan assets:
Relating to assets held at September 30, 2011 . . . . . . . . . . . . . . . . . . (137) (22) 2,953 2,794
Purchases, sales and settlements, net . . . . . . . . . . . . . . . . . . . . . . . . . . . (16) (1,648) 1,488 (176)
Transfers in (out) from other categories . . . . . . . . . . . . . . . . . . . . . . . . . — (5,879) — (5,879)
Exchange rate changes . . . . . . . . . . . . . . . . . . . . . . . . . . . . . . . . . . . . . . (8) (98) (2,764) (2,870)
Balance at September 30, 2012 . . . . . . . . . . . . . . . . . . . . . . . . . . . . . . . $ 97 3,041 $80,022 $83,160
Postemployment Benefits
The Company utilizes a service-based approach in accounting for most of its postemployment benefits.Under this approach, the costs of benefits are recognized over the eligible employees’ service period. TheCompany has elected to delay recognition of actuarial gains and losses that result from changes in assumptions.
Postemployment benefit costs for the years ended September 30 included the following components:
2012 2011 2010
Service cost . . . . . . . . . . . . . . . . . . . . . . . . . . . . . . . . . . . . . . . . . . . . $16,399 $13,327 $11,409
Interest cost . . . . . . . . . . . . . . . . . . . . . . . . . . . . . . . . . . . . . . . . . . . . 5,639 5,054 4,379
Amortization of prior service credit . . . . . . . . . . . . . . . . . . . . . . . . . . (1,697) (1,697) (1,697)
Amortization of loss . . . . . . . . . . . . . . . . . . . . . . . . . . . . . . . . . . . . . . 15,639 10,490 7,777
$35,980 $27,174 $21,868
The changes in benefit obligation for these postemployment benefits were as follows:
Postemployment benefits2012 2011
Change in benefit obligation:
Beginning obligation . . . . . . . . . . . . . . . . . . . . . . . . . . . . . . . . . . . . . . . . . . . $137,575 $112,751
Service cost . . . . . . . . . . . . . . . . . . . . . . . . . . . . . . . . . . . . . . . . . . . . . . . . . . 16,399 13,327
Interest cost . . . . . . . . . . . . . . . . . . . . . . . . . . . . . . . . . . . . . . . . . . . . . . . . . . 5,639 5,054
Benefits paid . . . . . . . . . . . . . . . . . . . . . . . . . . . . . . . . . . . . . . . . . . . . . . . . . (51,989) (42,572)
Actuarial loss . . . . . . . . . . . . . . . . . . . . . . . . . . . . . . . . . . . . . . . . . . . . . . . . . 55,025 49,015
Benefit obligation at September 30 . . . . . . . . . . . . . . . . . . . . . . . . . . . . . . . . $162,649 $137,575
68

Becton, Dickinson and Company
Notes to Consolidated Financial Statements — (Continued)
The postemployment benefit plan obligations as of September 30, 2012 and 2011 were unfunded. Theamounts recognized in Accumulated other comprehensive (loss) income before income taxes for the net actuarialloss was $157,525 and $116,442 at September 30, 2012 and 2011, respectively. The estimated net actuarial lossthat will be amortized from the Accumulated other comprehensive (loss) income into postemployment benefitcost over the next fiscal year is $19,210.
Savings Incentive Plan
The Company has a voluntary defined contribution plan (“Savings Incentive Plan”) covering eligibleemployees in the United States. The Company matches contributions for eligible employees to 75% ofemployees’ contributions, up to a maximum of 4.5% of each employee’s eligible compensation. The cost of theSavings Incentive Plan was $36,281 in 2012, $36,535 in 2011 and $34,097 in 2010. The Company guaranteesemployees’ contributions to the fixed income fund of the Savings Incentive Plan, which consists of diversifiedmoney market instruments. The amount guaranteed was $254,060 at September 30, 2012.
Note 9 — Acquisitions
Sirigen
On August 24, 2012, the Company acquired a 100% interest in Sirigen Group Limited (“Sirigen”), adeveloper of unique polymer dyes that are used in flow cytometry. The fair value of consideration transferredwas $64,433 which consisted of $52,533 in cash, net of $878 in cash acquired, as well as $11,900 in contingentconsideration that will be paid based upon the achievement of certain development milestones. The fair value ofthe contingent consideration was estimated using a probability-weighted discounted cash flow model that wasbased upon the probabilities assigned to the contingent events. This acquisition is intended to complement theCompany’s existing instrument platforms and reagent portfolio and allow the Company to differentiate its lifescience research reagent portfolio and add value for customers.
The acquisition was accounted for under the acquisition method of accounting for business combinationsand Sirigen’s results of operations were included in the Biosciences segment’s results from the acquisition date.Pro forma information is not provided as the acquisition did not have a material effect on the Company’sconsolidated results. The following table summarizes the estimated fair values of the assets acquired andliabilities assumed at the acquisition date. These fair values are based upon the information available as ofSeptember 30, 2012 and may be adjusted should further information regarding events or circumstances existingat the acquisition date become available.
Patent . . . . . . . . . . . . . . . . . . . . . . . . . . . . . . . . . . . . . . . . . . . . . . . . . . . . . . . . . . . . . . . . . . . . $ 10,700
Developed technology . . . . . . . . . . . . . . . . . . . . . . . . . . . . . . . . . . . . . . . . . . . . . . . . . . . . . . 19,100
Acquired in-process research and development . . . . . . . . . . . . . . . . . . . . . . . . . . . . . . . . . . . 11,600
Deferred tax assets . . . . . . . . . . . . . . . . . . . . . . . . . . . . . . . . . . . . . . . . . . . . . . . . . . . . . . . . . 2,639
Other . . . . . . . . . . . . . . . . . . . . . . . . . . . . . . . . . . . . . . . . . . . . . . . . . . . . . . . . . . . . . . . . . . . . 664
Total identifiable assets acquired . . . . . . . . . . . . . . . . . . . . . . . . . . . . . . . . . . . . . . . . . . . . . . 44,703
Deferred tax liabilities . . . . . . . . . . . . . . . . . . . . . . . . . . . . . . . . . . . . . . . . . . . . . . . . . . . . . . (15,734)
Other . . . . . . . . . . . . . . . . . . . . . . . . . . . . . . . . . . . . . . . . . . . . . . . . . . . . . . . . . . . . . . . . . . . . (1,150)
Total liabilities assumed . . . . . . . . . . . . . . . . . . . . . . . . . . . . . . . . . . . . . . . . . . . . . . . . . . . . . (16,884)
Net identifiable assets acquired . . . . . . . . . . . . . . . . . . . . . . . . . . . . . . . . . . . . . . . . . . . . . . . 27,819
Goodwill . . . . . . . . . . . . . . . . . . . . . . . . . . . . . . . . . . . . . . . . . . . . . . . . . . . . . . . . . . . . . . . . . 36,614
Net assets acquired . . . . . . . . . . . . . . . . . . . . . . . . . . . . . . . . . . . . . . . . . . . . . . . . . . . . . . . . . $ 64,433
69

Becton, Dickinson and Company
Notes to Consolidated Financial Statements — (Continued)
The patent asset of $10,700 represents Sirigen’s enabling technology that underlies both developedtechnology and in-process research and development projects. The patent’s fair value was determined based onthe present value of projected cash flows utilizing an income approach which reflected a risk-adjusted discountrate of 20%. The patent will be amortized over an expected useful life of 14 years. The developed technologyasset of $19,100 represents Sirigen’s developed polymer technology. The developed technology’s fair value wasdetermined based on the present value of projected cash flows utilizing an income approach which reflected arisk-adjusted discount rate of 22%. The developed technology will be amortized over an expected useful life of16 years, the period over which the developed technology is expected to generate substantial cash flows.
The acquired in-process research and development asset of $11,600 represents development projects ofadditional polymer dyes. The probability of success associated with the projects, based upon the applicabletechnological and commercial risk, was assumed to be 80% or more, depending upon the project. The projects’fair value was determined based on the present value of projected cash flows utilizing an income approach and arisk-adjusted discount rate of 24% to 26%, depending upon the project.
The $36,614 of goodwill was allocated to the Biosciences segment. Goodwill typically results throughexpected synergies from combining operations of an acquiree and an acquirer as well as from intangible assetsthat do not qualify for separate recognition. The goodwill recognized as a result of this acquisition includes,among other things, the synergies expected from complementing the Company’s instrument and reagent portfoliowith the capabilities of Sirigen’s advanced polymer technology. Additionally, synergies are expected to resultfrom expanding the market for the polymer technology through the Company’s broader global sales organizationand customer relationships. No portion of this goodwill will be deductible for tax purposes. The Companyrecognized $1,300 of acquisition-related costs that were expensed in the current year-to-date period and reportedin the Consolidated Statements of Income as Selling and administrative.
KIESTRA
On February 9, 2012, the Company acquired a 100% interest in KIESTRA Lab Automation BV(“KIESTRA”), a Netherlands-based company that manufactures and sells innovative lab automation solutions forthe microbiology lab. The fair value of consideration transferred was $59,457 which consisted of $50,891 incash, net of $5,176 in cash acquired, as well as $8,566 in contingent consideration that will be paid based uponthe achievement of certain development milestones and performance targets. The fair value of the contingentconsideration was estimated using a probability-weighted discounted cash flow model that was based upon theprobabilities assigned to the contingent events. This acquisition is intended to complement the Company’sexisting portfolio of microbiology platforms, reagents and supplies and allow the Company to offer innovativefull lab automation solutions to hospitals and laboratories worldwide.
The acquisition was accounted for under the acquisition method of accounting for business combinationsand KIESTRA’s results of operations were included in the Diagnostic segment’s results from the acquisitiondate. Pro forma information is not provided as the acquisition did not have a material effect on the Company’sconsolidated results. The following table summarizes the estimated fair values of the assets acquired andliabilities assumed at the acquisition date. These fair values are based upon the information available as of
70

Becton, Dickinson and Company
Notes to Consolidated Financial Statements — (Continued)
September 30, 2012 and may be adjusted should further information regarding events or circumstances existingat the acquisition date become available.
Developed technology . . . . . . . . . . . . . . . . . . . . . . . . . . . . . . . . . . . . . . . . . . . . . . . . . . . . . . $ 12,581
Acquired in-process research and development . . . . . . . . . . . . . . . . . . . . . . . . . . . . . . . . . . . 7,416
Other intangibles . . . . . . . . . . . . . . . . . . . . . . . . . . . . . . . . . . . . . . . . . . . . . . . . . . . . . . . . . . . 4,767
Property, plant and equipment . . . . . . . . . . . . . . . . . . . . . . . . . . . . . . . . . . . . . . . . . . . . . . . . 5,373
Other . . . . . . . . . . . . . . . . . . . . . . . . . . . . . . . . . . . . . . . . . . . . . . . . . . . . . . . . . . . . . . . . . . . . 10,348
Total identifiable assets acquired . . . . . . . . . . . . . . . . . . . . . . . . . . . . . . . . . . . . . . . . . . . . . . 40,485
Deferred tax liabilities . . . . . . . . . . . . . . . . . . . . . . . . . . . . . . . . . . . . . . . . . . . . . . . . . . . . . . (6,191)
Other . . . . . . . . . . . . . . . . . . . . . . . . . . . . . . . . . . . . . . . . . . . . . . . . . . . . . . . . . . . . . . . . . . . . (8,357)
Total liabilities assumed . . . . . . . . . . . . . . . . . . . . . . . . . . . . . . . . . . . . . . . . . . . . . . . . . . . . . (14,548)
Net identifiable assets acquired . . . . . . . . . . . . . . . . . . . . . . . . . . . . . . . . . . . . . . . . . . . . . . . 25,937
Goodwill . . . . . . . . . . . . . . . . . . . . . . . . . . . . . . . . . . . . . . . . . . . . . . . . . . . . . . . . . . . . . . . . . 33,520
Net assets acquired . . . . . . . . . . . . . . . . . . . . . . . . . . . . . . . . . . . . . . . . . . . . . . . . . . . . . . . . . $ 59,457
The developed technology asset of $12,581 represents KIESTRA’s developed lab automation solutions. Thetechnology’s fair value was determined based on the present value of projected cash flows utilizing an incomeapproach which reflected a risk-adjusted discount rate of 14.5%. The technology will be amortized over anexpected useful life of 10 years, the period over which the technology is expected to generate substantial cashflows.
The acquired in-process research and development asset of $7,416 represents development projects of theexisting lab automation technology for use in diagnostic applications. The probability of success associated withthe projects, based upon the applicable technological and commercial risk, was assumed to be 100%. Theprojects’ fair value was determined based on the present value of projected cash flows utilizing an incomeapproach and a risk-adjusted discount rate of 15.5%. The Company expects partial completion of the projects tooccur during fiscal year 2013, and full completion of the projects is expected to occur in fiscal year 2014.
The $33,520 of goodwill was allocated to the Diagnostics segment. Goodwill typically results throughexpected synergies from combining operations of an acquiree and an acquirer as well as from intangible assetsthat do not qualify for separate recognition. The goodwill recognized as a result of this acquisition includes,among other things, the value of integrating the Company’s broad clinical microbiology portfolio throughautomation for maximum workflow efficiency. Synergies are expected to result from the alignment ofKIESTRA’s automated instrumentation technologies with the Company’s existing portfolio of microbiologyplatforms, reagents and supplies. Additionally, synergies are expected to result from expanding the market forfull lab automation solutions into new geographic regions through the Company’s broader global salesorganization and customer relationships. No portion of this goodwill will be deductible for tax purposes. TheCompany recognized $2,000 of acquisition-related costs that were expensed in the current year-to-date periodand reported in the Consolidated Statements of Income as Selling and administrative.
Carmel Pharma
During the fourth quarter of fiscal year 2011, the Company acquired 100% of the outstanding shares ofCarmel Pharma, AB (“Carmel”), a Swedish company that manufactures the BD PhaSeal™ System, a closed-system drug transfer device for the safe handling of hazardous drugs that are packaged in vials. The fair value ofconsideration transferred totaled $287,111, net of $5,047 in cash acquired. The Company intends for thisacquisition to expand the scope of its healthcare worker safety emphasis, especially in the area of parenteralmedication delivery.
71

Becton, Dickinson and Company
Notes to Consolidated Financial Statements — (Continued)
The acquisition was accounted for under the acquisition method of accounting for business combinationsand Carmel’s results of operations were included in the Medical segment’s results from the acquisition date. Proforma information is not provided as the acquisition did not have a material effect on the Company’sconsolidated results. The following table summarizes the estimated fair values of the assets acquired andliabilities assumed at the acquisition date. These fair values are based upon the information available as ofSeptember 30, 2012 and may be adjusted should further information regarding events or circumstances existingat the acquisition date become available.
Product rights . . . . . . . . . . . . . . . . . . . . . . . . . . . . . . . . . . . . . . . . . . . . . . . . . . . . . . . . . . . . . $161,800
Customer relationships . . . . . . . . . . . . . . . . . . . . . . . . . . . . . . . . . . . . . . . . . . . . . . . . . . . . . . 4,100
Deferred tax assets . . . . . . . . . . . . . . . . . . . . . . . . . . . . . . . . . . . . . . . . . . . . . . . . . . . . . . . . . 2,135
Other . . . . . . . . . . . . . . . . . . . . . . . . . . . . . . . . . . . . . . . . . . . . . . . . . . . . . . . . . . . . . . . . . . . . 32,001
Total identifiable assets acquired . . . . . . . . . . . . . . . . . . . . . . . . . . . . . . . . . . . . . . . . . . . . . . 200,036
Deferred tax liabilities . . . . . . . . . . . . . . . . . . . . . . . . . . . . . . . . . . . . . . . . . . . . . . . . . . . . . . (45,035)
Other . . . . . . . . . . . . . . . . . . . . . . . . . . . . . . . . . . . . . . . . . . . . . . . . . . . . . . . . . . . . . . . . . . . . (13,276)
Total liabilities assumed . . . . . . . . . . . . . . . . . . . . . . . . . . . . . . . . . . . . . . . . . . . . . . . . . . . . . (58,311)
Net identifiable assets acquired . . . . . . . . . . . . . . . . . . . . . . . . . . . . . . . . . . . . . . . . . . . . . . . 141,725
Goodwill . . . . . . . . . . . . . . . . . . . . . . . . . . . . . . . . . . . . . . . . . . . . . . . . . . . . . . . . . . . . . . . . . 145,386
Net assets acquired . . . . . . . . . . . . . . . . . . . . . . . . . . . . . . . . . . . . . . . . . . . . . . . . . . . . . . . . . $287,111
The $145,386 of goodwill was allocated to the Medical segment. Goodwill typically results throughexpected synergies from combining operations of an acquiree and an acquirer as well as from intangible assetsthat do not qualify for separate recognition. The goodwill recognized as a result of this acquisition includes,among other things, the value of expanding the Company’s market for healthcare worker safety products.Synergies are expected to result from the alignment of Carmel’s product offerings in the closed-system drugtransfer device market segment with the Company’s existing healthcare worker safety focus, global customerreach, and operational structure. No portion of this goodwill will be deductible for tax purposes. The Companyrecognized $5,250 of acquisition-related costs that were expensed in the current year-to-date period and reportedin the Consolidated Statements of Income as Selling and administrative.
Accuri
On March 17, 2011, the Company acquired 100% of the outstanding shares of Accuri Cytometers, Inc.(“Accuri”), a company that develops and manufactures personal flow cytometers for researchers. The fair valueof consideration transferred totaled $204,970, net of $3,112 in cash acquired.
The Company intends for this acquisition to expand its presence into the emerging affordable personal flowcytometer space. The acquisition is also expected to help expand the use of flow technology by researchers indeveloping regions where ease of use is critical, as well as by researchers in scientific disciplines that have nottraditionally used flow cytometry, such as environmental studies.
The acquisition was accounted for under the acquisition method of accounting for business combinationsand Accuri’s results of operations were included in the Biosciences segment’s results from the acquisition date.Pro forma information is not provided as the acquisition did not have a material effect on the Company’sconsolidated results. The following table summarizes the estimated fair values of the assets acquired andliabilities assumed at the acquisition date. These fair values are based upon the information available as of
72

Becton, Dickinson and Company
Notes to Consolidated Financial Statements — (Continued)
September 30, 2012 and may be adjusted should further information regarding events or circumstances existingat the acquisition date become available.
Developed technology . . . . . . . . . . . . . . . . . . . . . . . . . . . . . . . . . . . . . . . . . . . . . . . . . . . . . . $111,500
Acquired in-process research and development . . . . . . . . . . . . . . . . . . . . . . . . . . . . . . . . . . . 42,300
Other intangibles . . . . . . . . . . . . . . . . . . . . . . . . . . . . . . . . . . . . . . . . . . . . . . . . . . . . . . . . . . 2,850
Deferred tax assets . . . . . . . . . . . . . . . . . . . . . . . . . . . . . . . . . . . . . . . . . . . . . . . . . . . . . . . . . 10,596
Other . . . . . . . . . . . . . . . . . . . . . . . . . . . . . . . . . . . . . . . . . . . . . . . . . . . . . . . . . . . . . . . . . . . . 8,176
Total identifiable assets acquired . . . . . . . . . . . . . . . . . . . . . . . . . . . . . . . . . . . . . . . . . . . . . . 175,422
Deferred tax liabilities . . . . . . . . . . . . . . . . . . . . . . . . . . . . . . . . . . . . . . . . . . . . . . . . . . . . . . (59,188)
Other . . . . . . . . . . . . . . . . . . . . . . . . . . . . . . . . . . . . . . . . . . . . . . . . . . . . . . . . . . . . . . . . . . . . (4,728)
Total liabilities assumed . . . . . . . . . . . . . . . . . . . . . . . . . . . . . . . . . . . . . . . . . . . . . . . . . . . . . (63,916)
Net identifiable assets acquired . . . . . . . . . . . . . . . . . . . . . . . . . . . . . . . . . . . . . . . . . . . . . . . 111,506
Goodwill . . . . . . . . . . . . . . . . . . . . . . . . . . . . . . . . . . . . . . . . . . . . . . . . . . . . . . . . . . . . . . . . . 93,464
Net assets acquired . . . . . . . . . . . . . . . . . . . . . . . . . . . . . . . . . . . . . . . . . . . . . . . . . . . . . . . . . $204,970
The acquired in-process research and development asset of $42,300 represents development of the personalflow cytometry technology that will enable its use in the clinical market. The fair value of this project wasdetermined based on the present value of projected cash flows utilizing an income approach reflecting anappropriate risk-adjusted discount rate based on the applicable technological and commercial risk of the project.The launch of the personal flow cytometer for use in the clinical market is expected to occur in fiscal year 2013,subject to regulatory approvals.
The $93,464 of goodwill was allocated to the Biosciences segment. The goodwill recognized as a result ofthis acquisition includes, among other things, the value of broadening the Company’s potential market for flowcytometry technology. No portion of this goodwill will be deductible for tax purposes. The Company recognized$900 of acquisition-related costs that were expensed in the current year-to-date period and reported in theConsolidated Statements of Income as Selling and administrative.
HandyLab
On November 19, 2009, the Company acquired 100% of the outstanding shares of HandyLab, Inc.(“HandyLab”), a company that develops and manufactures molecular diagnostic assays and automationplatforms. The fair value of consideration transferred totaled $277,610, net of cash acquired, which consisted ofthe following:
Cash . . . . . . . . . . . . . . . . . . . . . . . . . . . . . . . . . . . . . . . . . . . . . . . . . . . . . . . . . . . . . . . . . . . . $274,756
Settlement of preexisting relationship . . . . . . . . . . . . . . . . . . . . . . . . . . . . . . . . . . . . . . . . . . 2,854(A)
Total . . . . . . . . . . . . . . . . . . . . . . . . . . . . . . . . . . . . . . . . . . . . . . . . . . . . . . . . . . . . . . . . . . . . $277,610
(A) The acquisition effectively settled a prepaid asset associated with a pre-existing relationship withHandyLab, as discussed in further detail below.
HandyLab developed and commercialized a flexible automated platform (“Jaguar Plus”) for performingmolecular diagnostics which complements the Company’s molecular diagnostics offerings, specifically in thearea of healthcare-associated infections. The Company is placing its BD GeneOhmTM molecular assays onto theHandyLab platform and intends to market them as the new BD MaxTM System. The Company intends for this
73

Becton, Dickinson and Company
Notes to Consolidated Financial Statements — (Continued)
acquisition to allow further expansion of the BD molecular diagnostic menu and the achievement of revenue andcost synergies.
The acquisition was accounted for under the acquisition method of accounting for business combinationsand HandyLab’s results of operations were included in the Diagnostics segment’s results from the acquisitiondate. Pro forma information was not provided as the acquisition did not have a material effect on the Company’sconsolidated results. The following table summarizes the estimated fair values of the assets acquired andliabilities assumed at the acquisition date. These fair values are based upon the information available as ofSeptember 30, 2012 and may be adjusted should further information regarding events or circumstances existingat the acquisition date become available.
Acquired in-process research and development . . . . . . . . . . . . . . . . . . . . . . . . . . . . . . . . . . . $169,000
Deferred tax assets . . . . . . . . . . . . . . . . . . . . . . . . . . . . . . . . . . . . . . . . . . . . . . . . . . . . . . . . . 23,000
Other . . . . . . . . . . . . . . . . . . . . . . . . . . . . . . . . . . . . . . . . . . . . . . . . . . . . . . . . . . . . . . . . . . . . 8,843
Total identifiable assets acquired . . . . . . . . . . . . . . . . . . . . . . . . . . . . . . . . . . . . . . . . . . . . . . 200,843
Deferred tax liabilities . . . . . . . . . . . . . . . . . . . . . . . . . . . . . . . . . . . . . . . . . . . . . . . . . . . . . . (64,221)
Other . . . . . . . . . . . . . . . . . . . . . . . . . . . . . . . . . . . . . . . . . . . . . . . . . . . . . . . . . . . . . . . . . . . . (6,468)
Total liabilities assumed . . . . . . . . . . . . . . . . . . . . . . . . . . . . . . . . . . . . . . . . . . . . . . . . . . . . . (70,689)
Net identifiable assets acquired . . . . . . . . . . . . . . . . . . . . . . . . . . . . . . . . . . . . . . . . . . . . . . . 130,154
Goodwill . . . . . . . . . . . . . . . . . . . . . . . . . . . . . . . . . . . . . . . . . . . . . . . . . . . . . . . . . . . . . . . . . 147,456
Net assets acquired . . . . . . . . . . . . . . . . . . . . . . . . . . . . . . . . . . . . . . . . . . . . . . . . . . . . . . . . . $277,610
The acquired in-process research and development assets of $169,000 consisted of two projects that werestill in development at the acquisition date: Platform technology for $26,000 and Jaguar Plus technology for$143,000. The Platform technology is incorporated into an automated platform that performs moleculardiagnostics on certain specimens. The Jaguar Plus technology incorporates the Platform technology as well asadditional technology to perform assays or molecular tests. The fair values of these projects were determinedbased on the present value of projected cash flows utilizing an income approach reflecting the appropriate risk-adjusted discount rate based on the applicable technological and commercial risk of each project. During thethird quarter of fiscal year 2010, the Platform technology project was completed, and, as a result, the $26,000associated with this project was reclassified from Other Intangibles, Net to Core and Developed Technology, Netand is being amortized over its estimated useful life of 20 years. Substantially all of the cash flows expected to begenerated from the technology will occur over this period. During the fourth quarter of fiscal year 2012, theJaguar Plus Platform technology project was completed, and, as a result, the $143,000 associated with thisproject was reclassified from Other Intangibles, Net to Core and Developed Technology, Net and is beingamortized over its estimated useful life of 14 years. Substantially all of the cash flows expected to be generatedfrom the technology will occur over this period.
The $147,456 of goodwill was allocated to the Diagnostics segment. The primary item that generatedgoodwill is the value of the Company’s access to HandyLab’s flexible automated platform and expectedsynergies. No portion of this goodwill is expected to be deductible for tax purposes. The Company recognized$2,500 of acquisition-related costs that were expensed in the current period and reported in the ConsolidatedStatements of Income as Selling and administrative.
In May 2009, the Company entered into a twenty-year product development and supply agreement withHandyLab. This agreement provided the Company with access and distribution rights to HandyLab’s proprietarytechnology. Upon executing this agreement, the Company recorded an initial payment for exclusive distributionrights over a twelve-year term. At the acquisition date, the unamortized balance of the recognized prepaid was$2,854. The Company’s acquisition of HandyLab effectively settled the preexisting product development and
74

Becton, Dickinson and Company
Notes to Consolidated Financial Statements — (Continued)
supply agreement. Because the terms of the contract were determined to represent fair value at the acquisitiondate, the Company did not record any gain or loss separately from the acquisition.
Note 10 — Divestitures
On April 10, 2012, the Company signed a definitive agreement to sell its BD Biosciences — DiscoveryLabware unit, excluding its Advanced Bioprocessing platform, to Corning Incorporated, the world leader inspecialty glass and ceramics. This sale was completed on October 31, 2012 and gross cash proceeds from the salewere approximately $728,000, subject to post-closing adjustments. The Company expects to record a gain on thesale within discontinued operations in the first quarter of fiscal year 2013.
Assets held for sale associated with the Discovery Labware disposal group included the following atSeptember 30, 2012:
Inventory . . . . . . . . . . . . . . . . . . . . . . . . . . . . . . . . . . . . . . . . . . . . . . . . . . . . . . . . . . . . . . . . $ 49,818
Other current assets . . . . . . . . . . . . . . . . . . . . . . . . . . . . . . . . . . . . . . . . . . . . . . . . . . . . . . . . 449
Property, plant and equipment, net . . . . . . . . . . . . . . . . . . . . . . . . . . . . . . . . . . . . . . . . . . . . 76,732
Other intangibles, net . . . . . . . . . . . . . . . . . . . . . . . . . . . . . . . . . . . . . . . . . . . . . . . . . . . . . . . 8,858
Assets held for sale . . . . . . . . . . . . . . . . . . . . . . . . . . . . . . . . . . . . . . . . . . . . . . . . . . . . . . . . . $135,857
In the fourth quarter of fiscal year 2010, the Company sold the Ophthalmic Systems unit and the surgicalblades, critical care and extended dwell catheter product platforms for $270,000. The Company recognized apre-tax gain on sale from all of these divestitures of $146,478.
The results of operations associated with the Discovery Labware disposal group, Ophthalmic Systems unit,surgical blade platform and critical care platform are reported as discontinued operations for all periods presentedin the accompanying Consolidated Statements of Income and Cash Flows and related disclosures. The Companyagreed to perform contract manufacturing for a defined period after the sale of the extended dwell catheterproduct platform. The conditions for reporting the results of this platform in discontinued operations were notmet and as such, the associated results of operations were reported within continuing operations and $18,197 ofthe gain on sale from the 2010 divestitures was recognized in Other income (expense).
Results of discontinued operations, which were primarily associated with the Discovery Labware disposalgroup, for the years ended September 30 were as follows:
2012 2011 2010
Revenues . . . . . . . . . . . . . . . . . . . . . . . . . . . . . . . . . . . . . . . . . . . $238,376 $248,016 $415,668
Income from discontinued operations before income taxes . . . . . 91,667 105,310 276,392
Less income tax provision . . . . . . . . . . . . . . . . . . . . . . . . . . . . . . 31,268 35,199 73,626
Income from discontinued operations, net . . . . . . . . . . . . . . . . . . $ 60,399 $ 70,111 $202,766
75

Becton, Dickinson and Company
Notes to Consolidated Financial Statements — (Continued)
Note 11 — Intangible Assets
Other intangible assets at September 30 consisted of:
2012 2011Gross
CarryingAmount
AccumulatedAmortization
GrossCarryingAmount
AccumulatedAmortization
Amortized intangible assets
Core and developed technology . . . . . . . . . $ 856,585 $344,911 $ 685,191 $304,292
Product rights . . . . . . . . . . . . . . . . . . . . . . . 163,465 12,232 152,140 1,268
Patents, trademarks, and other . . . . . . . . . . 325,998 240,036 309,337 230,542
$1,346,048 $597,179 $1,146,668 $536,102
Unamortized intangible assets
Acquired in-process research anddevelopment . . . . . . . . . . . . . . . . . . . . . . $ 61,138 $ 185,300
Trademarks . . . . . . . . . . . . . . . . . . . . . . . . . 2,677 2,669
$ 63,815 $ 187,969
Intangible amortization expense was $71,437, $53,713 and $46,964 in 2012, 2011 and 2010, respectively.The estimated aggregate amortization expense for the fiscal years ending September 30, 2013 to 2017 are asfollows: 2013 — $77,004; 2014 — $77,206; 2015 — $76,029; 2016 — $72,059; 2017 — $69,813.
Note 12 — Derivative Instruments and Hedging Activities
The Company uses derivative instruments to mitigate certain exposures. The effects these derivativeinstruments and hedged items have on financial position, financial performance, and cash flows are providedbelow.
Foreign Currency Risks and Related Strategies
The Company has foreign currency exposures throughout Europe, Asia Pacific, Canada, Japan and LatinAmerica. Transactional currency exposures that arise from entering into transactions, generally on anintercompany basis, in non-hyperinflationary countries that are denominated in currencies other than thefunctional currency are mitigated primarily through the use of forward contracts and currency options. Hedges ofthe transactional foreign exchange exposures resulting primarily from intercompany payables and receivables areundesignated hedges. As such, the gains or losses on these instruments are recognized immediately in income.The offset of these gains or losses against the gains and losses on the underlying hedged items, as well as thehedging costs associated with the derivative instruments, is recognized in Other income (expense).
The total notional amounts of the Company’s outstanding foreign exchange contracts as of September 30,2012 and 2011 were $2,020,698 and $2,209,780, respectively.
From time to time, the Company may partially hedge forecasted export sales denominated in foreigncurrencies using forward and option contracts, generally with one-year terms. The Company’s hedging programhas been designed to mitigate exposures resulting from movements of the U.S. dollar, from the beginning of areporting period, against other foreign currencies. The Company’s strategy is to offset the changes in the presentvalue of future foreign currency revenue resulting from these movements with either gains or losses in the fairvalue of foreign currency derivative contracts. Forward contracts were used to hedge forecasted sales in fiscalyear 2010. The Company did not enter into contracts to hedge cash flows for fiscal year 2011 and 2012 and as ofSeptember 30, 2012, the Company had not entered into such contracts to hedge cash flows for fiscal year 2013.
76

Becton, Dickinson and Company
Notes to Consolidated Financial Statements — (Continued)
Interest Rate Risks and Related Strategies
The Company’s primary interest rate exposure results from changes in U.S. dollar interest rates. TheCompany’s policy is to manage interest cost using a mix of fixed and variable rate debt. The Companyperiodically uses interest rate swaps to manage such exposures. Under these interest rate swaps, the Companyexchanges, at specified intervals, the difference between fixed and floating interest amounts calculated byreference to an agreed-upon notional principal amount. These swaps are designated as either fair value or cashflow hedges.
For interest rate swaps designated as fair value hedges (i.e., hedges against the exposure to changes in thefair value of an asset or a liability or an identified portion thereof that is attributable to a particular risk), changesin the fair value of the interest rate swaps offset changes in the fair value of the fixed rate debt due to changes inmarket interest rates.
Changes in the fair value of the interest rate swaps designated as cash flow hedges (i.e., hedging theexposure to variability in expected future cash flows that is attributable to a particular risk) are offset by amountsrecorded in Other comprehensive income (loss). If interest rate derivatives designated as cash flow hedges areterminated, the balance in Accumulated other comprehensive income (loss) attributable to those derivatives isreclassified into earnings over the remaining life of the hedged debt. The amount, related to terminated interestrate swaps, expected to be reclassified and recorded in Interest expense within the next 12 months is $5,370, netof tax.
The total notional amounts of the Company’s outstanding interest rate swaps designated as fair value hedgeswere $200,000 at both September 30, 2012 and September 30, 2011. The outstanding swap represents afixed-to-floating rate swap agreement that was entered into to convert the interest payments on $200,000 in4.55% notes, due April 15, 2013, from the fixed rate to a floating interest rate based on LIBOR.
The Company had no outstanding interest rate swaps designated as cash flow hedges as of September 30,2012. The total notional amount of the Company’s outstanding interest rate swaps designated as cash flowhedges as of September 30, 2011 was $900,000 and included forward starting fixed-to-floating rate swapagreements under which the Company agreed to pay a fixed interest rate and receive a floating interest rate basedon LIBOR, subject to mandatory termination and cash settlement on the forward start date. These hedges wereentered into during the fourth quarter of fiscal year 2011 in anticipation of issuing new long-term debt in the firstquarter of fiscal year 2012. Their purpose was to partially hedge the risk of changes in interest paymentsattributable to changes in the benchmark interest rate (the U.S. Dollar LIBOR swap rate) against which the debtwas issued. These swaps were terminated on November 3, 2011, concurrent with the issuance of the new long-term debt. Additional disclosures regarding the Company’s issuance of debt in the first quarter of fiscal year2012 are included in Note 14.
Other Risk Exposures
The Company purchases resins, which are oil-based components used in the manufacture of certainproducts. Significant increases in world oil prices that lead to increases in resin purchase costs could impactfuture operating results. From time to time, the Company has managed price risks associated with thesecommodity purchases. The Company had no commodity forward contracts outstanding as of September 30,2011. In July 2012, the Company entered into cash-settled forward contracts to hedge approximately 16% of itsexpected global resin purchase volumes in fiscal year 2013. These contracts were designated as cash flow hedgesand the total notional amount of these contracts at September 30, 2012 was $22,534.
77

Becton, Dickinson and Company
Notes to Consolidated Financial Statements — (Continued)
Effects on Consolidated Balance Sheets
The location and amounts of derivative instrument fair values in the consolidated balance sheet aresegregated below between designated, qualifying hedging instruments and ones that are not designated for hedgeaccounting.
September 30,2012
September 30,2011
Asset derivatives-designated for hedge accounting
Interest rate swap . . . . . . . . . . . . . . . . . . . . . . . . . . . . . . . . . . . . . . . . . $ 2,353 $ 5,959
Asset derivatives-undesignated for hedge accounting
Forward exchange contracts . . . . . . . . . . . . . . . . . . . . . . . . . . . . . . . . . $17,197 $ 37,198
Total asset derivatives(A) . . . . . . . . . . . . . . . . . . . . . . . . . . . . . . . . . . . . $19,550 $ 43,157
Liability derivatives-designated for hedge accounting
Interest rate swaps . . . . . . . . . . . . . . . . . . . . . . . . . . . . . . . . . . . . . . . . $ — $ 69,103
Commodity forward contracts . . . . . . . . . . . . . . . . . . . . . . . . . . . . . . . 1,666 —
Total liability derivatives-designated for hedge accounting . . . . . . . . . . $ 1,666 $ 69,103
Liability derivatives-undesignated for hedge accounting
Forward exchange contracts . . . . . . . . . . . . . . . . . . . . . . . . . . . . . . . . . $16,563 $ 39,589
Total liability derivatives(B) . . . . . . . . . . . . . . . . . . . . . . . . . . . . . . . . . . $18,229 $108,692
(A) All asset derivatives are included in Prepaid expenses, deferred taxes and other.
(B) All liability derivatives are included in Accrued expenses.
Effects on Consolidated Statements of Income
Cash flow hedges
The location and amount of gains and losses on designated derivative instruments recognized in theconsolidated statement of income for the years ended September 30, consisted of:
Derivatives Accountedfor as Designated
Cash Flow HedgingRelationships
Gain (Loss) Recognized in OCI onDerivatives, Net of Tax
Location of Gain(Loss)
Reclassified fromAccumulated OCI
into Income
Gain (Loss) Reclassified fromAccumulated OCI into Income
2012 2011 2010 2012 2011 2010
Forward exchangecontracts . . . . . . . . . . . . . . . $ — $ — $43,624 Revenues $ — $ — $(31,471)
Interest rate swaps . . . . . . . . . 5,746 (33,200) 1,238 Interest expense (7,871) (1,656) (1,996)
Commodity forwardcontracts . . . . . . . . . . . . . . . (1,033) — 22 Cost of products sold — — (35)
Total . . . . . . . . . . . . . . . . . . . . $ 4,713 $(33,200) $44,884 $(7,871) $(1,656) $(33,502)
The Company’s designated derivative instruments are highly effective. As such, there were no gains orlosses, related to hedge ineffectiveness or amounts excluded from hedge effectiveness testing, recognizedimmediately in income relative to these swaps for the years ended September 30, 2012, 2011 and 2010.
The amounts recorded in Other comprehensive income (loss) on interest rate swaps for fiscal year 2012,2011, and 2010 included amortization of amounts related to terminated hedges. The gain recorded in Other
78

Becton, Dickinson and Company
Notes to Consolidated Financial Statements — (Continued)
comprehensive income (loss) for fiscal year 2012 also included the increase in the value of interest rate swapsentered into during the fourth quarter of fiscal year 2011 to partially hedge interest rate risk associated with theanticipated issuance of $500,000 of 5-year 1.75% notes and $1,000,000 of 10-year 3.125% notes in the firstquarter of fiscal year 2012. These swaps were designated as hedges of the variability in interest paymentsattributable to changes in the benchmark interest rates against which the long-term debt was priced and they wereterminated at a loss in November 2011, concurrent with the pricing of the notes.
The loss recognized in Other comprehensive income (loss) for interest rate swaps for fiscal year 2011included unrealized losses, due to a decrease in fair market value, on the interest rate swaps discussed above.These unrealized losses on the interest rate swaps entered into during the fourth quarter of 2011 were partiallyoffset by gains realized on interest rate swaps that were entered into in the first quarter of 2011 in anticipation ofissuing $700,000 of 10-year 3.25% notes and $300,000 of 30-year 5.00% notes. These swaps were designated ashedges of the variability in interest payments attributable to changes in the benchmark interest rates againstwhich the long-term debt was priced and they were terminated at a gain in November 2010, concurrent with thepricing of the notes.
The realized gains and losses on the swaps terminated in both November 2011 and 2010 will be amortizedover the lives of the notes with an offset to interest expense. Additional disclosures regarding the issuances ofdebt in the first quarters of fiscal years 2012 and 2011 are included in Note 14.
Fair value hedge
The location and amount of gains or losses on the hedged fixed rate debt attributable to changes in themarket interest rates and the offsetting gain (loss) on the related interest rate swap for the years endedSeptember 30 were as follows:
Income StatementClassification
Gain/(Loss) on Swap Gain/(Loss) on Borrowings2012 2011 2010 2012 2011 2010
Other income (expense)(A) . . . . . . . . $(3,607) $(2,650) $6,638 $3,607 $2,650 $(6,638)
(A) Changes in the fair value of the interest rate swap offset changes in the fair value of the fixed rate debt dueto changes in market interest rates. There was no hedge ineffectiveness relating to this interest rate swap.
Undesignated hedges
The location and amount of gains and losses recognized in income on derivatives not designated for hedgeaccounting for the years ended September 30 were as follows:
Derivatives NotDesignated as
For Hedge Accounting
Location of Gain (Loss)Recognized in Income on
Derivatives
Amount of Gain (Loss)Recognized in Income on
Derivative2012 2011 2010
Forward exchange contracts(B) . . Other income (expense) $(6,801) $(1,443) $(6,606)
(B) The gains and losses on forward contracts and currency options utilized to hedge the intercompanytransactional foreign exchange exposures are largely offset by gains and losses on the underlying hedgeditems in Other (expense) income.
79

Becton, Dickinson and Company
Notes to Consolidated Financial Statements — (Continued)
Note 13 — Financial Instruments and Fair Value Measurements
Recurring Fair Value Measurements
The fair values of financial instruments, including those not recognized on the statement of financialposition at fair value, carried at September 30, 2012 and 2011 are classified in accordance with the fair valuehierarchy in the tables below:
Basis of Fair Value Measurement
September 30,2012Total
Quoted Prices inActive Markets
for IdenticalAssets (Level 1)
SignificantOther
ObservableInputs (Level 2)
SignificantUnobservable
Inputs (Level 3)
Assets
Institutional money marketinvestments . . . . . . . . . . . . . . $1,065,629 $1,065,629 $ — $ —
Forward exchange contracts . . . 17,197 — 17,197 —
Interest rate swap . . . . . . . . . . . . 2,353 — 2,353 —
Total Assets . . . . . . . . . . . . . . $1,085,179 $1,065,629 $ 19,550 $ —
Liabilities
Forward exchange contracts . . . $ 16,563 $ — $ 16,563 $ —
Commodity forwardcontracts . . . . . . . . . . . . . . . . . 1,666 — 1,666 —
Contingent considerationliabilities . . . . . . . . . . . . . . . . 20,261 — — 20,261
Total Liabilities . . . . . . . . . . . $ 38,490 $ — $ 18,229 $20,261
Basis of Fair Value Measurement
September 30,2011Total
Quoted Prices inActive Markets
for IdenticalAssets (Level 1)
SignificantOther
ObservableInputs (Level 2)
SignificantUnobservable
Inputs (Level 3)
Assets
Institutional money marketinvestments . . . . . . . . . . . . . . $ 590,515 $ 590,515 $ — $ —
Forward exchange contracts . . . 37,198 — 37,198 —
Interest rate swap . . . . . . . . . . . . 5,959 — 5,959 —
Total Assets . . . . . . . . . . . . . . $ 633,672 $ 590,515 $ 43,157 $ —
Liabilities
Forward exchange contracts . . . $ 39,589 $ — $ 39,589 $ —
Interest rate swaps . . . . . . . . . . . 69,103 — 69,103 —
Total Liabilities . . . . . . . . . . . $ 108,692 $ — $108,692 $ —
The Company’s institutional money market accounts permit daily redemption and the fair values of theseinvestments are based upon the quoted prices in active markets provided by the holding financial institutions.The Company’s remaining cash equivalents totaling $605,536 and $584,767 at September 30, 2012 and 2011,respectively. Short-term investments are held to their maturities and are carried at cost, which approximates fair
80

Becton, Dickinson and Company
Notes to Consolidated Financial Statements — (Continued)
value. The cash equivalents consist of liquid investments with a maturity of three months or less and the short-term investments consist of instruments with maturities greater than three months and less than one year.
The Company measures the fair value of forward exchange contracts and currency options using an incomeapproach with significant observable inputs, specifically spot currency rates, market designated forward currencyprices and a discount rate. The fair value of interest rate swaps are provided by the financial institutions that arecounterparties to these arrangements.
Long-term debt is recorded at amortized cost. The fair value of long-term debt is measured based uponquoted prices in active markets for similar instruments, which are considered Level 2 inputs in the fair valuehierarchy. The fair value of long-term debt was $4,317,059 and $2,839,697 at September 30, 2012 and 2011,respectively. The fair value of $200,000 of 4.55% notes due on April 15, 2013, that were reclassified from long-term debt to short-term debt during the third quarter of fiscal year 2012, was $206,452 at September 30, 2012.
The contingent consideration liabilities were recognized as part of the consideration transferred in theCompany’s acquisition of KIESTRA, which occurred in the second quarter of fiscal year 2012, and in theCompany’s fourth quarter 2012 acquisition of Sirigen. The fair value of the contingent consideration liability wasestimated using a probability-weighted discounted cash flow model that was based upon the probabilitiesassigned to the contingent events. The estimated fair value of the contingent consideration liability is remeasuredat each reporting period based upon increases or decreases in the probability of the contingent payments. Thechange to the contingent consideration liabilities during fiscal year 2012 primarily relates to KIESTRA and islargely attributable to foreign currency translation. Additional disclosures regarding the contingent considerationliability are included in Note 9.
The Company’s policy is to recognize any transfers into fair value measurement hierarchy levels andtransfers out of levels at the beginning of each reporting period. There were no transfers in and out of Level 1,Level 2 or Level 3 measurements for the years ending September 30, 2012 and 2011.
Nonrecurring Fair Value Measurements
In the fourth quarter of fiscal year 2011, the Company recorded an impairment charge of $9,270, which wasrecorded to Research and development expense, resulting from its discontinuance of a research program withinthe Diagnostic Systems unit. Based upon an assessment using significant unobservable inputs and the lack ofalternative uses for these assets, the assets were determined to have no fair value.
Concentration of Credit Risk
The Company maintains cash deposits in excess of government-provided insurance limits. Such cashdeposits are exposed to loss in the event of nonperformance by financial institutions. Substantially all of theCompany’s trade receivables are due from public and private entities involved in the healthcare industry. Due tothe large size and diversity of the Company’s customer base, concentrations of credit risk with respect to tradereceivables are limited. The Company does not normally require collateral. The Company is exposed to creditloss in the event of nonperformance by financial institutions with which it conducts business. However, this lossis limited to the amounts, if any, by which the obligations of the counterparty to the financial instrument contractexceed the obligations of the Company. The Company also minimizes exposure to credit risk by dealing with adiversified group of major financial institutions.
Accounts receivable balances include sales to government-owned or government-supported healthcare facilitiesin several countries, which are subject to delays. Payment is dependent upon the financial stability and creditworthinessof those countries’ national economies. Deteriorating credit and economic conditions in parts of Western Europe,particularly in Italy and Spain, may continue to increase the average length of time it takes the Company to collect itsaccounts receivable in certain regions within these countries. Outstanding governmental receivable balances, net ofreserves, in Italy and Spain at September 30, 2012 were $71,390 and $42,866, respectively.
81

Becton, Dickinson and Company
Notes to Consolidated Financial Statements — (Continued)
The Company continually evaluates all governmental receivables for potential collection risks associatedwith the availability of government funding and reimbursement practices. The Company believes the currentreserves related to all governmental receivables are adequate and that this concentration of credit risk will nothave a material adverse impact on its financial position or liquidity.
Note 14 — Debt
Short-term debt at September 30 consisted of:
2012 2011
Loans Payable
Domestic . . . . . . . . . . . . . . . . . . . . . . . . . . . . . . . . . . . . . . . . . . . . . . . . . . . . $200,000 $200,000
Foreign . . . . . . . . . . . . . . . . . . . . . . . . . . . . . . . . . . . . . . . . . . . . . . . . . . . . . 2,738 34,910
Current portion of long-term debt . . . . . . . . . . . . . . . . . . . . . . . . . . . . . . . . . . . 202,404 22
$405,142 $234,932
Domestic loans payable consist of commercial paper. Foreign loans payable consist of short-termborrowings from financial institutions. The weighted average interest rates for short-term debt were 1.35% and1.20% at September 30, 2012 and 2011, respectively. The Company has available a $1 billion syndicated creditfacility with an expiration date of May 2017. This credit facility provides backup support for the commercialpaper program and can also be used for other general corporate purposes. The credit facility includes a provisionthat enables the Company, subject to additional commitments made by the lenders, to access up to an additional$500,000 in financing through the facility, for a maximum aggregate commitment of $1.5 billion. The creditfacility also includes a restrictive covenant that requires a minimum interest coverage ratio, with which theCompany was in compliance at September 30, 2012. There were no borrowings outstanding under the facility atSeptember 30, 2012. In addition, the Company had short-term foreign lines of credit pursuant to informalarrangements of approximately $309,481 at September 30, 2012, almost all of which was unused.
On November 3, 2011, the Company issued $500,000 of 5-year 1.75% notes and $1 billion of 10-year3.125% notes. The net proceeds from these issuances have been used for general corporate purposes, which mayinclude funding for working capital, capital expenditures, repurchases of the Company’s common stock andacquisitions. On November 8, 2010, the Company issued $700,000 of 10-year 3.25% notes and $300,000 of30-year 5.00% notes. The net proceeds from these issuances have been used for general corporate purposes,including funding for working capital, capital expenditures, repurchases of the Company’s common stock andacquisitions.
82

Becton, Dickinson and Company
Notes to Consolidated Financial Statements — (Continued)
Long-Term Debt at September 30 consisted of:2012 2011
Domestic notes due through 2014 (average year-end interest rate:
4.89% — 2012; 1.05% — 2011) . . . . . . . . . . . . . . . . . . . . . . . . . . . . . . . . $ 4 $ 8,0304.55% Notes due April 15, 2013 . . . . . . . . . . . . . . . . . . . . . . . . . . . . . . . . . . — 205,5811.75% Notes due November 8, 2016 . . . . . . . . . . . . . . . . . . . . . . . . . . . . . . . 497,388 —4.90% Notes due April 15, 2018 . . . . . . . . . . . . . . . . . . . . . . . . . . . . . . . . . . 203,595 204,1645.00% Notes due May 15, 2019 . . . . . . . . . . . . . . . . . . . . . . . . . . . . . . . . . . . 495,319 494,7433.25% Notes due November 12, 2020 . . . . . . . . . . . . . . . . . . . . . . . . . . . . . . 695,895 695,4613.125% Notes due November 8, 2021 . . . . . . . . . . . . . . . . . . . . . . . . . . . . . . 992,100 —7.00% Debentures due August 1, 2027 . . . . . . . . . . . . . . . . . . . . . . . . . . . . . 168,000 168,0006.70% Debentures due August 1, 2028 . . . . . . . . . . . . . . . . . . . . . . . . . . . . . 167,050 167,0506.00% Notes due May 15, 2039 . . . . . . . . . . . . . . . . . . . . . . . . . . . . . . . . . . . 245,478 245,4135.00% Notes due November 12, 2040 . . . . . . . . . . . . . . . . . . . . . . . . . . . . . . 296,283 296,223
$3,761,112 $2,484,665
Long-term debt balances at September 30, 2012 and 2011 have been impacted by certain interest rate swapsthat have been designated as fair value hedges, as discussed in Note 12.
The aggregate annual maturities of long-term debt during the fiscal years ending September 30, 2013 to2017 are as follows: 2013 — $202,404; 2014 — $3; 2015 — $0; 2016 — $0; 2017 — $497,388.
The Company capitalizes interest costs as a component of the cost of construction in progress. A summaryof interest costs and payments for the years ended September 30 is as follows:
2012 2011 2010
Charged to operations . . . . . . . . . . . . . . . . . . . . . . . . . . . . . . . . . . . . . $134,658 $ 84,019 $51,263
Capitalized . . . . . . . . . . . . . . . . . . . . . . . . . . . . . . . . . . . . . . . . . . . . . . 34,350 37,929 36,436
Total interest costs . . . . . . . . . . . . . . . . . . . . . . . . . . . . . . . . . . . . . . . . $169,008 $121,948 $87,699
Interest paid, net of amounts capitalized . . . . . . . . . . . . . . . . . . . . . . . $118,842 $ 68,447 $58,401
Note 15 — Income Taxes
The provision for income taxes from continuing operations for the years ended September 30 consisted of:2012 2011 2010
Current:Federal . . . . . . . . . . . . . . . . . . . . . . . . . . . . . . . . . . . . . . . . . . . . . . $164,302 $168,226 $290,071State and local, including Puerto Rico . . . . . . . . . . . . . . . . . . . . . 9,710 21,441 21,979Foreign . . . . . . . . . . . . . . . . . . . . . . . . . . . . . . . . . . . . . . . . . . . . . . 241,055 210,720 155,808
$415,067 $400,387 $467,858
Deferred:Domestic . . . . . . . . . . . . . . . . . . . . . . . . . . . . . . . . . . . . . . . . . . . . $ (29,279) $ (15,483) $ (32,648)Foreign . . . . . . . . . . . . . . . . . . . . . . . . . . . . . . . . . . . . . . . . . . . . . . (22,908) 32,100 16,687
(52,187) 16,617 (15,961)
$362,880 $417,004 $451,897
83

Becton, Dickinson and Company
Notes to Consolidated Financial Statements — (Continued)
The components of Income From Continuing Operations Before Income Taxes for the years endedSeptember 30 consisted of:
2012 2011 2010
Domestic, including Puerto Rico . . . . . . . . . . . . . . . . . . . . . . . $ 604,760 $ 843,068 $ 838,667
Foreign . . . . . . . . . . . . . . . . . . . . . . . . . . . . . . . . . . . . . . . . . . . 867,648 774,819 728,074
$1,472,408 $1,617,887 $1,566,741
Deferred tax assets and liabilities are netted on the balance sheet by separate tax jurisdictions. AtSeptember 30, 2012 and 2011, net current deferred tax assets of $253,577 and $287,143, respectively, wereincluded in Prepaid expenses, deferred taxes and other. Net non-current deferred tax assets of $137,294 and$111,786, respectively, were included in Other. Net current deferred tax liabilities of $3,882 and $7,522,respectively, were included in Current Liabilities — Income taxes. Net non-current deferred tax liabilities of$72,330 and $58,553, respectively, were included in Deferred Income Taxes and Other. Deferred taxes are notprovided on undistributed earnings of foreign subsidiaries that are indefinitely reinvested. At September 30,2012, the cumulative amount of such undistributed earnings indefinitely reinvested outside the United States was$4.4 billion. Determining the tax liability that would arise if these earnings were remitted is not practicable.Deferred taxes are provided for earnings outside the United States when those earnings are not consideredindefinitely reinvested.
The following table summarizes the gross amounts of unrecognized tax benefits without regard to reductionin tax liabilities or additions to deferred tax assets and liabilities if such unrecognized tax benefits were settled:
2012 2011 2010
Balance at October 1 . . . . . . . . . . . . . . . . . . . . . . . . . . . . . . . . . . . . . $135,494 $ 90,064 $ 50,547
Increase due to current year tax positions . . . . . . . . . . . . . . . . . . . . . 36,723 37,792 27,662
Increase due to prior year tax positions . . . . . . . . . . . . . . . . . . . . . . . 4,114 12,349 25,837
Decreases due to prior year tax positions . . . . . . . . . . . . . . . . . . . . . . (3,423) (1,815) (11,509)
Decrease due to settlements and lapse of statute of limitations . . . . . (17,465) (2,896) (2,473)
Balance at September 30 . . . . . . . . . . . . . . . . . . . . . . . . . . . . . . . . . . $155,443 $135,494 $ 90,064
The total amount of unrecognized tax benefits, if recognized, would favorably impact the effective tax rate.Included in the above total is approximately $9,821 of interest and penalties, of which approximately $844 arereflected in the current year statement of operations. The Company includes interest and penalties associated withunrecognized tax benefits as a component of the Income tax provision on the Consolidated Statements of Income.The Company expects changes in the aggregate amount of unrecognized tax benefits that may occur within thenext twelve months to be similar to the changes that occurred in the prior twelve months.
The Company conducts business and files tax returns in numerous countries and currently has tax audits inprogress in a number of tax jurisdictions. The IRS has completed its audit for the tax years through 2008. For theCompany’s other major tax jurisdictions where it conducts business, the Company’s tax years are generally openafter 2006.
84

Becton, Dickinson and Company
Notes to Consolidated Financial Statements — (Continued)
Deferred income taxes at September 30 consisted of:2012 2011
Assets Liabilities Assets Liabilities
Compensation and benefits . . . . . . . . . . . . . . . . $ 606,370 $ — $ 590,311 $ —
Property and equipment . . . . . . . . . . . . . . . . . . — 435,334 — 433,163
Loss and credit carryforwards . . . . . . . . . . . . . . 181,107 — 85,731 —
Other . . . . . . . . . . . . . . . . . . . . . . . . . . . . . . . . . 339,751 218,559 360,893 218,571
1,127,228 653,893 1,036,935 651,734
Valuation allowance . . . . . . . . . . . . . . . . . . . . . (158,676) — (52,347) —
$ 968,552 $653,893 $ 984,588 $651,734
Valuation allowances have been established as a result of an evaluation of the uncertainty associated withthe realization of certain deferred tax assets. The change in the valuation allowance for 2012 is primarily theresult of foreign losses due to the Company’s global re-organization of its foreign entities and these generallyhave no expiration date. Valuation allowances are also maintained with respect to deferred tax assets for certainfederal and state carryforwards that may not be realized and that principally expire between 2013 and 2014.
A reconciliation of the federal statutory tax rate to the Company’s effective tax rate was as follows:2012 2011 2010
Federal statutory tax rate . . . . . . . . . . . . . . . . . . . . . . . . . . . . . . . . . . . . . . . . . 35.0% 35.0% 35.0%
State and local income taxes, net of federal tax benefit . . . . . . . . . . . . . . . . . . 0.2 1.2 1.0
Effect of foreign and Puerto Rico earnings and foreign tax credits . . . . . . . . . (8.2) (7.5) (5.6)
Effect of Research Credits and Domestic Production Activities, . . . . . . . . . . (1.7) (2.7) (1.7)
Other, net . . . . . . . . . . . . . . . . . . . . . . . . . . . . . . . . . . . . . . . . . . . . . . . . . . . . . (0.7) (0.2) 0.1
24.6% 25.8% 28.8%
The approximate amounts of tax reductions related to tax holidays in various countries in which theCompany does business were $83,240, $60,275 and $51,300, in 2012, 2011 and 2010, respectively. The taxholidays expire at various dates through 2026.
The Company made income tax payments, net of refunds, of $217,724 in 2012, $512,092 in 2011 and$391,965 in 2010.
Note 16 — Supplemental Financial Information
Other Income (Expense), Net
Other income (expense), net in 2012 was $(1,152), which primarily included equity investment net incomeand proceeds from investments of $12,084 as well as income from license and other agreements of $5,491. Theseamounts were partially offset by foreign exchange losses (inclusive of hedging costs) of $(19,331).
Other income (expense), net in 2011 was $(7,164), which primarily included gains recognized on the sale ofassets of $1,902, equity investment net income of $3,017 and income from license and other agreements of$4,479, partially offset by foreign exchange losses (inclusive of hedging costs) of $(13,144) and the write-downof investments of $(3,304).
Other income (expense), net in 2010 was $497, which primarily included the gain recognized on the sale ofthe extended dwell catheter product platform of $18,039, equity investment income of $4,848 and income fromlicense and other agreements of $6,063, partially offset by foreign exchange losses (inclusive of hedging costs) of$(14,756) and the write-down of investments of $(14,024).
85

Becton, Dickinson and Company
Notes to Consolidated Financial Statements — (Continued)
Trade Receivables, Net
Allowances for doubtful accounts and cash discounts netted against trade receivables were $44,959 and$43,283 at September 30, 2012 and 2011, respectively. The amounts recognized in 2012, 2011 and 2010 relatingto these valuation accounts are provided in the following table:
Allowance forDoubtfulAccounts
Allowance forCash Discounts Total
Balance at September 30, 2009 . . . . . . . . . . . . . . . . . . . . . $ 40,285 $ 8,224 $ 48,509
Additions charged to costs and expenses . . . . . . . . . . . . 6,487 31,944 38,431
Deductions and other . . . . . . . . . . . . . . . . . . . . . . . . . . . (6,373)(A) (34,249) (40,622)
Balance at September 30, 2010 . . . . . . . . . . . . . . . . . . . . . $ 40,399 $ 5,919 $ 46,318
Additions charged to costs and expenses . . . . . . . . . . . . 12,510 26,147 38,657
Deductions and other . . . . . . . . . . . . . . . . . . . . . . . . . . . (17,360)(A) (24,332) (41,692)
Balance at September 30, 2011 . . . . . . . . . . . . . . . . . . . . . $ 35,549 $ 7,734 $ 43,283
Additions charged to costs and expenses . . . . . . . . . . . . 6,277 39,008 45,285
Deductions and other . . . . . . . . . . . . . . . . . . . . . . . . . . . (6,166)(A) (37,443) (43,609)
Balance at September 30, 2012 . . . . . . . . . . . . . . . . . . . . . $ 35,660 $ 9,299 $ 44,959
(A) Accounts written off.
Inventories
Inventories at September 30 consisted of:
2012 2011
Materials . . . . . . . . . . . . . . . . . . . . . . . . . . . . . . . . . . . . . . . . . . . . . . . . . . . $ 200,514 $ 176,955
Work in process . . . . . . . . . . . . . . . . . . . . . . . . . . . . . . . . . . . . . . . . . . . . . 247,217 233,538
Finished products . . . . . . . . . . . . . . . . . . . . . . . . . . . . . . . . . . . . . . . . . . . . 792,948 834,479
$1,240,679 $1,244,972
Property, Plant and Equipment, Net
Property, Plant and Equipment, Net at September 30 consisted of:
2012 2011
Land . . . . . . . . . . . . . . . . . . . . . . . . . . . . . . . . . . . . . . . . . . . . . . . . . . . . . . $ 102,385 $ 98,418
Buildings . . . . . . . . . . . . . . . . . . . . . . . . . . . . . . . . . . . . . . . . . . . . . . . . . . . 2,193,919 2,153,362
Machinery, equipment and fixtures . . . . . . . . . . . . . . . . . . . . . . . . . . . . . . 4,669,431 4,549,805
Leasehold improvements . . . . . . . . . . . . . . . . . . . . . . . . . . . . . . . . . . . . . . 80,310 78,624
7,046,045 6,880,209
Less accumulated depreciation and amortization . . . . . . . . . . . . . . . . . . . . 3,742,117 3,669,012
$3,303,928 $3,211,197
86

Becton, Dickinson and Company
SUPPLEMENTARY DATA (UNAUDITED)
20121st 2nd 3rd 4th Year
Thousands of dollars, except per share amounts
Revenues . . . . . . . . . . . . . . . . . . . . . . . . . . . . $1,831,720 $1,928,961 $1,980,530 $1,967,171 $7,708,382
Gross Profit . . . . . . . . . . . . . . . . . . . . . . . . . . 931,255 987,777 1,033,135 1,000,826 3,952,994
Income from Continuing Operations . . . . . . 248,544 275,124 311,581 274,278 1,109,528
Net Income . . . . . . . . . . . . . . . . . . . . . . . . . . 262,985 291,033 326,866 289,043 1,169,927
Earnings per Share(A):
Income from Continuing Operations . . . . 1.16 1.33 1.54 1.38 5.40
Income from Discontinued Operations . . . 0.07 0.08 0.08 0.07 0.29
Basic Earnings per Share . . . . . . . . . . . . . . 1.23 1.41 1.62 1.45 5.69
Income from Continuing Operations . . . . 1.14 1.31 1.52 1.35 5.30
Income from Discontinued Operations . . . 0.07 0.08 0.07 0.07 0.29
Diluted Earnings per Share . . . . . . . . . . . . 1.21 1.39 1.59 1.43 5.59
20111st 2nd 3rd 4th Year
Revenues . . . . . . . . . . . . . . . . . . . . . . . . . . . . $1,783,353 $1,860,614 $1,951,889 $1,988,181 $7,584,037
Gross Profit . . . . . . . . . . . . . . . . . . . . . . . . . . 943,187 969,352 1,029,237 1,017,140 3,958,915
Income from Continuing Operations . . . . . . 298,446 295,850 321,540 285,047 1,200,883
Net Income . . . . . . . . . . . . . . . . . . . . . . . . . . 315,937 312,019 343,058 299,980 1,270,994
Earnings per Share(A):
Income from Continuing Operations . . . . 1.31 1.34 1.47 1.32 5.43
Income from Discontinued Operations . . . 0.08 0.07 0.10 0.07 0.32
Basic Earnings per Share . . . . . . . . . . . . . . 1.39 1.41 1.57 1.38 5.75
Income from Continuing Operations . . . . 1.28 1.31 1.44 1.29 5.31
Income from Discontinued Operations . . . 0.08 0.07 0.10 0.07 0.31
Diluted Earnings per Share . . . . . . . . . . . . 1.36 1.38 1.53 1.36 5.62
Certain quarterly amounts may not add to the year-to-date totals due to rounding.
(A) Total amounts may not add due to rounding.
87

Item 9. Changes in and Disagreements With Accountants on Accounting and Financial Disclosure.
None.
Item 9A. Controls and Procedures.
An evaluation was conducted by BD’s management, with the participation of BD’s Chief Executive Officerand Chief Financial Officer, of the effectiveness of the design and operation of BD’s disclosure controls andprocedures (as defined in Rule 13a-15(e) under the Securities Exchange Act of 1934) as of September 30, 2012.Based upon that evaluation, the Chief Executive Officer and Chief Financial Officer concluded that the designand operation of these disclosure controls and procedures were, as of the end of the period covered by this report,effective and designed to ensure that material information relating to BD and its consolidated subsidiaries wouldbe made known to them by others within these entities. There were no changes in BD’s internal control overfinancial reporting during the fiscal quarter ended September 30, 2012 identified in connection with the above-referenced evaluations that has materially affected, or is reasonably likely to materially affect, the internal controlover financial reporting.
Management’s Report on Internal Control Over Financial Reporting and the Report of IndependentRegistered Public Accounting Firm are contained in Item 8, Financial Statements and Supplementary Data, andare incorporated herein by reference.
Item 9B. Other Information.
Not applicable.
PART III
Item 10. Directors, Executive Officers and Corporate Governance.
The information relating to directors and the Audit Committee of the BD Board of Directors required by thisitem will be contained under the captions “Proposal 1. Election of Directors” and “Board of Directors —Committee Membership and Function — Audit Committee” in a definitive proxy statement involving theelection of directors, which the registrant will file with the SEC not later than 120 days after September 30, 2012(the “2013 Proxy Statement”), and such information is incorporated herein by reference.
The information relating to executive officers required by this item is included herein in Part I under thecaption “Executive Officers of the Registrant.”
Certain other information required by this item will be contained under the captions “Ownership of BDCommon Stock — Section 16(a) Beneficial Ownership Reporting Compliance” and “Corporate Governance —Code of Conduct” in BD’s 2013 Proxy Statement, and such information is incorporated herein by reference.
Item 11. Executive Compensation.
The information required by this item will be contained under the captions “Board of Directors — Non-Management Directors’ Compensation,” “Compensation Discussion and Analysis,” “Report of the Compensationand Benefits Committee,” and “Compensation of Named Executive Officers” in BD’s 2013 Proxy Statement, andsuch information is incorporated herein by reference.
Item 12. Security Ownership of Certain Beneficial Owners and Management and Related StockholderMatters.
The information required by this item will be contained under the caption “Ownership of BD CommonStock” in BD’s 2013 Proxy Statement, and such information is incorporated herein by reference.
Item 13. Certain Relationships and Related Transactions, and Director Independence.
The information required by this item will be contained under the caption “Corporate Governance —Director Independence; Policy Regarding Related Person Transactions” in BD’s 2013 Proxy Statement, and suchinformation is incorporated herein by reference.
88

Item 14. Principal Accounting Fees and Services.
The information required by this item will be contained under the caption “Proposal 2. Ratification ofSelection of Independent Registered Public Accounting Firm” in BD’s 2013 Proxy Statement, and suchinformation is incorporated herein by reference.
PART IV
Item 15. Exhibits, Financial Statement Schedules.
(a) Financial Statements
The following consolidated financial statements of BD are included in Item 8 of this report:
• Reports of Independent Registered Public Accounting Firm
• Consolidated Statements of Income — Years ended September 30, 2012, 2011 and 2010
• Consolidated Statements of Comprehensive Income — Years ended September 30, 2012, 2011 and 2010
• Consolidated Balance Sheets — September 30, 2012 and 2011
• Consolidated Statements of Cash Flows — Years ended September 30, 2012, 2011 and 2010
• Notes to Consolidated Financial Statements
(b) Financial Statement Schedules
See Note 16 to the Consolidated Financial Statements included in Item 8, Financial Statements andSupplementary Data.
(c) Exhibits
See the Exhibit Index beginning on page 92 hereof for a list of all management contracts, compensatoryplans and arrangements required by this item (Exhibit Nos. 10(a) through 10(o)), and all other Exhibits filed orincorporated by reference as a part of this report.
89

SIGNATURES
Pursuant to the requirements of Section 13 or 15(d) of the Securities Exchange Act of 1934, the registranthas duly caused this report to be signed on its behalf by the undersigned, thereunto duly authorized.
BECTON, DICKINSON AND COMPANY
By: /s/ GARY DEFAZIO
Gary DeFazioVice President and Corporate Secretary
Dated: November 21, 2012
Pursuant to the requirements of the Securities Exchange Act of 1934, this report has been signed below onthe 21st day of November, 2012 by the following persons on behalf of the registrant and in the capacitiesindicated.
Name Capacity
/s/ VINCENT A. FORLENZA
(Vincent A. Forlenza)
Chairman, Chief Executive Officer and President(Principal Executive Officer)
/s/ SUKETU UPADHYAY
(Suketu Upadhyay)
Acting Chief Financial Officer,Senior Vice President and Controller
(Principal Financial Officer andPrincipal Accounting Officer)
Basil L. Anderson*
Director
Henry P. Becton, Jr.*
Director
Edward F. DeGraan*
Director
Claire M. Fraser*
Director
Christopher Jones*
Director
Marshall O. Larsen*
Director
Adel A.F. Mahmoud*
Director
Gary A. Mecklenburg*
Director
James F. Orr*
Director
90

Name Capacity
Willard J. Overlock, Jr.*
Director
Rebecca W. Rimel*
Director
Bertram L. Scott*
Director
Alfred Sommer*
Director
*By: /s/ GARY DEFAZIO
Gary DeFazioAttorney-in-fact
91

EXHIBIT INDEX
ExhibitNumber Description Method of Filing
3(a)(i) Restated Certificate of Incorporation, dated asof February 3, 2009
Incorporated by reference to Exhibit 3(a) to theregistrant’s Quarterly Report on Form 10-Q forthe period ended December 31, 2008
3(b) By-Laws, as amended and restated as ofJuly 26, 2011
Incorporated by reference to Exhibit 3.1 to theregistrant’s Current Report on Form 8-K datedJuly 26, 2011
4(d) Indenture, dated as of March 1, 1997, betweenthe registrant and The Bank of New YorkMellon Trust Company, N.A. (as successor toJPMorgan Chase Bank)
Incorporated by reference to Exhibit 4(a) toForm 8-K filed by the registrant on July 31,1997
The registrant hereby agrees to furnish to theCommission upon request a copy of any otherinstruments which define the rights of holdersof long-term debt of the registrant.
10(a) Form of Employment Agreement withexecutive officers relating to employmentfollowing a change of control of the registrant
Incorporated by reference to Exhibit 10(a) tothe registrant’s Quarterly Report on Form 10-Qfor the period ended December 31, 2008
10(b) Stock Award Plan, as amended and restated asof January 31, 2006
Incorporated by reference to Exhibit 10(a) tothe registrant’s Quarterly Report on Form 10-Qfor the period ended December 31, 2005
10(c) Performance Incentive Plan, as amended andrestated September 23, 2008
Incorporated by reference to Exhibit 10(c) tothe registrant’s Current Report on Form 8-Kdated September 26, 2008
10(d)(i) Deferred Compensation and Retirement BenefitRestoration Plan, as amended and restated as ofOctober 1, 2009
Incorporated by reference to Exhibit 10(d)(i) tothe registrant’s Annual Report on Form 10-Kfor the fiscal year ended September 30, 2009
10(d)(ii) 1996 Directors’ Deferral Plan, as amended andrestated as of October 1, 2009
Incorporated by reference to Exhibit 10(d)(ii) tothe registrant’s Annual Report on Form 10-Kfor the fiscal year ended September 30, 2009
10(e)(i) 1995 Stock Option Plan, as amended andrestated January 27, 1998
Incorporated by reference to Exhibit 10(k) tothe registrant’s Annual Report on Form 10-Kfor the fiscal year ended September 30, 1998
10(e)(ii) Amendments dated as of April 24, 2000 to the1995 Stock Option Plan, as amended andrestated January 27, 1998
Incorporated by reference to Exhibit 10(k) tothe registrant’s Quarterly Report on Form 10-Qfor the period ended June 30, 2000
10(f)(i) 1998 Stock Option Plan Incorporated by reference to Exhibit 10.1 to theregistrant’s Quarterly Report on Form 10-Q/Afor the period ended March 31, 1998
10(f)(ii) Amendments dated as of April 24, 2000 to the1998 Stock Option Plan
Incorporated by reference to Exhibit 10(l) to theregistrant’s Quarterly Report on Form 10-Q forthe period ended June 30, 2000
10(g) Australian, French and Spanish addenda to theBecton, Dickinson and Company Stock OptionPlans
Incorporated by reference to Exhibit 10(m) tothe registrant’s Annual Report on Form 10-Kfor the fiscal year ended September 30, 1998
10(h) Indian addendum to the Becton, Dickinson andCompany Stock Option Plans
Incorporated by reference to Exhibit 10(n) toregistrant’s Annual Report on Form 10-K forthe fiscal year ended September 30, 1999
10(i) China and Japan addenda to Becton, Dickinsonand Company Stock Option Plans
Incorporated by reference to Exhibit 10(n)(i) toregistrant’s Annual Report on Form 10-K forthe fiscal year ended September 30, 2002
92

ExhibitNumber Description Method of Filing
10(j)(i) Non-Employee Directors 2000 Stock OptionPlan
Incorporated by reference to Exhibit 10(o) tothe registrant’s Quarterly Report on Form 10-Qfor the period ended March 31, 2000
10(j)(ii) Amendments dated as of April 24, 2000 to theNon-Employee Directors 2000 Stock OptionPlan
Incorporated by reference to Exhibit 10(o) tothe registrant’s Quarterly Report on Form 10-Qfor the period ended June 30, 2000
10(k) 2002 Stock Option Plan Incorporated by reference to Appendix A to theregistrant’s Proxy Statement dated January 3,2002
10(l) Amended and Restated Aircraft Time SharingAgreement between Becton, Dickinson andCompany and Vincent A. Forlenza dated as ofMarch 21, 2012
Incorporated by reference to Exhibit 10.1 to theregistrant’s Current Report on Form 8-K datedMarch 27, 2012
10(m) Amended and Restated Five-Year CreditAgreement, dated as of May 18, 2012 amongthe registrant and the banks named therein
Incorporated by reference to Exhibit 10 to theregistrant’s Current Report on Form 8-K datedMay 24, 2012
10(n)(i) 2004 Employee and Director Equity-BasedCompensation Plan, as amended and restated asof November 20, 2012
Filed with this report
10(n)(ii) Terms of Awards under 2004 Employee andDirector Equity-Based Compensation Plan
Filed with this report
10(o) Retiree medical agreement between Becton,Dickinson and Company and Jeffrey S.Sherman
Filed with this report
21 Subsidiaries of the registrant Filed with this report
23 Consent of independent registered publicaccounting firm
Filed with this report
24 Power of Attorney Filed with this report
31 Certifications of Chief Executive Officer andChief Financial Officer, pursuant to SEC Rule13(a)-14(a)
Filed with this report
32 Certifications of Chief Executive Officer andChief Financial Officer, pursuant to Section1350 of Chapter 63 of Title 18 of the U.S. Code
Filed with this report
101 The following materials from this report,formatted in XBRL (Extensible BusinessReporting Language): (i) the ConsolidatedStatements of Income, (ii) the ConsolidatedStatements of Comprehensive Income, (iii) theConsolidated Balance Sheets, (iv) theConsolidated Statements of Cash Flows, and (v)Notes to Consolidated Financial Statements.
Copies of any Exhibits not accompanying this Form 10-K are available at a charge of 10 cents per page bycontacting: Investor Relations, Becton, Dickinson and Company, 1 Becton Drive, Franklin Lakes,New Jersey 07417-1880, Phone: 1-800-284-6845.
93

[THIS PAGE INTENTIONALLY LEFT BLANK]

