for the year ended december 31, 2014 -...
TRANSCRIPT

Samsung Electronics 2014 Business Report 1 / 170
SAMSUNG ELECTRONICS Co., Ltd.
2014 Business Report For the year ended December 31, 2014
Certain statements in the document, other than purely historical information, including estimates, projections, statements relating to our business plans, objectives and expected operating results, and the assumptions upon which those statements are based, are “forward-looking statements.” Forward-looking statements are based on current expectations and assumptions that are subject to risks and uncertainties which may cause actual results to differ materially from the forward-looking statements. A detailed discussion of risks and uncertainties that could cause actual results and events to differ materially from such forward-looking statements is included in our financial reports available on our website. See, also, 『1. Note on
Forward-Looking Statements』 in 『V. Management Discussion and Analysis』.
Note about forward-looking statements

Samsung Electronics 2014 Business Report 2 / 170
Table of Contents
Certification ................................................................................................................................................................................ 3 I. Corporate Overview ............................................................................................................................................................... 4 II. Businesses Overview ......................................................................................................................................................... 20 III. Financial Affairs .................................................................................................................................................................. 57 IV. Auditor’s Report ................................................................................................................................................................. 96 V. Management Discussion and Analysis ............................................................................................................................. 99 VI. Corporate Governance .................................................................................................................................................... 107 VII. Information on Shareholders ......................................................................................................................................... 118 VIII. Executives and Employees ........................................................................................................................................... 124 IX. Affiliates and Subsidiaries .............................................................................................................................................. 132 X. Related Party Transactions .............................................................................................................................................. 161 XI. Other Information Related to Investor Protection ........................................................................................................ 165

Samsung Electronics 2014 Business Report 3 / 170
Certification
Letter of Certification
We, Oh-Hyun Kwon and Sang-Hoon Lee, respectively, as CEO and director of the company in charge of reporting, certify that we have reviewed the annual business report of Samsung Electronics Co., Ltd. for the year ended December 31, 2014. To our knowledge, this report does not contain any untrue statement of a material fact or omit to state a material fact necessary that would be misleading with respect to the period covered by this report. To our knowledge, the financial statements, and other financial information included in the report, fairly present in all materials respects the financial condition, results of operations and cash flows of the company as of, and for, the periods presented in this report. We confirm that Samsung Electronics operates an Internal Accounting Management System, responsible for establishing and maintaining disclosure controls and procedures and internal controls over financial reporting, as defined in Article 2.2 and 2.3 of the External Audit Act. We have disclosed our most recent evaluation of internal controls over financial reporting to the Company’s auditors and to the audit committee of the Company’s board of directors. Date: 2015. 4. 29

Samsung Electronics 2014 Business Report 4 / 170
I. Corporate Overview
1. Overview A. Legal, Commercial Name:
- Samsung Electronics Co., Ltd. B. Date of Establishment:
- Samsung Electronics (“SEC” or `“The Company”) was established as Samsung Electronics Industry Co., Ltd. on January 13, 1969, and held an initial public offering on June 11, 1975.
- The Company changed its name from Samsung Electronics Industry Co., Ltd. to Samsung Electronics Co., Ltd. in
accordance with the resolution of the Annual General Meeting of Shareholders on February 28, 1984. C. Address, Phone Number, and English Language Website of the Corporate Headquarter
- Address: 129, Samsung-ro, Yeongtong-gu, Suwon, Gyeonggi-do, Korea - Phone Number: 82-31-200-1114 - Website: http:// www.samsung.com/us
D. The Company is not subject to Article 2 of the Framework Act on Small and Medium Enterprises. E. Core Businesses
- The Company independently manages three independent divisions (each a “Division”), CE (Consumer Electronics), IM (Information Technology & Mobile Communications), and DS (Device Solutions).
Products in each Division are presented below:
Division Products
CE TV, Monitor, Printer, Air Conditioner, Refrigerator, Washing Machine, Medical Devices, etc.
IM HHP, Network System, Computer, Digital Camera, etc.
DS DRAM, NAND Flash, Mobile AP, LCD panel, OLED panel, LED, etc.
The Company is a global electronics company comprised of the headquarters in Korea and 158 subsidiaries across the world including nine (9) regional headquarters for the CE and IM Divisions and five (5) regional headquarters for the DS Division.
[CE Division]
The CE Division is leading the global digital era by continuously offering new products with innovative technology, unique design, and value. TV is the core product of CE. The Company has maintained its market leadership position for the past nine (9) consecutive years through competitive advantage in hardware products such as LCD and LED TV as well as software driven product features within our Smart TV product portfolio.
Samsung Electronics 2014 Business Report 5 / 170
[IM Division]
The IM Division is leading mobile lifestyle innovation with consumer-friendly products such as the premium ‘GALAXY’ branded series of smartphones and tablets, while driving the paradigm shift in the market beyond mobile convergence to focus on software. The IM Division is focused on meeting market demands by enhancing mobile product differentiation through integration of key features from various product categories. In addition to handheld phone (“HHP”) products including smartphones, the IM Division is also leading technological development and standardization in the global networks system market including Long Term Evolution (“LTE”). [DS Division] The DS Division is comprised of the semiconductor sub-division and the display panel business. The semiconductor sub-division (“Semiconductor Sub-Division”) is further divided into the memory business and system LSI business. The Company’s memory business unit (“Memory” or “Memory Business Unit”) manufactures and sells DRAM and NAND products. The Company’s system LSI business unit (“System LSI”) manufactures mobile application processors (“Mobile APs” or “APs”) and various sensors including CMOS imaging sensors (“CIS”). The display business (“DP Business Unit”) manufactures and sells display panels (“DP”), including TFT-LCD and OLED. The Memory Business Unit produces differentiated products and has maintained the number one position in the global memory market by applying advanced process technology. System LSI is leading the industry shift from PCs to mobile. The Company’s DP Business Unit is leading the market with technological development and investment resulting in superior quality and cost competitiveness in TFT-LCDs and increasing applications of OLED panels in various IT products.
☞ See 『II. Businesses Overview』, for more details about each Division.

Samsung Electronics 2014 Business Report 6 / 170
F. Affiliates
The Company is an affiliate of the Samsung group as defined under Korea’s Monopoly Regulation and Fair Trade Act (“Samsung Group”). As at December 31, 2014, Samsung Group had a total of sixty-nine (69) domestic affiliates, where five (5) new affiliates (Samsung Welstory, Seoul Lakeside CC, Samsung Card Customer Service, Shilla Stay, and Samoo Architects & Engineers) were included and eleven (11) affiliates (Samsung Corning Precision Materials, Samsung SNS, Global Tech, 365Homecare, Samsung Petrochemical, Cheil Industries, World Cyber Games, SMP, SKKU dormitory, Care Camp, Gacchinet) were excluded. Among the Samsung Group’s sixty nine (69) domestic affiliates, eighteen (18) affiliates including Samsung Electronics are listed, and fifty-one (51) affiliates are unlisted.
[As of December 31, 2014]
No. of
affiliates Name of affiliates
Listed 18
Samsung C&T, Samsung Electronics, Samsung SDI, Samsung Techwin, SEMCO, Samsung Heavy Industries,
Samsung Card, Samsung Life Insurance, Hotel Shilla, Samsung Fire & Marine Insurance, Samsung
Securities, Samsung Fine Chemicals, Samsung Engineering, S1, Cheil Worldwide, Cheil Industries, Samsung
SDS, CREDU
Unlisted 51
Samsung General Chemicals, Samsung Total Petrochemicals, Samsung Lions, SERI, STECO, Samsung
Thales, SEMES, Samsung Electronics Sales, Samsung Electronics Service, Samsung Electronics Logitech,
Hantok Chemicals, CVnet Corporation, Allat., SECUI, Open Tide Korea, Samsung Futures, Samsung Venture
Investment Corporation, Samsung Asset Management, Saengbo, SD Flex, Samsung Claim Adjustment
Service, Samsung Fire & Marine Insurance Service, Suwon Samsung Bluewings FC, S-Core, Human TSS,
RAY, Songdo Land Mark City, S-1CRM, OpenHands, S-EnPol, Samsung Medison, Samsung Biologics, STM,
Nuri Solution, Colombo Korea, Samsung Life Service, Miracom, SU Materials, Natural9, Samsung Display,
Samsung Bioepis, Samsung Corning Advanced Glass , Daejung Offshore Wind Power Co., Ltd., Samsung
SRA Asset Management, Samsung Welstory, Jeongahm Wind Power, Samsung SGL Carbon Composite
Materials, Samsung Card Customer Service, Seoul Lakeside CC, Shilla Stay, Samoo Architects & Engineers
Total 69
※ The former Cheil Industries merged with Samsung SDI in July 2014, and Samsung Everland has been renamed as Cheil
Industries.
☞ See 『IX. Corporate Governance and Affiliates』 for more details about domestic and overseas affiliates.

Samsung Electronics 2014 Business Report 7 / 170
G. Subsidiaries Subject to Consolidated Financial Statements
As of December 31, 2014, Samsung Electronics’ consolidated subsidiaries totaled 158 with twelve (12) subsidiaries being newly included and seven (7) subsidiaries being excluded when compared to December 31, 2013. Below is the list of consolidated subsidiaries.
(Unit: KRW million)
Name of Subsidiaries Date of Establishment
Major business Dec 31,
2013 Assets
% ownership
Classified as major
subsidiary (Y/N)
Samsung Electronics America Inc. 1978.07 Sale of electronic goods 12,248,560 Over 50% Y
Samsung Receivables Corporation 1998.03 Receivable management 2,780,689 Over 50% Y
Samsung Semiconductor Inc. 1983.07 Sale of semiconductors and
display panels 7,346,339 Over 50% Y
Samsung Electronics Canada Inc. 1980.07 Sale of electronic goods 522,775 Over 50% Y
Samsung Research America, Inc (formerly Samsung Information Systems America Inc.)
1988.10 R&D 184,101 Over 50% Y
Grandis, Inc. 2002.06 R&D 108,037 Over 50% Y
Samsung International Inc. 1983.10 Production of TVs and monitors 34,424 Over 50% N
Samsung Mexicana S.A. de C.V 1988.03 Production of electronic goods 1,065,830 Over 50% Y
Samsung Telecommunications America LLC. 1992.01 Sale of telecom products 4,735,432 Over 50% Y
Samsung Austin Semiconductor LLC. 1996.02 Production of semiconductors 6,393,348 Over 50% Y
Samsung Electronics Mexico S.A. De C.V. 1995.07 Sale of electronic goods 1,554,638 Over 50% Y
SEMES America Inc. 1998.10 Semiconductor equipment 1,090 Over 50% N
Samsung Electronics Digital Appliance Mexico, SA de CV 2012.12 Production of electronic goods 503,513 Over 50% Y
Samsung Electronics Latinoamerica Miami, Inc. 1995.05 Sale of electronic goods 259,165 Over 50% Y
Nvelo, Inc. 2010.05 Software 1,519 Over 50% N
Samsung Electronics Latinoamerica (Zona Libre) 1989.04 Sale of electronic goods 375,274 Over 50% Y
Samsung Electronics Venezuela, C.A. 2010.05 Marketing and services 8,928 Over 50% N
Samsung Electronica Colombia S.A. 1997.03 Sale of electronic goods 327,320 Over 50% Y
Samsung Electronics Panama. S.A. 2012.07 Consulting 3,549 Over 50% N
Samsung Electronica da Amazonia Ltda. 1994.10 Production and sale of electronic goods
3,429,136 Over 50% Y
Samsung Electronics Argentina S.A. 1996.06 Marketing and services 49,454 Over 50% N
Samsung Electronics Chile Limitada 2002.12 Sale of electronic goods 492,709 Over 50% Y
Samsung Electronics Peru S.A.C. 2010.04 Sale of electronic goods 150,228 Over 50% Y
Samsung Electronics (UK) Ltd. 1995.07 Sale of electronic goods 1,393,507 Over 50% Y
Samsung Electronics(London) Ltd. 1999.01 Holding company 7,647 Over 50% N
Samsung Electronics Holding GmbH 1982.02 Holding company 886,338 Over 50% Y
Samsung Semiconductor Europe GmbH 1987.12 Sale of semiconductors and display panels
1,016,296 Over 50% Y
Samsung Electronics GmbH 1984.12 Sale of electronic goods 1,214,277 Over 50% Y
Samsung Electronics Iberia, S.A. 1989.01 Sale of electronic goods 783,438 Over 50% Y
Samsung Electronics France S.A.S 1988.01 Sale of electronic goods 1,157,900 Over 50% Y

Samsung Electronics 2014 Business Report 8 / 170
Name of Subsidiaries Date of
Establishment Major business Dec 31,
2013 Assets
% ownership
Classified as major
subsidiary (Y/N)
Samsung Electronics Hungarian Private Co. Ltd. 1989.10 Production and sale of electronic goods
1,249,691 Over 50% Y
Samsung Electronics Czech and Slovak s.r.o. 2010.01 Sale of electronic goods 170,011 Over 50% Y
Samsung Electronics Italia S.P.A. 1991.04 Sale of electronic goods 1,004,423 Over 50% Y
Samsung Electronics Europe Logistics B.V. 1991.05 Logistics 1,903,892 Over 50% Y
Samsung Electronics Benelux B.V. 1995.07 Sale of electronic goods 1,290,124 Over 50% Y
Samsung Display Slovakia s.r.o. 2007.03 Display panel processing 299,196 Over 50% Y
Samsung Electronics Romania LLC 2007.09 Sale of electronic goods 144,702 Over 50% Y
Samsung Electronics Polska, SP.Zo.o 1996.04 Sale of electronic goods 557,370 Over 50% Y
Samsung Electronics Portuguesa S.A. 1982.09 Sale of electronic goods 132,631 Over 50% Y
Samsung Electronics Nordic Aktiebolag 1992.03 Sale of electronic goods 533,252 Over 50% Y
Samsung Nanoradio Design Center 2004.02 R&D 21,737 Over 50% N
Samsung Semiconductor Europe Ltd. 1997.04 Sale of semiconductors and display panels
98,884 Over 50% Y
Samsung Electronics Austria GmbH 2002.01 Sale of electronic goods 323,756 Over 50% Y
Samsung Electronics Slovakia s.r.o 2002.06 Production of TVs and monitors 1,764,078 Over 50% Y
Samsung Electronics European Holding Cooperatief U.A. 2008.10 Holding company 5,780,302 Over 50% Y
Samsung Electronics Poland Manufacturing SP.Zo.o 2010.02 Production of home appliances 373,469 Over 50% Y
Samsung Electronics Greece S.A. 2010.04 Sale of electronic goods 108,514 Over 50% Y
Nanoradio Hellas AE 2007.11 R&D 21,737 Over 50% N
Samsung Denmark Research Center ApS 2012.09 R&D 22,520 Over 50% N
Samsung France Research Center SARL 2012.10 R&D 22,406 Over 50% N
Samsung Cambridge Solution Centre Limited 2012.09 R&D 132,919 Over 50% Y
Samsung Electronics Baltics SIA 2001.10 Sale of electronic goods 44,495 Over 50% N
Samsung Electronics Overseas B.V. 1997.01 Sale of electronic goods 173,644 Over 50% Y
Samsung Electronics Rus LLC 1999.03 Marketing 12,392 Over 50% N
Samsung Electronics Rus Company LLC 2006.10 Sale of electronic goods 1,410,054 Over 50% Y
Samsung Electronics Ukraine LLC 2004.01 Marketing 79 Over 50% N
Samsung Electronics Ukraine Company LLC 2008.09 Sale of electronic goods 189,644 Over 50% Y
Samsung R&D Institute Rus LLC 2011.11 R&D 13,767 Over 50% N
Samsung Electronics Kazakhstan LLP 2006.07 Marketing 964 Over 50% N
Samsung Electronics Central Eurasia LLP 2008.09 Sale of electronic goods 161,062 Over 50% Y
Samsung Electronics Rus Kaluga LLC 2007.07 Production of TVs 1,122,495 Over 50% Y
Samsung Russia Service Centre LLC 1997.11 Service 41,567 Over 50% N
Samsung Electronics West Africa 2010.03 Marketing 61,414 Over 50% N
Samsung Electronics East Africa 2011.12 Marketing 26,006 Over 50% N
Samsung Gulf Electronics Co., Ltd. 1995.05 Sale of electronic goods 1,071,694 Over 50% Y

Samsung Electronics 2014 Business Report 9 / 170
Name of Subsidiaries Date of
Establishment Major business Dec 31,
2013 Assets
% ownership
Classified as major
subsidiary (Y/N)
Samsung Electronics Egypt S.A.E 2012.07 Production and sale of electronic goods
251,866 Over 50% Y
Samsung Electronics Israel Ltd. 2012.09 Marketing 3,150 Over 50% N
Samsung Electronics Tunisia S.A.R.L 2012.09 Marketing 1,667 Over 50% N
Samsung Electronics Pakistan(Private) Ltd. 2012.11 Marketing 1,814 Over 50% N
Samsung Electronics South Africa(Pty) Ltd. 1994.06 Sale of electronic goods 787,562 Over 50% Y
Samsung Electronics Turkey 1984.12 Sale of electronic goods 674,173 Over 50% Y
Samsung Semiconductor Israel R&D Center Ltd. 2007.10 R&D 22,940 Over 50% N
Samsung Electronics Levant Co.,Ltd. 2009.07 Sale of electronic goods 403,713 Over 50% Y
Samsung Electronics Morocco SARLAU 2009.11 Sale of electronic goods 88,406 Over 50% Y
Samsung Japan Corporation 1975.12 Sale of electronic goods 1,174,832 Over 50% Y
Samsung R&D Institute Japan Co. Ltd 1992.08 R&D 181,723 Over 50% Y
Samsung Electronics Japan Co., Ltd. 2008.09 Sale of electronic goods 712,050 Over 50% Y
Samsung Electronics Display (M) Sdn. Bhd. 1995.03 Production and sale of electronic goods
814,820 Over 50% Y
Samsung Electronics (M) Sdn. Bhd. 1989.09 Production of home appliances 277,354 Over 50% Y
Samsung Vina Electronics Co., Ltd. 1995.01 Production and sale of
electronic goods 175,780 Over 50% Y
Samsung Asia Private Ltd. 2006.07 Sale of electronic goods 2,425,585 Over 50% Y
Samsung India Electronics Private Ltd. 1995.08 Production and sale of electronic goods 1,924,832 Over 50% Y
Samsung R&D Institute India-Bangalore Private Ltd. 2005.05 R&D 147,900 Over 50% Y
Samsung Electronics Australia Pty. Ltd. 1987.11 Sale of electronic goods 578,624 Over 50% Y
PT Samsung Electronics Indonesia 1991.08 Production and sale of
electronic goods 647,199 Over 50% Y
PT Samsung Telecommunications Indonesia 2003.03 Sale of telecom systems and services
15,944 Over 50% N
Thai Samsung Electronics Co., Ltd. 1988.10 Production and sale of
electronic goods 1,476,296 Over 50% Y
Samsung Electronics Philippines Corporation 1996.03 Sale of electronic goods 127,203 Over 50% Y
Samsung Malaysia Electronics (SME) Sdn. Bhd. 2003.05 Sale of electronic goods 814,104 Over 50% Y
Samsung R&D Institute BanglaDesh 2010.08 R&D 6,662 Over 50% N
Samsung Electronics Vietnam Co., Ltd. 2008.03 Production of electronic goods 5,625,759 Over 50% Y
Samsung Telecommunications Malaysia Sdn. Bhd. 2009.08 Sale of telecom systems
and services 11,593 Over 50% N
Samsung Display Dongguan Co., Ltd. 2001.11 Display panel production 1,015,838 Over 50% Y
Samsung Display TianJin Co., Ltd. 2004.06 Display panel production 650,311 Over 50% Y
Samsung Electronics Hong Kong Co., Ltd. 1988.09 Sale of electronic goods 1,188,620 Over 50% Y
Suzhou Samsung Electronics Co., Ltd. 1995.04 Production of home appliances 645,699 Over 50% Y
Samsung Suzhou Electronics Export Co., Ltd. 1995.04 Production of home appliances 352,780 Over 50% Y
Samsung (CHINA) Investment Co., Ltd. 1996.03 Sale of electronic goods 8,406,438 Over 50% Y
Samsung Mobile R&D Center, China-Guangzhou 2010.01 R&D 38,323 Over 50% N
Samsung Tianjin Mobile Development Center 2010.08 R&D 28,245 Over 50% N

Samsung Electronics 2014 Business Report 10 / 170
Name of Subsidiaries Date of
Establishment Major business Dec 31,
2013 Assets
% ownership
Classified as major
subsidiary (Y/N)
Samsung Electronics Suzhou Semiconductor Co., Ltd. 1994.12 Semiconductor processing 660,374 Over 50% Y
Samsung Electronics (Shandong) Digital Printing Co., Ltd. 1993.03 Production of printers 761,018 Over 50% Y
Samsung Electronics Huizhou Co., Ltd. 1992.12 Production of electronic goods 4,599,200 Over 50% Y
Tianjin Samsung Electronics Co., Ltd. 1993.04 Production of TV and monitors 907,752 Over 50% Y
Samsung Electronics Taiwan Co., Ltd. 1994.11 Sale of electronic goods 1,390,404 Over 50% Y
Beijing Samsung Telecom R&D Center 2000.09 R&D 44,780 Over 50% N
Tianjin Samsung Telecom Technology Co., Ltd. 2001.03 Production of telecom products 2,939,027 Over 50% Y
Shanghai Samsung Semiconductor Co., Ltd. 2001.10 Sale of semiconductor and display panels
1,310,109 Over 50% Y
Samsung Electronics Suzhou Computer Co., Ltd. 2002.09 Production of electronic goods 846,670 Over 50% Y
Samsung Display Suzhou Co., Ltd. 2002.09 Display panel processing 554,424 Over 50% Y
Samsung Suzhou LCD Co., Ltd 2011.07 Display panel production 1,463,589 Over 50% Y
Shenzhen Samsung Electronics Telecommunication Co., Ltd. 2002.02 Sale of telecom products 88,698 Over 50% Y
Samsung Electronics Shanghai Telecommunication Co., Ltd. 2001.11 Sale of telecom and network products
1,411 Over 50% N
Samsung Semiconductor (China) R&D Co., Ltd. 2003.04 R&D 18,982 Over 50% N
Samsung Electronics China R&D Center 2004.05 R&D 25,429 Over 50% N
Samsung (China) Semiconductor Co., Ltd. 2012.09 Semiconductor production 3,752,682 Over 50% Y
Samsung Electronics Hainan Fiberoptics Co., Ltd. 2004.04 Fiber optic and cable production 111,367 Over 50% Y
Samsung Electronics (Beijing) Service Company Ltd. 2005.01 Services 140,868 Over 50% Y
Tianjin Samsung LED Co., Ltd. 2009.05 LED production 457,896 Over 50% Y
Tianjin Samsung Opto-Electronics Co., Ltd. 1994.02 Camera/camcorder production 241,957 Over 50% Y
Samsung Display 2012.04 Display panel sales and production 35,754,894 Over 50% Y
SU Materials 2011.08 Display panel component production
21,711 Over 50% N
STECO 1995.06 Semiconductor component
production 91,556 Over 50% Y
SEMES 1993.01 Semiconductor/FPD manufacturing equipment
669,232 Over 50% Y
Samsung Electronics Service 1998.10 Electronics goods repair services 335,588 Over 50% Y
Samsung Electronics Sales 1996.07 Sales of electronic goods 564,361 Over 50% Y
Samsung Electronics Logitech 1998.04 Total logistics services 140,733 Over 50% Y
SVIC #6 Venture Capital Union 2005.07 Investment in venture firms and new technologies
37,284 Over 50% N
SVIC #14 Venture Capital Union 2009.05 Investment in venture firms and new technologies
55,465 Over 50% N
SVIC #20 Venture Capital Union 2011.03 Investment in venture firms
and new technologies 30,532 Over 50% N
SVIC #21 Venture Capital Union 2011.11 Investment in venture firms and new technologies 61,384 Over 50% N
SVIC #22 Venture Capital Union 2011.11 Investment in venture firms and new technologies
93,554 Over 50% Y
SVIC #23 Venture Capital Union 2012.10 Investment in venture firms
and new technologies 10,746 Over 50% N
Hi Pioneer Private Securities Investment Trust 1 2011.08 Investment in venture firms and new technologies 19,189 Over 50% N
Samsung Medison 1985.07 Medical equipment 309,321 Over 50% Y

Samsung Electronics 2014 Business Report 11 / 170
Name of Subsidiaries Date of
Establishment Major business Dec 31,
2013 Assets
% ownership
Classified as major
subsidiary (Y/N)
RAY 2004.10 Dental CT 5,950 Over 50% N
SonoAce Deutschland GmbH 2001.10 Medical equipment 322 Over 50% N
Samsung Medison Shanghai Medical Instrument Co., Ltd. 1992.11 Medical equipment 10,692 Over 50% N
Samsung Medison India Private Ltd. 2009.01 Medical equipment 96 Over 50% N
NexusDX Inc. 2009.07 Medical equipment 15,214 Over 50% N
NeuroLogica Corp. 2004.02 Medical equipment 187,297 Over 50% Y
Samsung Electronics Vietnam THAINGUYEN Co., Ltd. 2013.03 Production of telecom products 590,033 Over 50% Y
Samsung Network R&D Center, China-Shenzhen 2013.03 R&D 5,738 Over 50% N
Samsung Electronics Switzerland GmbH 2013.05 Sale of electronic goods 115,759 Over 50% Y
Samsung R&D Institute China-Xian 2013.07 R&D 8,179 Over 50% N
SEMES (XIAN) Co., Ltd. 2013.07 Semiconductor equipment 242 Over 50% N
Samsung Electronics New Zealand Limited 2013.09 Sale of electronic goods 3,163 Over 50% N
RT SV CO-INVEST, LP 2014.02 Investment in venture firms - Over 50% N
Samsung Display Bac Ninh 2014.07 Display panel production - Over 50% N
Samsung Electronics South Africa Production (pty) Ltd. 2014.07 Production of TV and monitors - Over 50% N
Quietside LLC 2001.07 Sale of Air-conditioner 17,407 Over 50% N
SmartThings, Inc. 2012.04 Sale of smart-home devices 12,775 Over 50% N
PrinterOn Inc. 2000.04 Sale of printing solutions 4,545 Over 50% N
PrinterOn America Corporation 1986.04 Sale of printing solutions 28 Over 50% N
PrinterOn Europe Limited 2013.11 Sale of printing solutions - Over 50% N
SVIC #27 Venture Capital Union 2014.09 Investment in venture firms and new technologies
- Over 50% N
Samsung Electronics Caucasus Co., Ltd. 2014.10 Marketing - Over 50% N
SVIC #26 Venture Capital Union 2014.11 Investment in venture firms and new technologies
- Over 50% N
※ Companies with over KRW75 billion in total assets as of December 31, 2013, are classified as major subsidiaries.
※ See 『II. Businesses Overview』 for additional information about major business segments.

Samsung Electronics 2014 Business Report 12 / 170
H. Credit Rating The Company’s credit rating is assessed by two external credit ratings agencies. As of December 31, 2014, the Company’s credit ratings are: A1 and investment outlook is stable, as rated by Moody’s; and A+ and investment outlook is stable, as rated by S&P.
Date Securities Ratings Credit Rating Agency Rating Range Note
’12.08 Corporate bond A S&P (USA) (AAA ~ D)
Annual Review
’12.08 Corporate bond A1 Moody’s (USA) (Aaa ~ C)
’13.08 Corporate bond A+ S&P (USA) (AAA ~ D)
’13.12 Corporate bond A1 Moody’s (USA) (Aaa ~ C)
’14.08 Corporate bond A+ S&P (USA) (AAA ~ D)
’14.10 Corporate bond A1 Moody’s (USA) (Aaa ~ C)
2. Company History
(The Information disclosed below outlines major changes to the Company such as asset transfers, M&A, and security offerings) 2010.01.01 Transferred VSS business to Samsung Techwin 2010.04.01 Merged with Samsung Digital Imaging 2011.01.01 Merged with Samsung Electronics Gwangju 2011.02.16 Acquired shares of Prosonic (100%) and Medison (43.5%) 2011.04.19 Signed a comprehensive partnership contract (including HDD business transfer) with Seagate 2011.04.29 Acquired additional shares of Medison (22.3%) 2011.07.01 Transferred solar cell business to Samsung SDI 2011.07.22 Acquired shares of Grandis (100%), an affiliate of subsidiary SISA
(Samsung Information System America) 2012.01.19 Acquired remaining shares of S-LCD Corporation (50%) from SONY 2012.04.01 Separated LCD business (established Samsung Display) 2012.04.01 Merged with Samsung LED 2012.04.10 Corporate bond ($1 billion) issued by SEA 2012.07.01 Samsung Mobile Display merged with S-LCD (a subsidiary of Samsung Display) 2012.09.01 Merged Prosonic with Samsung Medison 2012.12.01 Acquired SEHF Korea 2013.01.01 Merged SECRON with GES (a subsidiary of SEMES) 2013.01.28 Acquired shares of NeuroLogica (100%), a subsidiary of SEA 2014.01.15 Disposed of stocks of Samsung Corning Precision Materials, a subsidiary of Samsung Display
Purchased convertible preferred stocks from Corning Incorporated 2014.08.18 Acquired shares of SmartThings (100%), a subsidiary of SEA

Samsung Electronics 2014 Business Report 13 / 170
(Changes in Subsidiaries)
AMER Europe/
MEA/ CIS
Asia China Domestic Total Increase Decrease
Dec 31, 2009
17 39 20 25 15 116 - -
Dec 31, 2010 19 44 21 27 17 128
[Americas: 2] Samsung Electronics Peru S.A.C., Samsung Electronics Venezuela, C.A. [Europe/MEA/CIS: 5] Samsung Electronics West Africa, Samsung Electronics Greece S.A., Samsung LCD Netherlands R&D Center B.V, Samsung LCD Netherlands R&D Center(UK) Limited, Samsung Opto-Electronics GmbH [Asia: 1] Samsung Electronics Bangladeshi Research Center [China: 4] Samsung Guangzhou Mobile R&D Center, Samsung Tianjin Mobile Development Center, Tianjin Samsung Opto-Electronics Co., Ltd., Samsung LCD Netherlands R&D Center(HK) Limited [Domestic: 2] RAY, GES
[China: 2] Tianjin Tongguang Samsung Electronics, Tianjin Samsung Electronics Display
Dec 31, 2011 26 51 25 30 24 156
[Americas: 7] Samsung Medison Brasil Ltda., Samsung Medison America Inc., Grandis, Inc., Nexus DX Inc., HX Diagnostics, Inc., HX Reagents, Inc., Deltapoint Cardiac Diagnostics, Inc. [Europe/MEA/CIS: 7] SONOACE Deutschland GmbH, Samsung Medison France S.A.S., Samsung Medison Italia S.r.l., Samsung Medison Europe B.V., Samsung Moscow Research Centre, Samsung Electronics East Africa, Nanogen Recognomics GmbH [Asia: 4] Samsung Medison Japan Co., Ltd., Samsung Medison India Private Ltd., Medison Medical Systems India Private Ltd., TNP Small/Medium Size & Venture Enterprises Growth-Promotion Investment Limited Partnership(TSUNAMI) [China: 4] Samsung Medison Shanghai Medical Instrument Co., Ltd., Medison (Shanghai) Co., Ltd., Medison Medical Equipment Shanghai, Samsung Suzhou LCD Co., Ltd. [Domestic: 10] Prosonic, SVIC #20 Venture Capital Union, Samsung Medison, Medison Healthcare, CSL, Medison X-ray, SU Materials, Hi Pioneer Private Securities Investment Trust 1, SVIC #21 Venture Capital Union, SVIC #22 Venture Capital Union
[China: 1] Samsung Electronics Shenzhen Co., Ltd. [Domestic: 3] Samsung Electronics Gwangju, Medison X-ray, CSL
Dec 31, 2012
30 61 23 32 20 166
[Domestic: 2] Samsung Display , SVIC #23 Venture Capital Union [Americas: 8] Samsung LED AMERICA, Inc.,mSpot Inc.,Nanoradio Inc., Samsung Electronics Panama. S.A, Samsung Electronics Corportativo SA de CV, Samsung Electronics Digital Appliance Mexico SA de CV, Nvelo Inc., Newton Sub. Corp. [Europe/MEA/CIS: 11] Samsung LED Europe GmbH, Samsung Nanoradio Design Center, Nanoradio Hellas AE, General RF Modules AB, Samsung Cambridge Solution Centre Limited, Samsung Denmark Research Center ApS, Samsung Electronics Egypt S.A.E, Samsung Electronics Tunisia S.A.R.L, Samsung Electronics Israel, Samsung France Research Center SARL, Samsung Electronics Pakistan (Private) Ltd. [China: 2] Tianjin Samsung LED Co., Ltd., Samsung (China) Semiconductor Co., Ltd.
[Domestic: 6] Medison Healthcare, Samsung Mobile Display, S-LCD, SVIC #7 Venture Capital Union, Prosonic, SEHF-Korea [America: 4] Samsung LED AMERICA, Inc., HX Diagnostics, Inc., HX Reagents, Inc., Nanoradio Inc. [Europe/MEA/CIS: 1] Samsung LED Europe GmbH, [Asia: 2] Samsung Asia Private Ltd., Samsung Medison Japan Co., Ltd.
※ AMER = America; MEA = Middle East and Africa, CIS = Commonwealth of Independent States

Samsung Electronics 2014 Business Report 14 / 170
AMER Europe/
MEA/ CIS
Asia China Domestic Total Increase Decrease
Dec 31, 2013
25 55 22 33 18 153
[Americas: 2] NeuroLogica Corp., Intellectual Keystone Technology LLC. [Europe/MEA/CIS: 1] Samsung Electronics Switzerland GmbH [Asia: 2] Samsung Electronics Vietnam THAINGUYEN Co., Ltd., Samsung Electronics New Zealand Ltd. [China: 3] Samsung Network R&D Center China-Shenzhen, Samsung R&D Institute China-Xian, SEMES (XIAN) Co., Ltd.
[Domestic: 2] Secron, GES [Americas: 7] Newton Sub. Corp., mSpot, Inc., Deltapoint Cardiac Diagnostics, Inc., Samsung Medison America, Inc., Intellectual Keystone Technology LLC., Samsung Medison Brasil Ltda., Samsung Electronics Corporativo, SA de CV [Europe/MEA/CIS: 7] Samsung Telecoms (UK) Ltd., Samsung LCD Netherlands R&D Center B.V, Samsung LCD Netherlands R&D Center (UK) Limited, General RF Modules AB, Samsung Medison France S.A.S., Samsung Opto-Electronics GmbH, Samsung Medison Italia S.r.l. [Asia: 3] Samsung Electronic Philippines Manufacturing Corp., Batino Realty Corporation, TNP Small/Medium Size & Venture Enterprises Growth Promotion Investment Limited Partnership(TSUNAMI) [China: 2] Samsung LCD Netherlands R&D Center (HK)Limited, Medison (shanghai) Co., Ltd.
Dec 31, 2014
30 56 22 32 18 158
[Domestic : 2] SVIC #26 Venture Capital Union SVIC #27 Venture Capital Union [America: 6] RT SV CO-INVEST, LP, Quietside LLC, SmartThings, Inc., PrinterOn Inc., PrinterOn America Corporation, 1397011 Ontario Ltd. [Europe/MEA/CIS: 3] PrinterOn Europe Limited, Samsung Electronics South Africa Production(pty) Ltd., Samsung Electronics Caucasus Co., Ltd. [Asia : 1] Samsung Display Bac Ninh
[Domestic: 2] Samsung Blue wings, World cyber games [America: 6] 1397011 Ontario Ltd. [Europe: 2] Samsung Medison Europe B.V Nanogen Recognomics GmbH [Asia: 1] Medison Medical Systems India Private Ltd. [China: 1] Medison Medical Equipment Shanghai Co., Ltd..
※ AMER = America; MEA = Middle East and Africa, CIS = Commonwealth of Independent States
(Important Changes in Management Executives) Following the annual general meeting of shareholders on March 16, 2012, of the three Executive Directors with expired terms (Gee-Sung Choi, Yoon-Woo Lee, Ju-Hwa Yoon), Yoon-Woo Lee retired and Gee-Sung Choi and Ju-Hwa Yoon were re-appointed. Oh-Hyun Kwon was newly appointed as Executive Director. In addition, of the three Independent Directors with expired terms (Dong-Min Yoon, Jae-Woong Lee, Oh-Soo Park), Jae-Woong Lee and Oh-Soo Park retired and Dong-Min Yoon was re-appointed. Han-Joong Kim and Byeong-Gi Lee were newly appointed as Independent Directors. On June 8, 2012, Oh-Hyun Kwon succeeded Gee-Sung Choi as CEO. On February 7, 2013, Independent Director Dong-Min Yoon retired (deceased). On March 14, 2013, Executive Directors Gee-Sung Choi and Ju-Hwa Yoon resigned. Following the shareholders’ meeting on March 15, 2013, Boo-Keun Yoon, Jong-Kyun Shin, and Sang-Hoon Lee were newly appointed as Executive Directors. Independent Director In-Ho Lee was reappointed, and Kwang-Soo Song and Eun-Mee Kim were newly appointed as Independent Directors. On March 15, 2013, the Company appointed Executive Directors Boo-Keun Yoon and Jong-Kyun Shin as CEOs to serve alongside incumbent CEO Oh-Hyun Kwon as co-CEOs.

Samsung Electronics 2014 Business Report 15 / 170
On March 13, 2015, Executive Director Oh-Hyun Kwon and Independent Directors Han-Joong Kim and Byeong-Gi Lee were reappointed at the annual general meeting of shareholders. As of March 31, 2015, (the “Reporting Date”), the Company’s BOD is comprised of four Executive Directors (Oh-Hyun Kwon, Boo-Keun Yoon, Jong-Kyun Shin, Sang-Hoon Lee) and five Independent Directors (In-Ho Lee, Han-Joong Kim, Byeong-Gi Lee, Kwang-Soo Song and Eun-Mee Kim).
(Changes in Organizational Structure) In December 2012, following an organizational change, CE and IM businesses were upgraded to individual Division status, and the IT Solution business was divided into Printing Solution and Computer businesses. The Printing Solution business was incorporated into the CE Division and the Computer business was integrated into the Mobile business under the IM Division. The Medical Device business team was upgraded to a business unit within the CE Division. In December 2013, the Digital Imaging business was changed to a team unit, and then was integrated with the Mobile business. No further changes have been made as of year-end 2014. [As of December 2012]
Before After
Business organization
DMC Division (CE: Visual display, Digital appliances)
(IM: Mobile, IT solution, Network, Digital imaging)
CE Division (Visual display, Digital appliances, Printing solution, Medical devices)
IM Division (Mobile, Network, Digital imaging)
DS Division (Memory, SYS.LSI, LCD,LED) DS Division (Memory, SYS.LSI, DP, LED)
Regional headquarters
Korea, North America, Latin America, Europe, CIS, Southwest Asia, Southeast Asia, China, Middle East, Africa
Korea, North America, Latin America, Europe, CIS, Southwest Asia, Southeast Asia, China, Middle East, Africa
Americas(DS), Europe(DS), China(DS), Southeast Asia(DS), Japan(DS)
Americas(DS), Europe(DS), China(DS), Southeast Asia(DS), Japan (DS)
[As of December 2013]
Before After
Business organization
CE Division (Visual display, Digital appliances, Printing solution, Medical devices)
CE Division (Visual display, Digital appliances, Printing solution, Medical devices)
IM Division (Mobile, Network, Digital imaging) IM Division (Mobile, Network)
DS Division (Memory, SYS.LSI, DP, LED) DS Division (Memory, SYS.LSI, DP, LED)
Regional headquarters
Korea, North America, Latin America, Europe, CIS, Southwest Asia, Southeast Asia, China, Middle East, Africa
Korea, North America, Latin America, Europe, CIS, Southwest Asia, Southeast Asia, China, Middle East, Africa
Americas(DS), Europe(DS), China(DS), Southeast Asia(DS), Japan(DS)
Americas(DS), Europe(DS), China(DS), Southeast Asia(DS), Japan (DS)

Samsung Electronics 2014 Business Report 16 / 170
3. Changes in Paid-in Capital No changes were reported during the past five (5) consecutive years.
4. Stock Information A. Total Number of Shares The total number of authorized shares according to the articles of incorporation is 500,000,000 (par value per share: KRW 5,000). As of December 31, 2014, the Company has issued 147,299,337 shares of registered common stock and 22,833,427 shares of registered preferred stock without voting rights (excluding canceled shares). The Company has canceled 8,310,000 shares of common stock and 1,060,000 shares of preferred stock. As of December 31, 2014, the number of floating common stock is 130,204,596 shares and the number of floating preferred stock is 19,722,484 shares, excluding treasury shares (of 17,094,741 shares of common stock and 3,110,943 shares of preferred stock). [As of December 31, 2014]
(Unit: shares)
Classification Type of Stocks
Note Common Preferred Total
I. Number of authorized shares 400,000,000 100,000,000 500,000,000 -
II. Number of shares issued 155,609,337 23,893,427 179,502,764 -
III. Number of shares decreased 8,310,000 1,060,000 9,370,000 -
1. Capital Reduction - - - -
2. Number of shares canceled 8,310,000 1,060,000 9,370,000 Cancellation of treasury shares
3. Redemption of redeemable shares - - - -
4. Others - - - -
IV. Number of outstanding shares (II-III) 147,299,337 22,833,427 170,132,764 -
V. Treasury shares 17,094,741 3,110,943 20,205,684 -
VI. Number of floating shares (IV-V) 130,204,596 19,722,484 149,927,080 -
※ Shares of the Company’s common stock carry voting rights but preferred stock do not carry voting rights.

Samsung Electronics 2014 Business Report 17 / 170
B. Treasury Shares
In 2014, Samsung Electronics distributed 47,530 shares of common stock in connection with the exercise of previously granted stock options by current and former management and employees. The Company acquired 758,055 shares of common stock and 131,250 shares of preferred stock for its treasury to enhance shareholder value by stabilizing the price of its shares. As of December 31, 2014, the Company holds 17,094,741 shares of common stock and 3,110,943 shares of preferred stock as treasury shares.
[As of December 31, 2014] (Unit: Shares)
Acquisition method Share type
Period-beginning
shares
Change Period-end
shares Acquisition (+)
Disposal (-)
Cancellation (-)
Intra-market direct acquisition (Within dividend related capital gains limit)
Common 16,384,216 758,055 47,530 - 17,094,741
Preferred 2,979,693 131,250 - - 3,110,943
Total Common 16,384,216 758,055 47,530 - 17,094,741
Preferred 2,979,693 131,250 - - 3,110,943
C. Types of Registered Stock
The Company has two types of registered equity securities: 1) common stock; 2) non-voting and non-cumulative preferred stock.
The shareholders of preferred stock are entitled to dividend payments of an additional 1% of par value compared to shareholders of common stock. As of December 31, 2014, the total number of outstanding preferred stock is 22,833,427 shares.

Samsung Electronics 2014 Business Report 18 / 170
5. Voting Shares
Samsung Electronics has 147,299,337 shares of common stock outstanding, which represents 29.5% of the total number of authorized shares of 500 million (500,000,000). There are 22,833,427 shares of preferred stock outstanding (with no voting rights). The Company holds 17,094,741 shares of common stock (with no voting rights) in its treasury, and 12,506,577 shares of common stock are held by the Company’s affiliates and have limited voting rights under applicable laws. Thus, the total number of shares with voting rights is 117,698,019.
[As of December 31, 2014]
(Unit: Shares)
Classification Number
of shares Note
Number of outstanding shares (A)
Common 147,299,337 -
Preferred 22,833,427 -
Shares with no voting rights (B) Common 17,094,741 Treasury stock according to Korean Commercial Act
Shares with no voting rights according to Articles of Incorporation (C) Preferred 22,833,427 3,110,943 shares of preferred treasury stock included
Shares with limited voting rights under relevant laws (D)
Common 12,479,184 Restricted by the Monopoly Regulation and Fair Trade Act: 10,622,814 shares held by Samsung Life Insurance & 1,856,370 shares held by Samsung Fire & Marine Insurance
Common 27,393 Restricted by the Insurance Business Act: Shares held by Samsung Life Insurance in certain special accounts
Shares with voting rights (F = A - B - C - D)
Common 117,698,019 -
Preferred - -
※ Pursuant to Korea’s Monopoly Regulation and Fair Trade Act, shareholders with limited voting rights (D) can exercise certain rights in accordance with related laws, including the right to vote on agendas such as the appointment or dismissal of directors and revisions to the Articles of Incorporation.

Samsung Electronics 2014 Business Report 19 / 170
6. Shareholder Return
As a part of the Company’s shareholder return policy, a part of the profits have been returned to shareholders by way of dividends and shareholder value has been increased through open market purchases of floating shares (share repurchase). The Company carefully considers strategic investments for sustainable growth, business performance, and cash flows in determining the level of total shareholder return.
Dividends paid in the most recent three (3) fiscal years are as follows:
(Unit: Shares / %)
Classification 2014 2013 2012
Par value per share (won) 5,000 5,000 5,000
Net profit (million won) 23,082,499 29,821,215 23,185,375
EPS (won) 153,105 197,841 154,020
Total cash dividend (million won) 2,999,972 2,156,969 1,206,562
Total stock dividend (million won) - - -
Dividend payout ratio (%) 13.0 7.2 5.2
Cash dividend yield (%) Common 1.5 1.0 0.5
Preferred 1.9 1.4 1.0
Stock dividend yield (%) Common - - -
Preferred - - -
Cash dividend per share (won) Common 20,000 14,300 8,000
Preferred 20,050 14,350 8,050
Stock dividend per share (share) Common - - -
Preferred - - -
※ 2014 interim dividend declared was KRW 75,408 million (KRW 500 per share).
※ EPS denotes basic earnings per common share.
※ For further information relating to the calculation of basic EPS, see Earnings Per Share in 『3. Note to Consolidated Financial
Statements』 in 『Ⅲ. Financial Affairs』.

Samsung Electronics 2014 Business Report 20 / 170
II. Businesses Overview
1. Overview
A. Business Overview by Division
In addition to our headquarters in Korea, Samsung Electronics is comprised of 158 subsidiaries across the world responsible for sales and production. Also, there are nine (9) regional headquarters for Consumer Electronics (“CE”) and Information Technology & Mobile Communications (“IM”) Divisions and five (5) regional headquarters for Device Solutions (“DS”) Division.
The Company’s business Divisions are organized in a two-pronged business framework of set (brand products) and component businesses. The set business is comprised of CE and IM Divisions, and the component business is comprised of DS Division. The CE Division is responsible for the production and sales of TVs, monitors, printers, air conditioners and refrigerators, and the IM Division focuses on the production and sales of handheld phones (HHPs) (such as feature phones and smartphones), network systems, and computers. The DS Division is comprised of the Semiconductor business which manufactures and sells DRAM, NAND and Mobile AP, etc. and the Display Panel (“DP Business Unit”) business which manufactures and sells TFT-LCD and OLED panels for TVs, monitors, notebook PCs, and mobile devices.
<Major Products by Business Division>
Business Division Major Products
CE Division TV, Monitor, Printer, Air Conditioner, Refrigerator, Washing Machine, Medical Devices, etc.
IM Division HHP, Network System, Computer, Digital Camera, etc.
DS Division
Semiconductor (Sub-Division) DRAM, NAND Flash, Mobile AP, etc.
DP Business Unit TFT-LCD, OLED, etc.
The Company maintains its corporate headquarter and eighteen (18) consolidated domestic subsidiaries in Korea.
The Company’s corporate headquarters in Korea is divided along Divisions and/or businesses, and are situated at the following 5 locations: Suwon (CE Division and R&D Center); Gumi (IM Division); Giheung and Hwasung (Semiconductor business); and Gwangju (Home Appliance business). The Company’s consolidated domestic subsidiaries include Samsung Display for display panel production, Samsung Electronics Sales for domestic retail sales, Samsung Electronics Service for after service care, and Samsung Electronics Logitech for logistics.
We have 140 overseas subsidiaries for product manufacturing, sales, and R&D.
In the Americas, we have 30 subsidiaries responsible for product manufacturing and sales including SEA (New Jersey, United States) which is responsible for sales of products such as TVs, HHPs and other communication products in the US, SAMEX (Tijuana, Mexico) responsible for manufacturing TVs, and SAS (Austin, United States) responsible for manufacturing semiconductor products.
In Europe, we operate 32 subsidiaries including SEUK (UK), SEF (France), SEG (Germany), and SEI (Italy). SESK (Slovakia) and SEH (Hungary) are responsible for manufacturing TVs, and SEPM (Poland) is responsible for manufacturing home appliances.
In Asia, we have 22 overseas subsidiaries, including SAPL (Singapore), SEAU (Australia), SEPCO (Philippines), and SME (Malaysia), which are responsible for regional sales. In addition, we operate numerous production sites including SEV (Vietnam) for HHPs, SDMA (Malaysia) for TVs, and SIEL (India) for both TVs and HHPs.
We operate 32 subsidiaries in China, including regional sales operations in Beijing (SCIC) and Hong Kong (SEHK). We also operate production and processing facilities sites in Tianjin and Suzhou (TSTC, SSEC, and SESS). In addition, we have 24 production and sales subsidiaries across Africa, the Middle East and the CIS regions.

Samsung Electronics 2014 Business Report 21 / 170
[CE Division]
Industry Overview
Since the development of black-and-white TVs in 1926 and subsequent mass production of Color TVs, technological development has led to products such as the Trinitron CRT (1967) and the flat CRT (1996). As the penetration rate in major countries reached over 90%, the CRT TV business became stagnant. The industry regained strong growth momentum following the launch of Flat Panel TVs (LCD, PDP) with the expansion of digital broadcasting (UK/US 1998~).
Flat panel TVs (“FP-TVs”) replaced the CRT driven by enhanced product performance with respect to design, picture quality, etc., and a sharp decline in prices. In addition, 3D TVs were launched in 2010, and the rise of internet video services (OTT, OVER-THE-TOP) along with increased consumer interest in smart devices from 2011 to 2012 led to the birth of the Smart TV market. In 2013, OLED and UHD TVs with innovatively high resolution were launched and the TV market continues to evolve. In 2014, Annual TV shipment is expected to reach 232.51 million units, an increase 3.3% from the previous year. LCD-TV (including LED-TV) shipment is expected to be around 223.36 million units with an increase of 7.5% year-over-year, while PDP-TV shipment is expected to decline by 45.6% to 5.6 million units from the previous year (Source: Dec ‘14 Display Search). Market Condition The trend towards large-size and high-resolution screens is accelerating due to intensified competition between manufacturers. Accordingly, market share of major manufacturers with high-quality products and brand power is increasing. In addition, as consumer demand for high-resolution and slim design increases, LED TVs, with eco-friendly LED back light units (“BLU”) which increases brightness and contrast as well as energy efficiency, has become the mainstream of the market. The Company has focused on smart TV sales based on forecasts that consumers’ desire to acquire internet information from TVs will increase. The Company led the smart TV market in 2011 by launching smart TVs with various smart hub-based Apps and implementing a premium category sales strategy. In 2012, the Company introduced a new market trend with the introduction of the Smart Interaction™ system based on voice and gesture commands for convenient interaction with devices. In 2013, the Company introduced a system that recommends TV programs based on the user’s viewing history. In 2014, as competition among TV set makers accelerated in large-screen and high definition TVs, competitive products and strong brand power have become important factors in gaining and/or maintaining market share. Going forward, we expect this trend to continue in the global TV market, and with increasing customer demand for large-screen TVs with high definition, and expect that sales of ultra-high-definition (“UHD”) TVs will continue to increase. < Market Share of the CE Division’s Main Product >
Product 2014 2013 2012
TV 22.6% 21.6% 21.1% ※ Market share data is from research agency Display Search (Global market share in quantity). Business Condition We have maintained the top position in the Flat Panel TV market (in terms of market share) for nine consecutive years since 2006. In 2014, we introduced a variety of UHD TV products, offering differentiated benefits to our customers. Samsung UHD TVs, as the next step in the evolution of TVs, not only offers superior picture quality, but also supports upcoming UHD broadcasting standards through its Evolution Kit. Also, our Curved TV products, which offer a greater sense of depth and an immersive viewing experience, made our products unique and different. Thus, we were able to solidify our leadership in the premium TV market by expanding sales of UHD and Curved TVs. We aim to maintain our leadership in the market in 2015 by focusing on new premium products such as SUHD TVs.

Samsung Electronics 2014 Business Report 22 / 170
SUHD TVs, featuring our Nano Crystal technology, will offer superior picture quality in important material aspects including color, brightness, and contrast. Furthermore, most of our premium TV products, including SUHD TVs, will be offered as Smart TVs, and all our new Smart TV products will be equipped with: our own open‐source platform, Tizen, to offer easy compatibility with other smart devices; fast and intuitive user interface for better user experience (“UX”); and customized contents and services. [IM Division] Industry Overview
A mobile phone is one of the most ubiquitous electronics devices. As of year-end 2014, the global penetration rate was 74%. In 2015, it is expected to reach 77%. (Source: Dec ’14 Strategy Analytics) The mobile phone industry started with the first generation analogue phones in the early 1980s. It evolved to second generation digital, and to third generation mobile communication standards such as WCDMA with high-speed data transmission. Today, fourth generation mobile communication technology with ultra-high-speed data transmission is becoming commonplace in the market. In particular, the LTE market is spreading to all parts of the world, and LTE-Advanced with higher speeds has been commercialized in Korea since June 2013 through cooperation between the Company and mobile communication carriers. Recently, the mobile phone market is changing rapidly around not only smartphone and tablet but also new hybrid product categories such as Galaxy Note. This puts emphasis on not only existing hardware competitiveness but also on software competitiveness including Application and UX that enables users to access useful information more conveniently. Market Condition
In 2015, the HHP market is expected to reach 1.9 billion units with a growth of 5% from 1.8 billion in 2014. The smartphone market is expected to increase from 1.25 billion units in 2014 to 1.4 billion units in 2015 with a growth of 12% year over year. The tablet market is expected to reach 290 million units (16% growth rate YoY) shipped in 2015 from 250 million units in 2014. (Source: Strategy Analytics – Mobile/Smartphone: Dec ’14, Tablet: Nov.) < Market share of the IM Division’s Main Product >
Product 2014 2013 2012
HHP 22.4% 26.8% 25.1%
※ Market share data is from research agency Strategy Analytics (Global market share in quantity).
Business Condition
The Company strengthened market leadership by maintaining its wide range of product lineup from premium to mass market models and by being at the forefront of new markets such as the LTE market. In particular, the Company has maintained its status as No.1 in terms of global smartphone market share, based on the success of flagship smartphones such as the Galaxy S series and Galaxy Note series. Going forward, the Company will continue to solidify its market leadership in premium smartphones and tablets and create consumer demand with new products (such as Galaxy S, Gear VR, and Gear Circle) and advanced features (such as flexible displays). Furthermore, we will continue to strengthen the competitiveness of our strategic models to overcome unfavorable market conditions resulting from intensifying competition as more competitors enter the market with more products and lower prices. In addition, we will strive to become a company that consistently offers new value to customers by making strategic investments in mobile healthcare and B2B for future growth and by utilizing our R&D capacity that is the best in the industry.

Samsung Electronics 2014 Business Report 23 / 170
[DS Division]
- Semiconductor Industry Overview
In general, semiconductor is divided into memory semiconductor that stores information and system LSI (non-memory semiconductor) that logically processes information including mental calculation and inference. Memory semiconductor is divided into RAM products that can read and write and ROM products that can only read. RAM is called volatile memory as the information is deleted when power is off. It is used for temporary loading and storage of application programs. There are various types of system LSI products for various applications. CPU (Central Processing Unit) for PCs and servers is the biggest market. System LSI products are used in many product categories such as household electronics, telecommunications, network, and games. The Company supplies its system LSI semiconductor products for use in media players including digital TVs, DVDs, and MP3s. The company also manufactures CMOS image sensors (“CIS”) for camera phones, Mobile APs for smartphones, and other customized system LSI semiconductor products. The semiconductor industry is cyclical by nature, and imbalances between supply and demand frequently occur. Many manufacturers have not been able to maintain competitiveness during periods of global economic recession and oversupply, resulting in consolidation within the industry. Supply and demand volatility is expected to decrease as a result of increased demand for semiconductors in new smartphones, tablet PCs and servers. Market Condition
Throughout 2014, PC DRAM prices remained strong amid stable supply and demand. In the fourth quarter of 2014, overall DRAM demand increased driven by new product launch, but supply did not increase due to difficulties in process migration. In the fourth quarter, while supply of PC DRAM increased, supply for high density server and mobile DRAM adapting advanced processes continued to be limited. NAND supply and demand condition has been improving since the second half of 2014 driven by an increase in NAND contents in new smartphones and adoption of solid state drives (“SSDs”). < Market share of the Semiconductor Business’ Main Product >
Product 2014 2013 2012
DRAM 40.9% 37.2% 42.1%
※ Market share data is from research agency IDC (Global market share in amount).
Business Condition
The Company was the first to develop and produce 20nm DRAM products and also secured technology and cost competitiveness ahead of competitors. In addition, the Company is solidifying its leadership position in the DRAM market by developing differentiated 20nm products and 10nm-class DRAM. For NAND, the Company is simultaneously developing and mass producing both planar and vertical NANDs, addressing customer demand in a timely manner. In particular, the Company is entering the premium market by adding vertical NAND, with technology that is one year ahead of competitors, to high-performance SSD. The Company is also expanding high-quality 3bit products to maximize cost competitiveness. In 2015, the cloud server market and the mid-to-low end mobile markets are expected to grow. As such, the Company will expand differentiated products based on advanced processes and address each market segment with diverse product lineups to continue to lead the market as the No.1 memory maker.

Samsung Electronics 2014 Business Report 24 / 170
-DP Business Unit Industry Overview
Display products include TFT-LCD (Thin Film Transistor Liquid Crystal Display) and OLED (Organic Light Emitting Diode) panels. TFT-LCD panel is a liquid crystal based display that consumes less electricity and features a thinner profile, while maintaining high resolution. It has a wide range of potential applications in devices of all sizes and functionality. The market growth rate has slowed down recently due to a reduction of replace demand for CRT monitors and high market penetration of LCD TVs. OLED panels use organic materials which offer sharp contrast and color, high color concordance, and fast response rates. Such differentiating features provide advantages in smartphone products, and as a result the market demand for under 10” small-to-medium size displays has increased. In addition, OLED has recently made a foray into the high-end TV market. The TFT-LCD and OLED businesses have high barriers to entry as they are capital intensive and need large-scale production to realize economies of scale. These types of businesses are generally sensitive to business fluctuations. Therefore, even if demand increases continuously, supply and demand balance tends to change regularly due to competitive investment in facilities by producers. Also, production capacity can sharply increase as producers invest in facilities contemporaneously as they compete with one another to address demand increase ahead of the competition. As such, when production capacity sharply increases, the average selling price (“ASP”) of panels may decrease. In contrast, when supply cannot meet increasing demand, ASP may increase. Market Condition
In 2015, supply and demand of large-size panels is expected to be solid driven by the trend towards large-screen TVs and continued growth of UHD TVs. However, there may be excess supply due to an increase in industry capacity in the second half. For mobile devices, the product mix is expected to expand, particularly in the mid-range category. The trend toward higher resolution and larger size panels is expected to continue, while the demand for new product categories such as wearable devices is expected to increase. < Market Share of the DP Business’ Main Product >
Product 2014 2013 2012
Display Panel 20.9% 20.4% 25.4%
※ Market share data is from Display Search (Global market share, large-size panel in [units shipped]). Business Condition
The Company is improving cost competitiveness through increasing production yields by developing advanced process technologies, developing high transmission panels, and internally producing core equipment. In addition, the Company continues to improve profitability through close collaboration with TV and smartphone manufacturers from R&D to production. For its large-size panel business, the Company plans to improve profitability through increased cost competitiveness while meeting the demand for new premium products such as UHD TVs and Curved TVs. For mobile, the Company plans to secure long-term growth momentum by expanding its customer base through enhanced cost competitiveness, and expansion of new product categories, including mid-range products and flexible ultra-high-resolution products.

Samsung Electronics 2014 Business Report 25 / 170
B. Financial Summary by Division
(Unit: KRW million, %)
Division Classification 2014 2013 2012
Amount Portion Amount Portion Amount Portion
CE
Total sales 124,916,892 25.3% 125,088,762 22.4% 117,897,781 24.6%
Internal sales 74,733,757 25.9% 74,757,247 22.7% 66,792,679 24.0%
Net sales 50,183,135 24.3% 50,331,515 22.0% 51,105,102 25.4%
Operating profit 1,184,325 4.7% 1,673,343 4.5% 2,324,036 8.0%
Total asset 43,116,374 12.8% 47,183,953 14.9% 38,947,252 14.1%
IM
Total sales 236,438,979 47.9% 299,161,654 53.6% 224,920,171 46.9%
Internal sales 124,674,435 43.3% 160,344,435 48.7% 119,075,488 42.8%
Net sales 111,764,544 54.2% 138,817,219 60.7% 105,844,683 52.6%
Operating profit 14,562,885 58.2% 24,957,741 67.8% 19,418,235 66.8%
Total asset 94,227,108 27.9% 86,132,881 27.1% 68,743,115 24.9%
DS
Semi- conductor
Total sales 75,058,071 15.2% 70,908,145 12.7% 66,976,623 14.0%
Internal sales 35,328,169 12.3% 33,471,566 10.2% 32,090,017 11.5%
Net sales 39,729,902 19.3% 37,436,579 16.4% 34,886,606 17.3%
Operating profit 8,776,442 35.1% 6,887,978 18.7% 4,173,730 14.4%
Total asset 87,567,196 25.9% 76,224,096 24.0% 67,136,914 24.4%
DP Business
Unit
Total sales 52,227,615 10.6% 61,294,886 11.0% 69,359,762 14.5%
Internal sales 26,500,446 9.2% 31,457,770 9.5% 36,360,406 13.1%
Net sales 25,727,169 12.5% 29,837,116 13.0% 32,999,356 16.4%
Operating profit 660,181 2.6% 2,980,563 8.1% 3,214,750 11.1%
Total asset 46,826,533 13.8% 42,195,558 13.3% 41,429,074 15.0%
Total
Total sales 131,459,756 26.6% 134,394,781 24.1% 136,724,256 28.5%
Internal sales 65,669,950 22.8% 66,633,875 20.2% 68,436,962 24.6%
Net sales 65,789,806 31.9% 67,760,906 29.6% 68,287,294 34.0%
Operating profit 9,430,915 37.7% 10,000,665 27.2% 7,416,325 25.5%
Total asset 160,138,321 47.4% 145,872,686 45.9% 130,371,546 47.3%
※ Restated on 2014 basis (presented on a consolidated basis). ※ Net sales reported here includes inter-divisional sales.
Cumulative Net sales for 2014 were KRW 206.206 trillion. By Division, CE reported KRW 50,183 billion (24.3%) and IM reported KRW 111,765 billion (54.2%). The DS Division contributed approximately 31.9% of net sales: KRW 39,730 billion (19.3%) by the Semiconductor Sub-Division and KRW 25,727 billion (12.5%) by the DP Business Unit. Cumulative operating profit for 2014 was KRW 25.025 trillion. The IM Division accounted for 58.2% with KRW 14,563 billion and the DS Division accounted for 37.7% with KRW 9,431 billion.

Samsung Electronics 2014 Business Report 26 / 170
Reasonable Allocation of Common SG&A (Selling General & Administrative) Expenses and Assets (1) For common SG&A expenses, specific expenses that are allocable to specific product/model are allocated to such product/model. However, common expenses that cannot be attributed to a specific product/model category are reasonably allocated throughout the Company based on an allocation standard (expense-to-sales ratio, number of personnel, etc.). (2) For common assets, assets that can be directly allocated (inventory assets, fixed assets, investment assets, etc.) are allocated to the corresponding organizational unit. Assets that are commonly managed are allocated to each Division based on an allocation standard (expense-to-sales ratio, pre-tax profit, etc.).
2. Key Products and Services A. Revenue In 2014, the CE Division’s revenue of KRW 50,183 billion accounted for 24.3% of the total net revenue; the IM Division accounted for 54.2% with KRW 111,765 billion; and the DS Division accounted for 31.9% with KRW 65,790 billion. The Company’s net revenue by Division as of year-end 2014 are as follows:
(Unit: KRW 100 million, %)
Division Major Products Net Revenue Portion
CE TV, monitor, printer, air conditioner, refrigerator, washing machine, medical
equipment, etc. 501,831 24.3%
IM HHP, network system, computer, digital camera, etc. 1,117,645 54.2%
DS
Semiconductor DRAM, NAND flash, Mobile AP, etc. 397,299 19.3%
DP Business Unit TFT-LCD, OLED, etc. 257,272 12.5%
Sub-Total 657,898 31.9%
Others - -215,314 -10.4%
Total 2,062,060 100.0%
※ Includes sales between Divisions (on consolidated basis).
☞ See 『5. Sales and Distribution』 for sales by each product.
B. Average Selling Price (ASP) Changes Throughout 2014, the ASP of TVs continued to decline from 2013. The ASP of HHPs declined slightly compared to 2013, while the ASP of memory products stabilized, declining only 14% from 2013, due to stable market demand and supply conditions. The downward momentum of the ASP of display panels continued, due to weak demand from China and developed markets.

Samsung Electronics 2014 Business Report 27 / 170
3. Key Raw Materials
(On consolidated basis as of year-end 2014)
(Unit: KRW 100 million, %)
Division Type Item Specific usage Purchase price Portion Note (supplier)
CE
Raw materials Display panel Color picture signaler 39,249 18.0% CMI, AUO, etc.
Raw material Others 178,666 82.0%
Division Total 217,915 100.0%
IM
Raw material Mobile display panel Color picture signaler 49,043 12.0% Iljin Display, etc.
Raw material Baseband Chip CPU 48,375 11.8% Qualcomm, etc.
Raw material Others 312,900 76.2%
Division Total 410,318 100.0%
DS
Raw material Glass Glass substrate for display 18,392 9.2% Corning Precision Materials, etc.
Raw material POL Polarizer plate 18,880 9.4% Dongwoo Fine-Chem, NITTO, etc.
Raw material Window Tempered glass 12,435 6.2% BIEL, etc.
Raw material Others 150,272 75.2%
Division Total 199,979 100.0%
Others 444 -
Total 828,656 -
For the CE Division, key raw materials include display panels for TVs and monitors and PDP modules. For the IM Division, key raw materials include display panels for mobile devices and baseband chips. For the DS Division, key raw materials include glass, polarizers (“POL”) and wafers. Large display panels for TVs and monitors are supplied by Cummins (CMI) and AU Optronics (AUO) (among others), mobile display panels are supplied by Iljin Display, and baseband chips are supplied by the System LSI business unit and Qualcomm. The Company manufactures display panels with glass and POLs supplied by Samsung Corning and Dongwoo Fine-Chem. (Raw Materials Price Trends) The price of TV and monitor display panels, which are the major raw materials for the CE Division, declined 11% on average since 2013 due to oversupply from increased capacity and improved productivity. For the IM Division, since 2013, the price of mobile display panels declined by 8%, and the price of baseband chips increased by 7%. For the DS Division, the price of raw materials continues to decrease. Also, since 2013, the price of semiconductor wafer has declined by 17% and the price of glass for display panels has declined by 16%.

Samsung Electronics 2014 Business Report 28 / 170
4. Production and Facilities
A. Production Capacity, Output, Utilization Rate (Capacity)
(Unit: 1,000)
Division Item 2014 2013 2012
Quantity Quantity Quantity
CE TV 62,990 53,102 53,375
IM HHP 523,750 556,600 461,950
DS Memory 173,506,000 116,909,000 80,159,000
Display Panel 9,185 8,260 9,218 ※Global production capacity for major product categories The CE and IM Divisions’ production capacity, by major product, is calculated as follows: The average number of lines (x) the average output per hour (x) the average operation hours per day (x) the days of operation Memory production capacity for the DS Division is calculated as follows: Converted output (1GB equivalent) ÷ the utilization rate. Display panel production capacity is calculated as follows: The total producible panel surface area ÷ the dimensions of eighth generation glass (2200x2500mm) (Output)
(Unit: 1,000)
Division Item 2014 2013 2012
Quantity Quantity Quantity
CE TV 55,066 47,527 48,357
IM HHP 439,520 499,480 416,632
DS Memory 173,506,000 116,909,000 80,159,000
Display Panel 8,252 7,340 7,800 ※Global output for major product categories In 2014, the CE Division’s output of TVs was 55.066 million units (major production sites: Korea, China, Mexico, Brazil, and Hungary). The IM Division’s output of HHPs was 439.520 million units (major production sites: Korea, China, Vietnam, and Brazil). The DS Division’s memory output (1GB equivalent) was 173,506 million (major production sites: Korea and China). The DS Division’s output of display panels was 8.252 million units (major production sites: Korea, China, and Slovakia).
Samsung Electronics 2014 Business Report 29 / 170
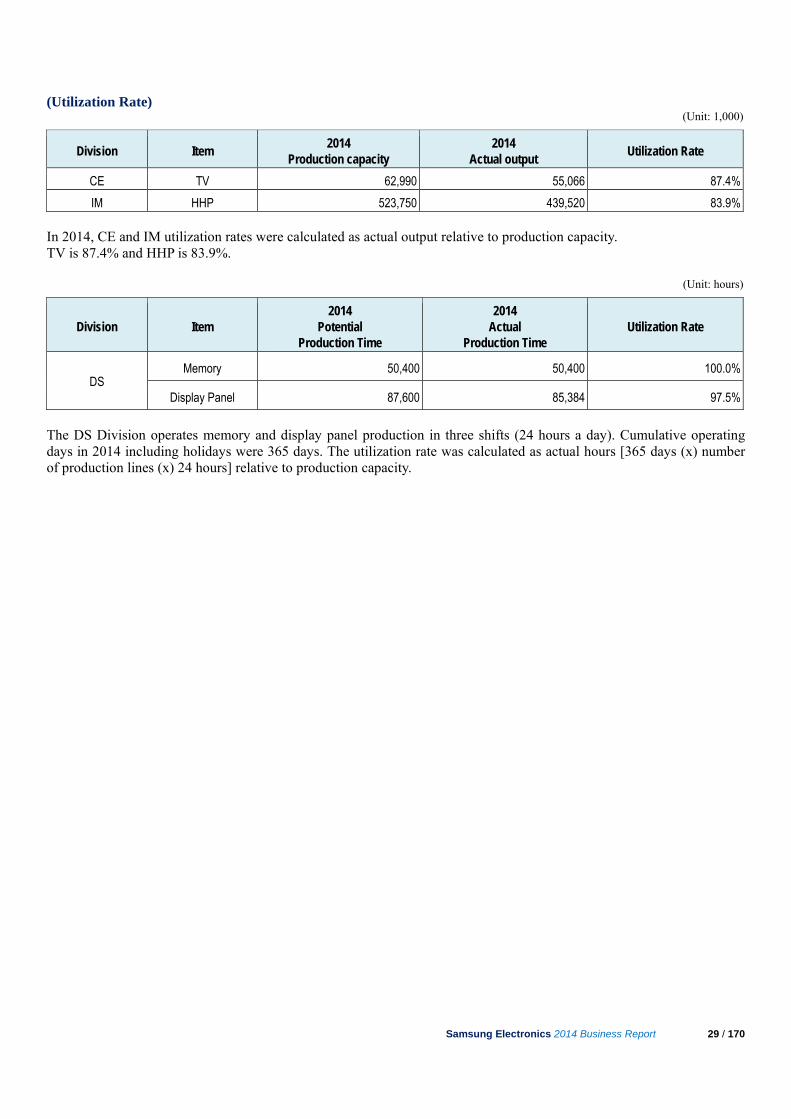
(Utilization Rate) (Unit: 1,000)
Division Item 2014
Production capacity 2014
Actual output Utilization Rate
CE TV 62,990 55,066 87.4%
IM HHP 523,750 439,520 83.9% In 2014, CE and IM utilization rates were calculated as actual output relative to production capacity. TV is 87.4% and HHP is 83.9%.
(Unit: hours)
Division Item 2014
Potential Production Time
2014 Actual
Production Time Utilization Rate
DS Memory 50,400 50,400 100.0%
Display Panel 87,600 85,384 97.5%
The DS Division operates memory and display panel production in three shifts (24 hours a day). Cumulative operating days in 2014 including holidays were 365 days. The utilization rate was calculated as actual hours [365 days (x) number of production lines (x) 24 hours] relative to production capacity.

Samsung Electronics 2014 Business Report 30 / 170
B. Production Facilities and Investment
(1) Key facilities for production and operation The Company’s operational activities include manufacturing, development, marketing, and sales in Korea – including operations in Seocho, Seoul, Suwon, Gumi, Giheung, Onyang, Gwangju – and 9 regional headquarters under the CE and IM Divisions and 5 under the DS Division in North America, Europe, and China. [Operations]
Region Headquarters Location
Korea (10)
Seocho Seoul, Korea
Suwon Suwon, Korea
Gumi1 Gumi, Korea
Gumi2 Gumi, Korea
Giheung Yongin, Korea
Onyang Asan, Korea
Hwaseong Hwaseong, Korea
Gwangju Gwangju, Korea
Cheonan Cheonan, Korea
Asan Asan, Korea
Overseas (9 Regional Headquarters for
CE and IM Divisions)
North America New Jersey, US
Europe London, UK
China Beijing, China
Southeast Asia Singapore, Singapore
Southwest Asia New Delhi, India
CIS Moscow, Russia
Middle East Dubai, UAE
Africa Johannesburg, Republic of South Africa
Latin America Sao Paolo, Brazil
Overseas (5 Regional Headquarters for
DS Division)
Americas San Jose, US
Europe Eschborn, Germany
China Shanghai, China
Southeast Asia Singapore
Japan Tokyo, Japan

Samsung Electronics 2014 Business Report 31 / 170
The Company’s property, plant and equipment include land, buildings and structures, machinery and equipment, and construction in progress. As of year-end 2014, their total book value is KRW 80,873 billion, which is an increase of KRW 5.377 trillion from year-end 2013. In 2014, new acquisitions of KRW 23,435 billion and depreciation of KRW 16,910 billion were recorded.
(Unit: KRW million)
Classification Land Buildings and Structures
Machinery and Equipment
Construction in –progress
Others Total
At 1 January 2014
Book value 7,429,287 15,715,064 36,498,478 13,840,172 2,013,387 75,496,388
Acquisition cost 7,429,287 23,375,035 118,621,699 13,840,172 5,518,351 168,784,544
Accumulated depreciation (Including accumulated impairment loss)
- (7,659,971) (82,123,221) - (3,504,964) (93,288,156)
Increase (Decrease)
General acquisition and capital expenditure 357,794 3,595,210 16,048,623 2,476,963 956,520 23,435,110
Acquisition as a result of business combination - - - - 940 940
Depreciation - (1,305,220) (14,729,718) - (875,088) (16,910,026)
Disposal/Discard (67,001) (457,634) (193,077) (44,883) (71,550) (834,145)
Damage - (2,280) (173,140) - (6,710) (182,130)
Others (9,728) 53,407 300,724 (439,945) (37,645) (133,187)
Balance at 31 Dec 2014
Book value 7,710,352 17,598,547 37,751,890 15,832,307 1,979,854 80,872,950
Acquisition cost 7,710,352 26,474,937 127,603,897 15,832,307 5,664,513 183,286,006
Accumulated depreciation (Including accumulated impairment loss) - (8,876,390) (89,852,007) - (3,684,659) (102,413,056)
※ Others: Includes effects of changes in FX rates and changes in the scope of consolidated financial statements. ※ Market value of major tangible assets is omitted as objective assessment is difficult. ※ Property, plant, and equipment above is presented on a consolidated basis. (2) CAPEX During 2014, the Company invested KRW 23.4 trillion in CAPEX, including upgrading production lines of the Semiconductor Sub-Division and the DP Business Unit. The total CAPEX for 2015 is expected to increase compared to the previous year, although this is subject to change depending on changes in the business environment and market conditions. [CAPEX by Division]
(Unit: KRW 100 million)
Business Purpose Period Assets Investment in 2014
Semiconductor Establishment, addition,
upgrade Jan '14 ~ Dec '14 Buildings, facilities 143,156
DP Business Unit Establishment, addition,
upgrade Jan '14 ~ Dec '14 Buildings, facilities 39,846
Others Others Jan '14 ~ Dec '14 Buildings, facilities 51,349
Total 234,351

Samsung Electronics 2014 Business Report 32 / 170
5. Sales and Distribution
A. Sales In 2014, the Company recorded KRW 206,206 billion of total revenue, a decline of 9.8% from the prior year. By Division, from 2013, the CE Division’s revenue decreased by 0.3%, the IM Division’s revenue decreased by 19.5%, and the DS Division’s revenue decreased by 2.9%.
(Unit: KRW 100 million)
Division Sales types Product categories 2014 2013 2012
CE
Goods Products Service Others
TV, monitor, printer, air conditioner, refrigerator,
washing machine, medical equipment
501,831 503,315 511,051
IM
Goods Products Service Others
HHP, Network System, Computer,
Digital camera 1,117,645 1,388,172 1,058,447
DS
Semiconductor
Goods Products Service Others
DRAM, NAND Flash, Mobile AP
397,299 374,366 348,866
DP Business Unit
Goods Products Service Others
TFT-LCD, OLED 257,272 298,371 329,994
Division total 657,898 677,609 682,873
Others Other revenue - -215,314 -282,169 -241,335
Total 2,062,060 2,286,927 2,011,036
※ Includes internal sales between Divisions.
※ Represented on 2014 basis.
□ Sales by Major Product (Unit: KRW 100 million)
Classification 2014 2013 2012
TV 324,486 331,207 350,381
Mobile Devices 1,074,149 1,353,537 1,032,875
Memory 293,244 237,146 208,640
Display Panel 257,272 298,371 329,994 ※ Including internal sales between Divisions.
※ Represented on 2014 basis.

Samsung Electronics 2014 Business Report 33 / 170
□ Sales by Type (Unit: KRW 100 million)
Classification 2014 2013 2012
Products 2,036,716 2,252,839 1,926,709
Service and other Sales 25,344 34,088 84,327
Total 2,062,060 2,286,927 2,011,036 ※Other sales consists of royalty income and rental income.
□ Sales by Region (on a Parent Company Financial Statement Basis) (Unit: KRW 100 million)
Classification 2014 2013 2012
Korea 153,247 172,004 204,703
Americas 433,940 442,526 315,846
Europe 208,982 335,645 312,650
Asia and Africa 298,140 341,059 290,832
China 283,946 292,487 288,033
Total 1,378,255 1,583,721 1,412,064 B. Sales Channels
□ Korea
Seller Sales Channel Consumer
Manufacturer (Facility)
Retailer
Consumer
Distributor (General Merchandise Store, Discount Store, Department Store, Home-Shopping, Internet)
Retailer Cooperative Joint Market, Sales Shop, Open Stores
Telecommunication Service Provider (SKT, KT, LG U+)
Direct Sales
□ Overseas
Seller Sales Channel Consumer
Production Subsidiaries
Regional Sales Office
Retailer
Consumer
Dealer Retailer
Distributor Dealer Retailer
Telecommunication Service Provider
Regional Distribution Office Regional Sales
Office
Retailer
Dealer Retailer
Distributor Dealer Retailer
Direct Sales
□ Sales Ratio by Channel
Channel Wholesale Retail Special/direct sale Others
Ratio 34% 26% 35% 5%
※ On a global basis

Samsung Electronics 2014 Business Report 34 / 170
C. Sales Methods and Conditions
□ Domestic
Classification Channel Collection Incidental expense sharing
Exclusive Agency - Credit agreement (Cash, 30 day credit)
(Credit applied within 100% of collateral) - Case specific cost sharing as determined by mutual agreement
Distributor General Merchandise Store,
Discount Store, Department Store, Home Shopping, Internet
Case specific and contract specific - Case specific cost sharing as determined by mutual agreement
Special/direct sale Corporate Clients, etc. Case specific and contract specific N/A
□ Overseas
Classification Channel Collection Incidental expense sharing
Retailer Retail store Case specific and contract specific - Case specific cost sharing as determined by mutual agreement
Dealer General merchandise store,
Discount store, Department store Case specific and contract specific - Case specific cost sharing as determined by mutual
agreement
Distributor Direct sales to local distributors Case specific and contract specific - Case specific cost sharing as determined by mutual agreement
B2B Corporate Clients, etc. Case specific and contract specific N/A
D. Sales Strategy ○ Expand market leadership based on smart devices ○ Provide differentiated value to customers through brand, products, and service ○ Strengthen operational capabilities for customer/market ○ Enhance sales capabilities
E. Major Customers During 2014, major customers included Apple, Deutsche Telekom, Ingram Micro, Sprint and Verizon. Sales to our five major customers accounted for about 13% of total sales.
6. Long-term Contracts N/A

Samsung Electronics 2014 Business Report 35 / 170
7. Financial Risk Management
The Company’s financial risk management focuses on minimizing market risk, credit risk, and liquidity risk arising from operating activities. To mitigate these risks, the Company implements and operates a financial risk policy and program that closely monitors and manages such risks.
The finance team mainly carries out the Company’s financial risk management. With the cooperation of the Company’s Divisions, domestic and foreign subsidiaries, the finance team periodically measures, evaluates and hedges financial risks and also establishes and implements global financial risk management policies.
Financial risk management officers are dispatched to the regional headquarters of located in the US, UK, Singapore, China, Japan, Brazil and Russia to oversee application of global financial risk management policies at the local finance centers.
Financial assets subject to the Company’s financial risk management are as follows: cash and cash equivalents, short-term financial instruments, available-for-sale financial assets, trade, and other receivables, and other financial assets. The Company’s financial liabilities subject to financial risk management are as follows: trade and other payables, borrowings, debentures, and other financial liabilities.
A. Market Risk
(1) Foreign Exchange Risk
The Company is exposed to foreign exchange risk arising from various currency exposures due to global operations. The Company is mostly exposed to foreign currency volatility due to exchange positions of currencies, including the US Dollar, Euro, Japanese Yen, and Chinese Yuan.
To minimize foreign exchange risk arising from operating activities, the Company’s foreign exchange management policy requires normal business transactions (including imports and exports) to be in the local currency or for the cash-in currency to be matched with the cash-out currency. The Company’s foreign exchange risk management policy also defines foreign exchange risk, measuring period, ownership responsibilities, management procedures, hedging period and hedge ratio.
The Company prohibits all speculative foreign exchange transactions. The Company has established a global foreign exchange system to manage exposures related to receivables and payables denominated in foreign currencies.
The foreign currency exposure to financial assets and liabilities of a 5% currency rate change against the Korean won (KRW) are presented below:
(Unit: KRW million)
Classification
Year-End 2014 Year-End 2013
Appreciation Depreciation Appreciation Depreciation
USD (171,265) 171,265 8,472 (8,472)
EUR (36,381) 36,381 9,136 (9,136)
JPY (42,529) 42,529 (45,131) 45,131

Samsung Electronics 2014 Business Report 36 / 170
(2) Risk of Volatility in Equity Securities Held as Investment
The Company’s investment portfolio consists of direct and indirect investments in equity securities and is classified as available-for-sale, which is in line with the Company’s strategy.
As of December 31, 2014 and December 31, 2013, a price fluctuation in relation to marketable equity securities by 1% would result in changes in other comprehensive income (before income tax) of KRW 57,768 million and KRW 43,993 million, respectively.
(3) Interest Rate Risk
Risk of changes in interest rate for a floating interest rate financial instrument is defined as the risk that the fair value of future cash flows of a financial instrument will fluctuate because of changes in market interest rates and the risk that cash flows from investing/financing activities will fluctuate with changes in interest gain/loss. The Company is exposed to interest rate risk mainly through interest bearing liabilities and assets. The Company has policies to minimize uncertainty and expenses from changes in interest rates. In order to minimize interest rate related risks, the Company minimizes external borrowings by facilitating cash pooling systems on a regional and global basis. The Company manages its exposure to interest rate risks by regularly monitoring risk factors and timely resolution, and prevention, of issues.
The sensitivity risk of the Company is determined based on the following assumptions:
- Changes in market interest rates that could impact the interest income and expenses of floating interest rate financial instruments
Based on the above assumption, changes to profit and net equity as a result of a 1% increase in interest rates on borrowings are presented below:
(Unit: KRW million)
Classification
Year-End 2014 Year-End 2013
Interest Rate Increase Interest Rate Decrease Interest Rate Increase Interest Rate Decrease
Financial Assets 52,977 (52,977)
46,025
(46,025)(46,025)
Financial Liabilities (30,722) 30,722 (22,942) 22,94222,942
Net Effect 22,255 (22,255) 23,083 (23,083)(23,083)
B. Credit Risk
Credit risk arises during the normal course of transactions and investing activities where clients or other parties fail to discharge an obligation. The Company actively monitors its credit risk on a regular basis and determines a counterparty’s credit limit periodically based on the counterparty’s financial conditions, default history, and other important factors.
Credit risk can arise from transactions with financial institutions which include financial instrument transactions such as cash and cash equivalents, savings, and derivative instruments. To minimize such risk, the Company transacts only with banks that have strong international credit ratings (S&P A and above), and all new transactions with financial institutions with no prior transaction history are approved, managed and monitored by the Company’s finance team and the local

Samsung Electronics 2014 Business Report 37 / 170
finance center. The Company requires separate approval for contracts with restrictions.
Most of the Company’s trade receivables are adequately insured to manage any risk, therefore, the Company estimates its credit risk exposure to be limited. The Company estimates that its maximum exposure to credit risk is the carrying value of its financial assets, net of impairment losses.
C. Liquidity Risk
Due to large investments made by the Company, maintaining adequate levels of liquidity is critical. The Company strives to achieve this goal by periodically forecasting its cash flow, estimating required cash levels, and managing income and expenses.
The Company manages its liquidity risk by periodically forecasting projected cash flows. If abnormal signs are identified, the Company works with the local finance center and provides liquidity support by utilizing globally integrated finance structures such as cash pooling. In addition, the Company maintains a liquidity management process which provides additional financial support through the local finance center and the Company when necessary. The cash pooling program allows sharing of surplus funds among entities and contributes to minimizing liquidity risk and strengthening the Company’s competitive position by reducing capital operation expenses and finance expenses.
In addition, the Company mitigates liquidity risk by contracting with financial institutions with respect to bank overdrafts and foreign trade finance and by providing payment guarantees to subsidiaries. For large scale facility investments, liquidity risk is minimized by utilizing internal reserves and long term borrowings according to the capital injection schedule.
As of year-end 2014, financial liabilities classified according to remaining term until the expiration date is as follows:
(1) Year-End 2014
(Unit: KRW million)
Under 3 mo. ~6 mo. ~1yr 1~5 yrs Over 5 yrs
Financial liabilities 34,502,783 706,077 3,528,699 3,994,862 106,857
(2) Year-End 2013
(Unit: KRW million)
Under 3 mo. ~6 mo. ~1yr 1~5 yrs Over 5 yrs
Financial liabilities 33,862,896 1,095,285 4,806,477 2,564,769 65,772
The above financial liabilities were classified according to the remaining term until the expiration date from the Reporting Date. The cash flows included were not discounted to present value. Please note, as expiry of derivatives bought and sold is not necessary for understanding liquidity requirements in a given period, its fair value of KRW 78,348 million (year-end 2013: KRW 244,172 million) is included in the “under 3 mo.” figure. These derivatives contracts are managed based on their fair value rather than expiration. Cash-settled derivatives are composed of currency forwards used for managing the Company’s exchange rate fluctuations.
The maximum amount of liquidity exposure from payment guarantees and performance guarantees of affiliates other than

Samsung Electronics 2014 Business Report 38 / 170
the above financial liabilities is KRW 115,211 million (year-end 2013: KRW 183,644 million).

Samsung Electronics 2014 Business Report 39 / 170
D. Capital Risk Management
The purpose of capital management is to maintain a healthy capital structure. The Company uses debt ratio as an indicator and measure of an appropriate capital structure. The debt ratio is calculated by dividing total liabilities by total equity in the consolidated financial statements.
The Company’s capital risk management policy has not changed since the fiscal year ended December 31, 2013. The Company has maintained A+ and A1 credit ratings from S&P and Moody’s, respectively.
The total liabilities to equity ratio as of year-end 2014 and year-end 2013 are as follows:
(Unit: KRW million)
December 31, 2014 December 31, 2013
Total liabilities 62,334,770 64,059,008
Total equity 168,088,188 150,016,010
Total liabilities to equity ratio 37.1% 42.7%

Samsung Electronics 2014 Business Report 40 / 170
E. Fair Value Measurement
- Carrying amounts and fair values of financial instruments by category as of December 31, 2014 and December 31, 2013 are as follows:
(Unit: KRW million)
Classification December 31, 2014 December 31, 2013
Carrying amount Fair value Carrying amount Fair value
Financial assets
Cash and cash equivalents 16,840,766 (1) 16,284,780 (1)
Short-term financial instruments 41,689,776 (1) 36,722,702 (1)
Short-term available-for-sale financial assets 3,286,798 3,286,798 1,488,527 1,488,527
Trade and other receivables 24,694,610 (1) 24,988,532 (1)
Long-term available-for-sale financial assets(2)
12,667,509 12,272,756 6,238,380 5,850,155
Other 4,762,971 4,725,263 5,472,956 5,436,470
Total Financial assets 103,942,430 91,195,877 Financial liabilities
Trade payables 7,914,704 (1) 8,437,139 (1)
Short-term borrowings 8,029,299 (1) 6,438,517 (1)
Other payables 9,258,344 (1) 7,877,581 (1)
Current portion of long-term borrowings
1,778,667 (1) 2,425,831 (1)
Debentures 1,355,882 1,377,113 1,311,068 1,327,569
Long-term borrowings 101,671 82,271 985,117 971,844
Long-term other payables 2,520,277 2,606,179 1,023,714 1,090,580
Other 11,474,129 (1) 10,862,512 (1)
Total Financial liabilities 42,432,973 39,361,479 1 Assets and liabilities whose carrying amounts are reasonable approximations of their fair value are excluded from the
fair value disclosures. 2 Amount measured at cost (2014: KRW 394,753 million and 2013: KRW 388,225 million) is excluded, as the range of
reasonable fair value estimates are significant and the probabilities of the various estimates cannot be reasonably assessed.

Samsung Electronics 2014 Business Report 41 / 170
The following table presents the fair value of assets and liabilities, by Level (as defined below), measured as of the dates indicated:
As of December 31, 2014
(In millions of Korean won) Level 1 Level 2 Level 3 Total balance
Short-term available-for-sale financial assets 1,016,878 2,269,920 - 3,286,798 Long-term available-for-sale financial assets1 5,776,836 3,050,338 3,445,582 12,272,756 Other 45,898 102,513 148,411
Total assets
Other - 78,348 - 78,348
Total liabilities -
December 31, 2013
(In millions of Korean won) Level 1 Level 2 Level 3 Total balance
Short-term available-for-sale financial assets 1,257,492 231,035 - 1,488,527 Long-term available-for-sale financial assets1 4,399,314 957,463 493,378 5,850,155 Other - 40,552 - 40,552
Total assets
Derivatives - 244,172 - 244,172
Total liabilities 1 Amount measured at cost (December 31, 2014: KRW 394,753 million, December 31, 2013: KRW 388,225 million) is excluded, as
the range of reasonable fair value estimates are significant and the probabilities of the various estimates cannot be reasonably assessed.
The levels of the fair value hierarchy (based on characteristics of the input variables) and its application to financial assets and liabilities are described below.
ㆍLevel 1: Quoted market prices (unadjusted) for identical assets or liabilities
ㆍLevel 2: Fair valuation based on inputs that are observable in the market (Other than quoted prices included within Level 1)
ㆍLevel 3: Fair valuation based on inputs that are unobservable in the market The fair value of financial instruments traded in active markets is based on quoted market prices at the statement of financial position date. A market is regarded as active if quoted prices are readily and regularly available from an exchange, dealer, broker, industry group, pricing service, or regulatory agency, and those prices represent actual and regularly occurring market transactions on an arm’s length basis. The quoted market price used for financial assets held by the Company is the current bid price. These instruments are included in Level 1. Instruments in Level 1 include listed equity investments classified as trading securities or available-for-sale financial assets.
The fair value of financial instruments that are not traded on an active market (for example, over-the-counter derivatives) is determined using valuation models. These valuation models maximize the use of observable market data where it is available and rely as little as possible on entity specific information. If all significant inputs required to measure the fair value of an instrument are observable, the instrument is included in Level 2.
If one or more of the significant inputs are not based on observable market data, the instrument is included in Level 3.

Samsung Electronics 2014 Business Report 42 / 170
The Company performs fair value measurements required for financial reporting purposes, including Level 3 fair values, and discusses valuation processes and results at least once every quarter in line with the Company’s quarterly reporting dates. The Company recognizes changes in Levels at the end of the reporting period, if corresponding events or changes in circumstances necessitating such reclassification have occurred.
Specific valuation methods used to value financial instruments include: ㆍQuoted market prices or dealer quotes for similar instruments.
ㆍThe fair value of foreign exchange forward contracts is determined using, among other things, forward exchange rates at the
statement of financial position date, with the resulting value discounted back to present value.
Other methods, such as discounted cash flow analysis, are used to determine fair value for the remaining financial instruments. For trade and other receivables, the book value approximates a reasonable estimate of fair value. - Valuation Methods and Inputs
ㆍThe Company utilizes a present value method to discount future cash flows at a proper interest rate for corporate bonds, government and public bonds, and bank debentures that are classified as Level 2 in the fair value hierarchy.
ㆍThe following table presents the valuation methods and inputs used for major financial instruments classified as
Level 3.
(In millions of Korean won)
Classification Fair
Value Valuation Technique Level 3 Inputs
Input Range (Weighted Average)
Long-term available-for-sale financial assets Taewon Electric 17,094 Discounted cash
flow Permanent growth rate -1.00% ~ 1.00% (0%) Weighted average cost of capital 7.76% ~ 9.76% (8.76%)
Samsung Venture Investment 6,586 Discounted cash flow
Permanent growth rate -1.00% ~ 1.00% (0%) Weighted average cost of capital 7.74% ~ 9.74% (8.74%)
Samsung General Chemicals 100,051 Discounted cash flow
Permanent growth rate -1.00% ~ 1.00% (0%) Weighted average cost of capital 10.48% ~ 12.48% (11.48%)
Coming Incorporated convertible preferred stock
3,106,332 Trinomial model Risk adjusted discount rate 4.96% ~ 6.96% (5.96%) Price volatility 30.50% ~ 36.50% (33.50%)
Derivatives Embedded derivatives (convertible bonds)
2,462 Binomial model Discount rate 5.16% ~ 10.30% (7.78%) Stock price volatility 11.88% ~ 17.60% (14.53%)

Samsung Electronics 2014 Business Report 43 / 170
- Changes in Level 3 Instruments:
(In millions of Korean won) 2014 2013
Balance as of January 1 493,378 389,195 Purchases 2,586,120 151,741 Disposals (97,487) (46,357) Amount recognized in profit or loss (67,581) (5,177) Amount recognized in other comprehensive income 646,856 2,615 Other (13,191) 1,361
Balance as of December 31 3,548,095 493,378
- Sensitivity Analysis for Recurring Fair Value Measurements Categorized within Level 3
Sensitivity analysis of financial instruments is performed to measure favorable and unfavorable changes in the fair value of financial instruments which are affected by inputs that are unobservable in the market, using a statistical technique. When the fair value is affected by two or more input variables, such fair value is calculated using the most favorable or most unfavorable input values. The results of the sensitivity analysis for the effect on profit or loss from changes in inputs for each type of financial instrument, which is categorized within Level 3 and subject to sensitivity analysis, are as follows:
(In millions of Korean won) Favorable Changes Unfavorable Changes
Classification Profit or Loss Equity Profit or Loss Equity Long-term available for sale financial assets1 - 231,909 - (225,568)
Embedded derivatives (convertible bonds)2 466 466 (475) (475)
Total 466 232,375 (475) (226,043)
1 Changes in the fair value of convertible preferred stock have been calculated by increasing or decreasing the correlation between volatility (30.50% ~ 36.50%) and the discount rate. Similarly, for other equity securities, changes in fair value have been calculated by increasing or decreasing the correlation between growth ratio (-1% ~ 1%) and the discount rate, which are significant unobservable inputs.
2 For equity derivatives, changes in fair value have been calculated by increasing or decreasing the correlation between stock prices and volatility by 10%.

Samsung Electronics 2014 Business Report 44 / 170
- As of December 31, 2014, assets and liabilities that are not measured at fair value but whose fair value is disclosed are as follows:
[Unit : KRW million]
Classification Book value Year-End 2014
Level 1 Level 2 Level 3 Total
(1) Assets
Other non-current assets 4,614,560 - 4,576,852 - 4,576,852
(2) Liabilities
Debentures 1,355,882 - 1,377,113 - 1,377,113
Long-term borrowings 101,671 - 82,271 - 82,271
Long-term other payables 2,520,277 - 2,606,179 - 2,606,179
[Unit : KRW million]
Classification Book value Year-End 2013
Level 1 Level 2 Level 3 Total
(1) Assets
Other non-current assets 5,432,404 - 5,395,918 - 5,395,918
(2) Liabilities
Debentures 1,311,068 - 1,327,569 - 1,327,569
Long-term borrowings 985,117 - 971,844 - 971,844
Long-term other payables 1,023,714 - 1,090,580 - 1,090,580
The Company utilizes a present value method to discount future cash flows by utilizing an appropriate interest rate for the above assets and liabilities that are classified as Level 2 in the fair value hierarchy.

Samsung Electronics 2014 Business Report 45 / 170
8. Derivative Instruments and Put Options
The Company holds convertible bonds in several companies, including FTS, as well as bonds with warrants of Shinwha Intertek Co., Ltd.
(A) The value of derivative instruments as of year-end 2014 is presented below:
(Unit: KRW million)
Asset Liabilities Valuation Gain Valuation Loss
Put options 8,844 - - 10,778
Total 8,844 - - 10,778
※ The option values were calculated using appropriate valuation methodologies, including the Black-Scholes model
(B) To manage foreign exchange risk, the Company’s subsidiaries hedge their foreign currency positions by trading currency forward contracts of such currencies. Overseas subsidiaries buy or sell currency forwards with less than one year maturity through a bank to minimize such risks.
The Company holds convertible preferred shares of Corning Incorporated and its value as of year-end 2014 is as follows.
(Unit: KRW million)
Purchasing Price Fair Value Valuation Gain Valuation Loss
Convertible preferred Stocks 2,434,320 3,106,332 672,012 -
※ Fair value determined using Trinomial Tree model
(C) Currency forwards as of year-end 2014 are as follows.
(Unit: KRW million)
Asset Liabilities Valuation Gain Valuation Loss
Currency forwards 45,775 78,311 44,308 74,023
Total 45,775 78,311 44,308 74,023

Samsung Electronics 2014 Business Report 46 / 170
9. Major Contracts
Account Item Contents
Ericsson
Contract type Patent cross-license agreement
Contract date 2014.01.25
Purpose and contents Secure operational advantage through mutual patent licensing
Contract type Patent cross-license agreement
Contract date and period 2014.01.25 / indefinite term
Purpose and contents Secure business freedom through mutual patent licensing
Others Permanent license contract (including patent applications in the next 10 years)
Cisco
Contract type Patent cross-license agreement
Contract date 2014.01.23
Purpose and contents Secure business freedom through mutual patent licensing
Global Foundries Inc.
Contract type Process technology license contract
Contract date 2014.02.28
Purpose and contents Expand customer base of 14nm process
InterDigital
Contract type Patent license agreement
Contract date 2014.06.03
Purpose and contents Secure business freedom through patent licensing
Microsoft
Contract type Settlement Agreement
Contract date -
Purpose and contents End dispute over royalty payment
※ Information that may be referenced or used in other IP disputes, including contract amount, is not included.

Samsung Electronics 2014 Business Report 47 / 170
10. Research and Development Activities
A. Summary of Activities and R&D Expenditures
The Company is leading the global market by continuously developing creative and innovative products and the future technology through shifting its way of thinking and understanding customer demand.
The Company is currently developing creative and innovative products and doing its utmost to cement its position in the world IT industry and become a truly Leading Company that leads world’s industrial technology by securing next-generation and original technology.
[R&D expenses] (Unit: KRW million)
2014 2013 2012
Total R&D expenditure 15,325,507 14,780,432 11,892,434
Accounting
Capitalization of development expenses (intangible asset) 940,001 461,030 359,639
R&D costs (expenses) 14,385,506 14,319,402 11,532,795
R&D expenses/sales Ratio 7.4% 6.5% 5.9%
※ On a consolidated basis (in conformity with K-IFRS)
As of December 31, 2014, the Company’s R&D expenses were KRW 15,326 billion, a 3.7% YoY basis. The Company capitalized KRW 940 billion and recognized KRW 14,386 billion as current expenditure.
B. R&D Organization and Operations
Korea
The Company operates three levels of R&D organizations; a business unit development team under each Division that develops market ready technologies with a 1-2 year outlook, a research institute under each business unit that develops mid-to-long term technology with a 3-5 year outlook, and the Samsung Advanced Institute of Technology that develops core technology as seeds for future growth engines.
Samsung Advanced Institute of Technology is the central research institute of Samsung Electronics that has been established to lead the future and serve as an incubator of cutting-edge technology. It has a creative R&D system and provides R&D direction for promising growth sectors at the Company level, exploring future growth engines and strengthening technological competitiveness of core businesses.
Overseas The Company operates R&D organizations in the US (SRA-Silicon Valley and SRA-Dallas), the UK (SRUK), Russia (SRR), Israel (SRIL and SIRC), India (SRI-Bangalore and SRI-Delhi), Japan (SRJ), China (SSCR, SRC-Beijing, SRC-Nanjing, SRC-Tianjin, and SRC-Guangzhou) to carry out research activities for product development and basic technological research.

Samsung Electronics 2014 Business Report 48 / 170
※ As of December 31, 2014
※ Refer to 『G. Subsidiaries subject to consolidation』 in 『I. Corporate Overview』 for more details about overseas R&D organizations.

Samsung Electronics 2014 Business Report 49 / 170
C. R&D Results
Research Project Research Results and Expected Effect In case applied to a product, name of the product and application
Smart TV monitor
□ Smart Monitor (TB750, 24"/27) - Support mobile device connectivity via MHL - Support wireless transmission of picture via WiFi - Can use smart hub and smart TV apps - AllShare and Connect Share functions - 7W x 2 Ch speaker - Asymmetric slim design
□ Region: Americas/Europe/ domestic, etc.
□ Launch: Feb ‘12
Set-Top Box for Virgin Media
□ Supply set-top boxes for UK Virgin Media - Develop cable TV set-top box (equipped with TiVo middle ware) - HD broadcasting and mass recording functions (1T class) ※ Virgin Media: The largest media group in UK
□ Region: UK □ Launch: Feb ‘12
Smart TV Service
□ Smart TV Service launch in ‘12 - Cloud-based contents sharing among family members - Provide and manage contents for toddlers - Customized exercise guide service - Contents sharing between various devices
□ SDK3.1 Public Release (March) - Smart Control input device and In-App advertisement - Provide utility tool (Automatic Testing Tool)
□ Region: Global □ Launch: Feb ‘12
Smart Input Device □ Introduction of smart wireless keyboard
Easy to control device with QWERTY text input and Touch Pad Bluetooth Pairing for controlling TV and Mobile devices
□ Region: Americas/Europe/ domestic, etc.
□ Launch: Feb ‘12 □ Applied products: LED/PDP products in response to BT
Smart Station Monitor
□ Smart Station Monitor (CB750, 24") - Support connection to Wireless PC screen - Mobile control function - Support mobile device connectivity via MHL - Can control 2 PCs (Drag & Drop file transfer, etc.) - Support USB Hub and USB Super Charging - 5W x 2 Channel speaker
□ Region: Americas/Europe/ domestic, etc.
□ Launch: May ‘12
All-in-one Cloud Monitor
□ Product Concept - All-in-one Cloud Display Monitor(AMD Solution)
* Cloud Display Monitor: All-in-one LED monitor for creating server-based computing environment, which is the next generation IT infra solution that can efficiently manage
IT resources and strengthen security □ Purpose and effects
- Respond to EnergyStar5.0 and Erp(European energy standard) - Apply platform/DDR3 and SSD/enable Fan less via 2 chip solution AMD Ontario - Increase opportunity of sales expansion by adding 23.6" 16:9, 19" 5:4 Format Line-up - ECO-Friendly → LED BLU /Energystar/TCO/Thin Design - Secure sales channel in response to VMware/Citrix virtualization solution
□ Region: Global □ Launch: Dec ‘12 □ Inch : 19"/23.6"
LFD DEC
(LH40DECPLBA/ZA)
□ Product Concept - Changed to new Echo-E chip dedicated to LFD from existing Genoa-P - DP LoopOut & DP1.2 MST using ST Athena chip - 24/7 operable Heavy Usage LED models - High intensity (700nit) anti-Glare required for information delivery
□ Spec and effects - Panel : New, Edge-LED, 700nit - SMPS (PD-Board) : New - 12 hours use per day (3 year warranty) - Safety standard 60950-1(monitor), EMC class A - Remote control: TM1240B - Stand not provided (Option accessory) - In response to competitors’ line-up - Secure LFD product line-up
□ Region: Global □ Launch: Oct ‘12 □ Inch : 40"/46"/55"

Samsung Electronics 2014 Business Report 50 / 170
Research Project Research Results and Expected Effect In case applied to a product, name of the product and application
Develop high-resolution
large-size TV panel □ Differentiate Main Stream TV products and secure competitiveness
□ Region: Global □ Launch: 1Q 13
High-resolution low-power consumption
Tablet product technology
□ Achieve low power consumption of table products by enhancing transmitivity and enhance production yield
□ Region: Global □ Launch: 4Q 12
Mass produce 20nm 4GB DDR3
DRAM for computer
□ Mass produce 20nm 4GB DDR3 DRAM as the first in the world - Developed as the first in the world for 4 consecutive generations since 50nm 4GB in '09 - Transmission speed of 1,833Mbps, which is the fastest for server
□ Maintain competitive advantage in the value-added DRAM market with cutting-edge ‘green memory’ from server to PC market
□ Region: Global □ Launch: Feb ‘12 □ Name : 4GB DDR3 DRAM
Mass produce 20nm 4GB LPDDR2
mobile DRAM for mobile
□ Mass produce 20nm 4GB mobile DRAM as the first in the world - Mass produce products from 1GB to 4GB, highest capacity in the industry - Only provider of 4GB ultra-thin 0.8mm solution in the industry
□ In the future, expand 4GB market by increasing the proportion of 20nm DRAM Maintain competitive advantage in the premium memory market
□ Region: Global □ Launch: Apr ‘12 □ Name : 4GB LPDDR2 Mobile DRAM
Develop 30nm 4GB DDR4
DRAM for computer
□ Develop next generation 30nm 4GB DDR4 DRAM as the first in the world - Launched 16GB DDR4 DRAM as the first after the launch of 2GB DDR4 DRAM in ‘11 - In the future, plan to develop products with fastest speed of 3.2Mb/s
□ Create differentiated market by mass producing 20nm products in '13 and maintain competitive advantage with high-capacity green memory
□ Region: Global □ Launch: Jun '12 □ Name : 4GB DDR4 DRAM
Mass produce 30nm 4GB LPDDR3 mobile
DRAM for mobile
□ Mass produce next generation 30nm 4GB mobile DRAM as the first in the world - Mass produce largest range of LPDDR3 products in the industry from 1GB to 2GB - Only provider of 2GB ultra-slim 0.8mm solution in the industry
□ Maintain competitive advantage in the premium memory market by taking the lead in high-capacity next generation LPDDR3 DRAM market in the future
□ Region: Global □ Launch: Aug ‘12 □ Name : 4GB LPDDR3 Mobile DRAM
Mass produce 20nm 128GB eMMC
internal storage for mobile
□ Mass produce high-capacity 20nm 128GB eMMC as the first in the world - Launched 128GB in Aug ’12 after mass production of 64GB in Jul '12 - Can store 15 8GB Full HD contents
□ Continue to expand next generation high-capacity mobile device market with 5 times faster speed than external memory card Class10
□ Region: Global □ Launch: Aug ‘12 □ Name : 128GB eMMC internal memory card
Mass produce 2ynm 4GB DDR3
DRAM for computer
□ Mass produce cutting-edge 2ynm 4GB DDR3 DRAM as the first in the world - Launched DRAM produced by new process for 4 consecutive years since '09 - Enhance product competitiveness with the best capacity low power consumption property
□ Continue to strengthen business competitive advantage by expanding sales in differentiated market through mass production of 20nm products in '13
□ Region: Global □ Launch: Oct ‘12 □ Name : 4GB DDR3 DRAM
Mass produce 2ynm
512GB SSD for computer
□ Mass produce the best performance high-capacity 512GB SSD in the world - Develop high-performance SSD with high-performance 3bit MLC as the first in the
industry - Lead market expansion by mass producing high-end/mass market SSD simultaneously
□ Continue to strengthen business competitiveness in the premium memory market by expanding premium ultra notebook market in '13
□ Region: Global □ Launch: Oct ‘12 □ Name : 512GB SSD

Samsung Electronics 2014 Business Report 51 / 170
Research Project Research Results and Expected Effect In case applied to a product, name of the product and application
Mass produce 10nm 64GB eMMC
internal storage for mobile
□ Mass produce 64GB eMMC with next generation standard as the first in the world - Launched next generation product after the launch of eMMC 4.5 product in Jul '12.7 - Equipped with best performance 10nm 64GB NAND since Oct '12
□ Take the lead in high performance mobile device market with subminiature package that has 10 times faster speed than external memory card Class10
□ Region: Global □ Launch: Nov ‘12 □ Name : 64GB eMMC internal memory card
Smart TV Service
□ Smart Hub service launch in ‘13 - Provides Smart Hub that enables easy and fast access to contents by category via
five panel UIs On TV: Recommends program based on viewing history by the hour Movies & TV Shows: Recommends popular/new VOD based on user’s viewing history Photos, Videos & Music: Provides list of recently played/recorded photos/music/videos Social: list of contents recommended by SNS friends/ video call Apps: Shows recommended/ downloaded apps
□ SDK 4.1 Public Release - Reinforces platform and ecosystem by adding major S/W module platform of ‘13 - Supports Linux and Mac emulator and provides local Cloud Emulator functions - Adds Smart Controller functions of ‘13 - Native IME (response to ’13 input device)
□ Region: Global □ Launch: Feb '13
Smart Input Device
□ Introduction of 2013 smart wireless keyboard Easy to control device with QWERTY text input and Touch Pad Supports multi pairing between BT standard devices including TV/mobile (shortcut)
□ Introduction of 2013 external camera Improves Skype resolution with 5M pixel camera EPTZ(Electronic Pan Tilt Zoom), Face Tracking One Hand Gesture Recognition
□ Region: Global □ Launch: Mar '13
HDD Broadcasting Multi-device (BD-F8500)
□ Key features Dual Tuner , CI , LAN, USB 2.0, HDMI, S-PDIF, Internal HDD, WiFi, Record 3D broadcasts
□ Development Applied ‘13 UX & Apps, Applied Fox-B, New Micom (Nuvoton, 32bit), Movie & TV Show,
Screen Mirroring, Remote Access
□ Region: Europe □ Launch: Mar ‘13
BD Player (BD-F7500)
□ Key features 4K 3D Wifi BDP premium model
Internal 4K Scaler / 2HDMI (4K/Audio) TV 7080 design matching VFD Front Display Smart Hub / Screen mirroring 2 x 2 Dual band Wifi module (minimized interference)
□ Development Scaler Chip for 4K HDMI exclusively for Audio (increase usability) Strengthen Smart Hub functions (Movie & TV Show, Screen Mirroring, Remote Access) Reinforce security with TrustZone
□ Region: Global □ Launch: Mar ‘13
Smart Interaction
□ Improved motion recognition - Improve motion sensitivity, Thumbs Up recognition
□ Increased interactive voice response supported countries - Countries added: Canada/Switzerland/Spain Countries supported: 9 (as of end-June) US, UK, Korea, France, Germany, Australia, Canada, Switzerland, Spain
□ Introduced built-in camera for OLED/UHD TV Reflected new developments on circuit/apparatus for OLED Design 5M pixels, support motion/face recognition (same spec as LED F8000)
□ Region: Global □ Launch: Jun ‘13 □ Applied products
- Motion recognition: TV with built-in camera
- Interactive voice response: Models of LED 6400 or higher
- Built-in camera: OLED TV KN55S9CAF, UHD TV 55/65 F9000

Samsung Electronics 2014 Business Report 52 / 170
Research Project Research Results and Expected Effect In case applied to a product, name of the product and application
Monitor (SC770)
□ Added Touch Monitor Line up in ‘13 - Introduced Touch Monitor to create a new market
□ Reinforced user convenience - Secured absolute advantage over competitors by providing differentiated usability&design
□ Optimum solution for using Touch - Fast Touch and 10 Points multi Touch possible by applying capacitive sensing Touch,
Windows8 certification - Ergonomic sliding stand structure - Wide viewing range Panel and contrast range three times wider than plain monitor
□ Premium design - Premium design with metallic materials - Narrow Bezel design that maximizes immersive experience when using Touch
□ Region: America/Europe/etc. □ Launch: Jun ‘13 □ Inch : 24"
Open Cell Monitor (SC590)
□ Seek to introduce Open Cell to Display product line - Introduced Open Cell model
□ Reinforced lineups - Open Cell new lineups - Cheaper model than existing SC570 model as responding to 27” Slim Design
□ Reinforced user convenience - Narrow Bezel Design provides immersive experience aesthetic value - Applied wide viewing range PLS Panel, reproduce vivid color in any angle - Increased connection devices such as PC and imaging device by supporting HDMI
□ Region: Global □ Launch: Aug ‘13 □ Inch : 27”
LFD ME95C
□ Product Concept - Ultra-large-size 95" LED LFD(world’s largest Edge LED LFD) - Slim Bezel & Depth Metallic Black Premium Design - Symmetric Design for both vertical/horizontal use - Valuable functions for Smart Meeting Room
□ Product specification - Support PIM Half Embedded structure - Support automatic Pivot, using sensor - Terminal: D -sub,DVI,Component(AV),DP,HDMIx3,RS232C
□Region: America/Europe/Domestic, etc.
□ Launch: Dec ‘13 □ Inch : 95”
Mobile AP development
□ Developed and mass produced big.LITTLE based octa-core Mobile AP as the first in the industry
- Maximized benefits of low power consumption with big.LITTLE based octa-core - GPU capacity twice the 'Exynos 4 Quad' products - Support WQXGA – can be applied to smartphone and tablet - Applied eMMC 5.0 and USB 3.0 interface as the first in the industry - Continue to secure the Company’s AP technology leadership
□ Region : Global □ Launch : Mar ‘13 □ Name : Exynos 5 Octa
Mass produce 10nm 128Gb NAND Flash
for mobile
□ Mass produced high capacity 10nm 128Gb NAND Flash - Launched twice the capacity of 10nm 64Gb in Nov ‘12 - Equipped best capacity 20nm 64Gb NAND from May ‘12
□ Strengthen product competitive edge and lead memory market growth with 128Gb NAND-based memory card and expansion of SSD market
□ Region : Global □ Launch : Mar ‘13 □ Name : 128Gb NAND Flash
Mass produce 20nm 1TB Server SSD
for Server
□ Mass produced world best performance 1TB class Server storage - High-efficiency solution for cloud service market - Enhanced Server system capacity by six fold, reduced power consumption by 30%
□ Lead premium SSD market growth by developing next generation SSD - Solidified competitive advantage with high value-added Server SSD
□ Region : Global □ Launch : Mar ‘13 □ Name : 960GB Server SSD
Smart card IC
□ Acquired 'CC EAL7' with Smart card IC as the first in the industry - Applied world-class design/manufacture/security technology - Established standard modeling that can resist various types of hacking attacks
Issue certification via ANSSI, a French security agency □ Promote the Company’s image as a leader of smart card IC technology and continue
to increase FSID market presence
□ Region : Global □ Launch : Mar ‘13 □ Name : S3FT9KF

Samsung Electronics 2014 Business Report 53 / 170
Research Project Research Results and Expected Effect In case applied to a product, name of the product and application
eFlash process
□ Developed 45nm eFlash process as the first in the industry - Secured commercialization technology by developing smart card IC test chip - Reduced power consumption 25%, data reading time 50% - Plan to mass produce the first commercialized product in 2H14 - Applied to MCU product foundry/ASIC business
□ Promote the Company’s image as a leader of smart card IC technology and induce foundry/ASIC customers
□ Region : Global □ Launch: May ‘13 □ Name: 45nm eFlash
160lm/W middle power LED package
□ Mass produced 160lm/W middle power, which is the best in the industry - Middle power achieved luminance efficiency of 160 lumen per watt - First to mass produce industry-best LED package
□ Promote the Company’s image as a leader of middle power technology and continue to secure LED market presence
□ Region : Global □ Launch: Feb ‘13 □ Name: LM561B
Mass produce 3D vertical
128Gb V-NAND Flash
□ Mass produce new concept 128Gb 3D V-NAND Flash as the first in the world - Overcome the limits of miniaturization by 3D CTF(Charge Trap Flash) cell structure innovation and vertical layer process innovation - Increased degree of integration by twofold/ cell life by tenfold/ writing speed by twofold
□ Secured Tera bit NAND mass production technology with 300 core patents - Strengthen technological competitive advantage to take the lead in large capacity market
□ Region : Global □ Launch: Aug ‘13 □ Name: 128Gb V-NAND Flash
Mobile 20nm
8Gb LPDDR4 DRAM
□ Develop next generation 20nm 8Gb LPDDR4 DRAM as the first in the world - Develop lowest power consumption/ highest speed mobile DRAM - Create LPDDR4 market in ’14 after LPDDR3 in '12
□ Build 20nm 8Gb DRAM mobile/server full lineup - Create new market by launching 4GB in ‘14, the largest capacity in mobile '
□ Region : Global □ Launch: Dec ‘13 □ Name : 8Gb LPDDR4
Mobile DRAM
Develop ISOCELL
Pixel technology
□ Develop next generation image sensor pixel technology as the first in the industry - Applied new method that isolates adjacent pixel - Enhanced sensitivity by minimizing loss of electric signal - Provide a sample of the first product with new technology
□ Strengthened the Company’s leadership in image sensor market
□ Region : Global □ Launch : Nov ‘13 □ Name : S5K4H5YB
Develop ultra-large-size/ high
resolution LCD TV panel
□ Mass produced 55”,65” UHD TV panel □ Strengthen market leadership and contribute to commercialization of UHD TV
by expanding UHD TV lineups
□ Region : Global □ Launch : Jun ‘13
Develop OLED TV panel (55”)
□ Take the lead in the next generation TV market by launching curved OLED TV □ Secure competitiveness by enabling Zero Pixel Defect definition
□ Region : Global □ Launch : Jun ‘13
Wearable Display Watch
□ Create new OLED Application market based on design differentiation □ Develop 1.63” high-resolution Compact Design
□ Region : Global □ Launch : Sep ‘13
Develop high-resolution OLED panel
□ Secure advantages in terms of resolution compare to competitors and strengthen market competitiveness by developing high-resolution technology
□ Mass produce smartphone OLED panel
□ Region : Global □ Launch : Apr ‘13
Develop Flexible technology
□ Secure advanced technology to take the lead in the next generation products □ Mass produce curved display for smartphone as the first in the world
□ Region : Global □ Launch : Oct ‘13
Develop UHD OLED TV panel
□ Develop R/G/B technology UHD products as the first in the world □ Reinforce market leadership and differentiate products by expanding UHD TV lineups
□ Region : Global □ Launch : TBD
High-resolution low power consumption
Tablet product technology
□ Mass produce high-resolution Tablet panel □ Achieved low power consumption of tablet products and higher rate of production by
enhancing transmissivity
□ Region : Global □ Launch : Feb ‘14
Mass produce Server
3D V-NAND based 960GB
high reliability SSD
□ Mass produced 3D V-NAND based high-reliability 960GB SSD as the first in the world Equal performance with SLC NAND SSD by using 3D V-NAND Increased customer value with high-reliability/high performance/high capacity/ low power consumption
□ Maximized efficiency of investment in datacenter with ultra power saving solution Secure competitiveness for expansion of next generation green IT market
□ Region : Global □ Launch : Sep ‘13 □ Name: 960GB 3D V-NAND SSD

Samsung Electronics 2014 Business Report 54 / 170
Research Project Research Results and Expected Effect In case applied to a product, name of the product and application
Mass produce 20nm 4GB
DDR3 DRAM for server
□ Mass produce ultra-fine 20nm 4GB DDR3 DRAM as the first in the world - Applied independently developed high-density/high-speed/low-power consumption technology - Enhanced productivity by 30% compare to 25nm
□ PC and server full line-up to be launched with 20nm 4GB DRAM - Enhance competitiveness by launching the whole line-up including mobile in the future
□ Region : Global □ Launch : Feb ‘14 □ Name : 4GB DDR3 DRAM
Develop new ISOCELL image sensor
□ Launched new 1600 megapixel ISOCELL image sensor - Clear image even in dark places - 16 megapixel / 30pfs per second (first in the industry) - 16:9 aspect ratio FullHD resolution
□ Developed 13 megapixel stacked ISOCELL image sensor - Smaller chip size and wider circuit range by applying stacked structure - Diversification of exposure with smart WDR function improves color in backlight
□ Region : Global □ Launch : Mar ‘14 □ Name : S5K2P2
Develop new mobile AP product
with HMP solution
□ Launched new Exynos 5 Octa (5422) product - Enhance power efficiency by combining and utilizing 8 high-capacity/low-power
consumption cores through applying HMP solution - Support WQHD and WQXGA ultra-high resolution - Strengthen low-power consumption capacity by using automatic conversion to
power save mode and mobile video compression technology □ Launched new Exynos 5 Hexa (5250) product
- Enhance power efficiency by combining and utilizing 6 high-capacity/low power consumption cores through applying HMP solution - Support WQXGA ultra-high resolution
□ Region : Global □ Launch: Jan/Mar ‘14 □ Name : Exynos5250/
Exynos5422
Develop new smart card product
□ Launched NFC with internal flash memory (e-flash) - Used 45nm e-flash logic process as the only one in the industry, which improves density and power efficiency compare to 90nm products - Miniaturized products by supporting smallest antenna solution - Enabled mobile POS through NFC chip as the first in the industry ※ POS (Point of Sales): point of sale information management system
□ Region : Global □ Launch: Jan ‘14 □ Name : S3FWRN5
UHD TV HU9000
□ Ultimate Curved UHD TV that provides perfect immersive experience - Adopted ergonomic Curved LED Panel
□ Clear differentiation values compare to competitors - Smart Hub function with Multi-Link Screen added - The only Evolutionary UHD TV
□ Premium design - Ergonomic Curved Design - The best premium image through Immersive Viewing Experience
□ Region : Global □ Launch: Mar ‘14 □ Inch : 55"/65"
UHD TV HU9000 (105")
□ Wide Curved(21:9) 105" UHD TV - Introduced ultra-large size 105" Curved UHD TV as the first in the world - Adopted SDC 4200R 105" Wide Curved Panel - Applied Golf-AP/MP Platform - Provide ultimate immersive experience and realistic viewing experience
□ Region : Middle East □ Launch : Jun ‘14 □ Inch : 105"
Mass produce 2nd generation V-NAND based 1TB SSD for PC
□ Mass produced 2nd generation 3D V-NAND based 1TB SSD as the first in the world - Opened up ‘the era of popularized 3D memory’ with 2nd generation V-NAND - Target PC market after creating server market last year
□ Launched high-reliability, high-capacity, low-power consumption V-NAND SSD line-up - Increased life by twofold and reduced power consumption by 20% compare to
existing SSD - Launch ‘V-NAND SSD’ in 53 nations around the world starting in July
□ Region : Global □ Launch : May ‘14 □ Name : 1TB, V-NAND SSD
Develop new ISOCELL Image sensor
□ Develop 13 megapixel stacked ISOCELL image sensor - Smaller chip size and wider circuit range by applying stacked structure - Diversification of exposure with smart WDR function improves color in backlight
□ Region : Global □ Launch : Jun ‘14 □ Name : S5K3M2

Samsung Electronics 2014 Business Report 55 / 170
Research Project Research Results and Expected Effect In case applied to a product, name of the product and application
Develop new mobile AP product
□ Launched new Exynos 5 Octa (5430) product - Increased power efficiency by applying 20nm low-power consumption HKMG process - Enhanced performance by applying HMP solution and can work individually depending on
low power core needs - Enhanced low power consumption property by using automatic conversion to power
save mode and mobile video compression technology - Support WQHD and WQXGA ultra high-resolution
□ Region : Global □ Launch : Jun ‘14 □ Name : Exynos 5430
UHD TV
(UN105S9WAF)
□ Product Concept - Wide Curved(21:9) 105” UHD TV - Need to solidify market leadership by introducing ultra-large size 105” UHD TV as
the first in the world □ Spec and effects
- Adopted SDC 4200R 105" Wide Curved Panel - Applied Golf-AP/MP Platform - Provide the ultimate immersive and realistic viewing experience
□ Region : Global □ Launch : Jul ‘14 □ Inch: 105”
LFD
QMD
□ Introduced Premium UHD Line Up - Introduced high resolution UHD LFD lineup - Applied SE13U Platform - Applied spec to respond to LFD Usage - Reduced additional investment costs by sharing TV HU7K design
□ Main functions - Support full HD screen split in 4 (2/3/4 splits) - DP 1.2 and SBB applicable
□ Region : Global □ Launch : Aug ‘14 □ Inch: 85”
Bendable TV Nov
(UN78S9BAF)
□ World’s first Bendable UHD TV - Secured technology leadership □ Design - Adopted Timeless Gallery Design - Becomes an aesthetic object when power is off
□ Region : Domestic □ Launch : Nov ‘14 □ Inch: 78”
Mass produce PC/server
32 layer 3bit 3D V-NAND
□ Mass produced the world’s first 3bit 3D V-NAND based 1TB SSD - Opened up the era of “popularized V-NAND SSD” with 3bit V-NAND - Target the standard SSD market with V-NAND that has 50% higher productivity □ Reinforced highly reliable, high-performance, low energy consuming V-NAND SSD lineup - Launched mSATA and M.2 SSD lineups in addition to the existing 2.5” - Launched '850 EVO SSD' in 53 nations around the world in Dec
□ Region : Global □ Launch : Oct ‘14 □ Inch: 128Gb 3bit 3D V-NAND (850 EVO SSD)
Mass produce mobile
20nm 8Gb LPDDR4 DRAM
□ Mass produced the world’s first ultrafine 20nm 8Gb LPDDR4 DRAM - Applied “highly integrated/ultrahigh speed/high-density” solution developed by the Company - Created the world’s first 4GB market and took the lead □ Led growth of the DRAM market by expanding 20nm DRAM lineup - Plan to take the lead in the market by expanding next-generation lineups(8/6/4Gb) in the
future
□ Region : Global □ Launch : Dec ‘14 □ Inch: 8Gb LPDDR4 DRAM

Samsung Electronics 2014 Business Report 56 / 170
11. Other Information
A. Intellectual Property Rights
In 2014, the Company invested KRW 15.3 trillion and registered 7,574 domestic and 14,342 overseas patents, including approval for 4,952 US patents. As a result, the Company maintained second place in terms of numbers of patents registered in US amongst global technology companies for nine (9) consecutive years since 2006.
<Number of Patents Registered in Each Country (as of December 31, 2014, cumulative)> (Unit: # of Patents)
Korea US Europe China Japan Others
Number 32,507 35,718 14,834 9,099 6,814 7,735
The Company registered its first US patent in 1984, and now holds 106,707 patents around the world. <Number of Patent Registrations Per Year>
(Unit: # of Patents)
‘14 ‘13 ‘12 ‘11 ‘10 ‘09 ‘08 ‘07
Korea 3,970 2,762 2,013 1,610 1,612 1,485 4,740 10,974
US 4,952 4,676 5,081 4,894 4,551 3,611 3,515 2,725
These patents are mostly related to smartphone, smart TV, flash memory, and system LSI products for the Company’s strategic business products or for future use. These patents not only protect the Company’s business but also play a role in keeping similar technology and patents, as well as competitors, in check. In addition, as some of the patents are for new materials and next-generation mobile communication, the Company expects them to protect its business in the future when it enters into new businesses.
The Company has also been focusing on securing design patents to protect its original design applied to smartphones and LED TVs. In 2014, the Company acquired 832 US patents, in part for the aforementioned purpose.
B. Environmental regulations
The Company strictly abides by environmental regulations on products and in the workplace, as prescribed by law. In addition, to following “the low carbon green growth policy” of the Korean government, the Company has been increasing the number of “Green Technology Certifications” and reports “the amount of CO2 emission and energy use” to the government and provides related information to stakeholders.
(See 『9. Green Management』 of 『XI. Other Information Related to Investment Protection』 for more details about
Green Technology Certification.)
(Environmental Regulation of Products)
The environmental regulation of products are becoming stricter reflecting the concerns of governments and regulators about potential direct and indirect impact of products to consumers’ health and safety as consumers. Accordingly, the Company is working to minimize the environmental impact throughout the entire life cycle of products from the development stage of components and products to manufacturing, distribution, use, and disposal. The Company offers “Eco-Partner Certification” to suppliers for components free of harmful substances, and runs an “eco-design evaluation”

Samsung Electronics 2014 Business Report 57 / 170
system to reflect eco-friendly elements on products (reduced use of resources, energy and harmful substances, and the use of eco-friendly materials) at the development stage, and operates a “waste electronics collection recycle system” in Europe, North America, Korea, and India for collecting and recycling waste electronics. These activities are in line with domestic and foreign environmental laws on electronics and are a differentiation factor for the Company and its products.
Relevant laws are as follows:
1. law on collection and· recycle of waste electronics (e.g., EU WEEE Directive)
2. limit on the use of harmful substances (e.g., EU RoHS Directive, REACH Regulation)
3. regulation on energy efficiency (e.g., EU ErP Directive)
(Environmental Regulations in the Workplace)
The Company operates environmental pollution prevention facilities to reduce air pollution, water pollution, and waste disposal, and to minimize the discharge of pollutants, thereby minimizing impact on the surrounding environment.
Environmental management of workplace is supervised by the relevant government authorities. All production facilities, domestic and overseas, have acquired the International Occupational Health and Safety Management System Certification (ISO 14001, OHSAS18001) to strengthen compliance.
Major Relevant Domestic and International Laws are as follows:
1. Regulations related to emission of pollutants: Water Quality and Ecosystem Conservation Act, Clean Air Conservation Act, Wastes Control Act, Noise and Vibration Control Act, Environmental Impact Assessment Act
2. Management of greenhouse gas emission: Greenhouse gas emission report, Goal management system
3. Others: Toxic Chemicals Control Act, Odor Control Law, Soil Environment Conservation Act
(Greenhouse gas emission and energy consumption management)
The Company is a “controlled entity” according to Article 42 of Korea’s “Framework Act on Low Carbon, Green Growth.” Thus, the Company has been reporting the amount of greenhouse gas emission and energy consumption, verified by a third-party, to the authorities and disclosing it to stakeholders according to Article 44 of the same Act since May 2011.
The reported amount of greenhouse gas emission and energy use are provided below:
2014 2013 2012
Greenhouse gas (Unit: tCO2e) 6,775,019 6,303,033 6,004,674
Energy (Unit: TJ) 101,386 96,298 91,330
※ 62 workplaces, including domestic manufacturing facilities, company buildings, and company owned buildings. ※ Reported Greenhouse gas emission excludes ozone depletion substances (ODS). The Company achieved its own greenhouse emission and energy consumption limit goal for 2014 through energy-saving activities and by installing energy efficient equipment to meet greenhouse gas reduction.

Samsung Electronics 2014 Business Report 58 / 170
III. Financial Affairs
1. Consolidated Financial Statements
CONSOLIDATED STATEMENTS OF FINANCIAL POSITION
(In millions of Korean won, in thousands of U.S dollars (refer to Ⅲ. 2 - 2.28))
December 31, December 31, December 31, December 31, Notes 2014 2013 2014 2013 KRW KRW USD USD Assets Current assets Cash and cash equivalents 4, 6, 7 16,840,766 16,284,780 15,997,688 15,469,535Short-term financial instruments 5, 6, 7 41,689,776 36,722,702 39,602,713 34,884,299Short-term available-for-sale
financial assets 6, 9
3,286,798 1,488,527 3,122,255 1,414,009Trade receivables 6, 7, 10 24,694,610 24,988,532 23,458,355 23,737,562Non-trade receivables 10 3,539,875 2,887,402 3,362,663 2,742,854Advances 1,989,470 1,928,188 1,889,874 1,831,660Prepaid expenses 3,346,593 2,472,950 3,179,057 2,349,150Inventories 11 17,317,504 19,134,868 16,450,560 18,176,943Other current assets 1,795,143 2,135,589 1,705,275 2,028,678Assets held-for-sale 12, 37 645,491 2,716,733 613,177 2,580,729Total current assets 115,146,026 110,760,271 109,381,617 105,215,419 Non-current assets
Long-term available-for-sale financial assets
6, 9 12,667,509 6,238,380 12,033,351 5,926,076
Investment in affiliates and joint ventures
12 5,232,461 6,422,292 4,970,515 6,100,781
Property, plant and equipment 13 80,872,950 75,496,388 76,824,309 71,716,907Intangible assets 14 4,785,473 3,980,600 4,545,904 3,781,324Long-term prepaid expenses 4,857,126 3,465,783 4,613,970 3,292,280Deferred income tax assets 29 4,526,595 4,621,780 4,299,986 4,390,406Other non-current assets 2,334,818 3,089,524 2,217,933 2,934,857Total assets 230,422,958 214,075,018 218,887,585 203,358,050

Samsung Electronics 2014 Business Report 59 / 170
CONSOLIDATED STATEMENTS OF FINANCIAL POSITION (In millions of Korean won, in thousands of U.S dollars (refer to Ⅲ. 2 - 2.28))
December 31, December 31, December 31, December 31, Notes 2014 2013 2014 2013 KRW KRW USD USD Liabilities and Equity Current liabilities Trade and other payables 6 7,914,704 8,437,139 7,518,480 8,014,761Short-term borrowings 6, 8, 15 8,029,299 6,438,517 7,627,338 6,116,194Other payables 6 10,318,407 9,196,566 9,801,850 8,736,170Advances received 1,427,230 1,706,313 1,355,780 1,620,892Withholdings 1,161,635 1,176,046 1,103,482 1,117,171Accrued expenses 12,876,777 11,344,530 12,232,143 10,776,603Income tax payable 2,161,109 3,386,018 2,052,920 3,216,508Current portion of long-term
liabilities 6, 15, 16 1,778,667 2,425,831 1,689,624 2,304,390Provisions 18 5,991,510 6,736,476 5,691,565 6,399,236Other current liabilities 326,259 467,973 309,930 444,548Liabilities held-for-sale 37 28,316 - 26,898 -Total current liabilities 52,013,913 51,315,409 49,410,010 48,746,473 Non-current liabilities
Debentures 6, 16 1,355,882 1,311,068 1,288,004 1,245,434Long-term borrowings 6, 15 101,671 985,117 96,581 935,800Long-term other payables 6 2,562,271 1,053,756 2,433,999 1,001,003Net defined benefit liabilities 17 201,342 1,854,902 191,262 1,762,042Deferred income tax liabilities 29 4,097,811 6,012,371 3,892,667 5,711,381Provisions 18 499,290 460,924 474,295 437,849Other non-current liabilities 1,502,590 1,065,461 1,427,368 1,012,122Total liabilities 62,334,770 64,059,008 59,214,186 60,852,104

Samsung Electronics 2014 Business Report 60 / 170
CONSOLIDATED STATEMENTS OF FINANCIAL POSITION (In millions of Korean won, in thousands of U.S dollars (refer to Ⅲ. 2 - 2.28))
Notes December 31, December 31, December 31, December 31,
2014 2013 2014 2013 KRW KRW USD USD Equity attributable to owners of the parent Preferred stock 20 119,467 119,467 113,486 113,486Common stock 20 778,047 778,047 739,097 739,097Share premium 4,403,893 4,403,893 4,183,426 4,183,426Retained earnings 21 169,529,604 148,600,282 161,042,656 141,161,092Other components of equity 23 (12,729,387) (9,459,073) (12,092,132) (8,985,535)Accumulated other comprehensive
income attributable to assets held-for-sale 37 80,101 - 76,091 -
162,181,725 144,442,616 154,062,624 137,211,566Non-controlling interests 5,906,463 5,573,394 5,610,775 5,294,380Total equity 168,088,188 150,016,010 159,673,399 142,505,946 Total liabilities and equity 230,422,958 214,075,018 218,887,585 203,358,050

Samsung Electronics 2014 Business Report 61 / 170
CONSOLIDATED STATEMENTS OF INCOME
(In millions of Korean won, in thousands of U.S dollars (refer to Ⅲ. 2 - 2.28))
For the year ended December 31,
Notes 2014 2013 2014 2013 KRW KRW USD USD
Revenue 206,205,987 228,692,667 195,882,955 217,243,913Cost of sales 25 128,278,800 137,696,309 121,856,939 130,802,991
Gross profit 77,927,187 90,996,358 74,026,016 86,440,922Selling and administrative expenses 25, 26 52,902,116 54,211,345 50,253,744 51,497,430Operating profit 25,025,071 36,785,013 23,772,272 34,943,492Other non-operating income 27 3,801,357 2,429,551 3,611,054 2,307,923Other non-operating expense 27 2,259,737 1,614,048 2,146,611 1,533,246Share of profit of affiliates
and joint ventures 12 342,516 504,063 325,369 478,829Financial income 28 8,259,829 8,014,672 7,846,328 7,613,444Financial expense 28 7,294,002 7,754,972 6,928,852 7,366,745Profit before income tax 27,875,034 38,364,279 26,479,560 36,443,697Income tax expense 29 4,480,676 7,889,515 4,256,366 7,494,552Profit for the year 23,394,358 30,474,764 22,223,194 28,949,145Profit attributable to owners of the
parent 23,082,499 29,821,215 21,926,949 28,328,313Profit attributable to non-controlling
interests 311,859 653,549 296,245 620,832Earnings per share for profit
attributable to owners of the parent (in Korean Won, in US dollars) 30
- Basic 153,105 197,841 145.44 187.94- Diluted 153,096 197,800 145.43 187.90

Samsung Electronics 2014 Business Report 62 / 170
CONSOLIDATED STATEMENTS OF COMPREHENSIVE INCOME (In millions of Korean won, in thousands of US dollars (refer to Ⅲ. 2 - 2.28))
For the year ended December 31,
Notes 2014 2013 2014 2013
KRW KRW USD USD
Profit for the year 23,394,358 30,474,764 22,223,194 28,949,145Other comprehensive loss Items not to be reclassified to profit or loss
subsequently: Remeasurement of net defined benefit liabilities, net of
tax 17, 23 (710,318) (213,113) (674,758) (202,444)Items to be reclassified to profit or loss
subsequently: Changes in value of available-for-sale financial assets,
net of tax 9, 23 (232,105) 186,480 (220,485) 177,144Share of other comprehensive income (loss) of
affiliates and joint ventures, net of tax 12, 23 (128,932) 20,756 (122,477) 19,717Foreign currency translation, net of tax 23 (922,059) (1,000,961) (875,899) (950,851)Other comprehensive loss for the year, net of tax (1,993,414) (1,006,838) (1,893,619) (956,434)Total comprehensive income for the year 21,400,944 29,467,926 20,329,575 27,992,711
Comprehensive income attributable to : Owners of the parent 20,990,732 28,837,590 19,939,900 27,393,930Non-controlling interests 410,212 630,336 389,675 598,781

Samsung Electronics 2014 Business Report 63 / 170
CONSOLIDATED STATEMENTS OF CHANGES IN EQUITY
(In millions of Korean won)
2013 KRW
Preferred stock
Common stock
Share premium
Retained earnings
Other components
of equity
Accumulated other
comprehensive income
attributable to assets held-for-sale
Equity attributable to owners of the parent
Non-controlling
interests Total
Notes
Balance as at January 1, 2013 119,467 778,047 4,403,893 119,985,689 (8,193,044) - 117,094,052 4,386,154 121,480,206 Profit for the year - - - 29,821,215 - - 29,821,215 653,549 30,474,764 Changes in value of available-for-sale
financial assets, net of tax 9, 23 - - - - 187,477 - 187,477 (997) 186,480 Share of other comprehensive income
(loss) of affiliates and joint ventures, net of tax 12, 23 - - - - 20,949 - 20,949 (193) 20,756
Foreign currency translation, net of tax 23 - - - - (986,691) - (986,691) (14,270) (1,000,961) Remeasurement of net defined benefit
liabilities, net of tax 17, 23 - - - - (205,360) - (205,360) (7,753) (213,113)
Total comprehensive income (loss) - - - 29,821,215 (983,625) - 28,837,590 630,336 29,467,926
Dividends 22 - - - (1,206,622) - - (1,206,622) (42,155) (1,248,777) Capital transaction under common
control
- - - - (312,959) - (312,959) 600,042 287,083 Changes in consolidated entities - - - - - - - (918) (918) Disposal of treasury stock 23, 24 - - - - 41,817 - 41,817 - 41,817 Stock option activities 23, 24 - - - - (11,999) - (11,999) - (11,999) Others - - - - 737 - 737 (65) 672 Total transactions with owners - - - (1,206,622) (282,404) - (1,489,026) 556,904 (932,122)
Balance as at December 31, 2013 119,467 778,047 4,403,893 148,600,282 (9,459,073) - 144,442,616 5,573,394 150,016,010

Samsung Electronics 2014 Business Report 64 / 170
CONSOLIDATED STATEMENTS OF CHANGES IN EQUITY
(In thousands of US dollars (refer to Ⅲ. 2 - 2.28))
2013 USD
Preferred stock
Common stock
Share premium
Retained earnings
Other components
of equity
Accumulated other
comprehensive income
attributable to assets held-for-sale
Equity attributable to owners of the parent
Non-controlling
interests Total
Notes
Balance as at January 1, 2013 113,486 739,097 4,183,426 113,978,996 (7,782,886) - 111,232,119 4,166,575 115,398,694 Profit for the year - - - 28,328,313 - - 28,328,313 620,832 28,949,145 Changes in value of available-for-sale
financial assets, net of tax 9, 23 - - - - 178,091 - 178,091 (947) 177,144 Share of other comprehensive income
(loss) of affiliates and joint ventures, net of tax 12, 23 - - - - 19,900 - 19,900 (183) 19,717
Foreign currency translation, net of tax 23 - - - - (937,295) - (937,295) (13,556) (950,851) Remeasurement of net defined benefit
liabilities, net of tax 17, 23 - - - - (195,079) - (195,079) (7,365) (202,444)
Total comprehensive income (loss) - - - 28,328,313 (934,383) - 27,393,930 598,781 27,992,711
Dividends 22 - - - (1,146,217) - - (1,146,217) (40,045) (1,186,262) Capital transaction under common
control
- - - - (297,292) - (297,292) 570,003 272,711 Changes in consolidated entities - - - - - - - (872) (872) Disposal of treasury stock 23, 24 - - - - 39,724 - 39,724 - 39,724 Stock option activities 23, 24 - - - - (11,398) - (11,398) - (11,398) Others - - - - 700 - 700 (62) 638 Total transactions with owners - - - (1,146,217) (268,266) - (1,414,483) 529,024 (885,459)
Balance as at December 31, 2013 113,486 739,097 4,183,426 141,161,092 (8,985,535) - 137,211,566 5,294,380 142,505,946

Samsung Electronics 2014 Business Report 65 / 170
CONSOLIDATED STATEMENTS OF CHANGES IN EQUITY (In millions of Korean won)
2014 KRW
Preferred stock
Common stock
Share premium
Retained earnings
Other components
of equity
Accumulated other
comprehensive income
attributable to assets held-for-sale
Equity attributable to owners of the parent
Non-controlling
interests Total
Notes
Balance as at January 1, 2014 119,467 778,047 4,403,893 148,600,282 (9,459,073) - 144,442,616 5,573,394 150,016,010 Profit for the year - - - 23,082,499 - - 23,082,499 311,859 23,394,358 Changes in value of available-for-sale
financial assets, net of tax 9, 23 - - - - (314,069) - (314,069) 81,964 (232,105) Share of other comprehensive income
(loss) of affiliates and joint ventures, net of tax 12, 23 - - - - (128,495) - (128,495) (437) (128,932)
Foreign currency translation, net of tax 23 - - - - (954,999) - (954,999) 32,940 (922,059) Remeasurement of net defined benefit
liabilities, net of tax 17, 23 - - - - (694,204) - (694,204) (16,114) (710,318) Classified as held-for-sale 37 - - - - (80,101) 80,101 - - -
Total comprehensive income (loss) - - - 23,082,499 (2,171,868) 80,101 20,990,732 410,212 21,400,944
Dividends 22 - - - (2,157,011) - - (2,157,011) (74,216) (2,231,227) Capital transaction under common
control
- - - - (158) - (158) 244 86 Changes in consolidated entities - - - - - - - 569 569 Acquisition of treasury stock 23, 24 - - - - (1,125,322) - (1,125,322) - (1,125,322) Disposal of treasury stock 23, 24 - - - - 32,764 - 32,764 - 32,764 Stock option activities 23, 24 - - - - (9,436) - (9,436) - (9,436) Others - - - 3,834 3,706 - 7,540 (3,740) 3,800 Total transactions with owners - - - (2,153,177) (1,098,446) - (3,251,623) (77,143) (3,328,766)
Balance as at December 31, 2014 119,467 778,047 4,403,893 169,529,604 (12,729,387) 80,101 162,181,725 5,906,463 168,088,188

Samsung Electronics 2014 Business Report 66 / 170
CONSOLIDATED STATEMENTS OF CHANGES IN EQUITY (In thousands of US dollars (refer to Ⅲ. 2 - 2.28))
2014 USD
Preferred stock
Common stock
Share premium
Retained earnings
Other components
of equity
Accumulated other
comprehensive income
attributable to assets held-for-sale
Equity attributable to owners of the parent
Non-controlling
interests Total
Notes
Balance as at January 1, 2014 113,486 739,097 4,183,426 141,161,092 (8,985,535) - 137,211,566 5,294,380 142,505,946 Profit for the year - - - 21,926,949 - - 21,926,949 296,245 22,223,194 Changes in value of available-for-sale
financial assets, net of tax 9, 23 - - - - (298,346) - (298,346) 77,861 (220,485) Share of other comprehensive income
(loss) of affiliates and joint ventures, net of tax 12, 23 - - - - (122,062) - (122,062) (415) (122,477)
Foreign currency translation, net of tax 23 - - - - (907,190) - (907,190) 31,291 (875,899) Remeasurement of net defined benefit
liabilities, net of tax 17, 23 - - - - (659,451) - (659,451) (15,307) (674,758) Classified as held-for-sale 37 - - - - (76,091) 76,091 - - -
Total comprehensive income (loss) - - - 21,926,949 (2,063,140) 76,091 19,939,900 389,675 20,329,575
Dividends 22 - - - (2,049,027) - - (2,049,027) (70,500) (2,119,527) Capital transaction under common
control
- - - - (150) - (150) 232 82 Changes in consolidated entities - - - - - - - 541 541 Acquisition of treasury stock 23, 24 - - - - (1,068,987) - (1,068,987) - (1,068,987) Disposal of treasury stock 23, 24 - - - - 31,124 - 31,124 - 31,124 Stock option activities 23, 24 - - - - (8,964) - (8,964) - (8,964) Others - - - 3,642 3,520 - 7,162 (3,553) 3,609 Total transactions with owners - - - (2,045,385) (1,043,457) - (3,088,842) (73,280) (3,162,122)
Balance as at December 31, 2014 113,486 739,097 4,183,426 161,042,656 (12,092,132) 76,091 154,062,624 5,610,775 159,673,399

Samsung Electronics 2014 Business Report 67 / 170
CONSOLIDATED STATEMENTS OF CASH FLOWS
(In millions of Korean won, in thousands of U.S dollars (refer to Ⅲ. 2 - 2.28))
For the year ended December 31,
Notes 2014 2013 2014 2013
KRW KRW USD USD Cash flows from operating activities
Profit for the year 23,394,358 30,474,764 22,223,194 28,949,145
Adjustments 31 22,323,765 23,804,832 21,206,200 22,613,120
Changes in operating assets and liabilities 31 (3,837,136) (1,313,245) (3,645,042) (1,247,502)
Cash flows from operating activities 41,880,987 52,966,351 39,784,352 50,314,763
Interest received 1,555,373 1,034,074 1,477,508 982,306
Interest paid (463,740) (434,857) (440,524) (413,087)
Dividend received 1,495,658 592,217 1,420,783 562,570
Income tax paid (7,492,889) (7,450,345) (7,117,782) (7,077,368)Net cash generated from operating activities 36,975,389 46,707,440 35,124,337 44,369,184
Cash flows from investing activities Net increase in short-term financial
instruments (1,110,842) (19,391,643) (1,055,231) (18,420,863)Net decrease (increase) in short-term
available-for-sale financial assets (713,452) 33,663 (677,735) 31,978Proceeds from disposal of long-term
available-for-sale financial assets 202,904 1,691,463 192,746 1,606,785Acquisition of long-term available-
for-sale financial assets (6,212,102) (1,531,356) (5,901,113) (1,454,694)Proceeds from disposal of affiliates
and joint ventures 2,014,430 240 1,913,584 228Acquisition of affiliates and joint
ventures (719,800) (181,307) (683,766) (172,230)Disposal of property, plant and
equipment 385,610 377,445 366,306 358,549Purchases of property, plant and
equipment (22,042,943) (23,157,587) (20,939,435) (21,998,278)
Disposal of intangible assets 31,731 4,562 30,142 4,334
Purchases of intangible assets (1,324,307) (934,743) (1,258,010) (887,948)
Cash outflows from business combination (176,625) (167,155) (167,783) (158,787)
Others (3,141,012) (1,490,601) (2,983,767) (1,415,979)
Net cash used in investing activities (32,806,408) (44,747,019) (31,164,062) (42,506,905)

Samsung Electronics 2014 Business Report 68 / 170
CONSOLIDATED STATEMENTS OF CASH FLOWS
(In millions of Korean won, in thousands of U.S dollars (refer to Ⅲ. 2 - 2.28))
For the year ended December 31,
Notes 2014 2013 2014 2013
KRW KRW USD USD
Cash flows from financing activities Net increase (decrease) in short-term
borrowings 1,833,419 (1,861,536) 1,741,635 (1,768,344)Acquisition of treasury stock (1,125,322) - (1,068,986) -Disposal of treasury stock 27,582 34,390 26,201 32,668Proceeds from long-term borrowings
and debentures 1,740,573 26,672 1,653,437 25,337Repayment of long-term borrowings
and debentures (3,299,595) (1,368,436) (3,134,412) (1,299,930)
Payment of dividends (2,233,905) (1,249,672) (2,122,072) (1,187,111)Net increase in non-controlling
interests 139 281,551 132 267,456
Net cash used in financing activities (3,057,109) (4,137,031) (2,904,065) (3,929,924)
Effect of exchange rate changes on
cash and cash equivalents (555,886) (330,070) (528,057) (313,546)Net increase (decrease) in cash and
cash equivalents 555,986 (2,506,680) 528,153 (2,381,191)
Cash and cash equivalents
Beginning of the year 16,284,780 18,791,460 15,469,535 17,850,726
End of the year 16,840,766 16,284,780 15,997,688 15,469,535

Samsung Electronics 2014 Business Report 69 / 170
2. Notes to Consolidated Financial Statements
1. General Information
1.1 Company Overview Samsung Electronics Co., Ltd. (“SEC”) was incorporated under the laws of the Republic of Korea in 1969 and listed its shares on the Korea Stock Exchange in 1975. SEC and its subsidiaries (collectively referred to as the “Company”) operate three business Divisions: Consumer Electronics (“CE”), Information technology & Mobile communications (“IM”), and Device Solution (“DS”). The CE Division includes digital TVs, monitors, printers, air conditioners and refrigerators and the IM Division includes mobile phones, communication systems, and computers. The DS Division manufactures products such as memory and system LSI products in the semiconductor business (“Semiconductor Business”, or when the context requires, “Semiconductor Sub-Division”), and LCD and OLED panels in the display panel business (“DP Business Unit”). SEC is domiciled in the Republic of Korea and the address of its registered office is Suwon, the Republic of Korea. These consolidated financial statements have been prepared in accordance with the Korean International Financial Reporting Standards (“Korean IFRS”) 1110, Consolidated Financial Statements. SEC, as the controlling company, consolidates its 158 subsidiaries, including Samsung Display and Samsung Electronics America (Note 1.2). The Company also applies the equity method of accounting to its 37 affiliates, including Samsung Electro-Mechanics. 1.2 Consolidated Subsidiaries (A) The consolidated subsidiaries as at December 31, 2014 are as follows:
Area Subsidiaries Industry Percentage of
ownership1
Domestic
High Pioneer Private Investment Trust #1 Technology business, Venture capital investments 100.0 Samsung Display (SDC) Manufacture and sale of display panels 84.8
SU Materials Manufacture of LCD components 50.0
STECO Manufacture of semiconductor components 51.0
SEMES Manufacture of semiconductor/FPD 91.5
Samsung Electronics Service Repair services for electronic devices 99.3
Samsung Electronics Sales Sale of electronic devices 100.0
Samsung Electronics Logitech General logistics agency 100.0
Samsung Medison Medical equipment 68.5
Ray Dental CT 68.1
Samsung Venture Capital Union #6 Technology business, Venture capital investments 99.0
Samsung Venture Capital Union #14 Technology business, Venture capital investments 99.0
Samsung Venture Capital Union #20 Technology business, Venture capital investments 99.0
Samsung Venture Capital Union #21 Technology business, Venture capital investments 99.0
Samsung Venture Capital Union #22 Technology business, Venture capital investments 99.0
Samsung Venture Capital Union #23 Technology business, Venture capital investments 99.0
Samsung Venture Capital Union #26 Technology business, Venture capital investments 99.0
Samsung Venture Capital Union #27 Technology business, Venture capital investments 99.0
America
Samsung Electronics America (SEA) Sale of electronic devices 100.0
NexusDX (Nexus) Medical equipment 100.0
Samsung Receivables (SRC) Credit management 100.0
NeuroLogica Medical equipment 100.0

Samsung Electronics 2014 Business Report 70 / 170
Area Subsidiaries Industry Percentage of
ownership1 Samsung Semiconductor (SSI) Sale of semiconductor/LCD 100.0
Samsung Electronics Canada (SECA) Sale of electronic devices 100.0
Samsung Research America (SRA) R&D 100.0
Grandis R&D 100.0
Samsung Mexicana (SAMEX) Manufacture of electronic devices 100.0
Samsung International (SII) Manufacture of CTV/monitors 100.0
Samsung Telecommunications America (STA) Sale of communication equipment 100.0
Samsung Austin Semiconductor (SAS) Manufacture of semiconductor 100.0
Samsung Electronics Mexico (SEM) Sale of electronic devices 99.9
SEMES America (SEMESA) Semiconductor equipment 100.0
Samsung Electronics Digital Appliance Mexico (SEDAM)
Manufacture of electronic devices 99.9
Samsung Electronics Latinoamerica Miami (SEMI) Sale of electronic devices 100.0
Nvelo Software 100.0
Samsung Electronics Latinoamerica (SELA) Sale of electronic devices 100.0
Samsung Electronics Venezuela (SEVEN) Marketing and services 100.0 Samsung Electronica Colombia (SAMCOL) Sale of electronic devices 100.0
Samsung Electronics Panama (SEPA) Consulting 100.0
Samsung Electronica da Amazonia (SEDA) Manufacture and sale of electronic devices 100.0
Samsung Electronics Argentina (SEASA) Marketing and services 100.0
Samsung Electronics Chile (SECH) Sale of electronic devices 100.0
Samsung Electronics Peru (SEPR) Sale of electronic devices 100.0
RT SV CO-INVEST (RT-SV) Technology business, Venture capital investments 99.9
Quietside Sale of heating and cooling products 100.0
SmartThings Sale of smart home electronics 100.0
PrinterOn Sale of printing solutions 100.0
PrinterOn America Sale of printing solutions 100.0
Europe
Samsung Electronics (UK) (SEUK) Sale of electronic devices 100.0
Samsung Electronics Holding (SEHG) Holding Company 100.0
Samsung Semiconductor Europe GmbH (SSEG) Sale of semiconductor/LCD 100.0
Samsung Electronics GmbH (SEG) Sale of electronic devices 100.0
Samsung Electronics Iberia (SESA) Sale of electronic devices 100.0
Samsung Electronics France (SEF) Sale of electronic devices 100.0
Samsung Electronics Hungarian (SEH) Manufacture and sale of electronic devices 100.0
Samsung Electronics Czech and Slovak (SECZ) Sale of electronic devices 100.0
Samsung Electronics Italia (SEI) Sale of electronic devices 100.0
Samsung Electronics Europe Logistics (SELS) Logistics 100.0
Samsung Electronics Benelux (SEBN) Sale of electronic devices 100.0
Samsung Display Slovakia (SDSK) Toll processing of LCD 100.0
Samsung Electronics Romania (SEROM) Sale of electronic devices 100.0
Samsung Electronics Overseas (SEO) Sale of electronic devices 100.0
Samsung Electronics Polska (SEPOL) Sale of electronic devices 100.0
Samsung Electronics Portuguesa (SEP) Sale of electronic devices 100.0
Samsung Electronics Nordic (SENA) Sale of electronic devices 100.0
Samsung Semiconductor Europe (SSEL) Sale of semiconductor/LCD 100.0
Samsung Electronics Austria (SEAG) Sale of electronic devices 100.0
Samsung Electronics Slovakia (SESK) Manufacture of CTV/monitors 100.0
Samsung Electronics Europe Holding (SEEH) Holding Company 100.0
Samsung Electronics Poland Manufacturing (SEPM)
Manufacture of home appliances 100.0
Samsung Electronics Greece (SEGR) Sale of electronic devices 100.0
Samsung Nanoradio Design Center (SNDC) R&D 100.0

Samsung Electronics 2014 Business Report 71 / 170
Area Subsidiaries Industry Percentage of
ownership1 Nanoradio Hellas R&D 100.0
SonoAce Deutschland (SMDE) Medical equipment 100.0
Samsung Electronics Rus (SER) Marketing 100.0
Samsung Electronics Rus Company (SERC) Sale of electronic devices 100.0 Samsung Electronics Ukraine (SEU) Marketing 100.0
Samsung Electronics Baltics (SEB) Sale of electronic devices 100.0
Samsung Electronics Ukraine Company (SEUC) Sale of electronic devices 100.0
Samsung R&D Institute Rus (SRR) R&D 100.0
Samsung Electronics Kazakhstan (SEK) Marketing 100.0
Samsung Electronics Central Eurasia (SECE) Sale of electronic devices 100.0
Samsung Electronics Rus Kaluga (SERK) Manufacture of CTV 100.0
Samsung Russia Service Centre (SRSC) Services 100.0
Samsung Electronics (London) Limited (SEL) Holding Company 100.0
Samsung Denmark Research Center (SDRC) R&D 100.0
Samsung France Research Center (SFRC) R&D 100.0
Samsung Cambridge Solution Centre (SCSC) R&D 100.0
Samsung Electronics Switzerland GmbH (SESG) Sale of electronic devices 100.0
PrinterOn Europe Sale of printing solutions 100.0
Samsung Electronics Caucasus (SECC) Marketing 100.0
Middle East and Africa
Samsung Electronics West Africa (SEWA) Marketing 100.0
Samsung Electronics East Africa (SEEA) Marketing 100.0
Samsung Gulf Electronics (SGE) Sale of electronic devices 100.0
Samsung Electronics Egypt (SEEG) Manufacture of CTV/monitors 100.0
Samsung Electronics Israel (SEIL) Marketing 100.0
Samsung Electronics Tunisia (SETN) Marketing 100.0
Samsung Electronics Pakistan (SEPAK) Marketing 100.0
Samsung Electronics South Africa (SSA) Sale of electronic devices 100.0
Samsung Electronics Turkey (SETK) Sale of electronic devices 100.0
Samsung Semiconductor Israel R&D Center (SIRC)
R&D 100.0
Samsung Electronics Levant (SELV) Sale of electronic devices 100.0
Samsung Electronics Morocco (SEMRC) Sale of electronic devices 100.0
Samsung Electronics South Africa Production (SSAP)
Manufacture of CTV/monitors 100.0
China
Samsung Display Dongguan (SDDG) Manufacture of LCD 100.0
Samsung Display Tianjin (SDTJ) Manufacture of LCD 95.0
Samsung Electronics Hong Kong (SEHK) Sale of electronic devices 100.0
Suzhou Samsung Electronics (SSEC) Manufacture of home appliances 88.3
Samsung Suzhou Electronics Export (SSEC-E)
Manufacture of home appliances 100.0
Samsung (China) Investment (SCIC) Sale of electronic devices 100.0
Samsung Mobile R&D Center China-Guangzhou (SRC-Guangzhou)
R&D 100.0
Samsung Tianjin Mobile Development Center (STMC)
R&D 100.0
Samsung Network R&D Center China-Shenzhen (SRC-Shenzhen)
R&D 100.0
Samsung Electronics Suzhou Semiconductor (SESS) Toll processing of semiconductor 100.0
Samsung Electronics (Shandong) Digital Printing (SSDP)
Manufacture of printers 100.0
Samsung Electronics Huizhou (SEHZ) Manufacture of electronic devices 99.9
Tianjin Samsung Electronics (TSEC) Manufacture of CTV/monitors 91.2
Samsung Electronics Taiwan (SET) Sale of electronic devices 100.0
Beijing Samsung Telecom R&D Center (BST) R&D 100.0

Samsung Electronics 2014 Business Report 72 / 170
Area Subsidiaries Industry Percentage of
ownership1 Tianjin Samsung Telecom Technology (TSTC) Manufacture of communication equipment 90.0
Shanghai Samsung Semiconductor (SSS) Sale of semiconductor/LCD 100.0
Samsung Electronics Suzhou Computer (SESC) Manufacture of electronic devices 100.0
Samsung Display Suzhou (SDSZ) Toll processing of LCD 100.0
Samsung Suzhou LCD (SSL) Manufacture of LCD 60.0
Shenzhen Samsung Electronics Telecommunication (SSET)
Manufacture of communication equipment 95.0
Samsung Electronics Shanghai Telecommunication (SSTC)
Sale of mobile communication and network equipment 100.0
Samsung Semiconductor (China) R&D (SSCR) R&D 100.0
Samsung Electronics China R&D Center (SCRC) R&D 100.0
Samsung (China) Semiconductor (SCS) Manufacture of semiconductor 100.0
Samsung Electronics Hainan Fiberoptics (SEHF) Manufacture of optical fiber/cable 100.0
Samsung Electronics (Beijing) Service (SBSC) Services 100.0
Samsung Medison Shanghai Medical Instrument (SMS1)
Medical equipment 100.0
Tianjin Samsung LED (TSLED) Manufacture of LED 100.0
Tianjin Samsung Opto-Electronics (TSOE) Manufacture of cameras/camcorders 90.0
Samsung R&D Institute China-Xian (SRC-Xian)
R&D 100.0
SEMES (Xian) Semiconductor equipment 100.0
Rest of Asia
Samsung Japan (SJC) Sale of electronic devices 100.0
Samsung R&D Institute Japan (SRJ) R&D 100.0
Samsung Electronics Japan (SEJ) Sale of electronic devices 100.0
Samsung Electronics Display (M) (SDMA) Manufacture and sale of electronic devices 100.0
Samsung Electronics (M) (SEMA) Manufacture of home appliances 100.0
Samsung Vina Electronics (SAVINA) Manufacture and sale of electronic devices 100.0
Samsung Asia Private (SAPL) Sale of electronic devices 100.0
Samsung India Electronics (SIEL) Manufacture and sale of electronic devices 100.0
Samsung R&D Institute India-Bangalore (SRI-B) R&D 100.0
Samsung Electronics Australia (SEAU) Sale of electronic devices 100.0
Samsung Electronics Indonesia (SEIN) Manufacture and sale of electronic devices 100.0
Samsung Telecommunications Indonesia (STIN) Sale and services of communication systems 100.0
Thai Samsung Electronics (TSE) Manufacture and sale of electronic devices 91.8
Samsung Electronics Philippines (SEPCO) Sale of electronic devices 100.0
Samsung Malaysia Electronics (SME) Sale of electronic devices 100.0
Samsung R&D Institute Bangladesh (SRBD) R&D 100.0
Samsung Electronics Vietnam (SEV) Manufacture of electronic devices 100.0
Samsung Telecommunications Malaysia (STM) Communication system services 100.0
Samsung Electronics Vietnam THAINGUYEN (SEVT)
Manufacture of communication equipment 100.0
Samsung Medison India (SMIN) Medical equipment 100.0
Samsung Electronics New Zealand (SENZ) Sale of electronic devices 100.0
Samsung Display Bac Ninh (SDBN) Manufacture of LCD 100.0
1 Ownership represents the Company’s ownership of voting rights in each entity.

Samsung Electronics 2014 Business Report 73 / 170
(B) A summary of financial data of major consolidated subsidiaries is as follows:
(1) 2014
2014 (In millions of Korean won) Assets Liabilities Sales Net Income (Loss)
Samsung Display (SDC) ₩ 37,939,965 ₩ 6,728,991 ₩ 24,980,628 ₩ 1,698,239 Samsung Electronics America (SEA) 10,697,787 5,409,749 14,076,007 (80,403)Samsung (China) Investment (SCIC) 9,603,679 7,830,941 16,451,983 162,677 Samsung Semiconductor (SSI) 7,577,935 3,883,673 19,105,338 194,713 Samsung Electronics Europe Holding (SEEH) 7,022,746 5,062,988 - 93,605 Samsung (China) Semiconductor (SCS) 6,765,278 3,911,166 877,508 166,754 Samsung Electronics Vietnam (SEV) 6,553,628 1,251,667 19,811,537 2,012,173 Samsung Austin Semiconductor (SAS) 6,503,003 3,375,099 2,423,230 78,747 Samsung Telecommunications America (STA) 5,321,014 4,573,413 23,002,379 66,255 Samsung Electronics Huizhou (SEHZ) 4,966,486 1,258,635 17,166,345 829,880 Samsung Electronics Vietnam THAINGUYEN (SEVT) 3,957,700 3,042,402 8,265,414 772,450 Samsung Electronica da Amazonia (SEDA) 3,797,166 1,330,302 7,936,105 887,715 Samsung Asia Private (SAPL) 3,110,433 671,729 1,423,212 1,057,873 Samsung India Electronics (SIEL) 2,949,605 1,776,936 6,849,389 428,757 Shanghai Samsung Semiconductor (SSS) 2,560,852 2,120,738 13,331,324 125,239 Tianjin Samsung Telecom Technology (TSTC) 2,316,054 789,395 11,413,234 510,357 Samsung Electronics Slovakia (SESK) 1,869,697 405,089 4,248,232 142,416 Samsung Suzhou LCD (SSL) 1,831,794 768,230 815,705 (38,931)Thai Samsung Electronics (TSE) 1,654,988 307,109 4,442,707 202,647 Samsung Electronics Europe Logistics (SELS) 1,621,583 1,524,468 13,320,129 38,209 Samsung Electronics Taiwan (SET) 1,583,027 1,299,330 4,472,432 44,559 Samsung Electronics Hungarian (SEH) 1,287,972 323,972 3,113,297 109,549 Samsung Electronics (UK) (SEUK) 1,235,239 964,058 4,304,335 72,231 Samsung Electronics Benelux (SEBN) 1,207,723 245,237 2,394,375 30,404 Samsung Electronics GmbH (SEG) 1,142,897 1,082,420 6,377,894 (17,881)
(2) 2013 2013
(In millions of Korean won) Assets Liabilities Sales Net Income
(Loss)
Samsung Display (SDC) ₩ 35,754,894 ₩ 6,682,229 ₩ 29,386,907 ₩ 2,400,779 Samsung Electronics America (SEA) 12,248,560 7,262,519 14,321,018 70,690 Samsung (China) Investment (SCIC) 8,406,438 6,780,610 25,605,822 743,369 Samsung Semiconductor (SSI) 7,346,339 3,991,768 17,932,937 39,289 Samsung Austin Semiconductor (SAS) 6,393,348 3,467,968 2,409,773 60,980 Samsung Electronics Europe Holding (SEEH) 5,780,302 4,025,760 - (17,863)Samsung Electronics Vietnam (SEV) 5,625,759 1,493,868 26,594,578 3,087,252 Samsung Telecommunications America (STA) 4,735,432 4,085,299 21,387,737 173,510 Samsung Electronics Huizhou (SEHZ) 4,599,200 1,802,686 22,664,923 1,012,728 Samsung (China) Semiconductor (SCS) 3,752,682 1,284,560 - (40,537)Samsung Electronica da Amazonia (SEDA) 3,429,136 1,658,072 7,852,428 920,157 Tianjin Samsung Telecom Technology (TSTC) 2,939,027 1,415,277 15,293,633 767,822 Samsung Asia Private (SAPL) 2,425,585 1,099,521 1,558,990 674,510 Samsung India Electronics (SIEL) 1,924,832 1,195,824 6,737,419 324,171 Samsung Electronics Europe Logistics (SELS) 1,903,892 1,806,486 14,543,524 7,613 Samsung Electronics Slovakia (SESK) 1,764,078 317,224 4,561,795 140,825 Samsung Electronics Mexico (SEM) 1,554,638 1,311,133 3,261,067 9,886 Thai Samsung Electronics (TSE) 1,476,296 373,181 5,033,203 222,389 Samsung Suzhou LCD (SSL) 1,463,589 379,118 18,892 12,067 Samsung Electronics Rus Company (SERC) 1,410,054 1,107,915 5,809,646 (11,137)Samsung Electronics (UK) (SEUK) 1,393,507 705,504 6,075,490 92,969 Samsung Electronics Taiwan (SET) 1,390,404 1,141,842 3,909,546 30,802 Shanghai Samsung Semiconductor (SSS) 1,310,109 1,005,056 15,937,922 130,082 Samsung Electronics Benelux (SEBN) 1,290,124 322,622 2,700,887 25,233 Samsung Electronics Hungarian (SEH) 1,249,691 253,536 3,272,358 103,658

Samsung Electronics 2014 Business Report 74 / 170
(C) Changes in scope of consolidation
(1) Subsidiaries newly included in the consolidation for the year ended December 31, 2014:
Area Subsidiary Description Domestic Samsung Venture Capital Union #26 Incorporation
Samsung Venture Capital Union #27 Incorporation America RT SV CO-INVEST (RT-SV) Acquisition of shares
Quietside Acquisition of shares
SmartThings Acquisition of shares PrinterOn Acquisition of shares
PrinterOn America Acquisition of shares 1397011 Ontario Acquisition of shares
Europe PrinterOn Europe Acquisition of shares Samsung Electronics Caucasus (SECC) Incorporation
Middle East and Africa
Samsung Electronics South Africa Production (SSAP) Incorporation
Asia Samsung Display Bac Ninh (SDBN) Incorporation
(2) Subsidiaries excluded from the consolidation for the year ended December 31, 2014:
Area Subsidiary Description
Domestic World Cyber Games Liquidation Samsung Electronics Football Club Disposal
America 1397011 Ontario Liquidation
Europe Samsung Medison Europe (SMNL) Liquidation
Nanogen Recognomics (Nanogen) Liquidation Asia Medison Medical Systems (India) (MI) Liquidation
China Medison Medical Equipment (Shanghai) (MMS) Liquidation
Samsung Electronics 2014 Business Report 75 / 170
2. Summary of Significant Accounting Policies
The principal accounting policies applied in the preparation of these consolidated financial statements are set out below. These policies have been consistently applied to all the years presented, unless otherwise stated.
2.1 Basis of Presentation
The Company maintains its accounting records in Korean won and prepares statutory financial statements in the Korean language (Hangul) in accordance with the International Financial Reporting Standards as adopted by the Republic of Korea (“Korean IFRS”). The accompanying consolidated financial statements have been condensed, restructured and translated into English from the Korean language financial statements. Certain information attached to the Korean language financial statements, but not required for a fair presentation of the Company's financial position, financial performance or cash flows, is not presented in the accompanying consolidated financial statements. The consolidated financial statements of the Company presented have been prepared in accordance with Korean IFRS. International Financial Reporting Standards (“IFRS”) have been adopted by the Korean Accounting Standards Board as Korean IFRS based on standards and interpretations published by the International Accounting Standards Board. Korean IFRS permits the use of critical accounting estimates in the preparation of the financial statements and requires management judgments in applying accounting policies. The areas involving a higher degree of judgment or complexity, or areas where assumptions and estimates are significant to the consolidated financial statements, are disclosed in Note 3.
2.2 Changes in Accounting Policy and Disclosures (A) New and Amended Standards Adopted by the Company The Company applied the following amended and enacted standards for the annual period beginning on January 1, 2014: Amendment to Korean IFRS 1032, Financial Instruments: Presentation Amendment to Korean IFRS 1032, Financial Instruments: Presentation, provides that the right to offset must not be contingent on a future event and must be legally enforceable in all of circumstances; and if an entity can settle amounts in a manner such that the outcome is, in effect, equivalent to net settlement, the entity will meet the net settlement criterion. The adoption of this standard did not have a material impact on the consolidated financial statements. Enactment of Korean IFRS 2121, Levies Korean IFRS 2121, Levies, is applied to a liability to pay a levy imposed by the government in accordance with the legislation. The interpretation requires that the liability to pay a levy is recognized when the activity that triggers the payment of the levy occurs (obligating event), as identified by the legislation. The application of this interpretation did not have a material impact on the consolidated financial statements. (B) New and Amended Standards Not Adopted by the Company
The Company expects that new standards, amendments and interpretations issued but not effective for the financial year beginning January 1, 2014, and not early adopted, would not have a material impact on its consolidated financial statements.

Samsung Electronics 2014 Business Report 76 / 170
2.3 Consolidation
The Company prepares the consolidated financial statements in accordance with Korean IFRS 1110, Consolidated Financial Statements.
(A) Subsidiaries
Subsidiaries are all entities (including special purpose entities) over which the Company has control. The Company controls the corresponding investee when it is exposed, or has rights, to variable returns from its involvement with the investee and has the ability to affect those returns through its power over the investee. Consolidation of a subsidiary begins from the date the Company obtains control of a subsidiary and ceases when the Company loses control of the subsidiary. The Company applies the acquisition method to account for business combinations. The consideration transferred is measured at the fair values of the assets transferred, and identifiable assets acquired and liabilities and contingent liabilities assumed in a business combination are initially measured at their fair values at the acquisition date. The Company recognizes any non-controlling interest in the acquiree on an acquisition-by-acquisition basis in the event of liquidation at the non-controlling interest’s proportionate share of the recognized amounts of acquiree’s identifiable net assets. Acquisition-related costs are expensed as incurred. Goodwill is recognized as the excess of (1) the aggregate of i) the consideration transferred, ii) the amount of any non-controlling interest in the acquiree and iii) the acquisition-date fair value of the Company’s previously held equity interest in the acquiree over (2) the net identifiable assets acquired. If this consideration (1) is lower than the fair value of the acquiree’s net assets in (2), the difference is recognized in profit or loss. Balances of receivables and payables, income and expenses and unrealized gains on transactions between the Company subsidiaries are eliminated. Accounting policies of subsidiaries are changed where necessary to ensure consistency with the policies adopted by the Company.
(B) Changes in Ownership Interests in Subsidiaries without Change of Control Transactions with non-controlling interests that do not result in loss of control are accounted for as equity transactions – that is, as transactions with the owners in their capacity as owners. The difference between fair value of any consideration paid and the relevant share acquired of the carrying value of net assets of the subsidiary is recorded in equity. Gains or losses on disposals of non-controlling interests are also recorded in equity.
(C) Disposal of Subsidiaries
If the Company loses control of a subsidiary, any investment continuously retained in the subsidiary is re-measured at its fair value at the date when control is lost and any resulting differences are recognized in profit or loss. Such fair value becomes the initial carrying amount for the subsequent measurement of the retained interest accounted for as an affiliate, joint venture, or financial asset. In addition, any amounts previously recognized in other comprehensive income in respect of such entity are accounted for as if the Company had directly disposed of the related assets or liabilities. As a result, the previously recognized other comprehensive income are reclassified into profit or loss.
(D) Non-Controlling Interests Each component of profit or loss and other comprehensive income is attributed to owners of the parent and to non-controlling interests. Total comprehensive income is attributed to owners of the parent and to non-controlling interests even if this results in a negative balance of non-controlling interests.

Samsung Electronics 2014 Business Report 77 / 170
(E) Affiliates
Associates are all entities over which the Company has significant influence but does not have control, generally investees of which from 20% to 50% of voting stock is owned by the Company. Investments in affiliates are initially recognized at acquisition cost using the equity method. Unrealized gains on transactions between the Company and its affiliates are eliminated to the extent of the Company’s interest in the affiliates. If there is any objective evidence that the investment in the affiliate is impaired, the Company recognizes the difference between the recoverable amount of the affiliate and its book value as impairment loss.
(F) Joint Arrangements
A joint arrangement of which two or more parties have joint control is classified as either a joint operation or a joint venture. A joint operator has rights to the assets, and obligations for the liabilities, relating to the joint operation and recognizes the assets, liabilities, revenues and expenses relating to its interest in a joint operation. A joint venturer has rights to the net assets relating to the joint venture and accounts for that investment using the equity method.
2.4 Foreign Currency Translation (A) Functional and Presentation Currency Items included in the financial statements of each of the Company’s entities are measured using the currency of the primary economic environment in which each entity operates (the “functional currency”). The consolidated financial statements are presented in Korean won, which is the parent company’s functional and presentation currency. (B) Transactions and Balances Foreign currency transactions are translated into the functional currency using the exchange rates prevailing at the dates of the transactions or valuation where items are re-measured. Foreign exchange gains and losses resulting from the settlement of such transactions and from the translation at year-end exchange rates of monetary assets and liabilities denominated in foreign currencies are recognized in profit or loss. Exchange differences arising on non-monetary financial assets and liabilities such as equity instruments at fair value through profit or loss and available-for-sale equity instruments are recognized in profit or loss and other comprehensive income, respectively, as part of the fair value gain or loss.
(C) Translation into the Presentation Currency
The results and financial position of all the foreign entities that have a functional currency different from the presentation currency of the Company are translated into the presentation currency as follows: Assets and liabilities for each statement of financial position presented are translated at the closing rate at the end of the
Reporting Date. Income and expenses for each statement of income are translated at average exchange rates, unless this average is not a
reasonable approximation of the cumulative effect of the rates prevailing on the transaction dates, in which case income and expenses are translated at the rate on the dates of the transactions.
All resulting exchange differences are recognized in other comprehensive income.
On consolidation, exchange differences arising from the translation of the net investment in foreign operations are recognized in other comprehensive income. When a foreign operation is partially disposed of or sold, the exchange differences that were recorded in equity are reclassified as part of gains and losses on disposition in the statement of income. When the Company no longer exercises control over a foreign subsidiary, the exchange differences that were recorded in equity are reclassified into profit or loss when such gain or loss on disposition is recognized.

Samsung Electronics 2014 Business Report 78 / 170
Any goodwill arising on the acquisition of a foreign operation and any fair value adjustments are treated as the foreign operation’s assets and liabilities. Such goodwill is expressed in the foreign operation’s functional currency and is translated at the closing rate. Exchange differences are recognized in other comprehensive income.
2.5 Cash and Cash Equivalents Cash and cash equivalents include cash on hand, deposits held at call with banks, and other short-term highly liquid investments that are readily convertible to a known amount of cash and are subject to an insignificant risk of change in value. 2.6 Financial Assets (A) Classification The Company classifies its financial assets in the following categories: financial assets at fair value through profit or loss, loans and receivables, available-for-sale financial assets, and held-to-maturity financial assets. The classification depends on the terms of the instruments and purpose for which the financial assets were acquired. Management determines the classification of its financial assets at initial recognition. (1) Financial Assets at Fair Value Through Profit or Loss Financial assets at fair value through profit or loss are financial assets held for trading. A financial asset is classified in this category if acquired principally for the purpose of selling in the short-term. Derivatives not subject to hedge accounting and derivatives separated from financial instruments, such as embedded derivatives, are also categorized as held for trading. Assets in this category are classified as current assets. (2) Loans and Receivables
Loans and receivables are non-derivative financial assets with fixed or determinable payments that are not quoted in an active market. They are included in current assets, except for those with maturities greater than 12 months after the end of the reporting period which are classified as non-current assets.
(3) Available-for-Sale Financial Assets
Available-for-sale financial assets are non-derivative financial assets that are either designated in this category or not classified in any of the other categories. They are included in non-current assets unless an investment matures or management intends to dispose of it within 12 months of the end of the reporting period.
(B) Recognition and Measurement Regular purchases and sales of financial assets are recognized on the trade date. At initial recognition, financial assets are measured at fair value plus, in the case of financial assets not carried at fair value through profit or loss, transaction costs. Transaction costs of financial assets carried at fair value through profit or loss are expensed in the statement of income. After the initial recognition, available-for-sale financial assets and financial assets at fair value through profit or loss are subsequently carried at fair value. Loans and receivables and held-to-maturity investments are subsequently carried at amortized cost using the effective interest method.
Changes in fair value of financial assets at fair value through profit or loss are recognized in profit or loss and changes in fair value of available-for-sale financial assets are recognized in other comprehensive income. When the available-for-sale financial assets are sold or impaired, the fair value adjustments recorded in equity are reclassified into profit or loss.

Samsung Electronics 2014 Business Report 79 / 170
Interest on available-for-sale financial assets and held-to-maturity financial assets calculated using the effective interest method is recognized in the statement of income as part of financial income. Dividends on available-for-sale financial assets are recognized in the statement of income as part of other non-operating income when the Company’s right to receive payments is established.
(C) Offsetting Financial Instruments
Financial assets and liabilities are offset, and the net amount reported in the statement of financial position, when there is a legally enforceable right to offset the recognized amounts and there is an intention to settle on a net basis, or realize the asset and settle the liability simultaneously.
(D) De-Recognition of Financial Assets
If the Company transfers a financial asset and the transfer does not result in de-recognition because the Company has retained substantially all of the risks and rewards of ownership of the transferred asset due to a recourse in the event the debtor defaults, the Company continues to recognize the transferred asset in its entirety and recognizes a financial liability for the consideration received. The related financial liability is classified as ‘borrowings’ in the statement of financial position.
2.7 Impairment of Financial Assets
The Company assesses at the end of each reporting period whether there is objective evidence that a financial asset or group of financial assets is impaired. A financial asset or a group of financial assets is impaired and impairment loss is recognized only if there is objective evidence and that loss event (or events) has an impact on the estimated future cash flows of the financial asset or group of financial assets that can be reliably estimated. Impairment of loans and receivables is presented as a deduction in an allowance account. Impairment of other financial assets is directly deducted from their carrying amount. The Company writes off financial assets when the assets are determined to no longer be recoverable. The objective evidence that a financial asset is impaired includes significant financial difficulty of the issuer or obligor, a delinquency in interest or principal payments, or the disappearance of an active market for that financial asset because of financial difficulties. A decline in the fair value of an available-for-sale equity instrument by more than 20% from its cost or a prolonged decline below its cost for more than six months is also objective evidence of impairment.
2.8 Trade Receivables
Trade receivables are amounts due from customers for merchandise sold or services performed in the ordinary course of business. If collection is expected in one year or less, they are classified as current assets. If collection is expected beyond one year, they are presented as non-current assets. Trade receivables are recognized initially at fair value and subsequently measured at amortized cost using the effective interest method, less provision for impairment.

Samsung Electronics 2014 Business Report 80 / 170
2.9 Inventories
Inventories are stated at the lower of cost and net realizable value. Cost is determined using the average cost method, except for materials in transit. The cost of finished goods and work in progress comprises design costs, raw materials, direct labor, other direct costs and related production overheads (based on normal operating capacity). It excludes costs of idle plant and abnormal waste. Net realizable value is the estimated selling price in the ordinary course of business, less applicable variable selling expenses. Inventories are reduced for the estimated losses arising from excess, obsolescence, and decline in value. This reduction is determined by estimating market value based on future customer demand. The losses on inventory obsolescence are recorded as a part of cost of sales.
2.10 Disposal Group Held-for-Sale
Non-current assets (or disposal group) are classified as assets held-for-sale when their carrying amount is to be recovered principally through a sale transaction and a sale is considered highly probable. The assets are measured at the lower of their carrying amount and the fair value less costs to sell.
2.11 Property, Plant and Equipment
Property, plant and equipment are stated at cost less accumulated depreciation and accumulated impairment losses. Historical cost includes expenditures that are directly attributable to the acquisition of the items. Subsequent costs are included in the asset’s carrying amount or recognized as a separate asset, as appropriate, only when it is probable that future economic benefits associated with the item will flow to the Company and the cost of the item can be measured reliably. The carrying amount of those parts that are replaced is derecognized and repairs and maintenance expenses are recognized in profit or loss in the period they are incurred. Depreciation on tangible assets is calculated using the straight-line method to allocate the difference between their cost and their residual values over their estimated useful lives. Land is not depreciated. Costs that are directly attributable to the acquisition, construction or production of a qualifying asset, including capitalized interest costs, form part of the cost of that asset and are amortized over the estimated useful lives. The Company’s policy is that property, plant and equipment should be depreciated over the following estimated useful lives:
Estimated useful lives Buildings and structures 15, 30 years Machinery and equipment 5 years Other 5 years
The depreciation method, residual values and useful lives of property, plant and equipment are reviewed, and adjusted if appropriate, at the end of each reporting period. An asset’s carrying amount is written down immediately to its recoverable amount if the asset’s carrying amount is greater than its estimated recoverable amount. Gains and losses on disposals are determined by comparing the proceeds with the carrying amount and are recognized within the statement of income as part of other non-operating income and expenses.

Samsung Electronics 2014 Business Report 81 / 170
2.12 Intangible Assets
Goodwill represents the excess of the cost of an acquisition over the fair value of the Company’s share of the net identifiable assets of the acquired subsidiary, affiliates, joint ventures and businesses at the date of acquisition. Goodwill on acquisitions of subsidiaries and businesses is included in intangible assets and goodwill on acquisition of affiliates and joint ventures is included in the investments in affiliates and joint ventures. Intangible assets, except for goodwill, are initially recognized at their historical cost and carried at cost less accumulated amortization and accumulated impairment losses. Internally generated development costs are the aggregate costs recognized after meeting the asset recognition criteria, including technical feasibility, and determined to have future economic benefits. Membership rights are regarded as intangible assets with an indefinite useful life and not amortized because there is no foreseeable limit to the period over which the assets are expected to be utilized. Intangible assets with definite useful lives such as trademarks and licenses, are amortized using the straight-line method over their estimated useful lives. The Company’s policy is that intangible assets should be amortized over the following estimated useful lives:
Estimated useful lives Development costs 2 years Trademarks, licenses and other intangible assets 5 - 10 years
2.13 Impairment of Non-Financial Assets
Goodwill or intangible assets with indefinite useful lives are not subject to amortization and are tested annually for impairment. Assets that are subject to amortization are reviewed for impairment whenever events or changes in circumstances indicate that the carrying amount may not be recoverable. An impairment loss is recognized for the amount by which the asset’s carrying amount exceeds its recoverable amount. The recoverable amount is the higher of an asset’s fair value less costs to sell and value in use. For the purposes of assessing impairment, assets are grouped at the lowest levels for which there are separately identifiable cash flows (cash-generating units). Non-financial assets other than goodwill for which an impairment charge was previously recorded are reviewed for possible reversal of the impairment at each reporting date.
2.14 Financial Liabilities
(A) Classification and measurement
Financial liabilities at fair value through profit or loss are financial instruments held for trading. Financial liabilities are classified in this category if incurred principally for the purpose of repurchasing them in the near term. Derivatives that are not designated as hedges or bifurcated from financial instruments containing embedded derivatives are also categorized as held-for-trading. The Company classifies non-derivative financial liabilities, except for financial liabilities at fair value through profit or loss, financial guarantee contracts and financial liabilities that arise when a transfer of financial assets does not qualify for derecognition, as financial liabilities carried at amortized cost and presented as ‘trade payables’, ‘borrowings’, and ‘other financial liabilities’ in the statement of financial position.
(B) Derecognition
Financial liabilities are removed from the statement of financial position when they are extinguished, for example, when the obligation specified in the contract is discharged, cancelled or expires or when the terms of an existing financial liability are substantially modified.

Samsung Electronics 2014 Business Report 82 / 170
2.15 Trade Payables
Trade payables are amounts due to suppliers for merchandise purchased or services received in the ordinary course of business. If payment is expected in one year or less, they are classified as current liabilities. If payment is expected beyond one year, they are presented as non-current liabilities. Non-current trade payables are recognized initially at fair value and subsequently measured at amortized cost using the effective interest method.
2.16 Borrowings
Borrowings are recognized initially at fair value, net of transaction costs, and are subsequently measured at amortized cost. Any difference between cost and the redemption value is recognized in the statement of income over the period of the borrowings using the effective interest method. If the Company has an indefinite right to defer payment for a period longer than 12 months after the end of the reporting date, such liabilities are recorded as non-current liabilities, otherwise, they are recorded as current liabilities.
2.17 Provisions
A provision is recognized when the Company has a present legal or constructive obligation as a result of a past event, it is probable that an outflow of resources embodying economic benefits will be required to settle the obligation, and a reliable estimate can be made of the amount of the obligation. Provisions are not recognized for future operating losses. Provisions are measured at the present value of the expenditures expected to be required to settle the obligation using a pre-tax rate that reflects current market assessments of the time value of money and the risks specific to the obligation. The increase in the provision due to passage of time is recognized as interest expense. When it is probable that an outflow of economic benefits will occur due to a present obligation resulting from a past event, and the amount is reasonably estimable, a corresponding provision is recognized in the financial statements. However, when such outflow is dependent upon a future event that is not certain to occur, or cannot be reliably estimated, a disclosure regarding the contingent liability is made in the notes to the financial statements. 2.18 Net Defined Benefit Liabilities The Company has a variety of retirement pension plans including defined benefit and defined contribution plans. A defined contribution plan is a pension plan under which the Company pays fixed contributions into a separate entity. The Company has no legal or constructive obligations to pay further contributions if the fund does not hold sufficient assets to pay all employees the benefits relating to employee service in the current and prior periods. For defined contribution plans, the Company pays contributions to annuity plans that are managed either publicly or privately on a mandatory, contractual or voluntary basis. The Company has no further future payment obligations once the contributions have been paid. The contributions are recognized as employee benefit expense when they are due. Prepaid contributions are recognized as an asset to the extent that a cash refund or a reduction in the future payments is available. A defined benefit plan is a pension plan that is not a defined contribution plan. Typically defined benefit plans define an amount of pension benefit that an employee will receive on retirement, usually dependent on one or more factors such as age, years of service and compensation. The liability recognized in the statement of financial position in respect to defined benefit pension plans is the present value of the defined benefit obligation at the end of the reporting period less the fair value of plan assets. The defined benefit obligation is calculated annually by independent actuaries using the projected unit credit method. The present value of the defined benefit obligation is determined by discounting the estimated future cash outflows using interest rates of high-quality corporate bonds that are denominated in the currency in which the benefits will be paid and that have terms to maturity approximating to the terms of the related pension obligation. Actuarial gains and losses resulting from the changes in actuarial assumptions, and the differences between the previous actuarial assumptions and what has actually occurred, are recognized in other comprehensive income in the period in which they were incurred. Past service costs are immediately recognized in profit or loss.

Samsung Electronics 2014 Business Report 83 / 170
2.19 Financial Guarantee Contract
Financial guarantee contracts are contracts that require the issuer to make specified payments to reimburse the holder for a loss it incurs because a specified debtor fails to make payments when due. Financial guarantees are initially recognized in the financial statements at fair value on the date the guarantee was given. If the amount measured in subsequent periods exceeds the unamortized balance of the amount initially recognized, the excess is classified as other financial liability.
2.20 Current and Deferred Tax
The tax expense for the period comprises current and deferred tax. Tax is recognized on the profit for the period in the statement of income, except to the extent that it relates to items recognized in other comprehensive income or directly in equity, in which case the tax is also recognized in other comprehensive income or directly in equity, respectively. The tax expense is calculated on the basis of the tax laws enacted or substantively enacted at the end of the reporting period. Deferred tax is recognized for temporary differences arising between the tax bases of assets and liabilities and their carrying amounts as expected tax consequences at the recovery or settlement of the carrying amounts of the assets and liabilities. However, deferred tax assets and liabilities are not recognized if they arise from initial recognition of an asset or liability in a transaction other than a business combination that at the time of the transaction affects neither accounting nor taxable profit or loss. Deferred tax assets are recognized only to the extent that it is probable that future taxable profit will be available against which the temporary differences can be utilized. A deferred tax liability is recognized for taxable temporary differences associated with investments in subsidiaries, affiliates, and interests in joint ventures, except to the extent that the Company is able to control the timing of the reversal of the temporary differences and it is probable that the temporary difference will not reverse in the foreseeable future. In addition, a deferred tax asset is recognized for deductible temporary differences arising from such investments to the extent that it is probable the temporary difference will reverse in the foreseeable future and taxable profit will be available against which the temporary difference can be utilized. Deferred tax assets and liabilities are offset when there is a legally enforceable right to offset current tax assets against current tax liabilities and when the deferred income taxes assets and liabilities relate to income taxes levied by the same taxation authority on either the same taxable entity or different taxable entities where there is an intention to settle the balances on a net basis.
2.21 Derivative Instruments
All derivative instruments are accounted for at their fair value according to the rights and obligations associated with the derivative contracts. The resulting changes are recognized in profit or loss in the year in which they are incurred. Certain derivatives that qualify as cash flow hedges and hedges on net investments in foreign operations are recognized under equity. 2.22 Dividend
Dividend distribution to the Company’s shareholders is recognized as a liability when the dividends are approved. 2.23 Share Capital
Common shares and preferred shares with no repayment obligations are classified as equity. When the Company purchases its common shares, the acquisition costs, including direct transaction costs, are deducted from equity until the redemption or reissuance as treasury shares. Consideration received on the subsequent sale or issuance of treasury shares is credited to equity.

Samsung Electronics 2014 Business Report 84 / 170
2.24 Revenue Recognition
Revenue mainly comprises the fair value of the consideration received or receivable for the sale of goods in the ordinary course of the Company’s activities. Revenue is shown net of value-added tax, returns, sales incentives and discounts and after eliminating intercompany transactions. The Company recognizes revenue when the amount of revenue can be reliably measured; when it is probable that future economic benefits will flow to the entity; and when specific criteria have been met for each of the Company’s activities, as described below. The Company measures revenue by reliably estimating the contingencies associated with revenue based on historical results, taking into consideration the type of customer, the type of transaction and the specifics of each arrangement. Where multiple-element arrangements exist, the fair values of each element are determined based on the current market price of each of the elements when sold separately. When the fair values of each element are indeterminable, the fair values of deliverables which have already been provided are calculated in such way that the fair values of elements which are yet to be provided are subtracted from total contract value of the arrangement.
(A) Sales of Goods
Sales of products and merchandise are recognized upon delivery when the significant risks and rewards of ownership of goods have transferred to the buyer. Revenue is recognized net of discounts and returns, estimated at the time of sale based on past experience.
(B) Sales of Services
Revenues from rendering services are generally recognized using the percentage-of-completion method based on the percentage of costs to date compared to the total estimated costs, contractual milestones or performance.
(C) Interest Income
Interest income is recognized using the effective interest method according to the time passed. When a loan or receivable is impaired, the Company reduces the carrying amount to its recoverable amount, to the extent of the estimated future cash flow discounted at the original effective interest rate of the instrument, and continues unwinding the discount as interest income. Interest income on impaired loans and receivables is recognized using the original effective interest rate.
(D) Royalty Income
Royalty income is recognized on an accrual basis in accordance with the substance of the relevant agreements.
(E) Dividend Income
Dividend income is recognized when the right to receive payment is established. 2.25 Government Grants Government grants are recognized at their fair values when there is reasonable assurance that the grant will be received and the Company will comply with the conditions attached to it. Government grants relating to costs are deferred and recognized in the income statement over the period necessary to match them with the costs that they are intended to compensate. Government grants relating to assets are recognized in liabilities as deferred income government grants and are credited to the income statement on a straight– line basis over the expected lives of the related assets.

Samsung Electronics 2014 Business Report 85 / 170
2.26 Earnings per Share Basic earnings per share is calculated by dividing net profit for the period available to common shareholders by the weighted-average number of common shares outstanding during the year. Diluted earnings per share is calculated using the weighted-average number of common shares outstanding adjusted to include the potentially dilutive effect of common equivalent shares outstanding. 2.27 Operating Segments Operating segments are disclosed in the manner reported to the chief operating decision-maker (Note 33). The chief operating decision-maker is responsible for making strategic decisions on resource allocation and performance assessment of the operating segments. The Management Committee, which makes strategic decisions, is regarded as the chief operating decision-maker. 2.28 Convenience Translation into United States Dollar Amounts The Company operates primarily in Korean won and its official accounting records are maintained in Korean won. The US dollar amounts provided in the financial statements represent supplementary information solely for the convenience of the reader. All
Korean won amounts are expressed in U.S. dollars at the rate of ₩1,052.70 to US $1, the average exchange rate for the year ended
December 31, 2014. Such presentation is not in accordance with generally accepted accounting principles, and should not be construed as a representation that the Korean won amounts shown could be readily converted, realized or settled in US dollars at this or at any other rate. 2.29 Approval of the Consolidated Financial Statements These consolidated financial statements were approved by the Board of Directors on January 29, 2015.
3. Critical Accounting Estimates and Assumptions The Company makes estimates and assumptions concerning the future. The estimates and assumptions are continuously assessed, considering historical experience and other factors, including expectations of future events that are believed to be reasonable under the circumstances. The resulting accounting estimates will, by definition, seldom equal the related actual results. The estimates and assumptions that have a significant risk of causing a material adjustment to the carrying amounts of assets and liabilities within the next financial year are addressed below. (A) Revenue Recognition The Company uses the percentage-of-completion method in accounting for its fixed-price contracts to deliver installation services. Use of the percentage-of-completion method requires the Company to estimate the services performed to date as a proportion of the total services to be performed. Revenues and earnings are subject to significant change, effected by early steps in a long-term projects, change in scope of a project, cost, period, and plans of the customers. (B) Provision for Warranty The Company recognizes provision for warranty on products sold. The Company accrues provision for warranty based on the best estimate of amounts necessary to settle future and existing claims. The amounts are estimated based on past experience.
(C) Fair Value of Derivatives and Other Financial Instruments The fair value of financial instruments that are not traded in an active market is determined by using a variety of methods and assumptions that are mainly based on market conditions existing at the end of each reporting period.

Samsung Electronics 2014 Business Report 86 / 170
(D) Net Defined Benefit Liabilities
The net defined benefit liability depends on a number of factors that are determined on an actuarial basis using a number of assumptions. Any changes in these assumptions will impact the carrying amount of the net defined benefit liability. The Company, in consideration of the interest rates of high-quality corporate bonds, determines the appropriate discount rate at the end of each year. This is the interest rate that is used to determine the present value of estimated future cash outflows expected to be required to settle the net defined benefit liability. The principal actuarial assumptions associated with the net defined benefit liability are based on the current market expectations. (E) Estimated Impairment of Goodwill
At the end of each reporting period, the Company tests whether goodwill has become impaired by comparing the carrying amounts of cash-generating units to the recoverable amounts. The recoverable amounts of cash-generating units have been determined based on value-in-use calculations, and these calculations are based on estimates.
(F) Income Taxes
Income taxes on the Company’s taxable income from operating activities are subject to various tax laws and determinations of each tax authority across various countries throughout the world. There is uncertainty in determining the eventual tax effects on the taxable income from operating activities. The Company has recognized current tax and deferred tax at the end of the fiscal year based on the best estimation of future taxes payable as a result of operating activities. However, the resulting deferred income tax assets and liabilities may not equal the actual future taxes payable and such difference may impact the current tax and deferred income tax assets and liabilities upon the determination of eventual tax effects.

Samsung Electronics 2014 Business Report 87 / 170
3. Other Financial Information
A. Matters of Interest
- Restatement of Financial Statements: N/A
- Acquisitions and Divestments (Separate only)
Refer to 8.Acquisition and Divestments (VIII. Other Information Related to Investment Protection)
B. Allowance for Bad Debt The allowances for bad debts over the past 3 years are as follows:
Bad debt allowance by account (Unit: KRW million, %)
Period Account Receivables Amount Allowance Amount Allowance (%)
2014
Trade receivables 24,972,069 277,459 1.1%
Short-term loans 9,650 118 1.2%
Other receivables 3,549,692 9,817 0.3%
Advances 1,993,788 4,318 0.2%
Trade receivables (Long-term) 35,944 329 0.9%
Other receivables (Long-term) 9,419 77 0.8%
Advances (Long-term) 176,949 793 0.4%
Long-term loans 176,232 1,246 0.7%
Total 30,923,743 294,157 1.0%
2013
Trade receivables 25,256,002 267,470 1.1%
Short-term loans 33,382 271 0.8%
Other receivables 2,907,221 19,819 0.7%
Advances 1,932,530 4,342 0.2%
Trade receivables (Long-term) 36,229 205 0.6%
Other receivables (Long-term) 24,384 227 0.9%
Advances (Long-term) 76,429 792 1.0%
Long-term loans 152,005 36,727 24.2%
Total 30,418,182 329,853 1.1%
2012
Trade receivables 24,138,022 276,787 1.1%
Short-term loans 60,843 675 1.1%
Other receivables 2,815,696 2,335 0.1%
Advances 1,676,804 2,376 0.1%
Trade receivables (Long-term) 30,405 - 0.0%
Other receivables (Long-term) 18,491 260 1.4%
Advances (Long-term) 85,843 793 0.9%
Long-term loans 166,689 643 0.4%
Total 28,992,793 283,869 1.0%
※ Receivables amount is based on net present value (Consolidated) ※ Presented in accordance with Korean International Financial Reporting Standards (“K-IFRS”)

Samsung Electronics 2014 Business Report 88 / 170
Allowance for Bad Debt (Roll Forward) (Unit: KRW million)
2014 2013 2012
1. Allowance for bad debts (beginning balance) 329,853 283,869 259,161
2. Net Bad Debt Expense (①-②±③) 49,349 17,833 53,433
① Bad Debt Expense (Write-off) 50,705 20,393 55,592
② Bad Debt Recovered 1,356 2,560 2,159
③ Others - - -
3. Bad debts expense 13,653 63,817 78,141
4. Allowance for bad debts (Ending balance) 294,157 329,853 283,869
※ Based on consolidated financial statements.
The guideline for Bad Debts Allowances
(1) Calculation of Bad Debts Allowances Bad Debts are calculated based on write-off experiences and future expected bad debts.
(2) Calculation Method for Write-Off Experience Rate:
Experience rate of write-off: the actual write-off rate for the average receivables balance of previous three (3) years
Future expected bad debts: Cases of debtor bankruptcy, compulsory execution, death, or disappearance are reflected in the bad debt allowance, ranging from 1% ~ 100% of the balance of trade-other receivable
[Bad Debt Allowance]
Situation Rate of Allowance
Dispute or Conflict 25%
Receivable through utilization of third party collection agency 50%
Receivable under litigation 75%
Customer filed or in the process of filing bankruptcy 100% (3) Instruction: Write-off is recorded when trade receivables contain the following characteristics:
ㆍ Objective proof of bad debts, such as bankruptcy, compulsory execution, discontinuance of business, debtor’s death or disappearance
ㆍ Legal action has failed or the right of collection is extinguished.
ㆍ When the collection agency gives as notice that collection is not possible.
ㆍ When the collateral is sold or insurance is received.
ㆍ The collection expenses exceed the amount of receivables.

Samsung Electronics 2014 Business Report 89 / 170
The outstanding period of trade receivables (Unit : KRW million)
Less than 6 months
6 months ~ 1 year
1 year ~ 3 years
More than 3 years Total
Amount 24,910,404 18,920 57,012 21,678 25,008,014
Ratio 99.6% 0.1% 0.2% 0.1% 100.0%
* Receivables amount on net present value (consolidated)

Samsung Electronics 2014 Business Report 90 / 170
C. Inventory - The inventory status by Division over the last three years is as follows:
(Unit: KRW million)
Division Category 2014 2013 2012 Note
CE
Finished Goods 1,946,482 1,927,784 1,868,910
Work In Process 80,122 73,876 72,375
Raw Material 1,566,121 1,435,023 1,468,295
Material In Transit 1,694,448 1,689,040 1,634,797
Total 5,287,173 5,125,723 5,044,377
IM
Finished Goods 2,210,160 2,896,647 3,113,848
Work In Process 279,861 333,109 305,543
Raw Material 2,751,331 3,363,195 2,736,050
Material In Transit 488,877 1,026,147 895,088
Total 5,730,229 7,619,098 7,050,529
DS
Semi- Conductor
Sub-Division
Finished Goods 777,450 1,219,189 1,317,615
Work In Process 3,677,543 3,022,125 2,461,713
Raw Material 419,398 351,646 486,166
Material In Transit 121,477 89,670 83,312
Total 4,995,868 4,682,630 4,348,806
DP Business Unit
Finished Goods 409,516 553,108 460,600
Work In Process 244,324 443,611 259,324
Raw Material 281,223 328,955 239,414
Material In Transit 55,176 4,988 63,721
Total 990,239 1,330,662 1,023,059
DS Total
Finished Goods 1,228,783 1,810,852 1,797,309
Work In Process 4,105,675 3,663,346 2,852,724
Raw Material 750,929 726,455 775,434
Material In Transit 178,218 98,897 150,237
Total 6,263,605 6,299,550 5,575,704
Total
Finished Goods 5,773,448 7,429,350 6,837,250
Work In Process 4,465,071 4,070,266 3,230,576
Raw Material 5,957,006 6,809,112 5,081,396
Material In Transit 1,121,979 826,140 2,598,191
Total 17,317,504 19,134,868 17,747,413
Inventory Ratio (%)– Total Assets
[Inventory ÷ Total Assets] 7.5% 8.9% 9.8%
Inventory Turn-over [ Yearly CGS ÷{(Beginning of Inventory End of
Inventory)÷2}] 7.0 7.5 7.6

Samsung Electronics 2014 Business Report 91 / 170
Inventory Counts
(1) Inspection Date
ㆍ End of May and November (twice a year)
ㆍ Performed check of the existence of inventories included in an accounting books and records on the inspection date
(2) Inspection Method
ㆍ Internal warehouse: Closed & Total Inspection
※ Sample check in Semiconductor Sub-Division and DP Business Unit inventory, SVC materials
ㆍ Outside warehouse
Performed check of the possession confirmation documents and sample tests at third party warehouse and Inventory in
transit
ㆍ External auditors join and observe the inspection and carry out sample test to check the existence and completeness.
Inventory Aging and Valuation
Inventories are stated at the lower of cost or net realizable value. Inventory as at December 31st, 2014 is as follows:
(Unit : KRW million)
Category Acquisition
Cost Inventory
Valuation Reserve Balance Note
Finished Goods 6,011,078 237,630 5,773,448
Work In Process 5,018,416 553,345 4,465,071
Raw Material 6,244,161 287,155 5,957,006
Material In Transit 1,121,979 - 1,121,979
Total 18,395,634 1,078,130 17,317,504
※ Prepared on a consolidated basis

Samsung Electronics 2014 Business Report 92 / 170
D. Fair Value Estimation
(1) Carrying amounts and fair values of financial instruments by category as at December 31, 2014 and 2013 are as follows:
2014 2013
(In millions of Korean won) Carrying amount Fair value Carrying amount Fair value
Financial assets
Cash and cash equivalents1 ₩ 16,840,766 ₩ - ₩ 16,284,780 ₩ -
Short-term financial instruments1 41,689,776 - 36,722,702 -
Short-term available-for-sale financial assets 3,286,798 3,286,798 1,488,527 1,488,527
Trade receivables1 24,694,610 - 24,988,532 -
Long-term available-for-sale financial assets2 12,667,509 12,272,756 6,238,380 5,850,155
Other 4,762,971 4,725,263 5,472,956 5,436,470
Total financial assets ₩ 103,942,430 ₩ 91,195,877
Financial liabilities
Trade payables1 ₩ 7,914,704 ₩ - ₩ 8,437,139 ₩ -
Short-term borrowings1 8,029,299 - 6,438,517 -
Other payables1 9,258,344 - 7,877,581 -
Current portion of long-term liabilities1 1,778,667 - 2,425,831 -
Debentures 1,355,882 1,377,113 1,311,068 1,327,569
Long-term borrowings 101,671 82,271 985,117 971,844
Long-term other payables 2,520,277 2,606,179 1,023,714 1,090,580
Other1 11,474,129 - 10,862,512 -
Total financial liabilities ₩ 42,432,973 ₩ 39,361,479
1 Assets and liabilities whose carrying amount is a reasonable approximation of fair value are excluded from the fair value disclosures. 2 Amount measured at cost (2014: ₩394,753 million, 2013: ₩388,225 million) is excluded as the range of reasonable fair value estimates is
significant and the probabilities of the various estimates cannot be reasonably assessed.

Samsung Electronics 2014 Business Report 93 / 170
(2) The following table presents the assets and liabilities, by level, that are measured at fair value:
2014
(In millions of Korean won) Level 1 Level 2 Level 3 Total balance
1) Assets
Short-term available-for-sale financial assets ₩ 1,016,878 ₩ 2,269,920 ₩ - ₩ 3,286,798
Long-term available-for-sale financial assets1 5,776,836 3,050,338 3,445,582 12,272,756
Other - 45,898 102,513 148,411
2) Liabilities
Derivatives - 78,348 - 78,348
2013
(In millions of Korean won) Level 1 Level 2 Level 3 Total balance
1) Assets
Short-term available-for-sale financial assets ₩ 1,257,492 ₩ 231,035 ₩ - ₩ 1,488,527
Long-term available-for-sale financial assets1 4,399,314 957,463 493,378 5,850,155
Other - 40,552 - 40,552
2) Liabilities
Derivatives - 244,172 - 244,172
1 Amount measured at cost (2014: ₩394,753 million, 2013: ₩388,225 million) is excluded as the range of reasonable fair value estimates is
significant and the probabilities of the various estimates cannot be reasonably assessed.
The levels of the fair value hierarchy and its application to financial assets and liabilities are described below.
ㆍ Level 1: Quoted prices (unadjusted) in active markets for identical assets or liabilities
ㆍ Level 2: Inputs other than quoted prices included within Level 1 that are observable for the asset or liability, either directly or
indirectly
ㆍ Level 3: Inputs for the asset or liability that are not based on observable market data (that is, unobservable inputs)

Samsung Electronics 2014 Business Report 94 / 170
The fair value of financial instruments traded in active markets is based on quoted market prices at the statement of financial position date. A market is regarded as active if quoted prices are readily and regularly available from an exchange, dealer, broker, industry group, pricing service, or regulatory agency, and those prices represent actual and regularly occurring market transactions on an arm’s length basis. The quoted market price used for financial assets held by the Company is the current bid price. These instruments are included in Level 1. Instruments included in Level 1 are listed equity investments classified as trading securities or available-for-sale financial assets.
The fair value of financial instruments that are not traded in an active market (for example, over-the-counter derivatives) is determined by using valuation techniques. These valuation techniques maximize the use of observable market data where it is available and rely as little as possible on entity specific estimates. If all significant inputs required to fair value an instrument are observable, the instrument is included in Level 2.
If one or more of the significant inputs are not based on observable market data, the instrument is included in Level 3.
Specific valuation techniques used to value financial instruments include:
ㆍ Quoted market prices or dealer quotes for similar instruments.
ㆍ The fair value of forward foreign exchange contracts is determined using forward exchange rates at the statement of financial
position date, with the resulting value discounted back to present value.
Other techniques, such as discounted cash flow analysis, are used to determine fair value for the remaining financial instruments. For trade and other receivables, the book value approximates a reasonable estimate of fair value.
(3) Valuation technique and the inputs
The Company utilizes a present value technique to discount future cash flows at a proper interest rate for corporate bonds, government and public bonds, and bank debentures that are classified as Level 2 in the fair value hierarchy. The following table presents the valuation technique and the inputs used for major financial instruments classified as Level 3.
(In millions of Korean won)
Classification Fair Value Valuation Technique Level 3 Inputs Input Range
(Weighted Average) Long-term available-for-sale financial assets Taewon Electric \ 17,094 Discounted cash flow Permanent growth rate -1.00% ~ 1.00% (0%)
Weighted average cost of capital 7.76%~9.76% (8.76%)
Samsung Venture Investment 6,586 Discounted cash flow Permanent growth rate -1.00%~1.00% (0%) Weighted average cost of capital 7.74%~9.74% (8.74%)
Samsung General Chemicals 100,051 Discounted cash flow Permanent growth rate -1.00%~1.00% (0%) Weighted average cost of capital 10.48%~12.48% (11.48%)
Coming Incorporated convertible preferred stock
3,106,333 Trinomial model Risk adjusted discount rate Price volatility
4.96%~6.96% (5.96%) 30.5%~36.5% (33.5%)
Derivatives Embedded derivatives
(convertible bonds) 2,462 Binomial model Discount rate 5.16%~10.3% (7.78%)
Stock price volatility 11.88%~17.6% (14.53%)

Samsung Electronics 2014 Business Report 95 / 170
(4) Changes in Level 3 instruments:
(In millions of Korean won) 2014 2013
Balance as at January 1 \ 493,378 \ 389,195
Purchases 2,586,120 151,741
Disposals (97,487) (46,357)
Amount recognized in profit or loss (67,581) (5,177)
Amount recognized in other comprehensive income 646,856 2,615
Other (13,191) 1,361
Balance as at December 31 \ 3,548,095 \ 493,378
(5) Sensitivity analysis for recurring fair value measurements categorized within Level 3
Sensitivity analysis of financial instruments is performed to measure favorable and unfavorable changes in the fair value of financial instruments which are affected by the unobservable parameters, using a statistical technique. When the fair value is affected by more than two input parameters, the amounts represent the most favorable or most unfavorable. The results of the sensitivity analysis for the effect on profit or loss (before-tax amount for other comprehensive income or loss) from changes in inputs for each financial instrument which is categorized within Level 3 and subject to sensitivity analysis, are as follows:
(In millions of Korean won) Favorable Changes Unfavorable Changes
Classification Profit or Loss Equity Profit or Loss Equity Long-term available-for-sale financial assets1 \ - \ 231,909 \ - \ (225,568)
Embedded derivatives (convertible bonds)2 466 466 (475) (475)
Total \ 466 \ 232,375 \ (475) \ (226,043)
1 Changes in fair value are calculated by increasing or decreasing the correlation between volatility (30.5% to 36.5%) and discount rate for convertible preferred stock. Similarly, for other equity securities, changes in fair value are calculated with the correlation between growth ratio (-1% to 1%) and discount rate, which are significant unobservable inputs.
2 For equity derivatives, changes in their fair value are calculated by increasing or decreasing the correlation between stock prices and volatility by 10%.

Samsung Electronics 2014 Business Report 96 / 170
(6) Fair value hierarchy classifications of the financial assets and financial liabilities that are measured at fair value as at December 31, 2014 and 2013, are as follows:
(In millions of Korean won) 2014
Classification Carrying amount Level 1 Level 2 Level 3 Total
Assets
Other \ 4,614,560 \ - \ 4,576,852 \ - \ 4,576,852
Liabilities
Debentures 1,355,882 - 1,377,113 - 1,377,113
Long-term borrowings 101,671 - 82,271 - 82,271
Long-term other payables 2,520,277 - 2,606,179 - 2,606,179
(In millions of Korean won) 2013 Classification Carrying amount Level 1 Level 2 Level 3 Total
Assets
Other non-current assets \ 5,432,404 \ - \ 5,395,918 \ - \ 5,395,918
Liabilities
Debentures 1,311,068 - 1,327,569 - 1,327,569
Long-term borrowings 985,117 - 971,844 - 971,844
Long-term other payables 1,023,714 - 1,090,580 - 1,090,580
As at December 31, 2014, assets and liabilities not measured at fair value but for which the fair value is disclosed and categorized within Level 2 in the fair value hierarchy, are measured using the present value technique which discounts future cash flows with appropriate interest rates.

Samsung Electronics 2014 Business Report 97 / 170
IV. Auditor’s Report
1. Introduction
Samil PwC has audited the financial year end consolidated/separate financial position of the Company as of December 31,
2014, and the related financial year end consolidated/separate statements of income and comprehensive income for the
year ended December 31, 2014, and the consolidated/separate statements of changes in equity and cash flows for the year
ended December 31, 2014. Nothing has come to attention that causes them to believe the accompanying year end
consolidated/separate financial statements are not presented fairly, in all material respects, in accordance with K-IFRS.
Samil PwC also conducted audits on the consolidated/separate financial statement of financial position of the Company as
of December 31, 2012 and 2013, and the related consolidated/separate statements of income, comprehensive income,
changes in equity and cash flows for the years then ended and expressed an unqualified opinion on those financial
statements. There were no auditor changes at any subsidiaries for the year ended December 31, 2014. There are 8 newly
incorporated/acquired entities, and 6 of them, such as Samsung Display Bac Ninh, appointed PwC as the auditor and 2 of
them, such as SVIC #26, appointed Deloitte Anjin as external auditor at their own decision.
Year end Company Auditor Audit Opinion Remarks
31 December 2014 Samil PwC Unqualified Not applicable
31 December 2013 Samil PwC Unqualified Not applicable
31 December 2012 Samil PwC Unqualified Not applicable
<Audit (Review) plan for the year ended December 31, 2014 >
Audit (review) Period Planned dates
2014 Q1 Pre-review 2014.03.10 ~ 2014.03.28
Review 2014.04.07 ~ 2014.05.09
2014 Q2 Pre-review 2014.06.09 ~ 2014.06.27
Review 2014.07.09 ~ 2014.08.08
2014 Q3 Pre-review 2014.09.08 ~ 2014.09.26
Review 2014.10.07 ~ 2014.11.07
System and Internal Control Audit 2014.08.25 ~ 2014.09.26
Audit procedures 2014.12.01 ~ 2015.01.28
Completion of final audit procedures 2015.01.29 ~ 2015.02.24

Samsung Electronics 2014 Business Report 98 / 170
[Audit Contract Description] (In millions of Korean won)
Fiscal Year Company
Auditor Description Compensation Total Hours
Year ended
December
31, 2014
Samil PwC - Review of the interim consolidated/separate financial statements
- Audit on consolidated/separate financial statements 3,690 43,411
Year ended
December
31, 2013
Samil PwC - Review of the interim consolidated/separate financial statements
- Audit on consolidated/separate financial statements 3,840 44,702
Year ended
December
31, 2012
Samil PwC - Review of the interim consolidated/separate financial statements
- Audit on consolidated/separate financial statements 3,660 43,572
Samil PwC has performed non-audit services and has been paid KRW 2,987 million by the Company for the year ended
December 31, 2014.
[Non-Audit Service Contract Description] (In millions of Korean won)
Fiscal Year Contract Date Non-audit Service Description Period for Service Compensation Note
Year ended
December
31, 2014
September 2013 Incorporation, M&A and Divestiture Advisory 2014.01~2014.12 1,161
August 2013 Tax Advisory 2014.01~2014.12 533
October 2013 Process Improvement Advisory 2014.01~2014.12 996
Others
297
Subtotal 2,987
Year ended
December
31, 2013
November 2012 Incorporation, M&A and Divestiture Advisory 2013.01~2013.12 2,466
August 2012 Tax Advisory 2013.01~2013.12 2,272
June 2012 Process Improvement Advisory 2013.01~2013.12 1,896
Others 1,573
Subtotal 8,207

Samsung Electronics 2014 Business Report 99 / 170
Fiscal Year Contract Date Non-audit Service Description Period for Service Compensation Note
Year ended
December
31, 2012
January 2012 Incorporation, M&A and Divestiture Advisory 2012.01~2012.12 3,520
January 2011 Tax Advisory 2012.01~2012.12 3,995
November 2011 IP Advisory 2012.01~2012.12 1,287
January 2012 Process Improvement Advisory 2012.01~2012.12 2,815
Others
802
Subtotal 12,419
2. Regarding Internal Control Samil PwC has reviewed management's report on the operations of the Internal Accounting Control System ("IACS") of the Company as of December 31, 2014 and nothing has come to attention that causes them to believe that management's report on the operations of the IACS is not presented fairly, in all material respects, in accordance with IACS standards.
Samil PwC has audited the financial year end consolidated/separate financial position of the Company as of December 31, 2014, and the related financial year end consolidated/separate statements of income and comprehensive income for the year ended December 31, 2014, and the consolidated/separate statements of changes in equity and cash flows for the year ended December 31, 2014. Nothing has come to attention that causes them to believe the accompanying year end consolidated/separate financial statements are not presented fairly, in all material respects, in accordance with K-IFRS. Samil PwC also conducted audits on the consolidated/separate financial statement of financial position of the Company as of December 31, 2012 and 2013, and the related consolidated/separate statements of income, comprehensive income, changes in equity and cash flows for the years then ended and expressed an unqualified opinion on those financial statements. There were no auditor changes at any subsidiaries for the year ended December 31, 2014. There are 8 newly incorporated/acquired entities, and 6 of them, such as Samsung Display Bac Ninh, appointed PwC as the auditor and 2 of them, such as SVIC #26, appointed Deloitte Anjin as external auditor at their own decision.

Samsung Electronics 2014 Business Report 100 / 170
V. Management Discussion and Analysis 1. Note on Forward-Looking Statements This annual report includes forward-looking statements that relate to future events and can be generally identified by phrases containing words such as “believes,” “expects,” “anticipates,” “foresees,” “forecasts,” “estimates” or other words or phrases of similar meaning. These forward-looking statements are not guarantees of future performance and may involve known and unknown risks, uncertainties and other factors that may affect our actual results, performance, achievements or financial position, making them materially different from the actual future results, performance, achievements or financial position expressed or implied by these forward-looking statements. Unless otherwise specified, all data presented in this report is from our consolidated financial statements.
Uncertain events that could positively or negatively affect the Company’s management condition and financial performance include:
• Trends of financial markets domestically and abroad, including changes in exchange rates and interest rates
• The Company’s strategic decision making, including disposals and purchases of businesses
• Unexpected sudden changes in core businesses such as CE, IM, Semiconductor, and DP
• Other changes domestically and abroad that can affect management condition and financial performance
The Company assumes no obligation to revise or update this report to reflect risks or uncertainties that arise after the reporting period.
2. Overview Even though the U.S. economy showed gradual signs of recovery in 2014, political and economic uncertainties persisted including a slowdown in China’s growth and growing tension in Russia and the Middle East. Accordingly, South Korea’s economy also remained weak. Despite intensifying price competition, we achieved record consolidated sales of KRW 206 trillion, operating profit of KRW 25 trillion, stand-alone sales of KRW 138 trillion, and net profit of KRW 15 trillion. From a financial management perspective, we maintained a sound capital structure with a consolidated debt to equity ratio of 37.1%, capital adequacy ratio of 72.9%, and ROE of 14.7%. Additionally, the parent company had a debt to equity ratio of 23.7%, a capital adequacy ratio of 80.9%, and an ROE of 11.4%. Furthermore, , our brand value rose to USD 45.5 billion, a 15% increase from the previous year, and ranked seventh in the global corporate list according to the Interbrand survey as of October 2014. During the year, we continued to lead the industry by launching products featuring advanced design and the industry leading technology. We began mass production of the world’s best performing and highest-density server DRAM memory modules and led the premium TV market with our UHD TV and curved TV. As uncertainties in the global economy are expected to persist in 2015 due to an increase in the U.S. interest rate, economic recession in the Eurozone, and financial risks in emerging countries resulting from a sharp fall in crude oil prices, we expect growth in our core product markets to slow and competition to intensify. Even under the rapidly changing business environment and difficult circumstances, we will strive to reinforce the technological competitiveness of our existing businesses and secure opportunities in the future by discovering new businesses.

Samsung Electronics 2014 Business Report 101 / 170
3. Financial Position and Performance (Consolidated) A. Financial Position
(Unit: KRW million)
Classification 2014 2013 Increase/decrease % change
Total assets 230,422,958 214,075,018 16,347,940 7.6%
Current assets 115,146,026 110,760,271 4,385,755 4.0%
- Cash and cash equivalents 16,840,766 16,284,780 555,986 3.4%
- Short-term financial instruments 41,689,776 36,722,702 4,967,074 13.5%
- Available-for-sale financial assets 3,286,798 1,488,527 1,798,271 120.8%
- Trade and other receivables 24,694,610 24,988,532 293,922 1.2%
- Inventories 17,317,504 19,134,868 1,817,364 9.5%
- Other current assets 11,316,572 12,140,862 824,290 6.8%
Non-current assets 115,276,932 103,314,747 11,962,185 11.6%
- Available-for-sale financial assets 12,667,509 6,238,380 6,429,129 103.1%
- Associates and joint ventures 5,232,461 6,422,292 1,189,831 18.5%
- Property, plant and equipment 80,872,950 75,496,388 5,376,562 7.1%
- Intangible assets 4,785,473 3,980,600 804,873 20.2%
- Other non-current assets 11,718,539 11,177,087 541,452 4.8%
Total liabilities 62,334,770 64,059,008 1,724,238 2.7%
Current liabilities 52,013,913 51,315,409 698,504 1.4%
Non-current liabilities 10,320,857 12,743,599 2,422,742 19.0%
Total equity 168,088,188 150,016,010 18,072,178 12.0%
Total liabilities and equity 230,422,958 214,075,018 16,347,940 7.6%
Capital adequacy ratio 72.9% 70.1% 2.8%p -
Debt-to-equity ratio 37.1% 42.7% 5.6%p -
Inventory turnover 7.0 7.5 0.5 -
※ Presented in accordance with Korean International Financial Reporting Standards (“K-IFRS”)

Samsung Electronics 2014 Business Report 102 / 170
- Samsung Electronics’ total assets in 2014 were KRW 230.423 trillion, an increase of KRW 16.348 trillion (7.6%) from the previous year. This includes an increase of KRW 5.4 trillion in property, plant and equipment from large-scale facilities investment, as well as an increase of KRW 6.4 trillion in long-term available-for-sale financial assets due to acquisition of Corning shares and purchase of bank debentures.
- Total liabilities were KRW 62.335 trillion, a decrease of KRW 1.724 trillion (2.7%) from the previous year. This includes an increase of KRW 698.5 billion (1.4%) in current liabilities and a decrease of KRW 2.423 trillion (19.0%) in non-current liabilities.
- Total equity was KRW 168.088 trillion, an increase of KRW 18.072 trillion (12.0%) from the previous year. Retained earnings increased by KRW 20.929 trillion primarily from net income of KRW 23.394 trillion.
- In terms of financial ratios, the Company maintained the financial structure of a world-class company as the capital adequacy ratio increased by 2.8% from the previous year to 72.9% and the debt-to-equity ratio decreased by 5.6% from the previous year to 37.1%.
B. Performance
(Unit: KRW million)
Classification 2014 2013 Increase/decrease % change
Sales 206,205,987 228,692,667 22,486,680 9.8%
Cost of sales 128,278,800 137,696,309 9,417,509 6.8%
Gross profit 77,927,187 90,996,358 13,069,171 14.4%
Selling and administrative expenses 52,902,116 54,211,345 1,309,229 2.4%
Operating profit 25,025,071 36,785,013 11,759,942 32.0%
Other revenue 3,801,357 2,429,551 1,371,806 56.5%
Other expenses 2,259,737 1,614,048 645,689 40.0%
Gain on valuation using the equity method of accounting 342,516 504,063 161,547 32.0%
Financial revenue 8,259,829 8,014,672 245,157 3.1%
Financial expenses 7,294,002 7,754,972 460,970 5.9%
Income before income tax expense 27,875,034 38,364,279 10,489,245 27.3%
Income tax expense 4,480,676 7,889,515 3,408,839 43.2%
Net income 23,394,358 30,474,764 7,080,406 23.2%
※ Presented in accordance with Korean International Financial Reporting Standards (“K-IFRS”)

Samsung Electronics 2014 Business Report 103 / 170
- In 2014, despite the increase in sales of semiconductors, including memory, intensifying competition in the smartphone market led to a 9.8% decrease in revenue compared to the previous year, with revenues of KRW 206 trillion recorded for 2014.
- Operating profit decreased by 32.0% to KRW 25.025 trillion, income before income tax expense decreased by 27.3% to KRW 27.875 trillion, and net income decreased by 23.2% to KRW 23.394 trillion.
Performance by division
[Unit: KRW million]
Classification Division Business 2014 2013 % change
Amount Share Amount Share Amount (%)
Revenue
CE 50,183,135 24.3% 50,331,515 22.0% 148,380 0.3%
IM 111,764,544 54.2% 138,817,219 60.7% 27,052,675 19.5%
DS
Semiconductor 39,729,902 19.3% 37,436,579 16.4% 2,293,323 6.1%
DP 25,727,169 12.5% 29,837,116 13.0% 4,109,947 13.8%
Total 65,789,806 31.9% 67,760,906 29.6% 1,971,100 2.9%
Overall sales 206,205,987 100.0% 228,692,667 100.0% 22,486,680 9.8%
Operating profit
CE 1,184,325 4.7% 1,673,343 4.5% 489,018 29.2%
IM 14,562,885 58.2% 24,957,741 67.8% 10,394,856 41.6%
DS
Semiconductor 8,776,442 35.1% 6,887,978 18.7% 1,888,464 27.4%
DP 660,181 2.6% 2,980,563 8.1% 2,320,382 77.9%
Total 9,430,915 37.7% 10,000,665 27.2% 569,750 5.7%
Overall operating profit 25,025,071 100.0% 36,785,013 100.0% 11,759,942 32.0%
[CE Division]
- The CE division’s 2014 revenue decreased by 0.3% from the previous year to KRW 50.183 trillion. Consolidated operating profit decreased by KRW 489 billion compared to the previous year to KRW 1.184 trillion. - Despite a depressed economy and weak demand from developed markets, we maintained our growth momentum mainly with our market-leading premium products such as ultra-high definition UHD TV and refrigerators. For flat panel TVs, we maintained our No. 1 position in total TV market share, including FPTV and LCD-TV, for the ninth consecutive year. We again achieved the "Triple Crown" thanks to our competitive advantages in technology and design. We continued to widen the gap with our competitors and, as a result, solidified our top position in the market. In 2015, we will continue to enhance our product leadership through exclusive design features in the premium and over-60" large-size line ups, and lead the market with ultra-high definition SUHD TV.

Samsung Electronics 2014 Business Report 104 / 170
[IM Division]
- The IM division’s revenue and profitability decreased compared to the previous year. 2014 revenue decreased by 19.5% to KRW 111.765 trillion and operating profit declined by 41.6% to KRW 14.563 trillion. - Despite stronger demand in emerging markets and an increase in premium smartphone sales, our market share and earnings declined compared to the previous year due to enhanced mid to low-end smartphone competitiveness of Chinese local makers and the launch of a large screen premium smartphone by competitors. In the premium market, the new Note line up and Galaxy Gear S, VR, and Circle are getting positive feedback based on the Galaxy brand image, achieving strong sales from the fourth quarter. This year, we will reinforce our leadership in the premium market based on differentiated design with new technologies, such as flexible display, and continue to increase mass-market dominance through various line ups. In addition, we will strengthen our position as a market leader who consistently provides new value to customers by investing in wearable products tailored to customers’ needs, including Gear S, VR, and Circle, and new growth engines such as Mobile Health Care and B2B. [Semiconductor]
- The semiconductor business’s 2014 revenue increased by 6.1% from the previous year to KRW 39.730 trillion. Operating profit increased by 27.4% compared to the previous year to KRW 8.776 trillion. - Amid stable demand in the memory market, we enhanced our cost competitiveness and increased high value-added product sales. As a result, our earnings improved remarkably. We also increased investment in the advanced process technologies to reinforce our technology leadership. - For DRAM, while ASP remained strong due to overall supply shortage, supply remained unstable in the fourth quarter of 2014. In particular, as other makers are experiencing a delay in producing cutting-edge high-performance and high-density products such as DDR4 and LPDDR4, we had a high level of demand. For NAND, supply and demand condition has been stabilizing since the second half of 2014 led by increased adoption in new smartphones and expansion of SSD adoption. In the first quarter of 2015, we expect the cloud server and mid to low-end mobile markets to grow. Accordingly, we plan to increase differentiated products based on cutting-edge processes and respond to each application by using various product line ups so that we can continue to lead the market as the No.1 memory maker. We have been maintaining our research and development competitive advantage which is over one year ahead of peer companies. We are also reinforcing our market leadership by launching premium products. For DRAM, we are leading the market by stabilizing production and yield of 20nm products and accelerating development of 10nm DRAM. As for NAND, we are aggressively entering the premium market by adding V-NAND in high-performance SSD, and expanding the share of high-quality 3bit products to maximize cost competitiveness. Looking forward to 2015, we will maintain our industry leadership as the No. 1 memory maker by leveraging our technological advantages and cost competitiveness from advanced process development. We will continue to expand our market dominance by further improving cost competitiveness and offering differentiated products through advanced process development. - For System LSI, we expect continued growth of mobile products in 2015 as the mid to low-end smartphone and tablet markets expanded further in emerging markets in 2014.

Samsung Electronics 2014 Business Report 105 / 170
For SOC products, demand for mobile IC, such as AP and modem SOC, is on the rise. Demand for an integrated chip, which provides all functions at once, is also increasing due to the expansion of the mid to low-end smartphone and tablet markets. We are securing the competitiveness of CIS products in emerging markets by differentiating our hardware with high-pixel technology. In response to this increasing demand for mid to low-end IC chips, we plan to release more competitive products earlier than competitors by leveraging our advanced process advantages. The System LSI market is growing mainly due to mobile. We expect the wearable device and IOT markets to grow further. Our AP business profits are driven by increased 28/20nm AP offerings. In the first quarter of 2015, we will introduce 14nm products to solidify our technological advantages. Additionally, we will further reinforce our competitiveness in AP by expanding the modem/ModAP business and mass producing connectivity products. For the foundry business, we are strengthening our market leadership by developing leading-edge processes, such as next-generation 14nm process, that are ahead of our competitors. [DP] - The DP division’s 2014 revenue decreased by 13.8% from the previous year to KRW 25.727 trillion. Operating profit decreased by 77.9% compared to the previous year to KRW 660.2 billion. - We responded to the market needs in a timely manner by expanding sales of panels for curved and over-60” UHD TV based on solid demand for large-size TV panel. However, small to medium size panel earnings decreased compared to the previous year due to a decline in tablet market demand. For the large size panel business, we improved our manufacturing competitiveness by enhancing yield and reducing product defect rates across all product line ups based on our TFT-LCD technologies. We further strengthened our competitive advantages by offering full line ups in large size TV panels and developing panels for curved TV. For cost savings, we are continuing our efforts to develop highly transparent panels and to localize key manufacturing equipment. We will strengthen partnerships with customers in technology and product development to maintain the highest utilization rate in the industry and to maximize profitability. For the small to medium size panel business, we expect the product line ups to expand from premium smartphones to mid to low-end, and the trends toward higher resolution as well as higher size smartphone panel to continue. We will reinforce our position in the premium market with our flexible and ultra-high resolution products, and focus on securing mid to long-term growth momentum and strengthening business competitiveness by expanding our customer base in the mid to low-end market. In 2015, we plan to expand premium product sales, including high-quality curved and over-60” UHD TV, actively respond to the market demand by reinforcing our mass-market display panel competitiveness, and strengthen cost competitiveness to improve profitability. In addition, while we secure product competitiveness through next-generation displays, we will also focus on developing future technologies such as transparent display to cement our position as a market-leading display maker. C. New businesses N/A

Samsung Electronics 2014 Business Report 106 / 170
D. Changes in Organizational Structure In December 2009, following an organizational change, the Company was reorganized from a two-divisional system (DMC and DS) to a system of seven independent business units. Additionally, the total number of regional headquarters increased to 10, as the Africa regional headquarters was newly established. In April 2010, the Digital Imaging business unit was added through a merger with Samsung Digital Imaging. In December 2010, an overseas semiconductor division was changed from a subsidiary to a regional headquarters. In July 2011, the Company established the DS business headquarters to reinforce synergies in the component business. In December 2011, following an organizational change, the DMC division was re-established and the Company returned to a two-divisional system (DMC and DS). In April 2012, the LED business unit was added through a merger with Samsung LED. In May 2012, the Japan regional headquarters was established under the DS division. In December 2012, following an organizational change, the CE and IM businesses were upgraded to individual division status, and the IT Solution business was divided into the Printing Solution and Computer businesses. The Printing Solution business was incorporated into the CE division, and the Computer business was integrated into the Mobile business under the IM division. The Medical Device business team was upgraded to a business unit within the CE division. In December 2013, the Digital Imaging business was changed to a team unit, and then was integrated with the Mobile business. No changes have made during 2014.
(Refer to 『2. Company History』 of 『I. Corporate Overview』 for more details about changes in the organizational structure.)
E. Foreign Exchange Risk
The Company is exposed to foreign exchange risks of currencies, including USD, in carrying out business activities. Uncertainty related to exchange rates could influence business transactions, assets and liabilities in the future. In particular, as the Company exports more than it imports, won cash flow can be negatively impacted when the won is strong. As such, the Company focuses on minimizing foreign exchange risk by matching foreign currency income and expenditure and does not hedge foreign currencies using derivatives. In particular, macroeconomic factors such as a fall in KRW/USD exchange rate and global policies to move away from ultra-low interest rates can negatively impact the Company’s profitability.
4. Liquidity, Financing, and Expenditure As of the end of2014, the Company has KRW 61.817 trillion of liquid funds.
These liquid funds include i) cash and cash equivalents, ii) short-term financial instruments, and iii) short-term available-for-sale securities. This balance increased by KRW 7.321 trillion from KRW 54.496 trillion at the end of the previous period.
The Company’s short-term borrowings (including alternatives for liquidity) are KRW 9.808 trillion, an increase of KRW
Samsung Electronics 2014 Business Report 107 / 170
943.7 billion from KRW 8.864 trillion of the end of the previous year. Long-term borrowings are KRW 1.458 trillion, a decrease of KRW 838.6 billion from KRW 2.296 trillion of the end of the previous year.
The Company’s net cash (liquid funds - borrowings) is KRW 50.552 trillion, which is an increase of KRW 7.216 trillion from KRW 43.336 trillion of the end of the previous period.
The Company has ample liquidity according to the liquidity assessment index of the global credit rating agency Moody’s. The Company’s cash coverage (cash and cash equivalents/borrowings), which is a major liquidity index that Moody’s uses, corresponds to the highest level, Aaa.
2014 2013 Note
Cash Coverage
(Cash and cash equivalents /borrowings) 549% 488%
Moody's rating
Aaa : >100%
5. Other Information for Investment Decision Making A. Significant accounting policies and estimation
- Refer to 『2. Note to Consolidated Financial Statements 』 in 『III. Financial Affairs』 for significant accounting
policies and estimates.
B. Environment and employees
- Refer to 『5. Sanctions and others』 in 『XI. Other information for investor protection』 for environmental sanctions or
administrative actions.
- No significant changes in employee positions during this period.
C. Legal regulations
- Refer to 『5. Sanctions and others』 of 『XI. Other information for investor protection』 for major legal regulations on
the Company’s businesses.
D. Derivatives and risk management policy
- To manage exchange rate risk, overseas companies enter into currency forwards which are denominated in the trading currency of a foreign currency position as opposed to the companies’ reporting currencies. Overseas offices buy or sell currency forwards with less than one year maturity via a bank to avert risk.

Samsung Electronics 2014 Business Report 108 / 170
VI. Corporate Governance
1. Board of Directors A. Overview of Board of Directors As of December 31, 2014, the Board of Directors (BOD) consists of nine (9) directors, four (4) of whom are executive directors (Oh-Hyun Kwon, Boo-Keun Yoon, Jong-Kyun Shin, and Sang-Hoon Lee) and five (5) independent directors (In-Ho Lee, Han-Joong Kim, Kwang-Soo Song, Byeong-Gi Lee, and Eun-Mee Kim). The Board has six (6) committees as follows: Management Committee, Audit Committee, Independent Director Recommendation Committee, Related Party Transactions Committee, Compensation Committee, and CSR Committee. B. The BOD Agendas considered and voting results
Date Agenda Results
Independent directors
In-Ho Lee Han-
Joong Kim
Kwang- Soo Song
Byeong-Gi
Lee
Eun-Mee Kim
Jan 24, 2014
① Approval of FY2013 financial statements and annual business report
② Approval of FY2014 business plan ③ Revision to management committee regulations ④ Participation in Samsung BioLogics equity rights offerings ⑤ Appointment of compliance officer
※ Reported Items ① Report on the internal accounting management system ② Assessment of the internal accounting management system ③ Report on the results of establishment of research committee for
environmental safety
Approved
Approved Approved Approved Approved
For
For For For For
For
For For For For
For
For For For For
For
For For For For
For
For For For For
Feb 18, 2014
① Decision to convene the 45th (FY2014) AGM ② Decision of the 45th AGM agenda items
- report items: 1) FY2013 annual audit report 2) FY2013 annual business report - Item 1: Approval of FY2013 financial statements, including
balance sheet, income statement, and the statement of appropriation of retained earnings, etc.
- Item 2: Approval of remuneration limit for Directors ③ Donation to Chung-nam Samsung Institute
※ Reported Item ① Report on the results of compliance review
Approved Approved
Approved
Did not attend
For For
For
For For
For
For For
For
Did not attend
Apr 29, 2014
① Approval of 1Q FY14 financial statements and business report ② Renewal of the existing Directors' liability insurance policy ③ Donation ④ Application for Venture Capital Union
Approved Approved Approved Approved
For For For For
For For For For
For For For For
For For For For
For For For For
Jun 03, 2014
① Disposal of technology assets ② Equity investments ③ A property leasing contract with Samsung Display ※ Reported Items ① Research results and findings from the advancement of
corporate ecosystem research council ② Reported Progress of research results for the environmental
safety
Approved Approved Approved
For For For
For For For
For For For
For For For
For For For

Samsung Electronics 2014 Business Report 109 / 170
Jul 31, 2014
① Approval of the 46th 1H14 financial statements, business report, and interim dividend
② Approval of Samsung Asset Management annual trade volume ③ Application for property insurance ④ Donation to Sungkyunkwan University ⑤ Donation to Samsung Science & Technology Foundation
Approved
Approved Approved Approved Approved
For
For For For For
For
For For For For
For
For For For For
For
For For For For
For
For For For For
Oct.30 2014
① Approval of the 46th 3Q14 financial statements and business report
Approved
For
For
For
For
Did not attend
Nov.26 2014
① Approval of transactions with affiliate persons ③ Payment of retirement pensions ④ Equity investments ⑤ Real estate rental from Samsung Life Insurance ⑥ Acquisition of treasury stock
Approved Approved Approved Approved Approved
For For For For For
For For For For For
For For For For For
For For For For For
Did not attend
C. The Committees of BOD (1) Composition of the BOD Committees as of December 31, 2014
Committee Name Members Member Name Responsibility and
Authority
Management 4 Executive
Directors Oh-Hyun Kwon, Boo-Keun Yoon,
Jong-Kyun Shin, Sang-Hoon Lee
See description below
Related Party Transactions
3 Independent Directors
In-Ho Lee, Han-Joong Kim, Kwang-Soo Song
Compensation 3 Independent
Directors Kwang-Soo Song, In-Ho Lee, Byeong-Gi Lee
CSR 5 Independent
Directors Byeong-Gi Lee, In-Ho Lee, Han-Joong Kim,
Kwang-Soo Song, Eun-Mee Kim
※ The Audit Committee and Independent Director Recommendation Committee were excluded according to Corporate Disclosure Guidelines set forth by the Financial Supervisory Service Authority of South Korea.
i) The Management Committee - Responsibility: The Management Committee deliberates and decides on matters specified by the BOD regulations and
resolutions or specifically delegated by the BOD. The composition and operation of the management committee are determined by the BOD.
- Authority The Management Committee deliberates and decides on the following matters: (A) General management
1. Annual or mid to long-term management policy and strategy 2. Key management strategy 3. Business planning and restructuring 4. Establishment, relocation, and withdrawal of overseas branch and corporation 5. Initiating cooperation such as strategic partnership with foreign companies 6. Acquisition or disposal of domestic and overseas subsidiaries 7. Other major management matters 8. Establishment, relocation, and withdrawal of branches and operations 9. Appointment or dismissal of supervisors 10. Suspension or shutdown of production over 5% of the total production in the recent year

Samsung Electronics 2014 Business Report 110 / 170
11. Licensing agreements and technology transfer, partnership in regards to technology of over 0.5% of the total equity 12. Acquisitions and transfers of patents related to new material and new technology of over 0.5% of the total equity 13. Collection and destruction of products corresponding to over 5% of the total sales in the recent business year 14. Contracting for over 5% of the total sales in the recent business year 15. Contracting or canceling of single sales agency and suppliers over 5% of the total sales in the recent business year 16. Set basic principles of organization management 17. Decision making on basic principles and any changes related to wages, bonus, and fringe benefits 18. Appointments, dismissals and changes of transfer agent 19. Closing of shareholder register and setting reference date 20. Establishing corporate guidelines for business and management related activities 21. Donations over KRW 50 billion per donation. Donation to related parties between KRW 1 billion and KRW 5 billion
(B) Matters related to Finance
1. Acquisitions or disposals of equity investments with a value between 0.1% and/or less than 2.5% of the total equity 2. Direct overseas investments with a value of over 0.1% and/or less than 2.5% of the total equity 3. New debt guarantee (excluding extension of period) or collateral issuance with a value of over 0.1% and/or less
than 2.5% of the total equity A. Collateral: Only in the case of providing collateral for others B. Guarantee: Excludes performance guarantee (e.g., bid, contract, defect, difference guarantee) and tax
payment guarantee 4. New credit agreement contract (excluding extension of period) with a value of over 0.1% and/or less than 5% of
the total equity 5. Approval of related party transactions:
Related party transactions with affiliates involving cash (loans and payments), equity (stocks and bonds) or assets (such as real estate and intangible property rights) with a value between KRW 1 billion and/or less than KRW 5 billion, as defined in the Monopoly Regulation and Fair Trade Act ※ Excluding cases where existing contracts are renewed without significant change.
6. Issuance of Corporate Bond 7. Acquisition and disposal of real estate with a value of over 0.1% of the total equity, provided that the transaction
is with the third party 8. Any matters that the CEO deems necessary and important for the business (e.g., CAPEX)
(C) All other matters except for those delegated to the BOD and other committees in accordance with BOD regulations
ii) Related Party Transactions Committee
- Responsibility: Improve management transparency through establishment of a voluntary compliance system - Authority
1) Right to receive reports on related party transactions: The Committee can request reports on related party transactions with affiliates ※ According to the Monopoly Regulation and Fair Trade Act, the Related Party Transactions committee is
permitted to conduct preliminary reviews and approves on related party transactions over KRW 5 billion and other transactions that are deemed as significant.
2) Right to order ex officio investigation of related party transactions 3) Right to propose corrective measures for related party transactions

Samsung Electronics 2014 Business Report 111 / 170
iii) Compensation Committee
- Responsibility: Provide transparent and objective decision making process related to remuneration of directors - Authority
1) Propose remuneration limit of directors at annual general shareholders’ meeting 2) Establish the director remuneration system 3) Other matters delegated by the Board
iv) CSR Committee
- Responsibility: Address social responsibilities of the Company and make contributions to public interest - Authority 1) Make decisions on matters related to social contributions of the Company 2) Establish research groups under the committee, appoint researchers, and devise CSR management plan 3) Other matters delegated by the Board
(2) The BOD Committee Activities ※ The Audit Committee and Independent Director Recommendation Committee were excluded according to Corporate
Disclosure Guidelines set forth by the Financial Supervisory Service Authority of South Korea. The Management Committee
Name Date Agenda Voting Results Attendance/Voting
Results of Independent Directors
Management Committee
Jan 20, 2014
① Patent license agreement ② Patent license agreement ③ Establishment of production base in the Republic of South
Africa ④ Product donations to Chung-nam Samsung Institute
Approved Approved Approved
Approved
N/A
(All comprised of executive directors)
Feb 19, 2014 ① Technology license agreement ② Liquidation of a subsidiary
Approved Approved
Mar 19, 2014 ① Ownership sales of Samsung Bluewings Approved
May 14, 2014 ① Increase the limit on trade finance ② Exercise of voting rights for merger with affiliates ③ Donation
Approved Approved Approved
Jun 3, 2014 ① Patent license agreement ② Closing of shareholder register for interim dividend
Approved Approved
Jul 16, 2014 ① Stake acquisition ② Stake acquisition ③ LED investment
Approved Rejected Approved
Jul 31, 2014 ① Stake acquisition ② Patent license agreement
Approved Approved
Aug 13, 2014 ① Stake acquisition ② Memory investment
Approved Approved
Sep 17, 2014 ① Bid for real estate purchase ② S.LSI investment ③ Establishment of overseas marketing corporate entity
Approved Approved Approved

Samsung Electronics 2014 Business Report 112 / 170
Oct 15, 2014 ① Memory investment ② Exercising voting rights regarding merger
Approved Approved
Nov 12, 2014 ① Stake acquisition Approved
Nov 26, 2014
① Stake sales ② Establishment of overseas complex ③ Business disposal ④ Memory investment ⑤ Integration of corporate bases
Approved Approved Approved Approved Approved
Dec 10, 2014 ① Merger with overseas office Approved

Samsung Electronics 2014 Business Report 113 / 170
The Related Party Transactions Committee
Date Agenda Voting
Results
Name of independent directors
In-Ho Lee (Attendance:
86%)
Han-Joong Kim (Attendance:
100%)
Kwang-Soo Song (Attendance:
100%)
For/against
Jan 23, 2014
- Preliminary review on large-scale related party transactions 1) Participation in Samsung BioLogics equity rights offerings - Report on 4Q13 related party transactions
N/A
-
-
-
-
-
-
Feb 18, 2014
- Preliminary review on large-scale related party transactions 1) Donation to Chung-nam Samsung Institute N/A
Did not attend
-
-
Apr 28, 2014
- Preliminary review on large-scale related party transactions 1) Renewal of the existing directors’ liability insurance policy 2) Donation 3) Application for Venture Capital Union - Report on 1Q14 related party transactions
N/A
-
-
-
-
-
-
Jun 3, 2014
- Preliminary review on large-scale related party transactions 1) Disposal of Technology assets 2) Equity investments 3) A property Leasing contract with Samsung Display
N/A
-
-
-
Jul 30, 2014
- Preliminary review on large-scale related party transactions
1) Approval of Samsung Asset Management annual trade volume
2) Application for property insurance 3) Donation to Sungkyunkwan University 4) Donation to Samsung Science & Technology Foundation
- Report on 2Q14 related party transactions
N/A
-
-
- -
- -
Oct 29, 2014
- Report on 3Q14 related party transactions N/A -
-
-
Nov 26, 2014
- Preliminary review on large-scale related party transactions
1) Approval of 2015 large-scale transactions of goods/services 2) Payment of retirement pensions 3) Equity investments 4) Real estate rental from Samsung Life Insurance
N/A
-
-
-

Samsung Electronics 2014 Business Report 114 / 170
The Compensation Committee
Date Agenda Voting
Results
Name of Independent Directors
Kwang-Soo Song (Attendance: 100%)
In-Ho Lee (Attendance: 50%)
Byeong-Gi Lee (Attendance: 100%)
For/Against
Feb 13, 2014
Appointment of the head of compensation committee
Approved For For For
Feb 18, 2014
Preliminary review on remuneration limit for Directors
Approved For Did not attend For
The CSR Committee
Date Agenda Voting
Results
Name of Independent Directors
Byeong-Gi Lee (Attendance:
100%)
In-Ho Lee (Attendance:
100%)
Han-Joong Kim (Attendance:
100%)
Kwang-Soo Song
(Attendance: 100%)
Eun-Mee Kim
(Attendance: 50%)
For/Against
Jan 24, 2014
- Report on the results of establishment of research committee for environmental safety
Approved For
For
For
For
For
May 30, 2014
- Research results and findings from the advancement of corporate ecosystem research council
- Reported Progress of research results for the environmental safety
N/A
-
-
-
-
-
-
-
-
Did not attend

Samsung Electronics 2014 Business Report 115 / 170
D. Director Independence
(1) Appointment of Directors Directors are appointed by shareholders at the annual general meeting of shareholders. The Board is responsible for nominating candidates for Executive Directors, and the Independent Director Recommendation Committee nominates independent director candidates, which are presented to shareholders as separate agendas and voted on at the annual general meeting. The Board submits shareholders’ proposal for appointment of Directors at the annual general shareholder meeting as a separate agenda if the proposal satisfies related laws and regulations. The Board of Directors appointed by shareholders is as follows: [As of December 31, 2014]
Position Name Nominated by Responsibility Transactions with
the Company
Relation with the controlling
shareholder
Executive Director
Oh-Hyun Kwon BOD Chairman of BOD
Head of DS Division
N/A N/A
Executive Director
Boo-Keun Yoon BOD Head of CE Division
Executive Director
Jong-Kyun Shin BOD Head of IM Division
Executive Director
Sang-Hoon Lee BOD CFO, Head of Corporate
Management Office
Independent Director
In-Ho Lee
Independent Director
Recommendation Committee
Overall management of the Company
Independent Director
Han-Joong Kim
Independent Director
Recommendation Committee
Overall management of the Company
Independent Director
Kwang-Soo Song
Independent Director
Recommendation Committee
Overall management of the Company
Independent Director
Byeong-Gi Lee
Independent Director
Recommendation Committee
Overall management of the Company
Independent Director
Eun-Mee Kim
Independent Director
Recommendation Committee
Overall management of the Company
※ Oh-Hyun Kwon, Boo-Keun Yoon, and Jong-Kyun Shin are appointed as the Represented Directors of the Company in accordance with the Commercial Act of Korea.

Samsung Electronics 2014 Business Report 116 / 170
(2) Independent Director Recommendation Committee The Independent Director Recommendation Committee assesses the independence and ability of potential candidates and recommends selected candidates to be appointed at the annual general meeting of shareholders. The committee is composed of three Independent Directors (Han-Joong Kim, Byeong-Gi Lee, and Eun-Mee Kim) and one Executive Director (Oh-Hyun Kwon) based on related laws that states more than a majority of members should be independent directors in accordance with clause 4 of Article 542-8 of the Commercial Law.
(3) Professionalism of Independent Directors
There are designated support group in the Company that supports independent directors to perform their duties professionally in the BOD and the Board committees. The support group provides reference materials on the meeting agendas in advance so Directors can thoroughly review them before the Board and committee meetings. If necessary, the support group provides separate information sessions on any agenda and frequently provides updates on other key management issues. In addition, the support group conducts internal education programs which allow Independent Directors to visit and conduct inspect domestic and overseas business sites and receive reports of the current state of business operation.

Samsung Electronics 2014 Business Report 117 / 170
2. Audit System
A. Profile of the member of the Audit Committee As of December 31, 2014, the Company operates an Audit Committee consisting of three (3) Independent Directors.
Name Career Note
In-Ho Lee
- Corporate Advisor, Shinhan Bank (2009-2011)
- Chief Executive Officer, Shinhan Financial Group (2005-2009)
- President & CEO, Shinhan Bank (1999-2003) Independent director
Han-Joong Kim
- Professor Emeritus, Yonsei University (2012~Present)
- President, Yonsei University (2008-2012)
- Professor, Dept. of Preventive Medicine & Public Health (1982-2012) Independent director
Kwang-Soo Song
- Advisor, Kim & Chang Law Office (2007-Present)
- Prosecutor General, Supreme Prosecutors’ Office (2003-2005)
- Chief Prosecutor, Daegu High Prosecutors’ Office (2002-2003) Independent director
B. Audit Committee Independence
Pursuant to related laws and the Articles of Incorporation, the Company has prepared internal audit regulations which encompass composition, operation, authority, and responsibility of the Audit Committees to carry out audit related activities.
The Audit Committee is exclusively composed of Independent Directors appointed at the annual general shareholder meeting and includes audit and financial experts. Also, the Audit Committee satisfies requirements of relevant laws. (e.g., The stipulation that the role of head of the committee be held by an Independent Director. The Audit Committee reviews accounting documents including financial statements and audit process related documents presented by the external auditor, and if needed, requests the external auditor to perform additional reviews on accounting books and records. To ensure the reliability of accounting related disclosures, the audit committee receives and reviews a report on internal accounting control systems prepared by internal accounting managers. In addition, the Committee attends the BOD meetings and other significant meetings. The Committee receives reports on deliberations of the Management Committee and on business performance from Directors and requests additional reviews and supplementation of data as needed.

Samsung Electronics 2014 Business Report 118 / 170
C. Major Activities of the Audit Committee
See the table below for major activities of the Audit Committee by reporting date.
Name Date Agenda Voting Results
Name of independent directors
In-Ho Lee (Attendance: 80%)
Han-Joong Kim (Attendance: 100%)
Kwang-Soo Song (Attendance: 100%)
For/Against
Audit Committee
Jan 23, 2014
- 2013 financial and business reports - Report on 2013 internal accounting management
system activities - Report on 4Q13 non-audit activities - Report on appointment plan of external auditor
- Report on 2013 audit activities
- - - - -
- - - - -
- - - - -
- - - - -
Feb 18, 2014
- Review and approval of appointment of external auditor - Review of the 2013 AGM agenda
- Assessment of 2013 activities of internal compliance system
Approved - -
Did not Attend
For - -
For - -
Apr 28, 2014
- Report on the 1Q14 financial statements and business report
- Report on 1Q14 non-audit activities
- -
- -
- -
- -
Jul 30, 2014
- Report on the 1H14 financial statements and business report
- Report on 2Q14 non-audit activities - Report on 1H14 audit activities
- - -
- - -
- - -
- - -
Oct 29, 2014
- Report on the 3Q14 financial statements and business report
- Report on 3Q14 non-audit activities
- -
- -
- -
- -
3. Voting rights of shareholders A. Voting method The Company has not adopted the concentrated voting system, voting in writing, or electronic voting system. B. Minority Shareholder Right No minority shareholder right was exercised during the reporting period. C. Competition over management right No competition over management rights occurred during the reporting period.

Samsung Electronics 2014 Business Report 119 / 170
VII. Information on Shareholders
1. Ownership of shares by the major shareholder and related parties The following table presents changes in shares held by the major shareholder and related parties as of the beginning and end of the reporting period. [As of December 31, 2014] (Unit: Shares, %)
Name Relationship Type of share
Number of Shares owned
Note Beginning of period End of period
# shares owned % # shares owned %
Kun-Hee Lee Major
shareholder Common 4,985,464 3.38 4,985,464 3.38 -
Kun-Hee Lee Major
shareholder Preferred 12,398 0.05 12,398 0.05 -
Samsung C&T Affiliate Common 5,976,362 4.06 5,976,362 4.06 -
Samsung Welfare Foundation
Affiliate Common 89,683 0.06 89,683 0.06 -
Samsung Foundation Of Culture Affiliate Common 37,615 0.03 37,615 0.03 -
Ra-Hee Hong Affiliate Common 1,083,072 0.74 1,083,072 0.74 -
Jae-Yong Lee Affiliate Common 840,403 0.57 840,403 0.57 -
Samsung Life Insurance
Affiliate Common 10,622,814 7.21 10,622,814 7.21 -
Samsung Life Insurance Affiliate Preferred 879 0.00 879 0.00 -
Samsung Life Insurance
(special accounts) Affiliate Common 514,098 0.35 486,926 0.33 Open market sales
Samsung Life Insurance
(special accounts) Affiliate Preferred 26,379 0.12 52,332 0.23 Open market sales
Samsung Fire & Marine Insurance Affiliate Common 1,856,370 1.26 1,856,370 1.26 -
Samsung Fire & Marine Insurance (special accounts)
Affiliate Common 143 0.00 0 0.00 Open market sales
Samsung Fire & Marine Insurance (special accounts)
Affiliate Preferred 53 0.00 0 0.00 Open market sales
Cheil Industries Affiliate Common 9,679 0.01 0 0.00 Open market sales
Oh-Hyun Kwon Affiliate Common 3,000 0.00 3,000 0.00 -
Sang-Hoon Lee Affiliate Common 1,473 0.00 1,473 0.00 -
Total Common 26,020,176 17.66 25,983,182 17.64 -
Preferred 39,709 0.17 65,609 0.29 -
※ In the beginning of the period(year-end 2013), Samsung Securities held 10 voting shares to broker loan transactions and ETF transactions. But as of the end of the reporting period, it no longer owns any share.

Samsung Electronics 2014 Business Report 120 / 170
※ As of April 24, 2014, Cheil Industries sold 9,679 shares in the market. ※ Note: According to the closed shareholder register, as at December 31,2014, Yong-Jin Jeong, CEO of Shinsegye, holds 245,000
shares. ※ The definition of major shareholder is as defined in the Monopoly Regulation and Fair Trade Act [The major shareholder]
○ Name of the major shareholder: Kun-Hee Lee
○ Career (recent 5 years): Chairman of Samsung Electronics (2010.3 ~) Chairman/CEO of Samsung Electronics (1998.4 ~ 2008.4) Vice Chairman of the Federation of Korean Industries (1987 ~) Member of the International Olympic Committee (1996 ~)
- There are no changes of the major shareholder recorded during the reporting period.
2. Ownership of shares As at December 31, 2014, the date of Suspension of Entry in the Register of Shareholders, shareholders with over 5% voting shares, excluding the major shareholder, are as follows: [As of December 31, 2014]
(Unit: Shares)
Classification Name Number of shares owned Share ratio Note
Shareholders with over 5% voting shares
National Pension Service 11,164,905 7.58 -
Samsung Life Insurance 11,109,740 7.54 -
Employee Stock Ownership Association - - -
※ The number of shares owned and share ratio of Samsung Life Insurance includes special accounts.
3. Minority Shareholders [As of December 31, 2014]
(Unit: Person, Shares, %)
Classification Shareholder Shares owned
Note # of shareholders Portion # of shares Portion
Minority shareholder
115,030 99.94 84,010,794 57.03 Shareholders with shares less than 1/100 of total issued stocks
Total 115,097 100.00 147,299,337 100.00
※ On common stock (with voting right) basis.

Samsung Electronics 2014 Business Report 121 / 170
4. Stock Affairs
Preemptive Rights in the Articles of Incorporation
1. New shares to be issued by the Company shall be allocated to the shareholders in proportion to their respective shareholdings in accordance with Paragraph 6, Article 8. If shareholders wave or lose their preemptive right to new shares issues or if there are fractional shares at the time of allocation of new shares, such shares may be handled by a resolution of the Board of Directors.
2. Notwithstanding the above Paragraph 1, new shares may be allocated to persons other than shareholders in the following cases:
a. If the Company issues new shares or causes underwriters to underwrite new shares by a resolution of the Board of Directors in accordance with the applicable laws and regulations including the Securities and Exchange Act ("SEA");
b. If the Company allocates new shares preferentially to members of the Employee Stock Ownership Association by a resolution of the Board of Directors in accordance with the applicable laws and regulations including SEA;
c. If the Company issues new shares for the issuance of depositary receipts (DR) by a resolution of the Board of Directors in accordance with the applicable laws and regulations including SEA;
d. If the Company issues new shares by public offering in accordance with Article 11-3;
e. If new shares are issued by the exercise of stock options in accordance with Article 11-4;
f. If the Company issues new shares to the extent of 30% of the total issued and outstanding shares, to domestic or foreign financial institutions to obtain financing urgently, or to partner companies to induce technology therefrom, etc., by a resolution of the Board of Directors; provided that the issue price of the new shares shall not be less than the price prescribed by Article 84-5 of the Enforcement Decree of SEA.
☞(Note) Paragraph 6, Article 8
In the case of rights issues, bonus issues or stock dividends, common shareholders shall be entitled to common shares, and preferred shareholders shall be entitled to preferred shares, in proportion to their respective shareholdings; provided that in the case of rights issue and stock dividend the Company may, if necessary, issue only one kind of shares, where all the shareholders, regardless of the class of their shares, shall be entitled to the kind of shares to be issued.
☞ (Note) Article 11-3 (Public Offering)
1. The Company may issue new shares by public offering to the extent that the new shares do not exceed 30% of the total number of issued and outstanding shares by a resolution of the Board of Directors, pursuant to Article 189-3 of the SEA.
2. If the Company issues new shares by public offering, the type, number and issue price of the new shares shall be determined by a resolution of the Board of Directors; provided that the issue price of such new shares shall not be less than the price prescribed by Article 84-5 of the Enforcement Decree of the SEA.

Samsung Electronics 2014 Business Report 122 / 170
Preemptive Rights in the Articles of Incorporation
☞ (Note) Article 11-4 (Stock Options)
1. The Company may grant stock options to its officers and employees (in this Article, “officers and employees” include officers and employees of the related companies as set forth in Article 189-4, Paragraph 1 of the SEA) by a special resolution of the general meeting of shareholders pursuant to Article 189-4 of the SEA, to the extent permitted by the SEA; provided, however, that the Company may grant the stock options to its officers and employees (except for the directors of the Company) by a resolution of the Board of Directors to the extent determined by the relevant laws and regulations.<Amended, Feb.28, 2002>
2. The persons to whom stock options may be granted are the officers and employees who have contributed or
have the capacity to contribute to the establishment, management, overseas business, technical innovation, etc. of the Company; provided, however, that the officers and employees who are not entitled to stock options under the relevant laws and regulations shall be excluded.<Amended, Feb.28, 2002>
3. The shares to be issued to the officers or employees by the exercise of their stock options (in case the Company
pays, either in cash or treasury shares, the difference between the exercise price of stock options and the market price, they refer to the shares which are the basis for such calculation) shall be common shares in registered form or preferred shares in registered form.
4. Total number of shares to be delivered in accordance with the exercise of stock options shall be up to the extent
permitted by the relevant laws and regulations. 5. The stock options may be exercised until an expiry date determined by a resolution of the general meeting of
shareholders or the Board of Directors and the expiry date shall be in no more than eight (8) years from when two (2) years have elapsed from the date of the general meeting of shareholders or the Board of Directors' meeting at which a resolution to grant such stock options was; provided, however, that the person to whom a stock option is granted should serve the Company for at least two (2) years after the date of such resolution in order to exercise such stock option, unless otherwise set forth by relevant laws and regulations.<Amended, Feb.28, 2002>
6. The terms and conditions of stock options, such as the contents and exercise price thereof shall be determined
by a special resolution of the general meeting of shareholders or by a resolution of the Board of Directors in accordance with the relevant laws and regulations and the Articles of Incorporation; provided, however, that such matters which are not provided for as matters reserved for resolutions of the general meeting of shareholders or the Board of Directors' meeting under the relevant laws and regulations or the Articles of Incorporation may be determined by the Board of Directors or a committee authorized by the Board of Directors.<Amended, Feb.28, 2002>
7. The Company may cancel the grant of stock options by a resolution of the Board of Directors in any of the
following cases: <Amended, Feb.28, 2002> a. In case the option grantees voluntarily retire from their office or leave the Company after the grant of stock
options; b. In case the option grantees cause substantial damage to the Company due to their willful misconduct or
negligence; c. In case any of the causes for cancellation set forth in the stock option agreement occur
Settlement date December 31 Annual General
Meetings of Shareholders
Within 3 months after the end of every business year
Shareholder register closing period One month from January 1
Stock type 1,5,10,50,100,500,1000,10000(8 types)
Transfer agent Korea Securities Depository(T: +82-2-3774-3000): 23, Yeouinaru-ro 4-gil, Yeongdeungpo-gu, Seoul, Korea
Shareholder benefit n/a Published on Joongang Daily

Samsung Electronics 2014 Business Report 123 / 170
5. Stock Price and Stock Transactions
A. Domestic stock market
(Unit: KRW, Shares)
Type July ‘14 August September October November December
Common stock
Stock price
Highest 1,395,000 1,317,000 1,226,000 1,244,000 1,287,000 1,352,000
Lowest 1,284,000 1,222,000 1,150,000 1,083,000 1,190,000 1,266,000
Average 1,329,565 1,261,450 1,193,895 1,126,143 1,221,250 1,310,143
Volume
Highest (day)
487,027 564,621 466,184 772,463 887,556 409,817
Lowest (day)
119,577 168,153 113,281 124,877 120,604 112,756
Monthly 4,749 5,113 4,991 6,138 5,275 5,122
Preferred stock
Stock price
Highest 1,128,000 1,044,000 1,008,000 985,000 1,049,000 1,046,000
Lowest 1,040,000 956,000 875,000 822,000 919,000 959,000
Average 1,075,522 1,001,050 946,842 874,476 960,850 1,018,143
Volume
Highest (day)
88,913 96,322 96,922 89,068 93,546 67,540
Lowest (day)
7,019 21,972 11,188 15,137 19,263 12,605
Monthly 780 931 775 1,017 679 730
※ Monthly trading volume in 1,000 shares

Samsung Electronics 2014 Business Report 124 / 170
B. Overseas stock market
□ Name of stock exchange: London Stock Exchange (common stock) (Unit: $, KRW, DR)
Type July ‘14 August September October November December
Common stock
Stock price
Highest 674.00 636.50 607.00 575.00 579.50 611.00
(Converted to KRW) 690,648 657,950 616,044 606,050 633,104 672,894
Lowest 630.50 600.00 553.00 515.50 541.00 577.00
(Converted to KRW) 641,849 612,360 576,281 552,771 601,700 627,834
Average 649.17 614.65 577.55 530.98 557.18 591.71
Volume
Highest (day) 78,983 117,894 134,943 161,340 111,237 128,518
Lowest (day) 14,277 2,122 16,902 20,239 29,845 4,706
Monthly 881 1,014 1,404 1,650 1,041 1,400
※ Monthly volume in 1,000 Depository Receipt (DR) shares.
※ Stock price converted to KRW is based on KRW/USD exchange rate of closing price of trading day. Ratio: Common one (1) share equals DR two (2) shares
□ Name of stock exchange: Luxembourg Stock Exchange (Preferred stock) (Unit: USD, KRW, 1,000 Shares )
Type July ‘14 August September October November December
Preferred stock
Stock price
Highest 548.50 501.00 497.50 457.20 468.00 472.00
(Converted to KRW) 562,048 517,884 504,913 481,889 515,315 519,814
Lowest 511.50 475.20 424.50 378.70 417.00 437.30
(Converted to KRW) 517,740 484,989 442,371 406,080 457,658 475,826
Average 525.54 487.95 459.41 409.54 436.82 459.32
Volume
Highest (day) 33,490 104,610 14,596 47,310 42,035 33,245
Lowest (day) 529 490 279 2,043 2,188 245
Monthly 134 561 104 259 258 229
※ Monthly volume in 1,000 DR shares.
※ Stock price converted to KRW is based on KRW/USD exchange rate of closing price of trading day. Ratio: Common one (1) share equals DR two (2) shares

Samsung Electronics 2014 Business Report 125 / 170
VIII. Executives and Employees
1. Executives and Employees A. Registered Executives [As of December 31, 2014] (Unit: # of shares)
Name Gender Date of
birth Position
Registered executive
Full/ part-time
Responsibility Major career
Number of shares owned Length of
Service Term expiration
Common Preferred
Oh-Hyun Kwon
M 1952.10 CEO Registered executive
Full time
Chairman of BOD Head of DS
Division
Head of DS Division
3,000 0 34 mo. 2015.03.15
Boo-Keun Yoon
M 1953.02 CEO Registered executive
Full time Head of CE
Division Head of CE
Division 0 0 22 mo. 2016.03.14
Jong-Kyun Shin
M 1956.01 CEO Registered executive
Full time Head of IM
Division
Head of IM
Division 0 0 22 mo. 2016.03.14
Sang-Hoon Lee
M 1955.06 CFO Registered executive
Full time
CFO, Head of Corporate
Management Office
Head of Corporate
Management Office
1,473 0 22 mo. 2016.03.14
In-Ho Lee
M 1943.11 Independent
Director Registered executive
Part time Overall
management of the Company
President & CEO of Shinhan
Bank
0 0 58 mo. 2016.03.14
Han-Joong Kim
M 1948.11 Independent
Director Registered executive
Part time Overall
management of the Company
President of Yonsei University
0 0 34 mo. 2015.03.15
Kwang-Soo
Song M 1950.01
Independent Director
Registered executive
Part time Overall
management of the Company
Advisor at Kim &
Chang Law Office
0 0 22 mo. 2016.03.14
Byeong-Gi Lee
M 1951.05 Independent
Director Registered executive
Part time Overall
management of the Company
Professor of Electrical
Engineering at Seoul National
University
0 0 34mo. 2015.03.15
Eun-Mee Kim
F 1958.09 Independent
Director Registered executive
Part time Overall
management of the Company
Dean of Graduate School of
International Studies at
Ewha Womans University
0 0 22 mo. 2016.03.14
※ At the AGM held on March 13, 2015, executive director Oh-Hyun Kwon and independent directors Han-Joong Kim and Byeong-Gi Lee were reappointed.

Samsung Electronics 2014 Business Report 126 / 170
B. Concurrent position with other companies
Concurrent office holder Company
Name Position Name of company Position
Kwang-Soo Song Independent director Doosan Corp. Independent director
C. Employees [As of December 31, 2014] (Unit: KRW million)
Division Gender
No. of employees Average length
of service (years)
Total Compensation
Average Compensation per employee Regular
Contract-based
Others Total
CE M 17,242 526 - 17,768 11.0 - -
CE F 3,346 397 - 3,743 6.3 - -
IM M 19,098 386 - 19,484 9.7 - -
IM F 7,660 245 - 7,905 7.1 - -
DS M 29,238 273 - 29,511 9.7 - -
DS F 13,011 347 - 13,358 8.8 - -
Others M 5,561 314 - 5,875 12.8 - -
Others F 1,354 384 - 1,738 7.1 - -
Gender Total M 71,139 1,499 - 72,638 10.3 8,084,727 112
Gender Total F 25,371 1,373 - 26,744 7.8 1,957,242 74
Total 96,510 2,872 - 99,382 9.6 10,041,969 102
※ Total compensation and average compensation per employee were calculated before income tax and other deductions based on the earned income payment record submitted to the district tax office in accordance with Article 20 of the Income Tax Law.
※ The number of employees represent domestic employees resident in Korea, excluding four executive directors.
※ Average compensation per employee was calculated based on total average employee figure of 98,594 (male: 72,188; female: 26,406)

Samsung Electronics 2014 Business Report 127 / 170
2. Remuneration for Directors
A. Summary on Total Remuneration
(1) Remuneration approved at the annual general meetings of shareholders
(Unit: KRW million)
Number of Persons Amount Approved at Shareholders’ Meeting
Note
Executive Directors 4 - -
Independent Directors 2 - -
Audit Committee member or Auditor 3 - -
Total 9 48,000 -
※ Number of persons as of the Reporting Date.
※ The amount approved at shareholders’ meeting is the remuneration limit for directors registered pursuant to Article 388 of the
Korean Commercial Act (“Registered Directors”). It includes compensation for Registered Directors who retired this fiscal year and in past years.
(2) Remuneration Paid
(Unit: KRW million)
Number
of Persons Total amount of remuneration
Average remuneration per Director Note
Executive Directors 4 33,320 8,330 -
Independent Directors 2 168 84 -
Audit Committee member or Auditor 3 270 90 -
Total 9 33,758 - -
※ Number of persons is as of the reporting date.
※ The total amount is the income based on the Income Tax Law that incumbent or retired executive directors, independent directors,
and members of audit committee in the fiscal year received as a Registered Director in accordance with Article 159 of the Financial Investment Services and Capital Markets Act and Article 168 of the enforcement decree of the same law.
※ Average remuneration per Director was calculated by dividing total remuneration by annual average number of persons.
※ There is no recognized expenses (compensation expenses) in this term from granting stock options.

Samsung Electronics 2014 Business Report 128 / 170
B. Summary on Remuneration by Executive
(Unit: KRW million)
Name position Total amount of remuneration
Remuneration not included in total amount
Oh-Hyun Kwon CEO 9,388 -
Boo-Keun Yoon CEO 5,496 -
Jong-Kyun Shin CEO 14,572 -
Sang-Hoon Lee CFO 3,864 -
※ Total amount of compensation for each individual is the sum of earned, retirement, and other related income based on the Income
Tax Law that incumbent or retired executive directors, independent directors, and members of audit committee in the fiscal year received as a Registered Director in accordance with Article 159 of the Financial Investment Services and Capital Markets Act and Article 168 of the enforcement decree of the same law.
(2) Criteria and methodology
Criteria and methodology
CEO Oh-Hyun Kwon
Total compensation of KRW 9,388 million – Earned Income
• Salary: KRW 2,083 million (consists of monthly wage) • Bonus: KRW 6,550 million (consists of traditional holiday bonus, Target Achievement
Incentive, Performance Incentive, Long-term Incentive) • Profit from exercising stock option : n/a • Other earned income: KRW 755 million
– Retirement Income: n/a – Other Income: n/a
Compensation criteria and calculation method – Salary: According to internal regulation for executive treatment (Board resolution) – Bonus: According to internal regulation for executive treatment (Board resolution)
• Traditional holiday bonus: 100% of monthly wage • Target Achievement Incentive: Paid biannual basis within the range of 0~200% of monthly
wage * CEO decides the amount according to the level of target achieved
• Performance Incentive: When performance exceeds the Company’s goal;, CEO decides the amount based on 20% of profit. Paid once a year within 0~50% of salary. (Adjusted according to individual performance)
• Long-term incentive: Calculated within the director remuneration limit, based on the average salary of 3 years, using ROE, stock performance, and EBIT margin
as criteria. Paid over the course of 3 years. Bonus awarded based on his contributions and consideration for his performance as he led the employees and the company in a challenging business environment; he contributed to Samsung Electronics by achieving KRW 206 trillion of revenue and KRW 25 trillion of operating profit and maintaining the Company’s position as the No.1 IT Company as well as the best earnings and technological leadership in the semiconductor industry. – Other earned income: According to internal regulation for executive treatment (Board resolution)
• Consists of a special bonus (one-off) and fringe benefits

Samsung Electronics 2014 Business Report 129 / 170
CEO Boo-Keun Yoon
Total compensation of KRW 5,496 million – Earned Income
• Salary: KRW 1,728 million (consists of monthly wage) • Bonus: KRW 3,114 million (consists of traditional holiday bonus, Target Achievement
Incentive, Performance Incentive, Long-term Incentive) • Profit from exercising stock option : n/a • Other earned income: KRW 653 million
– Retirement Income: n/a – Other Income: n/a
Compensation criteria and calculation method – Salary: According to internal regulation for executive treatment (Board resolution) – Bonus: According to internal regulation for executive treatment (Board resolution)
• Traditional holiday bonus: 100% of monthly wage • Target Achievement Incentive: Paid biannual basis within the range of 0~200% of monthly
wage * CEO decides the amount according to the level of target achieved
• Performance Incentive: When performance exceeds the Company’s goal, CEO decides the amount based on 20% of profit. Paid once a year within 0~50% of salary. (Adjusted according to individual performance)
• Long-term incentive: Calculated within the director remuneration limit, based on the average salary of 3 years, using ROE, stock performance, and EBIT margin
as criteria. Paid over the course of 3 years. Bonus awarded based on his contributions and consideration for his performance as he led the employees and the Company in a challenging business environment; he contributed to Samsung Electronics by achieving KRW 206 trillion of revenue and KRW 25 trillion of operating profit and by improving products of the CE Division as well as maintaining the Company’s global leadership of TV products.
– Other earned income: According to internal regulation for executive treatment (Board resolution) • Consists of a special bonus (one-off) and fringe benefits
CEO Jong-Kyun Shin
Total compensation of KRW 14,572 million – Earned Income
• Salary: KRW 1,728 million (consists of monthly wage) • Bonus: KRW 3,732 million (consists of traditional holiday bonus, Target Achievement
Incentive, Performance Incentive, Long-term Incentive) • Profit from exercising stock option : n/a • Other earned income: KRW 9,113 million
– Retirement Income: n/a – Other Income: n/a
Compensation criteria and calculation method – Salary: According to internal regulation for executive treatment (Board resolution) – Bonus: According to internal regulation for executive treatment (Board resolution)
• Traditional holiday bonus: 100% of monthly wage • Target Achievement Incentive: Paid biannual basis within the range of 0~200% of monthly
wage * CEO decides the amount according to the level of target achieved
• Performance Incentive: When performance exceeds the Company’s goal, CEO decides the amount based on 20% of profit. Paid once a year within 0~50% of
salary. (Adjusted according to individual performance) • Long-term incentive: Calculated within the director remuneration limit, based on the average
salary of 3 years, using ROE, stock performance, and EBIT margin as criteria. Paid over the course of 3 years.
Bonus awarded based on his contributions and consideration for his performance as he led the employees and the Company in a challenging business environment; he contributed to Samsung Electronics by achieving KRW 206 trillion of revenue and KRW 25 trillion of operating profit and by maintaining the Company’s lead in smartphones as well as by developing innovative products.
– Other earned income: According to internal regulation for executive treatment (Board resolution) • Consists of a special bonus (one-off) and fringe benefits

Samsung Electronics 2014 Business Report 130 / 170
CFO Sang-Hoon Lee
Total compensation of KRW 3,864 million – Earned Income
• Salary: KRW 1,123 million (consists of monthly wage) • Bonus: KRW 2,297 million (consists of traditional holiday bonus, Target Achievement
Incentive, Performance Incentive, Long-term Incentive) • Profit from exercising stock option : n/a • Other earned income: KRW 444 million
– Retirement Income: n/a – Other Income: n/a
Compensation criteria and calculation method – Salary: According to internal regulation for executive treatment (Board resolution) – Bonus: According to internal regulation for executive treatment (Board resolution)
• Traditional holiday bonus: 100% of monthly wage • Target Achievement Incentive: Paid biannual basis within the range of 0~200% of monthly
wage * CEO decides the amount according to the level of target achieved
• Performance Incentive: When performance exceeds the Company’s goal, CEO decides the amount based on 20% of profit. Paid once a year within 0~50% of
salary. (Adjusted according to individual performance) • Long-term incentive: Calculated within the director remuneration limit, based on the average
salary of 3 years, using ROE, stock performance, and EBIT margin as criteria. Paid over the course of 3 years.
Bonus awarded based on his contributions and consideration for his performance as he led the employees and the Company in a challenging business environment; he contributed to Samsung Electronics by achieving KRW 206 trillion of revenue and KRW 25 trillion of operating profit and pursued efficient management of resources, corporate, and human resources as the head of the Corporate Management Office.
– Other earned income: According to internal regulation for executive treatment (Board resolution) • Consists of a special bonus (one-off) and fringe benefits
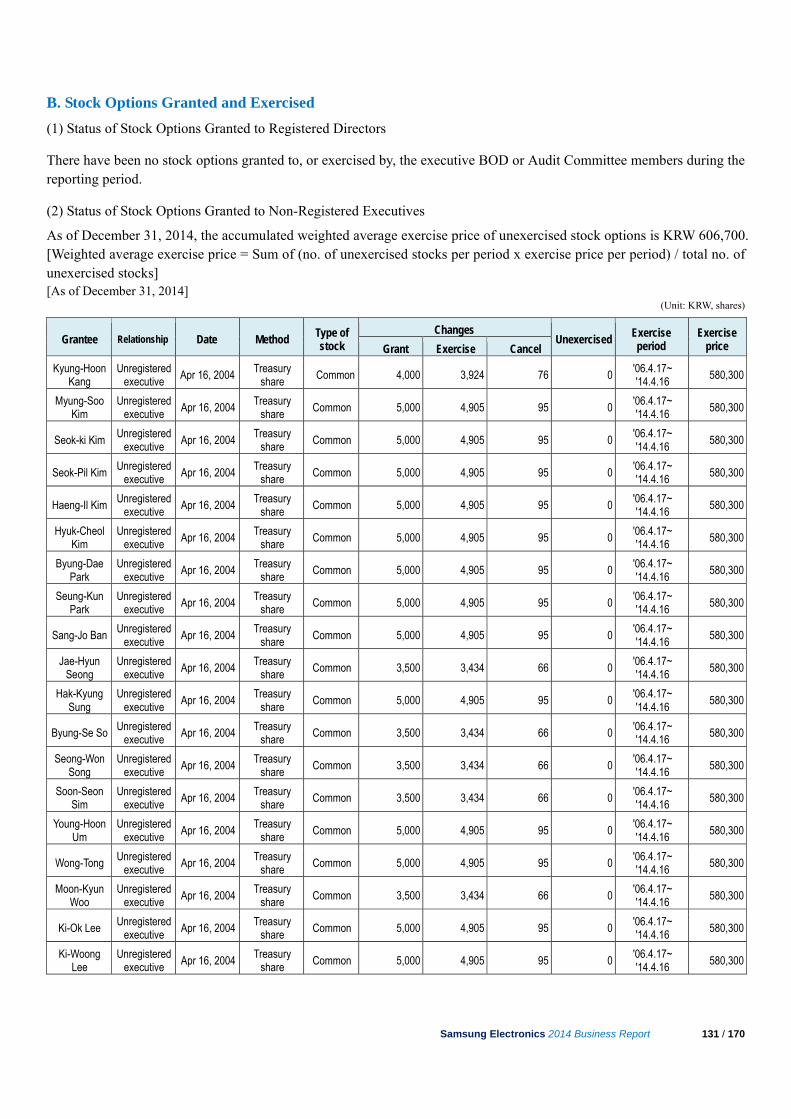
Samsung Electronics 2014 Business Report 131 / 170
B. Stock Options Granted and Exercised
(1) Status of Stock Options Granted to Registered Directors
There have been no stock options granted to, or exercised by, the executive BOD or Audit Committee members during the reporting period.
(2) Status of Stock Options Granted to Non-Registered Executives
As of December 31, 2014, the accumulated weighted average exercise price of unexercised stock options is KRW 606,700. [Weighted average exercise price = Sum of (no. of unexercised stocks per period x exercise price per period) / total no. of unexercised stocks] [As of December 31, 2014]
(Unit: KRW, shares)
Grantee Relationship Date Method Type of stock
Changes Unexercised
Exercise period
Exercise price Grant Exercise Cancel
Kyung-Hoon Kang
Unregistered executive
Apr 16, 2004 Treasury share Common 4,000 3,924 76 0 '06.4.17~
'14.4.16 580,300
Myung-Soo Kim
Unregistered executive Apr 16, 2004
Treasury share Common 5,000 4,905 95 0
'06.4.17~ '14.4.16 580,300
Seok-ki Kim Unregistered
executive Apr 16, 2004
Treasury share Common 5,000 4,905 95 0
'06.4.17~ '14.4.16
580,300
Seok-Pil Kim Unregistered
executive Apr 16, 2004 Treasury
share Common 5,000 4,905 95 0 '06.4.17~ '14.4.16 580,300
Haeng-Il Kim Unregistered executive
Apr 16, 2004 Treasury share Common 5,000 4,905 95 0 '06.4.17~
'14.4.16 580,300
Hyuk-Cheol Kim
Unregistered executive Apr 16, 2004
Treasury share Common 5,000 4,905 95 0
'06.4.17~ '14.4.16 580,300
Byung-Dae Park
Unregistered executive
Apr 16, 2004 Treasury share Common 5,000 4,905 95 0 '06.4.17~
'14.4.16 580,300
Seung-Kun Park
Unregistered executive Apr 16, 2004
Treasury share Common 5,000 4,905 95 0
'06.4.17~ '14.4.16 580,300
Sang-Jo Ban Unregistered
executive Apr 16, 2004
Treasury share Common 5,000 4,905 95 0
'06.4.17~ '14.4.16
580,300
Jae-Hyun Seong
Unregistered executive Apr 16, 2004
Treasury share Common 3,500 3,434 66 0
'06.4.17~ '14.4.16 580,300
Hak-Kyung Sung
Unregistered executive
Apr 16, 2004 Treasury
share Common 5,000 4,905 95 0 '06.4.17~ '14.4.16
580,300
Byung-Se So Unregistered executive
Apr 16, 2004 Treasury share Common 3,500 3,434 66 0 '06.4.17~
'14.4.16 580,300
Seong-Won Song
Unregistered executive
Apr 16, 2004 Treasury
share Common 3,500 3,434 66 0 '06.4.17~ '14.4.16
580,300
Soon-Seon Sim
Unregistered executive
Apr 16, 2004 Treasury share Common 3,500 3,434 66 0 '06.4.17~
'14.4.16 580,300
Young-Hoon Um
Unregistered executive
Apr 16, 2004 Treasury
share Common 5,000 4,905 95 0 '06.4.17~ '14.4.16
580,300
Wong-Tong Unregistered executive
Apr 16, 2004 Treasury share Common 5,000 4,905 95 0 '06.4.17~
'14.4.16 580,300
Moon-Kyun Woo
Unregistered executive Apr 16, 2004
Treasury share Common 3,500 3,434 66 0
'06.4.17~ '14.4.16 580,300
Ki-Ok Lee Unregistered executive
Apr 16, 2004 Treasury share Common 5,000 4,905 95 0 '06.4.17~
'14.4.16 580,300
Ki-Woong Lee
Unregistered executive Apr 16, 2004
Treasury share Common 5,000 4,905 95 0
'06.4.17~ '14.4.16 580,300

Samsung Electronics 2014 Business Report 132 / 170
Grantee Relationship Date Method Type of stock
Changes Unexercised
Exercise period
Exercise price
Grant Exercise Cancel
Sang-Cheol Lee
Unregistered executive Apr 16, 2004
Treasury share Common 5,000 4,905 95 0
'06.4.17~ '14.4.16 580,300
Jae-Hyung Lee
Unregistered executive
Apr 16, 2004 Treasury
share Common 5,000 4,905 95 0 '06.4.17~ '14.4.16
580,300
Chung-Ki Jang
Unregistered executive
Apr 16, 2004 Treasury
share Common 30,000 29,426 574 0 '06.4.17~ '14.4.16
580,300
Joon-Young Jeon
Unregistered executive
Apr 16, 2004 Treasury
share Common 3,500 3,434 66 0 '06.4.17~ '14.4.16
580,300
Keum-Yong Jeong
Unregistered executive
Apr 16, 2004 Treasury share Common 4,000 3,924 76 0 '06.4.17~
'14.4.16 580,300
Woo-In Jeong
Unregistered executive
Apr 16, 2004 Treasury
share Common 5,000 4,905 95 0 '06.4.17~ '14.4.16
580,300
Eun-Seung Jeong
Unregistered executive
Apr 16, 2004 Treasury share Common 5,000 4,905 95 0 '06.4.17~
'14.4.16 580,300
Seung-Hwan Cho
Unregistered executive Apr 16, 2004
Treasury share Common 3,500 3,434 66 0
'06.4.17~ '14.4.16 580,300
In-Soo Cho Unregistered executive
Apr 16, 2004 Treasury share Common 3,500 3,434 66 0 '06.4.17~
'14.4.16 580,300
Jae-Moon Cho
Unregistered executive Apr 16, 2004
Treasury share Common 3,500 3,434 66 0
'06.4.17~ '14.4.16 580,300
Seung-Cheol Choi
Unregistered executive
Apr 16, 2004 Treasury share Common 3,500 3,434 66 0 '06.4.17~
'14.4.16 580,300
Young-Jun Choi
Unregistered executive Apr 16, 2004
Treasury share Common 4,000 3,924 76 0
'06.4.17~ '14.4.16 580,300
In-Kwon Choi Unregistered executive
Apr 16, 2004 Treasury share Common 5,000 4,905 95 0 '06.4.17~
'14.4.16 580,300
Jeong-Hyuk Choi
Unregistered executive Apr 16, 2004
Treasury share Common 5,000 4,905 95 0
'06.4.17~ '14.4.16 580,300
Myung-Seob Han
Unregistered executive
Apr 16, 2004 Treasury share Common 5,000 4,905 95 0 '06.4.17~
'14.4.16 580,300
Deuk-Kyu Hwang
Unregistered executive Apr 16, 2004
Treasury share Common 3,500 3,434 66 0
'06.4.17~ '14.4.16 580,300
Kyung-Do Kim and other 83
- Apr 16, 2004 Treasury share Common 409,500 359,867 49,633 0
'06.4.17~ '14.4.16 580,300
Sub-total - - - - 590,000 536,939 53,061 0 - -
Young-Soo Kwak and
other 1
- Dec 20, 2005 Treasury
share Common 10,000 5,000 0 5,000
'07.12.21~ ’15.12.20 606,700
Total - - - - 600,000 541,939 53,061 5,000 - -
※ The change in number of shares granted reflects the cancellation of share grants according to Company’s internal revocation policy and decline of earnings in 2004.
※ As of December 31, 2014, the closing price was KRW 1,327,000. ‘Relationship’ is as of the reporting date (December 31, 2014).

Samsung Electronics 2014 Business Report 133 / 170
IX. Affiliates and Subsidiaries
1. Affiliates & Subsidiaries
A. Affiliates
- Name of affiliated group: Samsung Group (as defined under Korea’s Monopoly Regulation and Fair Trade Act) As at December 31, 2014, Samsung Group had a total of sixty-nine (69) domestic affiliates, where five (5) new affiliates (Samsung Welstory, Seoul Lakeside CC, Samsung Card Customer Service, Shilla Stay, and Samoo Architects & Engineers) were included and eleven (11) affiliates (Samsung Corning Precision Materials, Samsung SNS, Global Tech, 365Homecare, Samsung Petrochemical, Cheil Industries, World Cyber Games, SMP, SKKU dormitory, Care Camp, Gacchinet) were excluded. Among the Samsung Group’s sixty nine (69) domestic affiliates, eighteen (18) affiliates including Samsung Electronics are listed, and fifty-one (51) affiliates are unlisted.
[As of December 31, 2014]
No. of
affiliates Name of affiliates
Listed 18
Samsung C&T, Samsung Electronics, Samsung SDI, Samsung Techwin, SEMCO, Samsung Heavy Industries,
Samsung Card, Samsung Life Insurance, Hotel Shilla, Samsung Fire & Marine Insurance, Samsung
Securities, Samsung Fine Chemicals, Samsung Engineering, S1, Cheil Worldwide, Cheil Industries, Samsung
SDS, CREDU
Unlisted 51
Samsung General Chemicals, Samsung Total Petrochemicals, Samsung Lions, SERI, STECO, Samsung
Thales, SEMES, Samsung Electronics Sales, Samsung Electronics Service, Samsung Electronics Logitech,
Hantok Chemicals, CVnet Corporation, Allat., SECUI, Open Tide Korea, Samsung Futures, Samsung Venture
Investment Corporation, Samsung Asset Management, Saengbo, SD Flex, Samsung Claim Adjustment
Service, Samsung Fire & Marine Insurance Service, Suwon Samsung Bluewings FC, S-Core, Human TSS,
RAY, Songdo Land Mark City, S-1CRM, OpenHands, S-EnPol, Samsung Medison, Samsung Biologics, STM,
Nuri Solution, Colombo Korea, Samsung Life Service, Miracom, SU Materials, Natural9, Samsung Display,
Samsung Bioepis, Samsung Corning Advanced Glass , Daejung Offshore Wind Power Co., Ltd., Samsung
SRA Asset Management, Samsung Welstory, Jeongahm Wind Power, Samsung SGL Carbon Composite
Materials, Samsung Card Customer Service, Seoul Lakeside CC, Shilla Stay, Samoo Architects & Engineers
Total 69
※ The former Cheil Industries merged with Samsung SDI in July 2014, and Samsung Everland has been renamed as Cheil
Industries.

Samsung Electronics 2014 Business Report 134 / 170
B. Ownership Status of Affiliates and Subsidiaries
1) Domestic
Investee Investor
Samsung C&T Corp
Samsung Electronics
Samsung SDI
Samsung Electro-
Mechanics
Samsung Heavy
Industries
Samsung Techwin Hotel Shilla Samsung
Engineering Cheil
Worldwide
Samsung Fine
Chemicals
S1 Corpo ration
Samsung SDS
Cheil Industries
Samsung C&T Corporation 4.1 4.3 7.8 12.6 5.6 17.1 1.4
Samsung Electronics
19.6 23.7 17.6 25.5 5.1
12.6 8.4
22.6
Samsung SDI 7.4
0.4 0.1 0.1 13.1
14.7 11.0
3.7
Samsung Electro-mechanics 2.4 0.3 3.7
Cheil Industries
0.1
Samsung Heavy Industries Samsung Techwin 0.1
Cheil Worldwide
0.1
Samsung Fine Chemicals
Samsung General Chemicals
Hotel Shilla
2.2
S1 Corporation
SERI
Samsung SDS
Samsung Life Insurance 0.5 7.5 0.1 0.1 3.4 0.6 7.9 0.0 0.1 0.0 5.6
Samsung Fire & Marine Insurance 4.8 1.3
1.1 1.0
Samsung Securities. 2.0 3.1 1.3
Samsung Card
1.3
3.0
1.9
SDC
Samsung BioLogics
SVIC #6
Total 12.7 12.9 19.7 23.8 24.2 32.4 17.5 22.0 28.4 31.2 20.8 39.7 8.8
※ (% of Ownership; As of December 31, 2014; Based on Common shares)

Samsung Electronics 2014 Business Report 135 / 170
Investee Investor
Samsung General
Chemicals
Samsung Total
Petrochemicals
Hantok Chemicals
Samsung Lions SERI STECO SEMES
Samsung Electronics
Service
Samsung Electronics
Sales
Suwon Samsung Bluewings
FC
Samsung Electronics
Logitech
Samsung Display Ray
Samsung C&T Corporation 37.3 7.5 1.0 Samsung
Electronics 5.3
27.5 29.8 51.0 91.5 99.3 100.0
100.0 84.8
Samsung SDI 13.1 15.0 29.6 15.2
Samsung Electro-mechanics 9.0
12.5 23.8
Cheil
Industries 2.0 Samsung Heavy
Industries 1.0
Samsung Techwin 22.7
Cheil Worldwide
0.3
3.0
100.0
Samsung Fine Chemicals 3.1 50.0
Samsung General Chemicals 50.0
Hotel Shilla .
S1 Corporation
SERI
Samsung SDS
Samsung Life Insurance 14.8
Samsung Fire & Marine Insurance.
Samsung Securities
Samsung Card
SDC Samsung BioLogics
SVIC #6 64.6
Total 90.8 50.0 50.0 67.5 100.0 51.0 91.5 99.3 100.0 100.0 100.0 100.0 64.6
※ (% of Ownership; As of December 31, 2014; Based on Common shares)
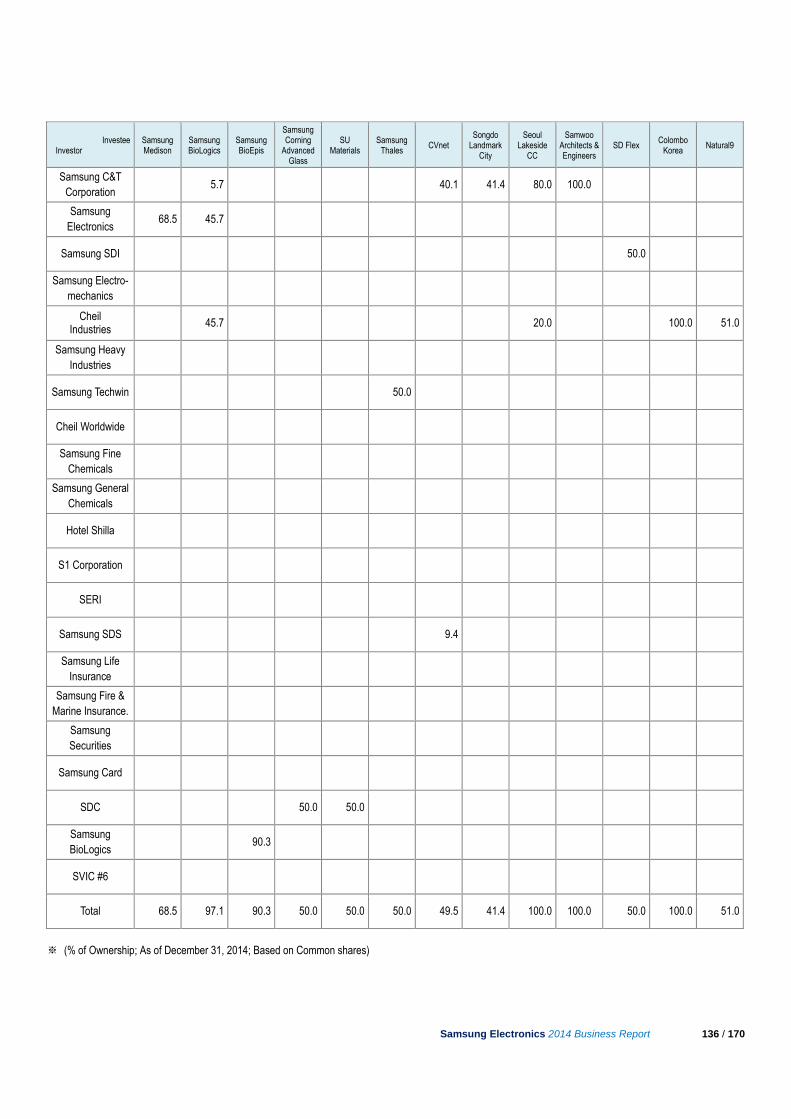
Samsung Electronics 2014 Business Report 136 / 170
Investee Investor
Samsung Medison
Samsung BioLogics
Samsung BioEpis
Samsung Corning
Advanced Glass
SU Materials
Samsung Thales CVnet
Songdo Landmark
City
Seoul Lakeside
CC
Samwoo Architects & Engineers
SD Flex Colombo Korea Natural9
Samsung C&T Corporation
5.7
40.1 41.4 80.0 100.0
Samsung Electronics
68.5 45.7
Samsung SDI
50.0
Samsung Electro-mechanics
Cheil Industries
45.7
20.0
100.0 51.0
Samsung Heavy Industries
Samsung Techwin
50.0
Cheil Worldwide
Samsung Fine Chemicals
Samsung General Chemicals
Hotel Shilla
S1 Corporation
SERI
Samsung SDS
9.4
Samsung Life Insurance
Samsung Fire & Marine Insurance.
Samsung Securities
Samsung Card
SDC
50.0 50.0
Samsung BioLogics
90.3
SVIC #6
Total 68.5 97.1 90.3 50.0 50.0 50.0 49.5 41.4 100.0 100.0 50.0 100.0 51.0
※ (% of Ownership; As of December 31, 2014; Based on Common shares)

Samsung Electronics 2014 Business Report 137 / 170
Investee Investor
Samsung Welstory
Daejung Offshore
Wind Power
Jeongahm Wind
Power SECUI Human
TSS S-1CRM S-EnPol STM CREDU Open Tide
Korea S-Core OpenHands
Samsung C&T Corporation
Samsung Electronics
Samsung SDI 13.8
Samsung Electro-mechanics
Cheil Industries
100.0
8.7
Samsung Heavy Industries
50.1 50.0
Samsung Techwin
Cheil Worldwide
9.8
Samsung Fine Chemicals
100.0 58.0
Samsung General Chemicals
Hotel Shilla
S1 Corporation
52.2 100.0 93.4
1.1
SERI
15.2
Samsung SDS
4.3
47.2 70.2 94.8 100.0
Samsung Life Insurance
0.0
Samsung Fire & Marine Insurance.
Samsung Securities
Samsung Card
SDC
Samsung BioLogics
SVIC #6
Total 100.0 50.1 50.0 65.2 100.0 93.4 100.0 71.8 62.4 81.1 94.8 100.0
※ (% of Ownership; As of December 31, 2014; Based on Common shares)

Samsung Electronics 2014 Business Report 138 / 170
Investee Investor Miracom Nuri Solution
Samsung SGL Carbon
Composite Materials
Shilla Stay
Samsung Life Insurance Saengbo Samsung Life
Service
Samsung SRA Asset
Management
Samsung Fire & Marine Insurance
Samsung Claim
Adjustment Service
Samsung Fire & Marine Insurance Service
Samsung C&T Corporation
Samsung Electronics
Samsung SDI
Samsung Electro-mechanics
Cheil Industries
19.3
Samsung Heavy Industries
Samsung Techwin
Cheil Worldwide
Samsung Fine Chemicals
Samsung General Chemicals
50.0
Hotel Shilla
100.0
S1 Corporation
SERI
Samsung SDS 100.0 100.0
Samsung Life Insurance
50.0 99.8 100.0 15.0
Samsung Fire & Marine Insurance.
99.9 100.0
Samsung Securities
Samsung Card
SDC
Samsung BioLogics
SVIC #6
Total 100.0 100.0 50.0 100.0 19.3 50.0 99.8 100.0 15.0 99.9 100.0
※ (% of Ownership; As of December 31, 2014; Based on Common shares)

Samsung Electronics 2014 Business Report 139 / 170
Investee Investor
Samsung Securities Samsung Card Allat Samsungcard Customer Service
Samsung Asset Management
Samsung Futures Samsung Venture Investment
Samsung C&T Corporation
0.3
Samsung Electronics 37.5 16.3
Samsung SDI 16.3
Samsung Electro-mechanics 17.0
Cheil Industries
30.0
Samsung Heavy Industries
17.0
Samsung Techwin 16.7
Cheil Worldwide
Samsung Fine Chemicals
Samsung General Chemicals
Hotel Shilla
S1 Corporation
SERI
Samsung SDS
Samsung Life Insurance
11.1 34.4 97.7
Samsung Fire & Marine Insurance.
8.0
Samsung Securities
99.9 16.7
Samsung Card 30.0 100.0
SDC
Samsung BioLogics
SVIC #6
Total 19.4 71.9 60.0 100.0 97.7 99.9 100.0
※ (% of Ownership; As of December 31, 2014; Based on Common shares)

Samsung Electronics 2014 Business Report 140 / 170
2) Overseas
Investor Investee Ownership Samsung C&T Corporation MYODO METAL CO., LTD. 100.0
Samsung C&T Corporation Samsung C&T Japan Corporation 100.0
Samsung C&T Corporation Samsung C&T America Inc. 100.0
Samsung C&T Corporation Samsung Finance Corporation. 80.0
Samsung C&T Corporation Samsung E&C America, INC. 100.0
Samsung C&T Corporation SAMSUNG OIL & GAS USA CORP 90.0
Samsung C&T Corporation Samsung Renewable Energy Inc. 100.0
Samsung C&T Corporation SCNT Power Norte S. De R.L. de C.V. 100.0
Samsung C&T Corporation QSSC, S.A. de C.V. 60.0
Samsung C&T Corporation Samsung C&T Oil & Gas Parallel Corp. 100.0
Samsung C&T Corporation Samsung C&T Automation Inc. 70.0
Samsung C&T Corporation Samsung C&T Canada Ltd. 100.0
Samsung C&T Corporation Samsung C&T Deutchland GmbH 100.0
Samsung C&T Corporation Samsung C&T U.K. Ltd. 100.0
Samsung C&T Corporation Xiod Distribution 25.0
Samsung C&T Corporation Samsung C&T France S.A.S 100.0
Samsung C&T Corporation Samsung C&T ECUK Limited 100.0
Samsung C&T Corporation Whessoe Project Limited 100.0
Samsung C&T Corporation SCNT Investment Atlantic SPRL 100.0
Samsung C&T Corporation POSS-SLPC, s.r.o 50.0
Samsung C&T Corporation Solluce Romania 1 B.V. 80.0
Samsung C&T Corporation SAM investment Manzanilo.B.V 53.3
Samsung C&T Corporation Solluce Slovenia 1 B.V. 80.0
Samsung C&T Corporation Ecosolar OOD 100.0
Samsung C&T Corporation Ecoenergy Solar OOD 100.0
Samsung C&T Corporation Agirlplam EOOD 100.0
Samsung C&T Corporation Fishtrade EOOD 100.0
Samsung C&T Corporation Manageprojekt EOOD 100.0
Samsung C&T Corporation Solar Park EOOD 100.0
Samsung C&T Corporation Veselinovo Energy OOD 100.0
Samsung C&T Corporation Samsung C&T Construction Hungary Kft. 100.0
Samsung C&T Corporation Samsung C&T (KL) Sdn.,Bhd. 100.0
Samsung C&T Corporation Samsung C&T Malaysia SDN. BHD 100.0
Samsung C&T Corporation Erdsam Co., Ltd. 100.0
Samsung C&T Corporation Samsung Chemtech 51.7
Samsung C&T Corporation S-print Inc 40.0
Samsung C&T Corporation Cassava Investment Korea Pte. Ltd. 29.7
Samsung C&T Corporation P.T. Samsung Development 100.0
Samsung C&T Corporation Samsung Development (Thailand) Co., Ltd. 33.0
Samsung C&T Corporation Samsung C&T Thailand Co., Ltd 44.0
Samsung C&T Corporation Cheil Holding Inc. 40.0
Samsung C&T Corporation Samsung Const. Co. Phils.,Inc. 25.0
Samsung C&T Corporation Samsung Design Philippines Inc 100.0
Samsung C&T Corporation Samsung Oil & Gas(Timor Sea 06-102) Ltd. 100.0
Samsung C&T Corporation Samsugn Oil & Gas Australia PTY. LTD 100.0
Samsung C&T Corporation PT. INSAM BATUBARA ENERGY 90.0
Samsung C&T Corporation Samsung C&T India Pte., Ltd. 100.0
Samsung C&T Corporation Samsung C&T Corporation India Private Ltd. 100.0
Samsung C&T Corporation Malaysia Samsung Steel Center Sdn.Bhd 70.0
Samsung C&T Corporation Samsung C&T Singapore Pte., Ltd. 100.0
Samsung C&T Corporation S&G Biofuel PTE.LTD 50.5
Samsung C&T Corporation SAMSUNG C&T Mongolia LLC. 70.0

Samsung Electronics 2014 Business Report 141 / 170
Investor Investee Ownership Samsung C&T Corporation Samsung C&T Eng.&Const. Mogolia LLC. 100.0
Samsung C&T Corporation Samsung C&T Hongkong Ltd. 100.0
Samsung C&T Corporation GUANGDONG XINGPU STEEL CENTER CO.,LTD 51.6
Samsung C&T Corporation Samsung C&T Taiwan Co., Ltd. 100.0
Samsung C&T Corporation Samsung Precision Stainless Steel(pinghu) Co.,Ltd. 55.0
Samsung C&T Corporation Samsung C&T (Shanghai) Co., Ltd. 100.0
Samsung C&T Corporation Samsung Nigeria Co., Ltd. 99.9
Samsung C&T Corporation LOBINAVE - Estaleiro Naval do Lobito, Limitada 40.0
Samsung C&T Corporation SAMSUNG C&T CORPORATION SAUDI ARABIA 100.0
Samsung C&T Corporation Samsung C&T Chile Copper SpA 100.0
Samsung C&T Corporation SCNT Power Kelar Inversones Limitada 99.0
Samsung C&T Corporation Samsung C&T do BRASIL CONSTRUCTORA LTDA. 100.0
Samsung C&T Corporation Samsung C&T Corporation Rus LLC 100.0
Samsung C&T Corporation KSI LLP 25.0
Samsung C&T Corporation JSC BALKHASH THERMAL POWER PLANT 57.5
Samsung C&T Corporation Samsung SDI America, Inc. 8.3
Samsung C&T Corporation Samsung SDI (Malaysia) SDN. BHD. 6.4
Samsung C&T Corporation Samsung SDI (Hong Kong) Ltd. 2.4
Samsung C&T Corporation Samsung SDI Brasil Ltda. 0.0
Samsung C&T Corporation Beijing Samsung Real Estate Co., Ltd 10.0
Samsung C&T America Inc. Meadowland Distribution 100.0
Samsung C&T America Inc. SAMSUNG OIL & GAS USA CORP 10.0
Samsung C&T America Inc. Samsung Green repower, LLC 100.0
Samsung C&T America Inc. Samsung Solar Construction Inc. 100.0
Samsung C&T America Inc. QSSC, S.A. de C.V. 20.0
Samsung C&T America Inc. Samsung C&T Automation Inc. 30.0
Samsung C&T America Inc. S-print Inc 24.0
Samsung E&C America, INC Samsung E&C RADIUS, INC. 100.0
Samsung Renewable Energy Inc. SRE GRW EPC GP Inc. 100.0
Samsung Renewable Energy Inc. SRE GRW EPC LP 100.0
Samsung Renewable Energy Inc. SRE SKW EPC GP Inc. 100.0
Samsung Renewable Energy Inc. SRE SKW EPC LP 100.0
Samsung Renewable Energy Inc. SRE GRW LP Holdings LP 100.0
Samsung Renewable Energy Inc. SRE SKW LP Holdings LP 100.0
Samsung Renewable Energy Inc. SRE WIND PA GP INC. 100.0
Samsung Renewable Energy Inc. SRE WIND PA LP 100.0
Samsung Renewable Energy Inc. SRE GRS Holdings GP Inc. 100.0
Samsung Renewable Energy Inc. SRE GRS Holdings LP 100.0
Samsung Renewable Energy Inc. SRE K2 EPC GP Inc. 100.0
Samsung Renewable Energy Inc. SRE K2 EPC LP 100.0
Samsung Renewable Energy Inc. SRE K2 LP HOLDINGS LP 100.0
Samsung Renewable Energy Inc. SRE KS HOLDINGS GP INC. 100.0
Samsung Renewable Energy Inc. SRE KS HOLDINGS LP 100.0
Samsung Renewable Energy Inc. SOUTHGATE SOLAR GP INC. 100.0
Samsung Renewable Energy Inc. SOUTHGATE SOLAR LP 100.0
Samsung Renewable Energy Inc. WINDSOR SOLAR GP INC. 100.0
Samsung Renewable Energy Inc. WINDSOR SOLAR LP 100.0
Samsung Renewable Energy Inc. SRE Belle River LP Holdings LP 100.0
Samsung Renewable Energy Inc. SRE Armow EPC GP Inc. 100.0
Samsung Renewable Energy Inc. SRE Armow EPC LP 100.0
Samsung Renewable Energy Inc. SRE Armow LP Holdings LP 100.0
Samsung Renewable Energy Inc. SRE Wind GP Holding Inc. 100.0
Samsung Renewable Energy Inc. SP Ontario Wind Development LP Inc. 50.0
Samsung Renewable Energy Inc. SP Southgate Wind LP 50.0

Samsung Electronics 2014 Business Report 142 / 170
Investor Investee Ownership Samsung Renewable Energy Inc. SRE Dover LP Holding LP 100.0
Samsung Green repower, LLC SOLAR PROJECTS SOLUTIONS,LLC 66.0
Kingston Solar GP Inc. Kingston Solar LP Inc. 0.0
K2 Wind Ontario Inc. K2 Wind Ontario LP 0.0
SP Armow Wind Ontario GP Inc SP Armow Wind Ontario LP 0.0
Samsung C&T Oil & Gas Parallel PLL Holdings LLC 83.6
Samsung C&T Oil & Gas Parallel PLL E&P LLC 90.0
SRE GRW EPC GP Inc. SRE GRW EPC LP 0.0
SRE SKW EPC GP Inc. SRE SKW EPC LP 0.0
PLL Holdings LLC Parallel Petroleum LLC 61.0
SRE GRW LP Holdings LP Grand Renewable Wind LP Inc. 44.5
SRE SKW LP Holdings LP South Kent Wind LP Inc. 50.0
SRE WIND PA GP INC. SRE WIND PA LP 0.0
SRE GRS Holdings GP Inc. Grand Renewable Solar GP Inc. 50.0
SRE GRS Holdings GP Inc. SRE GRS Holdings LP 0.0
SRE K2 EPC GP Inc. SRE K2 EPC LP 0.0
SRE K2 LP HOLDINGS LP K2 Wind Ontario LP 33.3
SRE KS HOLDINGS GP INC. Kingston Solar GP Inc. 50.0
SRE KS HOLDINGS GP INC. SRE KS HOLDINGS LP 0.0
SRE KS HOLDINGS LP Kingston Solar LP Inc. 25.0
SOUTHGATE SOLAR GP INC. SOUTHGATE SOLAR LP 0.0
WINDSOR SOLAR GP INC. WINDSOR SOLAR LP 0.0
SRE Belle River LP Holdings LP SP Belle River Wind LP 50.0
SP Belle River Wind GP Inc SP Belle River Wind LP 0.0
SRE Armow EPC GP Inc. SRE Armow EPC LP 0.0
SRE Armow LP Holdings LP SP Armow Wind Ontario LP 50.0
SRE Wind GP Holding Inc. K2 Wind Ontario Inc. 50.0
SRE Wind GP Holding Inc. SP Armow Wind Ontario GP Inc 50.0
SRE Wind GP Holding Inc. SP Southgate Wind GP 50.0
SRE Wind GP Holding Inc. SRE GRW LP Holdings LP 0.0
SRE Wind GP Holding Inc. SRE SKW LP Holdings LP 0.0
SRE Wind GP Holding Inc. SRE K2 LP HOLDINGS LP 0.0
SRE Wind GP Holding Inc. SRE Belle River LP Holdings LP 0.0
SRE Wind GP Holding Inc. SP Belle River Wind GP Inc 50.0
SRE Wind GP Holding Inc. SRE Armow LP Holdings LP 0.0
SRE Wind GP Holding Inc. SP Ontario Wind Development GP Inc. 50.0
SRE Wind GP Holding Inc. South Kent Wind GP Inc. 50.0
SRE Wind GP Holding Inc. Grand Renewable Wind GP Inc. 50.0
SRE Dover LP Holding LP SP Dover Wind LP 50.0
SP Ontario Wind Development GP SP Ontario Wind Development LP Inc. 0.0
South Kent Wind GP Inc. South Kent Wind LP Inc. 0.0
Grand Renewable Wind GP Inc. Grand Renewable Wind LP Inc. 0.0
Samsung C&T Deutchland GmbH Samsung C&T Italia S.A.R.L 100.0
Samsung C&T Deutchland GmbH SCNT Investment Atlantic SPRL 0.0
Samsung C&T Deutchland GmbH POSS-SLPC, s.r.o 20.0
Samsung C&T Deutchland GmbH Solluce Romania 1 B.V. 20.0
Samsung C&T Deutchland GmbH Solluce Slovenia 1 B.V. 20.0
Samsung C&T Deutchland GmbH S.C. Otelinox S.A 94.3
Samsung C&T Deutchland GmbH KSI LLP 25.0
Samsung C&T U.K. Ltd. Xiod Distribution 75.0
Samsung C&T U.K. Ltd. Samsung Nigeria Co., Ltd. 0.1
Samsung C&T France S.A.S Comptoir Des Produits Inoxydables S.A.S. 12.5
Solluce Romania 1 B.V. LJG GREEN SOURCE ENERGY ALPHA S.R.L. 78.0
SAM investment Manzanilo.B.V Terminal KMS de GNL S. de R.L de C.V 37.5

Samsung Electronics 2014 Business Report 143 / 170
Investor Investee Ownership Solluce Slovenia 1 B.V. ZE Solar 1 D.O.O. 70.0
Samsung C&T (KL) Sdn.,Bhd. SS KUKDONG JASATERA J/V 70.0
Cassava Investment Korea Pte. PT. Cahaya Borneo Sukses Agrosindo 49.0
Cassava Investment Korea Pte. PT. Cassava Borneo Sukses Plantation 49.0
Samsung C&T Thailand Co., Ltd Samsung Development (Thailand) Co., Ltd. 67.0
Cheil Holding Inc. Samsung Const. Co. Phils.,Inc. 75.0
Samsung C&T Singapore Pte. Ltd. Samsung Chemtech 48.3
Samsung C&T Singapore Pte. Ltd. S-print Inc 16.0
Samsung C&T Singapore Pte. Ltd. Cassava Investment Korea Pte. Ltd. 12.7
Samsung C&T Singapore Pte. Ltd. PT. INSAM BATUBARA ENERGY 10.0
Samsung C&T Singapore Pte. Ltd. Malaysia Samsung Steel Center Sdn.Bhd 30.0
Samsung C&T Singapore Pte. Ltd. S&G Biofuel PTE.LTD 12.6
S&G Biofuel PTE.LTD PT. Gandaerah Hendana 95.0
S&G Biofuel PTE.LTD PT. Inecda 95.0
SAMSUNG C&T HONGKONG Ltd. Samsung C&T Thailand Co., Ltd 13.2
SAMSUNG C&T HONGKONG Ltd. SAMSUNG (TIANJIN) INTERNATIONAL TRADING CO., LTD 100.0
SAMSUNG C&T HONGKONG Ltd. SAMSUNG TRADING (SHANGHAI) CO., LTD 100.0
SAMSUNG C&T HONGKONG Ltd. Karson Industrial Co., Ltd. 100.0
SAMSUNG C&T HONGKONG Ltd. SAMSUNG TRADING (SHENZHEN) CO., LTD 100.0
SAMSUNG C&T HONGKONG Ltd. Samsung Precision Stainless Steel(pinghu) Co.,Ltd. 45.0
SAMSUNG C&T HONGKONG Ltd. Samsung Logistics (China) Ltd. 100.0
SAMSUNG C&T HONGKONG Ltd. Samsung Corporation (Gaungzhou) Limited. 100.0
Samsung (China) Logistics Ltd. Samsung Logistics (Tianjin) Ltd 100.0
Samsung (China) Logistics Ltd. SAMSUNG TRADING (SHENZHEN) CO., LTD 100.0
Samsung C&T Chile Copper SpA Pampa Camarones S.A. 46.5
S.C. Otelinox S.A Comptoir Des Produits Inoxydables S.A.S. 87.5
Samsung Electronics Samsung Japan Corporation 100.0
Samsung Electronics Samsung R&D Institute Japan Co. Ltd 100.0
Samsung Electronics Samsung Electronics America Inc. 100.0
Samsung Electronics Samsung Electronics Canada Inc. 100.0
Samsung Electronics Samsung Electronics Mexico S.A. De C.V. 63.6
Samsung Electronics Nvelo.Inc 100.0
Samsung Electronics Samsung Electronics (UK) Ltd. 100.0
Samsung Electronics Samsung Electronics(London) Ltd. 100.0
Samsung Electronics Samsung Electronics Holding GmbH 100.0
Samsung Electronics Samsung Electronics Iberia, S.A. 100.0
Samsung Electronics Samsung Electronics France S.A.S 100.0
Samsung Electronics Samsung Electronics Hungarian RT. 100.0
Samsung Electronics Samsung Electronics Italia S.P.A. 100.0
Samsung Electronics Samsung Electronics Europe Logistics B.V. 100.0
Samsung Electronics Samsung Electronics Benelux B.V. 100.0
Samsung Electronics Samsung Electronics Overseas B.V. 100.0
Samsung Electronics Samsung Electronics Polska, SP.Zo.o 100.0
Samsung Electronics Samsung Electronics Portuguesa S.A. 100.0
Samsung Electronics Samsung Electronics Nordic Aktiebolag 100.0
Samsung Electronics Samsung Electronics Austria GmbH 100.0
Samsung Electronics Samsung Electronics Slovakia s.r.o 55.7
Samsung Electronics Samsung Electronics Europe Holding Cooperatief U.A. 100.0
Samsung Electronics Samsung Electronics Display (M) Sdn. Bhd. 75.0
Samsung Electronics Samsung Electronics (M) Sdn. Bhd. 100.0
Samsung Electronics Samsung Vina Electronics Co., Ltd. 100.0
Samsung Electronics Samsung Asia Private Ltd. 100.0
Samsung Electronics Samsung India Electronics Private Ltd. 100.0
Samsung Electronics Samsung R&D Institute India-Bangalore Private Limited 100.0

Samsung Electronics 2014 Business Report 144 / 170
Investor Investee Ownership Samsung Electronics Samsung Electronics Australia Pty. Ltd. 100.0
Samsung Electronics PT Samsung Electronics Indonesia 100.0
Samsung Electronics Thai Samsung Electronics Co., Ltd. 91.8
Samsung Electronics Samsung Malaysia Electronics(SME) Sdn.Bhd. 100.0
Samsung Electronics Samsung Electronics Hong Kong Co., Ltd. 100.0
Samsung Electronics Suzhou Samsung Electronics Co., Ltd. 69.1
Samsung Electronics Samsung (CHINA) Investment Co., Ltd. 100.0
Samsung Electronics Samsung Electronics Suzhou Semiconductor Co., Ltd. 100.0
Samsung Electronics Samsung Electronics (Shandong) Digital Printing Co., Ltd. 87.1
Samsung Electronics Samsung Electronics Huizhou Co., Ltd. 89.6
Samsung Electronics Tianjin Samsung Electronics Co., Ltd. 48.2
Samsung Electronics Samsung Electronics Taiwan Co., Ltd. 100.0
Samsung Electronics Tianjin Samsung Telecom Technology Co., Ltd. 90.0
Samsung Electronics Shanghai Samsung Semiconductor Co., Ltd. 100.0
Samsung Electronics Samsung Electronics Suzhou Computer Co., Ltd. 73.7
Samsung Electronics Shenzhen Samsung Electronics Telecommunication Co., Ltd. 95.0
Samsung Electronics Samsung Electronics Shanghai Telecommunication Co., Ltd. 100.0
Samsung Electronics Samsung Semiconductor (China) R&D Co., Ltd. 100.0
Samsung Electronics Samsung (China) Semiconductor Co., Ltd. 100.0
Samsung Electronics Samsung Electronics Hainan Fiberoptics Co., Ltd 100.0
Samsung Electronics Samsung Gulf Electronics Co., Ltd. 100.0
Samsung Electronics Samsung Electronics Egypt S.A.E 0.1
Samsung Electronics Samsung Electronics South Africa(Pty) Ltd. 100.0
Samsung Electronics Samsung Electronics Latinoamerica (Zona Libre) 100.0
Samsung Electronics Samsung Electronica da Amazonia Ltda. 87.0
Samsung Electronics Samsung Electronics Argentina S.A. 98.0
Samsung Electronics Samsung Electronics Chile Limitada 4.1
Samsung Electronics Samsung Electronics Rus Company LLC 100.0
Samsung Electronics Samsung Electronics Rus Kaluga LLC 100.0
Samsung Electronics Samsung Russia Service Centre LLC 100.0
Samsung Electronics Samsung SDI Brasil Ltda. 0.1
Samsung Electronics Tianjin Samsung LED Co., Ltd. 100.0
Samsung Electronics Tianjin Samsung Opto-Electronics Co., Ltd. 82.0
Samsung BioEpis SAMSUNG BIOEPIS UK LIMITED 100.0
Samsung Display Intellectual Keystone Technology LLC 41.9
Samsung Display Samsung Display Slovakia s.r.o. 100.0
Samsung Display Samsung Display Bac Ninh Co., Ltd. 100.0
Samsung Display Samsung Display Suzhou Co., Ltd. 100.0
Samsung Display Samsung Suzhou LCD Co., Ltd. 60.0
Samsung Display Samsung Display Dongguan Co., Ltd. 100.0
Samsung Display Samsung Display Tianjin Co., Ltd. 95.0
Samsung Display Novaled GmbH 9.9
SEMES SEMES America, Inc. 100.0
SEMES SEMES (XIAN) Co., Ltd. 100.0
Samsung Medison SonoAce Deutschland GmbH 100.0
Samsung Medison Samsung Medison India Private Ltd. 100.0
Samsung Medison Samsung Medison Shanghai Medical Instrument Co., Ltd. 100.0
Samsung Electronics America, Inc. NexusDX, Inc. 100.0
Samsung Electronics America, Inc. NeuroLogica Corp. 100.0
Samsung Electronics America, Inc. Samsung Receivables Corporation 40.1
Samsung Electronics America, Inc. Quietside 100.0
Samsung Electronics America, Inc. SmartThings 100.0
Samsung Electronics America, Inc. Samsung Semiconductor, Inc. 100.0
Samsung Electronics America, Inc. Samsung Information Systems America, Inc. 100.0

Samsung Electronics 2014 Business Report 145 / 170
Investor Investee Ownership Samsung Electronics America, Inc. Samsung International, Inc. 100.0
Samsung Electronics America, Inc. Samsung Telecommunications America LLC. 100.0
Samsung Semiconductor, Inc. Grandis, Inc. 100.0
Samsung Semiconductor, Inc. Samsung Austin Semiconductor LLC. 100.0
Samsung Electronics Canada Inc PrinterOn Corporation 100.0
PrinterOn Inc PrinterOn America Corporation 100.0
PrinterOn Inc PrinterOn Europe Limited 100.0
Samsung International, Inc. Samsung Mexicana S.A. de C.V 100.0
Samsung Telecommunications America LLC. Samsung Receivables Corporation 59.9
Samsung Electronics Mexico S.A Samsung Electronics Digital Appliance Mexico, SA de CV 100.0
Samsung Electronics (UK) Ltd. Samsung Semiconductor Europe Limited 100.0
Samsung Electronics Holding GmbH Samsung Semiconductor Europe GmbH 100.0
Samsung Electronics Holding GmbH Samsung Electronics GmbH 100.0
Samsung Electronics Hungarian RT. Samsung Electronics Czech and Slovak s.r.o. 30.0
Samsung Electronics Hungarian RT. Samsung Electronics Slovakia s.r.o 44.3
Samsung Electronics Benelux B.V. Samsung Electronics Mexico S.A. De C.V. 36.4
Samsung Electronics Benelux B.V. SAMSUNG ELECTRONICS BALTICS SIA 100.0
Samsung Electronics Benelux B.V. Samsung Electronics West Africa 100.0
Samsung Electronics Benelux B.V. Samsung Electronics East Africa 100.0
Samsung Electronics Benelux B.V. Samsung Electronics Egypt S.A.E 99.9
Samsung Electronics Benelux B.V. Samsung Electronics Israel Ltd. 100.0
Samsung Electronics Benelux B.V. Samsung Electronics Tunisia S.A.R.L 99.0
Samsung Electronics Benelux B.V. Samsung Electronics Pakistan(Private) Ltd. 100.0
Samsung Electronics Benelux B.V. Samsung Electronics South Africa Production 100.0
Samsung Electronics Benelux B.V. Samsung Electronics Turkey 100.0
Samsung Electronics Benelux B.V. Samsung Semiconductor Israel R&D Center,Ltd. 100.0
Samsung Electronics Benelux B.V. Samsung Electronics Levant Co.,Ltd. 100.0
Samsung Electronics Benelux B.V. Samsung Electronics Morocco SARLAU 100.0
Samsung Electronics Benelux B.V. Samsung Electronics Venezuela, C.A. 100.0
Samsung Electronics Benelux B.V. Samsung Electronica da Amazonia Ltda. 13.0
Samsung Electronics Benelux B.V. Samsung Electronics Chile Limitada 95.9
Samsung Electronics Benelux B.V. Samsung Electronics Peru S.A.C. 100.0
Samsung Electronics Benelux B.V. Samsung Electronics Rus LLC 100.0
Samsung Electronics Benelux B.V. Samsung Electronics Ukraine LLC 100.0
Samsung Electronics Benelux B.V. Samsung Electronics Ukraine Company LLC 100.0
Samsung Electronics Benelux B.V. Samsung R&D Institute Rus LLC 100.0
Samsung Electronics Benelux B.V. Samsung Electronics Kazakhstan LLP 100.0
Samsung Electronics Benelux B.V. Samsung Electronics KZ and Central Asia LLP 100.0
Samsung Electronics Benelux B.V. Samsung Electronics Caucasus Co., Ltd 100.0
Samsung Electronics Austria GmbH Samsung Electronics Switzerland GmbH 100.0
Samsung Electronics Europe Holding Cooperatief U.A. Samsung Electronics Czech and Slovak s.r.o. 70.0
Samsung Electronics Europe Holding Cooperatief U.A. Samsung Electronics Romania LLC 100.0
Samsung Electronics Europe Holding Cooperatief U.A. Porta Nuova Varesine Building 2 S.r.l. 49.0
Samsung Electronics Europe Holding Cooperatief U.A. Samsung Electronics Poland Manufacturing SP.Zo.o 100.0
Samsung Electronics Europe Holding Cooperatief U.A. Samsung Electronics Greece S.A. 100.0
Samsung Electronics Europe Holding Cooperatief U.A. Samsung Nanoradio Design Center 100.0
Samsung Electronics Europe Holding Cooperatief U.A. Samsung Denmark Research Center ApS 100.0
Samsung Electronics Europe Holding Cooperatief U.A. Samsung France Research Center SARL 100.0
Samsung Electronics Europe Holding Cooperatief U.A. Samsung Cambridge Solution Centre Limited 100.0
Samsung Electronics Europe Holding Cooperatief U.A. Novaled GmbH 40.0
Samsung Nanoradio Design Center Nanoradio Hellas AE 100.0
Samsung Electronics Display (M) Sdn. Bhd. Tianjin Samsung Electronics Co., Ltd. 2.2
Samsung Asia Private Ltd. Samsung Electronics Japan Co., Ltd. 100.0
Samsung Asia Private Ltd. Samsung Electronics Display (M) Sdn. Bhd. 25.0

Samsung Electronics 2014 Business Report 146 / 170
Investor Investee Ownership Samsung Asia Private Ltd. Samsung Electronics New Zealand Limited 100.0
Samsung Asia Private Ltd. Samsung Electronics Philippines Corporation 100.0
Samsung Asia Private Ltd. Samsung R&D Institute BanglaDesh 100.0
Samsung Asia Private Ltd. Samsung Electronics Vietnam Co., Ltd. 100.0
Samsung Asia Private Ltd. Samsung Telecommunications Malaysia Sbn. Bhd. 100.0
Samsung Asia Private Ltd. Samsung Electronics Vietnam THAINGUYEN Co., Ltd. 100.0
Samsung Asia Private Ltd. Samsung SDI (Malaysia) SDN. BHD. 25.0
Samsung Asia Private Ltd. Samsung Electro-Mechanics(Thailand) Co., Ltd. 25.0
Samsung Asia Private Ltd. iMarket Asia Co., Ltd. 11.4
PT Samsung Electronics Indonesia PT Samsung Telecommunications Indonesia 99.0
Samsung Electronics Hong Kong Co., Ltd. iMarket Asia Co., Ltd. 11.3
Suzhou Samsung Electronics Co., Ltd. Samsung Suzhou Electronics Export Co., Ltd. 100.0
Samsung (CHINA) Investment Co., Ltd. Suzhou Samsung Electronics Co., Ltd. 19.2
Samsung (CHINA) Investment Co., Ltd. Samsung Mobile R&D Center China-Guangzhou 100.0
Samsung (CHINA) Investment Co., Ltd. Samsung Mobile R&D Center China - Tianjin 100.0
Samsung (CHINA) Investment Co., Ltd. Samsung Network R&D Center China-Shenzhen 100.0
Samsung (CHINA) Investment Co., Ltd. Samsung R&D Institute China-Xian 100.0
Samsung (CHINA) Investment Co., Ltd. Samsung Electronics (Shandong) Digital Printing Co., Ltd. 12.9
Samsung (CHINA) Investment Co., Ltd. Samsung Electronics Huizhou Co., Ltd. 10.3
Samsung (CHINA) Investment Co., Ltd. Tianjin Samsung Electronics Co., Ltd. 40.8
Samsung (CHINA) Investment Co., Ltd. Beijing Samsung Telecom R&D Center 100.0
Samsung (CHINA) Investment Co., Ltd. Samsung Electronics Suzhou Computer Co., Ltd. 26.3
Samsung (CHINA) Investment Co., Ltd. Samsung R&D Institute China - Nanjing 100.0
Samsung (CHINA) Investment Co., Ltd. Samsung Electronics (Beijing) Service Company Limited 100.0
Samsung (CHINA) Investment Co., Ltd. Tianjin Samsung Opto-Electronics Co., Ltd. 8.0
Samsung Gulf Electronics Co., Ltd. Samsung Electronics Egypt S.A.E 0.1
Samsung Electronics Morocco SARLAU Samsung Electronics Tunisia S.A.R.L 1.0
Samsung Electronics Latinoamerica (Zona Libre) Samsung Electronics Latinoamerica Miami, Inc. 100.0
Samsung Electronics Latinoamerica (Zona Libre) Samsung Electronica Colombia S.A. 100.0
Samsung Electronics Latinoamerica (Zona Libre) Samsung Electronics Panama. S.A 100.0
Samsung Electronica da Amazonia Ltda. Samsung Electronics Argentina S.A. 2.0
Samsung Electronics KZ and Cen Samsung Electronics Caucasus Co., Ltd 0.0
Samsung SDI Intellectual Keystone Technology LLC 41.0
Samsung SDI Samsung SDI Japan co.Ltd 100.0
Samsung SDI Samsung SDI America, Inc. 91.7
Samsung SDI Samsung SDI Hungary Rt. 100.0
Samsung SDI Samsung SDI Europe GmbH. 100.0
Samsung SDI Samsung SDI Battery Systems GmbH 100.0
Samsung SDI Samsung SDI (Malaysia) SDN. BHD. 68.6
Samsung SDI Samsung SDI Vietnam Co., LTD. 100.0
Samsung SDI Samsung SDI Energy Malaysia Sdn. Bhd. 100.0
Samsung SDI Samsung SDI (Hong Kong) Ltd. 97.6
Samsung SDI Samsung SDI China Co,.Ltd 100.0
Samsung SDI Samsung SDI-ARN(Xian) Power Battery Co., Ltd 50.0
Samsung SDI Samsung SDI Brasil Ltda. 45.0
Samsung SDI SAMSUNG CHEIL INDUSTRIES JAPAN CO., LTD 100.0
Samsung SDI Samsung Chemical U.S.A Inc. 100.0
Samsung SDI Starex Compounding America Inc. 100.0
Samsung SDI Samsung Chemical Europe Gmbh 100.0
Samsung SDI Samsung Chemical Hungary LLC 100.0
Samsung SDI Novaled GmbH 50.1
Samsung SDI Samsung Chemical (Thailand) CO., Ltd 59.4
Samsung SDI Samsung Chemical Material Trading(Shanghai)Co.Ltd. 100.0
Samsung SDI TIANJIN SAMSUNG ENGINEERING PLASTICS CO.,LTD 100.0

Samsung Electronics 2014 Business Report 147 / 170
Investor Investee Ownership Samsung SDI DONGGUAN SAMSUNG ENGINEERING PLASTICS CO., Ltd. 100.0
Samsung SDI SAMSUNG CHEMICAL ELECTRONIC MATERIALS(SUZHOU)CO.,Ltd 100.0
Samsung SDI iMarket Asia Co., Ltd. 8.7
Samsung SDI America, Inc. Samsung SDI Mexico S.A. de C.V. 100.0
Samsung SDI America, Inc. Samsung SDI Brasil Ltda. 40.4
Samsung SDI (Hong Kong) Ltd. Shenzhen Samsung SDI Co., Ltd. 80.0
Samsung SDI (Hong Kong) Ltd. Tianjin Samsung SDI Co., Ltd. 80.0
Samsung SDI (Hong Kong) Ltd. Shanghai Samsung Electronic Devices Co., Ltd 60.3
Samsung SDI (Hong Kong) Ltd. Samsung SDI Brasil Ltda. 14.5
Samsung Electro-Mechanics Samsung Electro-Machanics Japan Co., Ltd. 100.0
Samsung Electro-Mechanics Samsung Electro-Mechanics Japan Advanced Technology Co.,Ltd 100.0
Samsung Electro-Mechanics Samsung Electro-Mechanics America, Inc. 100.0
Samsung Electro-Mechanics Samsung Electro-Mechanics Gmbh 100.0
Samsung Electro-Mechanics Samsung Hungary Electro-Mechanics Private LLC 100.0
Samsung Electro-Mechanics Samsung Electro-Mechanics(Thailand) Co., Ltd. 75.0
Samsung Electro-Mechanics Samsung Electro-Mechanics Phils., Corp. 100.0
Samsung Electro-Mechanics Calamba Premier Realty Corporation. 39.8
Samsung Electro-Mechanics Samsung Electro-Mechanics Pte., Ltd 100.0
Samsung Electro-Mechanics Samsung Electro Mechanics Vietnam Co., Ltd 100.0
Samsung Electro-Mechanics Dongguan Samsung Electro-Mechanics Co., Ltd 100.0
Samsung Electro-Mechanics Tianjin Samsung Electro-Mechanics Co., Ltd 81.8
Samsung Electro-Mechanics Samsung Electro-Mechanics(HK) Co., Ltd. 100.0
Samsung Electro-Mechanics SAMSUNG HIGH-TECH ELECTRO-MECHANICS(TIANJIN) CO., 95.0
Samsung Electro-Mechanics Samsung Electro-Mechanics(Shenzhen) Co., LTd 100.0
Samsung Electro-Mechanics Kunshan Samsung Electro-Mechanics Co., Ltd 100.0
Samsung Electro-Mechanics iMarket Asia Co., Ltd. 8.7
Samsung Electro-Mechanics Japan Advanced Technology Co.,Ltd Samsung Electro-Mechanics Nakhonratchasima Co.,Ltd 100.0
Samsung Electro-Mechanics America, Inc. Samsung Electro-Mechanics do Brasil Intermediacoes de Negocios Ltda 100.0
Calamba Premier Realty Corpora BATINO REALTY CORPORATION 100.0
Samsung Fire & Marine Insurance Samsung Fire & Marine Management Corporation 100.0
Samsung Fire & Marine Insurance Samsung Fire & Marine Insurance Company of Europe 100.0
Samsung Fire & Marine Insurance P.T. Asuransi Samsung Tugu 70.0
Samsung Fire & Marine Insurance Samsung Vina Insurance Co., Ltd. 75.0
Samsung Fire & Marine Insurance Samsung Reinsurance Pte., Ltd. 100.0
Samsung Fire & Marine Insurance Samsung Property and Casualty Insurance Co(China) Ltd. 100.0
Samsung Fire & Marine Insurance SAMSUNG FIRE & MARINE CONSULTORIA EM SEGUROS LTDA. 100.0
Samsung General Chemicals Samsung General Chemicals (Shanghai) Co., Ltd. 100.0
Samsung Total Petrochemicals Dongguan Samsung Total Engineering Plastic co.,ltd. 100.0
Samsung Total Petrochemicals Samsung Total Petrochemicals Trading (Shanghai) Co., Ltd. 100.0
Samsung Heavy Industries Co.,Ltd. Camellia Consulting Corporation 100.0
Samsung Heavy Industries Co.,Ltd. Samsung Wind Energy,Inc 100.0
Samsung Heavy Industries Co.,Ltd. Offshore 1 consulting Corporation 51.0
Samsung Heavy Industries Co.,Ltd. Samsung heavy Industries Hamburg GmbH 100.0
Samsung Heavy Industries Co.,Ltd. Samsung Heavy Industries India Pvt.Ltd. 100.0
Samsung Heavy Industries Co.,Ltd. SAMSUNG HEAVY INDUSTRIES (M) SDN.BHD 100.0
Samsung Heavy Industries Co.,Ltd. Samsung Heavy Industries(Ningbo) Co., Ltd 100.0
Samsung Heavy Industries Co.,Ltd. Samsung Heavy Industries(Rongcheng) Co., Ltd 100.0
Samsung Heavy Industries Co.,Ltd. Rongcheng Gaya Heavy Industries Co., Ltd 100.0
Samsung Heavy Industries Co.,Ltd. Samsung Heavy Industries Trade(Shanghai) Co., Ltd 100.0
Samsung Heavy Industries Co.,Ltd. SAMSUNG HEAVY INDUSTRIES NIGERIA LIMITED 100.0
Samsung Heavy Industries Co.,Ltd. SANGSUNG HEAVY INDUSTRIES BRAZIL ASSESSORIA EM PRO 100.0
Samsung Heavy Industries Co.,Ltd. SHI BRAZIL CONSTRUCTION 100.0
Offshore 1 consulting Corporat AMEC Samsung Oil&Gas, LLC 51.0
SAMSUNG HEAVY INDUSTRIES NIGERIA Co., Ltd SHI - MCI FZE 70.0
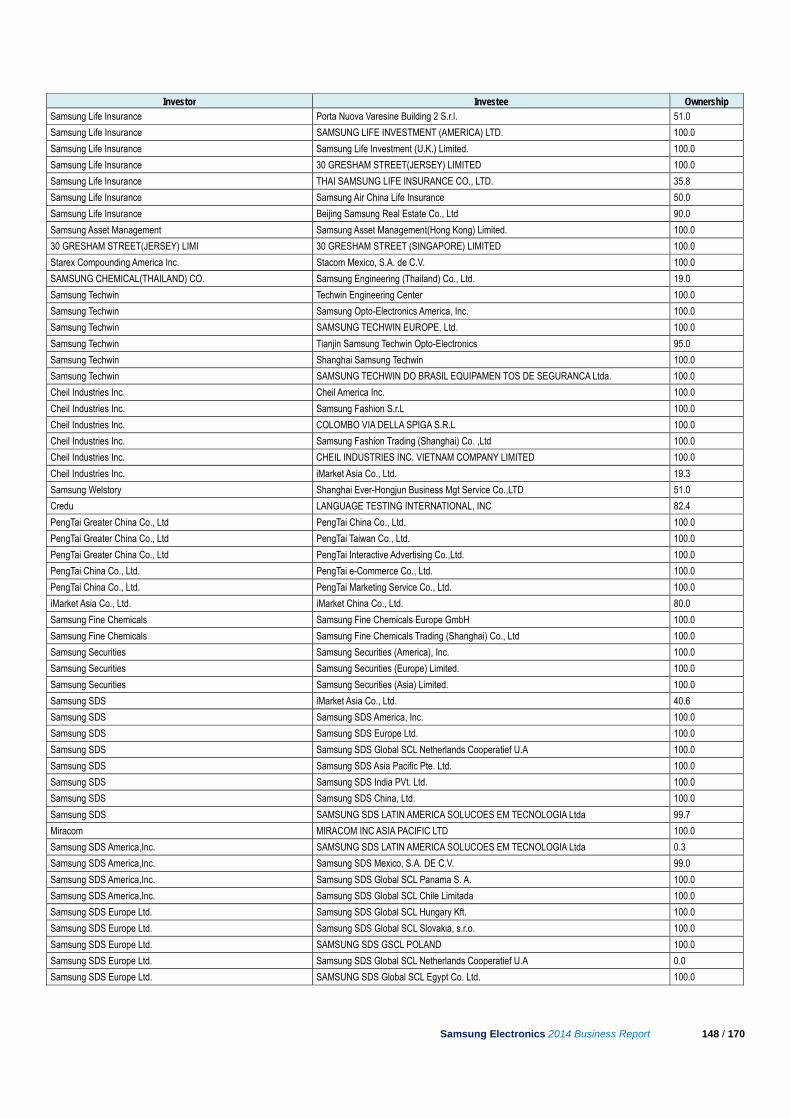
Samsung Electronics 2014 Business Report 148 / 170
Investor Investee Ownership Samsung Life Insurance Porta Nuova Varesine Building 2 S.r.l. 51.0
Samsung Life Insurance SAMSUNG LIFE INVESTMENT (AMERICA) LTD. 100.0
Samsung Life Insurance Samsung Life Investment (U.K.) Limited. 100.0
Samsung Life Insurance 30 GRESHAM STREET(JERSEY) LIMITED 100.0
Samsung Life Insurance THAI SAMSUNG LIFE INSURANCE CO., LTD. 35.8
Samsung Life Insurance Samsung Air China Life Insurance 50.0
Samsung Life Insurance Beijing Samsung Real Estate Co., Ltd 90.0
Samsung Asset Management Samsung Asset Management(Hong Kong) Limited. 100.0
30 GRESHAM STREET(JERSEY) LIMI 30 GRESHAM STREET (SINGAPORE) LIMITED 100.0
Starex Compounding America Inc. Stacom Mexico, S.A. de C.V. 100.0
SAMSUNG CHEMICAL(THAILAND) CO. Samsung Engineering (Thailand) Co., Ltd. 19.0
Samsung Techwin Techwin Engineering Center 100.0
Samsung Techwin Samsung Opto-Electronics America, Inc. 100.0
Samsung Techwin SAMSUNG TECHWIN EUROPE, Ltd. 100.0
Samsung Techwin Tianjin Samsung Techwin Opto-Electronics 95.0
Samsung Techwin Shanghai Samsung Techwin 100.0
Samsung Techwin SAMSUNG TECHWIN DO BRASIL EQUIPAMEN TOS DE SEGURANCA Ltda. 100.0
Cheil Industries Inc. Cheil America Inc. 100.0
Cheil Industries Inc. Samsung Fashion S.r.L 100.0
Cheil Industries Inc. COLOMBO VIA DELLA SPIGA S.R.L 100.0
Cheil Industries Inc. Samsung Fashion Trading (Shanghai) Co. ,Ltd 100.0
Cheil Industries Inc. CHEIL INDUSTRIES INC. VIETNAM COMPANY LIMITED 100.0
Cheil Industries Inc. iMarket Asia Co., Ltd. 19.3
Samsung Welstory Shanghai Ever-Hongjun Business Mgt Service Co.,LTD 51.0
Credu LANGUAGE TESTING INTERNATIONAL, INC 82.4
PengTai Greater China Co., Ltd PengTai China Co., Ltd. 100.0
PengTai Greater China Co., Ltd PengTai Taiwan Co., Ltd. 100.0
PengTai Greater China Co., Ltd PengTai Interactive Advertising Co.,Ltd. 100.0
PengTai China Co., Ltd. PengTai e-Commerce Co., Ltd. 100.0
PengTai China Co., Ltd. PengTai Marketing Service Co., Ltd. 100.0
iMarket Asia Co., Ltd. iMarket China Co., Ltd. 80.0
Samsung Fine Chemicals Samsung Fine Chemicals Europe GmbH 100.0
Samsung Fine Chemicals Samsung Fine Chemicals Trading (Shanghai) Co., Ltd 100.0
Samsung Securities Samsung Securities (America), Inc. 100.0
Samsung Securities Samsung Securities (Europe) Limited. 100.0
Samsung Securities Samsung Securities (Asia) Limited. 100.0
Samsung SDS iMarket Asia Co., Ltd. 40.6
Samsung SDS Samsung SDS America, Inc. 100.0
Samsung SDS Samsung SDS Europe Ltd. 100.0
Samsung SDS Samsung SDS Global SCL Netherlands Cooperatief U.A 100.0
Samsung SDS Samsung SDS Asia Pacific Pte. Ltd. 100.0
Samsung SDS Samsung SDS India PVt. Ltd. 100.0
Samsung SDS Samsung SDS China, Ltd. 100.0
Samsung SDS SAMSUNG SDS LATIN AMERICA SOLUCOES EM TECNOLOGIA Ltda 99.7
Miracom MIRACOM INC ASIA PACIFIC LTD 100.0
Samsung SDS America,Inc. SAMSUNG SDS LATIN AMERICA SOLUCOES EM TECNOLOGIA Ltda 0.3
Samsung SDS America,Inc. Samsung SDS Mexico, S.A. DE C.V. 99.0
Samsung SDS America,Inc. Samsung SDS Global SCL Panama S. A. 100.0
Samsung SDS America,Inc. Samsung SDS Global SCL Chile Limitada 100.0
Samsung SDS Europe Ltd. Samsung SDS Global SCL Hungary Kft. 100.0
Samsung SDS Europe Ltd. Samsung SDS Global SCL Slovakia, s.r.o. 100.0
Samsung SDS Europe Ltd. SAMSUNG SDS GSCL POLAND 100.0
Samsung SDS Europe Ltd. Samsung SDS Global SCL Netherlands Cooperatief U.A 0.0
Samsung SDS Europe Ltd. SAMSUNG SDS Global SCL Egypt Co. Ltd. 100.0

Samsung Electronics 2014 Business Report 149 / 170
Investor Investee Ownership Samsung SDS Europe Ltd. Samsung SDS global SCL South Africa 100.0
Samsung SDS Europe Ltd. Samsung SDS Global SCL Transport and Logistics Joint Stock Company 100.0
Samsung SDS Europe Ltd. Samsung SDS Global SCL Rus Limited liability company 100.0
Samsung SDS Global SCL Netherland Cooperatief U.A SAMSUNG SDS GSCL POLAND 0.0
Samsung SDS Global SCL Netherland Cooperatief U.A Samsung SDS Global SCL Rus LLC 0.0
Samsung SDS Asia Pacific Pte. Samsung SDS GSCL Vietnam Co Ltd 51.0
Samsung SDS Asia Pacific Pte. PT. Samsung SDS Global SCL Indonesia 100.0
Samsung SDS Asia Pacific Pte. Samsung SDS Global SCL Philippines Co., Ltd. 100.0
Samsung SDS Asia Pacific Pte. Samsung SDS Global SCL Thailand Co.,Ltd 100.0
Samsung SDS Asia Pacific Pte. Samsung SDS Global SCL Malaysia SDN.BHD. 100.0
Samsung SDS Asia Pacific Pte. SAMSUNG SDS GLOBAL SCL AUSTRALIA PTY., LTD. 100.0
Samsung SDS Asia Pacific Pte. Samsung SDS Global SCL Hong Kong Ltd 100.0
Samsung SDS China, Ltd. Samsung SDS Global Development Center Xi'an 100.0
Samsung SDS China, Ltd. Samsung SDS Global SCL Beijing Co., Ltd 100.0
MIRACOM INC ASIA PACIFIC LTD MIRACOM INC CHINA LTD 100.0
Samsung Engineering Offshore 1 consulting Corporation 49.0
Samsung Engineering Samsung Engineering America Inc. 100.0
Samsung Engineering Samsung Engineering Magyarorszag Epitoipari K. F. 100.0
Samsung Engineering Samsung Engineering (Malaysia) SDN. BHD. 100.0
Samsung Engineering PT Samsung Engineering Indonesia Co., Ltd. 100.0
Samsung Engineering Samsung Engineering (Thailand) Co., Ltd. 81.0
Samsung Engineering Samsung Engineering India Private Ltd. 100.0
Samsung Engineering Samsung Engineering Vietnam Co 100.0
Samsung Engineering Samsung Engineering Construction(Shanghai) Co., Ltd 100.0
Samsung Engineering Samsung Saudi Arabia Company Limited. 95.0
Samsung Engineering Muharraq Wastewater Services Company W.L.L. 64.8
Samsung Engineering Muharraq STP Company B.S.C. 4.6
Samsung Engineering Muharraq Holding Company 1 Ltd. 45.0
Samsung Engineering Samsung Ingenieria Minatitlan, S.A. De C.V. 99.9
Samsung Engineering Samsung Engineering Trinidad Co., Ltd. 100.0
Samsung Engineering Samsung Ingenieria Manzanillo, S.A. De C.V. 99.9
Samsung Engineering Grupo Samsung Ingenieria Mexico, S.A. De C.V. 100.0
Samsung Engineering Samsung Ingenieria Energia S.A. De C.V. 100.0
Samsung Engineering Samsung Engineering America Do Sul Projecto E Consultoria Ltda. 100.0
Samsung Engineering Samsung Engineering Bolivia S.A 99.9
Samsung Engineering Samsung Ingenieria DUBA S.A. de C.V. 100.0
Samsung Engineering Samsung Engineering Kazakhstan LLP 100.0
Samsung Engineering America Inc SEA Construction, LLC 100.0
Samsung Engineering (Malaysia) Muharraq Wastewater Services Company W.L.L. 0.3
Samsung Engineering (Thailand) Samsung Chemical (Thailand) CO., Ltd 40.6
Samsung Engineering India Private Ltd. Samsung Saudi Arabia Company Limited. 5.0
Samsung Saudi Arabia Company Samsung EPC Company Ltd. 75.0
Muharraq Holding Company 1 Ltd Muharraq Holding Company 2 Ltd. 100.0
Muharraq Holding Company 2 Ltd Muharraq STP Company B.S.C. 79.7
S1 Corporation SOCM LLC 100.0
S1 Corporation Samsung Beijing Security Systems 100.0
Cheil Worldwide Cheil USA Inc. 100.0
Cheil Worldwide Cheil Central America Inc. 100.0
Cheil Worldwide Cheil Europe Ltd. 100.0
Cheil Worldwide Cheil Germany GmbH 100.0
Cheil Worldwide Cheil France SAS 100.0
Cheil Worldwide Cheil Nordic AB 100.0
Cheil Worldwide Cheil India Pvt. Ltd. 100.0
Cheil Worldwide Cheil (Thailand) Ltd. 100.0
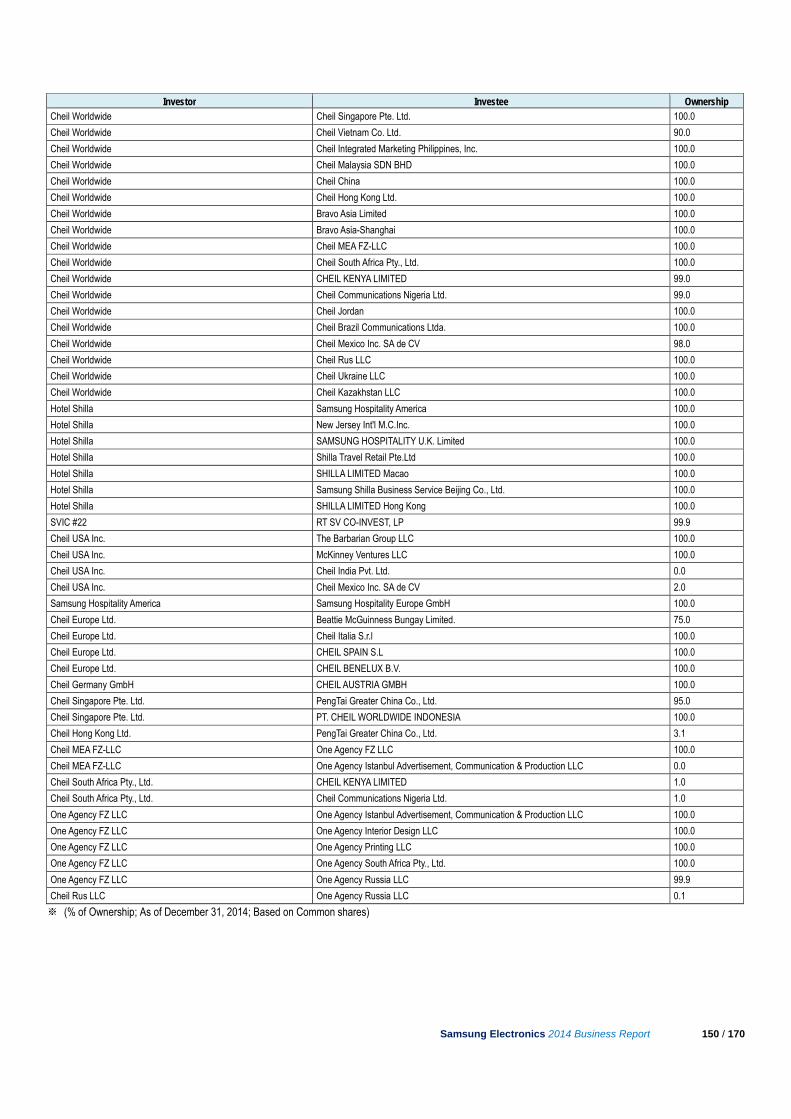
Samsung Electronics 2014 Business Report 150 / 170
Investor Investee Ownership Cheil Worldwide Cheil Singapore Pte. Ltd. 100.0
Cheil Worldwide Cheil Vietnam Co. Ltd. 90.0
Cheil Worldwide Cheil Integrated Marketing Philippines, Inc. 100.0
Cheil Worldwide Cheil Malaysia SDN BHD 100.0
Cheil Worldwide Cheil China 100.0
Cheil Worldwide Cheil Hong Kong Ltd. 100.0
Cheil Worldwide Bravo Asia Limited 100.0
Cheil Worldwide Bravo Asia-Shanghai 100.0
Cheil Worldwide Cheil MEA FZ-LLC 100.0
Cheil Worldwide Cheil South Africa Pty., Ltd. 100.0
Cheil Worldwide CHEIL KENYA LIMITED 99.0
Cheil Worldwide Cheil Communications Nigeria Ltd. 99.0
Cheil Worldwide Cheil Jordan 100.0
Cheil Worldwide Cheil Brazil Communications Ltda. 100.0
Cheil Worldwide Cheil Mexico Inc. SA de CV 98.0
Cheil Worldwide Cheil Rus LLC 100.0
Cheil Worldwide Cheil Ukraine LLC 100.0
Cheil Worldwide Cheil Kazakhstan LLC 100.0
Hotel Shilla Samsung Hospitality America 100.0
Hotel Shilla New Jersey Int'l M.C.Inc. 100.0
Hotel Shilla SAMSUNG HOSPITALITY U.K. Limited 100.0
Hotel Shilla Shilla Travel Retail Pte.Ltd 100.0
Hotel Shilla SHILLA LIMITED Macao 100.0
Hotel Shilla Samsung Shilla Business Service Beijing Co., Ltd. 100.0
Hotel Shilla SHILLA LIMITED Hong Kong 100.0
SVIC #22 RT SV CO-INVEST, LP 99.9
Cheil USA Inc. The Barbarian Group LLC 100.0
Cheil USA Inc. McKinney Ventures LLC 100.0
Cheil USA Inc. Cheil India Pvt. Ltd. 0.0
Cheil USA Inc. Cheil Mexico Inc. SA de CV 2.0
Samsung Hospitality America Samsung Hospitality Europe GmbH 100.0
Cheil Europe Ltd. Beattie McGuinness Bungay Limited. 75.0
Cheil Europe Ltd. Cheil Italia S.r.l 100.0
Cheil Europe Ltd. CHEIL SPAIN S.L 100.0
Cheil Europe Ltd. CHEIL BENELUX B.V. 100.0
Cheil Germany GmbH CHEIL AUSTRIA GMBH 100.0
Cheil Singapore Pte. Ltd. PengTai Greater China Co., Ltd. 95.0
Cheil Singapore Pte. Ltd. PT. CHEIL WORLDWIDE INDONESIA 100.0
Cheil Hong Kong Ltd. PengTai Greater China Co., Ltd. 3.1
Cheil MEA FZ-LLC One Agency FZ LLC 100.0
Cheil MEA FZ-LLC One Agency Istanbul Advertisement, Communication & Production LLC 0.0
Cheil South Africa Pty., Ltd. CHEIL KENYA LIMITED 1.0
Cheil South Africa Pty., Ltd. Cheil Communications Nigeria Ltd. 1.0
One Agency FZ LLC One Agency Istanbul Advertisement, Communication & Production LLC 100.0
One Agency FZ LLC One Agency Interior Design LLC 100.0
One Agency FZ LLC One Agency Printing LLC 100.0
One Agency FZ LLC One Agency South Africa Pty., Ltd. 100.0
One Agency FZ LLC One Agency Russia LLC 99.9
Cheil Rus LLC One Agency Russia LLC 0.1
※ (% of Ownership; As of December 31, 2014; Based on Common shares)

Samsung Electronics 2014 Business Report 151 / 170
C. Related Statute & Regulation
Regulatory restrictions including the restriction on cross-holdings in accordance with the Monopoly Regulation and Fair Trade Act (1) Date of announcement by the authorities related to companies deemed as a part of Samsung Group for the current year:
April 1, 2014
(2) Summary of Restrictions
- Restriction of cross-holdings
- Restriction of debt guarantee between affiliates
- Restriction of voting rights for affiliates, including financial and insurance companies
- Decision by board committee and public disclosure of large-scale related party transactions
- Public disclosure of important matters of unlisted companies
- Other public disclosures related to Company status

Samsung Electronics 2014 Business Report 152 / 170
D. Equity Investments in other corporations (1) The total book value of equity investments in other corporations as of December 31, 2014 is KRW 46,311 billion [As of December 31, 2014] (Unit: 1,000 shares, KRW million, %)
※ Domestic account noted here reflects approved for sales securities
Account Name of Company
Acquisition Date Objective
Acquisition Cost
Beginning Balance Increase/Decrease Ending Balance Current Financial Stats
Qty Ownership (%) Book Value
Acquisition/Disposal Valuation Qty
Ownership (%)
Book Value Total Asset
Net Income (Loss) Qty Amount
Domestic*
Listed Samsung Electro-
Mechanics 1977.01 Management 250 17,693 23.69 445,244 0 0 0 17,693 23.69 445,244 7,185,343 345,692
Listed Samsung Card 1988.12 Management 10,000 43,393 37.45 1,455,485 0 0 0 43,393 37.45 1,455,485 16,560,926 273,232
Listed Samsung Techwin 1977.12 Management 336 13,527 25.46 235,638 0 0 0 13,527 25.46 235,638 3,434,224 133,039
Unlisted STECO 1995.06 Business 24,000 2,448 51.00 32,724 0 0 0 2,448 51.00 32,724 91,556 3,188
Unlisted SEMES 1992.12 Business 1,000 2,167 91.30 70,817 6 1,089 0 2,173 91.54 71,906 669,232 38,062
Unlisted SERI 1991.05 Management 320 3,576 29.80 24,942 0 0 0 3,576 29.80 24,942 123,875 5,014
Unlisted Samsung SDS 1992.07 Management 6,160 17,472 22.58 560,827 0 0 0 17,472 22.58 560,827 5,300,100 325,983
Unlisted Samsung Lions 1986.08 Management 240 55 27.50 -102 0 0 0 55 27.50 -102 65,889 -12,166
Unlisted Samsung
Electronics Service
1998.01 Business 30,000 6,000 99.33 48,121 0 0 0 6,000 99.33 48,121 335,588 4,363
Unlisted MEMC Korea 1991.12 Management 36,000 3,440 20.00 35,286 -3,440 -35,286 0 0 0.00 0 266,963 5,418
Unlisted Samsung
Electronics Sales 2000.12 Business 3,100 1,767 100.00 247,523 0 0 0 1,767 100.00 247,523 564,361 4,425
Unlisted Samsung
Electronics Logitech
1999.04 Business 76 1,011 100.00 46,669 0 0 0 1,011 100.00 46,669 140,733 3,185
Unlisted SSLM 2012.04 Management 52,296 4,378 19.99 0 0 0 0 4,378 19.99 0 191,164 -64,194

Samsung Electronics 2014 Business Report 153 / 170
※ Domestic account noted here reflects approved for sales securities
Account Name of Company
Acquisition Date Objective
Acquisition Cost
Beginning Balance Increase/Decrease Ending Balance Current Financial Stats
Qty Ownership
(%) Book Value
Acquisition/Disposal Valuation Qty
Ownership (%)
Book Value Total Asset
Net Income (Loss) Qty Amount
Domestic*
Unlisted Samsung Display 2012.04 Business 16,009,547 221,969 84.78 18,509,307 0 0 0 221,969 84.78 18,509,307 35,754,894 2,400,779
Unlisted SVIC #6 2005.07 Business 26,800 1 99.00 2,277 0 0 0 1 99.00 2,277 37,284 -10,041
Unlisted SVIC #14 2009.05 Business 18,000 0 99.00 0 0 0 0 0 99.00 0 55,465 -1,882
Unlisted SVIC #21 2011.11 Business 19,800 0 99.00 81,180 1 69,454 0 0 99.00 150,634 61,384 -11,804
Unlisted SVIC #22 2011.11 Business 19,800 0 99.00 102,633 1 53,163 0 0 99.00 155,796 93,554 -4,497
Unlisted SVIC #26 2014.11 Business 19,800 0 0.00 0 0 19,800 0 0 99.00 19,800 0 0
Unlisted SVIC #27 2014.09 Business 5,940 0 0.00 0 0 5,940 0 0 99.00 5,940 0 0
Unlisted World Cyber
Games 2003.12 Business 1 450 47.60 0 -450 0 0 0 0.00 0 2,234 486
Unlisted Suwon Samsung Bluewings FC
2008.12 Business 2,000 400 100.00 2,000 -400 -2,000 0 0 0.00 0 4,115 -26
Unlisted Samsung Medison
2011.02 Business 286,384 87,350 68.45 477,648 0 0 0 87,350 68.45 477,648 309,321 28,856
Unlisted Samsung BioLogics
2011.04 Management 30,000 5,058 42.55 244,665 4,240 167,400 0 9,298 45.65 412,065 653,426 -140,762
Unlisted Intellectual Discovery
2011.05 Management 5,000 1,784 15.71 5,241 0 0 0 1,784 15.71 5,241 48,125 12,619
Listed Samsung Heavy
Industries 1977.09 Management 125 40,676 17.61 1,547,708 0 0 -736,229 40,676 17.61 811,479 17,427,147 632,205
Listed Samsung Fine
Chemicals 1995.05 Management 1,346 2,165 8.39 96,449 0 0 -25,654 2,165 8.39 70,795 1,900,118 3,340
Listed Hotel Shilla 1979.12 Management 252 2,005 5.11 133,314 0 0 49,917 2,005 5.11 183,231 1,712,071 10,810
Listed Cheil Worldwide 1988.09 Management 185 2,999 2.61 82,465 11,500 221,021 -54,108 14,499 12.60 249,378 1,704,531 102,269
Listed A-Tech Solution 2009.11 Management 26,348 1,592 15.92 9,568 0 0 -1,990 1,592 15.92 7,578 181,148 -1,340

Samsung Electronics 2014 Business Report 154 / 170
※ Domestic account noted here reflects approved for sales securities
Account Name of Company
Acquisition Date
Objective Acquisition Cost
Beginning Balance Increase/Decrease Ending Balance Current Financial Stats
Qty Ownership
(%) Book Value
Acquisition/ Disposal Valuation Qty
Ownership (%) Book Value
Total Asset
Net Income (Loss) Qty Amount
Domestic*
Listed iMarket Korea 2000.12 Management 1,900 647 1.80 16,668 0 0 1,716 647 1.80 18,384 791,733 38,557
Listed KT Skylife 2001.12 Management 3,344 240 0.50 7,092 0 0 -2,688 240 0.50 4,404 684,444 72,724
Listed Samsung SDI 1977.01 Management 304 9,283 20.38 874,079 4,180 1,306,874 -619,283 13,463 19.58 1,561,670 10,555,671 147,916
Listed Cheil Industries 2014.06 Management 312,380 0 0.00 0 0 0 0 0 0.00 0 4,987,794 255,032
Unlisted Samsung
Petrochemical 1978.01 Management 100 514 12.96 80,347 -514 -80,347 0 0 0.00 0 883,798 -42,180
Unlisted Samsung General
Chemicals 1988.07 Management 1,500 1,914 3.91 80,653 1,103 48,257 -28,859 3,017 5.29 100,051 1,597,400 205,314
Unlisted Kihyup
Technology Banking
1995.01 Management 5,000 1,000 17.24 5,000 0 0 0 1,000 17.24 5,000 85,615 691
Unlisted Pusan Newport 1997.09 Management 590 1,135 0.98 5,677 0 0 0 1,135 0.98 5,677 682,137 35,726
Unlisted The Korea
Economic Daily 1987.05 Management 150 72 0.39 365 0 0 0 72 0.39 365 221,876 12,938
Unlisted Brooks
Automation Asia 1999.06 Management 1,097 219 19.00 368 -219 -368 0 0 0.00 0 4,279 294
Unlisted Samsung Venture
Investment 1999.11 Management 4,900 980 16.33 7,021 0 0 -435 980 16.33 6,586 64,049 2,575
Unlisted Cyber Bank 2000.12 Management 8,000 1,083 7.46 0 0 0 0 1,083 7.46 0 0 0
Unlisted FineChips 2001.12 Management 10 2 3.81 10 0 0 0 2 3.81 10 3,231 361
Unlisted SK Telink 2010.11 Management 4,357 15 1.13 4,357 0 0 0 15 1.13 4,357 253,332 16,093
Unlisted Inkel 2006.11 Management 130 0 0.00 0 0 0 0 0 0.00 0 153,629 974
Unlisted Yongpyong Resort
2007.05 Management 1,869 400 1.05 1,869 0 0 0 400 1.05 1,869 734,627 12,019

Samsung Electronics 2014 Business Report 155 / 170
※ Domestic account noted here reflects approved for sales securities
Account Name of Company Acquisition Date Objective
Acquisition Cost
Beginning Balance Increase/Decrease Ending Balance Current Financial Stats
Qty Ownership (%)
Book Value Acquisition/Disposal
Valuation Qty Ownership (%)
Book Value
Total Asset
Net Income (Loss) Qty Amount
Domestic*
Unlisted E-SCOM 2007.12 Management 0 0 0.01 0 0 0 0 0 0.01 0 14,329 -7,482
Unlisted TGSambo 2012.09 Management 0 0 0.01 0 0 0 0 0 0.01 0 37,940 1,467
Unlisted Icube #1 2009.12 Management 4,000 0 16.23 4,000 0 0 0 0 16.23 4,000 24,399 97
Unlisted KT Wibro 2010.07 Management 60,000 600 24.20 60,000 0 0 0 600 24.20 60,000 262,713 3,169
Unlisted Shinsung Eng &
Construction 2010.07 Management 1 1 0.01 0 -1 0 0 0 0.01 0 61,878 3,281
Unlisted Woobang 2010.07 Management 0 1 0 0 0 0 0 1 0 0 171,444 1,109
Unlisted Heehoon Design &
Global 2010.07 Management 0 2 0.02 0 0 0 0 2 0.02 0 42,516 -8,168
Unlisted Daewoo
Development 2012.12 Management 0 0 0.02 0 0 0 0 0 0.02 0 153,402 -51,563
Unlisted Daewoo Songdo
Development 2012.12 Management 0 9 0.02 0 0 0 0 9 0.02 0 1,217,768 -267,694
Unlisted Zyle Motor Sales 2012.12 Management 0 1 0 0 0 0 0 1 0 0 318,071 -369
Unlisted Woojung
Construction 2014.04 Withdrawal 0 0 0 0 5 0 0 5 0.35 0 23,920 -6,902
Unlisted Hyunjin 2014.04 Withdrawal 0 0 0 0 23 0 0 23 0.25 0 47,994 1,579
Unlisted Sungwon
Construction 2014.04 Withdrawal 0 0 0 0 1 0 0 1 0.03 0 35,318 -18,343
Unlisted Inhee 2014.04 Withdrawal 0 0 0 0 2 0 0 2 0.17 0 15,780 -942
Unlisted Samsung Solution 2014.04 Withdrawal 0 0 0 0 4 0 0 4 6.70 0 11,713 173
Unlisted STX Construction 2014.04 Withdrawal 0 0 0 0 1 0 0 1 0.01 0 247,859 -443,500
Unlisted Poonglim 2014.05 Withdrawal 0 0 0 0 52 0 0 52 0.37 0 512,015 72,350
Unlisted SamGong
Development 2014.10
debt-equity swap
0 0 0 0 0 0 0 0 0.09 0 181,532 628

Samsung Electronics 2014 Business Report 156 / 170
※ Domestic account noted here reflects approved for sales securities
Account Name of Company Acquisition
Date Objective
Acquisition Cost
Beginning Balance Increase/Decrease Ending Balance Current Financial
Stats
Qty Ownership (%)
Book Value
Acquisition/Disposal Valuation Qty Ownership
(%) Book Value
Total Asset
Net Income (Loss) Qty Amount
Domestic*
Unlisted JNT 2011.02 Investment 1,800 0 24.00 3,360 0 0 0 0 24.00 3,360 13,647 -310
Unlisted SV 2011.02 Investment 1,850 0 14.80 3,403 0 0 0 0 14.85 3,403 19,873 -1,730
Unlisted Seoul Investment
Partners 2011.10 Investment 1,550 0 19.40 3,047 0 -175 0 0 19.38 2,872 15,778 1,257
Unlisted Daishin Aju IB 2011.08 Investment 258 0 3.00 2,277 0 -380 0 0 3.00 1,898 68,934 2,235
Unlisted TS 2011.11 Investment 1,700 0 20.48 3,400 0 -718 0 0 20.32 2,682 17,032 745
Unlisted IMM 2011.11 Investment 760 0 7.60 2,489 0 805 0 0 7.60 3,294 34,792 1,512
Unlisted L&S 2012.07 Investment 848 0 8.10 1,687 0 1,161 0 0 7.46 2,848 23,610 1,871
Unlisted Taewon Electric 2012.04 Management 16,544 9 15.00 17,072 36 0 22 45 15.00 17,094 82,347 5,386
Unlisted Pantech 2013.06 Business 53,000 53,000 10.03 53,053 0 0 -53,053 53,000 10.03 0 714,097 -619,909
Unlisted KTCNP-GC 2013.12 Business 960 0 3.00 960 0 -42 0 0 3.56 918 25,578 -1,591
Listed Wonik IPS 2013.12 Business 31,625 3,610 4.48 30,975 0 0 19,386 3,610 4.48 50,361 590,142 37,354
Unlisted Postech Technology
Investment 2013.12 Business 600 0 10.00 600 0 0 0 0 10.00 600 118,613 3,514
Unlisted High Pioneer Private Investment Trust #1 2011.09 Business 29,244 0 100.00 19,470 0 0 0 0 100.00 19,470 19,189 -303

Samsung Electronics 2014 Business Report 157 / 170
※ International account noted here reflects approved for sales securities
Account Name of Company
Acquisition Date Objective Acquisition
Cost
Beginning Balance Increase/Decrease Ending Balance Current Financial Stats
Qty Ownership
(%) Book Value
Acquisition/Disposal Valuation Qty Ownership
(%) Book Value Total Asset
Net Income (Loss) Qty Amount
Int’l*
Unlisted SECA 1992.08 Position Security
3,823 0 100.00 90,922 0 0 0 0 100.00 90,922 522,775 48,920
Unlisted SEA 1978.07 Position Security
59,362 492 100.00 4,861,334 0 166,546 0 492 100.00 5,027,880 11,316,048 56,864
Unlisted SELA 1989.04 Position Security
319 40 100.00 86,962 0 0 0 40 100.00 86,962 375,274 -26,800
Unlisted SEM 1995.07 Position Security
3,032 3,173 63.58 111,697 664 53,941 0 3,837 63.58 165,638 1,554,638 10,689
Unlisted SEASA 1996.06 Position Security
4,696 21,854 98.00 6,779 0 0 0 21,854 98.00 6,779 49,454 6,353
Unlisted SEDA 1994.01 Position Security
13,224 62,816,336 87.04 577,483 0 0 0 62,816,336 87.04 577,483 3,429,136 914,548
Unlisted SECH 2002.12 Position Security
597 0 4.10 597 0 0 0 0 4.10 597 492,709 28,128
Unlisted Nvelo,
Inc. 2012.12 Position Security
42,892 100 100.00 42,892 0 0 0 100 100.00 42,892 1,519 246
Unlisted CMLA LLC 2008.02 Management 654 0 25.00 4,115 0 0 0 0 25.00 4,115 10,084 -728
Unlisted SESA 1989.01 Position Security
3,276 8,021 100.00 142,091 0 0 0 8,021 100.00 142,091 783,438 57,386
Unlisted SENA 1992.03 Position Security
392 1,000 100.00 69,372 0 0 0 1,000 100.00 69,372 533,252 39,394
Unlisted SEH 1991.05 Position Security
1,954 753 100.00 650,157 0 0 0 753 100.00 650,157 1,249,691 103,658
Unlisted SEP 1982.09 Position Security
204 1,751 100.00 37,616 0 0 0 1,751 100.00 37,616 132,631 8,139
Unlisted SEF 1991.08 Position Security
230 2,700 100.00 234,115 0 0 0 2,700 100.00 234,115 1,157,900 127,155
Unlisted SEUK 1995.07 Position Security
33,908 109,546 100.00 433,202 0 0 0 109,546 100.00 433,202 1,393,507 92,969
Unlisted SEHG 1982.02 Position Security
28,042 0 100.00 354,846 0 0 0 0 100.00 354,846 886,338 122,818
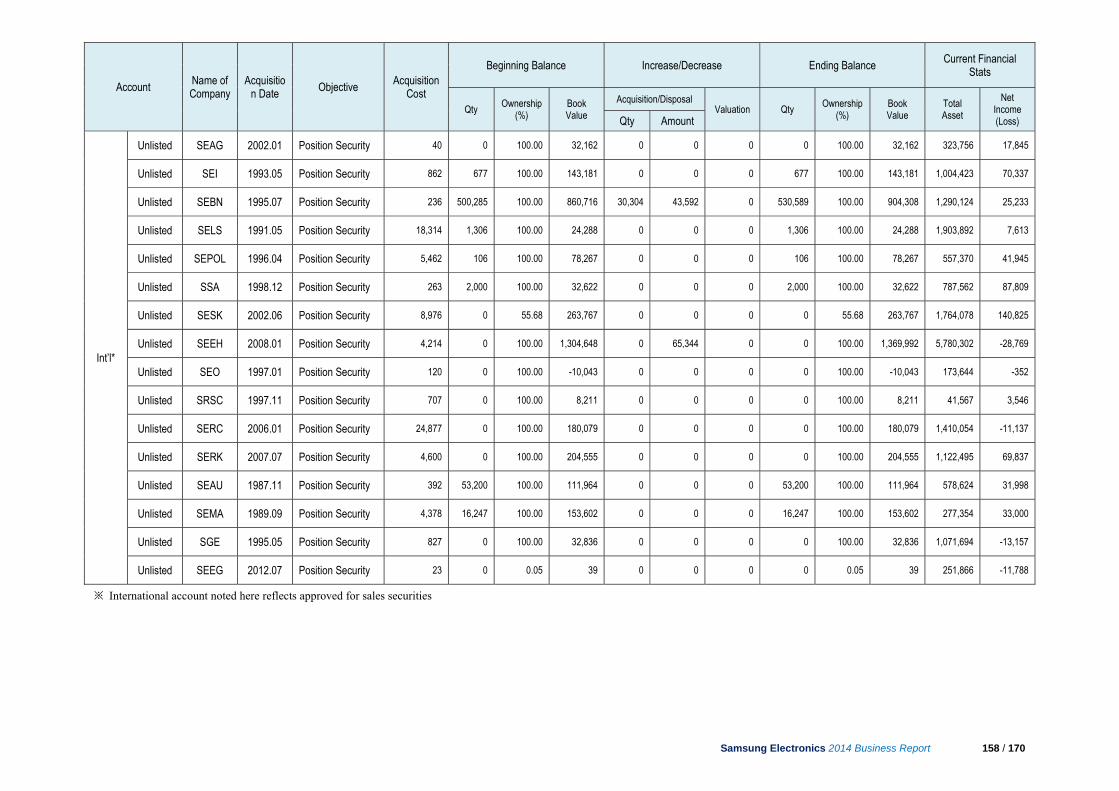
Samsung Electronics 2014 Business Report 158 / 170
※ International account noted here reflects approved for sales securities
Account Name of Company
Acquisition Date Objective
Acquisition Cost
Beginning Balance Increase/Decrease Ending Balance Current Financial
Stats
Qty Ownership
(%) Book Value
Acquisition/Disposal Valuation Qty
Ownership (%)
Book Value
Total Asset
Net Income (Loss) Qty Amount
Int’l*
Unlisted SEAG 2002.01 Position Security 40 0 100.00 32,162 0 0 0 0 100.00 32,162 323,756 17,845
Unlisted SEI 1993.05 Position Security 862 677 100.00 143,181 0 0 0 677 100.00 143,181 1,004,423 70,337
Unlisted SEBN 1995.07 Position Security 236 500,285 100.00 860,716 30,304 43,592 0 530,589 100.00 904,308 1,290,124 25,233
Unlisted SELS 1991.05 Position Security 18,314 1,306 100.00 24,288 0 0 0 1,306 100.00 24,288 1,903,892 7,613
Unlisted SEPOL 1996.04 Position Security 5,462 106 100.00 78,267 0 0 0 106 100.00 78,267 557,370 41,945
Unlisted SSA 1998.12 Position Security 263 2,000 100.00 32,622 0 0 0 2,000 100.00 32,622 787,562 87,809
Unlisted SESK 2002.06 Position Security 8,976 0 55.68 263,767 0 0 0 0 55.68 263,767 1,764,078 140,825
Unlisted SEEH 2008.01 Position Security 4,214 0 100.00 1,304,648 0 65,344 0 0 100.00 1,369,992 5,780,302 -28,769
Unlisted SEO 1997.01 Position Security 120 0 100.00 -10,043 0 0 0 0 100.00 -10,043 173,644 -352
Unlisted SRSC 1997.11 Position Security 707 0 100.00 8,211 0 0 0 0 100.00 8,211 41,567 3,546
Unlisted SERC 2006.01 Position Security 24,877 0 100.00 180,079 0 0 0 0 100.00 180,079 1,410,054 -11,137
Unlisted SERK 2007.07 Position Security 4,600 0 100.00 204,555 0 0 0 0 100.00 204,555 1,122,495 69,837
Unlisted SEAU 1987.11 Position Security 392 53,200 100.00 111,964 0 0 0 53,200 100.00 111,964 578,624 31,998
Unlisted SEMA 1989.09 Position Security 4,378 16,247 100.00 153,602 0 0 0 16,247 100.00 153,602 277,354 33,000
Unlisted SGE 1995.05 Position Security 827 0 100.00 32,836 0 0 0 0 100.00 32,836 1,071,694 -13,157
Unlisted SEEG 2012.07 Position Security 23 0 0.05 39 0 0 0 0 0.05 39 251,866 -11,788

Samsung Electronics 2014 Business Report 159 / 170
※ International account noted here reflects approved for sales securities
Account Name of Company
Acquisition Date
Objective Acquisition
Cost
Beginning Balance Increase/Decrease Ending Balance Current Financial Stats
Qty Ownership (%)
Book Value
Acquisition/Disposal Valuation Qty
Ownership (%)
Book Value
Total Asset
Net Income (Loss) Qty Amount
Int’l*
Unlisted SEIN 1991.08 Position Security 7,463 46 99.99 118,909 0 0 0 46 99.99 118,909 647,199 141,290
Unlisted SDMA 1995.03 Position Security 21,876 71,400 75.00 244,382 0 0 0 71,400 75.00 244,382 814,820 70,830
Unlisted SIEL 1995.08 Position Security 5,414 216,787 100.00 75,263 0 0 0 216,787 100.00 75,263 1,924,832 324,171
Unlisted SRI-B 2005.05 Position Security 7,358 17 100.00 31,787 0 0 0 17 100.00 31,787 147,900 20,316
Unlisted SAVINA 1995.01 Position Security 5,839 0 100.00 28,365 0 0 0 0 100.00 28,365 175,780 18,173
Unlisted TSE 1988.01 Position Security 1,390 11,020 91.83 279,163 0 0 0 11,020 91.83 279,163 1,476,296 222,389
Unlisted STE 1996.01 Position Security 4,206 2,499 49.00 4,474 0 0 0 2,499 49.00 4,474 23,979 -7
Unlisted SME 2003.05 Position Security 4,796 17,100 100.00 7,644 0 0 0 17,100 100.00 7,644 814,104 36,427
Unlisted SAPL 2006.07 Position Security 793 741,378 100.00 870,623 0 0 0 741,378 100.00 870,623 2,425,585 674,510
Unlisted SEHK 1988.09 Position Security 349 274,250 100.00 79,033 0 0 0 274,250 100.00 79,033 1,188,620 37,977
Unlisted SET 1994.11 Position Security 456 27,270 100.00 112,949 0 0 0 27,270 100.00 112,949 1,390,404 30,802
Unlisted SESS 1994.12 Position Security 18,875 0 100.00 483,923 0 20,390 0 0 100.00 504,313 660,374 64,362
Unlisted SCIC 1996.03 Position Security 23,253 0 100.00 617,941 0 0 0 0 100.00 617,941 8,406,438 743,369
Unlisted SEHZ 1992.12 Position Security 792 0 89.56 255,535 0 0 0 0 89.56 255,535 4,599,200 1,012,728
Unlisted SSEC 1995.04 Position Security 32,128 0 69.06 130,551 0 0 0 0 69.06 130,551 645,699 67,668
Unlisted TSEC 1993.04 Position Security 15,064 0 48.20 138,101 0 0 0 0 48.20 138,101 907,752 155,258

Samsung Electronics 2014 Business Report 160 / 170
※ International account noted here reflects approved for sales securities
Account Name of Company
Acquisition Date
Objective Acquisition
Cost
Beginning Balance Increase/Decrease Ending Balance Current Financial Stats
Qty Ownership
(%) Book Value
Acquisition/ Disposal Valuation Qty
Ownership (%)
Book Value
Total Asset
Net Income (Loss) Qty Amount
Int’l*
Unlisted SSDP 1993.08 Position Security
4,446 0 87.10 65,319 0 0 0 0 87.10 65,319 761,018 94,541
Unlisted TSTC 2001.03 Position Security
10,813 0 90.00 490,041 0 0 0 0 90.00 490,041 2,939,027 767,822
Unlisted SSTC 2001.11 Position Security
15,799 0 100.00 -1,186 0 0 0 0 100.00 -1,186 1,411 -4,958
Unlisted SSET 2002.02 Position Security
6,009 0 60.00 121,624 0 0 0 0 95.00 121,624 88,698 7,122
Unlisted SESC 2002.09 Position Security
5,471 0 73.70 34,028 0 0 0 0 73.70 34,028 846,670 58,194
Unlisted SSS 2001.01 Position Security
1,200 0 100.00 19,189 0 0 0 0 100.00 19,189 1,310,109 130,082
Unlisted SEHF 2004.04 Position Security
17,204 0 100.00 85,088 0 0 -31,219 0 100.00 53,869 111,367 -7,855
Unlisted SSCR 2006.09 Position Security
3,405 0 100.00 9,332 0 0 0 0 100.00 9,332 18,982 1,874
Unlisted TSOE 2010.04 Position Security
33,837 167,199 82.00 93,154 0 0 0 167,199 82.00 93,154 241,957 34,236
Unlisted TSLED 2012.04 Position Security
119,519 0 100.00 119,519 0 0 0 0 100.00 119,519 457,896 15,570
Unlisted SCS 2012.09 Position Security
111,770 0 100.00 2,538,826 0 173,270 0 0 100.00 2,712,096 3,752,682 -40,537
Unlisted SJC 1975.12 Position Security
273 1,560 100.00 370,647 0 0 0 1,560 100.00 370,647 1,174,832 2,866
Unlisted SRJ 1992.08 Position Security
3,120 122 100.00 117,257 0 0 0 122 100.00 117,257 181,723 4,905
Unlisted TSST Japan 2004.03 Management 1,639 0 49.03 11,137 30 40,260 -51,397 30 49.03 0 169,322 -41,875
Unlisted SDIB 1996.09 Management 3,110 586 0.08 0 0 0 0 586 0.08 0 49,372 10,088
Unlisted Semiconductor
Portal 2002.12 Management 38 0 1.21 10 0 0 0 0 1.21 10 1,724 2,141

Samsung Electronics 2014 Business Report 161 / 170
* International account noted here reflects approved for sales securities * Based on separate financial statements * Ownership is calculated based on common share
Account Name of Company
Acquisition Date
Objective Acquisition
Cost
Beginning Balance Increase/Decrease Ending Balance Current Financial Stats
Qty Ownership (%) Book Value
Acquisition/ Disposal Valuation Qty Ownership
(%) Book Value Total Asset
Net Income (Loss) Qty Amount
Int’l*
Unlisted FTS 2008.12 Management 1,952 116 41.50 563 0 0 0 116 41.50 563 2,710 406
Unlisted Nanosys Inc.
2010.08 Management 4,774 1,747 1.67 2,387 0 0 0 1,747 1.67 2,387 22,159 857
Unlisted ONE BLUE
LLC 2011.07 Management 1,766 0 16.67 1,766 0 0 0 0 16.67 1,766 33,803 875
Unlisted TidalScale 2013.08 Management 1,112 2,882 18.98 1,112 0 0 0 2,882 18.98 1,112 1,214 -1,948
Listed SSL 2014.05 Business 37,553 0 0.00 0 2,426 37,553 11,958 2,426 5.84 49,511 - -
Unlisted Mantis Vision 2014.01 Business 1,594 0 0.00 0 301 1,594 0 301 3.53 1,594 3,236 -4,186
Unlisted INEDA 2014.04 Business 3,181 0 0.00 0 3,918 3,181 0 3,918 5.55 3,181 9,878 2,955
Unlisted Leman 2014.08 Business 1,019 0 0.00 0 17 1,019 0 17 3.91 1,019 1,630 -1,495
Unlisted Alces 2014.09 Business 4,832 0 0.00 0 421 4,832 0 421 19.95 4,832 799 -738
Listed Rambus 2010.01 Business 185,363 4,788 4.34 47,851 0 0 10,517 4,788 4.19 58,368 752,829 -36,931
Listed SEAGATE 2011.12 Business 788,454 12,539 3.80 743,161 0 0 173,436 12,539 3.80 916,597 9,754,138 2,011,378
Total 18,975,679 45,261,470 54,211 2,387,172 -1,337,965 46,310,677

Samsung Electronics 2014 Business Report 162 / 170
X. Related Party Transactions
1. Credit Offerings for Affiliates and Subsidiaries
A. Details on Debt Guarantee (as at December 31, 2014)
- Domestic: N/A - Overseas:
(Unit: USD thousand)
Company Relationship Creditor Guarantee Expiry
Date
Transactions Limit of
Guarantee Beginning of period Increase Decrease End of period
SEA Subsidiary SMBC, etc. 2017-04-10 2,840,000 0 1,840,000 1,000,000 2,425,000
SECA Subsidiary Nova Scotia 2015-10-10 0 0 0 0 15,000
SEM Subsidiary Santander, etc. 2015-12-16 314,620 33,660 0 348,280 676,000
SAMCOL Subsidiary Citibank, etc. 2015-12-16 34,050 33,483 0 67,533 126,000
SEDA Subsidiary HSBC, etc. 2015-12-17 257,366 0 257,366 0 909,000
SECH Subsidiary Citibank, etc. 2015-12-16 49,400 4,932 0 54,332 178,000
SEPR Subsidiary BBVA, etc. 2015-12-16 63,688 0 970 62,718 180,000
SELA Subsidiary Citibank 2015-12-16 0 0 0 0 30,000
SEEH Subsidiary HSBC, etc. 2015-12-16 0 0 0 0 897,000
SSA Subsidiary Citibank, etc. 2015-12-16 64,729 96,366 0 161,095 335,000
SEMRC Subsidiary SocGen, etc. 2015-12-16 22,157 0 16,333 5,824 110,000
SETK Subsidiary BTMU, etc. 2015-12-16 150,784 0 64,907 85,877 420,000
SERK Subsidiary BNP, etc. 2015-12-16 0 0 0 0 370,000
SEI Subsidiary Intesa 2014-10-31 550 0 550 0 0
SECE Subsidiary Citibank, etc. 2015-12-16 10,400 0 10,400 0 105,000
SEUC Subsidiary Credit Agricole, etc. 2015-12-16 16,920 0 16,920 0 175,000
SELV Subsidiary Citibank 2015-12-16 0 0 0 0 10,000
SAPL Subsidiary BOA, etc. 2015-12-16 0 0 0 0 505,621
SEV Subsidiary SCB 2015-11-08 0 0 0 0 15,000
SAVINA Subsidiary SCB, etc. 2015-11-08 0 0 0 0 30,000
SEEG Subsidiary HSBC 2015-06-13 3,000 0 3,000 0 50,000
SEPCO Subsidiary BOA 2015-11-08 54,225 0 44,846 9,379 9,379
SET Subsidiary SCB 2015-11-08 0 0 0 0 30,000
SEIN Subsidiary BNP, etc. 2015-11-08 16,400 0 16,400 0 140,000
SCIC Subsidiary HSBC, etc. 2015-12-16 0 0 0 0 200,000
SJC Subsidiary Mizuho Bank, etc. 2015-12-16 285,600 0 73,718 211,882 891,397
SRJ Subsidiary SMBC 2016-02-28 26,085 0 5,157 20,928 20,928
SEDAM Subsidiary Citibank, etc. 2015-12-16 54,315 62,412 0 116,727 441,000
SME Subsidiary SCB 2015-11-08 0 0 0 0 120,000
SAMEX Subsidiary Citibank 2015-12-16 0 0 0 0 5,000
SEASA Subsidiary Citibank 2015-12-16 0 0 0 0 1,000
SSAP Subsidiary SCB 2015-11-08 0 7,779 0 7,779 20,000
Total 4,264,289 238,632 2,350,567 2,152,354 9,440,325

Samsung Electronics 2014 Business Report 163 / 170
Other than the guarantee obligations presented above, the Company provides payment guarantees of KRW 18,360 million (HUF 4.32 billion) to SEH (Samsung Electronics Hungarian) in Hungary to guarantee fulfillment of an investment incentive contract with the Hungarian government. The Company requires BOD approval for individual guarantees exceeding 2.5% of total equity. When the guarantee amount is between 0.1% and/or less than 2.5%, the approval decision is delegated to the Management Committee. B. Purchase and Sales of Securities
(Unit: KRW million)
Company Relationship
Changes
Balance Note Securities Type
Purchase Sale Total Profit &
Loss
Samsung Asset
Management Affiliate
Beneficiary certificate 1,450,000 1,700,000 3,150,000 24,131 1,016,878 Asset management
Total 1,450,000 1,700,000 3,150,000 24,131 1,016,878
※ Profit and loss of securities is based on gain from disposition.

Samsung Electronics 2014 Business Report 164 / 170
2. Acquisitions and disposals of Assets with Affiliates and Subsidiaries
During 2014, the Company disposed assets to affiliates including SCS (Samsung China Semiconductor Co., Ltd.) for the purpose of increasing production capacity. In addition, the Company acquired assets including facility equipment from affiliates to improve efficiency of domestic production.
(Unit: KRW million)
Company Relationship Purpose Transaction Date Date based on Asset Amount
Samsung SDI Affiliate Asset sale/purchase 2014.12.18 Date of sale/purchase Stock, etc. 670,081
Cheil Industries Affiliate Asset purchase 2014.12.31 Date of purchase Stock, etc. 374,046
Cheil Wordwide Affiliate Asset sale/purchase 2014.12.01 Date of sale/purchase Stock, etc. 223,115
Samsung Card Affiliate Asset purchase 2014.10.23 Date of purchase Stock, etc. 170,739
SAS Subsidiary Asset sale/purchase 2014.11.23 Date of sale/purchase Machinery, etc. 93,909
SCS Subsidiary Asset sale 2014.12.30 Date of sale Machinery, etc. 82,794
Samsung Techwin Affiliate Asset purchase 2014.12.31 Date of purchase Building, etc. 51,650
Samsung Biologics Affiliate Asset sale 2014.06.05 Date of sale Intellectual property right, etc. 10,433
SESS Subsidiary Asset sale/purchase 2014.12.22 Date of sale/purchase Machinery, etc. 10,352
SEV Subsidiary Asset sale/purchase 2014.11.01 Date of sale/purchase Machinery, etc. 4,565
SEIN Subsidiary Asset sale 2014.12.11 Date of sale Machinery, etc. 3,189
SEVT Subsidiary Asset sale 2014.09.30 Date of sale Machinery, etc. 3,086
SII Subsidiary Asset sale/purchase 2014.06.09 Date of sale/purchase Machinery, etc. 2,593
SRA Subsidiary Asset purchase 2014.12.04 Date of purchase Intellectual property right, etc. 2,540
Samsung Display Affiliate Asset purchase 2014.11.28 Date of purchase Machinery, etc. 1,463
TSE Subsidiary Asset sale/purchase 2014.11.24 Date of sale/purchase Machinery, etc. 1,398
SEHZ Subsidiary Asset purchase 2014.11.07 Date of purchase Machinery, etc. 1,361
SESC Subsidiary Asset purchase 2014.04.18 Date of purchase Machinery, etc. 950
SRC-Guangzhou Subsidiary Asset sale 2014.02.17 Date of sale Machinery, etc. 879
TSTC Subsidiary Asset purchase 2014.11.24 Date of purchase Machinery, etc. 865
SEMES Affiliates Asset purchase 2014.05.30 Date of purchase Machinery, etc. 808
TSST Korea Subsidiary Asset sale 2014.09.30 Date of sale Intellectual property right, etc. 647
SSEC-E Subsidiary Asset sale 2014.02.01 Date of sale Machinery, etc. 524
SSI Subsidiary Asset purchase 2014.12.05 Date of purchase Machinery, etc. 407
SSAP Subsidiary Asset sale 2014.12.30 Date of sale Machinery, etc. 197
SSEC Subsidiary Asset sale 2014.03.21 Date of sale Machinery, etc. 190
TSOE Subsidiary Asset sale/purchase 2014.07.25 Date of sale/purchase Machinery, etc. 124
SEMCO Affiliate Asset sale 2014.06.23 Date of sale Machinery, etc. 110

Samsung Electronics 2014 Business Report 165 / 170
※ Transaction date: most recent transaction
※ The former Cheil Industries merged with Samsung SDI in July 2014, and Samsung Everland name has been renamed as Cheil Industries
3. Business Transactions with Affiliates and Subsidiaries During 2014, the Company had business transactions with affiliates STA (Samsung Telecommunications America LLC.) and SEV (Samsung Electronics Vietnam Co., Ltd.).
(Unit: KRW million)
Company Relationship Type of
Transaction Date Details Amount
STA Subsidiary Sales/Purchases 2014.01 - 2014.12 Sales of HHP and Network
Equipment, etc. 18,229,215
SEV Subsidiary Sales/Purchases 2014.01 - 2014.12 Purchase of HHP and Home
Appliance, etc. 14,418,124
SSI Subsidiary Sales/Purchases 2014.01 - 2014.12 Purchase/sales of
semiconductor, etc. 13,668,329
SEHZ Subsidiary Sales/Purchases 2014.01 - 2014.12 Purchase/sales of HHP and
CTV, etc. 13,258,945
SEA Subsidiary Sales/Purchases 2014.01 - 2014.12 Purchase/sales of HHP and
Home Appliance, etc. 12,633,227
SII Subsidiary Sales/Purchases 2014.01 - 2014.12 Purchase/sales of CTV, etc. 7,555,735
4. Transactions with Stakeholders other than Affiliates and Subsidiaries
As at December 31, 2014, the Company’s outstanding loan amount is KRW 116 billion related to support for supplier companies for product competitiveness and mutual development as well as home loan and educational expenses for employee welfare. In addition, the Company provides debt guarantees up to KRW 13.1 billion for employees’ loans from financial institutions relating to housing rental.
(Unit: KRW million)
Company Relationship
Loans
Account title
Transaction
Beginning of period (January 1, 2014) Increase Decrease
End of period (December 31, 2014)
Jangwon Tech, etc Partner company Short-term
loans 30,977 7,114 3,770 34,321
Dooil I&D, etc Partner company and
employee Long-term loans 77,303 41,634 37,404 81,534
Total 108,280 48,749 41,173 115,855
※ The amount shown above reflects present value of discounted debts before accounting for bad debts.

Samsung Electronics 2014 Business Report 166 / 170
XI. Other Information
1. Public Disclosure
(A) Progress on major disclosed information related to management
Report date Title Report Progress
Feb 7, 2011 Appeal of Court’s Ruling on Samsung Motors Case
Related to the agreement regarding court receivership of Samsung Motors between 28 Samsung affiliates (including Samsung Electronics) and creditors of Samsung Motors in September 1999, the Samsung affiliates (including Samsung Electronics) appealed the Seoul High Court’s ruling of January 11, 2011, against the case filed by the defendants (Creditors filed the case in December 2005).
Case closed by the Supreme Court decision on January 29, 2015
Mar 4, 2011 Filing of a lawsuit
Related to the agreement regarding court receivership of Samsung Motors between 28 Samsung affiliates (including Samsung Electronics) and creditors of Samsung Motors in September 1999, creditors appealed the Court’s ruling of January 11, 2011 regarding the dispute case filed by the creditors in December 2005.
2. Summary of Results of Shareholder Meetings
Date Agenda Results
FY2015 annual general meeting of shareholders ('15.3.13)
1. Approval of Balance Sheet, Income Statement, and Statement of Appropriation of Retained Earnings (Draft), etc. for FY2014
2. Appointment of Directors 2.1: Appointment of Independent Directors 2.1.1: Han-Joong Kim 2.1.2: Byeong-Gi Lee 2.2: Appointment of Executive Director (Oh-Hyun Kwon) 2.3: Appointment of Member of Audit Committee (Han-Joong Kim) 3. Approval of the limit on the remuneration for Directors
Approved
Approved
Approved
FY2014 annual general meeting of shareholders ('14.3.14)
1. Approval of Balance Sheet, Income Statement, and Statement of Appropriation of Retained Earnings (Draft), etc. for FY2013
2. Approval of the limit on the remuneration for Directors
Approved
Approved
FY2013 annual general meeting of shareholders ('13.3.15)
1. Approval of Balance Sheet, Income Statement, and Statement of Appropriation of Retained Earnings (Draft), etc. for FY2012
2. Appointment of Directors
2.1 : Appointment of Independent Directors 2.1.1: In-Ho Lee 2.1.2: Kwang-Soo Song
2.1.3: Eun-Mee Kim
2.2: Appointment of Executive Directors 2.2.1: Boo-Keun Yoon 2.2.2: Jong-Kyun Shin
2.2.3: Sang-Hoon Lee
2-3: Appointment of Members of Audit Committee 2.3.1: In-Ho Lee 2.3.2: Kwang-Soo Song 3. Approval of the limit on the remuneration for Directors
Approved
Approved
Approved

Samsung Electronics 2014 Business Report 167 / 170
3. Litigation
The litigation with Apple Inc. (“Apple”) is ongoing in the United States as of the Reporting Date. Regarding the ongoing lawsuit in the United States, on August 24, 2012, the jury determined that the Company partially infringed Apple’s design and utility patent and should pay damages to Apple. On March 1, 2013, however, the Judge ordered a new trial for a certain portion of the damages, ruling that it was originally miscalculated. On March 6, 2014, the Judge denied Apple’s bid for a permanent injunction against the Company and made a final judgment restating the total damages amount determined by a jury verdict on November 21, 2013. The Company appealed the decision on the damages amount on March 7, 2014, and a hearing on the appeal was held on December 4, 2014.
Additionally, on May 5, 2014, the jury in another ongoing lawsuit determined that the Company partially infringed Apple’s utility patent and should pay damages to Apple. On November 25, 2014, first trial judgment was pronounced to confirm the jury’s verdict. The Company appealed the decision on the damages and the appeal is currently on-going. The final conclusion and the effect of the patent lawsuits with Apple are uncertain as of the reporting date.
In August 2014, the Company and Apple reached an agreement to withdraw from ongoing litigation in all regions other than the United States, and the Company is currently in the process of withdrawing all non-United States based lawsuits.
As at the time of this disclosure, there are multiple on-going lawsuits and civil damage claims by some overseas purchasers of TFT-LCD panels, as well as investigations by regulatory authorities, in connection with the price fixing of LCD panels. These lawsuits, claims and investigations were initiated prior to the spin-off of LCD business. The timing of payments related to these matters is currently uncertain but our management believes that the ultimate resolution of such lawsuits, claims, and investigations would not materially affect the financial condition of the Company.
In addition, during the normal course of business with numerous companies, the Company has been involved in various claims, disputes, and investigations conducted by regulatory authorities. Although the outflow of resources and timing of these matters are uncertain, the Company believes the outcome will not have a material impact on the financial condition of the Company.
4. Guarantees
See 『Commitments and Contingencies』 notes in the 『Separate and Consolidated Financial Statements』

Samsung Electronics 2014 Business Report 168 / 170
5. Sanctions and Others
The Company paid a fine of KRW 1.602 billion on August 7, 2012, pursuant to a corrective order resulting from the violation of Article 8 (Prohibition of Unreasonable Cancellation of Entrustment) of the Fair Transactions in Subcontracting Act. On March 21, 2012, the Company paid a fine of KRW 12.907 billion pursuant to a corrective order issued by the Fair Trade Commission resulting from the violation of Article 19 (Prohibition of Unfair Collaborative Acts) of the Monopoly Regulation and Fair Trade Act relating to sales of washing machines, flat panel TVs, and notebook PCs.
The Company is still engaged in a lawsuit after being issued a corrective order and fine (KRW 14.126 billion) on July 10, 2012 for violating Article 23 (Prohibition of Unfair Trade Practices) of the Monopoly Regulation and Fair Trade Act. In relation to the same lawsuit, the Company and two executives (one incumbent senior vice president at the time and one retired vice president at the time) were ordered to pay a fine (the Company: KRW 300 million, two executives: 50 million each) on March 12, 2012, and the parties have subsequently paid the fine.
The Company was ordered to pay a fine (KRW 26 million) on January 13, 2014 from the Fair Trade Commission for violating Article 4 (Announcement of Critical Information and Integrated Notification) of the Fair Labeling and Advertising Act, and has subsequently paid the fine.
The Company was ordered to pay a fine (KRW 267 million) on March 7, 2013, for violating the Occupational Safety and Health Act in connection with a hydrofluoric acid gas leak that occurred on January 28, 2013, and has subsequently paid the fine. The Company was issued an improvement order and ordered to pay a fine (KRW 2.2 million) on April 1, 2013, for violating the Toxic Chemicals Control Act. The Company reported compliance with the improvement order and subsequently paid the fine. As a result of this incident, three employees and executives of the Company were ordered to pay a fine (KRW 15 million) at the first trial on October 31, 2014. The Company appealed the decision on November 7, 2014.
For the hydrofluoric acid gas leak occurred on May 2, 2013, the Company was ordered to pay a fine (KRW 4.5 million) on February 27, 2014, for violating the Occupational Safety and Health Act and the Toxic Chemicals Control Act, and has subsequently paid the fine.
The Company was ordered and paid a fine of KRW 166.7 million for not reporting the importation of certain chemicals in August 2013, following a joint inspection by the Ministry of Environment and Gyeong-Gi Province.
The Company regularly provides compliance education and training to executives and employees to promote global standards of fair competition, and operates various compliance programs. The Company reinforced internal controls to comply with relevant laws on environmental safety and provides related education for executives and employees.
6. Return of Short-Swing Profits
The Company has not received any notification of short-swing profits from the Securities & Futures Commission (the Governor of the Financial Supervisory Service) in the past three years and until the date of this report.

Samsung Electronics 2014 Business Report 169 / 170
7. Subsequent Events
On January 1, 2015, Samsung Electronics America (SEA), a subsidiary of the Company, merged with Samsung Telecommunications America (STA), also a subsidiary of the Company. The merger was between two subsidiaries under common control, therefore, the merger was accounted for by transferring the book values on the consolidated financial statements. No additional goodwill was recognized.
Based on an agreement entered into in September 1999 related to Samsung Motor Inc.’s (“SMI”) insolvency proceedings, SMI’s creditors (the “Creditors”) filed a civil action in December 2005 against 28 Samsung Group affiliates, including the Company, seeking to recover KRW 2,450 billion in losses as well as additional penalty amounts. On January 11, 2011, the Seoul High Court ordered Samsung Group affiliates to pay to the Creditors KRW 600 billion as additional penalty plus interest for late payment. The decision was appealed to the Supreme Court of Korea. On January 29, 2015, the Supreme Court ordered the Samsung Group affiliates to pay the Creditors KRW 600 billion as additional penalty plus interest on the additional penalty amount (at a rate of 6% per annum). On January 11, 2011, the Seoul High Court ordered Samsung Group affiliates to pay to the Creditors KRW 600 billion as additional penalty plus interest for late payment. Compared to the January 2011 ruling, the penalty amount remained the same; however, interest rate on the additional
penalty increased by 1%, thus the total amount due to Creditors increased by ₩4 billion as a result of the Supreme
Court’s January 2015 decision.
8. Acquisition and Divestments
A. Acquisitions and divestments
[Samsung LED Merger]
ㆍ Type: Merger
ㆍ Purpose: Increase Efficiency and Profitability of LED Business
ㆍ Board Decision Date: 26 December 2011
ㆍ Board Approval Date: 20 February 2012
(※ The merger was approved at a regularly scheduled meeting of the board of directors in lieu of
shareholder approval.)
ㆍ Merger Date: April 1, 2012
Acquiring Company Predecessor Company
Name Samsung Electronics Co., Ltd. Samsung LED Co., Ltd.
Address 416, Maetan-dong, Yeongtong-gu, Suwon-si, Gyeonggi-do, Korea San 24, Nongseo-dong, Giheung-gu, Yongin-si, Gyeonggi-do, Korea
President Gee-sung Choi Nam-sung Cho
Rate of Merger 1 0.0134934

Samsung Electronics 2014 Business Report 170 / 170
[LCD Business Spin-off]
ㆍ Type: Physical division (establishment of Samsung Display Co., Ltd.)
ㆍ Purpose: Efficiency of LCD business and profitability
ㆍ Approval Date: March 16, 2012 (At the Annual Shareholder Meeting)
ㆍ Spin-off Date: April 1, 2012
[Samsung Electronics Hainan Fiber Optics Korea Merger]
ㆍ Type: Merger
ㆍ Purpose: Increase Efficiency and Profitability of Camera Module and Touchscreen
ㆍ Board Decision Date: September 13, 2012
ㆍ Board Approval Date: October 26, 2012
(※ The merger was approved at a regularly scheduled meeting of the board of directors in lieu of
shareholder approval.)
ㆍ Merger Date: 1 December 2012
Acquiring Company Predecessor Company
Name Samsung Electronics Co., Ltd. Samsung Electronics Hainan Fiber Optics Korea Co., Ltd.
Address 129, Samsung-ro, Yeongtong-gu, Suwon-si, Gyeonggi-do, Korea
94-1, Imsu-dong, Gumi-si, Gyeongsangbuk-do, Korea
President Oh-Hyun Kwon Phil-Young Kim
Merger Ratio 1 0.2056163 ※ We acquired Hainan Fiber Optics Korea Corp. without issuance of new shares as the Company already held 100% ownership of
the equity. B. Post Merger Financial Information
[Samsung LED] (Unit: KRW million)
Predecessor Company Account
Year 2 (2012)
Reason for Difference Forecast Actual
Forecast Vs.
Actual Ratio
Samsung LED
Revenue 2,381,405 1,587,265 33%
IT market and lighting business stagnation Operating
Profit 258,250 -54,283 121%
EBIT 234,507 -76,422 133%
※ For Year 1 (2011), please refer to the Audited Financial Statement of Samsung LED.

Samsung Electronics 2014 Business Report 171 / 171
[Samsung Electronics Hainan Fiber Optics Korea] (Unit: KRW million)
Predecessor Company Account
Year 1 (2012)
Reason for Difference Forecast Actual
Forecast Vs.
Actual Ratio
SEHF-K
Revenue 1,111,692 1,086,135 2%
Decrease of profitability of Touch Screen Panel Business
Operating Profit 33,366 5,121 85%
EBIT 31,517 1,008 97%
※ For Year 2 (2013), separate financial results are difficult to determine as the business was incorporated into the IM Division.
9. Green Management
The Company is actively securing “Green Technology Certifications” to follow the Low Carbon Green Growth policy of the Korean government.
(Green Technology Certification)
The Company is acquiring Green Technology Certifications in accordance with Clause 2, Article 32 of the Framework Act on Low Carbon Green Growth. Green technology development is a part of our “Planet First” strategy, which strives to conduct business activities in a manner that respect people and nature. Since the certification system was introduced in 2010, the Company has secured 37 valid Green Technology Certifications as of December 31, 2014. In addition, the Company has acquired 22 ‘Green Technology’ product certificates (412 models), for commercialized products. Meanwhile, the Company withdrew the application for its Giheung/Hwasung Campus to be re-certified as a Green Company Campus, and as of April 5, 2013, the Giheung/Hwasung Campus designation as a Green Company Campus was canceled.
Certified Green Technologies as of December 31, 2014 are as follows:
Division Business Name of green technology and green projects No.
CE Eco Bubble washing technology, etc. 23
IM Membrane laminated air filter for telecommunication base transceiver stations;
Low power consumption cooling, heating, and controlling humidity, etc. 8
DS
Semiconductor (Sub-Division)
3-bit NAND Flash semiconductor design technology, etc. 5
DP Transparent LCD Display technology, etc. 1
Total 37
※ The data reported above is with respect to Samsung Electronics Co., Ltd. only.
※ See 『11. Other Information (B. Environmental regulations)』 in 『II. Businesses Overview』 for greenhouse gas emission and
energy use.