for your information · the independent hearing panel has asked further questions in respect of...
TRANSCRIPT

Memorandum For Your Information
To: The Independent Hearing Panel for the proposed
Southland Water and Land Plan
From: Roger Hodson
Date: Wednesday, 12 July 2017
File Reference: pSWLP
Subject: Response to Hearing Panel Question’s 12 June
Message:
At the hearing for the proposed Southland Water and Land Plan on 12 June 2017, two Memoranda were tabled, being: (1) Memorandum from Roger Hodson in respect of Setbacks dated 25 May 2017; and (2) Memorandum from Roger Hodson in respect of Site Exceedance dated 9 June 2017. . The Independent Hearing Panel has asked further questions in respect of those memoranda. The questions and my responses are set out below. (1) Memorandum – Setbacks. Question: Figure 1.0 on page 10 shows a large amount of data scatter, accordingly:
1. What is the correlation coefficient for the first formula in the figure (slopes from 0 to 10
degrees)?
Response:
The figure (referred to as figure 1.0 in previous memorandum) in question is reproduced from Figure
4 on page 81 of Zhang et al. (2010). The units of the ‘x’ axis are in % slope not degrees. Zhang et al.
(2010) use the model illustrated to define the break point where the relationship between buffer
slope and sediment removal efficiency changes from positive to negative. The inflection point is
estimated to be 10% slope, with a 95% confidence interval of 8.14 to 11.725 % slope.
Zhang et al. (2010) go on to select a final model for predicting sediment removal efficacy (Table 3 on
page 82 of Zhang et al. (2010)). For sediment removal the R2 value increased from 0.373 to 0.654
when vegetation (mixed grass and trees or grass/trees only) buffer slope and buffer width (soil

- 2 -
drainage type was not statistically significant) were added to the final model. The authors provide a
segmented linear model, and I have used equations for mixed grass and trees vegetative cover,
equation “a” for slopes less than 10% and equation “c” for slopes greater than 10% (from table 3 on
page 82 of Zhang et al. (2010)). Note that in table 1.0 of the memorandum dated 25 May 2017 I have
converted slopes from % to degrees.
Question:
2. What are the corresponding margins of error (i.e. plus or minus x%) in the figures presented
in Table 1.0 on that same page.
Response: In the original publication, Zhang et al. (2010) do not provide a margin of error around each of vegetation/slope/buffer width predicted contaminant removal efficiencies, and similarly I am unable to provide a margin of error for the individual estimates. However, Zhang et al. (2010) do provide a 95% confidence interval for the initial theoretical model for sediment removal by buffer width only, see figure 3(a) on page 80 of Zhang et al. (2010), reproduced in part below as figure 1.0 (note this is not the final model which included vegetation type, slope and buffer width).
Figure 1. Sediment removal efficacy vs buffer width. From figure 3(a) on p. 80 of Zhang et al. (2010).

- 3 -
(2) Memorandum – Site Exceedance Question: For each of Tables 1.0 to 6.0 could Mr Hodson please provide the monitoring period? For example, Figures 1.0 and 3.0 indicate that the monitoring period for Tables 1.0 and 3.0 is 2012 to 2106, does that mean five calendar years? Response: I can confirm that the monitoring periods for each of the figures reproduced in the memorandum dated 9 June 2017 are the same as those that were produced in the opening presentation on 22 May 2017. I have tabulated the respective monitoring periods for each figure below (Table 1.0)
Figure number (9 June 2017 Memorandum) Monitoring period
1.0 Secondary Contact Recreation January 2012 – December 2016 (5 years)
2.0 Primary Contact Recreation December 2011 – March 2016 ( 5 summer monitoring periods)
3.0 Lakes – Total Nitrogen January 2012 – December 2016 (5 years)
4.0 Lakes Phytoplankton January 2012 – December 2016 (5 years)
5.0 Slime algae – Periphyton in Rivers Summer 2001/2002 – Summer 2010/2012, n ≥ 6 *
6.0 Macroinvertebrate Community Index Summer 2009/10 – Summer 2013-14 ( 5 years), n ≥ 3
*Assessment provided from predicted level of benthic periphyton (chlorophyll-a) and frequency, i.e. level exceeded 8% (1 month) of the time for the default class and 17% (2 months) for the productive class, using the site mean and the exponential distribution. As described in opening presentation on 22 May 2017, and in Snelder et al. (2013).

- 4 -
References Snelder, T., Biggs, B., Kilroy, C., Booker, D. 2013. National Objective Framework for periphyton. Prepared for Ministry for the Environment. NIWA Client Report No:CHC2013-122 http://www.mfe.govt.nz/sites/default/files/national-objective-framework-periphyton.pdf Zhang, X., Liu, X., Zhang, M., Dahlgren, R., A. 2010, A Review of Vegetated Buffers and a Meta-analysis of Their Mitigation Efficacy in reducing Nonpoint Source Pollution. Journal of Environmental Quality
TECHNICAL REPORTS
76
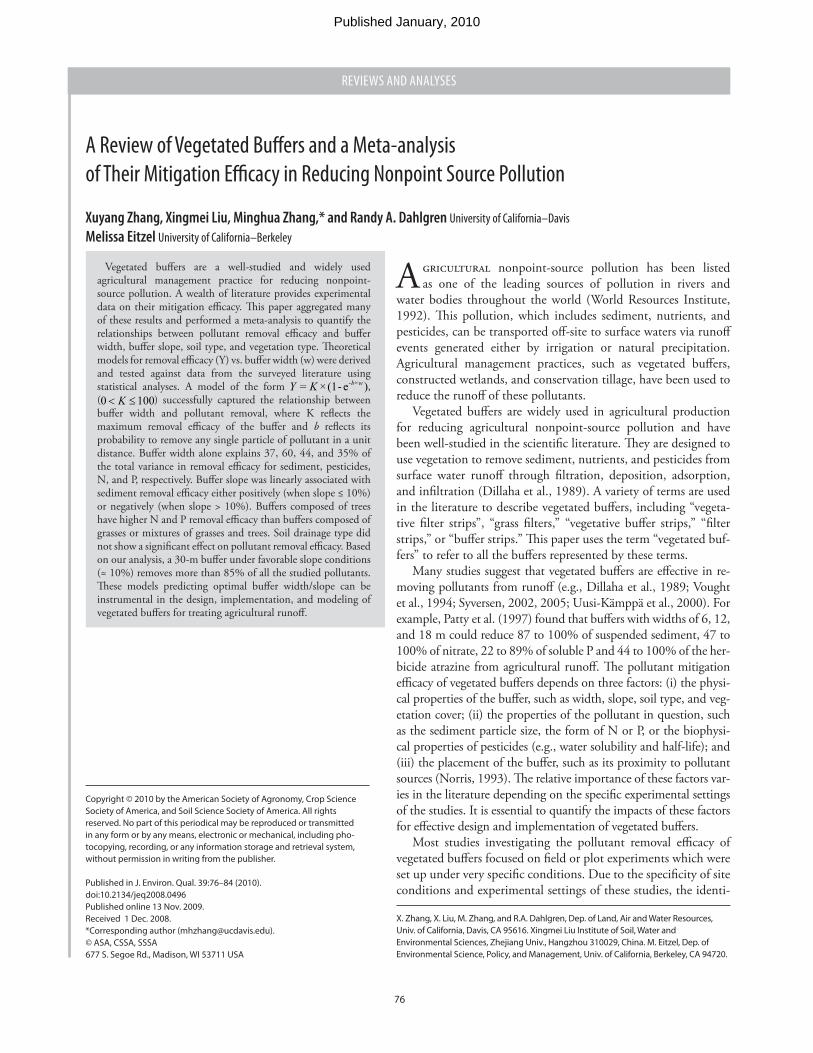
Vegetated buff ers are a well-studied and widely used agricultural management practice for reducing nonpoint-source pollution. A wealth of literature provides experimental data on their mitigation effi cacy. Th is paper aggregated many of these results and performed a meta-analysis to quantify the relationships between pollutant removal effi cacy and buff er width, buff er slope, soil type, and vegetation type. Th eoretical models for removal effi cacy (Y) vs. buff er width (w) were derived and tested against data from the surveyed literature using statistical analyses. A model of the form - ×= ×(1- e )b wY K , (0 100K< ≤ ) successfully captured the relationship between buff er width and pollutant removal, where K refl ects the maximum removal effi cacy of the buff er and b refl ects its probability to remove any single particle of pollutant in a unit distance. Buff er width alone explains 37, 60, 44, and 35% of the total variance in removal effi cacy for sediment, pesticides, N, and P, respectively. Buff er slope was linearly associated with sediment removal effi cacy either positively (when slope ≤ 10%) or negatively (when slope > 10%). Buff ers composed of trees have higher N and P removal effi cacy than buff ers composed of grasses or mixtures of grasses and trees. Soil drainage type did not show a signifi cant eff ect on pollutant removal effi cacy. Based on our analysis, a 30-m buff er under favorable slope conditions (≈ 10%) removes more than 85% of all the studied pollutants. Th ese models predicting optimal buff er width/slope can be instrumental in the design, implementation, and modeling of vegetated buff ers for treating agricultural runoff .
A Review of Vegetated Buff ers and a Meta-analysis
of Their Mitigation Effi cacy in Reducing Nonpoint Source Pollution
Xuyang Zhang, Xingmei Liu, Minghua Zhang,* and Randy A. Dahlgren University of California–Davis
Melissa Eitzel University of California–Berkeley
Agricultural nonpoint-source pollution has been listed
as one of the leading sources of pollution in rivers and
water bodies throughout the world (World Resources Institute,
1992). Th is pollution, which includes sediment, nutrients, and
pesticides, can be transported off -site to surface waters via runoff
events generated either by irrigation or natural precipitation.
Agricultural management practices, such as vegetated buff ers,
constructed wetlands, and conservation tillage, have been used to
reduce the runoff of these pollutants.
Vegetated buff ers are widely used in agricultural production
for reducing agricultural nonpoint-source pollution and have
been well-studied in the scientifi c literature. Th ey are designed to
use vegetation to remove sediment, nutrients, and pesticides from
surface water runoff through fi ltration, deposition, adsorption,
and infi ltration (Dillaha et al., 1989). A variety of terms are used
in the literature to describe vegetated buff ers, including “vegeta-
tive fi lter strips”, “grass fi lters,” “vegetative buff er strips,” “fi lter
strips,” or “buff er strips.” Th is paper uses the term “vegetated buf-
fers” to refer to all the buff ers represented by these terms.
Many studies suggest that vegetated buff ers are eff ective in re-
moving pollutants from runoff (e.g., Dillaha et al., 1989; Vought
et al., 1994; Syversen, 2002, 2005; Uusi-Kämppä et al., 2000). For
example, Patty et al. (1997) found that buff ers with widths of 6, 12,
and 18 m could reduce 87 to 100% of suspended sediment, 47 to
100% of nitrate, 22 to 89% of soluble P and 44 to 100% of the her-
bicide atrazine from agricultural runoff . Th e pollutant mitigation
effi cacy of vegetated buff ers depends on three factors: (i) the physi-
cal properties of the buff er, such as width, slope, soil type, and veg-
etation cover; (ii) the properties of the pollutant in question, such
as the sediment particle size, the form of N or P, or the biophysi-
cal properties of pesticides (e.g., water solubility and half-life); and
(iii) the placement of the buff er, such as its proximity to pollutant
sources (Norris, 1993). Th e relative importance of these factors var-
ies in the literature depending on the specifi c experimental settings
of the studies. It is essential to quantify the impacts of these factors
for eff ective design and implementation of vegetated buff ers.
Most studies investigating the pollutant removal effi cacy of
vegetated buff ers focused on fi eld or plot experiments which were
set up under very specifi c conditions. Due to the specifi city of site
conditions and experimental settings of these studies, the identi-
X. Zhang, X. Liu, M. Zhang, and R.A. Dahlgren, Dep. of Land, Air and Water Resources,
Univ. of California, Davis, CA 95616. Xingmei Liu Institute of Soil, Water and
Environmental Sciences, Zhejiang Univ., Hangzhou 310029, China. M. Eitzel, Dep. of
Environmental Science, Policy, and Management, Univ. of California, Berkeley, CA 94720.
Copyright © 2010 by the American Society of Agronomy, Crop Science
Society of America, and Soil Science Society of America. All rights
reserved. No part of this periodical may be reproduced or transmitted
in any form or by any means, electronic or mechanical, including pho-
tocopying, recording, or any information storage and retrieval system,
without permission in writing from the publisher.
Published in J. Environ. Qual. 39:76–84 (2010).
doi:10.2134/jeq2008.0496
Published online 13 Nov. 2009.
Received 1 Dec. 2008.
*Corresponding author ([email protected]).
© ASA, CSSA, SSSA
677 S. Segoe Rd., Madison, WI 53711 USA
REVIEWS AND ANALYSES
Published January, 2010

Zhang et al.: Vegetated Buff ers and Their Effi cacy in Reducing Nonpoint Source Pollution 77
fi ed relationships between buff er effi cacy and associated factors
were often inconsistent. To obtain a systematic understanding
of vegetated buff er mitigation effi cacy, results from studies con-
ducted under diff erent experimental settings and site condi-
tions should be compared with this in mind and synthesized to
obtain general insights.
Due to the multi-pollutant nature of agricultural runoff ,
studies must also compare the buff er removal effi cacy for mul-
tiple pollutants. Existing review papers addressing the effi cacy of
vegetated buff ers are either focused on a single type of pollutant
such as sediment (Liu et al., 2008), N (Mayer et al., 2007), P
(Dorioz et al., 2006), or pesticides (Reichenberger et al., 2007,
Otto et al., 2008); or they cover multiple types of pollutants in a
descriptive nature (Muscutt et al., 1993). Although these review
papers synthesized information on the effi cacy of vegetated buf-
fers, they did not provide a statistical analysis for the results of
the studies reviewed, nor did they determine a theoretical frame-
work for the relationship between the pollutant removal effi cacy
of buff ers and their key design factors. Th erefore, the objectives
of this paper were (i) to aggregate data from studies on the miti-
gation effi cacies of vegetated buff ers for removing sediment, N,
P, and pesticides; and (ii) to quantify the relationships between
pollutant removal effi cacy and buff er design factors through the-
oretical models and statistical analysis of the aggregated data.
Materials and MethodsLiterature Review
A total of 73 studies published in peer reviewed journals
provided quantitative results on pollutant removal by vegetated
buff ers, of which 63 were original studies and 10 were literature
reviews. Th ese papers were carefully examined to record detailed
information on author, year, location, buff er width, slope, area
to source ratio, pollutant type, soil type, vegetation type, infl ow
pollutant mass and concentration, outfl ow pollutant mass and
concentration, and percent of pollutants trapped by buff ers.
Surveyed data were compiled to perform meta-analyses for
buff er design factors: width, slope, vegetation type, and soil
drainage type (see Supplemental Table S1 in the supplemental
information). A total of 81 data points were collected on buff er
width, slope, vegetation type, and soil drainage type for sedi-
ment removal (Table 1). Few data were available on slope for
removal of N, P, and pesticides, however, more than 49 data
points were identifi ed for the other three variables. Diff erent
forms of N and P were reported in surveyed studies and were
pooled for statistical analysis to ensure power. Th e forms of N
were total N (44%), nitrate (46%), and ammonium (10%).
Th e forms of P were soluble P (48%) and total P (52%).
Theoretical Framework: Buff er WidthBoth “width” and “length” have been used in the literature
to describe the dimension of buff ers, depending on their shape.
Here we defi ne “buff er width” as the dimension parallel to run-
off fl ow. Studies on buff er effi cacy frequently reported that wider
buff ers removed more pollutants, but they often did not quantify
the relationship between buff er width and pollutant removal effi -
cacy. Qualitatively, one would expect that the pollutant reduction
would increase as width increases, at some point reaching a limit
where further increasing the buff er width will not substantially
increase the effi cacy. Th is expectation was based on two reasons.
First, while infi ltration is taking place, pollution mass is lost to
infi ltration with each successive unit of buff er width. Second, the
most easily trapped forms (e.g., large sediments) of pollutants will
be easily trapped in the upper buff er while the smaller particles (or
soluble forms) will be more diffi cult to trap. Th erefore, a point will
be reached where eff ectively all of the pollutant has been removed
and additional buff er width will make little diff erence.
Th e quantity we have chosen to model with respect to pol-
lutants is the total mass of the pollutant removed by the buff er.
We chose mass over concentration because mass balance is of-
ten used to study environmental transport of pollutants. If data
on actual pollutant mass measurement did not exist, mass was
calculated by multiplying concentration and fl ow. Th e removal
effi cacy can be defi ned in the following equation:
-= ×100% = 1- ×100%i f f
i i
m m mY
m m
⎛ ⎞ ⎛ ⎞⎜ ⎟ ⎜ ⎟⎝ ⎠ ⎝ ⎠
[1]
where Y is the percent effi cacy, mi is the mass of the pollutant
infl ow into the buff er, and mf is the mass of the pollutant
outfl ow from that same buff er (Fig. 1).
Assuming the runoff water is a well mixed column and
contains pollutants both in dissolved and adsorbed phases. We
make the following assumption:
Th e probability that any given amount of pollutant will be
removed by the buff er is constant for a given distance traveled
through the buff er.
If the probability of removal is constant, then the decrease in
pollutant mass with distance is proportional to the mass itself:
Table 1. Summary of collected data.
Variables Sediment Nitrogen Phosphorus Pesticides
Number of study sites 27 10 10 4
Number of buff ers 56 22 19 8
Data on buff er width 81 61 52 49
Data on buff er slope 79 12 8 0
Data on vegetation 81 61 52 49Data on soil drainage type
81 61 52 12
Fig. 1. Model variables in an illustrated vegetated buff er. mi is the mass infl ow of pollutant and mf is the mass outfl ow of the pollutant after exiting a buff er of width w.

78 Journal of Environmental Quality • Volume 39 • January–February 2010
= -dm
b×mdx
[2]
where m is the mass of the pollutant, x is the distance into the
buff er, and b is the probability of removal per unit length for a
given pollutant (here defi ned as constant with respect to x). Th e
solution to this diff erential equation is of the form:
-= ×e bxm A [3]
Using the following boundary conditions (from the defi nition
of effi cacy in Eq. [1]):
at x = 0, m = mi; at x = w, m = m
f [4]
where w is the total width of the buff er (Fig. 1), we fi nd that
imA = and that
= e-b×wf
i
mm
[5]
Substituting Eq. [5] into Eq. [1] yields the following relationship
between effi cacy (Y) and buff er width (w):
( )-= 1- e ×100%b×wY [6]
Th is equation should hold for each of the pollutants in question
(with a diff erent value of b for each pollutant) as long as Eq.
[2] holds and the probability of removal per unit length (b) is
constant within the buff er.
In practice, a constant (K) must be introduced to fi t the data:
e-b×wY = K×(1- ) , 0 100K< ≤ [7]
Th is constant refl ects the practical limit on the ability of a
vegetated buff er to remove a pollutant from runoff . Th is
quantity is developed further in the discussion section.
Th e assumption used to derive Eq. [2] is reasonable based on
two reasons. First, removal of dissolved pollutants by infi ltration,
which is the major mechanism, is proportional to the mass of water
that infi ltrates. For example, when saturated hydraulic conductiv-
ity is attained, infi ltration becomes constant. In this case change in
pollutant mass per unit width is also constant. Second, the main
mechanism for removal of adsorbed pollutant is sedimentation and
sorption. Both processes are dependent on initial pollutant mass.
However, this is a gross oversimplifi cation. Th e assumption
does not hold on the following conditions where: (i) water to-
tally infi ltrates within a buff er and no outfl ow occurs at the end
of the buff er; (ii) additional pollutant mass is released from the
buff er itself; and (iii) the probability that the particle will be re-
moved depends on the runoff velocity, particularly for the case
of sediment, in which velocity decreases due to friction as the
runoff travels through the buff er. Nevertheless, this assumption
captures the basic behavior of pollutants in the buff er and can
be applied to all the pollutants studied in this meta-analysis.
Theoretical Framework: Eff ect of
Buff er Slope on Sediment RemovalAs buff er slope increases, runoff velocity increases, reducing
the residence time of runoff in the buff er and reducing removal
effi cacy. Th ere is evidence, however, that a slight slope facilitates
runoff and encourages laminar fl ow across the buff er, increas-
ing removal effi cacy (Wenger, 1999). Modeling the eff ects of
slope on laminar fl ow and residence time are beyond the scope
of this paper; however, the data can be fi t with a segmented lin-
ear model (broken-stick model) to refl ect the change in regime,
such as increased laminar fl ow and decreased residence time.
Th is is done by choosing a critical slope, Sc, at which the latter
eff ect dominates and the effi cacy begins to decrease. Th e two
regimes are then independently fi t to the data as follows;
Y = α + β1 × x – β2 × (x –Sc) × I [8]
Where x is the slope of the buff er in percent, Y is the pollutant
removal effi cacy, and α, β1 and β
2 are fi tting parameters. Th e
breakdummy I = 1 if x is greater than the break value Sc, or 0
otherwise. Th e model can be rewritten to the following form:
1
1 2 2
+ × x when slope=
+ ( - )× + × when slope >
α β ≤⎧⎨α β β β⎩
c
c c
SY
S x S [9]
Th is model constrains the two lines to join. Th e values of the
break point Sc, α, β
1, and β
2 can be estimated using a nonlinear
algorithm (Piegorsch and Bailer, 2005).
Theoretical Framework: Vegetation and Soil
Type Classifi cationDiff erent vegetation types may remove diff erent pollutants
with varying effi cacies. Th e studies reviewed in this paper gave
species names in many cases, but this study group vegetation
using a functional classifi cation scheme. Many grasses will func-
tion similarly in a vegetated buff er, and many trees will function
similarly in a buff er. In the analysis, vegetation type was classed
as either grasses, trees, or a mixture of grasses and trees.
In the literature, soil type was described in a variety of ways,
including ‘sandy’ or ‘clay’ and in a few cases information was
given regarding percentage of sand, silt, and clay. To simplify this
variable, the soil type was categorized by how well the soil drains.
Th is classifi cation captures the functional eff ect of soil type on
effi cacy, because how well the soil drains will aff ect infi ltration of
runoff water. In the analysis, soil drainage types were classifi ed as
well drained, moderately drained, and poorly drained.
Since the variables of vegetation type and soil drainage type
are categorical, dummy variables were used in the analysis to
indicate vegetation and soil drainage type: trees (Veg1 = 1),
mixture of grasses and trees (Veg2 = 1), and grasses (Veg1 =
Veg2 = 0); and well drained (Sol1 = 1), moderately drained
(Sol2 = 1), and poorly drained (Sol1 = Sol 2 = 0).
Statistical AnalysisTh is section describes the statistical analyses which test the
fi t of the aggregated data to Eq. [7] and [8]. Th e aggregated
effi cacy data extracted from the reviewed studies were analyzed
using a set of statistical procedures. Boxplots were created to
examine the distribution of effi cacy values. Th e relationship
between pollutant removal effi cacy and buff er width was fi tted
to the theoretical model as shown in Eq. [7] using nonlinear

Zhang et al.: Vegetated Buff ers and Their Effi cacy in Reducing Nonpoint Source Pollution 79
regression analysis. Th e relationship between buff er slope and
sediment removal effi cacy was fi tted to the segmented linear
regression model as shown in Eq. [8]. A preliminary statistical
model with all the variables including buff er width, slope, veg-
etation type, soil drainage type, and site was built and tested for
the signifi cance of each independent variable. Statistical tests
were performed to test the interactions among these variables.
Results indicated that none of these interaction terms were sig-
nifi cant; therefore the models were built without them.
A fi nal model was built based on the independent variables
that were found to be statistically signifi cant. To examine the dif-
ferences between and within study sites, a mixed eff ect model was
fi rst built with a random error associated with site. However, the
parameter of site and its associated random error were found to be
not signifi cant with P values > 0.8 for all pollutant models. Th ere-
fore, site was removed from the models. Statistical diagnostics (in-
cluding the normal probability plot of residuals, a plot of the re-
siduals vs. the fi tted values, and a histogram of the residuals) were
used to determine whether the residuals met the statistical analysis
assumptions (in particular the normality and constant variance as-
sumptions). Models were selected based on their goodness-of-fi t
measures such as the R2 value and adjusted R2 value. All the statis-
tical analyses were performed using SAS 9.1 (SAS Institute Inc.,
2004) and SigmaPlot 10 (Kuo and Fox, 1993).
Results and DiscussionPollutant Removal Effi cacy
Figure 2 shows the distribution of removal effi cacy values of veg-
etated buff ers grouped by pollutants across a range of widths (0.5–
35 m) and slopes (2–16%). Th e median removal effi cacy is highest
for pesticides (88%), followed by sediment (86%), P (71.9%), and
N (68.3%). Sediment removal effi cacy has the lowest standard de-
viation (14.4) of the four pollutants with a range of 45 to 100%
(Daniels and Gilliam, 1996; Patty et al., 1997). In contrast, N re-
moval effi cacy has the widest range (2.2–99.9%) and standard de-
viation (21.1). Phosphorus removal effi cacy has a smaller range (22–
96.3%) than N, but the same standard deviation (21.1). Pesticide
removal effi cacy varies the most (standard deviation = 28.5) with a
wide range in effi cacy (4.2–99.9%) (Murphy and Shaw, 1997; Patty
et al., 1997; Watanabe and Grismer, 2001) (Fig. 2).
Eff ects of Buff er WidthRegression equations and parameter estimates from the fi t
of the data to the theoretical model (Eq. [7]) are summarized
in Table 2. Estimates of K, which represents the maximum re-
moval effi cacy of the buff er, ranged from 89.5 to 93.2. Esti-
mates of parameter b, which refl ects the probability of removal
per unit distance of a given particle of pollutant, ranged from
0.157 to 0.446. All the models were statistically signifi cant
(P < 0.001) with R2 values of 0.373, 0.597, 0.437, and 0.352
for sediment, pesticide, N, and P, respectively (Table 2).
Figure 3 shows the relationship between buff er width and
pollutant removal effi cacy for sediment (Fig. 3a), pesticides
(Fig. 3b), N (Fig. 3c), and P (Fig. 3d). In all cases, as is ex-
pected for an exponential function such as Eq. [7], the removal
effi cacy increases quickly with increase in buff er width and the
rate of increase becomes smaller as the buff er gets wider until
the effi cacy approaches a maximum value (the removal capac-
ity). Of the buff ers studied for sediment removal, 97% were <
20 m in width and more than 60% were <10 m. Buff er widths
from pesticide removal studies range from 0.5 to 18 m. Re-
moval capacity for pesticides was the highest of the four pollut-
ants with pesticide removal effi cacy reaching as high as 93.2%
(Fig. 3b). More than 96% of the buff ers studied for N and P
removal were < 20 m wide. Nitrogen and P removal effi cacy
showed a similar pattern, though N removal effi cacy reaches
Fig. 2. Boxplot of pollutant removal effi cacy values. The lower and upper boundary of the box indicates the 25th and 75th percentile, respectively. A line within the box marks the median. Bars above and below the box indicate the 90th and 10th percentiles. The hollow circles represent observations that are not within the range of the 10th to 90th percentile. The numbers displayed next to the boxes are the median value of removal effi cacy. Sample sizes are 81, 49, 61, and 52 for sediment, pesticide, N (includes various forms of nitrogen), and P (includes various forms of P), respectively.
Table 2. Nonlinear regression models and parameter estimates using buff er width as the independent variable.
Pollutant
Y = K × (1 – e-bx) Estimate of K Estimate of bN R2 SE† P K SE‡ P b SE§ P
Sediment 81 0.373 11.44 <0.001 90.9 1.96 <0.001 0.446 0.047 <0.001
Pesticide 52 0.597 18.30 <0.001 93.2 5.86 <0.001 0.215 0.045 <0.001
Nitrogen 61 0.437 15.94 <0.001 92.0 6.40 <0.001 0.160 0.028 < 0.001
Phosphorus 52 0.352 17.18 <0.001 89.5 7.47 <0.001 0.157 0.033 < 0.001
† Residual standard deviation of regression model.
‡ Standard error of the estimate of K.
§ Standard error of the estimate of b.

80 Journal of Environmental Quality • Volume 39 • January–February 2010
a slightly higher removal capacity (92%) than P (89.5%) (Fig.
3c, 3d).
Interpretation of K and bTh e meta-analysis results demonstrate that the relationship
between pollutant removal effi cacy and buff er width can be de-
scribed by a model of the form - ×= ×(1- e )b wY K , (0 1K< ≤ 00).
Although the maximum removal capacity K can be 100 accord-
ing to the model, the estimate of K is always smaller. Th ere are
several reasons for this fi nding. First, the variance of data for
statistical estimates of K is essentially the mean of the removal
capacities of many diff erent buff ers built under various experi-
mental designs. For a given pollutant, some designs may have a
low probability for pollutant removal and therefore have a low
effi cacy for a given width, pulling down the overall removal av-
erage. Second, if our simplifi ed model has overlooked mecha-
nisms that have a signifi cant impact on effi cacy as a function
of distance, the inadequacy of the model itself may result in a
low value of K for a given pollutant. For instance, additional
nutrients may be released from vegetation or soil during trans-
port through the buff er (Chaubey et al., 1995; Lowrance and
Sheridan, 2005), and this may cause nutrient mass in outfl ows
to be higher than our theoretical model can predict because it
assumes no new pollutant is added within the buff er. Finally,
chemical partitioning between the water and sediment column
maintains pollutant residues in water as long as the amount of
runoff water is not zero.
Although K is an estimate of the practical limit on the effi cacy
of a buff er, some of our data points reach 100% effi cacy. Th ese
data might be from situations where no runoff water fl ows out of
the buff er, in which our model does not hold. Another possible
reason is that there is an analytical detection threshold for each
pollutant below which no pollutant will be detected despite the
continued presence of the pollutant in runoff . Th is threshold
indicates that the pollutant may be present at low concentrations
despite the fact that the analytical analysis does not detect it.
Although our analysis is based on the assumption that the prob-
ability of pollutant removal by the buff er is constant with respect
to distance traveled through the buff er, more sophisticated models
can be built by more realistically modeling the probability of re-
moval as a function of x. Many studies have shown that removal
effi cacy may be high in the fi rst few meters of a buff er but decreases
as pollutants travel through the buff er. For example, accumulation
of sediment changes the microtopography of a buff er and turns
the runoff fl ow from laminar to concentrated fl ow (Gharabaghi et
al., 2006). In this case, b could be described as a function of micro-
topography and fl ow rate. In addition, the estimates of b increase
in the order of P, N, pesticide, and sediment indicating that b may
be associated with solubility of the pollutant. Further research is
needed to investigate the underlying source/sink processes for each
pollutant to model the effi cacy when the probability of pollutant
removal in a buff er is not constant throughout the buff er. Th is can
be realized when more data become available in the future.
Eff ects of Buff er SlopeIn the literature reviewed, buff er slope varied from 2% (Dan-
iels and Gilliam, 1996, Van Dijk et al., 1996) to as high as 16%
(Dillaha et al., 1989). Th e break point (Sc) where the relation-
ship between buff er slope and sediment removal effi cacy changes
from positive to negative is estimated to be 10% with a 95% of
confi dence interval of 8.14 to 11.72%. Figure 4 shows the fi t of
the data to the proposed model (Eq. [8]) which is as follows:
Fig. 3. Pollutant removal effi cacy vs. buff er width for each pollutant. Black dots are data and lines are model predictions. Dotted red lines indicate 95% confi dence band. The limiting value of K is shown in pink with a dotted line. Details of the model are given in each fi gure for (a) sediment, (b) pesticides, (c) N, and (d) P.

Zhang et al.: Vegetated Buff ers and Their Effi cacy in Reducing Nonpoint Source Pollution 81
71.02 + 2.49× when slope 10%=
134.09 -3.86× when slope > 10%
≤⎧⎨⎩
xY
x [10]
As shown in Eq. [10], the parameters α, β1, and β
2 are estimated to
be 71.02 (SE = 3.65), 2.49 (0.67), and –3.86 (1.14), respectively.
All the estimates are statistically signifi cant with P values < 0.001.
Sediment removal effi cacy increases as slopes increase from 0
to 10%. Buff ers steeper than 10% become less eff ective with
increasing slope (Fig. 4). Th e fi t to our aggregated data suggests
that with 95% confi dence, a slope between 8.14 and 11.72% is
optimum for removing sediments by vegetated buff ers.
Eff ects of Vegetation Type and Soil Drainage TypeTh e impacts of vegetation type on pollutant removal effi cacy
were statistically signifi cant for all pollutants except pesticides.
Buff ers composed of only grasses or trees remove more sediment
than that with mixed grasses and trees (Table 3). For N and P
removal, vegetation composed of trees has a higher removal ef-
fi cacy than vegetation composed of grasses or mixed grasses and
trees (Table 3). Th e impact of soil drainage type on pollutant
removal effi cacy was not statistically signifi cant (Table 3) and
therefore, soil drainage type was not included in the fi nal model.
Models which include all selected factors are shown in Table 3,
with R2 values of 0.654, 0.492, 0.475, and 0.597 for sediment,
N, P, and pesticides, respectively. Th e P values of these models
show that the models were all highly signifi cant (Table 3).
Sediment Removal Effi cacyVegetated buff ers are generally eff ective in removing sediment
from runoff . Buff er width, slope, and vegetation type are impor-
tant factors for designing an eff ective buff er. Buff er effi cacy is more
sensitive to a change in width at smaller widths, as expected for an
exponential relationship. Table 4 shows that, increasing the buff er
width from 5 to 10 m would increase sediment removal effi cacy
by 10 to 15%. With a 10% slope, a 20-m buff er composed of
only grasses or trees would remove almost all the sediment from
runoff (Table 4). Th e results illustrated that increasing width to
more than 20 m does not appreciably increase removal effi cacy.
Th is is due to the fact that large soil aggregates (> 40 μm in diam-
eter), sand and silt particles are deposited by sedimentation within
the fi rst few meters of the buff er (Gharabaghi et al., 2006), while
small aggregates and fi ne clay particles are removed by infi ltration
in a wider buff er. When the infi ltration rate is lower than fl ow rate,
fi ne particles are unlikely to be removed from the water column.
A vegetated buff er with a slope of about 10% (8.1–11.7%)
is optimum for sediment removal. Increasing buff er slope from
5 to 10% would increase sediment removal effi cacy by about
10%, while increasing slope from 10 to 16% would reduce the
sediment removal effi cacy by about 20% (Table 4). A slight slope
(≤ 10%) may facilitate runoff and laminar fl ow over the buff er.
In contrast, increased steepness (> 10%) could increase the fl ow
velocity of the runoff water, reducing residence time of runoff
water and therefore reducing sediment trapping effi cacy.
Buff ers composed of only grass species or trees remove more
sediment as compared with buff ers composed of a mixture of
grasses and trees. Th e data for mixed grasses and trees were main-
ly from two studies, Schmitt et al. (1999) and Väänänen et al.
(2006). Schmitt et al. (1999) planted young trees and shrubs in
the lower half of vegetated buff ers and found no impact on fi lter
performance, while the buff ers in the Väänänen et al. (2006)
study had very low effi cacies due to high runoff volume and
velocity. Th ese signifi cantly lower effi cacies might be caused by
other factors such as placement of trees and runoff velocity.
R2 values for sediment removal increased from 0.373 to 0.654
when vegetation and slope were added as additional independent
variables, indicating the signifi cant impact of slope and vegetation
in addition to buff er width in accounting for variation in the data.
Th e full model with buff er width, vegetation type, and slope ex-
plained 66% of the total variance in buff er effi cacy. Since the non-
linear model contains linear components (slope, vegetation type,
and soil type), it is inevitable to have predictions of Y over 100. In
this case, the value of 100 was assigned to the removal effi cacy.
Th e unexplained variation in sediment removal effi cacy could be
due to other factors, such as the type of runoff fl ow. For example,
shallow, uniform fl ow is essential in maintaining a high pollutant
Fig. 4. Correlation between sediment removal effi cacy and buff er slope.

82 Journal of Environmental Quality • Volume 39 • January–February 2010
removal effi cacy in vegetated buff ers. Helmers et al. (2005) found
through modeling buff er sediment trapping that as the convergence
of overland fl ow increases, sediment-trapping effi cacy is reduced.
Dosskey et al. (2002) revealed that the “eff ective buff er area”, which
is the area of the buff er that fi eld runoff would encounter, accounted
for 6 to 81% of the total buff er area. Th e modeled sediment trap-
ping effi cacy ranged from 15 to 43% for the eff ective area compared
to 41 to 99% for the total area (Dosskey et al., 2002). Th ese results
refl ected the extent of concentrated fl ow and its subsequent impact
on sediment-trapping effi cacy (Dosskey et al., 2002). Th erefore, the
maintenance of sheet fl ow, which is typically diffi cult, is very impor-
tant in maintaining sediment removal effi cacy. Because our model
does not include this factor, the higher degree of variance which is
not accounted for is expected. Th e actual sediment removal effi cacy
may be lower than predicted under concentrated fl ow conditions
and we did fi nd a lower sediment removal effi cacy at the watershed
scale compared to the fi eld scale.
Nitrogen and Phosphorus Removal Effi cacyVegetated buff ers are eff ective for removing N and P, with re-
moval effi cacy of 92% and 89.5%, respectively. Th e models sug-
gest that buff er width and vegetation together explain about 50%
of the variation in N removal effi cacy and 48% of the variation in
P removal effi cacy (Table 3). Increasing the buff er width from 5 to
10 m would increase the removal effi cacy by about 20% and 18%
for N and P, respectively (Table 4). A 20-m buff er removes about
91 to 100% and 97 to 100% of N and P, respectively (Table 4).
Buff ers composed of trees generally remove more N from run-
off . Th e signifi cant diff erence indicates that subsurface removal
of N may be an important mechanism since trees could better
remove N with their deeper rooting system. Th e potential impor-
tance of subsurface hydrology and biogeochemistry for N remov-
al has been suggested in a previous study (Mayer et al., 2007).
Denitrifi cation rates are often greatest when the groundwater
table is near the surface and when microbially-labile carbon and
nitrate N are in good supply (Bradley et al., 1992; DeSimone and
Howes, 1996; Groff man et al., 2002). Th e presence of oxygen is
often the controlling factor for nitrate removal since denitrifi ca-
tion is an anaerobic process and oxygen inhibits the reaction.
However, the impacts of vegetation on P removal are more
complicated. Our study found that trees generally remove
more P than grasses. Phosphorus removal also diff ers between
diff erent grass species. A study by Abu-Zreig et al. (2004) in a
fi eld near Elora, ON, Canada suggested that native grass spe-
cies were more eff ective in removing P than ryegrass and red
fescue, and McFarland and Hauck (2004) found that coastal
Table 3. Eff ects of selected variables and model statistics.
Sediment Nitrogen Phosphorus Pesticide
Buff er width Exponential Exponential Exponential Exponential
Vegetation Grasses/trees > mixed grass and trees† Trees > grasses/mixed grasses and trees
Trees > grasses/mixed grasses and trees
Not signifi cant
Soil drainage type
Not signifi cant Not signifi cant Not signifi cant Not available
Slope Positive when slope ≤ 10%Negative when slope > 10%
Not available Not available Not available
Full model (a) Slope ≤ 10%; mixed grasses and treesY = 6.9 + 2.0 × Xslope + 61.0 × (1 – e-0.35 × xwidth)
(b) Slope ≤ 10%; grasses/trees only:Y = 21.7 + 2.0 × Xslope
+ 61.0 × (1 – e-0.35 × xwidth)(c) Slope > 10%; mixed grasses and trees
Y = 64.9 – 3.8 × Xslope + 61.0 × (1 – e-0.35 × xwidth)
(d) Slope > 10%; grasses/trees onlyY = 79.7 – 3.8 × Xslope + 61.3 × (1 – e-0.35 × xwidth)
(a) Mixed grasses and trees/grasses only
Y = 10.2 + 91.4 × (1 – e-0.11 × xwidth)(b) Trees only
Y = 23.9 + 91.4 × (1 – e-0.11 × xwidth)
(a) Mixed grasses and trees/grasses only
Y = 30.5 + 147 × (1 – e-0.03 × xwidth)(b) Trees only
Y = 59.8 + 147 × (1 – e-0.03 × xwidth)
Y = 93.2 × (1 – e-0.22 × xwidth)
Statistics R2 = 0.654 N = 81P < 0.001
R2 = 0.492 N = 61P < 0.001
R2 = 0.475 N = 52P < 0.001
R2 = 0.597 N = 49P < 0.001
† This means that buff ers with grasses only or trees only vegetation had higher pollutant removal effi cacy compared to buff ers with mixed grasses and
trees vegetation.
Table 4. Predicted pollutant removal effi cacy.
Predicted removal effi cacy, %
Buff er width = 5 m 10 m 20 m 30 m
Sediment (a) Slope = 5%; mixed grass and trees 67 76 78 78
(b) Slope = 5%; grass/trees only 82 91 93 93
(c) Slope = 10%; mixed grass and trees 77 86 88 88
(d) Slope = 10%; grass/trees only 92 100† 100 100
(e) Slope = 15%; mixed grass and trees 58 67 68 68
(f ) Slope = 15%; grass/trees only 73 81 83 83
Nitrogen (a) Mixed grass and trees/grass only 49 71 91 98
(b) Trees only 63 85 100 100
Phosphorus (a) Mixed grass and trees/grass only 51 69 97 100
(b) Trees only 80 98 100 100
Pesticide 62 83 92 93
† If predicted values exceed 100, the value of 100 was assigned instead.

Zhang et al.: Vegetated Buff ers and Their Effi cacy in Reducing Nonpoint Source Pollution 83
Bermuda grass was more eff ective in trapping P than sorghum
[Sorghum bicolor (L.) Moench] or wheat (Triticum aestivum L.).
Even though some studies indicated that soil properties can
aff ect P removal effi cacy, we did not fi nd a signifi cant eff ect as-
sociated with soil drainage type. Cooper et al. (1995) revealed
that in riparian zones the degradation of soil structure follow-
ing compaction by grazing resulted in a decrease in buff er ef-
fi cacy. Studies found higher retention effi cacy for total P and
dissolved P by sandy soil than silty clay (Magette et al., 1989;
Schwer and Clausen, 1989). However, soil drainage type as an
independent variable was not signifi cant in any of our models.
Although we were not able to obtain enough data on slope
for N and P removal, we suspect that slope would have had
signifi cant impacts on buff er effi cacy given the signifi cant
contribution of slope to the sediment removal model. Further
research on the eff ects of slope is needed to obtain a more thor-
ough understanding of N and P removal by vegetated buff ers.
Pesticide Removal Effi cacyVegetated buff ers showed high removal effi cacy for pesti-
cides. Based on our model, a buff er of 30 m could remove 93%
of the pesticides from runoff . Buff ers wider than 30 m do not
appreciably improve the removal effi cacy. Th is prediction is
mainly based on a model built with studies performed on her-
bicides, with soil and water partition coeffi cients (Koc
) ranging
from 100 to 1000. Pesticides with Koc
> 1000 (strongly hydro-
phobic), such as pyrethroids and many organophosphates, can
adsorb strongly to organic carbon in sediment. Since sediments
are easily removed by buff ers, these pesticides are more eas-
ily removed by vegetated buff ers. Th is indicates that vegetated
buff ers could be even more eff ective in removing these hydro-
phobic pesticides than the model predicts because the model is
based on pesticides with contrasting Koc
.
Buff er width alone explained over half of the variation in pes-
ticide removal effi cacy, while vegetation type did not show a sig-
nifi cant impact on pesticide removal effi cacy. Although we were
not able to obtain enough data on slope and soil type for pesticide
removal, we suspect that adding slope and soil type to the model
would help explain additional variation. Th e unexplained variation
could also be due to physiochemical properties of pesticides such as
Koc. For water soluble pesticides, infi ltration was expected to be the
main retention process, while sorption to sediments was expected
to be the main retention process for hydrophobic pesticides. How-
ever, due to the extremely skewed distribution of Koc values for the
pesticides used in the studies, we were unable to perform statistical
analyses on the eff ect of Koc. Nevertheless, the R2 value of 0.597
confi rmed that buff er width was a very important factor governing
the effi cacy of pesticide removal by vegetated buff ers.
Model UncertaintiesAlthough our models captured a reasonable amount of vari-
ance in buff er removal effi cacy, the model predictions contain
uncertainty due to three primary reasons. First, our model is
an oversimplifi cation of a complex set of processes. In addition
to the factors studied, the area of the fi eld which is the source
of the runoff , irrigation amount (simulated or natural rainfall)
and duration of the studies (days vs. months vs. years) may also
play important roles. Seasonality of vegetation within buff ers
may also cause the effi cacy to vary during diff erent times of
year. While buff ers are typically eff ective when newly installed,
their effi cacies may decrease as they age (Wenger, 1999).
Second, the environmental settings and management scenarios
of the studies vary considerably. Buff ers installed under diff erent
climate conditions may perform diff erently and require diff erent
management. Increased infi ltration by buff ers may allow pollut-
ants to reach groundwater in areas with highly permeable soil and
shallow groundwater tables. Finally, the models for N, P, and pesti-
cide removal would be greatly improved had there been enough in-
formation on buff er slope available in the literature. Th e optimum
buff er width and slope to achieve reduction for multiple pollutants
may diff er from the predictions presented in this paper. However,
the model revealed the quantitative relationships between miti-
gation effi cacies of vegetated buff ers and their width, vegetation
type, and slope. Th is information could serve as baseline data for
setting guidelines for buff er implementation and installation. In
addition, estimated parameters could facilitate further investiga-
tions on buff er effi cacy beyond fi eld scale. Researchers have initi-
ated modeling eff orts to evaluate diff erent scenarios to implement
best management practices at the watershed scale. Th eir modeling
results have been limited by lack of knowledge of the relationships
between buff er effi cacy and key buff er design factors (Arabi et al.,
2007). Th e results of this paper could be a valuable addition to the
current knowledge base and thus assist in future modeling eff orts
to study the mitigation effi cacy of vegetated buff ers.
ConclusionsTh is study quantifi ed the relationship between pollutant re-
moval effi cacy and key buff er design factors, concluding that
effi cacy is largely infl uenced by the buff er width, slope, and veg-
etation type. Statistical models found that buff er width was a
signifi cant factor in the removal of all the pollutants, explaining
37, 60, 44, and 35% of the total variance in removal effi cacy
for sediment, pesticides, N and P, respectively. Buff er slope was
shown to be signifi cantly associated with sediment removal ef-
fi cacy, with slopes in the range of 8.14 to 11.72% being optimal.
Regarding vegetation type, buff ers composed of trees have higher
N and P removal effi cacy than other vegetation types. Th e mod-
els established in this analysis are highly useful not only in the
prediction of the removal effi cacy of various pollutants, but also
in the creation of the optimal buff er design to achieve a desired
reduction of multiple pollutants simultaneously. Th ese models
can therefore provide valuable information for simulating veg-
etated buff er effi cacy at the watershed scale, which is increasingly
becoming a useful scientifi c tool for making eff ective policy and
regulation decisions to reduce nonpoint-source pollution.
Supplemental Information AvailableAggregated data from the literature review on buff er width,
vegetation type, soil drainage type and slope, as well as the
sources of the data are available as supplemental information
(Supplemental Table S1) at http://jeqscijournals.org.

84 Journal of Environmental Quality • Volume 39 • January–February 2010
AcknowledgmentsTh is work was funded by the California State Water
Resources Control Board and the Coalition for the Urban/
Rural Environmental Stewardship (CURES). We would like
to also thank the anonymous reviewers and the associate editor
for providing very helpful comments and suggestions.
ReferencesAbu-Zreig, M., R.P. Rudra, M.N. Lalonde, H.R. Whiteley, and N.K. Kaushik.
2004. Experimental investigation of runoff reduction and sediment removal by vegetated fi lter strips. Hydrol. Processes 18:2029–2037.
Arabi, M., R.S. Govindaraju, and M.M. Hantush. 2007. A probabilistic approach for analysis of uncertainty in the evaluation of watershed management practices. J. Hydrol. 333:459–471.
Bradley, P.M., M. Fernandez, and F.H. Chapelle. 1992. Carbon limitation of denitrifi cation rates in an anaerobic groundwater system. Environ. Sci. Technol. 26:2377–2381.
Chaubey, I., D.R. Edwards, T.C. Daniel, P.A. Moore, and D.J. Nichols. 1995. Eff ectiveness of vegetative fi lter strips in controlling losses of surface-applied poultry litter constituents. Trans. ASAE 38:1687–1692.
Cooper, A.B., C.M. Smith, and M.J. Smith. 1995. Eff ects of riparian set-aside on soil characteristics in an agricultural landscape: Implications for nutrient transport and retention. Agric. Ecosyst. Environ. 55:61–67.
Daniels, R.B., and J.W. Gilliam. 1996. Sediment and chemical load reduction by grass and riparian fi lters. Soil Sci. Soc. Am. J. 60:246–251.
DeSimone, L.A., and B.L. Howes. 1996. Denitrifi cation and nitrogen transport in a coastal aquifer receiving wastewater discharge. Environ. Sci. Technol. 30:1152–1162.
Dillaha, T.A., R.B. Reneau, S. Mostaghimi, and D. Lee. 1989. Vegetative fi lter strips for agricultural nonpoint source pollution-control. Trans. ASAE 32:513–519.
Dorioz, J.M., D. Wang, J. Poulenard, and D. Trevisan. 2006. Th e eff ect of grass buff er strips on phosphorus dynamics–A critical review and synthesis as a basis for application in agricultural landscapes in France. Agric. Ecosyst. Environ. 117:4–21.
Dosskey, M.G., M.J. Helmers, D.E. Eisenhauer, T.G. Franti, and K.D. Hoagland. 2002. Assessment of concentrated fl ow through riparian buff ers. J. Soil Water Conserv. 57:336–343.
Gharabaghi, B., R.P. Rudra, and P.K. Goel. 2006. Eff ectiveness of vegetative fi lter strips in removal of sediments from overland fl ow. Water Qual. Res. J. Can. 41:275–282.
Groff man, P.M., N.J. Boulware, W.C. Zipperer, R.V. Pouyat, L.E. Band, and M.F. Colosimo. 2002. Soil nitrogen cycle processes in urban riparian zones. Environ. Sci. Technol. 36:4547–4552.
Helmers, M.J., D.E. Eisenhauer, M.G. Dosskey, T.G. Franti, J.M. Brothers, and M.C. McCullough. 2005. Flow pathways and sediment trapping in a fi eld-scale vegetative fi lter. Trans. 48:955–968.
Kuo, J., and E. Fox. 1993. Sigmaplot user’s manual. Jandel Scientifi c, San Rafael, CA.
Liu, X., X. Zhang, and M. Zhang. 2008. Major factors infl uencing the effi cacy of vegetated buff ers on sediment trapping: A review and analysis. J. Environ. Qual. 37:1667–1674.
Lowrance, R., and J.M. Sheridan. 2005. Surface runoff water quality in a managed three zone riparian buff er. J. Environ. Qual. 34:1851–1859.
Magette, W.L., R.B. Brinsfi eld, R.E. Palmer, and J.D. Wood. 1989. Nutrient and
sediment removal by vegetated fi lter strips. Trans. ASAE 32:663–667.
Mayer, P.M., S.K. Reynolds, Jr., M.D. McCutchen, and T.J. Canfi eld. 2007. Meta-analysis of nitrogen removal in riparian buff ers. J. Environ. Qual. 36:1172–1180.
McFarland, A.M.S., and L.M. Hauck. 2004. Controlling phosphorus in runoff from long term dairy waste application fi elds. J. Am. Water Resour. Assoc. 40:1293–1304.
Murphy, G.P., and D.R. Shaw. 1997. Eff ects of vegetative fi lter strip width on reducing fl uometuron and norfl urazon losses in surface runoff . Tech. Bull. 214. Mississippi Agric. and Forestry Exp. Stn., Mississippi State Univ., Starkville.
Muscutt, A.D., G.L. Harris, S.W. Bailey, and D.B. Davies. 1993. Buff er zones to improve water quality: A review of their potential use in UK agriculture. Agric. Ecosyst. Environ. 45:59–77.
Norris, V. 1993. Th e use of buff er zones to protect water quality: A review. Water Resour. Manage. 7:257–272.
Otto, S., M. Vianello, A. Infantino, G. Zanin, and A. Di Guardo. 2008. Eff ect of a full-grown vegetative fi lter strip on herbicide runoff : Maintaining of fi lter capacity over time. Chemosphere 71:74–82.
Patty, L., B. Réal, and J.J. Gril. 1997. Th e use of grassed buff er strips to remove pesticides, nitrate and soluble phosphorus compounds from runoff water. Pestic. Sci. 49:243–251.
Piegorsch, W.W., and A.J. Bailer. 2005. Analyzing environmental data. John Wiley & Sons, New York.
Reichenberger, S., M. Bach, A. Skitschak, and H.-G. Frede. 2007. Mitigation strategies to reduce pesticide inputs into ground- and surface water and their eff ectiveness: A review. Sci. Total Environ. 384:1–35.
SAS Institute Inc. 2004. SAS 9.1.3 Help and documentation, 2002–2004. SAS Inst. Inc., Cary, NC.
Schmitt, T.J., M.G. Dosskey, and K.D. Hoagland. 1999. Filter strip performance and processes for diff erent vegetation, widths, and contaminants. J. Environ. Qual. 28:1479–1489.
Schwer, C.B., and J.C. Clausen. 1989. Vegetative fi lter treatment of dairy milkhouse waste-water. J. Environ. Qual. 18:446–451.
Syversen, N. 2002. Eff ect of a cold-climate buff er zone on minimising diff use pollution from agriculture. Water Sci. Technol. 45:69–76.
Syversen, N. 2005. Eff ect and design of buff er zones in the Nordic climate: Th e infl uence of width, amount of surface runoff , seasonal variation and vegetation type on retention effi ciency for nutrient and particle runoff . Ecol. Eng. 24:483–490.
Uusi-Kämppä, J., B. Braskerud, H. Jansson, N. Syversen, and R. Uusitalo. 2000. Buff er zones and constructed wetlands as fi lters for agricultural phosphorus. J. Environ. Qual. 29:151–158.
Väänänen, R., M. Nieminen, and M. Vuollekoski. 2006. Retention of phosphorus in soil and vegetation of a buff er zone area during snowmelt peak fl ow in Southern Finland. Water Air Soil Pollut. 177:103–118.
Van Dijk, P.M., F. Kwaad, and M. Klapwijk. 1996. Retention of water and sediment by grass strips. Hydrol. Processes 10:1069–1080.
Vought, L.B.M., J. Dahl, C.L. Pedersen, and J.O. Lacoursiere. 1994. Nutrient retention in riparian ecotones. Ambio 23:342–348.
Watanabe, H., and M.E. Grismer. 2001. Diazinon transport through inter-row vegetative fi lter strips: Micro-ecosystem modeling. J. Hydrol. 247:183–199.
Wenger, S. 1999. A review of the scientifi c literature on riparian buff er width, extent and vegetation. Univ. of Georgia, Athens.
World Resources Institute. 1992. Th e 1992 Information please environmental almanac. Houghton Miffl in Co., Boston, MA.