foreign direct investment, trade and real exchange rate … · · 2015-03-03foreign direct...
TRANSCRIPT

Foreign Direct Investment, Trade and Real Exchange Rate Linkagesin Developing Countries
Linda S. Goldberg and Michael Klein
published in Managing Capital Flows and Exchange Rates: Perspectives from thePacific Basin, editor Reuven Glick (Cambridge University Press 1998) pp.73-100.
ABSTRACT
We investigate the relationships among trade, foreign direct investment and the real exchange
rate between a set of SouthEast Asia and Latin American countries and both the United States
and Japan. Foreign direct investment by both Japan and the United States to the East Asian
countries in our sample is significantly affected by bilateral real exchange rates. Also, trade
between the countries in our sample and the United States and Japan is significantly affected
by foreign direct investment. These sets of relationships, between the real exchange rate and
foreign direct investment, and between foreign direct investment and trade, support two
channels through which the real exchange rate affects trade: a direct effect on the relative price
of goods and an indirect effect through foreign direct investment.
Linda S. Goldberg Michael W. Klein
Federal Reserve Bank of New York Fletcher School of Law and Diplomacy
and NBER Tufts University and NBER
The views expressed in this paper are those of the individual authors and do not necessarilyreflect the position of the Federal Reserve Bank of New York or the Federal Reserve System. Maurice Obstfeld, Kei-Mu Yi, and participants at Managing Capital Flows and ExchangeRates: Lessons from the Pacific Basin (Federal Reserve Bank of San Francisco, September1996) provided useful discussion. Keith Crockett of the FRBNY provided excellent researchassistance.

1
3.1 Introduction
Trade flows and foreign direct investment are linked in a variety of ways. Direct
investment may set the stage for export promotion, import substitution or greater trade in
intermediate inputs, especially between parent and affiliate producers. These trade implications
of foreign direct investment may be observed between the host and source country or with a set
of third country markets. In addition to this direct linkage, there is an indirect linkage between
trade flows and direct investment since each share the common determinant of the real exchange
rate. In this paper we work toward disentangling the scale of the direct and indirect linkages
between trade flows and direct investment in order to completely trace the role of the real
exchange rate on each of these activities. The data we examine are for the trade and investment
between a set of developing countries from SouthEast Asia and Latin America with both Japan and
the United States.
As with much other empirical research, we find that the real exchange rate significantly
affects trade. For our sample of developing countries, import elasticities with respect to real
exchange rates exceed their export elasticities. We also find that for SouthEast Asian countries
exchange rates affect direct investment not only from Japan but also from the United States. FDI
from Japan into SouthEast Asia has been very sensitive to changes in the yen-dollar exchange rate:
dollar depreciations lead to investment surges from Japan. Moreover, holding constant the effect
of the real exchange rate, direct investment from Japan promotes trade between Asia and both
Japan and the United States. Japanese direct investment expands both the export and import
linkages of SouthEast Asia. United States FDI plays a different role in the region: it substitutes
for SouthEast Asian imports from the United States. In contrast to our findings for SouthEast
Asia, FDI into Latin America from the United States and Japan are not responsive to real exchange
rates. Moreover, the trade-promoting effects of this FDI appear to be weak or insignificant with
regard Latin American trade with the United States and Japan.

2
Section II sets the stage for our detailed empirical analysis by profiling the sectoral
composition of trade and FDI between the respective SouthEast Asian and Latin American
countries and the United States and Japan. Section III presents the main econometric methodology
and linkage results of the paper. Section IV emphasizes that the practice of dollar pegging by
SouthEast Asian countries was important for the expansion of trade and FDI linkages of that
region. Countries in this region are highly negatively exposed when the yen weakens vis-a-vis the
United States dollar.
Our work complements three recent strands of analysis of trade and currency issues in
various regions. First, we add a temporal dimension and an explicit role for exchange rates to the
insights gained from the (methodologically distinct) gravity approach to modeling trade and
investment. Therein, country endowment sets and distance parameters provide a measure of
natural tendencies toward inter-industry and intra-industry trade flows [see Frankel (1993) on
Japan, and Eaton and Tamura (1994) on flows between Japan and the United States and various
regions of the world.] Second, our focus on the implications of exchange rate movements for trade
and capital flows between countries provides a nice complement to studies of the determinants of
real and nominal exchange rate movements in SouthEast Asia [see Frankel and Wei (1994)].
Third, our work complements a literature on capital flows to other developing countries which in
recent years has tended to focus more on hot money and short-term capital flows than on foreign
direct investment [for example, see Calvo, Leiderman, and Reinhart (1993), Kletzer and Spiegel
(this volume), and Bohn and Tesar (this volume)]. Our emphasis on FDI is especially pertinent
in light of some recent developing country efforts to redirect the composition of capital inflows
away from short-term and toward longer-term equity holdings.
3.2 Bilateral Trade and FDI Patterns
There have been dramatic changes in FDI activity over the 1980s. Although the United
States continued its role as a large capital exporter, it also became a destination for increasing

3
amounts of foreign capital. Japan=s role as a source country for long term capital ratcheted upward,
via both an increase in merger and acquisition activity in industrialized countries and by increased
greenfield investments in developing countries. With expanded privatization programs underway,
foreign direct investment also regained prominence in Latin America and surged in many emerging
market economies.
The resulting recent empirical and theoretical research on FDI has been largely oriented
toward explaining the merger and acquisition phenomenon in industrialized nations [for example,
see Klein and Rosengren (1994) and the collection of papers in Froot (1993)].1 While the
SouthEast Asian experience also has received some attention recently [as in the collections of
papers in Ito and Krueger (1996)], there has been very little systematic examination of FDI activity
in developing countries or the role of currency movements in this context.2
Existing empirical studies of FDI into developing countries either purely document
directional patterns or compare observed flows with some globally-based benchmarks which are
based on country characteristics. An example of the first group of studies is Kohsaka=s (1996)
careful tracing of levels and composition of capital flows to Latin America and Asia.3 Examples
of the second class of studies include work using gravity models. Eaton and Tamura (1994,
1996), for instance, relate the bilateral trade and investment flows of the United States and Japan
with various regions to transportation costs (distance between countries), market size (population),
overhead investment costs (human capital), and per capital GNP. Frankel (1993) and Frankel and
Wei (1993) also use gravity models to compare the regionalism in trade flows of the United States
and Japan, among other countries. These studies argue that regionalism abounds in trade and
investment flows, even after models account for country tendencies and features. The United
States is more tightly linked with Latin America, while Japan has Aunexplained@ deep ties to the
rest of Asia.
In contrast to these studies, our empirical work is not directly concerned with whether
excessive bilateral or regional linkages are observed in United States and Japanese transactions

4
with Latin America or SouthEast Asia. Instead, by examining the (time series) interactions
between trade, FDI, and exchange rates, we provide stylized facts on the rich channels through
which particular exchange rate movements strengthen or weaken international linkages.4
3.2.1 Inter-Regional Patterns of Trade
The SouthEast Asian countries in our sample include Malaysia, the Philippines, Indonesia,
and Thailand (sometimes described as the ASEAN4 nations). These countries are strong net
recipients of private direct investment and long term capital flows, in contrast to the Newly
Industrialized countries of Asia (NICs, i.e. Hong Kong, Korea, Singapore, and Taiwan)5 in which
domestic savings now exceed domestic investment. The Latin American countries that we explore
in detail are: Chile, Brazil, and Argentina,6 each of which is a net importer of long term capital.
Perspective on the centrality of the United States and Japan for financial and real activities
for these regions are suggested by trade and FDI data [Table 1]. Data on partner shares on country
trade, calculated as bilateral exports plus bilateral imports relative to total trade, show that the
United States represents about 20 percent of the total (direct) export and import activities of the
countries in both Latin America and SouthEast Asia. The fraction of trade activity accounted for
by Japan is very different across the two regions: Japan accounts for closer to 25 percent of trade
activities of SouthEast Asian countries, but is a much smaller (although not trivial) partner in trade
for Latin America. European countries together dominate the United States in absolute terms as
a trade partner of Latin American countries, and are a more moderate partner for the SouthEast
Asian countries. China does not account for a large part of trade transactions for any of the
countries of our sample, although there clearly is potential for this relationship to expand.
The dollar and yen play key roles in these trade flows. Country currencies either are
formally tied to the United States dollar or give the dollar a high weight in basket pegs. The
weight of the dollar in the currency baskets is generally about five times higher than the weights
that would be suggested purely by volumes of direct trade with the United States. The historic
phenomenon of dollar invoicing of trade may be an important component of explaining the Abias@

5
toward the dollar in currency baskets. One reason is that the majority of resource intensive
transactions are invoiced in dollars. A second reason is that the majority of trade between
SouthEast Asian and Japanese countries is invoiced in dollars [Tavlas and Ozeki, 1992].
Additionally, the Chinese Yuan is in practice closely valued against the dollar, and further
reinforces the dominance of the dollar in the baskets of SouthEast Asian countries [Frankel and
Wei, 1994].
The United States and Japan are important source countries for foreign direct investment.
Table 2 provides a one year snapshot of FDI from the United States and Japan into the respective
countries of Latin America and SouthEast Asia. The United States maintains a dominant position
in FDI into Latin American countries. Japan maintains a dominant position in FDI into SouthEast
Asia. The apparent Aregionalism@ in investment by these sources is robust to adjustments for
natural resource and factor endowments and distance [Eaton and Tamura, 1994].7 Europe is a
significant investment presence in both regions, but still is smaller (in terms of flows) than the
United States in the Latin American countries, and than both the United States and Japan in
SouthEast Asia. In recent years, the NICS also have been large-scale investors in SouthEast Asia.
3.2.2 Sectoral Composition of Trade with United States and Japan.
In this section we provide a sectoral decomposition of the trade between each country and
the United States and Japan. In section (c) we provide the sectoral decomposition of FDI inflows
into the same group of developing countries from the respective source countries.
United States exports to the panel countries of SouthEast Asia and Latin America have a
very similar (two digit SIC) sectoral decomposition. Machinery (electrical and non-electrical) and
transportation equipment comprise roughly 65 percent of United States sales in each country.
Chemicals and allied products further account for between 15 and 25 percent of United States
exports to Latin America and between 5 and 17 percent of United States exports to SouthEast
Asia.8

6
Japanese exports to the Latin American countries also are heavily concentrated (roughly
80 percent) in machinery (including office equipment, electrical apparatus and appliances, and
other electronics) and transportation equipment. There is a different profile for Japanese exports
to SouthEast Asian countries. Electrical machinery and transportation equipment are important,
but account for only about 35 percent of SouthEast Asian purchases from Japan. The remaining
significant export categories are the types of goods that are direct inputs into SouthEast Asian
production activities: iron and steel, power-generating and industrial machinery and equipment.
The imports of the United States and Japan from the respective panel countries are much
more diffuse and differentiated by source country. United States imports from Latin America are
heavily concentrated in food, leather, and primary metal products. By contrast, United States
imports from SouthEast Asian countries are concentrated in electrical and nonelectrical machinery
(especially with regards to Malaysia) and apparel and textile products.
Japanese imports from Latin America primarily consist of raw materials and foodstuffs.
Argentine exports are 70 percent foodstuffs, with residual exports mainly comprised of nonferrous
metals. Brazil and Chilean exports to Japan are mainly crude materials, foodstuffs, and metal
products (ferrous and nonferrous). Japanese imports from SouthEast Asia differ substantially
across countries. Indonesia sells fuels, and cork and wood manufactures to Japan. Malaysia sells
fuel and non-fuel crude materials, and some manufactured products to Japan. Both the Philippines
and Thailand export some foodstuffs, non-fuel crude materials (together representing about 50%
of sales), and manufactured products.
3.2.3 Sectoral Composition of FDI with United States and Japan.
The bulk of recent United States investments into Latin America (especially outside of
Banking and Finance sectors) have targeted Brazil, although Argentina also receives significant
quantities of direct investment from the United States. Inflows to Brazil have been concentrated
in various manufacturing industries, and especially in the Transportation Equipment sector which
represents an important part of Brazilian exports to the United States. Direct investment by the

7
United States into Argentina is concentrated in Foodstuffs and various manufacturing industries,
also paralleling the composition of Argentina exports to the United States.
United States direct investment into SouthEast Asia has been significantly smaller than its
flows into Latin America. For example, in 1993 these flows into SouthEast Asia were less than
a quarter of the flows to the three Latin American countries. More than half of the United States
FDI into SouthEast Asia went to the Indonesian Petroleum and Products sector, which currently
does not export significant amounts to the United States. The remaining funds largely went to
Electronics Manufacturing in Malaysia, in line with the bulk of United States purchases from that
country.
Compared with the United States data, Japanese direct investment data are less complete
in coverage and less detailed in their decomposition. Data on Japanese direct investment into
Latin America and SouthEast Asia are available as annual cumulative stocks disaggregated by
industry and by area (North America, Latin America, Asia, Middle and Near East, Europe,
Africa, and Oceania).9 Direct investment into Latin America has mainly gone into the Banking
and Insurance and Transportation components of non-manufacturing industries. Flows into
manufacturing have been concentrated in Iron and Ferrous Metal and Transportation Equipment
sectors. These investment patterns contrast significantly with those of the United States and with
Japanese investment patterns into SouthEast Asia.
Japanese FDI into SouthEast Asia is three to four times larger than its (non-Banking and
Insurance) FDI into Latin America. Moreover, Japanese FDI in SouthEast Asia is dispersed
among a range of manufacturing and non-manufacturing industries. These industries are much
broader than the SouthEast Asian industries which account for the bulk of exports to Japan. In
fact, the industries which received significant funds from Japan were those industries that most
resembled the pattern of production in Japan in the 1980s.
The differences in the sectoral pattern of direct investment by Japan and the United States
to the countries in our sample may be a source of differences in the linkages among direct

8
investment, trade and the real exchange rate. In the empirical results which follow we are able to
study differences in direct investment from Japan or the United States although the lack of
sufficient sectoral data precludes us from drawing any inferences on the possibility that the source
of these differences arises from a different sectoral mix.
3.3 Econometric Results: FDI, Trade and Real Exchange Rates
This section presents our empirical findings on the linkages among foreign direct
investment, trade flows and the real exchange rate between the developing countries and the
United States and Japan. First, we present regressions over a time-series panel of direct investment
into each of the developing countries from either Japan or the United States. Real FDI is expressed
as a function of bilateral real exchange rates and the real incomes of the source and host countries.
Further regressions explore the determinants of the developing country exports to and imports
from either the United States or Japan. The regressions express real exports and real imports as
functions of real income, bilateral real exchange rates and real direct investment from both source
countries.
Overall, the empirical results document the significance of regional linkages between the
real exchange rate and direct investment, and between the real exchange rate and trade flows.
These results also demonstrate that direct investment into these developing countries affects their
trade flows with industrialized countries, even after holding constant the independent contribution
to trade of the real exchange rate. There are significant differences between the strength of the
linkages observed for the Latin American and for the SouthEast Asian countries. Moreover, the
source of FDI -- i.e. Japan or the United States -- has a strong influence on resulting effects of FDI
on current and future trade patterns of the developing countries.
The data set used in these regressions consists of a cross-section time-series panel of
annual observations. The countries in the panel are Argentina, Brazil, Chile, Indonesia, Malaysia,
Thailand and the Philippines. We provide regression results for the full panel and for the subsets

9
of the Latin American countries and the SouthEast Asian countries. The time series runs from
1978 to 1993 or 1994, depending upon the country. All real exchange rates (RERus, RERj) are
bilateral rates measured as prices in the panel countries relative to prices in either the United States
or Japan: an increase in the real exchange rate index represents a real appreciation of the currency
of the country in the panel with respect to the dollar or the yen, respectively. All estimation is
done using a fixed-effects model which effectively has a dummy variable for all but one of the
countries included in the regression. The variables enter the regressions in logarithmic form, so
that estimated regression coefficients are interpreted as elasticities.
3.3.1 Direct Investment Regressions
There are several channels through which real exchange rates may affect direct investment.
In the developing country context, the most important channel may be that a depreciation of the
real exchange rate reduces the cost of domestic labor (and other productive inputs) relative to
foreign production costs. The depreciation increases labor demand and employment, thereby
raising the return on capital. Thus, greenfield foreign direct investment increases in response to
a depreciation. This channel suggests that we should expect to find a negative coefficient on the
real exchange rate in a direct investment regression (where an increase in the real exchange rate
represents a real appreciation of the domestic currency).
Exchange rates may also affect direct investment through an imperfect capital markets
channel, as discussed in Froot and Stein (1991). In this case, a real depreciation of the domestic
currency raises the wealth of foreign investors relative to that of domestic investors and thereby
increases FDI.10 This channel also has the prediction that a real depreciation increases FDI. 11 The
imperfect capital markets channel for real exchange rate effects may be more relevant in merger
and acquisition bids than in the greenfield investments which prevail in many developing
countries. The exception for developing and emerging markets pertains to privatization efforts.

10
In contrast to these arguments, other causal channels suggest a positive coefficient between
real exchange rate appreciation and FDI. One causal channel may be associated with domestic
efforts to mitigate some of the distributional and aggregate effects of a real appreciation. For
example, an appreciation of the domestic currency may yield an increase in imports which, in turn,
increases pressures for the implementation of protectionist policies. In this case direct investment
may take place in anticipation of future tariff barriers that are precipitated by adverse exchange
rate movements. The plausibility of this potential effect of exchange rates on FDI is supported
by the considerable evidence that exists regarding the countercyclical nature of trade barriers.
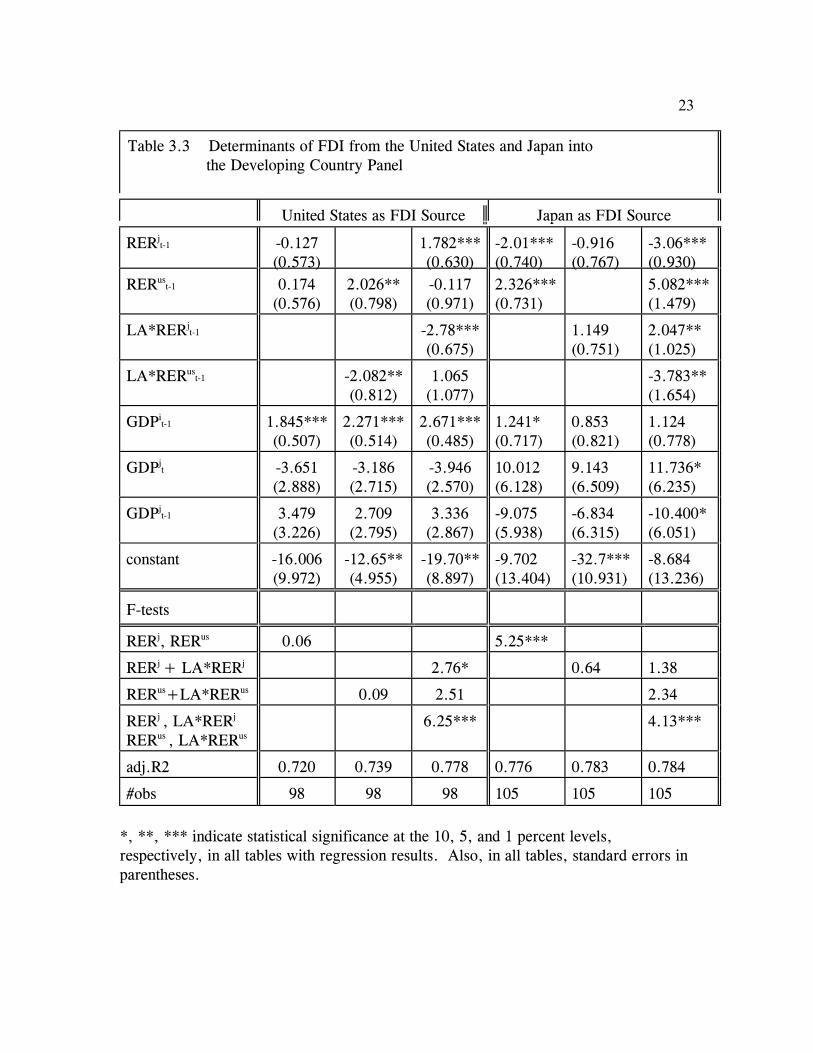
Foreign direct investment regressions over the full panel of seven countries are presented
in Tables 3. In Tables 4 and 5 we provide FDI regression results when the Latin American
countries are not pooled with the SouthEast Asian countries. The dependent variable in these
regressions is the logarithm of the annual real dollar value of direct investment from either the
United States or Japan. The independent variables in these regressions include the logarithms of
national income in the source country, lagged national income in the source country, lagged
national income in the host country, and lagged bilateral real exchange rates with respect to both
the yen and the dollar. Real exchange rates and host-country national income are lagged to avoid
simultaneity. Contemporaneous source country national income is included since it is unlikely that
simultaneity bias arises with respect to this variable. Some regressions include an interactive
dummy ALA@ on exchange rate terms: this dummy variable equals one for Latin America and is
zero otherwise.
Results: In Table 3, column 4 observe that when the developing country currencies depreciate
with respect to the yen (i.e. when RERj falls), there is a corresponding increase in direct
investment from Japan. However, regressions which include the dummy variable for Latin
America (column 6) show that the real exchange rate and FDI linkage is statistically significant
only for SouthEast Asia and not significant for Latin America. The results in Table 4 further

11
confirm the lack of significant linkages between the real exchange rate and foreign direct
investment in the subsequent year for any of the Latin American countries in our sample.
The results in Table 3, column 6 indicate that a 1 percent depreciation with respect to the
yen causes an increase in direct investment from Japan to the SouthEast Asian countries of 3
percent. However, the effect is highly statistically significant only when one also controls for the
exchange rate movements of the developing country currency relative to the U. S. dollar. The
domestic currency depreciation therefore potentially raises the return to Japanese investment in
SouthEast Asia relative to investment in Japan. In Table 4, column 4, subtracting the coefficients
on RERj from RERus, which yields the coefficient on a yen/dollar real exchange rate, the resulting
net coefficient suggests that a 1 percent appreciation of the yen against the dollar raises FDI into
these countries by 8.14 percent. This finding is consistent with more anecdotal claims about the
potential hollowing out of Japanese industrial sectors with respect to a strong yen.
The results in Table 3 column 3 also suggest that an appreciation with respect to the dollar
is associated with an increase in direct investment from the United States to SouthEast Asia, but
this result is not robust to the inclusion of the bilateral yen real exchange rate in the regression.
Table 5 confirms these significant linkages between SouthEast Asian bilateral exchange rates and
direct investment from both Japan and the United States. From Table 5, column 4 observe that a
1 percent depreciation with respect to the yen increases direct investment from Japan by 2.62
percent and decreases direct investment from the United States by 1.46 percent. Also, column 4
shows that a 1 percent appreciation of the yen against the dollar increases direct investment from
Japan by 7.7 percent. Column 2 shows that this same appreciation of the yen against the dollar
reduces United States investment in SouthEast Asia by 1.6 percent.
The coefficients on the (third party) bilateral exchange rates in these regressions should be
are interpreted as showing the effects of real exchange rates holding constant the bilateral
exchange rate between the host country and the source country. Thus, these coefficient reflect the
effect of a change in the yen/dollar exchange rate on FDI to the countries in the panel. For

12
example, an increase in the dollar/ringgit exchange rate, holding constant the yen/ringgit exchange
rate, represents an increase in the dollar/yen exchange rate. Therefore, a positive coefficient on
the dollar/ringgit real exchange rate in a regression of direct investment from Japan that also
includes the yen/ringgit real exchange rate reflects the fact that an appreciation of the yen relative
to the dollar, all else equal, increases direct investment from Japan to Malaysia.
3.3.2 Trade Regressions
In this section we examine the direct effect of real exchange rates on the relative prices of
developing country (bilateral) exports and imports, and also explore the indirect real exchange rate
linkage via foreign direct investment. Foreign direct investment may also increase imports of
intermediate inputs purchased by the host country, if the direct investment supports or creates links
in the chain of production of a multinational firm. Imports of final goods purchased by the host
country may decline in the wake of direct investment if that investment supports or creates a
domestic industry that displaces purchases of final goods from the source country. Exports may
also increase in the wake of direct investment as the producers in the source country use the host
country as a platform for selling to third-country markets.12
Tables 6, 7, and 8 present the results of regressions which link the logarithms of direct
investment and real exchange rates to the country real bilateral imports (in millions of constant US
dollars) from the United States and Japan. The tables present results for, respectively, the full
developing country panel, the Latin American country panel, and the SouthEast Asian panel.
Analogous regressions for real bilateral exports to the United States and Japan are provided in
Tables 9, 10, and 11. All regressions include the logarithms of both contemporaneous and lagged
real exchange rates, national income in both countries and current and lagged foreign direct
investment flows.13 The real exchange rate in a particular regression is the bilateral exchange rate
relative to the trade partner.

13
For the full panel of countries, the real exchange rate appreciation has the expected
positive effect on imports, and the sum of the current and lagged real exchange rates is significant
in all four regressions of Table 6. Direct investment from Japan has a positive and significant
impact on imports from Japan, a result consistent with a situation where direct investment is
supported by subsequent trade in intermediate inputs from the source country.
However, in Latin American countries (Table 7) neither imports from the United States
or Japan are responsive to FDI from either source. The significance of FDI for imports in the
full panel of countries was driven by the SouthEast Asian results. As indicated in Table 8, direct
investment from both the United States and Japan significantly affects goods imported by
SouthEast Asian countries. From column 3 observe that a 10 percent increase in direct investment
from the United States reduces SouthEast Asian country imports from the United States by about
3 percent over time. From column 6 observe that a 10 percent increase in direct investment from
Japan increases imports from Japan by about 1.5 percent over time. Japanese direct investment
is also shown to significantly increase SouthEast Asian imports from the United States . This set
of results could imply that United States FDI substitutes for United States trade with the region,
while Japanese FDI leads to more externally oriented local production.
A confirmation that there are direct (relative price) and indirect (via FDI) effects of real
exchange rates on SouthEast Asian imports is provided by regressions which exclude the FDI
terms. The resulting coefficients on real exchange rates in these regressions which exclude FDI
are roughly 20 percent lower for imports from the United States and 50 percent higher for imports
from Japan. These elasticity adjustments are consistent with the results concerning the effects of
direct investment on trade and the results presented above on the effects of the real exchange rate
on direct investment. An appreciation of a country=s real exchange rate decreases FDI which, in
turn, decreases SouthEast Asian imports from Japan and increases SouthEast Asian imports from
the United States.

14
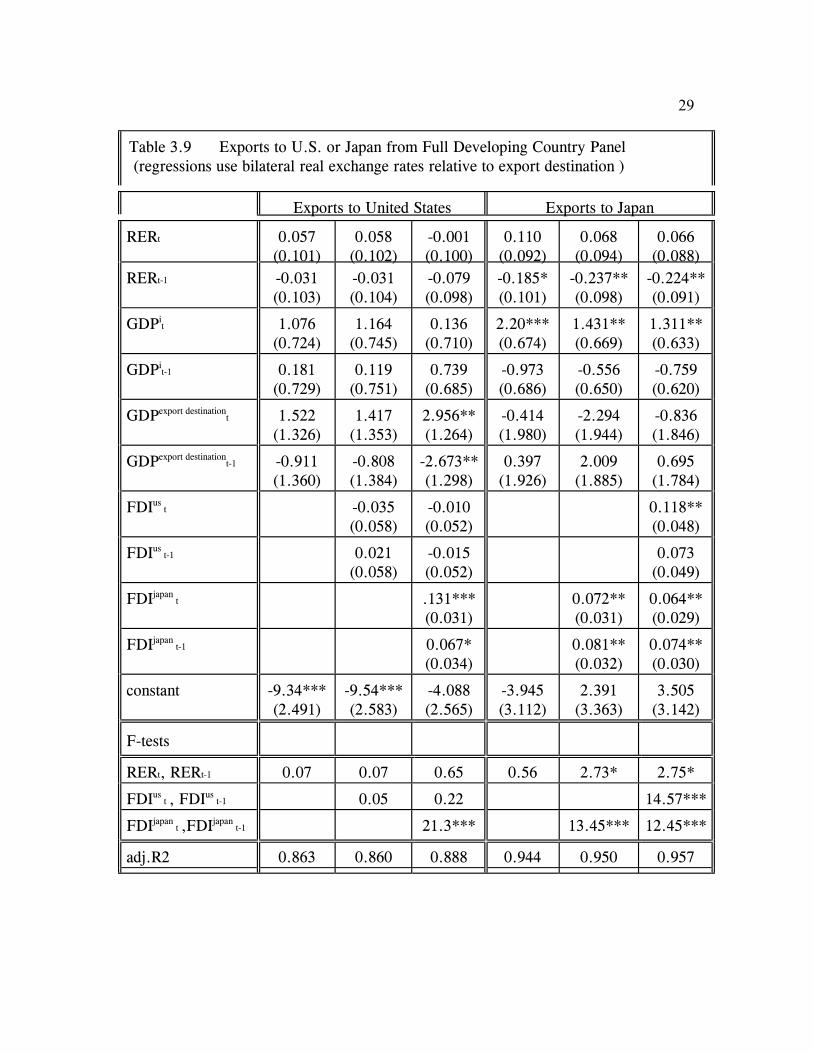
Tables 9, 10, and 11 present results for regressions of exports from the countries in the full
panel, Latin American panel, and SouthEast Asian panel, respectively, to either the United States
or Japan. For the full panel of countries (Table 9) the real exchange rate coefficients in Table 9
indicate a J-curve effect with positive (albeit insignificant) coefficients on contemporaneous
exchange rates and negative (and significant, in the case of Japan) coefficients on lagged exchange
rates. The results (in Table 9, columns 3 and 6) indicate a positive effect of Japanese foreign
investment on exports to both the United States and Japan. There is also a significant effect of
direct investment from the United States on panel country exports to Japan. This finding is
consistent with a situation where Japanese and American multinational firms= exports to the United
States or Japan are increased by direct investment in countries in the panel.
The decomposition of the full panel into the Latin American and SouthEast Asian country
components reveals which relationships were driving the results of Table 9. Specifically, the
evidence provided in Tables 10 and 11 is suggestive of which countries in the panel serve as
significant platforms for exporting by multinationals to the United States or Japan. Exports from
Latin America to the United States are significantly increased by direct investment from Japan
[Table 10]. However, United States FDI into Latin America does not appear to promote further
Latin American sales to the United States. The trade-promoting effects of Japanese FDI also is
observed in SouthEast Asia. In Table 11 observe that SouthEast Asian exports to the United States
and to Japan are both significantly increased by direct investment from Japan. By contrast, for
these countries there is no significant increase in exports to either the United States or Japan
associated with increased direct investment by the United States.
3.4 Closing Remarks
The empirical results provided in this paper document two types of linkages between Latin
American and SouthEast Asian countries with the United States and Japan: (i) the link between
the real exchange rate and direct investment; and (ii) the link between the real exchange rate and

15
trade. We show that direct investment into these developing countries affects their trade flows with
industrialized countries, even after holding constant the contribution of the real exchange rate.
There are significant differences in the linkages shown by regressions for the Latin American and
for the SouthEast Asian countries vis-a-vis the United States and Japan. In general, real exchange
rates have the most significant effect on trade and FDI patterns for SouthEast Asia. In this region
the effects of FDI on subsequent trade also are strongest. Moreover, the source of FDI -- i.e.
Japan or the United States -- influences the degree and direction of the trade effects of FDI.
Our results provide evidence of a number of statistically significant linkages. A real
depreciation of the currencies of the SouthEast Asian countries with respect to the yen both
increases foreign direct investment to these countries from Japan and decreases foreign direct
investment to these countries from the United States. Foreign direct investment from Japan to the
SouthEast Asian countries increases imports from Japan. These imports largely consist of inputs
to production. Foreign direct investment from Japan to the SouthEast Asian countries also is
associated with an increase in exports from these countries to both the United States and Japan.
These exports are comprised of both machinery and (for Japan) raw materials. We also show that
foreign direct investment from Japan to Latin America is associated with an increase in the exports
of these countries to the United States. These exports consists of machinery and transportation
equipment, and some food, leather, primary metals and raw materials.
For SouthEast Asian countries the real exchange rates that we examine are closely related
to their nominal exchange rates. The nominal exchange rate regime therefore presents a relevant
context for interpretation of our results. Most SouthEast Asian countries have pursued basket pegs.
Frenkel and Wei (1994) showed that, with the exception of high yen weights observed in the
baskets during 1985/1986, the weight of the dollar in SouthEast Asian currency baskets often was
between ninety and one hundred percent.14 Thus, SouthEast Asian (and Latin American) countries
use the United States dollar as the main benchmark against which their own currencies are valued.
An open question concerns the role of the performance of countries not included in the sample

16
in diverting trade or investment from the countries we study here. For example, the real exchange
rates of Korea, Singapore or Taiwan may have had an influence on investment in Indonesia,
Malaysia, the Philippines or Thailand.

17
The existence of the peg arrangements in which the dollar has a dominant role, in
conjunction with our findings about the direction and strength of empirical linkages between
exchange rates, trade, and FDI, provide support for a significant role of exchange rate movements
in the rapid development of production and trade by manufacturing industries in SouthEast Asia:
the appreciation of the yen against the dollar since the mid 1980s was a crucial element in this
expansion. Yen appreciation against the United States dollar since 1985 stimulated Japanese FDI
into the dollar area of SouthEast Asia (but not into Latin America). These investments furthered
the trade linkages of SouthEast Asian countries with respect to both Japan and the United States.
By pegging to the dollar, SouthEast Asian countries became extremely attractive targets for
investment and trade when the yen appreciated. Analogously, yen depreciation against the dollar,
under the dollar-denominated exchange rate regime of SouthEast Asian countries, leaves these
countries adversely exposed as a target for FDI and as a comparably attractive trade partner.
References
Bohn, H. and L. Tesar (1997). AU.S. Portfolio Investment in Asian Capital Markets,@ this volume,
chapter 2.
Calvo, G., L. Leiderman, and C.Reinhart (1993). ACapital Inflows to Latin America: The Role of
External Factors,@ IMF Staff Papers 40(1):108-51.
Dewenter, K. (1995). ADo Exchange Rate Changes Drive Foreign Direct Investment?@ Journal of
Business 68(3):405-433.
Eaton, J. and A.Tamura (1994). ABilateralism and Regionalism in Japanese and US Trade direct
foreign investment patterns,@ Journal of the Japanese and International Economies 8:478-510.
Eaton, J. and A.Tamura (1996). AJapanese and U.S. Exports and Investment as Conduits of
Growth.@ In T.Ito and A. Krueger, eds., Financial Deregulation and Integration in East Asia,
NBER and University of Chicago Press.
Frankel, J. (1993). AIs Japan Creating a Yen Bloc in East Asia and the Pacific?@ In J.Frankel and
M. Kahler, eds. Regionalism and Rivalry: Japan and the U.S. in Pacific Asia University of
Chicago Press and NBER.

18
Frankel, J. and S.J Wei (1993). ATrade Blocs and Currency Blocs@ NBER working paper 4335,
April.
Frankel, J. and S.J Wei (1994). AYen Bloc or Dollar Bloc? East Asian Exchange Rate Policies.@
In T. Ito and A. Krueger, eds. Macroeconomic Linkage, University of Chicago Press and
NBER.
Froot, K., editor (1993). Foreign Direct Investment (University of Chicago Press and NBER.
Froot, K. and J. Stein (1991). AExchange Rates and Foreign Direct Investment: An Imperfect
Capital Markets Approach,@ Quarterly Journal of Economics 106(4):1191-1217.
Goldberg, L. (1997). AExchange Rates and Investment Response in Latin America.@ In B.J.
Cohen, ed., International Trade and Finance: New Frontiers for Research: Festschrift in
Honor of Peter B. Kenen Cambridge University Press.
Goldberg, L. and C. Kolstad (1995). AForeign Direct Investment, Exchange Rate Variability and
Demand Uncertainty,@ International Economic Review 36(4).
Ito, T. and A. Krueger (1996). Financial Deregulation and Integration in East Asia NBER and
University of Chicago Press.
Klein, M. and E. Rosengren (1994). AThe Real Exchange Rate and Foreign Direct Investment in
the United States: Relative Wealth vs. Relative Wage Effects,@ Journal of International
Economics 36(3/4):373-389.
Kletzer, K. and M. Spiegel (1997). ASpeculative Capital Inflows and Exchange Rate Targeting in
the Pacific Basin: Theory and Evidence,@this volume, chapter 13.
Kohsaka, A. (1996). AInterdependence through Capital Flows in Pacific Asia and the Role of
Japan.@ In T.Ito and A. Krueger, eds., Financial Deregulation and Integration in East Asia
NBER and University of Chicago Press.
Matsuoka, M. and B. Rose (1994). The DIR Guide to Japanese Economic Statistics New York,
Oxford University Press.
Tavlas, G. and Y. Ozeki (1992). AThe internationalization of currencies: an appraisal of the
Japanese yen.@ Occasional Paper 90, Washington DC: International Monetary Fund (January).

19
Data Appendix
A. Japan. External Direct Investment by industry and area from Monthly Finance Review,
Japan Ministry of Finance, August issues, annual series 1978/1980 to 1994.
Aggregate export and import data from IMF Direction of Trade Statistics, annual
series, 1979 to 1995.
Disaggregated 1 and 2-Digit SITC bilateral exports and imports from United Nations
Trade database.
Exchange rates (Real Effective and bilateral US dollar rate) from IMF International
Financial Statistics, annual series (period average), 1979 to 1995.
Price indices from IMF International Financial Statistics, annual series, 1979 to 1995.
Gross Domestic Product and GDP Deflator from IMF International Financial Statistics,
annual series, 1979 to 1995.
B. United States. Direct Investment from Bureau of Economic Analysis (BEA), annual series,
1978 to 1993.
Direct Investment by Industry from US Dept. Of Commerce, Survey of Current
Business, annual series, 1983 and 1993.
Aggregate export and import data from IMF Direction of Trade Statistics, annual
series, 1979 to 1995.
Disaggregated 1 and 2-Digit SIC bilateral exports and imports from Bureau of Census
database, annual series 1983 to 1995.
Exchange rates (Real Effective and bi-lateral US dollar rate) from IMF International
Financial Statistics, annual series (period average), 1979 to 1995.
Price indices from IMF International Financial Statistics, annual series, 1979 to 1995.
Gross Domestic Product and GDP Deflator from IMF International Financial Statistics,
annual series, 1979 to 1995.

20
C. Latin America: Argentina, Brazil, Chile. Exchange rates (Real Effective and bi-lateral
US dollar rate) from IMF International Financial Statistics, annual series (period average),
1979 to 1995.
Price indices from IMF International Financial Statistics, annual series, 1979 to 1995.
Gross Domestic Product and GDP Deflator from IMF International Financial Statistics,
annual series, 1979 to 1995.
D. SouthEast Asia: Indonesia, Malaysia, Philippines, Thailand. Exchange rates (Real
Effective and bi-lateral US dollar rate) from IMF International Financial Statistics, annual
series (period average), 1979 to 1995.
Price indices from IMF International Financial Statistics, annual series, 1979 to 1995.
Gross Domestic Product and GDP Deflator from IMF International Financial Statistics,
annual series, 1979 to 1995.

21
Table 3.1 Regional Trade Shares into Latin American and
SouthEast Asian Countries, 1993 (in percent)
United States Japan Europe China
Argentina 17.2 3.8 26.1 1.3
Brazil 21.2 6.5 26.2 1.5
Chile 21.4 12.3 23.5 2.0
Latin AmericanGroup
21.5 7.2 27.4 1.7
Indonesia 13.1 26.8 16.5 3.4
Malaysia 18.7 20.1 13.1 2.5
Philippines 26.4 19.6 12.6 1.2
Thailand 16.1 24.3 15.7 1.6
SouthEast
Asian Group
17.4 23.0 14.7 2.3
* Trade Share is calculated as the sum of bilateral exports plus bilateral imports relative
to total exports plus imports of the developing country. Data Source: IMF Direction of
Trade Statistics Yearbook, 1995.

22
Table 3.2 Regional FDI into Latin American and
SouthEast Asian Countries, 1993 (in millions of US$)
Destination\Source United States Japan Europe* World Total
Argentina 956 34 304 6305
Brazil 565 419 198 1292
Chile 214 3 130 841
Latin American
Group
1735 456 632 8438
Indonesia 559 813 57 2004
Malaysia 330 800 587 5006
Philippines 298 207 116 1025
Thailand 46 578 245 1726
SouthEastAsian Group
1233 2398 1005 9761
Data Sources: United States FDI data from the Bureau of Economic Analysis (BEA)and also published in the Survey of Current Business. Japanese FDI data from theJapanese Ministry of Finance Monthly Finance Review. Total FDI data from IMF,International Financial Statistics. *Europe includes Belgium, France, Germany, Italy,Netherlands, Portugal, Spain, Sweden and the United Kingdom. Data sources: OECDDirect Investment Yearbook provides FDI flow in source country currencies.Conversion to US $ values done using IFS period average exchange rates.
23
Table 3.3 Determinants of FDI from the United States and Japan into the Developing Country Panel
United States as FDI Source Japan as FDI Source
RERjt-1 -0.127
(0.573)1.782***(0.630)
-2.01***(0.740)
-0.916(0.767)
-3.06***(0.930)
RERust-1 0.174
(0.576)2.026**(0.798)
-0.117(0.971)
2.326***(0.731)
5.082***(1.479)
LA*RERjt-1 -2.78***
(0.675)1.149(0.751)
2.047**(1.025)
LA*RERust-1 -2.082**
(0.812)1.065
(1.077)-3.783**(1.654)
GDPit-1 1.845***
(0.507)2.271***(0.514)
2.671***(0.485)
1.241*(0.717)
0.853(0.821)
1.124(0.778)
GDPjt -3.651
(2.888)-3.186(2.715)
-3.946(2.570)
10.012(6.128)
9.143(6.509)
11.736*(6.235)
GDPjt-1 3.479
(3.226)2.709
(2.795)3.336
(2.867)-9.075(5.938)
-6.834(6.315)
-10.400*(6.051)
constant -16.006(9.972)
-12.65**(4.955)
-19.70**(8.897)
-9.702(13.404)
-32.7***(10.931)
-8.684(13.236)
F-tests
RERj, RERus 0.06 5.25***
RERj + LA*RERj 2.76* 0.64 1.38
RERus+LA*RERus 0.09 2.51 2.34
RERj , LA*RERj
RERus , LA*RERus6.25*** 4.13***
adj.R2 0.720 0.739 0.778 0.776 0.783 0.784
#obs 98 98 98 105 105 105
*, **, *** indicate statistical significance at the 10, 5, and 1 percent levels,respectively, in all tables with regression results. Also, in all tables, standard errors inparentheses.

24
Table 3.4 Determinants of FDI from U.S. and Japan into Latin American Panel
United States as FDI Source Japan as FDI Source
RERjt-1 -0.246
(0.682)0.300
(0.415)-1.881(1.439)
RERust-1 -0.091
(0.165)0.140
(0.663)2.148
(1.360)
GDPit-1 5.460***
(0.870)5.425***(0.885)
0.124(1.850)
-0.707(1.889)
GDPfdi sourcet -6.826*
(3.492)-6.552*(3.617)
15.264(13.003)
11.338(12.994)
GDPfdi sourcet-1 5.466
(3.626)4.876
(4.019)-12.462(12.447)
-10.024(12.306)
constant -40.821***(6.461)
-36.968***(12.516)
-34.359*(19.216)
0.535(29.034)
F-tests
RERj, RERus 0.21 1.52
adj.R2 0.899 0.897 0.667 0.680
#obs 42 42 45 45

25
Table 3.5 Determinants of FDI from U.S. and Japan into S.E. Asia Panel
United States as FDI Source Japan as FDI Source
RERjt-1 1.462**
(0.695)-0.761(0.702)
-2.615***(0.720)
RERust-1 1.168
(0.768)-0.138(0.968)
4.948***(1.077)
GDPit-1 1.915***
(0.601)1.811***(0.583)
0.857(0.862)
1.498**(0.745)
GDP fdi sourcet 0.038
(3.289)-1.548(3.266)
5.165(6.596)
11.066*(5.748)
GDP fdi sourcet-1 -1.655
(3.399)1.776
(3.667)-2.658(6.552)
-9.601*(5.767)
constant 0.535(6.871)
-20.910(12.167)
-33.632(13.487)
-5.895(12.949)
F-tests
RERj, RERus 3.45* 11.36***
adj.R2 0.328 0.373 0.668 0.760
#obs 56 56 60 60

26
Table 3.6 Imports from U.S. or from Japan into Developing Country Panel (regressions use bilateral real exchange rates relative to import source)
Imports from United States Imports from Japan
RERt 0.234***(0.066)
0.266***(0.074)
0.064(0.101)
0.060(0.101)
RERt-1 0.341***(0.067)
0.315***(0.072)
0.254**(0.105)
0.262**(0.105)
GDPit 1.785***
(0.506)1.567***(0.564)
2.921***(0.717)
2.805***(0.728)
GDPit-1 -0.2216
(0.519)-0.117(0.545)
-1.230*(0.696)
-1.239*(0.714)
GDPimport sourcet -2.068**
(0.947)-1.752*(1.010)
-4.091**(2.081)
-3.495*(2.124)
GDPimport sourcet-1 1.928**
(0.971)1.648
(1.046)3.548*(2.017)
2.998(2.053)
FDIus t 0.27
(0.076)0.037
(0.080)0.070
(0.055)
FDIus t-1 0.034
(0.078)0.027
(0.082)0.003
(0.056)
FDIjapan t -0.001
(0.024)0.089***(0.033)
0.088***(0.034)
FDIjapan t-1 0.028
(0.027)0.069**(0.035)
0.067*(0.035)
constant -4.297**(1.825)
-3.629*(2.155)
-2.938(3.600)
-2.405(3.615)
F-tests
RERt, RERt-1 79.97*** 62.99*** 8.40*** 8.57***
FDIus t , FDIus
t-1 1.61 1.74 1.65
FDIjapan t ,FDIjapan
t-1 0.64 12.56*** 11.75***
adj.R2 0.913 0.912 0.944 0.944
#obs 84 83 97 97

27
Table 3.7 Imports from U.S. or from Japan into Latin American Panel (regressions use bilateral real exchange rates relative to import source)
Imports from United States Imports from Japan
RERt 0.272***(0.086)
0.288***0.102)
0.1370.130
0.1250.132
RERt-1 0.353***(0.088)
0.339***(0.098)
0.327**(0.139)
0.333**(0.148)
GDPit 1.292
(0.889)0.924
(1.033)3.047***(1.028)
2.308*(1.208)
GDPit-1 -0.678
(0.875)-0.093(1.000)
0.447(1.051)
0.674(1.318)
GDPimport sourcet -0.986
(1.979)-0.334(2.230)
0.564(4.005)
-0.171(4.391)
GDPimport sourcet-1 1.086
(1.901)0.776
(2.149)-1.545(3.480)
-0.690(4.136)
FDIus t 0.049
(0.118)0.064
(0.123)0.196
(0.164)
FDIus t-1 0.080
(0.108)0.105
(0.117)-0.135(0.167)
FDIjapan t -0.026
(0.036)0.037
(0.048)0.039
(0.051)
FDIjapan t-1 0.023
(0.041)-0.001(0.050
0.002(0.053)
constant -4.359(4.512)
-3.386(4.728)
-16.172**(6.377)
-12.754*(7.398)
F-tests
RERt, RERt-1 44.85*** 39.42*** 9.35*** 8.41***
FDIus t , FDIus
t-1 1.79 2.58 0.20
FDIjapan t ,FDIjapan
t-1 0.00 0.29 0.32
adj.R2 0.904 0.901 0.792 0.788
#obs 42 41 41 41

28
Table 3.8 Imports from U.S. or from Japan into SouthEast Asian Panel (regressions use bilateral real exchange rates relative to import source )
Imports from United States Imports from Japan
RERt 1.012***0.386
0.848**0.368
0.742**0.355
1.242***0.239
0.523**0.215
0.590***0.222
RERt-1 0.1120.381
0.0040.364
0.0680.347
-0.2780.264
0.0080.205
0.0510.229
GDPit 2.678***
0.6453.055***
0.6252.009***
0.7607.312***
0.9265.021***
0.9035.331***
0.920
GDPit-1 -0.985
0.658-0.8820.617
-0.0560.731
-6.025***0.942
-4.438***0.880
-4.650***03886
GDPimport sourcet -1.783*
0.940-1.1070.939
-0.8950.906
-5.388***1.826
-7.135***1.408
-7.456***1.414
GDPimport sourcet-1 1.364
0.9980.3101.033
-0.1811.006
6.412***1.831
7.592***1.391
7.966***1.405
FDIus t -0.095
0.177-0.0370.175
-0.0640.041
FDIus t-1 -0.214
0.144-0.265*0.139
0.0110.039
FDIjapan t 0.077*
0.0410.082**0.039
0.081**0.039
FDIjapan t-1 0.024
0.0350.179***
0.0370.172**0.038
constant -0.3902.179
-1.8882.133
1.7792.584
-18.412***3.822
-5.2203.636
-6.910*3.791
F-tests
RERt, RERt-1 12.01*** 6.95*** 6.78*** 19.50*** 8.82*** 10.35***
FDIus t , FDIus
t-1 5.43** 5.49** 0.84
FDIjapan t ,FDIjapan
t-1 5.04** 34.17*** 31.70***
adj.R2 0.919 0.929 0.935 0.920 0.955 0.955
#obs 42 42 42 56 56 56
29
Table 3.9 Exports to U.S. or Japan from Full Developing Country Panel (regressions use bilateral real exchange rates relative to export destination )
Exports to United States Exports to Japan
RERt 0.057(0.101)
0.058(0.102)
-0.001(0.100)
0.110(0.092)
0.068(0.094)
0.066(0.088)
RERt-1 -0.031(0.103)
-0.031(0.104)
-0.079(0.098)
-0.185*(0.101)
-0.237**(0.098)
-0.224**(0.091)
GDPit 1.076
(0.724)1.164
(0.745)0.136
(0.710)2.20***(0.674)
1.431**(0.669)
1.311**(0.633)
GDPit-1 0.181
(0.729)0.119
(0.751)0.739
(0.685)-0.973(0.686)
-0.556(0.650)
-0.759(0.620)
GDPexport destinationt 1.522
(1.326)1.417
(1.353)2.956**(1.264)
-0.414(1.980)
-2.294(1.944)
-0.836(1.846)
GDPexport destinationt-1 -0.911
(1.360)-0.808(1.384)
-2.673**(1.298)
0.397(1.926)
2.009(1.885)
0.695(1.784)
FDIus t -0.035
(0.058)-0.010(0.052)
0.118**(0.048)
FDIus t-1 0.021
(0.058)-0.015(0.052)
0.073(0.049)
FDIjapan t .131***
(0.031)0.072**(0.031)
0.064**(0.029)
FDIjapan t-1 0.067*
(0.034)0.081**(0.032)
0.074**(0.030)
constant -9.34***(2.491)
-9.54***(2.583)
-4.088(2.565)
-3.945(3.112)
2.391(3.363)
3.505(3.142)
F-tests
RERt, RERt-1 0.07 0.07 0.65 0.56 2.73* 2.75*
FDIus t , FDIus
t-1 0.05 0.22 14.57***
FDIjapan t ,FDIjapan
t-1 21.3*** 13.45*** 12.45***
adj.R2 0.863 0.860 0.888 0.944 0.950 0.957

30
#obs 98 98 97 98 97 97
Table 3.10 Exports to U.S. or Japan from Latin American Country Panel (regressions use bilateral real exchange rates relative to exportdestination )
Exports to United States Exports to Japan
RERt 0.009(0.065)
0.006(0.066)
-0.028(0.068)
0.064(0.072)
0.060(0.082)
0.038(0.074)
RERt-1 -0.069(0.066)
-0.074(0.068)
-0.967(0.065)
-0.158*(0.083)
-0.196**(0.087)
-0.126(0.082)
GDPit -0.257
(0.564)0.090
(0.686)-0.357(0.686)
1.87***(0.625)
1.714**(0.644)
1.284*(0.674)
GDPit-1 0.693
(0.594)0.519
(0.675)1.011
(0.665)0.117
(0.656)0.294
(0.658)-0.654(0.735)
GDPexport destinationt 2.481*
(1.329)2.063
(1.526)3.369**(1.481)
1.231(2.214)
-0.038(2.506)
1.781(2.449)
GDPexport destinationt-1 -1.309
(1.349)-0.938(1.467)
-2.513*(1.428)
-1.018(2.322)
-0.030(2.403)
-1.261(2.307)
FDIus t -0.091
(0.091)-0.055(0.082)
0.143(0.091)
FDIus t-1 0.064
(0.083)-0.003(0.078)
0.086(0.093)
FDIjapan t 0.074***
(0.024)0.041
(0.030)0.019
(0.028)
FDIjapan t-1 0.036
(0.027)0.033
(0.031)0.012
(0.030)
constant -6.71***(2.318)
-7.993**(3.481)
-6.609**(3.141)
-15.4***(3.615)
-12.06***(3.991)
-6.359(4.126)
F-tests
RERt, RERt-1 0.75 0.90 3.56* 1.17 2.05 0.99
FDIus t , FDIus
t-1 0.13 0.69 8.88***

31
FDIjapan t ,FDIjapan
t-1 9.48*** 3.14* 0.58
adj.R2 0.966 0.965 0.973 0.942 0.944 0.954
#obs 42 42 41 42 41 41
Table 3.11 Exports to U.S. or Japan from SouthEast Asian Country Panel (regressions use bilateral real exchange rates relative to exportdestination )
Exports to United States Exports to Japan
RERt 1.723***(0.480)
1.741***(0.486)
1.37***(0.493)
0.91***(0.308)
0.279(0.319)
0.266(0.338)
RERt-1 0.743(0.497)
0.677(0.511)
0.710(0.489)
0.143(0.340)
0.364(0.304)
0.455(0.348)
GDPit 3.416***
(0.939)3.397***(0.952)
1.612(1.153)
5.26***(1.194)
2.053(1.341)
2.188(1.401)
GDPit-1 -1.665*
(0.950)-1.767*(0.967)
-0.232(1.137)
-3.56***(1.214)
-0.952(1.308)
-0.983(1.350)
GDPexport destinationt 2.675**
(1.282)2.504
(1.309)2.540*(1.273)
0.887(2.355)
-1.031(2.091)
-1.106(2.154)
GDPexport destinationt-1 -1.979
(1.345)-1.686(1.393)
-2.079(1.353)
-0.932(2.361)
0.310(2.067)
0.366(2.140)
FDIus t 0.011
(0.056)0.016
(0.054)-0.026(0.063)
FDIus t-1 0.051
(0.054)0.038
(0.052)-0.026(0.063)
FDIjapan t 0.135**
(0.056)0.167***(2.898)
0.171***(0.059)
FDIjapan t-1 0.002
(0.051)0.106*(0.056)
0.104*(0.057)
constant -5.472*(2.758)
-5.561*(2.792)
-2.072(3.050)
-8.991*(4.927)
4.580(5.401)
3.735(5.774)
F-tests
RERt, RERt-1 66.17*** 59.13*** 34.97*** 13.9*** 5.86** 5.64**

32
FDIus t , FDIus
t-1 0.68 0.55 0.36
FDIjapan t ,FDIjapan
t-1 4.61** 17.04*** 16.18***
adj.R2 0.863 0.860 0.872 0.927 0.945 0.943
#obs 56 56 56 56 56 56
1. Goldberg and Kolstad (1995) show that exchange rate risk influences both trade andinternational investment flows, which in part substitute for trade. The pattern of effects ofexchange rate risk on these flows depends on the correlations between shocks to exchange ratesand shocks to demand and costs in respective home and foreign markets.
2. Goldberg (forthcoming, 1997) explores the effects of exchange rate movements on totalinvestment in Latin American countries, but does not break out the effects on domestic versusforeign investors.
3. Kohsaka (1996) also discusses possible root causes of changing inter- and intra-regional
capital flows, especially in Asia, but does not formally specify or test any hypotheses.
4. Our results can be contrasted with and complement Frankel and Wei=s (1994) correlationsbetween bilateral exchange rate variability and bilateral trade flows. The latter results showthat variability per se slows trade mildly in some regions.
5. Sometimes these countries are called the ANIEs, i.e. the Asian Newly IndustrializedEconomies. The sum of the NICs and SouthEast Asia and China are sometimes referred to asPacific Asia.
6. Mexico is excluded due to its particular set of close ties to the United States. The LatinAmerican countries selected are significant trade and investment partners of the United Statesand Japan.
7. Annual FDI flows are quite variable over time, so annual ratios are indicative of relativescales of activity but not representative of consistent patterns in country investment shares. Forreference, we also report the amount of FDI from Europe and the total of all FDI into thecountry, calculated from the Balance of Payments Statistics of the country and reported in theIMF=s International Financial Statistics. We do not present the source country FDI series as apercentage of the IFS total: these series from different sources are not compatible numbers.Unlike the trade data, the data on FDI flows into developing countries are less reliable andmore volatile series. The FDI series that we utilize for the United States are flow data

33
computed by the Bureau of Economic Analysis and reported in the Survey of Current Business.The shortcomings of these series have been extensively discussed elsewhere and will not bereiterated here [see DeWenter, 1995]. Despite the criticisms of the United States FDI series,we still may be on much stronger grounds with this data, compared with our data on Japaneseoutward FDI, reported in Monthly Finance Review of the Japan Ministry of Finance.Matsuoka and Rose (1994) reports that MOF data exclude FDI resulting from retainedearnings, the opening and expanding of branches, and the purchase of land. Also, the MOFdata are calculated by summing up nominal dollar investments over time, without price indexadjustments.
8. 1993 data from United States Bureau of Census database.
9. The flows are the difference between cumulative annual stocks.
10. Klein and Rosengren (1994) and Dewenter (1995) provide empirical support for thischannel in inward FDI to the United States.
11. The imperfect capital market channel has the additional prediction that the ratio of domesticto foreign investors (and relative shares of different foreign investors) in financing domesticinvestment opportunities should fall when the domestic currency depreciates.
12. Goldberg and Kolstad (1995) also show that FDI can replace exports when the FDI isinduced by the volatility of exchange rates.
13. The US PPI is used to convert the trade data into constant dollars. The bilateral realexchange rate data are expressed as price in panel country relative to the PPI in the UnitedStates or Japan. The specific price deflator varies across the panel countries due to dataavailability. The PPI is used for Chile; the WPI is used for Indonesia, Thailand, and thePhilippines, and the CPI is used for Malaysia, Argentina, and Brazil.
14. Frenkel and Wei (1994) estimate the weights on various currencies in practice in the basketpegs pursued by Asian countries. These computations are done by regressing respectiveforeign currency values against the domestic currency, with all exchange rates expressedrelative to a >neutral@ base, the Swiss Franc.