foreign direct investments in bulgaria: …anale.feaa.uaic.ro/anale/resurse/ec3goev.pdfforeign...
TRANSCRIPT

FOREIGN DIRECT INVESTMENTS IN BULGARIA: MAIN RESULTS OF
FOREIGN INVESTORS SURVEYS
Valentin GOEV
Faculty of Applied Informatics and Statistics
University of National and World Economy
Sofia, Bulgaria
Venelin BOSHNAKOV
Faculty of Applied Informatics and Statistics
University of National and World Economy
Sofia, Bulgaria
Ekaterina TOSHEVA
Faculty of Applied Informatics and Statistics
University of National and World Economy
Sofia, Bulgaria
Abstract
The paper presents some main results obtained from a survey of foreign investors in Bulgaria
conducted at the end of year 2009. The goal of the survey was to reveal and outline various aspects
and effects of the operation of foreign controlled companies on the improvement of inter-firm relations
during the continuing restructuring of Bulgarian economy after the official EC membership since
2007. А comparison with results from a similar survey conducted in 2001 is derived in order to assess
the main shifts occurred in respect of these effects during the EU accession period.
Keywords: foreign direct investment, questionnaire survey, inter-firm relations, Bulgaria.
JEL classification: F21, F23
1. INTRODUCTION
Foreign investment influx in Bulgaria has always been the focus of special interest to
Bulgarian and foreign researchers. This interest has been growing in parallel with the im-
pressive increase in the amount of foreign direct investment /FDI/ after year 2002. While in
the initial stage of the European integration of Bulgaria (1999) the FDI amounted to 866
million EUR, by year 2007 the cumulative volume of FDI was already 8.6 billion EUR, i.e.

388 Valentin GOEV, Venelin BOSHNAKOV, Ekaterina TOSHEVA
a growth of approximately 10 times during this period. Another phenomenon of the Bulgari-
an economy during this period with such a remarkable expansion is hardly to be found. In
this respect, the main direction of the research on FDI in Bulgaria is related to the role and
impact of FDI on the economic development of the country. This is fully understandable, as
far as FDI play the role of one of the most important factors for economic recovery of the
Bulgarian economy during the market transition.
However, it is also important to seek answers to few other research questions such as:
why foreign investors come to Bulgaria, what are their strategies for entering the Bulgarian
market, how are the FDI realized; what are the preferred economic sectors, what kind of re-
lationships with local companies – customers and suppliers – are created. The answers to
these and other related questions were explored through sample questionnaire surveys
among representatives of foreign investors in Bulgaria. Among others, such surveys have
been conducted in the years 2001 and 2009 and some main results of these surveys are pre-
sented in this study. The survey results can be considered as representative for medium- and
large-scale foreign investors and are restricted to companies with headquarters established in
Western Europe.
The following study consists of two parts. The first part presents a brief review of the
theoretical views and some fundamental tenets of the dominant theories for foreign invest-
ments on the basis of which the survey objectives and research tasks were formulated. The
second part is essentially empirical and presents selected results from these studies which
seek to provide clarification to some of the above mentioned issues.
2. SHORT LITERATURE REVIEW
Тhe world’s scientific literature suggests a number of theoretical views on foreign di-
rect investments and the factors behind the reallocation of production activities abroad,
particularly to the emerging market economies in Europe and Asia. In the 70's and 80's of
the last century, research on the activities of multi- and transnational companies were domi-
nated by established theoretical views on international business. Various authors studied
specific aspects and factors such as the imperfections in capital markets, technology trans-
fer, organizational and entrepreneurial skills; the relation between the effectiveness of the
production cycle and production localization; the forms of cross-border business strategies
for acquisition of property; the effective technology transfer and utilization of comparative
advantages, the possible positive and negative "externalities" of the activities of foreign in-
vestors and others [see for example Vernon, 1974; Buckley & Casson, 1985; Buckley, 1987;
Casson, 1990; Caves, 1996; Norbäck, 2001; Markusen, 2001; Konrad & Lommerund, 2001;
Haddad & Harrison, 1993; Desai et al., 2005; etc.].
An important one among these views is the so called "theory of internalization" seek-
ing an explanation of the decision “to buy” or “to make” as well as the emergence of
specific non-market mechanisms, suggesting the use of intermediate forms and agreements
for cooperation, strategic alliances, developing joint ventures, etc. [Buckley & Casson,
1985; Casson, 1992]. It provides a grounded theoretical framework in which to analyze the
decision whether a foreign company should be improved by "absorption" of the specific ac-
tivity (i.e. "to make”) or should contract for external delivery (i.e. "to buy”). The motivation
for "internalization" or buying from the market depends on different groups of factors spe-
cific to the industry, the region, the country, and the company. The famous author John
Dunning developed the so called "eclectic paradigm", which outlines the cross-border initia-

Foreign Direct Investments in Bulgaria: Main Results of Foreign Investors Surveys 389
tives of multinational companies depending on the configuration of three factors, respective-
ly "ownership-location-internalization" [Dunning, 1993; 1995].
The development of the so-called "theory of networks” is related to the occurrence of
specific interactions in which foreign economic agents establish direct and lasting relation-
ships with local organizations aiming to stabilize and control resources, information and
production flows. Such relationships are typically based on information, reciprocity, trust,
acceptance of rules for loyalty, etc. [Dunning, 1993; Graber & Stark, 1997; Markusen &
Venables, 1999; Norbäck, 2001; Ghauri et al., 2005]. Despite the accumulated scientific
knowledge in various fields of foreign investment, however, more and more popular be-
comes the view that traditional theories, together with the views of internalization, are not
sufficiently compelling in the study of foreign investment in emerging market economies
[Meyer, 1998; Moosa, 2002; Campos & Kinoshita, 2003; Demekas et al., 2004; etc.].
Economic studies show traditionally high interest in the characteristics and factors of
cross-border movement of capital to the countries of Central and Eastern Europe /CEE/. The
motivation of companies-investors to relocate their activities in CEE countries is identified
as an important aspect of these processes. The organizational forms, long-term strategies,
motivation for investment decisions, and the effects of "attracting" factors (geographical,
economic, human and natural resources) in these countries, and particularly those of South-
East Europe have been studied by a wide range of researchers [see for example Djarova,
1996; Rizopoulos, 1997; Bevan et al., 2001; CSD, 2001; Todeva & Ebbers, 2002; Mintchev
et al., 2002; Campos & Kinoshita, 2003; Hunya, 2004; Marangozov, 2005, etc.).
In large extent, FDI studies focus on traditional issues related to the characteristics of
the profile of the countries towards which investment is directed, and the orientation of
transnational companies to search for the specific comparative advantages of the realloca-
tion of its business in CEE countries. Currently, research in this area is reporting more and
more effects associated with the process of economic globalization and reduction in the
number of barriers to the free movement of capital across borders. Along with this emphasis
is placed on: motivational mechanisms, processes of decision-making by transnational com-
panies to enter into certain countries and regions; linking corporate strategies for entering
using the "attracting" factors in the country where the subdivision is built, the role of rising
competitiveness on product markets, etc. [see for example Moosa, 2002; Meyer 1995; Ernst
& Young, 2008; Garibaldi et al., 2002; Campos & Kinoshita, 2003; Demekas et al., 2004;
Demirbag et al., 2007; Botric & Skuflic, 2006; etc.].
The results of various studies indicate that the analyzes of investment opportunities in
Bulgaria are tied to the strategic goals of companies-investors [Djarova, 1999; Ana-
stassopoulos et al., 2000; KPMG, 2000; Mintchev et al., 2002; Dimova, 2004; Marangozov,
2005; Grigorova, 2007; Marangozov, 2009; etc.]. Some of the trends in particular character-
istics of the local and international joint ventures in Bulgaria are empirically tested, e.g. the
evolution of the number of such established companies, the branch structure and their terri-
torial concentration, the distribution of equity between partners, the size of these companies,
etc. [Marangozov, 2009]. As major causes for this process are identified some qualitative
changes in the business environment (such as the intensification of competition related to
the regionalization and globalization, the shortening of life cycles of products, the accelera-
tion of the rate of technological change, etc.). The impact of these factors made it necessary
to invest significant resources in company self-development of the so called "value chain" of
transnational companies. It is believed that companies with mostly high organizational and

390 Valentin GOEV, Venelin BOSHNAKOV, Ekaterina TOSHEVA
technological development will be able to secure competitive advantages through cross-
border relocation of production and/or distribution of its products.
3. MAIN RESULTS OF THE SURVEYS
3.1. General formulation of the surveys
The surveys conducted in 2001 and 2009 on the impact of relocation of some activities
of European companies on the development of inter-firm relations in Bulgaria use the same
methodology and similar sample size. The method of providing primary data in 2001 and in
2009 was the same – "face to face" interview during which a questionnaire is filled in: 89
firms were interviewed in 2001 and 99 companies were interviewed in 2009. The companies
were randomly selected from a big group that includes companies-investors in Bulgaria hav-
ing the largest volume of realized foreign investment. Therefore the results can be
considered representative only for medium-sized and large foreign investors in Bulgaria that
are registered at the Bulgarian Investment Agency (formerly, Agency for Foreign Invest-
ments). Both questionnaires were structured in a similar way with four blocks of questions:
“General information" (A), "Relationships with suppliers and customers" (B), "Relation-
ships with banks, financial institutions and public administration" (C) and "Passport data"
(D).
Despite the uniform structure the questions in the two questionnaires are not absolutely
identical. There are some differences both in the number of questions and in their content.
These modifications are due to the varying conditions under which the surveys were con-
ducted, the objective circumstances and characteristics of the economic situation in
Bulgaria, and the experience gained from the study conducted in 2001. The most substantial
divergences are in block B. Regardless of this, the content of the questions is similar and the
comparative analysis of the results of both surveys is undoubtedly consistent. It should high-
light the major changes that have occurred in the type, size and origin of foreign investors in
Bulgaria, their relationships with suppliers and customers, as well as with banks and official
institutions during the period between 2001 and 2009.
The first study was conducted three years after the bank and currency crisis year for
Bulgaria (1997) – a year of hyperinflation and when a currency board system was intro-
duced. Four years later (2001) the economic situation in Bulgaria could be described as
stable and in many aspects attractive to foreign investments. The next survey in 2009 was
conducted two years after the accession of Bulgaria to the European Union and one year af-
ter the financial crisis of the 2008 autumn when its consequences have not yet reached their
full effect in Bulgarian economy. The 5 years period before the second survey can still be
characterized as favorable for foreign investors, so in this sense, the comparison is made for
two periods when the economic environment is generally characterized as stable and attrac-
tive for foreign investment activities.
3.2.Basic characteristics of the companies
Particular disparities of surveyed companies are identified by some changes in the in-
dustry affiliation, size, ownership structure, and countries in which they are headquartered.
In 2009 compared to 2001 there is an increase in the number of companies in services sector
– trade, finance, tourism, transport – as well as the construction industry. This increase is on

Foreign Direct Investments in Bulgaria: Main Results of Foreign Investors Surveys 391
account of the reduction of nearly 10 percentage points of manufacturing companies - they
were 58.4% of the total number of companies surveyed in 2001 while in 2009 this percent-
age dropped to 48.5%. Unlike 2001 when there were 3 foreign companies in agriculture in
2009 there were none. The reasons for this may be sought in two directions: first, the dimin-
ishing number of foreign companies in this sector, and second, very few companies in the
industry and thus (because the mechanisms of sample formation) very low probability of se-
lection of such companies.
Table no. 1 Sectoral distribution of respondent companies
Sector 2001 2009
Count % Count %
Manufacturing 52 58.4 48 48.5
Trade 14 15.7 21 21.2
Finance 2 2.2 6 6.1
Tourism 1 1.1 3 3.0
Transport 3 3.4 8 8.1
Telecommunications 2 2.2 2 2.0
Construction 1 1.1 5 5.1
Agriculture 3 3.4 – –
Other 11 12.4 6 6.1
Total 89 100.0 99 100.0
There are significant changes in the distribution of firms by number of employees. In
2001 the share of companies with 200 employees was 66.3% whereas in 2009 this share de-
creased by nearly 15 percentage points to 52.5%. Moreover, the proportion of very large
companies (those with over 500 employees) in 2001 was about 10% while in 2009 it was
nearly 30%. This shows that, for the covered period, there was a clear trend towards increas-
ing the share of larger companies-foreign investors in Bulgaria.
47.2
19.1
23.6
5.6
3.4
1.1
41.4
11.1
17.2
13.1
11.1
4.0
0 5 10 15 20 25 30 35 40 45 50
Up to 100
101 to 200
201 to 500
501 to 1000
1001 to 2000
Over 2000
2009
2001
Figure no. 1 Size distribution of respondent companies (number of employees)

392 Valentin GOEV, Venelin BOSHNAKOV, Ekaterina TOSHEVA
Shifts in the ownership structure of respondent companies have been observed.
In 2001 about 15% of the surveyed companies were up to 50% foreign equity and
36% with total foreign participation.
In 2009 the share of firms with a substantial share of foreign participation has
increased – only 2% had up to 50% share of foreign-controlled capital and over
70% of the companies had 100% foreign capital.
A disparity is found in the distribution of firms by country in which company head-
quarter is located as well as the number of countries where this principal owns subsidiaries.
In 2009 the proportion of firms with headquarters in Germany, Italy and Austria has in-
creased: the share of German investors had increased from 22 to 27%; a substantial increase
in the proportion of Italian and Austrian companies has also been observed by nearly 9 per-
centage points (from 5 to 14% for Italian and from 3 to 12% for Austrian companies). In the
same time, the share of companies based in Greece and Cyprus decreased. The comparison
of the distributions of respondents by number of countries in which the investor company
has subsidiaries is presented in Figure2. There is a clearly expressed trend of change in the
type of foreign firms in our country - more and more large multinational companies with
branches in over ten or even more than 20 countries invest in Bulgaria.
3.3. Reasons for entering Bulgarian economy
One of the core questions raised in the survey was related to the reasons of the foreign
companies to enter Bulgarian economy. In both surveys nearly two thirds of the respondents
indicate as a main reason “long-term strategy for entering the CEE markets”. This reason,
together with “taking market positions in Bulgaria”, are the most frequently declared incen-
tives. Difference is observed in respect of “market positioning” which was identified by
larger share of companies in 2001 (85%) compared to 2009 (64%). A significant reduction
of responses is observed in respect to “economies in production costs” (also identified as a
reason for FDI influx) – almost twice lower is the share of companies that have indicated
this reason in 2009 compared to 2001. A clear conclusion can be derived that larger share of
the foreign investors active in 2009 considered their investments in Bulgaria as part of their
overall expansion in CEE and not directly related to economies of production costs.

Foreign Direct Investments in Bulgaria: Main Results of Foreign Investors Surveys 393
65.2
21.3
43.8
85.4
66.7
26.3
21.2
63.6
0 20 40 60 80 100
Long-term strategy for entering CEE
Serious competition on the traditional markets
Economies of production costs
Occupying market positions in Bulgaria
2009
2001
Figure no. 2 Share of companies indicated particular main reason
for entering Bulgarian economy
The changes in responses to questions about the biggest market for the production of
foreign investors and their major competitors are very indicative for the shifts occurred in
the period. The number of those who indicated the EU market as the most important for
their company production increased in 2009 compared to 2001 by 60% (from 26 to 42 com-
panies). At the same time, the relative share of those who indicated the national Bulgarian
market as the main market decreased by 13 percentage points in 2009 compared to 2001.
An essential increase is found for the number of those foreign investors who indicated
that other foreign companies are their main competitors. If in 2001 only 19 firms (22%)
identified as their rivals firms from abroad whereas in 2009 their share have doubled (46%).
At the same time the share of respondents who indicated Bulgarian national companies as
main competitors has significantly decreased (from 36% in 2001 to 10% in 2009).
Table no. 2 Largest markets for the Bulgarian affiliate of the foreign investors
Market 2001 2009
Count % Count %
Domestic market 55 61.8 48 48.5
EC market 26 29.2 42 42.4
Other international markets 8 9.0 9 9.1
Total 89 100.0 99 100.0
All this provides evidence that, compared to 2001, in 2009 foreign investors in Bulgar-
ia exported a substantial share of their overall product to the European and other
international markets. In other words, two years after the EU membership the Bulgarian af-
filiates of respondent companies are competitively involved in greater extent on the
international markets. This conclusion is somehow related to the results obtained by the
question "How would you assess the level of technology used by you in Bulgaria in compar-
ison with the average technological level of the industry in the European Union countries?".
394 Valentin GOEV, Venelin BOSHNAKOV, Ekaterina TOSHEVA
While in 2001 only five firms (or 6%) indicated technological level in Bulgaria as higher
than the EU average, in 2009 their share was already 17%.
3.4
4.5
3.4
5.6
11.1
13.1
11.1
11.1
0 2 4 6 8 10 12 14
Priority investment projects /valueover 5 mln.USD/
Investment projects creating morethan 100 jobs
Investment projects in highunemployment regions
Preferences under the Law onCorporate Taxation
2009
2001
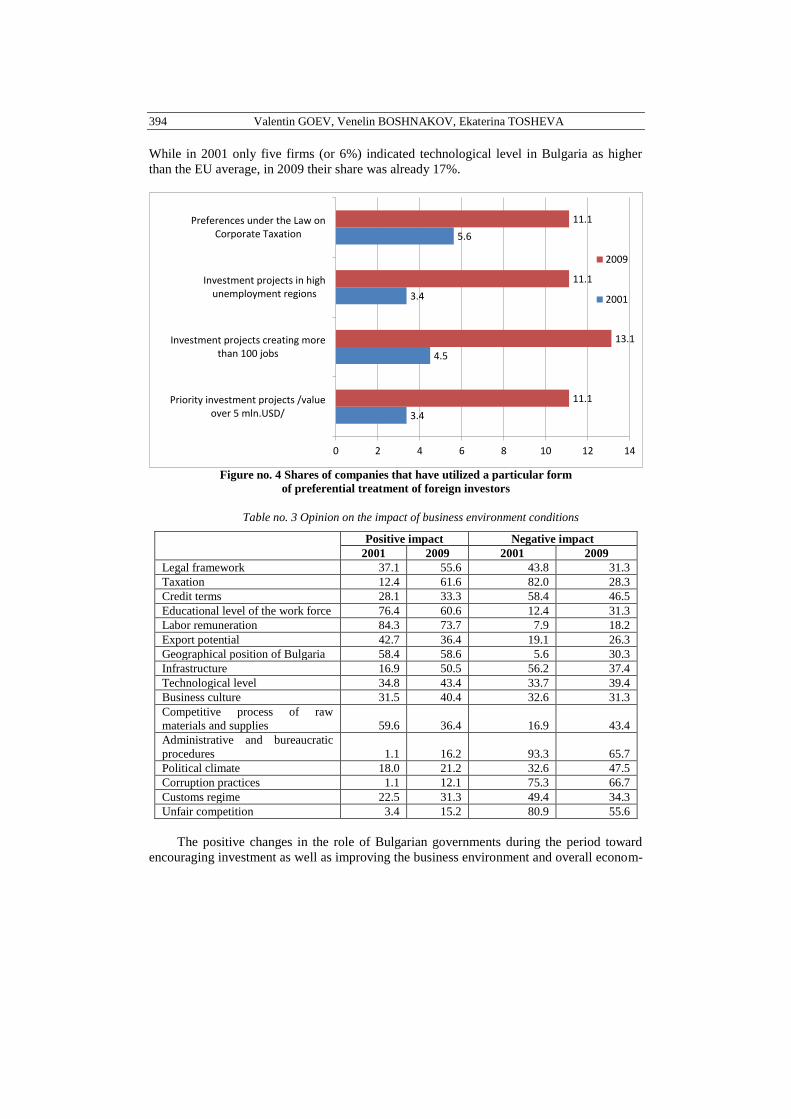
Figure no. 4 Shares of companies that have utilized a particular form
of preferential treatment of foreign investors
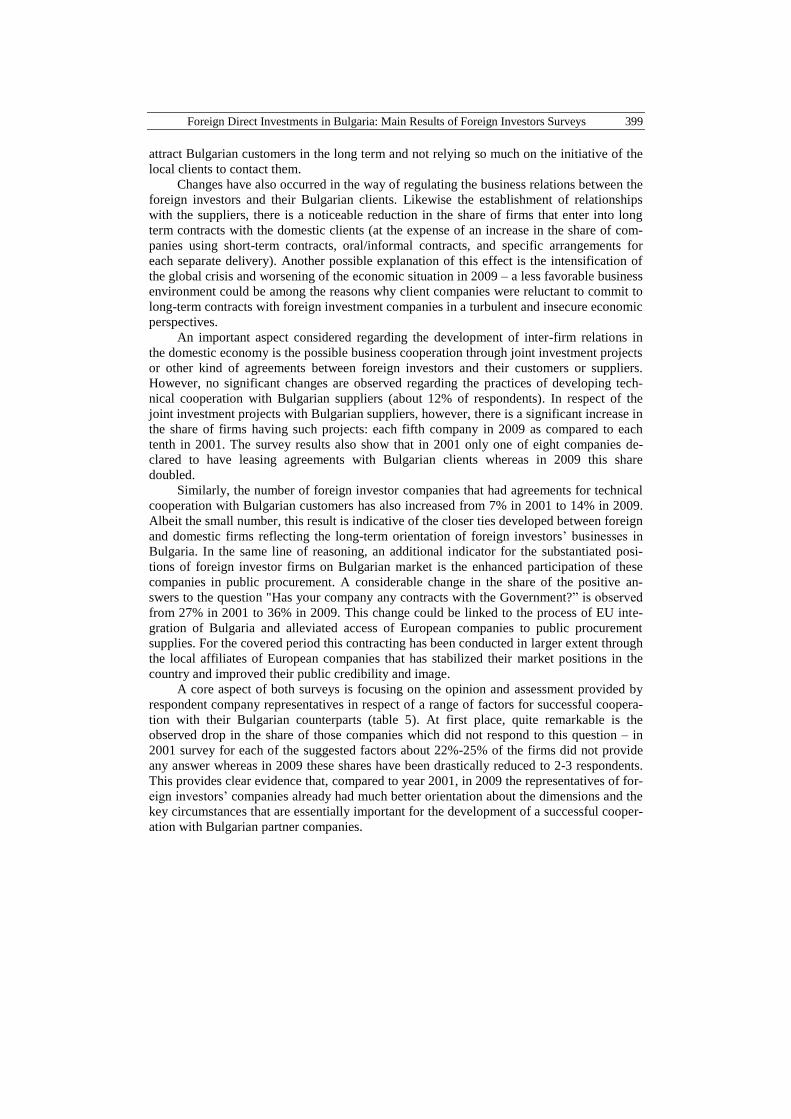
Table no. 3 Opinion on the impact of business environment conditions
Positive impact Negative impact
2001 2009 2001 2009
Legal framework 37.1 55.6 43.8 31.3
Taxation 12.4 61.6 82.0 28.3
Credit terms 28.1 33.3 58.4 46.5
Educational level of the work force 76.4 60.6 12.4 31.3
Labor remuneration 84.3 73.7 7.9 18.2
Export potential 42.7 36.4 19.1 26.3
Geographical position of Bulgaria 58.4 58.6 5.6 30.3
Infrastructure 16.9 50.5 56.2 37.4
Technological level 34.8 43.4 33.7 39.4
Business culture 31.5 40.4 32.6 31.3
Competitive process of raw
materials and supplies 59.6 36.4 16.9 43.4
Administrative and bureaucratic
procedures 1.1 16.2 93.3 65.7
Political climate 18.0 21.2 32.6 47.5
Corruption practices 1.1 12.1 75.3 66.7
Customs regime 22.5 31.3 49.4 34.3
Unfair competition 3.4 15.2 80.9 55.6
The positive changes in the role of Bulgarian governments during the period toward
encouraging investment as well as improving the business environment and overall econom-

Foreign Direct Investments in Bulgaria: Main Results of Foreign Investors Surveys 395
ic conditions significantly affected the activities of foreign firms. While in 2001 only 15
firms (or 17%) benefited from incentives for foreign investors provided by the Bulgarian
legislation, in 2009 their number was almost doubled to 29 (30%). Interesting results have
been obtained when the respondents have been asked to express their opinion whether cer-
tain element of Bulgarian business environment had positive or negative impact on their
operation (table 3). The greatest increase in the share of positive evaluation (and the corre-
sponding decrease in the share of negative evaluation) is identified regarding circumstances
such as: taxation, country’s infrastructure, administrative and bureaucratic procedures, and
unfair competition. It could be asserted that, compared to year 2001, Bulgaria substantially
improved these conditions up to 2009 from the point of view of foreign investors.
On the other hand, a decrease is also observed in the share of positive evaluations re-
garding the prices of raw materials, the wage level, and the educational level of the
population. Therefore, in 2009 these were not the most important factors to foreign investors
for developing the businesses of their Bulgarian affiliates. For the studied period there are
also improvements in conditions such as: customs regime, overall technological level, and
business culture of management. In the same line of reasoning, a positive shift is perceived
regarding the sources of information which foreign investor firms take into account when
making investment decisions. While in 2001 the companies used mainly their own sources,
in 2009 the share of own sources have decreased by 15 percentage points (from 82% to
67%) and the shares of public administration, official statistics and international financial
institutions have significantly increased.
3.4. Market relations with suppliers and customers
A key moment in analyzing the politics and positions of foreign investors on the Bul-
garian market is the analysis of their relations with suppliers and customers. In the context
of the comparative analysis of the foreign companies which participated in the surveys in
2001 and 2009 there are some disparities in the number and kind of suppliers with whom
they work for the realization of their activities on the Bulgarian market. Unlike 2001, in
2009 the share of firms that operate with only one supplier and many (more than 11 suppli-
ers) at the expense of those who work with from 2 to 10 suppliers. Unlike number of
suppliers, there were no significant changes in the number of clients with which companies
operate. In both 2001 in 2009 over two thirds of the surveyed companies indicated that they
worked with many clients - over 20. The number of companies which stated that they
worked with between 5 and 10 clients, and between 11 and 20 clients were both about 10%
in both studies. The number of companies which have only one client is negligible.
Table no. 4 Suppliers of the Bulgarian affiliates of surveyed foreign investors
Suppliers of predominant
share of inputs
2001 2009
Count % Count %
Foreign-controlled Bulgarian firms 15 17.2 23 23.7
Nationally-controlled Bulgarian firms 51 58.6 41 42.3
Foreign firms 21 24.2 33 34.0
Total 87 100.0 97 100.0
It is interesting to examine what kind of suppliers the companies use depending on the
degree of foreign control (table 4). As a whole, in 2009 compared to 2001, the share of

396 Valentin GOEV, Venelin BOSHNAKOV, Ekaterina TOSHEVA
companies with predominantly foreign supplier has increased by 10 percentage points. In
the same time, the number of companies which indicated as predominant suppliers (i) for-
eign-controlled Bulgarian companies or (ii) foreign companies increased by more than 50%.
Most likely this is due to the fact that in 2009 foreign companies operating in Bulgaria are
mainly multinational companies with strong positions on the European market, and particu-
larly in CEE, that typically use supplies from other large multinational companies that may
have or may not have any Bulgarian affiliates. This conclusion is also confirmed by the in-
crease in the number of respondents in 2009 that indicate less than 25% of their supplies as
provided from nationally-controlled companies. Another possible reason for that could be
found in the spread of Bulgarian companies with foreign participation nationwide and the
existence of closer links between firms with foreign capital in our country.
75.3
75.3
69.7
55.6
61.6
56.6
0 10 20 30 40 50 60 70 80 90 100
Terms of suppliers
Prices of supply
Quality of supplied materials
2009
2001
Figure no. 4 Shares of companies that link the satisfaction from their
Bulgarian suppliers to particular reasons
It is important to explore the reasons for the decrease in the number of foreign inves-
tors who work with Bulgarian suppliers. Some of them could be identified through the
shares of positive responses to the question "Are you satisfied with your main Bulgarian
supplier in respect of delivery times, supply prices and quality of delivered materials?"
(fig.5). In 2009 the share of respondents who gave a positive answer to all three criteria has
decreased. The greatest drop (nearly 20 percentage points) is observed regarding the re-
sponses on “delivery terms”. The shrinkage of the share regarding the “delivery price” and
the “quality of supplied inputs” is also significant (from 75% to 62%). It can be concluded
that not-so-good delivery terms offered by the Bulgarian companies made foreign investors
to additionally shift to foreign or foreign-controlled suppliers. Perhaps the lack of trust re-
garding quality, prices and delivery terms prevented investors from entering long term

Foreign Direct Investments in Bulgaria: Main Results of Foreign Investors Surveys 397
contractual relationships with Bulgarian companies – the share of firms operating long term
contracts with Bulgarian suppliers has decreased at the expense of those who prefer separate
contracts for each delivery (fig.6).
18.0
43.8
36.0
39.3
20.2
34.3
36.4
53.5
0 10 20 30 40 50 60
Gentlmen's agreement
Formal long-term contract
Formal short-term contract
Contract for each separate supply
2009
2001
Figure no. 6 Shares of companies that indicate the main preferred form
of contracting with Bulgarian suppliers
14.6
49.4
53.9
28.1
31.5
24.7
15.2
33.3
47.5
32.3
35.4
26.3
0 10 20 30 40 50 60
Available cheaper supplies
Lack of proper domestic suppliers
Better quality of foreign supplies
Better contract coditions
Higher degree of reliability
Better maintenance service
2009
2001
Figure no. 6 Main reasons for preferring suppliers from abroad

398 Valentin GOEV, Venelin BOSHNAKOV, Ekaterina TOSHEVA
With some exceptions, no significant change in 2009 is observed regarding the reasons
why foreign investors in Bulgaria deliver raw materials and other inputs from external sup-
pliers (fig.7). Among the main reasons for both studies were better quality (indicated by
about half of the companies), higher degree of reliability, better contractual conditions, and
better maintenance services. In both survey years only about 15% indicate as a reason for
supplies from abroad the lower price. The only substantial change is observed regarding the
lack of suitable Bulgarian suppliers where the share of respondents has dropped from one
half to one third which indicates the expanded availability of domestic providers in 2009 as
compared to 2001. The survey results on suppliers selection and the reasons why foreign in-
vestors’ companies ship from abroad provide grounds for the conclusions that if the
Bulgarian suppliers would like to increase their sales to foreign investors’ local affiliates
they should emphasize more on the quality of their supplies and to improve their practices
regarding the terms and conditions of supply.
9.0
13.5
66.3
22.5
18.0
20.2
30.3
42.4
39.4
20.2
0 10 20 30 40 50 60 70
Through intermediation of another enterprises
Former clients recommendations
The client found us himself
Through advertisement campaigns
Friendly relations between the managers
2009
2001
Figure no. 7 Main channels for establishing contacts with domestic clients
Interesting results are obtained regarding the establishment of contacts with the main
local clients of respondent companies. In 2001 the highest share (two thirds) of the respond-
ents were contacted by their Bulgarian customers, less than one fourth actually made
connection through advertising, and less than one fifth had relied on the friendly relations
between managers. A significant shift is observed in 2009 when the share of foreign invest-
ment companies directly contacted by their clients declined to 42%. By contrast, there was a
significant increase in the shares of firms that found their clients mainly through advertising
campaigns and through recommendations from former clients. All this suggests that, com-
pared to 2001, foreign investors in Bulgaria in 2009 acted to a greater extent as companies
with well established client networks on the Bulgarian market looking for various ways to
Foreign Direct Investments in Bulgaria: Main Results of Foreign Investors Surveys 399
attract Bulgarian customers in the long term and not relying so much on the initiative of the
local clients to contact them.
Changes have also occurred in the way of regulating the business relations between the
foreign investors and their Bulgarian clients. Likewise the establishment of relationships
with the suppliers, there is a noticeable reduction in the share of firms that enter into long
term contracts with the domestic clients (at the expense of an increase in the share of com-
panies using short-term contracts, oral/informal contracts, and specific arrangements for
each separate delivery). Another possible explanation of this effect is the intensification of
the global crisis and worsening of the economic situation in 2009 – a less favorable business
environment could be among the reasons why client companies were reluctant to commit to
long-term contracts with foreign investment companies in a turbulent and insecure economic
perspectives.
An important aspect considered regarding the development of inter-firm relations in
the domestic economy is the possible business cooperation through joint investment projects
or other kind of agreements between foreign investors and their customers or suppliers.
However, no significant changes are observed regarding the practices of developing tech-
nical cooperation with Bulgarian suppliers (about 12% of respondents). In respect of the
joint investment projects with Bulgarian suppliers, however, there is a significant increase in
the share of firms having such projects: each fifth company in 2009 as compared to each
tenth in 2001. The survey results also show that in 2001 only one of eight companies de-
clared to have leasing agreements with Bulgarian clients whereas in 2009 this share
doubled.
Similarly, the number of foreign investor companies that had agreements for technical
cooperation with Bulgarian customers has also increased from 7% in 2001 to 14% in 2009.
Albeit the small number, this result is indicative of the closer ties developed between foreign
and domestic firms reflecting the long-term orientation of foreign investors’ businesses in
Bulgaria. In the same line of reasoning, an additional indicator for the substantiated posi-
tions of foreign investor firms on Bulgarian market is the enhanced participation of these
companies in public procurement. A considerable change in the share of the positive an-
swers to the question "Has your company any contracts with the Government?” is observed
from 27% in 2001 to 36% in 2009. This change could be linked to the process of EU inte-
gration of Bulgaria and alleviated access of European companies to public procurement
supplies. For the covered period this contracting has been conducted in larger extent through
the local affiliates of European companies that has stabilized their market positions in the
country and improved their public credibility and image.
A core aspect of both surveys is focusing on the opinion and assessment provided by
respondent company representatives in respect of a range of factors for successful coopera-
tion with their Bulgarian counterparts (table 5). At first place, quite remarkable is the
observed drop in the share of those companies which did not respond to this question – in
2001 survey for each of the suggested factors about 22%-25% of the firms did not provide
any answer whereas in 2009 these shares have been drastically reduced to 2-3 respondents.
This provides clear evidence that, compared to year 2001, in 2009 the representatives of for-
eign investors’ companies already had much better orientation about the dimensions and the
key circumstances that are essentially important for the development of a successful cooper-
ation with Bulgarian partner companies.

400 Valentin GOEV, Venelin BOSHNAKOV, Ekaterina TOSHEVA
Table no. 5 Factors of successful cooperation with local firms
“How important are the following factors for the successful cooperation of your company with
other Bulgarian firms?”
Year
Impor-
tant
Partly
impor-
tant
Without
impor-
tance
Can’t
judge N/A Total
Established long-
term relations
2001 36.0 29.2 3.4 6.7 24.7 100.0
2009 57.6 31.3 3.0 6.1 2.0 100.0
Frequency of the
mutual contacts
2001 28.1 25.8 14.6 7.9 23.6 100.0
2009 46.5 41.4 9.1 1.0 2.0 100.0
Geographic prox-
imity
2001 11.2 21.3 31.5 11.2 24.7 100.0
2009 36.4 45.5 15.2 1.0 2.0 100.0
Personal contacts
with the manager
of the other firm
2001 14.6 39.3 14.6 9.0 22.5 100.0
2009 30.3 46.5 11.1 10.1 2.0 100.0
Trust in the other
firm
2001 52.8 14.6 3.4 6.7 22.5 100.0
2009 57.6 29.3 7.1 4.0 2.0 100.0
Ability to work
with flexible and
formal contacts
2001 40.4 24.7 2.2 9.0 23.6 100.0
2009 40.4 38.4 8.1 11.1 2.0 100.0
Ability to work
with flexible and
informal contacts
2001 20.2 38.2 12.4 7.9 21.3 100.0
2009 29.3 43.4 14.1 11.1 2.0 100.0
Activity in the
same branch
2001 23.6 21.3 14.6 16.9 23.6 100.0
2009 29.3 35.4 21.2 12.1 2.0 100.0
Activity in com-
plementary
branches
2001 7.9 32.6 12.4 22.5 24.7 100.0
2009 22.2 43.4 21.2 11.1 2.0 100.0
Activity in the
same chain of
supplies
2001 18.0 14.6 16.9 25.8 24.7 100.0
2009 35.4 34.3 15.2 13.1 2.0 100.0
Common business
culture
2001 39.3 21.3 4.5 12.4 22.5 100.0
2009 32.3 45.5 8.1 11.1 3.0 100.0

Foreign Direct Investments in Bulgaria: Main Results of Foreign Investors Surveys 401
The most significant differences are identified in respect of the following factors. First-
ly, the assessment of the geographical proximity has substantially increased its importance
as in 2001 only one third of the companies evaluated it as "important" or "partly important"
whereas in 2009 these shares reached 82%. Another interesting shift is observed in the share
of those who assess the long-term established relationships as “important” from 36% in
2001 to 58% in 2009. This appears to be quite reasonable since for such a period of 8 years
of intensive economic restructuring foreign investor companies have rebased their opera-
tions much more on the development of sustainable economic relations with their domestic
partners.
However, having in mind the specifics of the local business culture, during 2009 sur-
vey foreign investors perceived in larger extent the role of personal contacts – in 2001 just
over half the company representatives assessed this factor as "important" or "partly im-
portant", whereas in 2009 three out of four respondents provided such an evaluation.
Obviously, after accumulating substantial experience in operating in Bulgaria, recent opin-
ions of foreign investors considered interpersonal business relations as a key factor of
successful business cooperation. Other noteworthy differences are found concerning the ap-
praisal of how important it is for Bulgarian counterparts – which the foreign investors’
companies cooperate with – to have experience in activities in complementary industries or
in the same supply chain. Most likely, these assessments are related to the evolution and
“maturation” of the activities of foreign investors in the country – evidence for which is the
fact that in 2001 the most important thing for the domestic partners was to have experience
only in the same sector whereas in 2009 the most important was to have experience in the
respective supply chain.
5.6
32.6
71.9
28.1
21.3
17.2
30.3
53.5
30.3
28.3
0 10 20 30 40 50 60 70 80
Land
Buildings
Machines and equipment
R&D activity
Patents and licenses
2009
2001
Figure no. 8 Main elements of investment activity of foreign investors’ companies

402 Valentin GOEV, Venelin BOSHNAKOV, Ekaterina TOSHEVA
The priorities of the investment behavior of foreign controlled firms in Bulgaria has
been evaluated using a question whether in the past 12 months the company has invested in
particular assets. In 2001 almost three fourths of respondents declared to have invested in
machinery and equipment whereas in 2009 this share contracted to about 54%. This has its
natural explanation since in 2001 most foreign-owned affiliates were a relatively new phe-
nomenon in the Bulgarian economy and this type of initial investment was essential for
them. Unlike that period, in 2009 it was expected that they already had developed this
“hardware” business infrastructure. Opposite shift is observed regarding the investments in
land, in R&D activities, and in patent and licenses. For example, in 2001 only 6% declared
to have bought land during last year whereas about 17% have already made such investment
in 2009. This appears to be another important indicator for the longer-term intentions of for-
eign investors in Bulgaria which is supported to the stable and slightly growing share of
foreign controlled companies that have invested especially in patents and licenses compa-
nies (from 21% in 2001 to 28% in 2009) and in targeted R&D activities (from 28% in 2001
to 30% in 2009).
3.5. Relationships with banks and public administration
Undoubtedly an important element of the business environment related to the invest-
ment policy of foreign firms in Bulgaria is the way these companies perceive and evaluate
the levels of taxes in the country (table 6). In both surveys the question "How would you
rate on a 5-grade scale the burden of the following taxes/liabilities in Bulgaria?" has been
asked for the main types of taxes where the respondents were expected to assess the tax bur-
den on the scale 1 (too low) to 5 (too high). The answers to this question’s items provide
particular evidence that assists the evaluation of tax environment at the respective years as
one of the core factors supposed to influence the attraction of foreign investors.
Table no. 6 Opinion on the degree of tax burden in Bulgaria
Types of taxes Year Too low Too high
Total 1 2 3 4 5
Corporate
income tax
2001 0.0 3.4 26.1 35.2 35.2 100.0
2009 2.2 26.7 38.9 26.7 5.6 100.0
Personal in-
come tax
2001 1.1 2.3 20.7 29.9 46.0 100.0
2009 21.5 53.8 22.6 1.1 1.1 100.0
Real estate tax 2001 5.7 11.4 52.3 18.2 12.5 100.0
2009 1.1 18.0 47.2 28.1 5.6 100.0
Social &
health
insurance
2001 2.3 8.0 36.4 25.0 28.4 100.0
2009 1.1 17.4 47.8 27.2 6.5 100.0
Customs
tariffs
2001 6.0 7.1 50.0 23.8 13.1 100.0
2009 4.5 11.4 58.0 21.6 4.5 100.0

Foreign Direct Investments in Bulgaria: Main Results of Foreign Investors Surveys 403
Firstly, the distribution of opinions on the scale regarding the personal income tax
/PIT/ shows the most radical drop from 45% (2001) to 1% (2009) of the share of respond-
ents assessing the PIT burden as “too high” – this obviously can be related to the
introduction of the 10% flat PIT rate since 2008. Similar decrease (although not so radical)
is observed for the share of respondents that perceive the Corporate tax burden as "too high"
(from 35% in 2001 to 6% in 2009); parallel shift is observed also for the share of respond-
ents that indicated score 4 (i.e. high tax burden). Analogous changes are also observed for
the burden of social insurance contributions (28% of respondents in 2001 rated them as “too
high” whereas this share in 2009 dropped to 7%) as well as for the customs tariffs. All this
gives ground for a conclusion that since in 2001 foreign investors perceived the direct taxes
as rather high or too high, in 2009 the predominant opinion has substantially shifted to “nei-
ther high nor low” which indicates a definite relaxation of the taxation level in Bulgaria for
the covered period.
Table no. 7 Opinion on the effectiveness of relations with other institutions
Types of institutions Year
How do you assess your relations with the
following institutions? Total
Very
good Good
Not very
good Can’t judge
Your serving banks 2001 62.5 31.8 3.4 2.3 100.0
2009 50.0 41.7 1.0 7.3 100.0
Auditing firms 2001 25.3 50.6 5.7 18.4 100.0
2009 35.1 45.4 2.1 17.5 100.0
Central Government
administration
2001 1.1 44.8 23.0 31.0 100.0
2009 19.6 68.0 4.1 8.2 100.0
Local Government
administration
2001 9.2 49.4 25.3 16.1 100.0
2009 18.6 69.1 7.2 5.2 100.0
Customs authorities 2001 6.9 46.0 19.5 27.6 100.0
2009 16.5 64.9 5.2 13.4 100.0
Employers' organiza-
tions
2001 4.6 29.9 9.2 56.3 100.0
2009 17.5 49.5 3.1 29.9 100.0
Trade unions 2001 6.9 29.9 11.5 51.7 100.0
2009 10.3 47.4 0.0 42.3 100.0
Tax administration 2001 9.1 68.2 18.2 4.5 100.0
2009 15.5 62.9 6.2 15.5 100.0
Foreign investment
agency
2001 11.6 19.8 9.3 59.3 100.0
2009 13.4 47.4 0.0 39.2 100.0
Other dimension of the business environment assessed by the representatives of the
foreign investors’ companies is related to the effectiveness of their interaction with various
private and public institutions (table 7). The results from both surveys show a definite im-
provement of the relations with most types of institutions. The best rated relationships are
between the foreign investor firms and their serving banks (in 2001 survey 63% rated them
as "very good" and 32% as "good" whereas in 2009 these shares were 50% and 42% respec-
tively). This result is easily explainable as the majority of commercial banks in Bulgaria are
actually foreign controlled banks and, in most cases, the choice of a serving bank is per-
formed by the headquarters of the foreign investor companies. The situation regarding the
auditor firms is similar, however, unlike the banks many respondents evaluated these rela-

404 Valentin GOEV, Venelin BOSHNAKOV, Ekaterina TOSHEVA
tionships as "good" (51% in 2001 and 45% in 2009) followed by "very good” (25% in 2001
and 35% in 2009).
A positive progress is identified with respect to the observed rise of the share of re-
spondents that defined their relations with public administration bodies as "very good" – in
2001 minor shares of foreign investors’ companies rated their relations with the Central and
Local Government administration as "very good" whereas in 2009 these shares expanded re-
spectively to about 20%. The largest and even growing shares are estimated for those
assessing these relations as "good" (about one half in 2001 and over two thirds in 2009)
which naturally comes at the expense of a drastic shrinkage of the share of respondents
evaluating them as "not very good."
It’s worth mentioning the positive restructuring of the assessments of their relations
with other institutions, both non-governmental (employers’ organizations, trade unions) and
governmental (customs offices, tax administration, investment agency). For example, in
2001 less than a half of the surveyed companies assessed as "very good" or "good" their in-
teraction with the customs authorities, and every fifth company has identified its relations as
"not very good", whereas in 2009 about 80% provided positive ratings and only 5% declared
unfavorable patterns of interaction. Similar developments are observed regarding the rela-
tions with employers and trade unions – the share of positive evaluations of the interaction
with employers' organizations increased from one third in 2001 to two thirds in 2009 and to
some lesser extent also for the relations with trade unions (from 37% to 57% in 2009). A no-
ticeable development is definitely the considerable expansion of the shares of respondents
that positively rated their contacts with Bulgarian Investment Agency (form 31% to 61% in
2009) – a sign of the substantially improved interaction between the state and foreign com-
panies operating in Bulgaria.
4. SELECTED DETERMINANTS OF THE DECISION TO ENTER THE
BULGARIAN ECONOMY: EVIDENCE FROM LOGISTIC REGRESSION
MODELS
As an upgrade to the explorative study of survey data hereafter we provide the results
from four binary logistic regression models that have been estimated in order to identify
possible net effects for a selection of independent variables on the main reasons for entering
Bulgarian economy in 2009. The following four binary dependent variables have been con-
structed on the basis of the answers to the following question: “Which are the reasons that
have motivated your company to come in Bulgaria?”
(y1) Occupying market positions in Bulgaria (1 – yes; 0 – no, doesn’t know, n/a).
(y2) Economy of production costs (1 – yes; 0 – no, doesn’t know, n/a)
(y3) Serious competition on our traditional markets (1 – yes; 0 – no, doesn’t know, n/a)
(y4) Long-term strategy for entering the countries in Central and Eastern Europe (1 –
yes; 0 – no, doesn’t know, n/a)
The following set of independent variables has been involved for each model with the
respective dependent variable.
(1) Independent variables introducing the main attributes that are expected to motivate
the foreign investors to establish a local affiliate. They are constructed on the basis of the
question: “According to your opinion, how the conditions listed below influence your busi-
ness activities in Bulgaria?”.

Foreign Direct Investments in Bulgaria: Main Results of Foreign Investors Surveys 405
(x1.1) Educational level of the population (1 – positive impact, 0 – negative impact,
doesn’t know, n/a)
(x1.2) Taxation system (1 – positive impact, 0 – negative impact, doesn’t know, n/a)
(x1.3) Labour remuneration level (1 – positive impact, 0 – negative impact, doesn’t
know, n/a)
(x1.4) Opportunities for export (1 – positive impact, 0 – negative impact, doesn’t
know, n/a)
(2) Control variables in respect of:
(x2.1) Size of the company: Large (1 – with over 500 employees; 0 – otherwise)
(x2.2) Level of technology used (1 – higher; 0 – otherwise: approximately the same,
lower, doesn’t know, n/a). The variable is constructed on the basis of the answers to the
question “How would you define the level of technology used by you in Bulgaria compared
to the average technological level for the same industry in the EU countries?”.
(x2.3) Expansion of trans-border activity of the company. A proxy for this is con-
structed on the basis of the answers to the question “In how many countries your company
has subsidiaries?” (1 – over 20; 0 – otherwise: l, 2-5, 6-10, 11-20, doesn’t know, n/a).
(3) Control variables in respect of the main economic sectors: Industry (1, 0), Trade
(1,0), Transport (1, 0), and Finance (1, 0).
The probability of having a positive indication for any of the main reasons (dependent
variable value: y=1), conditional on the values of the set of independent variables, is mod-
eled by the logistic function:
jj
jj
xbb
xbbyP
0
0
exp1
exp1X
where “xj” are the independent variables explained above. Model parameters are estimated
by the maximum likelihood method, i.e. through maximization of the log-likelihood
function [Wooldridge, 2002, 533-534]. The main empirical results are presented in table 8.
Table no. 8 Logistic regression models results
Independent
variables
Dependent variable
1. Occupying
market positions
2. Production costs
economies
3. Competition on
traditional
markets
4. Long term
strategy
b Exp(b) b Exp(b) b Exp(b) b Exp(b)
Educational
level 0.307 1.36 0.196 1.22 0.023 1.02 0.514 1.67
Taxation -0.936* 0.39 -0.197 0.82 0.152 1.16 0.133 1.14
Labour
remuneration 0.505 1.66 -0.476 0.62 -0.400 0.67 0.105 1.11
Export
opportunities -0.608 0.54 1.310** 3.71 1.324** 3.76 -0.205 0.81
Size (>500
employees) 1.407** 4.08 1.779** 5.92 -0.371 0.69 0.235 1.26
Higher
technology -1.148* 0.32 1.257* 3.51 0.270 1.31 0.024 1.02
Foreign affi-
liates (>20) -0.735 0.48 -1.570** 0.21 0.474 1.61 1.032** 2.81
Industry 1.419* 4.13 2.393** 10.94 0.081 1.08 -0.350 0.70
Trade 2.703*** 14.93 1.326 3.77 1.002 2.72 -0.912 0.40

406 Valentin GOEV, Venelin BOSHNAKOV, Ekaterina TOSHEVA
Independent
variables
Dependent variable
1. Occupying
market positions
2. Production costs
economies
3. Competition on
traditional
markets
4. Long term
strategy
b Exp(b) b Exp(b) b Exp(b) b Exp(b)
Transport 1.928 6.88 2.237 9.36 -0.389 0.68 -0.961 0.38
Finance -1.703 0.18 -18.262 0.00 -19.897 0.00 0.075 1.08
Intercept -0.356 0.70 -3.651 0.03 -1.749 0.17 0.354 1.42
–2 Log-
likelihood 105.81 77.21 97.58 117.27
Cox & Snell
R-square 0.215 0.224 0.153 0.085
Note: *** significant at 0.01 level; ** significant at 0.05 level; * significant at 0.10 level.
1) The first model results (regarding the “market motive”) provide grounds for the
following conclusions.
Only two of the sectoral dummies (for “industry” and “trade”) are statistically
significant, hence other things equal, companies from the trade and industrial sectors are
more likely to enter Bulgaria with a basic motive for occupying market positions on the
domestic market.
Opposite effect is observed for the “higher technology” variable – those indicating
such a status tend not to select this motive (as the coefficient on that dummy variable is
negative and statistically significant).
In the same time, the coefficient on the “size control” variable has been estimated
as positive and significant, which gives evidence that – ceteris paribus – the largest
respondent companies tend to indicate this motive which is explainable – these are usually
large producers of goods and services for the mass of end consumption users.
Only one of the four selected attraction factors have revealed a statistically
significant effect which, surprisingly, has a negative coefficient. It turns out that, after
isolating the net effects of the other independent variables, the “taxation stimulus”
negatively correlates with the choice of the “market motive”. In other words, those
companies who suggest that taxation level is positively influencing their activity in Bulgaria
tend not to indicate this motive as a main reason for entering Bulgarian economy, other
things equal.
2) The second model results (regarding the “cost motive”) gives basis for the
following deductions.
Only the “industry” coefficient remained statistically significant, hence only the
companies from this sector reveal a higher likelihood to enter Bulgaria with a basic motive
for realizing production costs. However, the net effect of the dummy variable for “labour
remuneration” level remained insignificant – perhaps this is due to the absorbing of its
impact by interaction with other variables (which needs to be specifically explored).
In this model, both “higher technology” and “size” variables reveal positive and
significant net effects. In other words, larger companies as well as those indicating a higher
level of technology used in Bulgaria are more likely to select the “cost motive”, other things
equal. As it is explainable for the large companies hiring a wide range of personnel, this
result confirms a commonly shared hypothesis that high-tech (e.g. companies operating in
the ICT sector) also utilize low-cost inputs provided in a country like Bulgaria.

Foreign Direct Investments in Bulgaria: Main Results of Foreign Investors Surveys 407
Here another but still only one of the four attraction factors have revealed a
statistically significant effect, namely, the export opportunities that foreign investors’
companies face. After isolating the net effects of the control and other independent
variables, the “export opportunities stimulus” positively correlates with the choice of the
“cost motive”, i.e. those foreign investors that perceive the export opportunities as positively
affecting their activity in Bulgaria tend to indicate this motive as a main reason for entering
Bulgarian economy, other things equal.
3) Unlike the first two, the results from the third model (regarding the “competition
motive”) provide little evidence for any detailed conclusions about the covariates of the
likelihood for indicating that motive. All parameters of the independent variables are found
to be statistically insignificant except that for the export opportunities. On this basis we can
infer that – whatever levels the other specific attributes have – those investors that
emphasize the importance of export opportunities tend to indicate the “competition motive”.
In other words, all the included attributes of the respondents appear not to be correlated with
the search of better competitiveness, except the opportunities for utilization of efficient
options for export and trans-border distribution of their products.
4) Similar situation is observed for the results from the fourth model (regarding the
“strategy motive”) – all parameters of the covariates are statistically insignificant except that
for the number of foreign affiliates of the principal investor’s company. This provides
grounds to conclude that – in respect of the strategic orientation for entering CEE – the
respondent companies cannot be differentiated by any of the attributes incorporated in the
model, except by the number of their affiliates established in foreign countries. In other
words, only those investors that operate a substantial number of foreign affiliates tend to
indicate the “strategy motive”, i.e. the development of their Bulgarian affiliate can be
considered as part of the overall strategy for expanding the operations of transnational
corporations in as many as possible CEE countries.
5. CONCLUSIONS
The selected results for the two surveys presented above show a range of advances re-
lated to the process of development of foreign investors’ businesses in Bulgaria for the
period 2001-2009.The main results can be summarized as follows.
Foreign investors in Bulgaria in 2009 compared to 2001 were large transnational
companies with headquarters in EU countries (Germany, Italy, Austria, Greece, Belgium,
etc.) that have affiliates in numerous other host countries.
The vast majority of respondent companies (about two thirds) in 2009 indicate as a
main reason for entering Bulgarian economy the accomplishment of a long-term strategy for
entering CEE countries. Almost the same share of companies affirms that another main
reason is occupying market positions in Bulgaria. Much less frequently respondents are
identifying as such reasons the intensified competition on the traditional markets (26%) and
the possible economy of production costs (21%).
Compared to year 2001, in 2009 foreign investors in Bulgaria preferred in greater
extent to work with foreign suppliers or foreign-controlled Bulgarian suppliers. The main
reasons for this are, generally, better terms, conditions, and reliability of the deliveries of the
foreign companies. If Bulgarian supplier-companies wish to increase their share of supply to
foreign investors’ affiliates in the country they should definitely improve the quality of their
supplies and to better comply with the terms and conditions required by the buyers.

408 Valentin GOEV, Venelin BOSHNAKOV, Ekaterina TOSHEVA
Among the clients of foreign investors in Bulgaria, the share of foreign controlled
Bulgarian companies is increasing. The investors interviewed in 2009, as compared to 2001,
have diversified their approaches for attracting customers which provides indirect indication
for the reinforcement of their positions on the Bulgarian market.
A favourable shift is observed about the share of foreign investors who operate
joint investment projects, leasing contracts, and technical agreements with their Bulgarian
suppliers and/or clients. Foreign companies in 2009, as compared to 2001, were to a greater
extent achieving such cooperation not only in respect of their core business but also
regarding their complementary and product distribution activities.
The representatives of foreign investors’ companies in 2009, as compared to 2001,
conveyed more favourable assessment of the elements of business environment, taxation,
and the interaction with governmental and non-governmental institutions. These relations
have considerably improved in many aspects which was clearly identified by the surveys.
Finally, although a range of positive shifts have been identified, still various problems
and obstructs of foreign investors’ activity are to be resolved through energetic and targeted
state intervention that is expected to provide additional positive impacts on the investment
activity of foreign companies contributing to the combat with global crisis effects.
References
[1] Anastassopoulos G., Maroudas, L., Rizopoulos, Y., Determinants of inward FDI in the
Bulgarian manufacturing, EACES Paris Workshop III, June, 2000, pp.118-122.
[2] Bevan, A., Estrin, S., Grabbe, H., The impact of EU accession prospects on FDI inflows to
Central and Eastern Europe, ESRC One Europe or Several? Programme, Policy Paper
No.06/01, 2001.
[3] Botric, V., Skuflic, L., Main determinants of foreign direct investment in the Southeast
European countries, Transition Studies Review, v.13 (2), 2006, pp.359-377.
[4] Buckley, P.J., The Theory of the Multinational Enterprises, Uppsala: Almquist and Wiksell Intl.,
1987.
[5] Buckley P.J., Casson, M.C., The Economic Theory of the Multinational Enterprise, London:
Macmillan Press, 1985.
[6] Campos, F.N., Kinoshita, Y., Why does FDI go where it goes? New evidence from the transition
economies, IMF Working Paper No.228, 2003.
[7] Casson, M.C., The theory of foreign direct investment, in Buckley P.J. (ed.) International
Investment, Aldershot: Edward Elgar, 1990.
[8] Casson, M.C., Internalization theory and beyond, in Buckley P.J. (ed.) New Directions in
International Business, Aldershot: E.Elgar, 1992.
[9] Caves, R., Multinational Enterprise and Economic Activity, Cambridge: Cambridge University
Press, 1996.
[10] Demekas, D., Horváth, B., Ribakova, E., Wu, Y., Foreign direct investment in Southeastern
Europe: What do the data tell us?, Conference paper, Austrian National Bank Conference on
European Economic Integration Southeastern European Challenges and Prospects, Vienna,
2004.
[11] Demirbag, M., Glaister, K.W., Tatoglu, E., Institutional and transaction costs influences of
MNEs’ ownership strategies of their affiliates: Evidences from an emerging market, Journal of
World Business, v.42 (4), 2007, pp.418-434.
[12] Desai, M.A., Foley, C.F., Hines Jr., J.R., Foreign direct investment and domestic economic
activity, NBER Working Paper No.11717, 2005.

Foreign Direct Investments in Bulgaria: Main Results of Foreign Investors Surveys 409
[13] Dimova, R., International corporations in globalizations, Economic Thought, 2004, No.4 (in
Bulgarian).
[14] Djarova, J. (ed), Foreign Direct Investment in Central and Eastern Europe. The Case of
Bulgaria. Rotterdam: Copynomie, 1996.
[15] Djarova, J., Foreign investment strategies and the attractiveness of Central and Eastern Europe,
International Studies of Management & Organization, Vol. 29, 1999.
[16] Djarova, J., Cross-Border Investing: The Case of Central and Eastern Europe, Norwell: Kluwer
Academic Publishers, 2004.
[17] Dunning, J.H., Multinational Enterprises and the Global Economy, New York: Addison-Wesley
Publ.Co., 1993.
[18] Dunning, J.H., Reappraising the eclectic paradigm in an age of alliance capitalism, Journal of
Business Studies, v.26 (3), 1995, pp.461-491.
[19] Ernst & Young, South East Europe: An Emergent FDI Destination in Europe, SEE
Attractiveness Survey, April 2008.
[20] Garibaldi, P., Mora, N., Sahay, R., Zettelmeyer, J., What moves capital to transition
economies?, IMF Working Paper 02/64, 2002.
[21] Ghauri, P., Hadjikhani, A., Johanson, J. (eds), Managing Opportunity Development in Business
Networks, Chippenham: Palgrave, 2005.
[22] Graber, G., Stark, D. (eds), Restructuring Networks in Post-Socialism. New York: Oxford
University Press, 1997.
[23] Grigorova, V., Foreign Direct Investment in Bulgarian Industry, Sofia: ROLL Co., 2007 (in
Bulgarian).
[24] Haddad, M., Harrison, A., Are there positive spillovers from direct foreign investment?, Journal
of Developing Economics, v.42, 1993, pp.51-74.
[25] Hunya, G., Foreign Direct Investment in South East Europe in 2003-2004. Vienna: OECD and
WIIW, 2004.
[26] Konrad, K.A., Lommerund, K.E., Foreign direct investment, intra-firm trade, and ownership
structure, European Economic Review, v.45, 2001, pp.411-427.
[27] KPMG, Foreign Investors in Bulgaria, Survey 2000, Sofia, 2000.
[28] CSD, Problems with Foreign Direct Investment in Bulgaria, Technical Report, Sofia: Centre for
the Study of Democracy, 2001.
[29] Marangozov, I., Characteristics of the international joint ventures in Bulgaria (1989-2003),
European Business Review, v.17 (3), 2005, pp.242-262.
[30] Marangozov, I., Strategic Alliances, Sofia: Avangard Prima, 2009 (in Bulgarian).
[31] Markusen, J.R., Venables, A.J., Foreign direct investment as a catalyst for industrial
development, European Economic Review, v.43, 1999, pp.335-356.
[32] Markusen, J.R., Contracts, intellectual property rights, and multinational investment in
developing countries, Journal of International Economics, 2001, pp.189-204.
[33] Meyer, K.E., Direct foreign investment in Eastern Europe: The role of labor costs, Comparative
Economic Studies, v.37 (4), 1995, pp.69-88.
[34] Meyer, K.E, Direct Investment in Economies in Transition, Cheltenham, UK: Edward Elgar
Publishing, 1998.
[35] Mintchev, V., Goev, V., Tsenova-Knudsen, T., Boshnakov, V., Determinants of EU enterprises
relocation in Bulgaria, Economic Thought, Yearbook XVII, Institute of Economics at BAS,
2002, pp.56-72.
[36] Moosa, I.A., Foreign Direct Investment: Theory, Evidence and Practice. Basingstoke: Palgrave
Macmillan, 2002.
[37] Norbäck, P.-J., Multinational firms, technology and location, Journal of International
Economics, v.54, 2001, pp.449-469.
[38] Rizopoulos, Y., Foreign direct investment and western firms’ internationalization strategies in
the Balkan countries, ACE Project Report 94-0760 Economic Cooperation in the Balkans: A
Regional Approach to European Integration, 1997, pp.1-4 (mimeo).

410 Valentin GOEV, Venelin BOSHNAKOV, Ekaterina TOSHEVA
[39] Todeva, E., Ebbers, H., Integration of Central and Eastern Europe into the 21st century world
economy, in Dunaway, W. (ed), Crises and Resistance in the 21st Century, Greenwood Press,
2002, pp.81-102.
[40] Vernon, R., The location of economic activity, in Dunning, J.H. (ed), Economic Analysis and
the Multinational Enterprise, London: George Allen and Unwin, 1974, pp.89-114.
[41] Wooldridge, J., Introductory Econometrics - A Modern Approach, 2nd ed., Thomson South-
Western College Publ., 2002.