foreign human capital and the earnings gap between ... human capital and the earnings gap between...
TRANSCRIPT

Foreign Human Capital and The Earnings Gap Between
Immigrants and Canadian-born Workers∗
Working Paper
Nicole Fortin†, Thomas Lemieux ‡, Javier Torres §
This Version: September, 2014
Abstract
We use the new information available in the 2006 Canadian census regarding the location wherethe highest degree of education was attained to better estimate Canadian and foreign humancapital (education and work experience). The identification of the human capital source explainsup to 70% of the immigrant/native wage gap. We find that education acquired in Asia tends tobe valued less than education from South America, Africa and East Europe; which in turn is lessvalued than education from Oceania, the U.S. and the rest of Europe. The native/immigrantwage gap is highly heterogenous across countries or regions of birth. The separation of the sourceof human capital visibly reduce the country fixed effects coefficients. The reduction is sizeablefor China, Pakistan, India, Philippines, West and Central Asia and the rest of Asia. Some fieldsof study are considerably more tradable than others. “Health Assistance”,“Computer Sciences,Mathematics, Physical Sciences and Sciences Technologies” and “Humanities and Visual andPerforming Arts ” are the most tradable fields to Canada. “Social and Behavioral Sciences andLaw”, “Business, Finance and Marketing” and “Education” are the least tradable.
JEL Classification: J15, J24, J31, J70Keywords: Immigrant Assimilation, Human Capital, Wage Gap.
∗This paper is a revised version of a chapter of Javier Torres’ doctoral dissertation. We would like to thank SiwanAnderson, Mauricio Drelichman, David Green, Craig Riddell, John Ries and Mikal Skuterud for their comments andrecommendations throughout the dissertation defence process. We would also like to thank the participants of the2013 Conference on the Economics of Immigration for their suggestions and the commentaries of Serge Coulombe.All mistakes of the current version are sole responsibility of Javier Torres.†University of British Columbia‡University of British Columbia§Universidad del Pacifico
1

1 Introduction
Immigrants have not fared well in the Canadian labour market lately. A number of studies have
documented a steady decline in their earnings relative to the Canadian born over the last three
decades. They have found that immigrants who arrived in Canada in the 1990s earned around 30
percent less than Canadian-born workers (see for instance Green and Worswick (2004) and Aydemir
and Skuterud (2005)). By contrast, earlier cohorts of immigrants who arrived in the 1970s were
earning about the same as Canadian-born workers. Starting with Chiswick (1978), studies have
suggested that the lack of transferability of human capital is a key reason why immigrants tend to
earn less than natives. While most immigrants in the 1960s were from countries culturally close to
Canada (Western Europe and the United States), about two thirds of immigrants who arrived in
the 1980s and 1990s were from Asia, Africa, and Central and South America. Given the large and
increasing fraction of foreign-born population in Canada (currently around 20%), the appropriate
assimilation of recent immigrants into the Canadian labor market has become a priority.1
We investigate how much of the earnings gap between immigrants and the Canadian born derives
from the lower valuation the labour market assigns to foreign human capital (education and work
experience) in comparison to Canadian human capital. Our research exploits a direct measure of
the location where the highest degree was obtained based on a new question of the 2006 Canadian
Census. This new information goes a long way towards identifying how much of an immigrant’s
education was obtained in the home country and how much was obtained in Canada.2 We use
the census to estimate earnings penalties to immigrants linked to the country or region where they
acquired their education controlling for gender, academic degree, work experience, metropolitan
area of residence and mother tongue (English or French only). We go further and examine for
which of the immigrants’ main countries/regions of birth does the inclusion of the human capital
origin substantially explain the earnings gap.
The identification of the human capital source explains up to 70% of the immigrant/native wage
gap. Education acquired in Asia tends to be valued less than education from South America, Africa
and East Europe; which in turn is less valued than education from Oceania, the U.S. and the rest
of continental Europe. Studying in the UK appears more beneficial than studying in Canada.
The native/immigrant wage gap is highly heterogenous across countries or regions of birth.
Immigrants from Asia (with the exception of South-East Asia and Hong Kong) tend to have larger
wage gaps than immigrants from Europe. The improvements in our human capital estimations (and
location of study) visibly reduce the country fixed effects coefficients. The reduction is sizeable for
China, Pakistan, India, Philippines, West and Central Asia and the rest of Asia.
Some fields of study are considerably more tradable than others. “Health Assistance” is a trad-
1The proportion of foreign-born fluctuated between 15% and 16% from 1961 to 1991. The fraction rose to 18.4% in2001 and 19.8% in 2006
2This information, in turn, helps distinguish work experience acquired abroad from work experience acquired inCanada.
1

able field for almost all locations of study. To some extent the same holds true for “Computer
Sciences, Mathematics, Physical Sciences and Sciences Technologies” and “Humanities and Visual
and Performing Arts ”. The fields that experience the highest negative wage penalties if stud-
ied abroad (“Social and Behavioral Sciences and Law”, “Business, Finance and Marketing” and
“Education”) require country specific knowledge and high communication skills .
The paper proceeds as follows, the second section reviews the literature regarding the returns
foreign human capital. The third section describes the census data and summary statistics. The
fourth models the foreign wage gap in an earnings equation framework. Empirical findings are
reviewed in fifth section and conclusions are presented in last section.
2 Foreign human capital and immigrants earnings gap
The location of study of recent immigrants may account for the growing earnings gap between
immigrants and Canadian-born workers if the human capital acquired abroad is not fully transferable
into the Canadian labour market. The influential study by Friedberg (2000) uses the 1983 Israeli
Census to look at the contribution of the differences in the returns to foreign and native schooling
and labour market experience to the immigrant-native wage gap.3 Friedberg also highlights the level
of heterogeneity in the returns to foreign schooling by source country. Returns to education abroad
are higher for immigrants from Europe and the Western Hemisphere (in comparison to immigrants
from Asia and Africa). The paper also suggests that acquiring further education in the host country
may increase the overall return to education.
The Canadian literature (Ferrer and Riddell (2008), Ferrer, Green and Riddell (2006) among
others) also suggests that years of schooling and experience accumulated before arrival are much
less valued than the host country ones.4 Ferrer and Riddell study the period from the 1980s
to the early 2000s. Their central focus is on the effect of credentials (degrees and diplomas) on
the earnings of immigrants, holding constant the number of years of education. Using public-use
Census files from 1981 to 2001, they estimate a flexible functional form for wages where education
and experience are interacted with an immigrant indicator. They find substantially lower returns
to foreign education and experience. Ferrer, Green and Riddell (2006) use a different approach.
They incorporate measures of literacy skills in addition to educational levels and separate degrees
acquired in the home and host country. They find that, among the university-educated, literacy
skills explain about two thirds of earnings difference between immigrants and the Canadian born.
This suggests that the quality of foreign education, as measured by literacy skills, is not as high as
Canadian education.5
3The 1972 Israeli Census is used to argue that the results found using the 1983 Census come from an assimilationprocess and not a change in cohort quality over time.
4Another possibility is that recent immigrants may not have good enough language skills (in English or French) to getsome high-paying jobs. Aydemir and Skuterud (2005) find that language skills accounts for a share of the earningsgap between immigrants and the Canadian born.
5Recent comparisons between immigrants earnings in Canada and Australia (Clarke and Skuterud (2012) and An-
2

One challenge when trying to estimate the role of foreign education in the earnings gap between
immigrants and Canadian-born workers is that explicit information on the location of study is typi-
cally not available in data sets like the Census. Researchers have tried to infer where the education
was obtained by comparing the age at which an immigrant should have completed her reported
highest degree to the age at immigration.6 Indeed, Friedberg estimates years of schooling in the
home country under the assumptions that children start schooling at age 7 and, more importantly,
that they attend school without interruption. Bratsberg and Ragan Jr (2002) follow a similar strat-
egy using the 1990 U.S. Census to estimate differences in the return to education for immigrants
with and without U.S. schooling.7 Their main findings are similar to those of Friedberg for Israel.8
The procedure, however, may mis-attribute the country where education was acquired. Immigrants
may have worked in Canada for a number of years before starting their final degree. For instance,
a 40 year old immigrant with a MBA who came to Canada at age 25 may very well have completed
that degree in a Canadian university after the age of 25. Likewise, foreign-born individuals may
finish their studies in Canada before being officially considered immigrants. In the Canadian Census
age at immigration is the age an individual had when he/she first became a permanent resident
of Canada. Foreign students who went to university in Canada and became permanent residents
after finishing school would, therefore, be misleadingly classified as having a foreign degree using a
Friedberg-type imputation procedure.
Fortunately, the long form of the 2006 Canadian Census includes an explicit question about
where was the highest degree obtained. The location of study is either recorded as a country, for
those who studied abroad, or as a province, for those who studied in Canada.9 While the location
of study is also available in some smaller data sets, we can perform a much more detailed analysis
thanks to the large sample available in the master files of the 2006 Canadian Census (20 percent of
the total population). The Census also includes information on field of study, which enables us to
see whether some fields of study are more portable (e.g. math and computer science)than others
(e.g. education and humanities) regardless of the location of study.10
tecol, Kuhn and Trejo (2006)) argue that foreign-born assimilation is better in Australia due to the role played byinstitutions. Clarke and Skuterud (2012) indicate that the Australian system is encouraging high quality applicantsto choose it as destination.
6For instance, one may assume that an immigrant with a BA degree who came to Canada at age 30 completed herdegree abroad prior to immigrating.
7They determine an age of graduation based on the reported years of education and the assumption of startingschooling at age at 6. Immigrants arriving at an age lower than the presumed age at graduation (years of completedschooling plus six) are classified as having U.S. schooling.
8They find that immigrants with U.S. schooling earn higher wages than immigrants without U.S. schooling. Theirresults also indicate that returns to foreign schooling are significantly higher for immigrants who completed someof their studies in the United States. Though this last finding is based on a small (351 immigrants) and notrepresentative survey of U.S. immigrants (the National Longitudinal Survey of Youth)
9Consider an immigrant with a high school diploma who comes to Canada at age 25 and then completes a two-yearcommunity college program. Since one would normally complete such a program at age 20, the imputation procedurewould suggest that the immigrant got all of her schooling abroad despite the fact the two-year community collegeprogram was actually acquired in Canada. With the new information available we can clearly distinguish bothsources of human capital and correspondingly recalculate years of work experience abroad and in Canada.
10Relatively recent studies (such as Clark and Jaeger (2006) and Hartog and Zorlu (2009)) have also directly identify
3

3 Data and Descriptive Statistics
3.1 The 2006 Canadian Census
As mentioned above, our primary data comes from the 2006 long form Canadian Census. The
Census was conducted by Statistics Canada on residents of private dwellings as of May 16, 2006
(the reference day) between the months of February and August of that year.11 It enumerates
Canadian citizens, landed immigrants, and non-permanent residents.12 One in five households
received the long form questionnaire which, in addition to the regular eight questions on household
members, age, gender, marital status and mother tongue, contained 53 questions on various topics
such as education, immigration, income and employment.
We focus on people between the age of 20 and 64 with an education level higher than high school,
and who were full-time workers with positive wage income in 2005.13 Regarding immigrants, we
further focus on those who were old enough to face problems adapting to their new environment,
but who were young enough to invest in education around the time of migration. Therefore, the
majority of our analysis uses immigrants who arrived in Canada between the age of 15 and 29.
Nevertheless, trying to make our data set more comparable with previous literature we replicate
some of our specifications using a sample of immigrants 15 or older at arrival. Non-permanent
residents are removed from the sample since they are not comparable to landed immigrants, and
are not asked the date of arrival to Canada.14
Our dependent variable is the logarithm of the average weekly wages. The average is constructed
dividing the total wage income in 2005 by the declared number of weeks worked in the year. Since
the census does not record weekly hours of work in 2005, we limit our analysis to full-time workers
to have a better measure of the hourly price of labor. To minimize the problem of low-wage outliers,
we only consider people earning more than half the minimum weekly earnings a full time worker
could get (assuming a working week of 30 hours). That is, we restrict the sample to people with an
average weekly wage earnings higher than 15 times the province minimum hourly wage rate.15 Minor
the origin of immigrants education for other countries or for other analysis. For example, Clark and Jaeger (2006)distinguish between immigrants who earned an additional degree in the host country (a GED in particular) andimmigrants who did not. They find immigrants with a host country degree earn more than immigrants withoutone but with similar foreign schooling. Still, their study relates more to sheepskin effect (or signaling) than to theundervaluation of foreign education. Hartog and Zorlu (2009) follow refugees to the Netherlands for their first fiveyears (1995 to 2000) and use the administrative immigration records to measure their education level. Their mainfinding is that returns to higher education are not significant. Their study, however, limits itself to refugees in theirfirst five years and does not identify their location of study.
11Statistics Canada points out that this was the period of most intense activities on data collection.12According to the Census information, it also counted “Canadian citizens and landed immigrants who were tem-
porarily outside the country on Census Day; including federal and provincial government employees working outsideCanada, Canadian embassy staff posted to other countries, members of the Canadian Forces stationed abroad andall Canadian crew members of merchant vessels”.
13The question on where was the highest degree obtained is only asked to people with more than a high school degree.14Non-permanent residents are defined as persons living in Canada who have a Work or Study Permit, or who are
claiming refugee status.15Appendix A shows the minimum hourly wage by Province valid in 2005.
4

restrictions are imposed to exclude observations with inconsistencies in key explanatory variables
such as unspecified country of origin (“Other”), location of study (“Outside Canada” or “Distance
Learning”) or year of immigration (for the foreign born).16 The list of the restrictions is detailed
in Appendix B. Our final sample has about 1.2 million observations with an immigrant share of
around 10 percent.
As a first step, we create explanatory variables related to years of experience and years of
education. We follow a standard Mincer earnings regression and calculate potential labour market
experience as the difference between age and years of education assuming that children start school
at age seven. Given that the 2006 census no longer asks for the number of years of schooling, the
variable is imputed according to the highest degree or diploma obtained (see Appendix C for the
imputation rules).17 Nonetheless, given that our dataset contains only people with more than a
high school diploma, we subtract 12 years out of the total number years of education. This means
that a person with a bachelor’s degree would get four years of education (rather than 16).
We further separate work experience in Canada and abroad based on age at immigration. Under
the assumption that landed immigrants who finished their studies abroad start working upon arrival,
we calculate their work experience in Canada as the difference between their age at the time of
the Census and their age at arrival. Foreign-born individuals who finish their studies in Canada
are divided into three groups according to their age at arrival and highest degree attained. For
those arriving at 18 years old or younger, Canadian work experience is assumed equal to total
work experience. For those arriving between the age of 19 and 22, Canadian work experience is
calculated as age (in 2006) minus age at arrival minus the imputed years of education in Canada
assuming that those with a bachelor’s degree or higher didn’t start their programs until arriving in
Canada.18 Lastly, for those who arrived after age 22 work experience is calculated as age minus age
at arrival minus imputed years of education in Canada. In that case, however, we assume that those
with a postgraduate degree finished their bachelor’s degree before arriving in Canada. Individuals
born in Canada are simply assumed to have obtained all of their work experience in Canada. For
immigrants, work experience abroad is computed as the difference between total work experience
and work experience in Canada.
The fact that the education section in the 2006 census simply records the highest degree or
diploma achieved, offers the possibility to include a dummy variable for each education level in
the wage regressions. We simplify the empirical model by grouping the educational degrees into
16The Research Data Center data release policy prevents us from currently disclosing the number of observationsdropped with each restriction. However, the total number of observations eliminated are smaller than 5% of thefinal sample.
17In the 1981 to 2001 censuses more detailed questions were asked about years of education. They provided moreinformation about the educational achievement of individuals without a high school diploma (e.g. 8 vs. 11 yearsof education). The 2006 Census only records whether or not one completed a high school (or higher) diploma.Fortunately, this is of limited consequence for our analysis that only focuses on workers with more than a highschool diploma.
18This implicitly assumes that there are no transfer mid-program.
5
four categories: trade certificate, college or university diploma below a bachelor’s degree, bachelor’s
degree and post-graduate degree. We use “trade certificate” as the base category in all estimations.
The advantage of this approach, relative to one based on years of education, is that non-linearities in
the return to education are directly captured by the set of dummy variables. To identify differences
in the return to education obtained in Canada and abroad, the education dummies are interacted
with the foreign education indicator (yielding six binary variables: three for education attainment
in general and three interaction terms).19 For instance, if a person got a bachelor’s degree outside
Canada we would observe the separate effects of having a bachelor’s degree in general and obtaining
a bachelor’s degree abroad.
Moreover, following Friedberg, we divide years of education in Canada and years of education
abroad. We, however, add an additional distinction. We distinguish between years of education
above high school and years of education above a bachelor’s degree. Thus, we end up with four
variables: years of education above high school in Canada, years of education above high school
abroad, years of education above a bachelor’s degree in Canada and years of education above a
bachelor’s degree abroad. In principle, a foreign-born who finishes a master’s degree in Canada
has only one (or two) year(s) of education outside her country. In our specification there is a limit
of four years of education above high school (which is approximately the time needed to finish a
bachelor’s degree) and five years of education above bachelor‘s degree (considering a doctoral degree
as the highest education possible). People with bachelor‘s education and higher are inputted with
the maximum years of education above high school. In the case of the foreign-born with a master’s
degree in Canada we would input four years of education above high school abroad and two years
of education above bachelor’s in Canada.20
Country of birth and the country where the highest diploma was obtained (location of study) are
grouped in 22 and 19 categories, respectively. We identify the top ten countries where immigrants
get their education from (including Canada) and group the rest in broad geographic areas (such
as “South America”, “East Europe”, “Africa”, etc.). The first ten countries provided education to
more than 80% of all immigrants. Similarly, we find the top ten countries of origin and combine the
rest in relatively homogenous geographic areas. Nevertheless, to avoid location of study dummies
becoming proxies for country of origin effects we make the classification of countries of origin as
detailed as the classification for the locations of study. Thus, we include two more country of
origin dummies for Pakistan and Romania.21 With Canada also in the country of origin list, we
have thirteen countries (the original top ten plus Canada, Pakistan and Romania) and nine regions
(Appendix D shows the details).
Additionally, the 2006 census has detailed information about the field of study of the highest
postsecondary degree.22 The original data is coded using the Classification of Instructional Pro-
19We disregard the interaction of foreign degree and trade certificate.20The common procedure would have allocated two years of Canadian education and 16 years of foreign education.21These two countries are in the top 15 countries of origin.22The dictionary in the public use files describes this variable as “the predominant discipline or area of learning or
6

grams (CIP Canada 2000). We combine several subsections across broad CIP categories trying to
form more homogenous groups. Appendix E shows our definition of eleven major fields of study.
With the new classification we explore to what extent the field of study affects the transferability of
foreign diplomas to the Canadian Labour market. For example, while diplomas in education may
be valued differently depending on the country of origin, diplomas in mathematics-related fields are
arguably less influenced by cultural and linguistic factors and might be more portable.
3.2 Descriptive Statistics
Table 1 shows the distribution of immigrants by country/area of origin and year of arrival. The top
ten countries account for 51% of all immigrants in our sample. With the exception of the United
Kingdom, all of the top five countries of origin are located in Asia. Given the age restrictions in
our sample the earliest year of arrival is 1956.
One can see that the distribution of source countries has changed dramatically throughout the
years. Most of the immigrants who arrived between 1956 and 1970 were from the UK and continental
Europe (21.9% from UK, 2.4% from France, 1.2% from Poland, 7.7% from East Europe and 25.9%
from the rest of the continent), whereas the majority of immigrants who arrived after 1990 are
from Asia.23 Just India, Philippines, China, Hong Kong and Vietnam made up 37% and 39% of all
immigrants who arrived between 1991 and 2000, and after 2000, respectively.
Close to 56% of immigrants received their highest diploma in Canada (see table 2). Not surpris-
ingly, immigrants who spent more time in the country are more likely to have a Canadian diploma.
More than 62% of all immigrants who arrived before 1990 obtained their highest diploma in Canada,
but the number goes down as the year of arrival nears (55% for immigrants who arrived between
1990 and 2000, and 26% for immigrants who arrived after 2000).24
The majority of the foreign-born who did not acquire their highest degree in Canada got it in
their home country instead. Accordingly, the distribution of the location of study for countries
other than Canada closely mirrors the distribution of country of origin of immigrants.
Considering all year, the total share of immigrants who got their highest degree in countries
other than Canada ranges from 0.7% to 5.8% (see table 2). The U.K. and Europe are the most
important locations of study for immigrants who arrived between 1956 and 1970 (around 23% of
those immigrant got their highest education there), but their relevance diminishes after 1980. India,
Philippines and China increase their positions after 1991, reaching 30% for immigrants who arrived
after 2000.
Regarding the distribution of natives and immigrants by field of study, we see that foreign-born
are relatively under-represented in fields that require higher levels of communication abilities, such
as education and social sciences (see 3). Either the heterogeneity of transferability of degrees or
training of a person’s highest postsecondary degree, certificate or diploma”.23Asia represents the source of 52% and 51% of all arrivals between 1991 and 2000, and after 2000, respectively.24These figures suggest that a share of immigrants acquire additional education years after their arrival to Canada.
7

the Canadian immigration policy may be affecting the field of study distribution of newcomers.25
Conversely, immigrants are over-represented in fields that require more quantitative skills, such as
mathematics, computer and physical sciences, architecture and engineering.
Consistent with other Census-based studies, we find a strong clustering of immigrants in large
census metropolitan areas (CMAs), and in particular Toronto, Vancouver and Montreal (see table
4). 66% percent of immigrants live in these three cities, compared to only 30% of natives. The
twenty largest CMAs listed in the table account for over 90% of immigrants, but only about 60%
of natives.
The age distribution of immigrants and natives reported in table 5 show some important de-
mographic differences between the two groups. Immigrants in our sample are generally older than
natives. There is a higher fraction of immigrants age 50 to 64 (30% versus 23% of natives), and a
smaller fraction for the age 20 to 29 (12% versus 20% of natives). Immigrants are also more edu-
cated than natives. In table 6 we group the eleven levels of education from the Census into seven
categories and impute the number of years one would normally take to complete the corresponding
diplomas. Relative to natives, immigrants are less likely to have some vocational education or a
community college/CEGEP diploma (45% compared to 60% for natives), and more likely to have
a diploma above bachelor’s degree (17% for immigrants compared to 11% for natives).
Naturally, pursuing a diploma in Canada depends heavily on the age at arrival. Immigrants who
arrive at a relatively young age are inclined to obtain a Canadian degree, while immigrants who
arrive at an older age are more likely to have their highest degree in their home countries (see table
8).Of the people who arrived at age 19, only 8.4% obtained their highest degree abroad, compared
to the 71% for immigrants who arrived at age 29. Given that we only analyze people with more
than a high school degree, all immigrants who arrived between the age of 15 and 19 obtained their
highest diploma in Canada.
Table 8 illustrates how the direct question on location of study helps us identify where did
immigrants acquire their human capital. Only a few immigrants have diplomas that one cannot
be completed before the age of 25 (people with a PhD or an MD are such cases). Hence, very few
immigrants age 25 and over would be imputed some Canadian education using a Friedberg-type
imputation approach. By contrast, we show that around 40 percent of immigrants who came at
age 25 or 26 have a Canadian diploma. This fraction remains substantial (about 30 percent) even
for immigrants who came to Canada at age 29. The table depicts a relatively smooth decline in
the share of immigrants with a Canadian degree as a function of age at immigration. By contrast,
imputation procedures that have been used in the past would have generated a much sharper drop
in the share of immigrants with a Canadian degree as the age of arrival increases.26
25Chiswick and Miller (2007) study suggests that inmigrants with language mismatches tend to be penalized by thelabour market. While inmigrants who match the language requirements have better possibilities of moving to jobsthat suit better their skills.
26For instance, under the assumption that people start their education at age seven and continue without interruption,everyone should complete a Bachelor’s degree by age 23. Immigrants who currently hold a bachelor’s degree but
8

The summary statistics of the main variables are reported in table 9. The mean of log weekly
wages for natives is only slightly larger than the mean for immigrants (0.04 difference in logs, i.e. a
4 percent difference). That said, the means reported in the table also confirm the earlier evidence
that immigrants are both older (average age of 42.37 versus 40.37) and more educated (15.14 against
14.68) than natives. Since earnings increase in both age and education, controlling for these factors
in the earning regression should make the 4 percent earnings gap larger. Lastly, immigrants work as
many weeks per year as natives (around 47) and have a larger total work experience (21.23 versus
19.7), though understandably a smaller Canadian work experience (17.26 versus 19.7).
4 Empirical strategy
We estimate the logarithm of weekly wages on a foreign-born dummy, a set of demographics and
human capital variables (gender, education and work experience) and a set of location of study
dummies. The focus is on the magnitude of the foreign-born dummy as it would indicate how
much of the immigrant/native gap we are not able to explain. An initial specification restricts the
regression coefficients (except the constant) to be the same for immigrants and the Canadian born.
Consider a standard (log) earnings equation for immigrants
wi = αI +XiβI + µi
and for Canadian-born workers
wi = αC +XiβC + µi
where wi is the logarithm of weekly wage, Xi is a vector of covariates (including work experience and
education), and µi is an error term that satisfies the usual orthogonality assumption (E(µi|Xi) = 0).
The equation would condition the effect of the covariates on earnings to be the same for immigrants
and natives.
wi = αC + αIIi +Xiβ + µi (1)
The mean earnings gap (wC − wI) would come from the difference in the average value of
covariates ((XC −XI)β) and the specific constant for immigrants (−αI), where Ii is a dichotomous
variable indicating whether person i is an immigrant. The sign, size and significance of αI relates
to the unexplained part of the earnings gap; and our different specifications would show how much
of the wage gap we are able to disentangle.
This first specification is, however, restrictive. We make efforts to distinguish education and
experience acquired in Canada from education and experience obtained abroad. Still the focus
remains on the foreign born dummy, and how much can we explain of it with the direct information
regarding the location of study.
arrived before the age of 23 would all be imputed a Canadian diploma, while immigrants who arrived after the ageof 23 would all be imputed a foreign degree.
9

wi = αC + αIIi +XiβC(1−Di) +XiβIDi + µi (2)
Where Di is an indicator of where the human capital was acquired. One if it was acquired out of
Canada and zero otherwise. In some specifications we decompose the immigrant indicator Ii into
several dummies according to the immigrants’ age at arrival (15 to 19, 20 to 24 and 25 to 29 years
old).
We go further and break up the foreign born indicator into several country/area of origin dum-
mies. In this way each country/area of origin fixed effect becomes an unexplained wage gap between
immigrant from that country and natives. Additionally, we incorporate controls for language skills
(two dummies for English and French as mother tongues), metropolitan area of residence (being
Toronto the omitted CMA) and province of residence (making Ontario the base case). The equation
can be generalized to:
wilas = αC + ψs +XiβC(1−Di) +XiβIDi + ηl + λa + +µilas (3)
Where the additional indexes specify the effect of knowledge of official languages (ηl) and res-
idence in a particular province and city (λa). ψs represents the country/area of origin fixed effect
and Di remains the indicator of where human capital was acquired. Lastly, a set of regressions
include the field of study of immigrants and interactions between with the location of study. These
interactions enable the comparison of wage premiums between specializing in a field in a particular
foreign country versus doing it in Canada; and the evaluation if the difference depends on the field
of study.
5 Findings
5.1 Base Specifications
Our initial estimations identify the native/immigrant wage gap at around 11%. Through the differ-
ent specifications the coefficient of the foreign-born dummy experiences a reduction between 30%
to 50% (see tables 10,11,12 and 13). The reductions are associated with the incorporation of loca-
tion of study fixed effects or the separation of the human capital acquired in Canada from the one
obtained abroad.27 The statistical significance of the results will not be mentioned regularly. Given
the large number of observations the vast majority of our results are statistically significant at 1%.
Immigrants arriving at a younger age appear to have less problems integrating into the Canadian
labour market. Columns five and six of table 10 show that foreign-born arriving at ages between 15
27For both measures the new information available in the Census is paramount, as it improves the identification ofthe source of human capital.
10

to 19 have the smallest a wage gap (of about 2.6%). In comparison, the wage gap for people arriving
at ages between 20 to 24 is 8%, and for people arriving at ages 25 to 29 is 19%. The inclusion of
location of study fixed effects have a higher impact on the wage gap of immigrants who arrive at
an older age, reducing their wage gap between 34% to 39%. The effect on the wage gap of people
arriving at 19 or younger is negligible.
Using the coefficients of the location of study dummies we graph the average negative effects
of obtaining an educational degree from a particular country in comparison to Canada (the base
category). Figures 1 and 2 show that Pakistan is the most penalize location of study. India, China
and the rest of Asia (South East Asia, Western and Central Asia and the rest) follow suit as less
advantageous places to study. Studying in the U.S., Oceania and the rest of Europe (basically,
continental Western Europe) appears to be considerated as good as studying in Canada; while
studying in the U.K. has, in fact, a positive premium payoff. This pattern is consistently depicted
by all the even columns of table 10.28
Tables 11 and 12 show the largest decrease in the immigrant/native wage gap (from around -12%
to around -3%).29 They present different ways to incorporate education into the earnings equation
(years above a high school and bachelor vs degree achieved), but for both the highest reductions in
the immigrant dummy coefficient come from the separation of foreign and Canadian human capital
(columns three, five and seven in both tables). We see this as evidence of the better classification
we are able to achieve. Location of study fixed effects are included in all even columns, however
their incorporation starts losing impact by column six. By then, the human capital separation is
already included in the specifications.
The different returns between foreign and Canadian human capital are clearly shown in table
12; where work experience is separated according to its origin (foreign or native) and education
abroad is specified as an additional effect on the achieved degree. Foreign human capital is valued
less than Canadian human capital. The major difference in the returns to education happens at
the bachelor and graduate level. Those with a foreign bachelor degree or higher have between 6%
to 15% less income than people who finish a similar degree in Canada. The difference is relatively
minor for people with university certificate below bachelor’s level (between 3% to 6%).30 The most
straightforward explanation is that occupations that do not require higher levels of education tend
to involve lower levels of communication skills and a higher component of manual skills, which are
quite comparable across countries. In many specifications (of both tables 11 and 12) , people with
an above bachelor’s education abroad have a smaller immigrant/native wage gap than those with a
foreign bachelor’s degree. Again, it could be argued that occupations for very specialized workers
28Even though the number of years after arrival is incorporated in the work experience variable, we can not completelyrule out the possibility of a discontinuity in the immigration assimilation process for immigrants arriving before the1970s as much of UK immigrants did.
29Note that the first two columns of both tables come from table 10.30The difference for people with trade certificates is negligible. We do not incorporate the interactions in this version,
but our key results remain under all specifications.
11

are homogenous across countries; hence the penalty from foreign education would be smaller.31
Regarding work experience, we see that years abroad are heavily discounted. At best, the first order
difference (without considering the square term) between Canadian and foreign years of experience
is seven to one (columns six and eight); at worst, thirty-five to one (column seven); with coefficients
of foreign experience very close to zero.32
Interactions between the highest degree achieved and the last location of study are presented
in table 13. Given the pattern found in figures 1 and 2 we decide to group location of study into
broader areas, namely: Canada; the West (including Oceania); East Europe (including Romania
and Poland); China and West and Central Asia (including Hong Kong); India, Pakistan and the
rest of Asia; the rest of America; South-East Asia (including the Philippines) and Africa. A more
manageable number of locations facilitates the interpretation of the results without sacrificing much
of the identification of location specific premiums. Country/area of origin fixed effects are added as
extra controls in the last two columns (in addition to CMA and province fixed effects) but the main
finding of the table remains. Recognition of educational achievements is highly related to the last
location of study. Overall, education in Asia has the highest negative premiums. Regarding edu-
cation levels, Bachelor’s and above bachelor’s degrees tend to have the largest negative coefficients,
but they vary substantially by location of study. The contrast is greater between the old areas of
origin (the West) and the new sources of immigrants (China and West and Central Asia; India,
Pakistan and the rest of Asia; and South-East Asia). While a bachelor degree obtained in any of
the new areas of origin would create a negative wage gap of about 33% to 22% for the newcomer,
a bachelor degree obtained in the West would only have a negative wage gap of about 2%.33
5.2 Including older arriving immigrants
Trying to make our data more comparable with the ones used by the literature we expand the
sample to include immigrants arriving at an age older than 29. That is, we consider all immigrants
arriving at age 15 or older.34 The replication of tables 10 to 12 gives us relatively similar but
interesting findings. The inclusion of location of study fixed effects markedly reduces the foreign-
born dummy coefficient. The comparison of columns one and three against two and and four in
table 14 (the replication of table 10) shows that the size of the immigrant coefficient decreases in
more than half. The initial magnitude of the unexplained wage gap is, however, twice as large as
previously found. Columns five and six shed some light on the factors behind the wage gap increase.
31The possibility that immigrants with a graduate education abroad could be more likely to arrive with an arrangedemployment can not be disregarded. Information on arranged employment before arriving is not available in thecensus.
32Given that the average foreign years of experience in the sample is less than four years, it is reasonable to consideronly the linear term for comparison.
33The interaction of educational degrees with the detailed list of locations of study shows that immigrants who studiedin the UK had a positive and statistically significant effect on the wage gap, while those who studied in Pakistan orIndia had the highest negative impact. Particularly for Bachelor’s and above bachelor’s degrees.
34Friedberg makes a similar argument when explaining the selection criteria for her sample.
12

Immigrant/native wage gap for immigrants arriving at an age older than 29 is considerably larger.
The foreign-born dummy coefficients for those arriving between 15 and 19, 20 and 24, and 25 and
29 remain quite similar to the previously found (compare columns five and six of tables 10 and 14);
in a range between -0.03 and -0.18. However, the coefficient jumps to a range of -0.31 to -0.42 for
those arriving in their thirties. It jumps again to a range of -0.53 to -0.61 for those arriving in their
forties and it is -0.64 for those arriving at 50 or older. That is, immigrants arriving at 50 or older
earned around 47% less than Canadians of the same age-cohort (and with similar characteristics).35
Moreover, the incorporation of the location of study dummies loses effect on the age at immi-
gration coefficients as the age at arrival increases. While the reduction in the coefficient is relatively
similar to the one in table 10 for immigrants arriving between the ages of 25 and 29 (about 42%),
the reduction for those arriving between 40 and 44 is 25% and around 21% for those arriving at 50
or older.
The results of tables 15 and 16 confirm that, just as in tables 11 and 12, the identification of
foreign human capital explains a significant part of initial immigrant/native wage gap. Adding
location of study dummies in the first specifications (columns one and three) reduces the foreign-
born coefficient between a half a quarter (58% to 27% depending on the specification). Moreover, the
separation of education and work experience by source (Canadian vs. foreign) pushes the unexplain
wage gap to less than 3% (from -0.24/-0.23 to around -0.01/-0.02, see columns one and seven in
each table).
5.3 Immigrant wage gap by gender
The comparison of the wage gap by gender (tables 17 to 20) shows that female immigrants tend to
face a smaller penalty than males (-9% to - 10% and -13% to -12%, respectively). The inclusion of
location of study dummies in the simplest specification (column two in all the tables) also causes
a larger reduction on the foreign-born dummy coefficient for women (between 72% and 78% versus
less than 30% for men).
The highest reduction in the unexplain wage gap, though, comes from the separation of education
and work experience by origin. The separation explains about half of the initial wage gap for men
but nearly all of it for women. The foreign-born coefficient in column seven (of both tables 17 and
18) goes down more than 90% and becomes not statistically different from zero.
A last noticeable gender difference relates to the return to education. The overall return to
foreign education (in comparison to a “trade certificate” education level) is higher for immigrant
women than for immigrant men. For example, the return to a bachelor’s degree abroad for women
is around 48% (using the coefficients for bachelor’s degree and foreign bachelor’s degree in column
seven of table 18) while for men is 37% (column seven of table 20).36 In comparison to its own gender,
35The proper interpretation of the effect of a dummy on the percentage change of a continuous log-transform variableis 100 ∗ [ecoefficient − 1]. For small values, the size of the coefficient approximates the percentage change in thedependant variable.
36The higher return to foreign education can also be seen in columns 5 to 8 of tables 17 and 19.
13

nevertheless, women face a larger difference in the returns to education. The wage penalty for having
a foreign bachelor’s degree instead of a Canadian one is about 16.6% for women (transforming the
coefficient -0.1810 into percentage changes in wage ) while only 5.5% for men. That is, women’s
foreign education is discounted at a higher rate than men’s.
5.4 Separating the foreign born wage gap by country of origin
The foreign-born dummy in tables 10 to 12 represents the average wage gap between Canadians
and immigrants. Heterogeneity on the country of origin effect could, however, be present. Given
that the leading source countries to Canada have changed significantly over the last five decades
a clear identification of the country/area of birth effect is required. By including country/area of
origin fixed effects instead of the general foreign-born dummy, we find considerable heterogeneity
the wage premiums across geographical areas.
Figures 3 and 4 graph the country/area negative wage premium recovered from columns 1 to 6
of table 21 (a replication of table 10 adding cma/province fixed effects and dummies for English and
French mother tongue). Immigrants from Asia (not counting South-East Asia or Hong Kong) tend
to have the largest negative premiums; and out of them, workers from Pakistan consistently get the
lowest coefficient (-0.35). The next group includes immigrants from South and Central America,
Africa and East Europe with coefficients ranging from -0.2 to -0.1. Natives from the US, France,
Oceania, South-East Asia, Hong Kong and the rest of Europe have coefficients around -0.10. British
immigrants are the only group with a positive wage premium. The United Kingdom coefficient is
significant and close to 0.04.
The inclusion of dummies for groups of location of study in columns two, four and six markedly
reduces the size of most country coefficients and the overall divergence (see figure 4). In particular,
the coefficients of East European countries (including Romania and Poland) and the South-East
Asia region are driven close to zero, while the weighted average of the country/area coefficients goes
down from -0.15 to -0.10 (columns one and two).37
Following our previous specifications, tables 23 and 24 separate Canadian and foreign work
experience and education. Throughout their columns the size of the country dummies decreases.
The identification of foreign education and work experience is particularly important to explain the
negative premium of Asian countries. The comparison of columns 1 and 5 of tables 23 and 24 (see
figures 5 and 6), shows a reduction in the coefficients of most countries; but the reduction is sizeable
for China, Pakistan, India, Philippines, West and Central Asia and the rest of Asia (East Europe,
Romania, France and Africa as well). Overall, the country coefficients drop from a range between
37The weights come from the first column of table 1 and refer to the share of immigrants across countries (or areas)in our sample. To test that the incorporation of country/area of origin fixed effect instead of a foreign-born dummystill captures the average negative premium of immigrants and does not affect the coefficients of other variables, wereplicate the first four columns of table 10 changing only the foreign-born dummy. Table 22 presents the results.The changes in the coefficients of education, work experience and gender variables are fairly minor. Moreover,the weighted average of the country/area of birth dummy coefficients is quite similar to the foreign-born dummycoefficient of table 10.
14

0.04 and -0.35 to (in column 1 of table 24) to a range between 0.06 to -0.23 (in column 5). Smaller
reductions for Oceania, South-East Asia, Europe (as a whole) and the US drive their coefficients
close to zero. Still, the addition of groups of location of study dummies reduces the divergence
of the country coefficients and their negatives values regardless of the specification (see columns
2, 4 and 6 on figures 5 and 6). By the end, we are able to significantly explain the wage penalty
for immigrants from the European region (including the UK) - and to a large extent - Oceania,
South-East Asia, the US and Hong Kong.38
Adding country of origin fixed effects does not change the coefficients of education and work
experience markedly. We confirm that the Canadian labour market assigns a lower valuation to
both types of foreign human capital. For instance, one year of work experience abroad gives at most
1% increase on wage income; compare to around 5% increase per year of work in Canada (again,
considering only the linear terms).39 Also, for any level of education, the penalty for obtaining it
abroad varies from -3% to -13% (based on table 24).
Given that most of foreign-born who arrive an early age obtain their highest education in Canada,
as a robustness check we restrict the sample to immigrants landing between the age of 20 to 29. We
find that although the initial immigrant/native wage gap is higher and the dispersion of country
coefficients is bigger (column 1 of table 25), we are able to explain about the same proportion of it
(around 50%). The weighted average of the country coefficients goes from -0.1740 to -0.0793; and
the distribution of each country effect, drawn in figure 7, is indistinguishable to the previous figure.
5.5 Friedberg’s Approach
In order to highlight the difference between our imputations of foreign education and work experi-
ence from the ones commonly employed by the literature, we replicate tables 24 and 25 using an
imputation method a la Friedberg.
For this, we need to create a variable indicating where we suppose the highest degree of education
was acquired. Canadians are assumed to have no years of education abroad and immigrants are
considered to have a Canadian degree only if their age at arrival minus six is equal or less than
their calculated years of education.40 Work experience variables also need to change. Canadians
are given zero work experience abroad, and immigrants are assigned foreign work experience only
if, under the new calculations, they would have finished their studies before coming to Canada; that
is, if they have no Canadian degree. For them the foreign work experience would be the difference
between their age at immigration and the assumed age at which they finish their studies (years of
education plus six). Given the methodology then, no foreign-born could have both foreign work
38For the first group of countries the absolute value of the fixed effects coefficients is lower than 0.05. For the secondgroup the absolute values is lower than 0.065.
39The average foreign years of experience in the sample is less than four years, so the linear term is the most relevant.40The number of years of education is imputed according to the categories in table 6. In the case where a Canadian
degree is assumed for a foreign-born, years of education abroad would be calculated as the age at arrival minus sixand years of education in Canada would make up the difference to the total.
15

experience and Canadian education. Lastly, immigrants are assumed to have gotten all of their
foreign education in their home countries. We forgo the possibility of immigrants leaving their
home-country to study. Figure 10 compares the calculated share of immigrants with a Canadian
degree under these rules with the direct information provided by the census (and presented in table
8) and tables 26 and 27 present the replication results.
The commonly used methodology markedly underestimates the share of immigrants with a
Canadian degree, particularly for immigrants arriving at an age over 23 (see figure 10). Corre-
spondingly, when incorporating dummies for groups of location of study and separate the human
capital factors by their origin, the wage penalty for holding a foreign degree turns somewhat smaller
than in our initial estimations. For instance, for people with a foreign bachelor’s or above bachelor’s
degree, the direct measures points to a wage penalty between 8% to 9% whereas the estimations
with the inferred variables indicate a penalty of around 7% (there is no noticeable difference regard-
ing the returns to Canadian degrees). There is also a difference regarding the returns to foreign
work-experience. Our estimations show a small return to an extra year of work abroad of about
1%. The estimated return using the inferred variables is almost zero. Given that immigrant have
an average of 4 years of work abroad, the difference widens.
Though the weighted average of the country/area coefficients follows the same decreasing pat-
tern, reaching less than half of its value by the last specification, the coefficients precision differ.
Our estimates, using the direct information on location of study, have lower standard deviations.
This is evident when dummies for groups of location of study are included and the sample is re-
stricted to immigrants arriving between 20 and 29 years old. For them, the old methodology has
the biggest problems assigning the source of human capital. Consequently, the effect on the wage
income is picked up by the country/area dummy. This imprecision could affect the estimates of the
interacting effects of two or more variables; for example location of study and field of study.
5.6 Identifying the field of study effect
We explore the heterogenous wage premiums related to fields of study in tables 28 and 29, and
evaluate if they depend on the country where the education was acquired. After controlling for
foreign and Canadian education and work experience (as well as gender, mother tongue and province
and city of residence) and using “Humanities and Visual and Performing Arts” as the base category,
we find that the most rewarded fields of study involve either high levels of education and advanced
knowledge of mathematics or require technical skills and have a higher labor demand.
“Architectures, Engineering and Engineering Technicians” and “Construction trade, Mechanics
and Woodwork” stand out as the two fields of study with the highest payoff (see table 28 and
the corresponding figure 11). The first one has a high level of specialization while the second one
relates to manual skills and trades. The next three highest paying fields, in descending order, are
“Business, Finance and Marketing”, “Health Technicians” and “Computer Sciences, Mathematics,
Physical Sciences and Sciences Technologies”. The lowest wage premiums relate to the fields of
16

“Education” and “Social and Behavioral Sciences and Law”
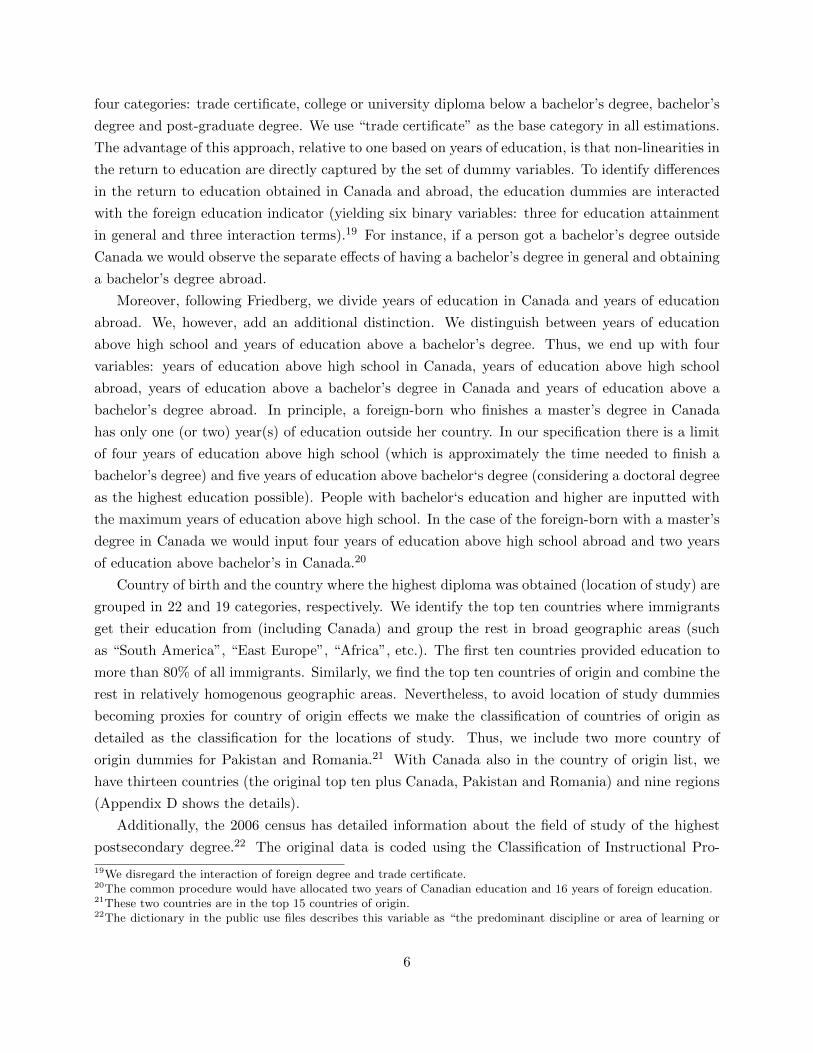
The last two columns of table 29 interact the location of study groups with the field of study
categories. The general wage premiums for location of study are analyzed in columns three and
four, and shown in figure 12. Consistent with previous results, studying in the west, which includes
the U.S., U.K., Oceania and west Europe, does not create a structural lower wage than studying
in Canada. No other region has this comparability. The coefficients of the rest of the regions are
negative and significant. Studying in “South-East Asia” and “India, Pakistan and Rest of Asia”
give the highest negative wage premiums.
Regarding the interactions, we find considerable dispersion in the returns to field of study
depending on where the education was acquired. For example, studying “Business, Finance and
Marketing” has a slightly positive wage premium if done in the “West”, whereas it gives a highly
negative wage premium if done in “East Europe”, “India, Pakistan and Rest of Asia” or “South-
East Asia” (figures 13 and 14 present coefficients of the interactions for column five). Still, there
are some visible patterns. Regardless of the field of study, education in the “West” is comparable
to education in Canada. Some fields even enjoy a positive wage premium (“Health Practitioners”,
“Computer Sciences, Mathematics, Physical Sciences and Sciences Technologies” and “Business,
Finance and Marketing”).41 In contrast, the interaction coefficients for East Europe and the three
regions of Asia are almost all visibly different from zero.
We also find that “Health Assistance” is a, comparatively, tradable field across regions. With
the exception of people studying in “East Europe”, health technicians immigrants do not suffer
additional wage reductions. To some extent we observe the same pattern for “Computer Sciences,
Mathematics, Physical Sciences and Sciences Technologies” and “Humanities and Visual and Per-
forming Arts ”. Most immigrants experience none or minor negative wage premiums, suggesting
that education in these fields is relatively tradable. Immigrants who finish their education in “India,
Pakistan and Rest of Asia” or “South-East Asia”, however, do suffer additional wage reductions for
specializing in computer or physical sciences.42 43
The fields of study with the highest negative wage premiums are common to most of the regions
(except the West): “Social and Behavioral Sciences and Law”, “Business, Finance and Marketing”
and “Education”. These are fields who require country specific knowledge and high communication
skills, which foreign-born workers might not posses.
41To a lesser extent, and due to larger standard errors, the same is true for some fields studied in Africa.42People who study in “India, Pakistan and Rest of Asia” are the only ones who face additional wage discounts for
specializing in humanities.43Curiously, foreign architects and engineers do experience a negative wage premium.
17

6 Conclusions
This study tries to better explain the earnings gap between immigrants and Canadian workers. It
uses a direct question, available in the 2006 Canadian census, regarding the location where the
highest degree of education was attained. The new information improves estimates of Canadian
and foreign human capital (education and work experience), calculated before by assumptions on
the education level by age and the age of immigrants at arrival.
The refined identification of the human capital source explains up to 70% of the initial immi-
grant/native wage gap. The separation of both the education and work experience into native and
foreign sources are deciding factors in the reduction of the wage gap from around 11%-12% to close
to 3%.
The Canadian labor market gives a negative wage premium to education and work experience
acquired abroad. The incorporation of location of study fixed effects provides evidence that edu-
cation obtained in Asia tends to be less valued than education obtained in South America, Africa
and East Europe. In turn, education obtained in these regions is less valued than education from
Oceania, the U.S. and the rest of continental Europe. Education in the UK is the only one with a
greater value than education in Canada.
Also, the wage penalty for immigrants increases with their age at arrival. While immigrants
arriving between 15 and 19 have about a 3% wage gap, immigrants arriving at 50 or older earned
around 47% less than Canadians workers of the same age-cohort (and similar characteristics). Taken
as a whole, the results speak of human capital transferability problems.
The replacement of the foreign-born dummy by country of origin fixed effects reveals consid-
erable heterogeneity in the native/immigrant wage gap across regions. In general, larger gaps for
immigrants from Asia (with the exception of South-East Asia and Hong Kong) and smaller ones
for immigrants from Europe. The different specifications visibly reduce the country fixed effects
coefficients. The reduction is sizeable for China, Pakistan, India, Philippines, West and Central
Asia and the rest of Asia; though their coefficients remain negative. By the end, we are able to
significantly explain the wage penalty for immigrants from the European region (including the UK)
and, to a large extent, Oceania, South-East Asia, the US and Hong Kong.
The inclusion of field of study fixed effects shows that some fields are more tradable than others.
“Health Assistance” is a tradable field across almost all regions. With the exception of people study-
ing in “East Europe”, foreign-educated health technicians do not suffer additional wage penalties.
To some extent we observe the same holds true for “Computer Sciences, Mathematics, Physical
Sciences and Sciences Technologies” and “Humanities and Visual and Performing Arts ”. The
fields that experience the highest negative wage penalties if studies abroad (“Social and Behavioral
Sciences and Law”, “Business, Finance and Marketing” and “Education”) require country specific
knowledge and high communication skills .
18

References
Antecol, Heather, Peter Kuhn, and Stephen J Trejo. 2006. “Assimilation via prices or
quantities? Sources of immigrant earnings growth in Australia, Canada, and the United States.”
Journal of Human Resources, 41(4): 821–840.
Aydemir, A., and M. Skuterud. 2005. “Explaining the deteriorating entry earnings of
Canada’s immigrant cohorts, 1966–2000.” Canadian Journal of Economics/Revue canadienne
d’economique, 38(2): 641–672.
Bratsberg, B., and J.F. Ragan Jr. 2002. “The impact of host-country schooling on earnings:
A study of male immigrants in the United States.” Journal of Human resources, 63–105.
Chiswick, Barry R, and Paul W Miller. 2007. “Matching language proficiency to occupation:
the effect on immigrants’ earnings.” IZA Discussion Papers.
Chiswick, B.R. 1978. “The effect of Americanization on the earnings of foreign-born men.” The
Journal of Political Economy, 86: 897–921.
Clarke, Andrew, and Mikal Skuterud. 2012. “Why Do Immigrant Workers in Australia Perform
Better Than in Canada? Is It the Immigrants or Their Labour Markets?” UBC Department of
Economics.
Clark, Melissa A, and David A Jaeger. 2006. “Natives, the foreign-born and high school equiv-
alents: New evidence on the returns to the GED.” Journal of Population Economics, 19(4): 769–
793.
Ferrer, A., and W.C. Riddell. 2008. “Education, credentials, and immigrant earnings.” Cana-
dian Journal of Economics/Revue canadienne d’economique, 41(1): 186–216.
Ferrer, A., D.A. Green, and W.C. Riddell. 2006. “The effect of literacy on immigrant earn-
ings.” Journal of Human Resources, 41(2): 380–410.
Friedberg, R.M. 2000. “You can’t take it with you? Immigrant assimilation and the portability
of human capital.” Journal of Labor Economics, 18(2): 221.
Green, D., and C. Worswick. 2004. “Immigrant earnings profiles in the presence of human
capital investment: Measuring cohort and macro effects.” Institute for Fiscal Studies Working
Paper 04, 13.
Hartog, Joop, and Aslan Zorlu. 2009. “How important is homeland education for refugees
economic position in The Netherlands?” Journal of Population Economics, 22(1): 219–246.
19

Table 1: Immigrant’s Top Countries of Origin by Year of Arrival
Total 1956 to 1970 1971 to 1980 1981 to 1990 1991 to 2000 After 2000
Top Ten countriesIndia 9.3 3.9 7.3 6.7 11.3 16.6UK 7.8 21.9 13.0 6.6 2.9 2.2Philippines 7.6 2.5 7.5 7.0 9.5 8.1China 5.9 2.7 3.2 3.1 8.2 12.5Hong Kong 5.1 1.9 6.4 6.5 5.8 0.6US 3.9 6.7 6.7 3.6 1.9 2.2Poland 3.2 1.2 1.2 7.6 3.0 0.9Jamaica 3.0 3.9 4.5 3.8 2.0 0.7Vietnam 2.8 . 3.9 5.0 1.9 0.7France 2.3 2.4 1.7 1.6 2.3 4.3
Two other CountriesPakistan 1.8 . 1.1 0.8 2.7 3.8Romania 1.7 . 0.4 1.0 2.7 3.7
Rest of the WorldAfrica 7.8 3.9 7.0 7.7 8.3 10.6Rest of America 7.3 7.1 8.4 9.3 6.0 4.6Rest Europe 7.1 25.9 9.2 6.2 2.7 2.2East Europe 5.9 7.7 3.0 3.2 9.0 7.5W. and C. Asia 5.2 1.5 2.7 6.5 6.7 6.3South America 5.0 2.7 6.6 5.8 3.7 5.4Rest Asia 4.4 1.1 2.5 4.0 7.0 4.6South-East Asia 1.8 . 2.3 3.0 1.3 1.1Oceania 1.3 1.6 1.4 1.2 1.2 1.4
Total 100 9.2 23.8 23.1 30.8 13.2Numb. of Observ. 651750
Note: A Missing value “.” indicates that the cell has less than 100 observations.
20

Table 2: Immigrant’s Top Locations of Study by Year of Arrival
Total 1956 to 1970 1971 to 1980 1981 to 1990 1991 to 2000 After 2000
Top Ten countriesCanada 55.91 64.85 62.03 64.03 55.09 26.25India 5.8 1.17 3.5 3.44 7.12 14.26UK 5.24 10.83 8.95 4.57 2.29 2.69Philippines 5.05 1.72 4.94 3.94 6.01 7.25US 3.07 2.65 4.26 2.56 2.43 3.6China 2.43 . . 0.75 3.72 8.12France 1.65 1.43 1.01 0.9 1.75 4.07Poland 1.63 . 0.63 4.25 1.29 0.58Romania 1.06 . . 0.42 1.62 3.26Pakistan 1.02 . 0.45 0.4 1.33 2.87
Rest of the WorldEast Europe 3.23 3.55 1.65 1.92 4.55 5.08Rest Europe 2.9 8.66 3.55 2.5 1.41 1.94Africa 2.25 . 1.64 1.79 2.29 5.18Rest Asia 2.16 0.94 1.92 2.13 2.63 2.4Rest of America 1.99 1.35 1.6 2.29 1.8 3.05W. and C. Asia 1.76 . 0.72 1.58 2.26 3.87South America 1.47 . 1.41 1.21 1.15 3.53Oceania 0.7 . 0.62 0.44 0.66 1.29South-east Asia 0.7 . 0.8 0.9 0.6 0.7
Total 100.0 9.2 23.8 23.1 30.8 13.2Numb. of Observ. 651750
Note: A Missing value “.” indicates that the cell has less than 100 observations.

Table 3: Distribution of Inmigrants and Natives by Field of Study
Native Inmigrant Total
Education 7 4 7
Humanities and Visual and Performing Arts 7 7 7
Social and Behavioural Sciences and Law 10 8 10
Business, Finance and Marketing 13 13 13
Small Businesses, Accounting and Business Support 8 9 8
Computer Sc., Math., Physical Sc. And Sc. Technologies 5 11 6
Architecture and Engineering and Engineer Technicians 9 17 10
Construction trade, Mechanics and Woodwork 15 10 15
Health Practicioners and Life Science 4 5 4
Health Assistance 9 9 9
Others 13 7 12
Total 100 100 100
22

Table 4: Distribution of Immigrants and Natives by CMAof Residence
Immigrant Native Total
Top 20 CMAsToronto 40.9 11.0 14.1Vancouver 13.0 5.1 5.9Montreal 12.4 12.9 12.9Calgary 4.7 4.0 4.0Ottawa 4.1 4.5 4.4Edmonton 3.7 3.7 3.7Hamilton 2.2 2.1 2.1Winnipeg 2.1 2.3 2.2Kitchener 1.5 1.4 1.4London 1.1 1.5 1.5Windsor 1.0 0.9 0.9Oshawa 0.9 1.1 1.1Victoria 0.9 1.1 1.1St. Catharines–Niagara 0.8 1.1 1.1Quebec 0.5 3.6 3.3Abbotsford 0.5 0.4 0.4Halifax 0.4 1.7 1.6Guelph 0.4 0.4 0.4Barrie 0.3 0.6 0.6Saskatoon 0.3 0.9 0.8
RestOther CMAs 5.3 21.8 20.1Non-CMAs 3.2 18.0 16.4
Total 10.3 89.7 100
Note: Numbers are rounded up to one decimal point.
Table 5: Age Distribution of Immigrants and Natives
Natives Immigrants Total
20 to 29 years old 20.2 12.3 19.430 to 39 years old 26.8 32.8 27.440 to 49 years old 29.8 25.1 29.350 to 59 years old 20.2 23.4 20.560 to 64 years old 3.1 6.7 3.4
100 100 100
23

Table 6: Years of Education
Group Assigned Yrs. of Educ. Natives Immigrants Total
CEGEP (3 - 12 months)a 13 26.9 19.0 26.1CEGEP (13 months - more than 2 years) 14 32.6 25.8 31.9University certificate below bachelor level 15 6.6 12.0 7.1Bachelor’s degree 16 23.5 26.4 23.8University certificate above bachelor level 17 3.4 4.3 3.5Master’s degree or Degree in medicine b 18 6.2 10.8 6.7Earned doctorate degree 21 0.9 1.8 0.9
Total 100 100 100
a It includes trades certificate, registered apprenticeship certificate and CEGEP (between 3 to 12 months).b It includes degrees in medicine, dentistry, veterinary and optometry
24

Table 7: Share of Immigrants with a Canadian Degree by EducationCategory
Distribution Foreign degree Canadian Degree
Tradea 19.0 16 22
Below Bachelorb 37.7 36 39
Bachelor 26.4 31 23
Above Bachelorc 16.9 18 16
Total 100 100 100a It refers to people with 13 years of education.b It refers to people with 14 or 15 years of education.b It refers to people with more than 16 years of education.
Table 8: Share of Immigrants with a Canadian Degree by Age atImmigration
Age at Immigrationa Foreign degree Canadian degree Total
19 8.4 91.720 20.6 79.421 30.3 69.722 42.7 57.323 47.5 52.524 53.3 46.725 57.6 42.426 61.9 38.127 64.7 35.428 67.0 33.029 71.3 28.7
Total 44.1 55.9 100
a All immigrants who arrived at an age younger than 19 obtained their highestdegree of education in Canada.
25

Table 9: Summary Statistics
Native Immigrant
Log. weekly wages 6.8 6.76(0.65) (0.67)
Weeks worked 47.01 46.59(10.42) (10.72)
Age 40.37 42.37(10.79) (10.92)
Age of Imm. . 23.42(4.04)
Year of Imm. . 1986.92(11.32)
Years of Educ. 14.68 15.14(1.59) (1.74)
Years of Educ. (-12) 2.68 3.14(1.59) (1.74)
Canadian degree 98% 56%
Yrs. Educ. AboveHS - CAN 2.45 1.27(1.23) (1.51)
Yrs. Educ. AboveBACH - CAN 0.18 0.2(0.63) (0.74)
Yrs. Educ. AboveHS - FOR 0.03 1.52(0.29) (1.73)
Yrs. Educ. AboveBACH - FOR 0.02 0.15(0.26) (0.56)
Work Exp. 19.7 21.23(10.89) (11.23)
Work Exp. CAN 19.7 17.26(10.89) (11.18)
Work Exp. FOR . 3.96(3.04)
Weighted Observations 5671380 651750
26

Table 10: Base Specification
(1) (2) (3) (4) (5) (6)
Const. 5.8405 5.8408 5.7572 5.7567 5.7528 5.7540(0.0022)∗∗∗ (0.0022)∗∗∗ (0.0022)∗∗∗ (0.0022)∗∗∗ (0.0022)∗∗∗ (0.0022)∗∗∗
Immigrant -.1096 -.0580 -.1180 -.0657(0.002)∗∗∗ (0.0025)∗∗∗ (0.002)∗∗∗ (0.0025)∗∗∗
Below Bachelor 0.1652 0.1653(0.0014)∗∗∗ (0.0014)∗∗∗
Bachelor 0.4456 0.4494(0.0017)∗∗∗ (0.0017)∗∗∗
Above Bachelor 0.5906 0.5908(0.0022)∗∗∗ (0.0022)∗∗∗
Yrs. of Educ. (-12) 0.1233 0.1242 0.1243 0.1246(0.0004)∗∗∗ (0.0004)∗∗∗ (0.0004)∗∗∗ (0.0004)∗∗∗
Work Exp. 0.0518 0.052 0.051 0.0512 0.0512 0.0513(0.0002)∗∗∗ (0.0002)∗∗∗ (0.0002)∗∗∗ (0.0002)∗∗∗ (0.0002)∗∗∗ (0.0002)∗∗∗
Work Exp. Square (/100) -.0879 -.0889 -.0873 -.0882 -.0877 -.0884(0.0005)∗∗∗ (0.0005)∗∗∗ (0.0005)∗∗∗ (0.0005)∗∗∗ (0.0005)∗∗∗ (0.0005)∗∗∗
Gender 0.2922 0.2918 0.286 0.2859 0.2865 0.2862(0.0012)∗∗∗ (0.0012)∗∗∗ (0.0011)∗∗∗ (0.0011)∗∗∗ (0.0011)∗∗∗ (0.0011)∗∗∗
Age of Imm. 15-19 -.0266 -.0261(0.0042)∗∗∗ (0.0042)∗∗∗
Age of Imm. 20-24 -.0800 -.0491(0.0033)∗∗∗ (0.0036)∗∗∗
Age of Imm. 25-29 -.1863 -.1227(0.0029)∗∗∗ (0.0038)∗∗∗
Loc. of study F.E. No Yes No Yes No Yes
Obs. 6323125 6323125 6323125 6323125 6323125 6323125R2 0.2137 0.2167 0.2115 0.2143 0.2126 0.2147
Note: Robust standard errors are in parenthesis. *, ** and *** denote significance at 10%, 5% and 1% levelsrespectively. The omitted category in the location of study fixed effects is Canada.
27

Table 11: Separating Years of Education Above High School from Years of Education Above Bachelor’s Degree
(1) (2) (3) (4) (5) (6) (7) (8)
Immigrant -.1180 -.0657 -.1186 -.0655 -.0677 -.0565 -.0351 -.0303(0.002)∗∗∗ (0.0025)∗∗∗ (0.002)∗∗∗ (0.0025)∗∗∗ (0.0025)∗∗∗ (0.0025)∗∗∗ (0.0039)∗∗∗ (0.0039)∗∗∗
Yrs. of Educ. (- 12) 0.1233 0.1242(0.0004)∗∗∗ (0.0004)∗∗∗
Yrs. of Educ Above HS 0.1492 0.151(0.0005)∗∗∗ (0.0005)∗∗∗
Yrs. of Educ Above BACH 0.068 0.0661(0.001)∗∗∗ (0.001)∗∗∗
Yrs. of Educ Above HS - CAN 0.1516 0.1517 0.1515 0.1515(0.0005)∗∗∗ (0.0005)∗∗∗ (0.0005)∗∗∗ (0.0005)∗∗∗
Yrs. of Educ Above BACH - CAN 0.0726 0.0708 0.0719 0.0703(0.001)∗∗∗ (0.0011)∗∗∗ (0.001)∗∗∗ (0.0011)∗∗∗
Yrs. of Educ Above HS - FOR 0.1178 0.1296 0.1258 0.1361(0.0011)∗∗∗ (0.0016)∗∗∗ (0.0012)∗∗∗ (0.0016)∗∗∗
Yrs. of Educ Above BACH - FOR 0.0596 0.0441 0.0581 0.0469(0.0021)∗∗∗ (0.0024)∗∗∗ (0.0021)∗∗∗ (0.0024)∗∗∗
Work Exp. 0.051 0.0512 0.0516 0.0518 0.0515 0.0518(0.0002)∗∗∗ (0.0002)∗∗∗ (0.0002)∗∗∗ (0.0002)∗∗∗ (0.0002)∗∗∗ (0.0002)∗∗∗
Work Exp. Square (/100) -.0873 -.0882 -.0878 -.0888 -.0876 -.0888(0.0005)∗∗∗ (0.0005)∗∗∗ (0.0005)∗∗∗ (0.0005)∗∗∗ (0.0005)∗∗∗ (0.0005)∗∗∗
Work Exp. - CAN 0.0522 0.052(0.0002)∗∗∗ (0.0002)∗∗∗
Work Exp. Square (/100) - CAN -.0908 -.0908(0.0005)∗∗∗ (0.0005)∗∗∗
Work Exp. - FOR 0.0066 0.0099(0.002)∗∗∗ (0.002)∗∗∗
Work Exp. Square (/100) - FOR -.0085 -.0394(0.0211) (0.0211)∗
Gender 0.286 0.2859 0.2926 0.2924 0.2935 0.2927 0.2934 0.2928(0.0011)∗∗∗ (0.0011)∗∗∗ (0.0012)∗∗∗ (0.0011)∗∗∗ (0.0011)∗∗∗ (0.0011)∗∗∗ (0.0011)∗∗∗ (0.0011)∗∗∗
Loc. of study F.E. No Yes No Yes No Yes No Yes
Obs. 6323125 6323125 6323125 6323125 6323125 6323125 6323125 6323125R2 0.2115 0.2143 0.2152 0.2182 0.2163 0.2185 0.2178 0.2193
Note: Robust standard errors are in parenthesis. *, ** and *** denote significance at 10%, 5% and 1% levels respectively. The omitted category in thelocation of study fixed effects is “Canada”.
28

Table 12: Modeling Return to Education by Including Educational Group Dummies
(1) (2) (3) (4) (5) (6) (7) (8)Immigrant -.1096 -.0580 -.0787 -.0603 -.0458 -.0285 -.0359 -.0283
(0.002)∗∗∗ (0.0025)∗∗∗ (0.0023)∗∗∗ (0.0025)∗∗∗ (0.0038)∗∗∗ (0.0039)∗∗∗ (0.0038)∗∗∗ (0.0039)∗∗∗
Below Bachelor 0.1652 0.1653 0.1663 0.1667 0.1647 0.1649 0.1654 0.1657(0.0014)∗∗∗ (0.0014)∗∗∗ (0.0014)∗∗∗ (0.0014)∗∗∗ (0.0014)∗∗∗ (0.0014)∗∗∗ (0.0014)∗∗∗ (0.0014)∗∗∗
Bachelor 0.4456 0.4494 0.4558 0.4557 0.447 0.4496 0.4544 0.4542(0.0017)∗∗∗ (0.0017)∗∗∗ (0.0017)∗∗∗ (0.0017)∗∗∗ (0.0017)∗∗∗ (0.0017)∗∗∗ (0.0017)∗∗∗ (0.0017)∗∗∗
Above Bachelor 0.5906 0.5908 0.5997 0.5991 0.5921 0.5916 0.5993 0.5986(0.0022)∗∗∗ (0.0022)∗∗∗ (0.0023)∗∗∗ (0.0023)∗∗∗ (0.0022)∗∗∗ (0.0022)∗∗∗ (0.0023)∗∗∗ (0.0023)∗∗∗
Below Bachelor - FOR -.0390 -.0667 -.0282 -.0462(0.005)∗∗∗ (0.0082)∗∗∗ (0.005)∗∗∗ (0.0082)∗∗∗
Bachelor - FOR -.1530 -.1525 -.1155 -.1152(0.0054)∗∗∗ (0.0088)∗∗∗ (0.0054)∗∗∗ (0.0088)∗∗∗
Above Bachelor - FOR -.0801 -.1441 -.0677 -.1165(0.0057)∗∗∗ (0.009)∗∗∗ (0.0057)∗∗∗ (0.0091)∗∗∗
Work Exp. 0.0518 0.052 0.0518 0.0521(0.0002)∗∗∗ (0.0002)∗∗∗ (0.0002)∗∗∗ (0.0002)∗∗∗
Work Exp. Square (/100) -.0879 -.0889 -.0879 -.0891(0.0005)∗∗∗ (0.0005)∗∗∗ (0.0005)∗∗∗ (0.0005)∗∗∗
Work Exp. - CAN 0.0526 0.0523 0.0524 0.0522(0.0002)∗∗∗ (0.0002)∗∗∗ (0.0002)∗∗∗ (0.0002)∗∗∗
Work Exp. Square (/100) - CAN -.0914 -.0910 -.0910 -.0910(0.0005)∗∗∗ (0.0005)∗∗∗ (0.0005)∗∗∗ (0.0005)∗∗∗
Work Exp. - FOR -.0092 0.0068 0.0015 0.0077(0.0019)∗∗∗ (0.002)∗∗∗ (0.002) (0.002)∗∗∗
Work Exp. Square (/100) - FOR 0.167 0.0086 0.051 -.0139(0.0199)∗∗∗ (0.0206) (0.0206)∗∗ (0.0207)
Gender 0.2922 0.2918 0.2928 0.2919 0.2923 0.2919 0.2927 0.292(0.0012)∗∗∗ (0.0012)∗∗∗ (0.0012)∗∗∗ (0.0012)∗∗∗ (0.0012)∗∗∗ (0.0012)∗∗∗ (0.0012)∗∗∗ (0.0012)∗∗∗
Loc. of study F.E. No Yes No Yes No Yes No Yes
Obs. 6323125 6323125 6323125 6323125 6323125 6323125 6323125 6323125R2 0.2137 0.2167 0.2147 0.217 0.2156 0.2176 0.2162 0.2178
Note: Robust standard errors are in parenthesis. *, ** and *** denote significance at 10%, 5% and 1% levels respectively. The omitted categoryin the location of study fixed effects is “Canada”.
29

Table 13: Interacting Education with Groups of Location of Study
(1) (2) (3) (4)Immigrant -.0964 -.0725
(0.0028)∗∗∗ (0.0041)∗∗∗
Below Bachelor 0.1465 0.1457 0.1466 0.1456(0.0014)∗∗∗ (0.0014)∗∗∗ (0.0014)∗∗∗ (0.0014)∗∗∗
Bachelor 0.4189 0.4176 0.4186 0.4171(0.0017)∗∗∗ (0.0017)∗∗∗ (0.0017)∗∗∗ (0.0017)∗∗∗
Above Bachelor 0.5616 0.561 0.5612 0.5601(0.0023)∗∗∗ (0.0023)∗∗∗ (0.0023)∗∗∗ (0.0023)∗∗∗
Work Exp. 0.0525 0.0527(0.0002)∗∗∗ (0.0002)∗∗∗
Work Exp. Square (/100) -.0892 -.0899(0.0005)∗∗∗ (0.0005)∗∗∗
Work Exp. - CAN 0.0524 0.0525(0.0002)∗∗∗ (0.0002)∗∗∗
Work Exp. Square (/100) - CAN -.0905 -.0909(0.0005)∗∗∗ (0.0005)∗∗∗
Work Exp. - FOR 0.0132 0.0116(0.002)∗∗∗ (0.002)∗∗∗
Work Exp. Square (/100) - FOR -.0720 -.0518(0.0205)∗∗∗ (0.0205)∗∗
Gender 0.2868 0.2869 0.2869 0.2869(0.0011)∗∗∗ (0.0011)∗∗∗ (0.0011)∗∗∗ (0.0011)∗∗∗
Eng. or Fren. Mother Tongue Yes Yes Yes Yes
CMA/Province F.E. Yes Yes Yes Yes
Country/area of origin F.E. No No Yes Yes
Weighted Obs. 6323125 6323125 6323125 6323125
Note: Robust standard errors are in parenthesis.*, ** and *** denote significance at 10%,5% and 1% levels respectively. The omitted categories in the CMA and Province fixed effectsare Toronto and Ontario, respectively. The omitted category for country/area of origin fixedeffect is “Eastern Europe”.

Cont. - Interacting Education with Groups of Location of Study
(1) (2) (3) (4)Trade - WEST 0.0826 0.0439 0.0259 0.0013
(0.0097)∗∗∗ (0.0097)∗∗∗ (0.0099)∗∗∗ (0.01)
Below Bachelor - WEST 0.0485 0.0293 -.0015 -.0080(0.0074)∗∗∗ (0.0074)∗∗∗ (0.0077) (0.0077)
Bachelor - WEST -.0206 -.0175 -.0358 -.0290(0.0085)∗∗ (0.0085)∗∗ (0.0086)∗∗∗ (0.0086)∗∗∗
Above Bachelor - WEST -.0062 -.0051 -.0104 -.0093(0.0066) (0.0066) (0.0066) (0.0066)
Trade - EASTEU 0.0674 0.0608 0.00005 -.0213(0.0167)∗∗∗ (0.0167)∗∗∗ (0.0179) (0.0179)
Below Bachelor - EASTEU -.0599 -.0451 -.1262 -.1248(0.0134)∗∗∗ (0.0133)∗∗∗ (0.0152)∗∗∗ (0.0151)∗∗∗
Bachelor - EASTEU -.1636 -.0960 -.2392 -.1961(0.0161)∗∗∗ (0.0162)∗∗∗ (0.0182)∗∗∗ (0.0182)∗∗∗
Above Bachelor - EASTEU -.1612 -.1350 -.2309 -.2235(0.0144)∗∗∗ (0.0144)∗∗∗ (0.0162)∗∗∗ (0.0161)∗∗∗
Trade - CHINAWC -.1964 -.1595 -.1544 -.1365(0.0328)∗∗∗ (0.032)∗∗∗ (0.0332)∗∗∗ (0.0325)∗∗∗
Below Bachelor - CHINAWC -.2296 -.1590 -.1835 -.1406(0.0172)∗∗∗ (0.0173)∗∗∗ (0.0182)∗∗∗ (0.0182)∗∗∗
Bachelor - CHINAWC -.2587 -.1699 -.2087 -.1517(0.0145)∗∗∗ (0.0147)∗∗∗ (0.016)∗∗∗ (0.0161)∗∗∗
Above Bachelor - CHINAWC -.1928 -.1452 -.1468 -.1253(0.0279)∗∗∗ (0.0278)∗∗∗ (0.0288)∗∗∗ (0.0286)∗∗∗
Trade - IND PAK ASIA -.0913 -.0769 -.0474 -.0467(0.0228)∗∗∗ (0.0228)∗∗∗ (0.0232)∗∗ (0.0233)∗∗
Below Bachelor - IND PAK ASIA -.1870 -.1643 -.1425 -.1327(0.0113)∗∗∗ (0.0113)∗∗∗ (0.0125)∗∗∗ (0.0125)∗∗∗
Bachelor - IND PAK ASIA -.3342 -.2993 -.2902 -.2674(0.0105)∗∗∗ (0.0106)∗∗∗ (0.0121)∗∗∗ (0.0121)∗∗∗
Above Bachelor - IND PAK ASIA -.4249 -.3997 -.3843 -.3705(0.0149)∗∗∗ (0.015)∗∗∗ (0.0163)∗∗∗ (0.0164)∗∗∗
Trade - RESTAME -.1110 -.1133 -.0633 -.0561(0.0166)∗∗∗ (0.0167)∗∗∗ (0.0171)∗∗∗ (0.0173)∗∗∗
Below Bachelor - RESTAME -.1296 -.1165 -.0818 -.0583(0.015)∗∗∗ (0.015)∗∗∗ (0.0156)∗∗∗ (0.0156)∗∗∗
Bachelor - RESTAME -.2327 -.1666 -.1899 -.1119(0.0199)∗∗∗ (0.0203)∗∗∗ (0.0205)∗∗∗ (0.0209)∗∗∗
Above Bachelor - RESTAME -.2567 -.2213 -.2174 -.1706(0.0282)∗∗∗ (0.0286)∗∗∗ (0.0285)∗∗∗ (0.0289)∗∗∗
Note: *, ** and *** denote significance at 10%, 5% and 1% levels respectively. Robuststandard errors are in parenthesis.

Cont. - Interacting Education with Groups of Location of Study
(1) (2) (3) (4)Trade - SOUTHEASTASIA -.0882 -.0828 -.0881 -.0820
(0.0233)∗∗∗ (0.0235)∗∗∗ (0.0242)∗∗∗ (0.0242)∗∗∗
Below Bachelor - SOUTHEASTASIA -.1291 -.1098 -.1428 -.1242(0.013)∗∗∗ (0.0129)∗∗∗ (0.0151)∗∗∗ (0.0151)∗∗∗
Bachelor - SOUTHEASTASIA -.2210 -.1989 -.2371 -.2155(0.0117)∗∗∗ (0.0118)∗∗∗ (0.0146)∗∗∗ (0.0147)∗∗∗
Above Bachelor - SOUTHEASTASIA -.3532 -.3394 -.3669 -.3540(0.0279)∗∗∗ (0.028)∗∗∗ (0.0292)∗∗∗ (0.0292)∗∗∗
Trade - AFRICA -.0439 -.0105 -.0111 -.0015(0.0283) (0.0284) (0.0293) (0.0293)
Below Bachelor - AFRICA -.1310 -.0819 -.0988 -.0725(0.0183)∗∗∗ (0.0185)∗∗∗ (0.0198)∗∗∗ (0.0199)∗∗∗
Bachelor - AFRICA -.1662 -.1179 -.1335 -.1068(0.0234)∗∗∗ (0.0232)∗∗∗ (0.0246)∗∗∗ (0.0244)∗∗∗
Above Bachelor - AFRICA -.0387 -.0097 -.0085 0.0007(0.0421) (0.0419) (0.0427) (0.0424)
Note: *, ** and *** denote significance at 10%, 5% and 1% levels respectively. Robust standarderrors are in parenthesis.

Table 14: Base Specification - Sample Extension: Immigrants Arriving at 15 and older
(1) (2) (3) (4) (5) (6)
Const. 5.8839 5.8694 5.8133 5.7987 5.7764 5.7768(0.0022)∗∗∗ (0.0022)∗∗∗ (0.0022)∗∗∗ (0.0022)∗∗∗ (0.0022)∗∗∗ (0.0022)∗∗∗
Immigrant -.2336 -.0973 -.2445 -.1107(0.0016)∗∗∗ (0.0022)∗∗∗ (0.0016)∗∗∗ (0.0022)∗∗∗
Below Bachelor 0.1617 0.1641(0.0014)∗∗∗ (0.0014)∗∗∗
Bachelor 0.4178 0.4351(0.0017)∗∗∗ (0.0017)∗∗∗
Above Bachelor 0.5596 0.5678(0.0021)∗∗∗ (0.0021)∗∗∗
Yrs. of Educ. (-12) 0.1143 0.1173 0.1193 0.1197(0.0004)∗∗∗ (0.0004)∗∗∗ (0.0004)∗∗∗ (0.0004)∗∗∗
Work Exp. 0.0484 0.0499 0.0476 0.049 0.0492 0.0498(0.0002)∗∗∗ (0.0002)∗∗∗ (0.0002)∗∗∗ (0.0002)∗∗∗ (0.0002)∗∗∗ (0.0002)∗∗∗
Work Exp. Square (/100) -.0799 -.0842 -.0793 -.0832 -.0813 -.0836(0.0005)∗∗∗ (0.0005)∗∗∗ (0.0005)∗∗∗ (0.0005)∗∗∗ (0.0005)∗∗∗ (0.0005)∗∗∗
Gender 0.2827 0.2838 0.2756 0.2768 0.2801 0.2795(0.0011)∗∗∗ (0.0011)∗∗∗ (0.0011)∗∗∗ (0.0011)∗∗∗ (0.0011)∗∗∗ (0.0011)∗∗∗
Age of Imm. 15-19 -.0258 -.0249(0.0042)∗∗∗ (0.0042)∗∗∗
Age of Imm. 20-24 -.0831 -.0469(0.0033)∗∗∗ (0.0035)∗∗∗
Age of Imm. 25-29 -.1825 -.1060(0.0029)∗∗∗ (0.0035)∗∗∗
Age of Imm. 30-34 -.3091 -.2078(0.0033)∗∗∗ (0.0039)∗∗∗
Age of Imm. 35-39 -.4179 -.2957(0.0042)∗∗∗ (0.0048)∗∗∗
Age of Imm. 40-44 -.5285 -.3960(0.0058)∗∗∗ (0.0063)∗∗∗
Age of Imm. 45-49 -.6128 -.4725(0.009)∗∗∗ (0.0093)∗∗∗
Age of Imm. 50 plus -.6441 -.5053(0.0149)∗∗∗ (0.0147)∗∗∗
Loc. of study F.E. No Yes No Yes No Yes
Obs. 6880170 6880170 6880170 6880170 6880170 6880170R2 0.194 0.2066 0.1927 0.2043 0.204 0.2098
Note: Robust standard errors are in parenthesis. *, ** and *** denote significance at 10%, 5% and 1% levelsrespectively. The omitted category in the location of study fixed effects is Canada.
33

Table 15: Separating Years of Education Above High School from Years of Education Above Bachelor’s Degree - Immigrants15 and older
(1) (2) (3) (4) (5) (6) (7) (8)Immigrant -.2445 -.1107 -.2446 -.1066 -.1052 -.0832 -.0081 -.0113
(0.0016)∗∗∗ (0.0022)∗∗∗ (0.0016)∗∗∗ (0.0022)∗∗∗ (0.0022)∗∗∗ (0.0023)∗∗∗ (0.0031)∗∗∗ (0.0031)∗∗∗
Yrs of Educ. (-12) 0.1143 0.1173(0.0004)∗∗∗ (0.0004)∗∗∗
Yrs. of Educ Above HS 0.1393 0.1463(0.0005)∗∗∗ (0.0005)∗∗∗
Yrs. of Educ Above BACH 0.0671 0.0617(0.0009)∗∗∗ (0.0009)∗∗∗
Yrs. of Educ Above HS - CAN 0.1485 0.1488 0.1483 0.1486(0.0005)∗∗∗ (0.0005)∗∗∗ (0.0005)∗∗∗ (0.0005)∗∗∗
Yrs. of Educ Above BACH - CAN 0.0827 0.0756 0.0784 0.0744(0.001)∗∗∗ (0.001)∗∗∗ (0.001)∗∗∗ (0.001)∗∗∗
Yrs. of Educ Above HS - FOR 0.0814 0.1086 0.1109 0.1264(0.0009)∗∗∗ (0.0012)∗∗∗ (0.0009)∗∗∗ (0.0012)∗∗∗
Yrs. of Educ Above BACH - FOR 0.0626 0.0433 0.0637 0.0499(0.0015)∗∗∗ (0.0016)∗∗∗ (0.0015)∗∗∗ (0.0016)∗∗∗
Work Exp. 0.0476 0.049 0.0481 0.0497 0.0489 0.0499(0.0002)∗∗∗ (0.0002)∗∗∗ (0.0002)∗∗∗ (0.0002)∗∗∗ (0.0002)∗∗∗ (0.0002)∗∗∗
Work Exp. Square (/100) -.0793 -.0832 -.0797 -.0840 -.0817 -.0847(0.0005)∗∗∗ (0.0005)∗∗∗ (0.0005)∗∗∗ (0.0005)∗∗∗ (0.0005)∗∗∗ (0.0005)∗∗∗
Work Exp. - CAN 0.051 0.0506(0.0002)∗∗∗ (0.0002)∗∗∗
Work Exp. Square (/100) - CAN -.0886 -.0881(0.0005)∗∗∗ (0.0005)∗∗∗
Work Exp. - FOR 0.0043 0.0072(0.0006)∗∗∗ (0.0006)∗∗∗
Work Exp. Square (/100) - FOR -.0196 -.0240(0.0023)∗∗∗ (0.0023)∗∗∗
Gender 0.2756 0.2768 0.2822 0.2841 0.2868 0.2856 0.289 0.2879(0.0011)∗∗∗ (0.0011)∗∗∗ (0.0011)∗∗∗ (0.0011)∗∗∗ (0.0011)∗∗∗ (0.0011)∗∗∗ (0.0011)∗∗∗ (0.0011)∗∗∗
Loc. of study F.E. No Yes No Yes No Yes No Yes
Obs. 6880170 6880170 6880170 6880170 6880170 6880170 6880170 6880170R2 0.1927 0.2043 0.1959 0.2086 0.2023 0.2098 0.2118 0.2159
Note: Robust standard errors are in parenthesis. *, ** and *** denote significance at 10%, 5% and 1% levels respectively. The omitted category inthe location of study fixed effects is “Canada”.
34

Table 16: Modeling Return to Education by Including Educational Group Dummies - Immigrants 15 and older
(1) (2) (3) (4) (5) (6) (7) (8)Immigrant -.2336 -.0973 -.1373 -.1006 -.0419 -.0119 -.0174 -.0155
(0.0016)∗∗∗ (0.0022)∗∗∗ (0.0021)∗∗∗ (0.0022)∗∗∗ (0.003)∗∗∗ (0.0031)∗∗∗ (0.0031)∗∗∗ (0.0031)∗∗∗
Below Bachelor 0.1617 0.1641 0.166 0.1655 0.1622 0.1637 0.1629 0.1643(0.0014)∗∗∗ (0.0014)∗∗∗ (0.0014)∗∗∗ (0.0014)∗∗∗ (0.0014)∗∗∗ (0.0014)∗∗∗ (0.0014)∗∗∗ (0.0014)∗∗∗
Bachelor 0.4178 0.4351 0.454 0.4529 0.4287 0.4381 0.4505 0.4512(0.0017)∗∗∗ (0.0017)∗∗∗ (0.0017)∗∗∗ (0.0017)∗∗∗ (0.0016)∗∗∗ (0.0017)∗∗∗ (0.0017)∗∗∗ (0.0017)∗∗∗
Above Bachelor 0.5596 0.5678 0.5985 0.5951 0.5725 0.5758 0.5967 0.5966(0.0021)∗∗∗ (0.0021)∗∗∗ (0.0023)∗∗∗ (0.0023)∗∗∗ (0.0021)∗∗∗ (0.0021)∗∗∗ (0.0023)∗∗∗ (0.0023)∗∗∗
Below Bachelor - FOR -.0889 -.0802 -.0301 -.0508(0.0038)∗∗∗ (0.0062)∗∗∗ (0.0038)∗∗∗ (0.0062)∗∗∗
Bachelor - FOR -.2806 -.2244 -.1702 -.1628(0.0039)∗∗∗ (0.0065)∗∗∗ (0.0039)∗∗∗ (0.0065)∗∗∗
Above Bachelor - FOR -.2137 -.2302 -.1289 -.1692(0.0044)∗∗∗ (0.0068)∗∗∗ (0.0043)∗∗∗ (0.0068)∗∗∗
Work Exp. 0.0484 0.0499 0.0492 0.0503(0.0002)∗∗∗ (0.0002)∗∗∗ (0.0002)∗∗∗ (0.0002)∗∗∗
Work Exp. 2 (/100) -.0799 -.0842 -.0821 -.0853(0.0005)∗∗∗ (0.0005)∗∗∗ (0.0005)∗∗∗ (0.0005)∗∗∗
Work Exp. - CAN 0.052 0.051 0.0512 0.0507(0.0002)∗∗∗ (0.0002)∗∗∗ (0.0002)∗∗∗ (0.0002)∗∗∗
Work Exp. 2 (/100) - CAN -.0903 -.0887 -.0887 -.0881(0.0005)∗∗∗ (0.0005)∗∗∗ (0.0005)∗∗∗ (0.0005)∗∗∗
Work Exp. - FOR -.0016 0.0066 0.0037 0.0072(0.0006)∗∗∗ (0.0006)∗∗∗ (0.0006)∗∗∗ (0.0006)∗∗∗
Work Exp. 2 (/100) - FOR -.0026 -.0206 -.0173 -.0243(0.0023) (0.0023)∗∗∗ (0.0023)∗∗∗ (0.0022)∗∗∗
Gender 0.2827 0.2838 0.2862 0.2849 0.2869 0.2868 0.2887 0.2876(0.0011)∗∗∗ (0.0011)∗∗∗ (0.0011)∗∗∗ (0.0011)∗∗∗ (0.0011)∗∗∗ (0.0011)∗∗∗ (0.0011)∗∗∗ (0.0011)∗∗∗
Loc. of study F.E. No Yes No Yes No Yes No Yes
Obs. 6880170 6880170 6880170 6880170 6880170 6880170 6880170 6880170R2 0.194 0.2066 0.2002 0.2083 0.2077 0.2132 0.2099 0.2142
Note: Robust standard errors are in parenthesis. *, ** and *** denote significance at 10%, 5% and 1% levels respectively. The omittedcategory in the location of study fixed effects is “Canada”.
35

Table 17: Separating Years of Education Above High School from Years of Education Above Bachelor’s Degree - Females
(1) (2) (3) (4) (5) (6) (7) (8)Immigrant -.1040 -.0293 -.1044 -.0285 -.0286 -.0145 -.0007 0.0102
(0.0028)∗∗∗ (0.0033)∗∗∗ (0.0028)∗∗∗ (0.0033)∗∗∗ (0.0033)∗∗∗ (0.0034)∗∗∗ (0.0052) (0.0052)∗∗
Yrs. of Educ. (-12) 0.1495 0.1512(0.0005)∗∗∗ (0.0005)∗∗∗
Yrs. of Educ Above HS 0.1821 0.1843(0.0007)∗∗∗ (0.0007)∗∗∗
Yrs. of Educ Above BACH 0.0766 0.076(0.0014)∗∗∗ (0.0014)∗∗∗
Yrs. of Educ Above HS - CAN 0.1858 0.1856 0.1855 0.1854(0.0007)∗∗∗ (0.0007)∗∗∗ (0.0007)∗∗∗ (0.0007)∗∗∗
Yrs. of Educ Above BACH - CAN 0.0825 0.0808 0.082 0.0804(0.0015)∗∗∗ (0.0015)∗∗∗ (0.0015)∗∗∗ (0.0015)∗∗∗
Yrs. of Educ Above HS - FOR 0.1359 0.1499 0.1425 0.155(0.0015)∗∗∗ (0.0022)∗∗∗ (0.0016)∗∗∗ (0.0022)∗∗∗
Yrs. of Educ Above BACH - FOR 0.0648 0.0503 0.0636 0.0524(0.0032)∗∗∗ (0.0038)∗∗∗ (0.0032)∗∗∗ (0.0038)∗∗∗
Work Exp. 0.0461 0.0461 0.0469 0.0469 0.0467 0.0469(0.0003)∗∗∗ (0.0003)∗∗∗ (0.0003)∗∗∗ (0.0003)∗∗∗ (0.0003)∗∗∗ (0.0003)∗∗∗
Work Exp. Square (/100) -.0802 -.0806 -.0810 -.0816 -.0808 -.0816(0.0007)∗∗∗ (0.0007)∗∗∗ (0.0007)∗∗∗ (0.0007)∗∗∗ (0.0007)∗∗∗ (0.0007)∗∗∗
Work Exp. - CAN 0.0475 0.0474(0.0003)∗∗∗ (0.0003)∗∗∗
Work Exp. Square (/100) - CAN -.0841 -.0841(0.0007)∗∗∗ (0.0007)∗∗∗
Work Exp. - FOR 0.0073 0.0095(0.0027)∗∗∗ (0.0027)∗∗∗
Work Exp. Square (/100) - FOR -.0095 -.0352(0.0284) (0.0284)
Loc. of study F.E. No Yes No Yes No Yes No Yes
Obs. 2909150 2909150 2909150 2909150 2909150 2909150 2909150 2909150R2 0.2046 0.2087 0.2112 0.2156 0.214 0.2161 0.2156 0.2173
Note: Robust standard errors are in parenthesis. *, ** and *** denote significance at 10%, 5% and 1% levels respectively. The omitted category inthe location of study fixed effects is “Canada”.
36

Table 18: Modeling Return to Education by Including Educational Group Dummies - Females
(1) (2) (3) (4) (5) (6) (7) (8)Immigrant -.0933 -.0202 -.0444 -.0223 -.0263 0.0087 -.0057 0.0091
(0.0028)∗∗∗ (0.0033)∗∗∗ (0.0032)∗∗∗ (0.0033)∗∗∗ (0.0051)∗∗∗ (0.0052)∗ (0.0051) (0.0052)∗
Below Bachelor 0.2508 0.2519 0.2531 0.2544 0.2507 0.2516 0.2526 0.2538(0.0021)∗∗∗ (0.0021)∗∗∗ (0.0021)∗∗∗ (0.0022)∗∗∗ (0.0021)∗∗∗ (0.0021)∗∗∗ (0.0021)∗∗∗ (0.0022)∗∗∗
Bachelor 0.5589 0.5639 0.5728 0.5735 0.5602 0.5638 0.5713 0.5721(0.0024)∗∗∗ (0.0024)∗∗∗ (0.0024)∗∗∗ (0.0024)∗∗∗ (0.0024)∗∗∗ (0.0024)∗∗∗ (0.0024)∗∗∗ (0.0024)∗∗∗
Above Bachelor 0.7167 0.7209 0.73 0.7304 0.7183 0.721 0.7293 0.7295(0.003)∗∗∗ (0.003)∗∗∗ (0.0031)∗∗∗ (0.0031)∗∗∗ (0.003)∗∗∗ (0.003)∗∗∗ (0.0031)∗∗∗ (0.0031)∗∗∗
Below Bachelor - FOR -.0665 -.1151 -.0578 -.1032(0.0068)∗∗∗ (0.0126)∗∗∗ (0.0069)∗∗∗ (0.0126)∗∗∗
Bachelor - FOR -.2140 -.2455 -.1810 -.2175(0.0072)∗∗∗ (0.0131)∗∗∗ (0.0073)∗∗∗ (0.0132)∗∗∗
Above Bachelor - FOR -.1199 -.2102 -.1083 -.1914(0.0077)∗∗∗ (0.0137)∗∗∗ (0.0077)∗∗∗ (0.0137)∗∗∗
Work Exp. 0.0469 0.047 0.0469 0.0471(0.0003)∗∗∗ (0.0003)∗∗∗ (0.0003)∗∗∗ (0.0003)∗∗∗
Work Exp. Square (/100) -.0805 -.0811 -.0806 -.0814(0.0007)∗∗∗ (0.0007)∗∗∗ (0.0007)∗∗∗ (0.0007)∗∗∗
Work Exp. - CAN 0.0479 0.0475 0.0476 0.0474(0.0003)∗∗∗ (0.0003)∗∗∗ (0.0003)∗∗∗ (0.0003)∗∗∗
Work Exp. Square (/100) - CAN -.0844 -.0838 -.0838 -.0837(0.0007)∗∗∗ (0.0007)∗∗∗ (0.0007)∗∗∗ (0.0007)∗∗∗
Work Exp. - FOR -.0172 0.0038 0.0002 0.0057(0.0026)∗∗∗ (0.0027) (0.0027) (0.0027)∗∗
Work Exp. Square (/100) - FOR 0.2665 0.0465 0.0769 0.0086(0.0272)∗∗∗ (0.0278)∗ (0.0278)∗∗∗ (0.0279)
Loc. of study F.E. No Yes No Yes No Yes No Yes
Obs. 2909150 2909150 2909150 2909150 2909150 2909150 2909150 2909150R2 0.2077 0.2118 0.21 0.2126 0.21 0.213 0.2116 0.2137
Note: Robust standard errors are in parenthesis. *, ** and *** denote significance at 10%, 5% and 1% levels respectively. The omitted categoryin the location of study fixed effects is “Canada”.
37

Table 19: Separating Years of Education Above High School from Years of Education Above Bachelor’s Degree - Males
(1) (2) (3) (4) (5) (6) (7) (8)Immigrant -.1250 -.0902 -.1257 -.0904 -.0960 -.0876 -.0603 -.0607
(0.0029)∗∗∗ (0.0036)∗∗∗ (0.0029)∗∗∗ (0.0036)∗∗∗ (0.0035)∗∗∗ (0.0037)∗∗∗ (0.0057)∗∗∗ (0.0057)∗∗∗
Yrs. of Educ. (-12) 0.1034 0.1037(0.0005)∗∗∗ (0.0005)∗∗∗
Yrs. of Educ Above HS 0.1226 0.1242(0.0008)∗∗∗ (0.0008)∗∗∗
Yrs. of Educ Above BACH 0.0636 0.0608(0.0013)∗∗∗ (0.0013)∗∗∗
Yrs. of Educ Above HS - CAN 0.124 0.1243 0.1241 0.1243(0.0008)∗∗∗ (0.0008)∗∗∗ (0.0008)∗∗∗ (0.0008)∗∗∗
Yrs. of Educ Above BACH - CAN 0.0664 0.0643 0.0657 0.0638(0.0015)∗∗∗ (0.0015)∗∗∗ (0.0015)∗∗∗ (0.0015)∗∗∗
Yrs. of Educ Above HS - FOR 0.104 0.1158 0.1138 0.1242(0.0016)∗∗∗ (0.0022)∗∗∗ (0.0017)∗∗∗ (0.0023)∗∗∗
Yrs. of Educ Above BACH - FOR 0.0593 0.0449 0.0576 0.0486(0.0028)∗∗∗ (0.0031)∗∗∗ (0.0028)∗∗∗ (0.0031)∗∗∗
Work Exp. 0.0574 0.0576 0.0577 0.058 0.0577 0.058(0.0003)∗∗∗ (0.0003)∗∗∗ (0.0003)∗∗∗ (0.0003)∗∗∗ (0.0003)∗∗∗ (0.0003)∗∗∗
Work Exp. Square (/100) -.0978 -.0990 -.0980 -.0993 -.0979 -.0993(0.0007)∗∗∗ (0.0007)∗∗∗ (0.0007)∗∗∗ (0.0007)∗∗∗ (0.0007)∗∗∗ (0.0007)∗∗∗
Work Exp. - CAN 0.0582 0.058(0.0003)∗∗∗ (0.0003)∗∗∗
Work Exp. Square (/100) - CAN -.1008 -.1009(0.0007)∗∗∗ (0.0007)∗∗∗
Work Exp. - FOR 0.0059 0.0096(0.003)∗∗ (0.003)∗∗∗
Work Exp. Square (/100) - FOR -.0048 -.0341(0.0307) (0.0308)
Loc. of study F.E. No Yes No Yes No Yes No Yes
Obs. 3413970 3413970 3413970 3413970 3413970 3413970 3413970 3413970R2 0.1611 0.1639 0.1631 0.1661 0.1635 0.1662 0.165 0.1668
Note: Robust standard errors are in parenthesis. *, ** and *** denote significance at 10%, 5% and 1% levels respectively. The omitted category inthe location of study fixed effects is “Canada”.
38

Table 20: Modeling Return to Education by Including Educational Group Dummies - Males
(1) (2) (3) (4) (5) (6) (7) (8)Immigrant -.1184 -.0839 -.1008 -.0857 -.0600 -.0548 -.0568 -.0546
(0.0029)∗∗∗ (0.0036)∗∗∗ (0.0033)∗∗∗ (0.0036)∗∗∗ (0.0056)∗∗∗ (0.0057)∗∗∗ (0.0057)∗∗∗ (0.0057)∗∗∗
Below Bachelor 0.1212 0.121 0.1217 0.1219 0.1205 0.1204 0.1206 0.1206(0.0019)∗∗∗ (0.0019)∗∗∗ (0.0019)∗∗∗ (0.0019)∗∗∗ (0.0019)∗∗∗ (0.0019)∗∗∗ (0.0019)∗∗∗ (0.0019)∗∗∗
Bachelor 0.3677 0.3711 0.3745 0.3741 0.3696 0.372 0.3734 0.373(0.0024)∗∗∗ (0.0024)∗∗∗ (0.0024)∗∗∗ (0.0024)∗∗∗ (0.0024)∗∗∗ (0.0024)∗∗∗ (0.0024)∗∗∗ (0.0024)∗∗∗
Above Bachelor 0.5041 0.5016 0.509 0.5082 0.506 0.5034 0.5093 0.5084(0.0032)∗∗∗ (0.0033)∗∗∗ (0.0034)∗∗∗ (0.0034)∗∗∗ (0.0032)∗∗∗ (0.0033)∗∗∗ (0.0034)∗∗∗ (0.0034)∗∗∗
Below Bachelor - FOR -.0217 -.0385 -.0095 -.0131(0.0073)∗∗∗ (0.0108)∗∗∗ (0.0074) (0.0109)
Bachelor - FOR -.0989 -.0768 -.0564 -.0329(0.0079)∗∗∗ (0.0119)∗∗∗ (0.008)∗∗∗ (0.012)∗∗∗
Above Bachelor - FOR -.0432 -.0914 -.0298 -.0580(0.0082)∗∗∗ (0.0121)∗∗∗ (0.0082)∗∗∗ (0.0122)∗∗∗
Work Exp. 0.0578 0.0581 0.0578 0.0582(0.0003)∗∗∗ (0.0003)∗∗∗ (0.0003)∗∗∗ (0.0003)∗∗∗
Work Exp. Square (/100) -.0981 -.0995 -.0982 -.0996(0.0007)∗∗∗ (0.0007)∗∗∗ (0.0007)∗∗∗ (0.0007)∗∗∗
Work Exp. - CAN 0.0584 0.0581 0.0583 0.0581(0.0003)∗∗∗ (0.0003)∗∗∗ (0.0003)∗∗∗ (0.0003)∗∗∗
Work Exp. Square (/100) - CAN -.1012 -.1010 -.1010 -.1010(0.0007)∗∗∗ (0.0007)∗∗∗ (0.0007)∗∗∗ (0.0007)∗∗∗
Work Exp. - FOR -.0011 0.0102 0.004 0.0101(0.0028) (0.0029)∗∗∗ (0.0029) (0.0029)∗∗∗
Work Exp. Square (/100) - FOR 0.0732 -.0329 0.0194 -.0386(0.0288)∗∗ (0.03) (0.0298) (0.0301)
Loc. of study F.E. No Yes No Yes No Yes No Yes
Obs. 3413970 3413970 3413970 3413970 3413970 3413970 3413970 3413970R2 0.1628 0.1658 0.1632 0.1659 0.1646 0.1664 0.1647 0.1665
Note: Robust standard errors are in parenthesis. *, ** and *** denote significance at 10%, 5% and 1% levels respectively. The omitted categoryin the location of study fixed effects is “Canada”.
39

Table 21: Immigrant Wage Gap by Country of Origin - Base Specification
(1) (2) (3) (4) (5) (6)
Below Bachelor 0.1452 0.1456(0.0014)∗∗∗ (0.0014)∗∗∗
Bachelor 0.4108 0.4131(0.0017)∗∗∗ (0.0017)∗∗∗
Above Bachelor 0.5535 0.5542(0.0022)∗∗∗ (0.0022)∗∗∗
Yrs. of Educ. (- 12) 0.116 0.1167 0.1166 0.1169(0.0004)∗∗∗ (0.0004)∗∗∗ (0.0004)∗∗∗ (0.0004)∗∗∗
Work Exp. 0.0526 0.0527 0.0519 0.0519 0.0521 0.052(0.0002)∗∗∗ (0.0002)∗∗∗ (0.0002)∗∗∗ (0.0002)∗∗∗ (0.0002)∗∗∗ (0.0002)∗∗∗
Work Exp. Square (/100) -.0898 -.0899 -.0892 -.0891 -.0894 -.0893(0.0005)∗∗∗ (0.0005)∗∗∗ (0.0005)∗∗∗ (0.0005)∗∗∗ (0.0005)∗∗∗ (0.0005)∗∗∗
Gender 0.287 0.2869 0.2823 0.2823 0.2827 0.2826(0.0011)∗∗∗ (0.0011)∗∗∗ (0.0011)∗∗∗ (0.0011)∗∗∗ (0.0011)∗∗∗ (0.0011)∗∗∗
Age of Imm. 15-19 0.0549 0.0166(0.0053)∗∗∗ (0.0054)∗∗∗
Age of Imm. 20-24
Age of Imm. 25-29 -.0814 -.0573(0.0043)∗∗∗ (0.0044)∗∗∗
Eng. or Fren. Mother Tongue Yes Yes Yes Yes Yes YesCMA/Province F.E. Yes Yes Yes Yes Yes YesCountry/area of Orig. F.E. Yes Yes Yes Yes Yes YesGroup Loc. of Study F.E. No Yes No Yes No Yes
Obs. 6323125 6323125 6323125 6323125 6323125 6323125R2 0.2455 0.2468 0.2445 0.2458 0.2452 0.246
Country/area Weighted Ave. -.1540 -.1007 -.1648 -.1106 -.1390 -.0967(0.0026)∗∗∗ (0.0030)∗∗∗ (0.0026)∗∗∗ (0.0030)∗∗∗ (0.0037)∗∗∗ (0.0040)∗∗∗
Note: Robust standard errors are in parenthesis. *, ** and *** denote significance at 10%, 5% and 1% levelsrespectively. The omitted category in the groups of location of study is “Canada”. The mother tongue fixedeffects incorporates a dummy for English mother tongue and a dummy for French Mother tongue. The omittedcategories in the CMA and Province fixed effects are Toronto and Ontario, respectively. The omitted category forcountry/area of origin fixed effect is “Canada”.
40

Table 22: Base Specification - Weighted Average of Country of Origin Dummies
(1) (2) (3) (4)Const. 5.8415 5.8408 5.7573 5.7561
(0.0022)∗∗∗ (0.0022)∗∗∗ (0.0022)∗∗∗ (0.0022)∗∗∗
Immigrant
Below Bachelor 0.1653 0.1655(0.0014)∗∗∗ (0.0014)∗∗∗
Bachelor 0.4478 0.45(0.0017)∗∗∗ (0.0017)∗∗∗
Above Bachelor 0.5929 0.5926(0.0022)∗∗∗ (0.0022)∗∗∗
Yrs. of Educ. (-12) 0.124 0.1246(0.0004)∗∗∗ (0.0004)∗∗∗
Work Exp. 0.0521 0.0522 0.0513 0.0513(0.0002)∗∗∗ (0.0002)∗∗∗ (0.0002)∗∗∗ (0.0002)∗∗∗
Work Exp. Square (/100) -.0894 -.0896 -.0888 -.0889(0.0005)∗∗∗ (0.0005)∗∗∗ (0.0005)∗∗∗ (0.0005)∗∗∗
Gender 0.2923 0.2921 0.2862 0.2862(0.0012)∗∗∗ (0.0012)∗∗∗ (0.0011)∗∗∗ (0.0011)∗∗∗
Country/area of origin F.E. Yes Yes Yes YesLoc. of study F.E. No Yes No Yes
Obs. 6323125 6323125 6323125 6323125R2 0.216 0.2175 0.2139 0.2152
Country/area of origin (Weighted Av.) -.1095 -.0569 -.1180 -.0659(0.0020)∗∗∗ (0.0025)∗∗∗ (0.0020)∗∗∗ (0.0026)∗∗∗
Note: Robust standard errors are in parenthesis.*, ** and *** denote significance at 10%, 5% and1% levels respectively. The omitted category for country/area of origin fixed effect is “Canada”.
41

Table 23: Immigrant Wage Gap by Country of Origin - Separating Years of Education Above HighSchool from Years of Education Above Bachelor’s Degree
(1) (2) (3) (4) (5) (6)
Yrs. of Educ Above HS 0.139 0.1399(0.0005)∗∗∗ (0.0005)∗∗∗
Yrs. of Educ Above BACH 0.0677 0.0672(0.001)∗∗∗ (0.001)∗∗∗
Yrs. of Educ Above HS - CAN 0.1408 0.1404 0.1406 0.1402(0.0005)∗∗∗ (0.0005)∗∗∗ (0.0005)∗∗∗ (0.0005)∗∗∗
Yrs. of Educ Above BACH - CAN 0.0724 0.0704 0.0719 0.0699(0.001)∗∗∗ (0.001)∗∗∗ (0.001)∗∗∗ (0.001)∗∗∗
Yrs. of Educ Above HS - FOR 0.1133 0.1271 0.1191 0.1326(0.0012)∗∗∗ (0.0016)∗∗∗ (0.0012)∗∗∗ (0.0016)∗∗∗
Yrs. of Educ Above BACH - FOR 0.0558 0.0514 0.054 0.0532(0.0021)∗∗∗ (0.0024)∗∗∗ (0.0021)∗∗∗ (0.0024)∗∗∗
Work Exp. 0.0524 0.0525 0.0524 0.0525(0.0002)∗∗∗ (0.0002)∗∗∗ (0.0002)∗∗∗ (0.0002)∗∗∗
Work Exp. Square (/100) -.0896 -.0897 -.0895 -.0897(0.0005)∗∗∗ (0.0005)∗∗∗ (0.0005)∗∗∗ (0.0005)∗∗∗
Work Exp. - CAN 0.0524 0.0524(0.0002)∗∗∗ (0.0002)∗∗∗
Work Exp. Square (/100) - CAN -.0908 -.0909(0.0005)∗∗∗ (0.0005)∗∗∗
Work Exp. - FOR 0.006 0.0116(0.002)∗∗∗ (0.002)∗∗∗
Work Exp. Square (/100) - FOR -.0032 -.0463(0.0208) (0.0209)∗∗
Gender 0.2879 0.2879 0.2886 0.2881 0.2886 0.2881(0.0011)∗∗∗ (0.0011)∗∗∗ (0.0011)∗∗∗ (0.0011)∗∗∗ (0.0011)∗∗∗ (0.0011)∗∗∗
Eng. or Fren. Mother Tongue Yes Yes Yes Yes Yes YesCMA/Province F.E. Yes Yes Yes Yes Yes YesCountry/area of Orig. F.E. Yes Yes Yes Yes Yes YesGroup Loc. of Study F.E. No Yes No Yes No Yes
Obs. 6323125 6323125 6323125 6323125 6323125 6323125R2 0.2473 0.2486 0.248 0.2487 0.2485 0.2491
Country/area Weighted Ave. -.1622 -.10743 -.1207 -.1021 -.0848 -.0769(0.0026)∗∗∗ (0.0030)∗∗∗ (0.0030)∗∗∗ (0.0030)∗∗∗ (0.0042)∗∗∗ (0.0042)∗∗∗
Note: Robust standard errors are in parenthesis. *, ** and *** denote significance at 10%, 5% and 1% levelsrespectively. The omitted category in the groups of location of study is “Canada”. The mother tongue fixed effectsincorporates a dummy for English mother tongue and a dummy for French Mother tongue. The omitted categories inthe CMA and Province fixed effects are Toronto and Ontario, respectively. The omitted category for country/area oforigin fixed effect is “Canada”.
42

Table 24: Immigrant Wage Gap by Country of Origin - Educational Group Dummies
(1) (2) (3) (4) (5) (6)
Below Bachelor 0.1452 0.1456 0.1471 0.1465 0.1464 0.1456(0.0014)∗∗∗ (0.0014)∗∗∗ (0.0014)∗∗∗ (0.0014)∗∗∗ (0.0014)∗∗∗ (0.0014)∗∗∗
Bachelor 0.4108 0.4131 0.4191 0.4185 0.4178 0.417(0.0017)∗∗∗ (0.0017)∗∗∗ (0.0017)∗∗∗ (0.0017)∗∗∗ (0.0017)∗∗∗ (0.0017)∗∗∗
Above Bachelor 0.5535 0.5542 0.5623 0.5613 0.5616 0.5602(0.0022)∗∗∗ (0.0022)∗∗∗ (0.0023)∗∗∗ (0.0023)∗∗∗ (0.0023)∗∗∗ (0.0023)∗∗∗
Below Bachelor - FOR -.0562 -.0458 -.0457 -.0266(0.005)∗∗∗ (0.008)∗∗∗ (0.0051)∗∗∗ (0.008)∗∗∗
Bachelor - FOR -.1314 -.1191 -.1041 -.0834(0.0054)∗∗∗ (0.0084)∗∗∗ (0.0055)∗∗∗ (0.0085)∗∗∗
Above Bachelor - FOR -.0816 -.1107 -.0746 -.0863(0.0056)∗∗∗ (0.0087)∗∗∗ (0.0056)∗∗∗ (0.0088)∗∗∗
Work Exp. 0.0526 0.0527 0.0526 0.0527(0.0002)∗∗∗ (0.0002)∗∗∗ (0.0002)∗∗∗ (0.0002)∗∗∗
Work Exp. Square (/100) -.0898 -.0899 -.0898 -.0900(0.0005)∗∗∗ (0.0005)∗∗∗ (0.0005)∗∗∗ (0.0005)∗∗∗
Work Exp. - CAN 0.0526 0.0526(0.0002)∗∗∗ (0.0002)∗∗∗
Work Exp. Square (/100) - CAN -.0911 -.0911(0.0005)∗∗∗ (0.0005)∗∗∗
Work Exp. - FOR 0.004 0.0108(0.0019)∗∗ (0.002)∗∗∗
Work Exp. Square (/100) - FOR 0.0265 -.0388(0.0203) (0.0205)∗
Gender 0.287 0.2869 0.2876 0.287 0.2875 0.287(0.0011)∗∗∗ (0.0011)∗∗∗ (0.0011)∗∗∗ (0.0011)∗∗∗ (0.0011)∗∗∗ (0.0011)∗∗∗
Eng. or Fren. Mother Tongue Yes Yes Yes Yes Yes YesCMA/Province F.E. (Ontario - Toronto) Yes Yes Yes Yes Yes YesCountry/area of Orig. F.E. Yes Yes Yes Yes Yes YesGroup Loc. of study F.E. No Yes No Yes No Yes
Obs. 6323125 6323125 6323125 6323125 6323125 6323125R2 0.2455 0.2468 0.2462 0.247 0.2467 0.2473
Country/area Weighted Ave. -.1540 -.1007 -.1240 -.1031 -.0836 -.0734(0.0026)∗∗∗ (0.0030)∗∗∗ (0.0028)∗∗∗ (0.0030)∗∗∗ (0.0042)∗∗∗ (0.0042)∗∗∗
Note: Robust standard errors are in parenthesis. *, ** and *** denote significance at 10%, 5% and 1% levels respectively.The omitted category in the groups of location of study is “Canada”. The mother tongue fixed effects incorporates a dummyfor English mother tongue and a dummy for French Mother tongue. The omitted categories in the CMA and Province fixedeffects are Toronto and Ontario, respectively. The omitted category for country/area of origin fixed effect is “Canada”.
43

Table 25: Immigrant Wage Gap by Country of Origin - Educational Group Dummies (Immigrants between20 and 29)
(1) (2) (3) (4) (5) (6)
Below Bachelor 0.1457 0.146 0.1469 0.1469 0.1466 0.146(0.0014)∗∗∗ (0.0014)∗∗∗ (0.0014)∗∗∗ (0.0014)∗∗∗ (0.0014)∗∗∗ (0.0014)∗∗∗
Bachelor 0.4112 0.4128 0.4181 0.418 0.4174 0.4167(0.0017)∗∗∗ (0.0017)∗∗∗ (0.0017)∗∗∗ (0.0017)∗∗∗ (0.0017)∗∗∗ (0.0017)∗∗∗
Above Bachelor 0.5548 0.5546 0.5622 0.5614 0.5615 0.5598(0.0022)∗∗∗ (0.0022)∗∗∗ (0.0023)∗∗∗ (0.0023)∗∗∗ (0.0023)∗∗∗ (0.0023)∗∗∗
Below Bachelor - FOR -.0414 -.0443 -.0419 -.0258(0.0051)∗∗∗ (0.0082)∗∗∗ (0.0051)∗∗∗ (0.0082)∗∗∗
Bachelor - FOR -.1128 -.1165 -.0976 -.0824(0.0056)∗∗∗ (0.0086)∗∗∗ (0.0056)∗∗∗ (0.0087)∗∗∗
Above Bachelor - FOR -.0711 -.1085 -.0694 -.0843(0.0057)∗∗∗ (0.0089)∗∗∗ (0.0057)∗∗∗ (0.009)∗∗∗
Work Exp. 0.0527 0.0527 0.0527 0.0527(0.0002)∗∗∗ (0.0002)∗∗∗ (0.0002)∗∗∗ (0.0002)∗∗∗
Work Exp. Square (/100) -.0900 -.0899 -.0899 -.0901(0.0005)∗∗∗ (0.0005)∗∗∗ (0.0005)∗∗∗ (0.0005)∗∗∗
Work Exp. - CAN 0.0526 0.0525(0.0002)∗∗∗ (0.0002)∗∗∗
Work Exp. Square (/100) - CAN -.0910 -.0910(0.0005)∗∗∗ (0.0005)∗∗∗
Work Exp. - FOR 0.0122 0.0125(0.0028)∗∗∗ (0.0028)∗∗∗
Work Exp. Square (/100) - FOR -.0349 -.0518(0.0257) (0.0256)∗∗
Gender 0.2885 0.2884 0.289 0.2885 0.289 0.2885(0.0011)∗∗∗ (0.0011)∗∗∗ (0.0011)∗∗∗ (0.0011)∗∗∗ (0.0011)∗∗∗ (0.0011)∗∗∗
Eng. or Fren. Mother Tongue Yes Yes Yes Yes Yes YesCMA/Province F.E. (Ontario - Toronto) Yes Yes Yes Yes Yes YesCountry/area of Orig. F.E. Yes Yes Yes Yes Yes YesGroup Loc. of study F.E. No Yes No Yes No Yes
Obs. 6193890 6193890 6193890 6193890 6193890 6193890R2 0.2467 0.2475 0.2472 0.2478 0.2474 0.248
Country/area Weighted Ave. -.1740 -.1152 -.1433338 -.1182 -.1106 -.0793(0.0028)∗∗∗ (0.0034)∗∗∗ (0.0032)∗∗∗ (0.0034)∗∗∗ (0.0075)∗∗∗ (0.0076)∗∗∗
Note: Robust standard errors are in parenthesis. *, ** and *** denote significance at 10%, 5% and 1% levels respectively.The omitted category in the groups of location of study is “Canada”. The mother tongue fixed effects incorporates a dummyfor English mother tongue and a dummy for French Mother tongue. The omitted categories in the CMA and Province fixedeffects are Toronto and Ontario, respectively. The omitted category for country/area of origin fixed effect is “Canada”.
44

Table 26: Friedberg: Immigrant Wage Gap by Country of Origin - Educational Group Dummies
(1) (2) (3) (4) (5) (6)
Below Bachelor 0.1452 0.1448 0.1489 0.1467 0.1457 0.1453(0.0014)∗∗∗ (0.0014)∗∗∗ (0.0014)∗∗∗ (0.0015)∗∗∗ (0.0014)∗∗∗ (0.0015)∗∗∗
Bachelor 0.4108 0.4103 0.4204 0.4179 0.4158 0.4153(0.0017)∗∗∗ (0.0017)∗∗∗ (0.0017)∗∗∗ (0.0017)∗∗∗ (0.0017)∗∗∗ (0.0017)∗∗∗
Above Bachelor 0.5535 0.553 0.5617 0.5595 0.5578 0.5576(0.0022)∗∗∗ (0.0022)∗∗∗ (0.0023)∗∗∗ (0.0023)∗∗∗ (0.0023)∗∗∗ (0.0023)∗∗∗
Friedberg: Below Bachelor - FOR -.0663 -.0353 -.0252 -.0187(0.0046)∗∗∗ (0.0058)∗∗∗ (0.0052)∗∗∗ (0.0059)∗∗∗
Friedberg: Bachelor - FOR -.1460 -.1091 -.0807 -.0706(0.0056)∗∗∗ (0.0067)∗∗∗ (0.0063)∗∗∗ (0.0069)∗∗∗
Friedberg: Above Bachelor - FOR -.1209 -.0863 -.0781 -.0693(0.0068)∗∗∗ (0.0078)∗∗∗ (0.0073)∗∗∗ (0.0081)∗∗∗
Work Exp. 0.0526 0.0528 0.0528 0.0528(0.0002)∗∗∗ (0.0002)∗∗∗ (0.0002)∗∗∗ (0.0002)∗∗∗
Work Exp. Square (/100) -.0898 -.0900 -.0900 -.0902(0.0005)∗∗∗ (0.0005)∗∗∗ (0.0005)∗∗∗ (0.0005)∗∗∗
Friedberg: Work Exp. - CAN 0.053 0.053(0.0002)∗∗∗ (0.0002)∗∗∗
Friedberg: Work Exp. Square (/100) - CAN -.0918 -.0918(0.0005)∗∗∗ (0.0005)∗∗∗
Friedberg: Work Exp. - FOR 0.0008 0.0026(0.0024) (0.0027)
Friedberg: Work Exp. Square (/100) - FOR 0.019 0.0073(0.0282) (0.0299)
Gender 0.287 0.2868 0.2874 0.2872 0.2874 0.2873(0.0011)∗∗∗ (0.0011)∗∗∗ (0.0011)∗∗∗ (0.0011)∗∗∗ (0.0011)∗∗∗ (0.0011)∗∗∗
Eng. or Fren. Mother Tongue Yes Yes Yes Yes Yes YesCMA/Province F.E. (Ontario - Toronto) Yes Yes Yes Yes Yes YesCountry/area of Orig. F.E. Yes Yes Yes Yes Yes YesFriedberg: Group Loc. of study F.E. No Yes No Yes No Yes
Obs. 6323125 6323125 6323125 6323125 6323125 6323125R2 0.2455 0.2461 0.2462 0.2464 0.2469 0.247
Country/area Weighted Ave. -.1540 -.0747 -.0917 -.0740 -.0753 -.0730(0.0026)∗∗∗ (0.0043)∗∗∗ (0.0035)∗∗∗ (0.0043)∗∗∗ (0.0038)∗∗∗ (0.0043)∗∗∗
Note: Robust standard errors are in parenthesis. *, ** and *** denote significance at 10%, 5% and 1% levels respectively. Theomitted category in the groups of location of study is “Canada”. The mother tongue fixed effects incorporates a dummy forEnglish mother tongue and a dummy for French Mother tongue. The omitted categories in the CMA and Province fixed effectsare Toronto and Ontario, respectively. The omitted category for country/area of origin fixed effect is “Canada”.
45

Table 27: Friedberg: Immigrant Wage Gap by Country of Origin - Educational Group Dummies (Immigrantsbetween 20 and 29)
(1) (2) (3) (4) (5) (6)
Below Bachelor 0.1457 0.1457 0.148 0.1471 0.1459 0.1457(0.0014)∗∗∗ (0.0014)∗∗∗ (0.0015)∗∗∗ (0.0015)∗∗∗ (0.0015)∗∗∗ (0.0015)∗∗∗
Bachelor 0.4112 0.4105 0.419 0.4177 0.4154 0.415(0.0017)∗∗∗ (0.0017)∗∗∗ (0.0017)∗∗∗ (0.0017)∗∗∗ (0.0017)∗∗∗ (0.0017)∗∗∗
Above Bachelor 0.5548 0.553 0.5607 0.559 0.5574 0.5571(0.0022)∗∗∗ (0.0022)∗∗∗ (0.0023)∗∗∗ (0.0023)∗∗∗ (0.0023)∗∗∗ (0.0023)∗∗∗
Friedberg: Below Bachelor - FOR -.0470 -.0327 -.0231 -.0189(0.0056)∗∗∗ (0.006)∗∗∗ (0.0056)∗∗∗ (0.0061)∗∗∗
Friedberg: Bachelor - FOR -.1220 -.1056 -.0758 -.0708(0.0065)∗∗∗ (0.0069)∗∗∗ (0.0067)∗∗∗ (0.0071)∗∗∗
Friedberg: Above Bachelor - FOR -.0978 -.0815 -.0735 -.0683(0.0075)∗∗∗ (0.0079)∗∗∗ (0.0078)∗∗∗ (0.0083)∗∗∗
Work Exp. 0.0527 0.0528 0.0528 0.0528(0.0002)∗∗∗ (0.0002)∗∗∗ (0.0002)∗∗∗ (0.0002)∗∗∗
Work Exp. Square (/100) -.0900 -.0900 -.0901 -.0901(0.0005)∗∗∗ (0.0005)∗∗∗ (0.0005)∗∗∗ (0.0005)∗∗∗
Friedberg: Work Exp. - CAN 0.053 0.053(0.0002)∗∗∗ (0.0002)∗∗∗
Friedberg: Work Exp. Square (/100) - CAN -.0918 -.0918(0.0005)∗∗∗ (0.0005)∗∗∗
Friedberg: Work Exp. - FOR 0.0012 0.0028(0.0026) (0.0028)
Friedberg: Work Exp. Square (/100) - FOR 0.0166 0.0047(0.0294) (0.0305)
Gender 0.2885 0.2884 0.2888 0.2887 0.2888 0.2888(0.0011)∗∗∗ (0.0011)∗∗∗ (0.0011)∗∗∗ (0.0011)∗∗∗ (0.0011)∗∗∗ (0.0011)∗∗∗
Eng. or Fren. Mother Tongue Yes Yes Yes Yes Yes YesCMA/Province F.E. (Ontario - Toronto) Yes Yes Yes Yes Yes YesCountry/area of Orig. F.E. Yes Yes Yes Yes Yes YesFriedberg: Group Loc. of study F.E. No Yes No Yes No Yes
Obs. 6193890 6193890 6193890 6193890 6193890 6193890R2 0.2467 0.2468 0.247 0.2471 0.2476 0.2477
Country/area Weighted Ave. -.1740 -.0659 -.1129 -.0685 -.0803 -.0661(0.0028)∗∗∗ (0.0094)∗∗∗ (0.0047)∗∗∗ (0.0094)∗∗∗ (0.0060)∗∗∗ (0.0094)∗∗∗
Note: Robust standard errors are in parenthesis. *, ** and *** denote significance at 10%, 5% and 1% levels respectively. Theomitted category in the groups of location of study is “Canada”. The mother tongue fixed effects incorporates a dummy forEnglish mother tongue and a dummy for French Mother tongue. The omitted categories in the CMA and Province fixed effectsare Toronto and Ontario, respectively. The omitted category for country/area of origin fixed effect is “Canada”.
46

Table 28: Exploring the Effect of Field of Study
(1) (2) (3) (4) (5) (6)
Immigrant -.1379 -.1533 -.0846 -.0969 -.0756 -.0888(0.0025)∗∗∗ (0.0025)∗∗∗ (0.0041)∗∗∗ (0.0041)∗∗∗ (0.0041)∗∗∗ (0.0041)∗∗∗
Below Bachelor 0.1451 0.1682 0.1449 0.1678 0.146 0.168(0.0014)∗∗∗ (0.0015)∗∗∗ (0.0014)∗∗∗ (0.0015)∗∗∗ (0.0014)∗∗∗ (0.0015)∗∗∗
Bachelor 0.4097 0.4702 0.4111 0.4721 0.4185 0.481(0.0017)∗∗∗ (0.0019)∗∗∗ (0.0017)∗∗∗ (0.0019)∗∗∗ (0.0017)∗∗∗ (0.002)∗∗∗
Above Bachelor 0.5527 0.613 0.5542 0.6153 0.5627 0.6239(0.0022)∗∗∗ (0.0024)∗∗∗ (0.0022)∗∗∗ (0.0024)∗∗∗ (0.0023)∗∗∗ (0.0025)∗∗∗
Below Bachelor - FOR -.0376 -.0176(0.005)∗∗∗ (0.005)∗∗∗
Bachelor - FOR -.1171 -.1302(0.0054)∗∗∗ (0.0053)∗∗∗
Above Bachelor - FOR -.0770 -.0738(0.0056)∗∗∗ (0.0055)∗∗∗
Work Exp. 0.0524 0.0518(0.0002)∗∗∗ (0.0002)∗∗∗
Work Exp. Square (/100) -.0885 -.0876(0.0005)∗∗∗ (0.0005)∗∗∗
Work Exp. - CAN 0.0528 0.0524 0.0526 0.0522(0.0002)∗∗∗ (0.0002)∗∗∗ (0.0002)∗∗∗ (0.0002)∗∗∗
Work Exp. Square (/100) - CAN -.0912 -.0906 -.0908 -.0901(0.0005)∗∗∗ (0.0005)∗∗∗ (0.0005)∗∗∗ (0.0005)∗∗∗
Work Exp. - FOR -.0056 -.0088 0.006 0.0024(0.0019)∗∗∗ (0.0019)∗∗∗ (0.002)∗∗∗ (0.0019)
Work Exp. Square (/100) - FOR 0.1309 0.1646 0.0069 0.0421(0.0198)∗∗∗ (0.0196)∗∗∗ (0.0204) (0.0202)∗∗
Gender 0.2871 0.2374 0.2873 0.2372 0.2877 0.2372(0.0011)∗∗∗ (0.0014)∗∗∗ (0.0011)∗∗∗ (0.0014)∗∗∗ (0.0011)∗∗∗ (0.0014)∗∗∗
Mother Tongue - ENG 0.0787 0.0858 0.0676 0.0749 0.0646 0.0718(0.0023)∗∗∗ (0.0023)∗∗∗ (0.0023)∗∗∗ (0.0023)∗∗∗ (0.0023)∗∗∗ (0.0023)∗∗∗
Mother Tongue - FREN 0.0963 0.0985 0.0866 0.0889 0.0842 0.0864(0.0029)∗∗∗ (0.0029)∗∗∗ (0.0029)∗∗∗ (0.0029)∗∗∗ (0.0029)∗∗∗ (0.0029)∗∗∗
Prov + CMA Fixed Effects Yes Yes Yes Yes Yes Yes
Country/area Fixed Effects No No No No No No
Field of Study Fixed Effects No Yes No Yes No Yes
Obs. 6323125 6323125 6323125 6323125 6323125 6323125R2 0.2434 0.2599 0.2448 0.2615 0.2454 0.2622
Note: Robust standard errors are in parenthesis. *, ** and *** denote significance at 10%, 5% and 1% levels respectively.The omitted categories in the CMA and Province fixed effects are Toronto and Ontario, respectively. The omittedcategory for country/area of origin fixed effect is “Canada”. The base case for the field of study fixed effects is“Humanities and Visual Arts”.
47

Table 29: Interacting Field of Study with Location of Study Groups
(1) (2) (3) (4) (5) (6)
Immigrant
Below Bachelor 0.145 0.1675 0.1452 0.1678 0.1674 0.1674(0.0014)∗∗∗ (0.0015)∗∗∗ (0.0014)∗∗∗ (0.0015)∗∗∗ (0.0015)∗∗∗ (0.0015)∗∗∗
Bachelor 0.4116 0.4729 0.4133 0.4743 0.4736 0.4736(0.0017)∗∗∗ (0.0019)∗∗∗ (0.0017)∗∗∗ (0.0019)∗∗∗ (0.002)∗∗∗ (0.002)∗∗∗
Above Bachelor 0.5538 0.6149 0.5544 0.6146 0.614 0.6138(0.0022)∗∗∗ (0.0024)∗∗∗ (0.0022)∗∗∗ (0.0025)∗∗∗ (0.0025)∗∗∗ (0.0025)∗∗∗
Work Exp. - CAN 0.0527 0.0523 0.0526 0.0522 0.0522 0.0521(0.0002)∗∗∗ (0.0002)∗∗∗ (0.0002)∗∗∗ (0.0002)∗∗∗ (0.0002)∗∗∗ (0.0002)∗∗∗
Work Exp. Square (/100) - CAN -.0914 -.0907 -.0911 -.0905 -.0905 -.0905(0.0005)∗∗∗ (0.0005)∗∗∗ (0.0005)∗∗∗ (0.0005)∗∗∗ (0.0005)∗∗∗ (0.0005)∗∗∗
Work Exp. - FOR -.0059 -.0088 0.0105 0.0064 0.0069 0.0072(0.0019)∗∗∗ (0.0019)∗∗∗ (0.002)∗∗∗ (0.002)∗∗∗ (0.002)∗∗∗ (0.002)∗∗∗
Work Exp. Square (/100) - FOR 0.1316 0.1644 -.0245 0.0198 0.014 0.0122(0.0198)∗∗∗ (0.0196)∗∗∗ (0.0204) (0.0203) (0.0203) (0.0203)
Gender 0.2871 0.2371 0.2869 0.2367 0.2364 0.2364(0.0011)∗∗∗ (0.0014)∗∗∗ (0.0011)∗∗∗ (0.0014)∗∗∗ (0.0014)∗∗∗ (0.0014)∗∗∗
Mother Tongue - ENG 0.0521 0.0551 0.0496 0.0528 0.0529 0.0512(0.0025)∗∗∗ (0.0025)∗∗∗ (0.0025)∗∗∗ (0.0025)∗∗∗ (0.0025)∗∗∗ (0.0025)∗∗∗
Mother Tongue - FREN 0.073 0.0716 0.071 0.0697 0.0696 0.0678(0.003)∗∗∗ (0.003)∗∗∗ (0.003)∗∗∗ (0.003)∗∗∗ (0.003)∗∗∗ (0.003)∗∗∗
Prov + CMA Fixed Effects Yes Yes Yes Yes Yes Yes
Country/area Fixed Effects Yes Yes Yes Yes Yes No
Adding African countries F.E. No No No No No Yes
GROUP Location of Study No No Yes Yes No No
Field of Study Fixed Effects No Yes No Yes Yes Yes
Interaction: Group Location & Field No No No No Yes Yes
Obs. 6323125 6323125 6323125 6323125 6323125 6323125R2 0.2462 0.2631 0.2471 0.2639 0.2645 0.2646
Note: Robust standard errors are in parenthesis. *, ** and *** denote significance at 10%, 5% and 1% levels respectively. The omittedcategories in the CMA and Province fixed effects are Toronto and Ontario, respectively. The omitted category in the groups of location ofstudy is “Canada”. The omitted category for country/area of origin fixed effect is “Eastern Europe”. The base case for the field of studyfixed effects is “Humanities and Visual Arts”. The interactions are between the groups of locations of study (excluding Canada) and theeleven fields of study (excluding “Humanities and Visual Arts”).
48

Figure 1: Location of Study Fixed Effects Table 10 Column 2
49

Figure 2: Location of Study Fixed Effects - Table 10 Columns 2,4 and 6
50

Figure 3: Country of Origin Fixed Effects Table 21 Columns 1 and 2
51

Figure 4: Country of Origin Fixed Effects Table 21 adding groups of location of study Fixed Effects
52

Figure 5: Country of Origin Fixed Effects Table 23
53

Figure 6: Country of Origin Fixed Effects Table 24
54

Figure 7: Country of Origin Fixed Effects Table 25 - Immigrants between 20 and 29
55

Figure 8: Friedberg: Country of Origin Fixed Effects Table 26
56

Figure 9: Friedberg: Country of Origin Fixed Effects Table 27 - Immigrants between 20 and 29
57

Figure 10: Share of Immigrants with a Canadian degree by age at immigration
58

Figure 11: Field of Study Fixed Effects Table 28
59
Figure 12: Location of Study table 29
60

Figure 13: Interaction: Location + Field of Study Table 29 - Part 1
61

Figure 14: Interaction: Location + Field of Study Table 29- Part 2
62

A Minimum Hourly Wage by Province
Province Minimum Wage Effective Date
Alberta 7.00 September 2005British Columbia 8.00 November 2001Manitoba 7.25 April 2005New Brunswick 6.30 January 2005Newfoundland and labrador 6.25 June 2005Northwest Territories 8.25 December 2003Nova Scotia 6.80 October 2005Nunavut 8.50 March 2003Ontario 7.45 February 2005Prince Edward Island 6.80 January 2005Quebec 7.60 May 2005Saskatchewan 7.05 September 2005Yukon 7.20 October 1998

B Sample Restrictions
Major Restrictions1 Age between 20 and 64 years old2 Education level higher than high school3 Wage income for 2005 higher than zero but lower than 88888884 Number of weeks worked in 2005 higher (or equal) than one and smaller
than 525 Full-time workers only6 No non-permanent residents7 Immigrants age at arrival has to be between 15 and 29 years old.8 Weekly wage higher than 15 times the provincial minimum hourly wage.
Secondary Restrictions9 Canadian-born should have missing values for ”age at immigration”10 Location of study clearly identified (drop if location of study=”Outside
Canada”or ”Distance learning”)
11 Country of origin clearly specified (drop if country of origin = ”Other’)12 Drop if years of education plus 6 is greater than age13 Drop if years of education plus 6 is greater than age at arrival for immi-
grants withtheir highest degree obtained abroad
Inconsistencies Checks
14 Drop observations if logarithm of the weekly wages is less or equal tozero
15 Year of immigration must be a non-missing value for immigrants

C Years of Education by Highest Degree Attained
Highest Degree Achieved Years of Education Assigned
Other trades certificate or diploma 13Registered apprenticeship certificate 13College, CEGEP or other non-university certificate (3 to 12months)
13
College, CEGEP or other non-university certificate (13 to24 months)
14
College, CEGEP or other non-university certificate (morethan 2 years)
14
University certificate or diploma below bachelor level 15Bachelor’s degree 16University certificate or diploma above bachelor level 17Degree in medicine, dentistry, veterinary or optometry 18Master’s Degree 18Earned doctorate degree 21

D Region of Origin and Location of Study
Location of Study Country of Origin Groupings Location of Study
1 Canada 1 Canada 1 Canada2 USA 2 US 2 US, UK, France, Oceania and rest of Europe3 South America 3 Jamaica 3 East Europe, Romania and Poland4 Rest of America 4 South America 4 West and Central Asia and China5 UK 5 Rest of America 5 India, Pakistan and the rest of Asia6 France 6 UK 6 South America and the rest of America7 Poland 7 France 7 Philippines and South-East Asia8 Romania 8 Poland 8 Africa9 East Europe 9 Romania10 Rest Europe 10 East Europe11 Africa 11 Rest Europe12 Western and Central Asia 12 Africa13 China 13 Western and Central Asia14 Phillipines 14 China15 India 15 Hong Kong16 Pakistan 16 Phillipines17 South East Asia 17 Vietnam18 Rest Asia 18 India19 Oceania 19 Pakistan
20 South East Asia21 Rest Asia22 Oceania

E Fields of Study
We combine the thirteen categories specified by the Classification of Instructional Programs (CIP - Canada2000) into eleven more homogenous groups. The biggest changes were the reordering of programs related tothree CIP categories: “Business, Management and Public Administration”, “Architecture, Engineering, andRelated Technologies” and “Health, Parks, Recreation and Fitness”.
We divide “Business, Management and Public Administration” into two groups. One related to manage-ment and the other one related to accounting and business support. With the “Architecture, Engineering,and Related Technologies” category we separate the core programs related to architecture and engineeringfrom programs related to construction trades and mechanic and repair technologies. Finally, we split theprograms of the “Health, Parks, Recreation and Fitness” category into three groups. One group related tohealth practitioners, one related to health assistance and one related to other fields.
67

Field of Study Classification of Instructional Programs (CIP)
Education 13 Education
Humanities & Visualand Performing Arts
16 Aboriginal and Foreing Languages, Literatures and Linguistics23 English Language and Literature/Letters24 Liberal Arts and Sciences, General Studies and Humanities
30.13 Medieval and Renaissance Studies30.21 Holocaust and Related Studies30.22 Classical and Ancient Studies
38 Philosophy and Religious Studies39 Theology and Religious Vocations50 Visual and Performing Arts54 History55 French Language and Literature/Letters
Social and BehaviouralSciences and Law
5 Area, Ethnic, Cultural and Gender Studies9 Communication, Journalism and Related Programs19 Family and Consumer Sciences/Human Sciences22 Legal Professions and Studies
30.05 Peace Studies and Conflict Resolution30.1 Biopsychology30.11 Gerontology30.12 Historic Preservation and Conservation30.14 Museology/Museum Studies30.15 Science, Technology and Society30.17 Behavioural Sciences30.2 International/Global Studies30.23 Intercultural/Multicultural and Diversity Studies30.25 Cognitive Science30.99 Multidisciplinary/Interdisciplinary Studies, Other
42 Psychology45 Social Sciences
Business, Finance andMarketing
52.01 Business/Commerce, General52.02 Business Administration, Managment and Operations52.05 Business/Corporate Communications52.06 Business/Managerial Economics52.08 Finance and Financial Management Services52.09 Hospitality Administration/Management52.1 Human Resources Management and Services52.11 International Business/Trade/Commerce52.12 Management Information Systems and Services52.13 Management Sciences and Quantitative Methods52.14 Marketing52.15 Real Estate52.16 Taxation52.17 Insurance52.2 Construction Management
68

Field of Study Classification of Instructional Programs (CIP)
Small Businesses, Ac-counting, and BusinessSupport
30.16 Accounting and Computer Science52.03 Accounting and Related Services52.04 Business Operations Support and Assistant Services52.07 Entrepreneurial and Small Business Operations52.18 General Sales, Merchandising and Related Marketing Operations52.19 Specialized Sales, Merchandising and Marketing Operations52.99 Business, Management, Marketing and Related Support Services, Other
Computer Sciences,Mathematics, PhysicalSciences & SciencesTechnologies
11 Computer and Information Sciences and Support Services27 Mathematics and Statistics40 Physical Sciences41 Science Technologies/Technicians
Architecture, Engi-neering & EngineeringTechnician
4 Architecture and Related Services14 Engineering15 Engineering Technologies/Technicians
Construction trade,Mechanics and Wood-work
46 Construction Trades47 Mechanic and Repair Technologies/Technicians48 Precision Production
Health Practitioners
26 Biological and Biomedical Sciences30.01 Biological and Physical Sciences30.18 Natural Sciences30.19 Nutrition Sciences30.24 Neuroscience
51 Health Services/Allied Health/Health Sciences, General51.02 Communication Disorders Sciences and Services51.04 Dentistry (DDS, DMD)51.05 Advanced/Graduate Dentistry and Oral Sciences (Cert., MSc, PhD)51.12 Medicine (MD)51.14 Medical Scientist (MSc, PhD)51.15 Mental and Social Health Services and Allied Professions51.17 Optometry (OD)51.2 Pharmacy, Pharmaceutical Sciences and Administration51.21 Podiatric Medicine/Podiatry (DPM)51.22 Public Health51.24 Veterinary Medicine (DVM)51.25 Veterinary Biomedical and Clinical Sciences (Cert., MSc, PhD)51.31 Dietetics and Clinical Nutrition Services51.32 Bioethics/Medical Ethics
60 Dental, Medical and Veterinary Residency Programs
69

Field of Study Classification of Instructional Programs (CIP)
Health Assistance
51.01 Chiropractic (DC)51.06 Dental Support Services and Allied Professions51.07 Health and Medical Administrative Services51.08 Allied Health and Medical Assisting Services51.09 Allied Health Diagnostics, Intervention and Treatment Professions51.1 Clinical/Medical Laboratory Science and Allied Professions51.11 Health/Medical Preparatory Programs51.16 Nursing51.18 Ophtalmic and Optometric Support Services and Allied Professions51.19 Osteopathic Medicine/Osteopathy (DO)51.23 Rehabilitation and Therapeutic Professions51.26 Health Aides/Attendants/Orderlies51.27 Medical Illustration and Informatics51.33 Alternative and Complementary Medicine and Medical Systems51.34 Alternative and Complementary Medical Support Services51.35 Somatic Bodywork and Related Therapeutic Services51.36 Movement and Mind-Body Therapies51.37 Energy-based and Biologically-based Therapies51.99 Health Professions and Related Clinical Sciences, Other
Others
1 Agriculture, Agriculture Operations and Related Sciences3 Natural Resources and Conservation10 Communications Technologies/Technicians and Support Services12 Personal and Culinary Services28 Reserve Entry Scheme for Officers in the Armed Forces29 Military Technologies31 Parks, Recreation, Leisure and Fitness Studies44 Public Administration and Social Service Professions49 Transportation and Materials Moving
70