forest health aerial survey report 2013 - new york state ... · forest health aerial survey report...
TRANSCRIPT

NYSDEC Forest Health Aerial Survey Report 2013
1
Summary The 2010 Forest Health Aerial Survey Report is a descriptive report for the aerial observations from the 2010 genera
Summary - 2012 Forest Health Aerial Survey
A total of approximately 19.2 million acres of New York State was surveyed by aircraft between June 6th and August 17th, and approximately 708,000 acres of forest damage was detected.

NYSDEC Forest Health Aerial Survey Report 2013
2
Summary – 2013 Forest Health Aerial Survey New York State was surveyed by aircraft between June 4th and August 28th. The survey covered 15 million acres of which 407,000 acres of forest damage was detected and recorded.
Gypsy moth caterpillar (GMC) was the most significant damage causal agent (DCA) from the 2013 survey season, with associated forest damage totaling 166,000 acres. The most severe of this defoliation was observed in southern Cattaraugus and western Allegany counties, totaling 160,000 acres. The remaining locations of GMC defoliation were observed in Sullivan and Suffolk counties, 6,000 acres and 75 acres, respectively. This year showed a significant rise in GMC populations, an increase of 150,000 acres of damage from the previous year.
Frost defoliation, another significant DCA for 2013, was observed in the Catskill Region and Southern Tier, totaling 78,000 acres and 3,000 acres, respectively.
Mild foliage discoloration was observed in St. Lawrence, Lewis, Hamilton and Warren counties, totaling 102,000 acres. Discoloration resulted from a combination of increased precipitation, poorly drained soils, and water intolerant species.
Mortality associated with subsequent years of forest tent caterpillar (FTC) defoliation was observed in Delaware, Madison, Chenango and Steuben counties, totaling approximately 2,000 acres. New York State’s FTC population remained small this year, with no new outbreaks to be reported. Scotch pine and red pine decline was observed in plantations in Lewis and Oneida counties, totaling 2,500 acres. The primary factors leading to initial decline can be attributed to old age, thin soils, and poor management. Secondary damage caused by opportunistic pests and diseases, including bark beetles, pitch moth, root/stem rot, and diplodia tip blight, was also observed. Due to these factors and associated stress response, mortality is anticipated. The standardized precipitation index illustrates wetter than normal conditions for New York State between June and August, 2013 (Figure 1). This increase in moisture accounted for high water damage observed in 28 of the 40 counties surveyed, totaling 17,000 acres. Damaged areas appeared as discolored foliage or mortality in small pockets along perimeters of wetlands and drainage areas. Geographic regions affected by inundation in 2013 include the Finger Lakes Region, Southern Tier, Central Region, and the North Country.
Saltwater injury was observed in coastal residential neighborhoods and stream inlets throughout Suffolk County, totaling 157 acres.
Other DCAs can be referenced in appendix.
The SPI compares the actual cumulative precipitation from a 6-month time period to the mean precipitation for that time period. The mean precipitation is calculated using data gathered 1951 to present. A negative SPI indicates a drought is occurring, an SPI of 0 indicates average precipitation, and a positive SPI indicates wetter than normal conditions. The more negative or positive the SPI, the more severe the condition (National Oceanic and Atmospheric Administration).
Figure 1. Standard Precipitation Index June – August 2013. National Oceanic and Atmospheric Administration.

NYSDEC Forest Health Aerial Survey Report 2013
3
Introduction
New York State aerial surveys are flown in cooperation with USDA Forest Service and their national forest health aerial survey agenda. The principal objectives are the acquisition of general forest health conditions for management and monitoring statewide, as well as tracking causal agents on a national scale. The aerial survey identifies possible threats to forest health over large areas, and in a short period of time. The resulting data should be viewed as a general overview of forest health conditions.
Methods Mission Planning Factors considered during mission planning include insect and host phenology, event-specific phenomenon, altitude and visibility restrictions, office and airport locations, regional boundary divisions, and airspace restrictions. Phenology
A delay of four to eight weeks from initial leaf-out allows for maximum leaf flush and provides early season DCAs sufficient time to cause damage observable from the aircraft. DCAs appearing mid or late season are detected during the course of surveys, no delay is required.
Latitude and Elevation Differences
Flight lines are flown in an east to west pattern beginning in Newburgh the first or second week of June and are planned for completion in Plattsburgh by the second or third week of August. General bioclimatic effects are considered along with associated growing degree days (GDD), indicating the beginning of flights in southern latitudes and lower elevations first, which allows for variations in GDD and subsequent phenological differences (Figure 2). The flights are normally planned to begin in southern New York, and move north toward Albany. The survey is then flown in the Southern Tier and shifted north and west toward Lake Ontario and Buffalo, respectively. The higher elevations of the Adirondacks and higher latitudes of Franklin and Clinton counties are surveyed last (Figure 3).
Event –Specific Phenomenon
In cases where factors are not known until they occur, such as tornados and frost damage, or unpredicted changes in insect populations, the survey schedule is adjusted to capture the greatest amount of damage.
Figure 3. Aerial Flight Lines.
Other Flight Restrictions
The surveys are flown at approximately 1,000ft AGL and visibility ranges from two to six miles. The flight line is spaced at eight mile intervals (Figure 3) and the flown/not-flown area is based on an average visibility distance of four miles. It can be seen that blocks of the state were not flown, which can be attributed to the loss of a biological window due to weather or other airspace restrictions (Figure 4).
Figure 2. Growing Degree Days Accumulation. Cornell University Atmospheric Sciences and Turf Team 2009.

NYSDEC Forest Health Aerial Survey Report 2013
4
Figure 4. Flown/Not Flown.
Aircraft/Equipment Aerial survey missions are flown using either a Cessna 172, 182, 206 or Partenavia P-68 Observer. Aircraft choice is determined by pilot qualifications, aircraft capabilities and terrain type. The aerial sketch-mapper uses a GPS (Global Positioning System) receiver integrated laptop, equipped with a touch screen and loaded with DOQQ (digital orthographic quarter quadrangle) base-map layer for reference within a GIS (Geographic Information System) environment. Forest areas with visible damage are recorded on the laptop device and stored in memory. Post-Processing The data is later reviewed and the polygons are altered in the lab using heads-up digitizing techniques based on 1:24,000 DOQQs. The polygons are then distributed to region foresters and DEC Forest Health ground crews for management, monitoring, ground verification and further causal agent detail categorization. During the process of data collection many of the polygons created during the flight are adjusted for forest area delineation accuracy. In many instances the areas of forest damage are widespread, and across a heterogeneous landscape. Due to aerial time constraints and the severity of damage in certain regions, a geographically significant part of the landscape is included (lumped) within the sketched polygons during flight.
Because non-forest land cover types cannot be included in damage area calculations, they are removed in the lab (Figure5).
In previous years, the data was modified using a classification based on Landsat TM satellite data. This process removed non-forest areas that were included in the initial polygon creation but did not allow for human interpretation, which degraded the accuracy of these edits. It has proven to be more effective to eliminate non-forest areas by human made edit decisions using heads up digitalizing techniques. The editing process involves layering a base map 1:24,000 DOQQ with the forest damage polygon data and systematically rearranging and removing portions of the polygon to best fit the underlying base map layer. This technique is more time consuming but yields a more accurate representation.
Figure 5. Removed Non-Forest Areas.
Adjusted Non-Forest Type Removed
Unadjusted Data

NYSDEC Forest Health Aerial Survey Report 2013
5
Causal Agent Categorization/Ground Verification The original aerial sketched polygons created from the aircraft are divided into three broad categories, mortality, defoliation and discoloration. These polygons are then given to the ground crews for further categorization. Due to the high volume of data collected and the window period for ground verification, a limited percentage of actual polygons are visited. For those polygons visited further categorization is applied (Appendix, Table 3). New Technologies Aerial detection surveys (ADS) are beginning to incorporate satellite images as part of the forest health pre-evaluation and pre-detection process. This incorporation intends to improve ADS safety, resource allocation and increase detection sensitivity. The forest disturbance mapper (FDM), created by the Forest Health Technology Enterprise Team (FHTET), is a computer model based on 240 meter MODIS satellite data. The model works in a couple of ways. First, the model looks at the history of forest health through foliage reflection values, which are averaged over a 3 to 5 year period. This average value is then compared to the present value to see if a change occurred. If a change occurred it is recorded as a disturbance. Second, if this disturbance is seen for multiple weeks, the forest disturbance is seen as having greater persistence. Generally speaking, if an area shows a deviation from past reflectance values (disturbance) for several weeks or more (persistence), there is probably a damage causal agent present. The aerial sketchmapper then augments the mission planning process by targeting areas of known disturbance and persistence. This eliminates time spent surveying areas of healthy forests and frees up resources for areas where survey is most needed. USFS FDM website: http://foresthealth.fs.usda.gov/portal/Flex/FDM?dL=0
Acknowledgements: NYSDEC Region Staff NYS Police Aviation Unit Division of Lands and Forests - Forest Health Unit USDA Forest Service
For more information contact: Division of Lands and Forests Forest Health Section
625 Broadway, 5th Floor
Albany, NY 12233-4253
518-402-9425
NYSDEC Forest Health Aerial Survey Report 2013
6
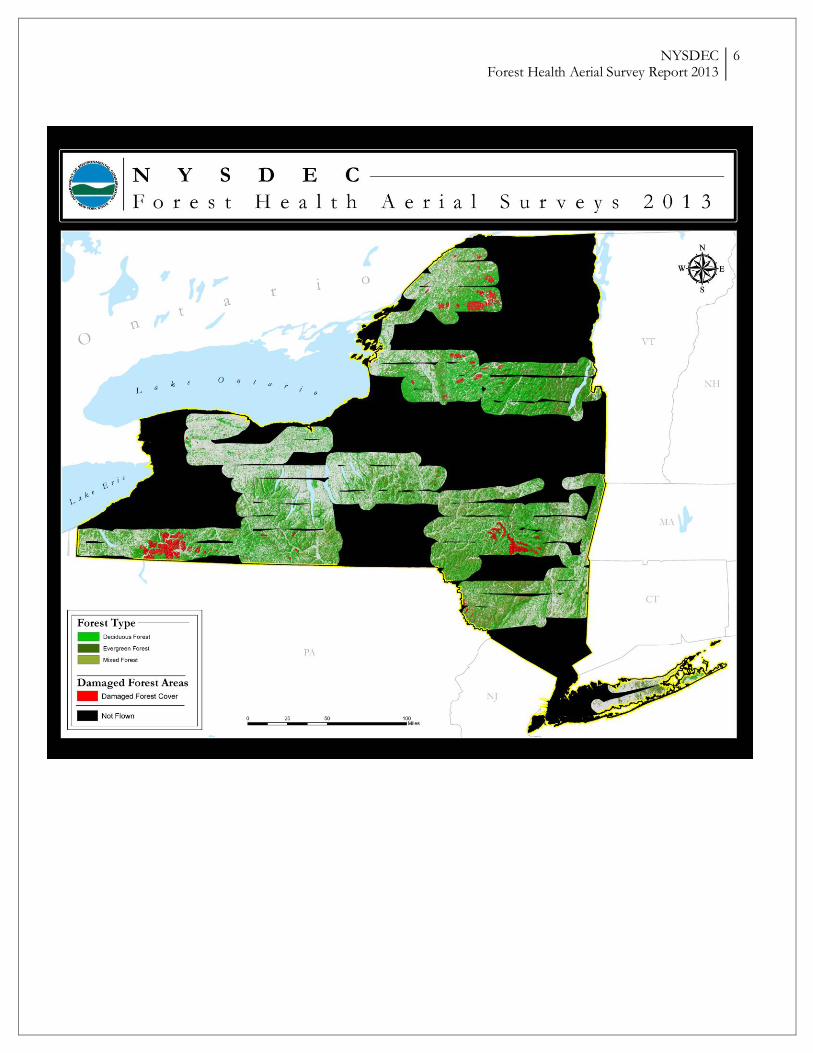
New York State Aerial Surveys 2012

NYSDEC Forest Health Aerial Survey Report 2013
7
R1 R3 R4 R5 R6 R7 R8 R9 Total Damage Causal Agent (DCA)
Bark Beetles
9
2,159 24 87
2,280
Black Turpentine Beetle 64
64
Gypsy Moth 76 2,726
160,781 163,582
Eastern Tent Caterpillar
267
267
Forest Tent Caterpillar
306
1,025 994
2,325
Locust Leafminer
676
676
Unknown Defoliator
77 135
7,759
7,971
Western Larch Woolly Aphid
13
13
Balsam Woolly Adelgid
11
11
Hemlock Woolly Adelgid
1,210
1,210 Boring Insects
7
7
Emerald Ash Borer*
94
94
Armillaria Root Disease
501
501
Stem Decays/Cankers
788
0
788
Black Knot of Cherry 185
185
Beech Bark Disease
101
101
Vine Damage 185
185
Decline Complexes/Dieback 9
2,104 10 70 9 2,201
Ash Decline/Yellows
75 122 5 493 695
Decline 19 9 2
173 96 634
934
Dutch Elm Disease
581 68
649 Foliage and Shoot Diseases
39
39
Needlecast
11
11
Anthracnose 6
6
Lophodermium
2
2
Rhizosphaera Needle Cast
21
21
Diplodia Canker
63
3
66
Fire 15 10
25
American Beaver
436
436
Abiotic
8,337 97,017 830 4,286
110,470
Drought
5
5
Flooding-High Water 275 82 193 806 8,487 550 5,561 873 16,827 Frost
6,797 71,894
133 3,089
81,914
Hail
652 2,884
3,535
Snow -Ice
7
7
Wind-Tornado/Hurricane 24 1,500 195
163 5 8 1,894
Saltwater Injury 158
158
Human Activities
14
44
58
Logging Damage
77
4,560 193
4,831
Soil Compaction
0
0
Unknown 1 812 203 347 361 98 624 12 2,457 Total 1,016 14,552 76,501 10,278 124,145 3,376 15,456 162,176 407,500
Appendix
Table1. DCA per Region (acres)
Total polygon area was split between DCAs when multiple causal agents were present.
NYSDEC Forest Health Aerial Survey Report 2013
8
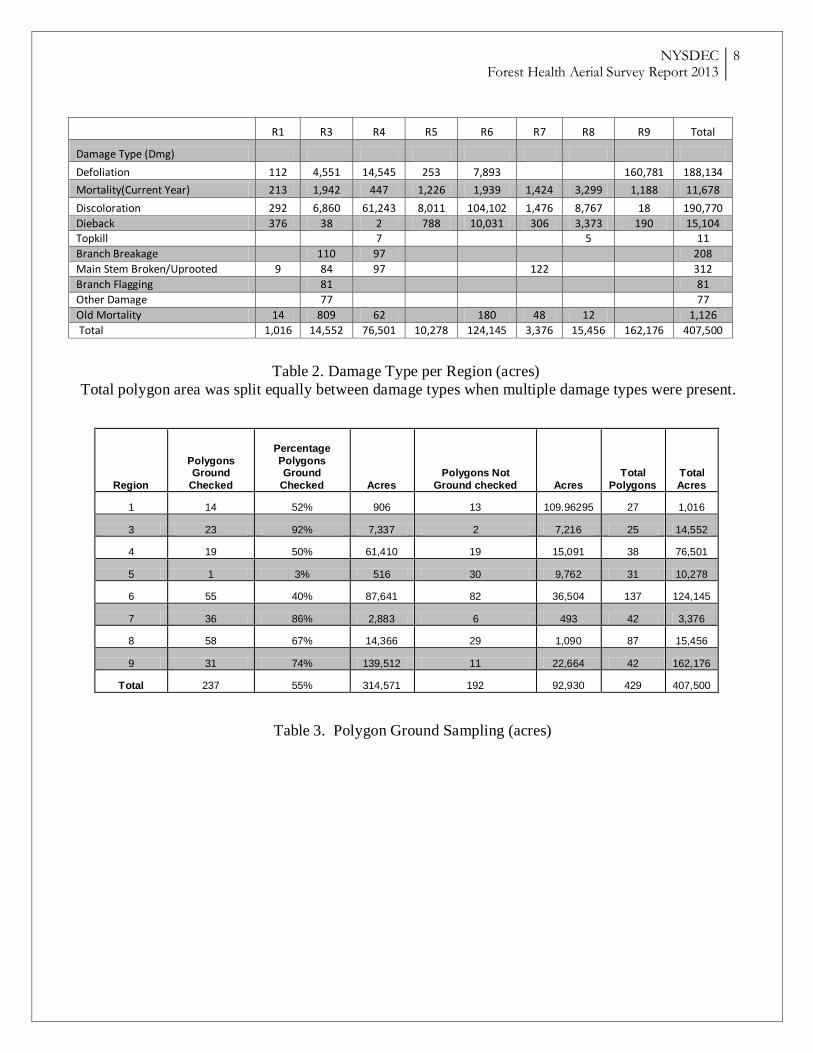
R1 R3 R4 R5 R6 R7 R8 R9 Total
Damage Type (Dmg)
Defoliation 112 4,551 14,545 253 7,893
160,781 188,134
Mortality(Current Year) 213 1,942 447 1,226 1,939 1,424 3,299 1,188 11,678
Discoloration 292 6,860 61,243 8,011 104,102 1,476 8,767 18 190,770
Dieback 376 38 2 788 10,031 306 3,373 190 15,104 Topkill
7
5
11
Branch Breakage
110 97
208
Main Stem Broken/Uprooted 9 84 97
122
312
Branch Flagging
81
81
Other Damage
77
77
Old Mortality 14 809 62
180 48 12
1,126
Total 1,016 14,552 76,501 10,278 124,145 3,376 15,456 162,176 407,500
Region
Polygons Ground
Checked
Percentage
Polygons Ground
Checked Acres
Polygons Not
Ground checked Acres
Total
Polygons
Total
Acres
1 14 52% 906 13 109.96295 27 1,016
3 23 92% 7,337 2 7,216 25 14,552
4 19 50% 61,410 19 15,091 38 76,501
5 1 3% 516 30 9,762 31 10,278
6 55 40% 87,641 82 36,504 137 124,145
7 36 86% 2,883 6 493 42 3,376
8 58 67% 14,366 29 1,090 87 15,456
9 31 74% 139,512 11 22,664 42 162,176
Total 237 55% 314,571 192 92,930 429 407,500
Table 2. Damage Type per Region (acres)
Total polygon area was split equally between damage types when multiple damage types were present.
Table 3. Polygon Ground Sampling (acres)