form 10-q - scientificindustries.com x no __ . indicate by check mark whether the registrant is a...
TRANSCRIPT
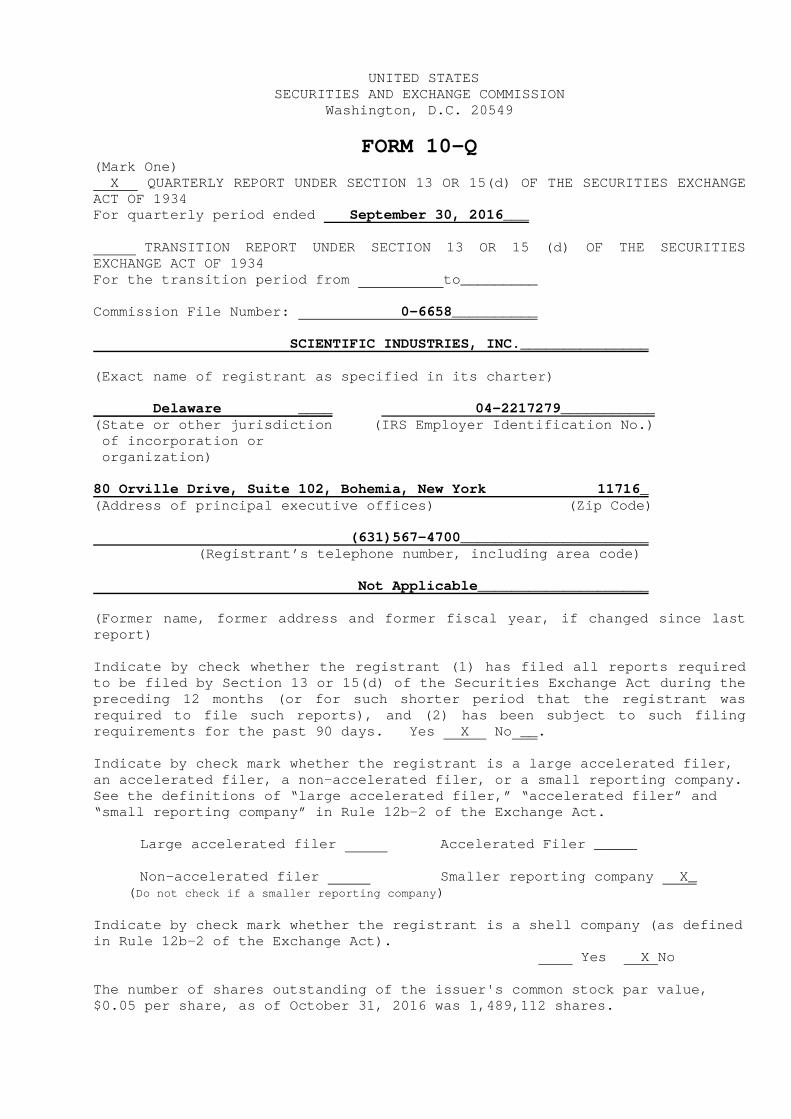
UNITED STATES SECURITIES AND EXCHANGE COMMISSION
Washington, D.C. 20549
FORM 10-Q (Mark One) X QUARTERLY REPORT UNDER SECTION 13 OR 15(d) OF THE SECURITIES EXCHANGE ACT OF 1934 For quarterly period ended September 30, 2016___ TRANSITION REPORT UNDER SECTION 13 OR 15 (d) OF TH E SECURITIES EXCHANGE ACT OF 1934 For the transition period from to_________ Commission File Number: 0-6658 __________ SCIENTIFIC INDUSTRIES, INC._ ______________ (Exact name of registrant as specified in its chart er) Delaware ____ 04-2217279___________ (State or other jurisdiction (IRS Employer Identifi cation No.) of incorporation or organization) 80 Orville Drive, Suite 102, Bohemia, New York 11716_ (Address of principal executive offices) (Zip C ode) (631)567-4700________ ______________
(Registrant’s telephone number, including area code ) Not Applicable______ ______________ (Former name, former address and former fiscal year , if changed since last report) Indicate by check whether the registrant (1) has fi led all reports required to be filed by Section 13 or 15(d) of the Securitie s Exchange Act during the preceding 12 months (or for such shorter period tha t the registrant was required to file such reports), and (2) has been su bject to such filing requirements for the past 90 days. Yes X No __ .
Indicate by check mark whether the registrant is a large accelerated filer, an accelerated filer, a non-accelerated filer, or a small reporting company. See the definitions of “large accelerated filer,” “ accelerated filer” and “small reporting company” in Rule 12b-2 of the Exch ange Act. Large accelerated filer Accelerated Filer _____ Non-accelerated filer Smaller reporting company X_ ( Do not check if a smaller reporting company ) Indicate by check mark whether the registrant is a shell company (as defined in Rule 12b-2 of the Exchange Act). Yes X No The number of shares outstanding of the issuer's co mmon stock par value, $0.05 per share, as of October 31, 2016 was 1,489,1 12 shares.

TABLE OF CONTENTS PART I – FINANCIAL INFORMATION ITEM 1 CONDENSED CONSOLIDATED FINANCIAL STATEMENTS (UNAUDITED): Pa ge Condensed Consolidated Balance Sheets 1 Condensed Consolidated Statements of Operations 2 Condensed Consolidated Statements of Comprehensiv e Loss 3 Condensed Consolidated Statements of Cash Flows 4 Notes to Condensed Consolidated Financial State ments 6 ITEM 2 MANAGEMENT’S DISCUSSION AND ANALYSIS OR PLAN OF OPERATIONS 13 ITEM 4 CONTROLS AND PROCEDURES 15 PART II – OTHER INFORMATION ITEM 6 EXHIBITS AND REPORTS ON FORM 8-K 16 SIGNATURE 17 EXHIBITS 18

PART I-FINANCIAL INFORMATION Item 1. Financial Statements
SCIENTIFIC INDUSTRIES, INC. AND SUBSIDIARIES CONDENSED CONSOLIDATED BALANCE SHEETS
ASSETS
September 30, June 30, 201 6 2016 __ Current assets: (Unaudited) Cash and cash equivalents $ 966,000 $1 ,245,000 Investment securities 292,100 290,10 0 Trade accounts receivable, net 1,151,700 1,231,900 Inventories 2,601,100 2,412,100 Prepaid expenses and other current assets 21 1,300 47,200 Deferred taxes 125,500 140,600
Total current assets 5,347,700 5,366,900 Property and equipment at cost, net 233,200 251,100 Intangible assets, net 828,100 897,6 00 Goodwill 705,300 705,300 Other assets 52,500 52, 500 Deferred taxes 274,600 275,900
Total assets $7,441,400 $7,549,300 LIABILITIES AND SHAREHOLDERS' EQUITY Current liabilities: Accounts payable $ 320,400 $ 342,400 Customer advances 403,800 - Notes payable, current portion 6,500 6,400 Accrued expenses and taxes, current portion 5 26,000 849,700 Contingent consideration payable, current portion 161,800 136,500 Total current liabilities 1,418,500 1,335,000 Notes payable, less current portion 10,800 12,500 Contingent consideration payable, less current port ion 67,100 209,800 Accrued expenses, less current portion 60,00 0 60,000
Total liabilities 1,556,400 1,617,300
Shareholders' equity: Common stock, $.05 par value; authorized 7,000,00 0 shares; 1,508,914 outstanding at September 30, 2016 and June 30, 2016 75,400 75,400 Additional paid-in capital 2,499,200 2,498,500 Accumulated other comprehensive income 2,000 900 Retained earnings 3,360,800 3,409,600 5,937,400 5,984,400 Less common stock held in treasury, at cost, 19,802 shares 52,400 52,400
Total shareholders’ equity 5,885,000 5,932,000 Total liabilities and
shareholders’ equity $7,441,400 $7,549,300
See notes to unaudited condensed consolidated finan cial statements 1

SCIENTIFIC INDUSTRIES, INC. AND SUBSIDIARIES CONDENSED CONSOLIDATED STATEMENTS OF OPERATIONS(UNAUDITED)
For the Three Month Periods Ended September 30, 2016 2015 Revenues $1,559,100 $1 ,444,500 Cost of revenues 889,500 849,400 Gross profit 669,600 595,100 Operating expenses: General and administrative 412,400 408,200 Selling 216,800 167,000 Research and development 115,400 85,400 Total operating expenses 744,600 660,600 Loss from operations ( 75,000) ( 65,500) Other income (expense): Investment income 200 400 Other income (expense) 5,400 ( 4,700) Interest expense ( 200) ( 8,100) Total other income (expense), net 5,400 ( 12,400) Loss before income tax expense (benefit) ( 69 ,600) ( 77,900) Income tax expense (benefit): Current ( 36,300) - Deferred 15,500 ( 17,800) Total income tax benefit ( 20,800) ( 17,800) Net loss ($ 48,800) ($ 60,100) Basic and diluted loss per common share ($ .03) ($ .04)
See notes to unaudited condensed consolidated finan cial statements
2

SCIENTIFIC INDUSTRIES, INC. AND SUBSIDIARIES CONDENSED CONSOLIDATED STATEMENTS OF COMPREHENSIVE LOSS
For the Three Month Periods Ended September 30,____ 2016_ _ 2015__ Net loss ($ 48,800) ($ 60,100) Other comprehensive income (loss): Unrealized holding gain (loss) arising during period, net of tax _ _ 1,100 (__ 3,800) Comprehensive loss ($ 47,700) ($ 63,900)
See notes to unaudited condensed consolidated finan cial statements
3

SCIENTIFIC INDUSTRIES, INC. AND SUBSIDIARIES CONDENSED CONSOLIDATED STATEMENTS OF CASH FLOWS (UNAUDITED)
For the Three Mo nth Periods Ended Sept. 30, 2016 Sept. 30, 2015 Operating activities: Net loss ($ 48,800) ($ 60,100) Adjustments to reconcile net loss to net cash used in operating activities: Loss on asset disposal - 2,700 Depreciation and amortization 95,700 105,200 Deferred income taxes 15,500 ( 17,8 00) Stock-based compensation 700 600 Changes in operating assets and liabilities: Accounts receivable 80,200 344,300 Inventories ( 189,000 ) ( 130,100) Prepaid expenses and other current assets ( 164,100 ) ( 76,700) Accounts payable ( 22,000) ( 26,500) Customer advances 403,800 17,100 Accrued expenses and taxes ( 323,700 ) ( 203,100) Total adjustments ( 102,900) 15,700_ Net cash used in operating activities ( 151,700) ( 44,400) Investing activities: Capital expenditures - ( 6,500) Purchases of intangible assets ( 8,400 ) -____ Net cash used in investing activities ( 8,400) ( 6,500) Financing activities: Line of credit proceeds - 200,000 Payment of contingent consideration ( 117,400) ( 100,900) Principal payments on note payable ( 1,500) - ___ Net cash provided by (used in) financing activities ( 118,900) 99,100
See notes to unaudited condensed consolidated finan cial statements
4

SCIENTIFIC INDUSTRIES, INC. AND SUBSIDIARIES CONDENSED CONSOLIDATED STATEMENTS OF CASH FLOWS (UNAUDITED)
For the Three Month Periods Ended Sept. 30, 2016 Sept. 30, 2015 Net increase (decrease) in cash and cash equivalents ( 279,000) 48,200 Cash and cash equivalents, beginning of year` 1,245,000 482,000 Cash and cash equivalents, end of period $ 966,000 $ 530,200 Supplemental disclosures: Cash paid during the period for: Income Taxes $186,000 $ 18,500 Interest 200 4,400
See notes to unaudited condensed consolidated finan cial statements
5

SCIENTIFIC INDUSTRIES, INC. AND SUBSIDIARIES NOTES TO UNAUDITED CONDENSED CONSOLIDATED FINANCIAL STATEMENTS
General: The accompanying unaudited interim conden sed consolidated
financial statements are prepared pursuant to the S ecurities and Exchange Commission’s rules and regulations for reporting on Form 10-Q. Accordingly, certain information and footnotes required by accounting principles generally accepte d in the United States for complete financial statements are not included herein. The Company believes all adjustmen ts necessary for a fair presentation of these interim statements have been included and that they are of a normal an d recurring nature. These interim statements should be read in conjunction with the Company’s financial statements and notes thereto, included in its Annual Report on Form 10-K , for the fiscal year ended June 30, 2016. The results for the three months ended September 30, 2016, are not necessaril y an indication of the results for the full fiscal year ending June 30, 2017.
1. Summary of significant accounting policies: Principles of consolidation:
The accompanying consolidated financial statements include the accounts of Scientific Industries, Inc., Scientific Packagin g Industries, Inc., an inactive wholly-owned subsidiary, Altamira Instr uments, Inc. (“Altamira”), a Delaware corporation and wholly-own ed subsidiary, and Scientific Bioprocessing, Inc. (“SBI”), a Delaware corporation and wholly-owned subsidiary, (all collectively referred to as the “Company”). All material intercompany balances and transactions have been eliminated.
2. New Accounting Pronouncements:
In March 2016, the FASB issued ASU No. 2016-09 , "Compensation - Stock Compensation(Topic 718): Improvements to Employee Share-Based Payment Accounting" (ASU 2016-09). Areas for sim plification in this update involve several aspects of accounting for share- based payment transactions, including the income tax consequences, classificat ion of awards as either equity or liabilities, and classification on the s tatement of cash flows. ASU 2016-09 is effective for interim and ann ual reporting periods beginning after December 15, 2016, with early applicatio n permitted. The Company is currently evaluating the timing, impact and method of applying this guidance on its
consolidated financial statements.
In February 2016, the FASB issued authoritative gui dance that requires lessees to account for most leases on their bala nce sheets with the liability being equal to the present value of the lease payments. The right- of-use asset will be based on the lease liability adjusted for certain costs such as direct costs. Lease expense will be recog nized similar to current accounting guidance with operating leases resulti ng in a straight-line expense and financing leases resulting in a front -loaded expense similar to the current accounting for capital leases. This g uidance becomes effective for the Company's fiscal 2020 first quarter, with early adoption permitted. This guidance must be adopted using a modified re trospective transition approach for leases that exist or are entered int o after the beginning of the
6

earliest comparative period in the financial stat ements, and provides for certain practical expedients. The Company is curr ently evaluating the timing, impact and method of applying this guidance on i ts consolidated financial statements.
In November 2015, the FASB issued new guidance simp lifying the balance sheet classification of deferred taxes. The new guidan ce requires that deferred tax liabilities and assets be classified as noncu rrent in a classified statement of financial position. The current requ irement that deferred tax liabilities and assets of a tax-paying component of an entity be offset and presented as a single amount is not affected by t he new guidance. The guidance is effective for public companies for in terim and annual reporting periods beginning after December 15, 2016, with e arly adoption permitted as of the beginning of an interim or annual reportin g period. The new guidance may be applied either prospectively to all deferr ed tax liabilities and assets or retrospectively to all periods presente d. The Company does not expect the adoption to have a material impact on its financial condition, results of operations or cash flows.
In July 2015, the FASB issued ASU No. 2015-11, “Inventory: Simplifying the Measurement of Inventory” , that requires inventory not measured using either the last in, first out (LIFO) or the retail inven tory method to be measured at the lower of cost and net realizable value. Ne t realizable value is the estimated selling prices in the ordinary course o f business, less reasonably predictable cost of completion, disposal and tran sportation. The new standard
will be effective for fiscal years beginning afte r December 15, 2016, including interim periods within those fiscal year s, and will be applied prospectively. Early adoption is permitted. The Co mpany does not expect the adoption to have a material impact on its financia l condition, results of operations or cash flows.
In May 2014, the Financial Accounting Standards Boa rd (“FASB”) issued Accounting Standards Update (“ASU”) 2014-09, Reve nue from Contracts with Customers amending revenue recognition requiremen ts for multiple- deliverable revenue arrangements. This update pro vides guidance on how revenue is recognized to depict the transfer of p romised goods or services to customers in an amount that reflects the consi deration to which the entity expects to be entitled in exchange for the goods or services. This determination is made in five steps: (i) identify the contract with the customer; (ii) identify the performance obligatio ns in the contract; (iii) determine the transaction price; (iv) alloc ate the transaction price to the performance obligations in the contract; a nd (v) recognize revenue when (or as) the entity satisfies a performance o bligation. In July 2015, the FASB deferred the effective date to fiscal ye ars beginning after December 15, 2018 and early adoption of the stand ard is permitted, but not before the original effective date of December 15 , 2017. The Company is evaluating the effect this guidance will have on the consolidated financial statements and related disclosures.
3. Segment Information and Concentrations:
The Company views its operations as three segments: the manufacture and marketing of standard benchtop laboratory equipment including the balances and scales by its Torbal Scales Division for resear ch in university, hospital and industrial laboratories sold primarily through laboratory equipment distributors and on a direct basis (“Benc htop Laboratory Equipment”), the manufacture and marketing of custo m-made catalyst research
7
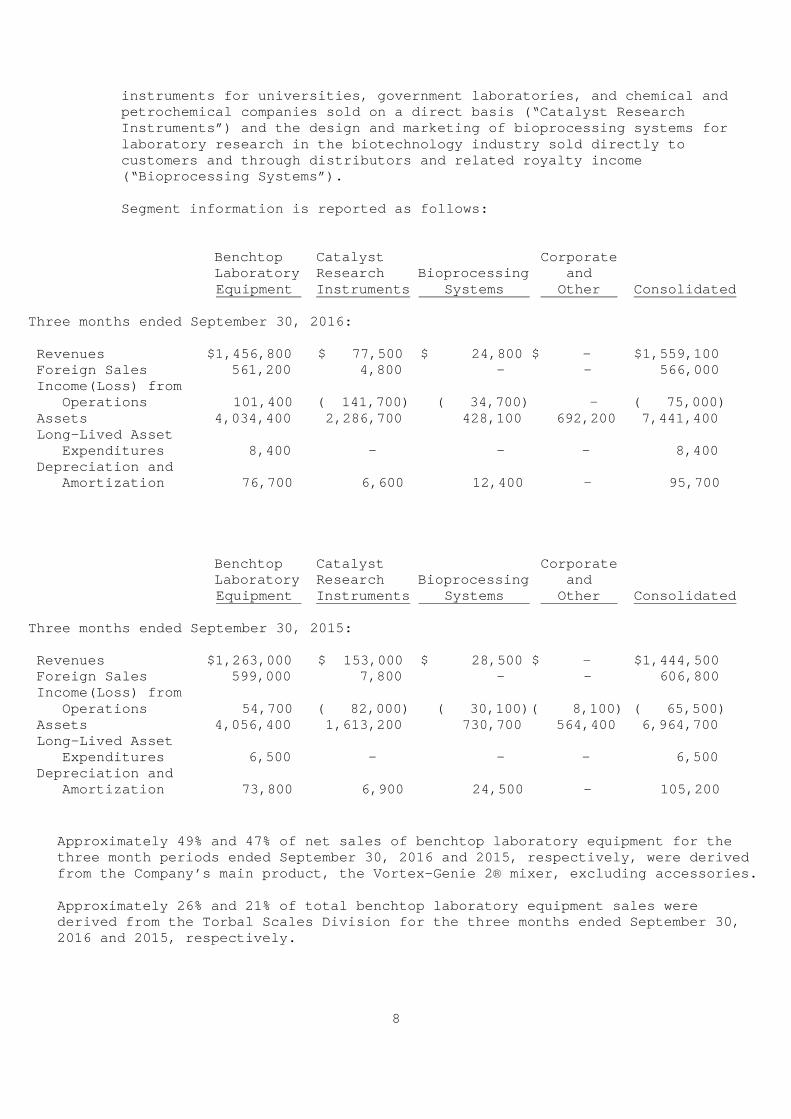
instruments for universities, government laboratori es, and chemical and petrochemical companies sold on a direct basis (“Ca talyst Research Instruments”) and the design and marketing of biopr ocessing systems for laboratory research in the biotechnology industry s old directly to customers and through distributors and related roya lty income (“Bioprocessing Systems”).
Segment information is reported as follows: Benchtop Catalyst Corporate
Laboratory Research Bioprocessing and Equipment Instruments Systems Other Consolidated Three months ended September 30, 2016: Revenues $1,456,800 $ 77,500 $ 24,800 $ - $1,559,100 Foreign Sales 561,200 4,800 - - 566,000 Income(Loss) from Operations 101,400 ( 141,700) ( 34,700) - ( 75,000) Assets 4,034,400 2,286,700 428,100 692,200 7,441,400 Long-Lived Asset Expenditures 8,400 - - - 8,400 Depreciation and Amortization 76,700 6,600 12,400 - 95,700
Benchtop Catalyst Corporate
Laboratory Research Bioprocessing and Equipment Instruments Systems Other Consolidated Three months ended September 30, 2015: Revenues $1,263,000 $ 153,000 $ 28,500 $ - $1,444,500 Foreign Sales 599,000 7,800 - - 606,800 Income(Loss) from Operations 54,700 ( 82,000) ( 30,100)( 8,100) ( 65,500) Assets 4,056,400 1,613,200 730,700 564,400 6,964,700 Long-Lived Asset Expenditures 6,500 - - - 6,500 Depreciation and Amortization 73,800 6,900 24,500 - 105,200
Approximately 49% and 47% of net sales of benchtop laboratory equipment for the three month periods ended September 30, 2016 and 20 15, respectively, were derived from the Company’s main product, the Vortex-Genie 2 ® mixer, excluding accessories. Approximately 26% and 21% of total benchtop laborat ory equipment sales were derived from the Torbal Scales Division for the thr ee months ended September 30, 2016 and 2015, respectively.
8

For the three months ended September 30, 2016, and 2015, respectively, two customers accounted in the aggregate for approximat ely 16% and 13% of net sales of the Benchtop Laboratory Equipment Operations (15 % and 11% of the Company’s total revenues). Sales of catalyst research instru ments generally comprise a few very large orders averaging at least $100,000 per o rder to a limited number of customers, who differ from order to order. Sales t o one customer (who differed from period-to-period) during the three months ende d September 30, 2016 and 2015, accounted respectively, for approximately 57% and 7 6% of the Catalyst Research Instrument Operations’ revenues and 3% and 8% of th e Company’s total revenues, respectively.
4. Fair Value of Financial Instruments:
The FASB defines the fair value of financial instru ments as the amount that would be received to sell an asset or paid to transfer a lia bility in an orderly transaction between market participants at the measurement date . Fair value measurements do not include transaction costs.
The accounting guidance also expands the disclosure requirements around fair value and establishes a fair value hierarchy for valuatio n inputs. The hierarchy prioritizes the inputs into three levels based on t he extent to which inputs used in measuring fair value are observable in the market. Each fair value measurement is reported in one of the three levels, which is deter mined by the lowest level input that is significant to the fair value measurement i n its entirety. These levels are described below:
Level 1 Inputs that are based upon unadjusted quot ed prices for identical
instruments traded in active markets . Level 2 Quoted prices in markets that are not cons idered to be active or
financial instruments for which all significant inp uts are observable, either directly or indirectly .
Level 3 Prices or valuation that require inputs th at are both significant to the fair value measurement and unobserv able . The following tables set forth by level within the fair value hierarchy the Company’s financial assets that were accounted for at fair value on a recurring basis at September 30, 2016 and June 30, 2016 according to the valuation techniques the Company used to determine their fair values: Fair Value Measurements Using Inputs Considered as Fair Value at September 30, 2016 Level 1 Level 2 Level 3 Assets: Cash and cash equivalents $ 966,000 $ 966 ,000 $ - $ - Available for sale securities 292,100 292,100 - -_ __ Total $1,258,100 $1,258,100 $ - $ -____ Liabilities: Contingent consideration $ 228,900 $ - $ - $228,900
9

Fair Value Measurements Using Inputs Considered as Fair Value at June 30, 2016 Level 1 Level 2 Level 3 Assets: Cash and cash equivalents $1,245,000 $1,245 ,000 $ - $ - Available for sale securities 290,100 290,100 - -___ Total $1,535,100 $1,535,100 $ - $ -___ Liabilities: Contingent consideration $ 346,300 $ - $ - $346,300 The following table sets forth an analysis of chang es during the three months ended September 30, 2016, Level 3 financial liabili ties of the Company: Beginning balance, June 30, 2016 $346,300 Payments (117,400) Ending Balance, September 30, 2016 $228,900
Investments in marketable securities classified as available-for-sale by security type at September 30, 2016 and June 30, 20 16 consisted of the following: Unrealized Fair Holding Gain Cost Value (Loss)__ At September 30, 2016: Available for sale: Equity securities $ 29,300 $ 41,500 $ 12,200 Mutual funds 260,800 250,600 (10,200) $ 290,100 $ 292,100 $ 2,000_ Unrealized Fair Holding Gain Cost Value (Loss)___ At June 30, 2016: Available for sale: Equity securities $ 29,300 $ 40,700 $ 11,400 Mutual funds 259,900 249,400 (10,500) $ 289,200 $ 290,100 $ 900_ 5. Inventories:
Inventories for financial statement purposes are based on perpetual inventory records at September 30, 2016 and based on a physical count as of June 30, 2016. Components of inventory are as follows:
September 30, June 30, 2016 2016 _ Raw materials $1,502,800 $1,529,800 Work in process 774,000 425,300 Finished goods 324,300 457,000 $2,601,100 $2,412,100
10

6. Loss per common share:
Basic loss per common share is computed by dividi ng net loss by the weighted-average number of shares outstanding. D iluted earnings per common share include the dilutive effect of stock options, if any.
Loss per common share was computed as follows: For the Three Mon th Periods Ended September 30, 2016 2015 Net loss ($ 48,800 ) ($ 60,100 ) Weighted average common shares outstanding 1,489,112 1,489,112 Weighted average dilutive common shares outstanding 1,489,112 1,489,112 Basic loss per common share ($ .03 ) ($ .04 ) Diluted loss per common share ($ .03 ) ($ .04 )
Approximately 43,500 and 38,500 shares of the Compa ny's Common Stock issuable upon the exercise of outstanding options w ere excluded from the calculation of diluted loss per common share, for t he three months ended September 30, 2016 and 2015, because the effect wou ld be anti-dilutive due to the loss for each period.
7. Goodwill and Other Intangible Assets:
Goodwill represents the excess of the purchase pric e over the fair value of the net assets acquired in connection with the C ompany's acquisition of Altamira and SBI’s acquisition of assets. Goodwill amounted to $705,300 as of September 30, 2016 and June 30, 2016, all of which is expected to be deductible for tax purposes.
The components of other intangible assets are as f ollows:
Useful Accumulated Lives Cost Amortization Net____ At September 30, 2016: Technology, trademarks 5/10 yrs. $ 722,800 $ 489,900 $ 232,900 Trade names 6 yrs. 140,000 60,200 79,800 Websites 5 yrs. 210,000 108,500 101,500 Customer relationships 9/10 yrs. 357,000 269,200 87,800 Sublicense agreements 10 yrs. 294,000 143,300 150,700 Non-compete agreements 5 yrs. 384,000 253,200 130,800 Intellectual Property, Research and Development(IPR&D) 3 yrs. 110,000 94,700 15,300 Other intangible assets 5 yrs. 186,300 157,000 29,300
$2,404,100 $1,576,000 $ 828,100
11
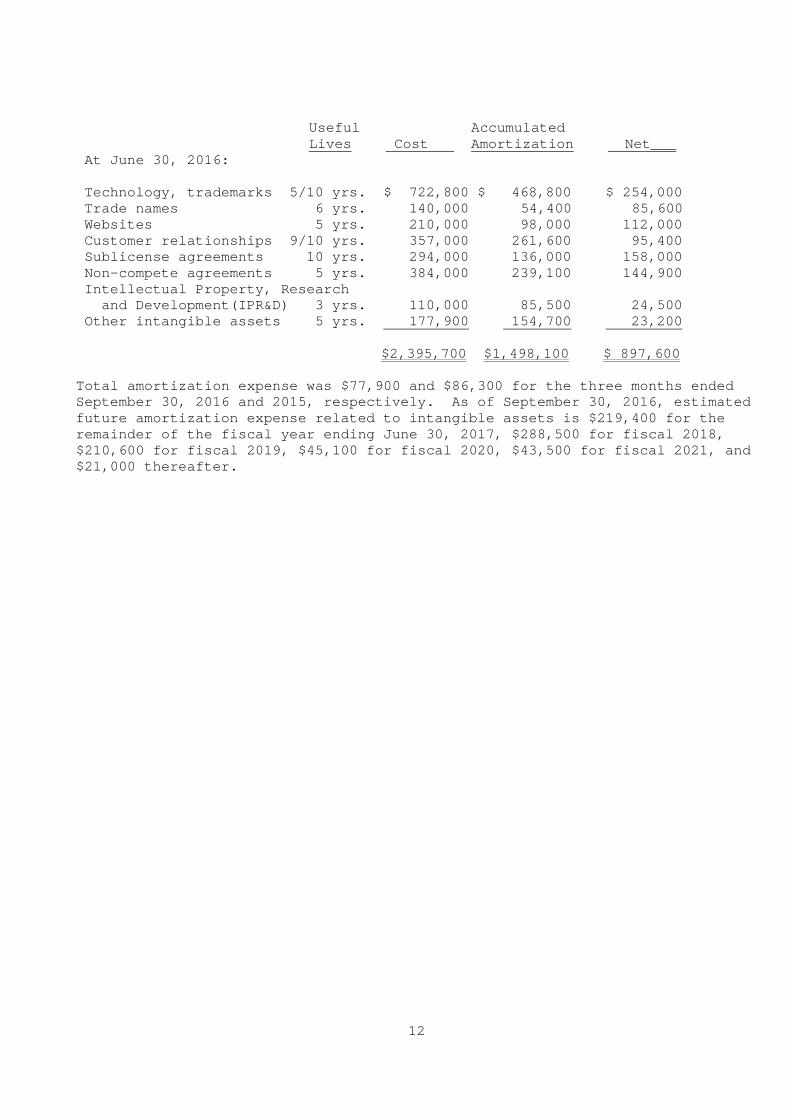
Useful Accumulated Lives Cost Amortization Net___ At June 30, 2016: Technology, trademarks 5/10 yrs. $ 722,800 $ 468,800 $ 254,000 Trade names 6 yrs. 140,000 54,400 85,600 Websites 5 yrs. 210,000 98,000 112,000 Customer relationships 9/10 yrs. 357,000 261,600 95,400 Sublicense agreements 10 yrs. 294,000 136,000 158,000 Non-compete agreements 5 yrs. 384,000 239,100 144,900 Intellectual Property, Research and Development(IPR&D) 3 yrs. 110,000 85,500 24,500 Other intangible assets 5 yrs. 177,900 154,700 23,200 $2,395,700 $1,498,100 $ 897,600 Total amortization expense was $77,900 and $86,300 for the three months ended September 30, 2016 and 2015, respectively. As of S eptember 30, 2016, estimated future amortization expense related to intangible a ssets is $219,400 for the remainder of the fiscal year ending June 30, 2017, $288,500 for fiscal 2018, $210,600 for fiscal 2019, $45,100 for fiscal 2020, $43,500 for fiscal 2021, and $21,000 thereafter.
12

SCIENTIFIC INDUSTRIES, INC. AND SUBSIDIARIES
Item 2. Management’s Discussion and Analysis or Pla n of Operations Certain statements contained in this report are not based on historical facts, but are forward-looking statements that are based u pon various assumptions about future conditions. Actual events in the futu re could differ materially from those described in the forward-looking informa tion. Numerous unknown factors and future events could cause such differen ces, including but not limited to, product demand, market acceptance, impa ct of competition, the ability to reach final agreements, the ability to f inance and produce to customers’ specifications for catalyst research ins truments, and to develop marketable bioprocessing systems, adverse economic conditions, and other factors affecting the Company’s business that are b eyond the Company’s control. Consequently, no forward-looking statement can be g uaranteed. We undertake no obligation to publicly update forwa rd-looking statements, whether as a result of new information, future events or otherwise. Liquidity and Capital Resources Cash and cash equivalents decreased by $279,000 to $966,000 as of September 30, 2016 from $1,245,000 as of June 30, 2016. Net cash used in operating activities was $151,700 for the three months ended September 30, 2016 as compared to $44,400 for the c omparable three month period in 2015, reflecting lower accounts receivable balan ces, increased prepayments to vendors, decreased accrued expense items, partia lly offset by increased advances from customers for catalyst research instr ument orders. Cash used in investing activities was $8,400 for the three month period ended September 30, 2016 compared to $6,500 for the three month period ended September 30, 2015. Cash used in financing activities was $118,900 for the three months ended September 30, 2016 compared to cash provided of $99 ,100 for the three months ended September 30, 2015 because of the proceeds re ceived under the line of credit in the prior year. The Company’s working capital decreased by $102,700 to $3,929,200 at September 30, 2016 from $4,031,900 at June 30, 2016. The Company has two lines of credit through June 20 17 with First National Bank of Pennsylvania – an Export-Related Revolving Line of Credit which is guaranteed by the Export-Import Bank of the United States which provides for export-related borrowings of up to $200,000, bearin g interest at prime plus 1% and an annual fee of 1.75% and a second one-year De mand Line of Credit which provides for borrowings of up to $300,000 for regular working capital needs, bearing interest at prime, currently 3.50%. Advances on both lines are secured by a pledge of the Company's assets includi ng inventory, accounts, chattel paper, equipment and general intangibles of the Company. As of September 30, 2016 no borrowings were outstanding u nder either line . Management believes that the Company will be able t o meet its cash flow needs during the next 12 months from its available financ ial resources which include its cash and investment securities, lines of credit , and operations.
13

Results of Operations Financial Overview The Company incurred a loss of $69,600 before incom e tax benefit for the three months ended September 30, 2016 compared to a loss of $77,900 before income tax benefit for the comparable period last year, the im provement is primarily due to higher sales and margins generated by the Bencht op Laboratory Equipment Operations. The result included non-cash amounts f or depreciation and amortization of $95,700 and $105,200 for the three months ended September 30, 2016 and 2015, respectively. The Three Months Ended September 30, 2016 Compared With the Three Months Ended September 30, 2015 Revenues for the three months ended September 30, 2 016 increased by $114,600 (7.9%) to $1,559,100 from $1,444,500 for the three months ended September 30, 2015, primarily as a result of a $193,800 increase in benchtop laboratory equipment sales. Sales of catalyst research instru ments, and bioprocessing revenues decreased by $75,500 and $3,700 respective ly. Catalyst research instruments are sold pursuant to a small number of larger orders, typically averaging over $100,000 each, resulting in signific ant swings in revenues, and the Bioprocessing Systems Operations’ revenues cons ist primarily of earned royalties. The backlog of orders for catalyst rese arch instruments was $1,167,000 as of September 30, 2016, substantially all of which is expected to be delivered by fiscal year end, as compared to the backlog as of September 30, 2015 of $2,944,000. The gross profit percentage for the three months en ded September 30, 2016 increased to 42.9% compared to 41.2% for the three months ended September 30, 2015, primarily due to higher sales for the Benchto p Laboratory Equipment Operations. General and administrative expenses for the three m onths ended September 30, 2016 amounted to $412,400 compared to $408,200 for the three months ended September 30, 2015. Selling expenses for the three months ended Septemb er 30, 2016 increased $49,800 (29.8%) to $216,800 from $167,000 for the t hree months ended September 30, 2015, primarily the result of increased adverti sing expenses for benchtop laboratory equipment and trade show expense for the Catalyst Research Instruments Operations. Research and development expenses for the three mon ths ended September 30, 2016 increased by $30,000 (35.1%) to $115,400 from $85,4 00 for the three months ended September 30, 2015, due primarily to increase d new product development activity by the Benchtop Laboratory Equipment Opera tions. Total other income was $5,400 for the three month p eriod ended September 30, 2016 compared to $12,400 expense for the three mont h period ended September 30, 2015 due to miscellaneous income items in the curre nt year and reduced interest expense. For the three months ended September 30, 2016, the income tax benefit was $20,800 compared to income tax benefit of $17,800 f or the three months ended September 30, 2015.
14

As a result, the net loss for the three months ende d September 30, 2016 was $48,800 compared to a net loss of $60,100 for the t hree months ended September 30, 2015. Item 4. Controls and Procedures Evaluation of Disclosure Controls and Procedures. As of the end of the period covered by this report, based on an evaluation of t he Company's disclosure controls and procedures (as defined in Rules 13a-15 (e) and 15d-15(e) under the Securities Exchange Act of 1934), the Chief Executi ve and Chief Financial Officer of the Company has concluded that the Compa ny's disclosure controls and procedures are effective to ensure that information required to be disclosed by the Company in its Exchange Act reports is recorded , processed, summarized and reported within the applicable time periods specifi ed by the SEC's rules and forms. The Company also concluded that information required to be disclosed in such reports is accumulated and communicated to the Company's management, including its principal executive and principal fin ancial officer, as appropriate to allow timely decisions regarding req uired disclosure. Changes in Internal Control Over Financial Reportin g. There was no change in the Company's internal controls over financial repo rting that occurred during the most recently completed fiscal quarter that mat erially affected or is reasonably likely to materially affect the Company' s internal controls over financial reporting.
15

Part II – OTHER INFORMATION Item 6. Exhibits and Reports on Form 8-K (a) Exhibit Number: Description
31.1 Certification of Chief Executive Officer and Chief Financial Officer pursuant to Section 302 of the Sarbanes-Oxley Act of 2002.
32.1 Certification of Chief Executive Officer and Chief
Financial Officer pursuant to Section 906 of the Sarbanes-Oxley Act of 2002.
(b) Reports on Form 8-K:
None
16

SCIENTIFIC INDUSTRIES, INC. AND SUBSIDIARIES
SIGNATURE In accordance with the requirements of the Exchange Act, the registrant caused this report to be signed on its behalf by the under signed, thereunto duly authorized. Scientific Industries , Inc. Registrant ____________________________ Helena R. Santos President, Chief Exec utive Officer and Treasurer Principal Executive, Financial and Accounting Officer Date: November 14, 2016
17
Exhibit 31.1
CERTIFICATION I, Helena R. Santos, certify that:
1. I have reviewed this report on Form 10-Q for the qu arter ended September 30, 2016 of Scientific Industries, Inc., a smaller reporting company (the “Registrant”);
2. Based on my knowledge, this report does not contain any untrue statement
of a material fact or omit to state a material fact necessary to make the statements made, in light of the circumstances unde r which such statements were made, not misleading with respect to the perio d covered by this report;
3. Based on my knowledge, the financial statements, an d other financial
information included in this report, fairly present in all material respects the financial condition, results of operat ions and cash flows of the Registrant as of, and for, the periods presente d in this report;
4. I am responsible for establishing and maintaining d isclosure controls and
procedures (as defined in Exchange Act Rules 13a-15 (e) and 15d-15(e) and internal control over financial reporting (as defin ed in Exchange Act Rules 13a-15 (f) and 15d-15(f)) for the Registrant and have: a) Designed such internal disclosure and procedures, o r caused such
controls and procedures to be designed under my sup ervision, to ensure that material information relating to the Registran t, including its consolidated subsidiaries, is made known to me by o thers within those entities, particularly during the period in which t his report is being prepared;
b) Designed such internal control over financial repor ting, or caused such internal control over financial reporting t o be designed under my supervision, to provide reasonable assuranc e, regarding the reliability of financial reporting and the preparation of financial statements for external purposes in accordance with genera lly accepted accounting principles;
c) Evaluated the effectiveness of the Registrant’s dis closure controls and procedures and presented in this report my conclusi ons about the effectiveness of the disclosure controls and proced ures, as of the end of the period covered by this report based on such evaluation; and
d) Disclosed in this report any change in the Registra nt’s internal control over financial reporting that occurred duri ng the Registrant’s most recent fiscal quarter that has materially affe cted, or is reasonably likely to affect, the Registrant’s inter nal control over financial reporting; and
5. I have disclosed, based on my most recent eval uation of internal controls over financial reporting, to the Regi strant’s auditors and the audit committee of the Registrant’s board of d irectors (or persons performing the equivalent functions): 18

a) All significant deficiencies and material weakness es in the design or
operation of internal controls over financial repor ting which are reasonably likely to adversely affect the Registran t’s ability to record, process, summarize and report financial inf ormation; and
b) Any fraud, whether or not material, that involves management or other employees who have a significant role in the Regist rant’s internal controls over financial reporting.
November 14, 2016 _________________ Helena R. Santos Chief Executive Officer and Chief Financial Officer
19

Exhibit 32.1
CERTIFICATION The undersigned as Chief Executive Officer and Chie f Financial Officer of the Company, does hereby certify that the foregoing Qua rterly Report of SCIENTIFIC INDUSTRIES, INC. (the “Company”), on Form 10-Q for the period ended September 30, 2016: (1) Fully complies with the requirements of Sectio n 13 or 15 (d) of the
Securities Exchange Act of 1934; and (2) Fairly presents, in all material respects, the financial condition and
results of operations of the Company. November 14, 2016 _________________ Helena R. Santos Chief Executive Officer and Chief Financial Officer A signed original of this written statement require d by Section 906 has been provided to the Company and will be retained by the Company and furnished to the Securities and Exchange Commission or its staff upon request.
20