forward guidance and corporate lending
TRANSCRIPT

Munich Personal RePEc Archive
Forward Guidance and Corporate
Lending
Delis, Manthos and Hong, Sizhe and Paltalidis, Nikos and
Philip, Dennis
15 January 2020
Online at https://mpra.ub.uni-muenchen.de/98159/
MPRA Paper No. 98159, posted 16 Jan 2020 08:57 UTC

Forward Guidance and Corporate Lending
Manthos D. Delis Montpellier Business School
Sizhe Hong
Durham University Business School
Nikos Paltalidis Durham University Business School
Dennis Philip
Durham University Business School
Earlier versions of the paper were presented at the 2019 EEA-ESEM Conference (Manchester), the CEPR 2019 Endless Summer Conference (Athens), the 2019 INFINITI Conference (Glasgow), and the 2019 University of York Workshop on Fiscal Policy. For useful comments and discussions, we thank Kizkitsa Biguri, Cagatay Bircan, Justas Dainauskas, Damian Damianov, Tatiana Damjanovic, Tim Eisert, Ruhollah Eskandari, Carlo Favero, Isabel Catalina Figuerola Ferretti, Bill Francis, Pedro Gete, Iftekhar Hasan, Andreas Joseph, Sotirios Kokas, Nikolaos Kokonas, Joao Madeira, Alex Michaelides, David Martinez Miera, Paulo Santo Monteiro, Anamaria Nicolae, Kilian Rieder, Raffaele Rossi, Rana Sajedi, Elizaveta Sizova, Mathias Trabandt, and Eyub Yegen. Authors’ coordinates: Manthos D. Delis, Montpellier Business School, 2300 Avenue des Moulins, 34185, Montpellier, France, email [email protected]. Sizhe Hong, Durham University Business School, Mill Hill Lane, Durham, DH1 3LB, UK, email [email protected]. Nikos Paltalidis, Durham University Business School, Mill Hill Lane, Durham, DH1 3LB, UK, email [email protected]. Dennis Philip, Durham University Business School, Mill Hill Lane, Durham, DH1 3LB, UK, email [email protected].

Forward Guidance and Corporate Lending
This Draft: January 15, 2020
Abstract
We suggest that forward guidance, via “binding” the central bank’s actions and creating associated expectations, fundamentally affects bank-lending decisions independently of other forms of monetary policy. To test this hypothesis, we build a forward guidance measure based
on the language used in the Federal Open Market Committee meetings and match this measure with syndicated loans. Our results show that expansionary forward guidance decreases corporate loan spreads and that this effect is stronger for well-capitalized banks lending to riskier firms. Moreover, banks more easily initiate new lending relationships with lower
spreads, and the loan syndicates are less concentrated.
JEL classification: G21; E52; E43; E58
Keywords: Forward guidance; Monetary policy transmission; Bank lending; Corporate loans; Loan spreads; Syndicate structure; Bank-firm relationships

1
1. Introduction
How does forward guidance affect corporate lending? The answer has important implications
for the role of monetary policy on bank lending and, by extension, for real economic activity.
Central banks describe forward guidance as their communication with the public about the state
of the economy, the economic outlook, and the likely future course of monetary policy. Thus,
forward guidance explicitly affects the future expectations of economic agents, the long-term
path of interest rates, and long-term economic and financial expectations (e.g., McKay,
Nakamura, and Steinsson 2016). Officially, the Board of Governors of the Federal Reserve
System (Fed) acknowledges that the Federal Open Market Committee (FOMC) began using
forward guidance in its post-meeting statements in the early 2000s. In the aftermath of the 2008
global financial crisis, and with consistently low policy rates, forward guidance has become an
indispensable tool for central banks to fulfil the dual mandate of maximum sustainable
employment and price stability.
The credit-channel literature suggests that expansionary monetary policy, exercised via
low interest rates, advances banks’ appetite for risk (Jiménez, Ongena, Peydró, and Saurina
2014; Delis, Hasan, and Mylonidis 2017) and generally affects credit supply (Bernanke and
Blinder 1992; Kashyap and Stein 2000). With the policy rate constrained in its effective lower
bound since 2008, little scope existed to change actual policy in order to affect expectations.
Therefore, central banks relied on quantitative easing and forward guidance to shape
expectations. Along this line, recent research has placed the spotlight on the effects of
unconventional monetary policy tools. Most related to our research, Dell’Ariccia, Laeven, and
Suarez (2018) suggest that asset purchases increase bank lending and reserves, a result
especially pronounced for banks with weaker balance sheets.
The literature remains silent on the role of forward guidance in the credit channel of
monetary policy. We hypothesize that by “binding” the central bank’s future actions and

2
creating associated expectations, forward guidance fundamentally affects contemporary bank-
lending decisions independently of the related effects of short rates and asset-purchase
programs. To test our hypothesis, we build a monthly forward guidance measure based on the
language used in the statements produced after the FOMC meetings. We distinguish the
language used in these meetings toward accommodative or contractionary monetary policy and
toward commitment to a particular course of action (“Odyssean” forward guidance) or to a
likely monetary policy action (“Delphic” forward guidance). The distinction is important
because Odyssean forward guidance significantly affects economic output, inflation, and the
unemployment rate, while Delphic forward guidance has no such effects (Campbell, Fisher,
Justiniano, and Melosi 2017).
We place the cost of loans (loan spreads over the LIBOR plus any fees) at the center of
our analysis (see, e.g., Delis, Hasan, and Mylonidis 2017; Paligorova and Santos 2017). All
else equal, the loan spread is an indicator of the loan-specific default probability (ex ante risk).
We match the dates of forward guidance with 20,615 syndicated loans made to 3,834 US
companies by 329 US banks, from May 1999 until June 2017.
Our identification strategy for a causal effect of forward guidance on the cost of loans
confronts three problems. First, we disentangle the effect of forward guidance from the effects
of the federal funds rate and other monetary policy innovations. To this end, we use the shadow
rate (Krippner 2015), which encompasses the full stance of monetary policy especially after
2008, leaving the effect of forward guidance to be captured by our measure of explicit forward-
looking language.
The other two identification problems find their solution in the use of loan-level data
(Delis, Hasan, and Mylonidis 2017; Ioannidou, Ongena, and Peydró 2015; Jiménez, Ongena,
Peydró, and Saurina 2014). Specifically, identifying the effect of forward guidance implies
identifying changes in incentives to take new risk, and this new risk must emanate from the

3
supply (bank) side as opposed to the demand (firm) side. In these respects, syndicated loans
are ideal because they allow both (i) studying the effect of forward guidance on new loans (new
risk) and (ii) distinguishing between loan demand and loan supply using firm times year fixed
effects and interaction terms between forward guidance and specific bank and/or firm
characteristics.
Our benchmark results (without interaction terms but with firm times year fixed effects)
show that expansionary forward guidance is associated with a decline in the corporate loan
spreads, with this effect being highly significant in the post-2008 period over and above the
effect of conventional monetary policy tools. According to our baseline specification, forward
guidance yields a decline in corporate loan spreads by approximately 31 bps (or 13.3%
reduction in the loan spread) for a loan with an average spread originated one month after an
Odyssean forward guidance. When we consider loans originated two months after an Odyssean
forward guidance (at which point the lending markets have had time to further absorb the
guidance information), the effect is more pronounced, with a decline of 36.9 bps in corporate
loan spreads (or 15.7% reduction in the loan spread). The reduction of interest expenses for the
borrowing firm is equal to USD 9.1 million for the loan with an average size and maturity.
Notably, our results support a risk-taking channel working via forward guidance.
Specifically, the models that interact forward guidance with bank capital and firm risk
measures show that banks with higher capital levels offer lower spreads to riskier firms, ceteris
paribus. These specifications enable us to isolate the pure supply-driven effects of forward
guidance on loan spreads, suggesting that banks, especially those with higher capital ratios,
take on more risk after forward guidance, as evidenced by their willingness to offer cheaper
loans to riskier firms. Economically, a highly capitalized bank (75 th percentile) reduces the loan
spread by 19.56% (13.66%) more than a less capitalized bank (25th percentile) one month (two

4
months) after expansionary forward guidance, for a borrowing firm with high leverage (7 th
percentile in a standard leverage ratio).
These findings are robust (and conservative) to several robustness tests. Specifically,
we use a quarterly measure of forward guidance; we run placebo tests for Delphic forward
guidance (the results are statistically insignificant); we replace the shadow rate with the federal
funds rate; we use different fixed effects and alternative control variables (e.g., credit ratings);
and we distinguish between term loans and credit lines (because these loan groups have
important differences).
We also consider two important extensions of our analysis. The first is on lender–
borrower relationships, which can play a key role in the effect of forward guidance on loan
spreads. We show that expansionary forward guidance increases the probability of establishing
new lender–borrower relationships and lowers the loan spreads on such loans. Second, we
examine the effect of forward guidance on the structure of loan syndicates (syndicate size and
concentration). Consistent with the literature suggesting that lower informational asymmetry
between syndicate participants implies less monitoring effort by lead banks and thus less
concentrated syndicates (e.g., Sufi 2007), our findings show that forward guidance innovations
increase the number of lenders in the syndicate and lower the share held by lead banks. The
results from these analyses further imply that, by alleviating informational asymmetry concerns,
forward guidance intensifies the banks’ willingness both to lend and to lend at lower cost.
The rest of the paper proceeds as follows. Section 2 places our paper within the extant
literature, discusses the theoretical background of our study, and formulates our testable
hypotheses. Section 3 discusses the data and our empirical model, emphasizing the importance
of distinguishing between Odyssean and Delphic forward guidance. Section 4 discusses our
solutions to the identification problems. Section 5 presents our empirical results and discusses
the implications for our hypotheses. Section 6 concludes.

5
2. Theoretical considerations and hypothesis development
2.1. The credit channel of monetary policy
The prevailing mechanism for the transmission of monetary policy is through the interest-rate
channel. A monetary tightening, along with the combination of sticky prices and rational
expectations, increases the real long-term interest rate. This, in turn, lowers investment
spending and aggregate demand, yielding reduced output. In reexamining the transmission
mechanism, both Bernanke and Blinder (1988) and Bernanke and Gertler (1995) suggest that
the response to interest rate changes can be considerably larger than that implied by the
conventional interest rate channel, and they put forth the role of the credit channel, further
separated into the bank-lending channel and the balance sheet channel.
The bank-lending channel suggests that a monetary contraction reduces bank deposits,
yielding a reduction in bank lending and the aggregate loan supply.1 In turn, the balance sheet
channel (Bernanke, Gertler, and Gilchrist 1999) suggests that shifts in monetary policy affect
the financial position of both borrowers (e.g., firms, households, and consumers) and private
agents. A contractionary monetary policy reduces borrowers’ net worth, which triggers an
increase in agency costs and motivates banks to reallocate the loan supply from riskier to safer
borrowers.
The simultaneous low interest rates and increase of bank risk-taking on the road to the
global financial crisis triggered renewed discussion on the credit channel. The key premise is
that a prolonged period of low interest rates leads to excessive bank risk-taking for three
reasons (Borio and Zhu 2012; Delis, Hasan, and Mylonidis 2017). First, low nominal interest
rates lower the intermediation margin and induce a search for yield mechanism through the
financing of riskier loans. Second, low rates lead to risk downsizing by banks through the
1 There is voluminous empirical literature on the bank-lending channel (e.g., Kashyap and Stein 2000; Kishan and Opiela 2000 and 2012; Jayaratne and Morgan 2000; Ashcraft 2006; Jiménez, Ongena, Peydró, and Saurina 2014), showing that banks with relatively weak balance sheets reduce loan supply during monetary contractions.

6
higher asset and collateral values, and firms’ net worth. Third, the commitment of a central
bank for lower future interest rates in the case of a threatening shock reduces the probability of
large downside risks, thereby encouraging banks to assume greater risk (the transparency
effect). Several studies empirically show a potent risk-taking channel of monetary policy (e.g.,
Ioannidou, Ongena and Peydró 2015; Jiménez, Ongena, Peydró, and Saurina 2014;
Dell’Ariccia, Laeven, and Suarez 2017; Delis, Hasan, and Mylonidis 2017).
The third mechanism of the risk-taking channel (working via central bank commitment)
is particularly important for our work. This effect, also known as the Greenspan or Bernanke
put, operates through expected lower interest rates rather than through the current low rates
themselves. Theoretically, anticipated interest rate reductions tend to correspond to a higher-
risk position when there is greater room for monetary expansion—that is, when current rates
are relatively high (De Nicolò, Dell’Ariccia, Laeven, and Valencia 2010). When current rates
are close to the zero lower bound, however, the focus turns to the effects of unconventional
policy tools. In the next section, we discuss how forward guidance in particular might affect
bank lending and loan pricing.
2.2. Forward guidance and the cost of corporate loans
Since the FOMC cut interest rates to the zero lower bound in December 2008, forward guidance
and quantitative easing have become the key policy tools for monetary accommodation. The
theoretical foundation of the effects of these tools is with macroeconomic models of forward-
looking beliefs and expectations. Krugman (1999) was among the first to note that, at the zero
lower bound, central banks can stimulate output by providing guidance that commits to
generate inflation. In theory, such commitments affect private expectations ex ante (Woodford
2003; Galí 2008).

7
Eggertsson and Woodford (2003) show that commitment to future policy rates affects
the entire path of expected future interest rates, and this dynamic in turn influences economic
activity. Accordingly, Krishnamurthy and Vissing-Jorgensen (2011) find that FOMC guidance
concerning asset purchase programs significantly increased asset prices. To explain these
effects, Justiniano, Primiceri and Tambalotti (2011) use a macroeconomic model in which
forward guidance influences both private and public expectations about the future path of the
economy and alleviates uncertainty. Romer and Romer (2004) and Ellingsen and Söderström
(2001) show that the use of explicit forward-guidance language facilitates changes in economic
outcomes.
Central bank guidance is not always sufficiently clear and quantifiable, however, and
as a result, its effects are questionable. Campbell, Evans, Fisher, and Justiniano (2012) study
public statement announcements made by the FOMC. They distinguish between “Odyssean”
forward guidance, which commits policymakers to specific future actions of monetary policy
at a specific date (i.e., state- and time-dependent commitment), and “Delphic” forward
guidance, which provides communication about future economic developments and intended
monetary policy actions. Working along these lines, Carlstrom, Fuerst, and Paustian (2015)
and Campbell, Fisher, Justiniano, and Melosi (2017) theoretically show that an explicit promise
by the central bank to keep interest rates below the natural rate of interest for a time horizon of
two years causes a significant increase in output.2
The relevant empirical literature is scant, whereas the effect of forward guidance on
banks’ loan pricing is, to the best of our knowledge, novel research. Our first hypothesis is that
apart from (over and above) the direct effect of short-term rates on banks’ incentives (i.e., apart
2 Other studies are more sceptical about the potency of these effects. McKay, Nakamura, and Steinsson (2016) question the magnitude of the effects of forward guidance on the real economy in the long-term. Hagedorn, Luo, Manovskii, and Mitman (2019) focus on the power of forward guidance in a liquidity trap and suggest that its effects are negligible. Angeletos and Lian (2018) provide an explanation on the so-called “forward guidance puzzle” by relaxing the assumption that agents have common understanding on the central ba nk’s policy announcement. Their findings suggest that the effectiveness of forward guidance is time- and agent-dependent.

8
from the usual effect of the interest rate channel), the central bank communication policies
affect the cost of loans. Transparency, commitment, and guidance about the future monetary
policy path, as well as the specific time-dependent binding actions communicated by the
FOMC, reduce informational asymmetries between the central bank and lenders. The same
effects prevail for the private decision makers’ uncertainty about future economic and financial
outcomes. This implies that anticipated interest rates induce forward-looking expectations
about banks’ funding costs, so that future corporate loan spreads are also better anticipated.
In theory, we should then observe that expansionary forward guidance lowers the cost
of loans. Two notable issues lie behind this prediction. First, any empirical findings should be
first and foremost about Odyssean forward guidance, which provides the most explicit path for
future monetary policy. The effect of Delphic forward guidance does not lower the relevant
informational asymmetries and should have a much lesser effect (if any) on the cost of bank
loans. Second, our prediction is the opposite of the risk-taking channel’s prediction, which
suggests that in light of low interest rates, banks will charge higher loan spreads on average
because they will expand lending to more-risky borrowers. The effect of forward guidance
mitigates informational asymmetries via increased transparency and commitment. Thus,
expansionary forward guidance should reduce the cost of loans despite the opposite effect of
short-term interest rates. For obvious reasons, this dynamic should be especially true for the
cost of credit for existing (as opposed to new) borrowers.
To this end, we formulate our first hypothesis as follows:
H1: Expansionary Odyssean forward guidance lowers the cost of loans.
Very similar to the mechanisms of the bank-lending channel, forward guidance should
have heterogeneous effects across banks with different balance sheet characteristics. A key

9
bank characteristic in recent literature about the bank-lending channel is bank capitalization
(Jiménez, Ongena, Peydró, and Saurina 2014; Delis, Hasan, and Mylonidis 2017). The
theoretical reason behind the role of bank capitalization is that it represents a measure of the
bank’s ability to expand credit in conjunction with any agency conflict that besets banks’ own
borrowing from their financiers (Holmstrom and Tirole 1997; Freixas and Rochet 2008;
Jiménez, Ongena, Peydró, and Saurina 2014).
Better-capitalized banks are better able to pass changes in forward-looking expectations
along to lending rates. Specifically, in light of expansionary forward guidance and the
associated developments highlighted under H1, the availability of bank capital implies lower
loan spreads to existing borrowers or attractive rates for new borrowers. Moreover, in a period
of low interest rates (as is the case when central banks use forward guidance), bank asset
valuation increases, thereby increasing the availability of bank capital (Dell’Ariccia, Laeven
and Marquez 2014). We expect that banks with already high levels of capital will benefit the
most from such valuation effects, thereby allowing them to offer their borrowers the most
attractive loan spreads.
Given the potentially important role of bank capitalization in the relation between
forward guidance and loan cost, we formulate our second hypothesis as follows:
H2: The negative effect of Odyssean forward guidance on the cost of loans will be more potent
for loans originated by highly capitalized banks.
Regardless of its financial condition, every bank aims to lend to borrowers that
maximize the bank’s returns. Especially in the corporate loan market, the pool generally
includes a mix of relatively low-risk borrowers and relatively high-risk borrowers. For a fixed
level of bank capital, we expect that expansionary forward guidance will boost the mechanisms

10
underlying the risk-taking channel in the form of lending to riskier borrowers. The two key
firm characteristics indicating firms’ health are the ratio of risk-adjusted returns (Z-score) and
leverage. When expansionary forward guidance occurs, better-capitalized banks will probably
be the ones expanding lending (via the associated mechanisms highlighted in our second
hypothesis). If a risk-taking channel is at work, banks (especially the better-capitalized ones)
should decrease the cost of loans more for risky and leveraged firms.
To be clear about our premise here, consider an example of the same bank lending to
the same firm twice within one year. The first loan originates during the period before
expansionary forward guidance, and the second originates after expansionary forward guidance.
The better-capitalized banks are more likely than less-capitalized banks to offer loans at lower
rates but also to further decrease those rates for relatively risky firms. Thus, the lending-rate
reduction would be more potent for risky firms compared with less risky ones (those that
already have access to relatively low rates).
Accordingly, we formulate our third testable hypothesis as follows:
H3: The negative effect of Odyssean forward guidance on the cost of loans will be more potent
for loans originated by highly capitalized banks and to relatively riskier borrowers.
3. Data and variables
Table 1 summarizes all the variable definitions and the data sources. Our variables include
measures of forward guidance, bank and firm characteristics, loan characteristics, and
macroeconomic characteristics.
(Please insert Table 1 about here)

11
3.1. Forward guidance
We measure forward guidance from the forward-looking language used in statements released
by the FOMC after every meeting. Approximately eight regular FOMC meetings take place
each year, but not every post-meeting statement contains a clear guidance message to the public.
For example, the phrase “policy accommodation can be removed at a pace that is likely to be
measured,” which appeared in several 2004 statements, provides no specific guidance about
the Fed’s forward-looking policy intentions.
Since the 2008 global financial crisis, however, the FOMC began providing explicit
forward guidance within its statements in order to improve macroeconomic outcomes by
affecting agents’ expectations. Campbell, Evans, Fisher, and Justiniano (2012) distinguish
between two types of forward guidance: Odyssean forward guidance, in which policymakers
publicly commit to a particular course of action; and Delphic forward guidance, which broadly
discusses macroeconomic conditions and likely monetary policy actions without binding the
central bank to future courses of action. The authors find that the use of Odyssean forward
guidance effectively stimulates the economy. For this reason, our empirical analysis mainly
considers Odyssean forward guidance from October 2008 onward, which corresponds to the
first post-FOMC meeting statement with an accommodating forward guidance since 2004. We
use Delphic guidance as placebo tests, under the premise that their effect must be considerably
weaker.
The policy stance and the communicative language used in the statements can remain
unchanged across several meetings if the committee so desires. Therefore, we consider only
new guidance issued to the public, wherein the forward-looking language changed significantly
from the previous statement. We construct forward guidance indicator variables corresponding
to the month when the relevant statement is publicly released. In constructing the variables, we

12
also note the direction of forward guidance, because an accommodative monetary policy and a
tightening monetary policy are expected to affect bank lending differently.
More precisely, for a given loan origination month t, we define the following: 𝐹𝑜𝑟𝑤𝑎𝑟𝑑 𝑔𝑢𝑖𝑑𝑎𝑛𝑐𝑒 (𝑡 − 𝑛) ={ 1, if the most recent expansionary guidance is provided 𝑛 month(s) ago−1, if the most recent contractionary guidance is provided 𝑛 month(s) ago 0 0 0, otherwise , (1)
where n = 1, 2, 3. The three forward guidance variables described in Eq. (1) measure whether
the FOMC forward guidance was in play one, two, or three months before the loan origination
date. As an alternative measure, we consider a quarterly forward guidance variable, which takes
the value 1 if expansionary guidance was issued in the previous quarter, –1 for contractionary
guidance, and 0 otherwise.
This procedure yields 19 changes in Odyssean forward guidance since the global
financial crisis, similar to the ones considered in the literature (Rudebusch and Williams 2008;
Campbell, Evans, Fisher, and Justiniano 2012; Swanson 2016; and others). Appendix Table
A1 lists the dates of Odyssean forward guidance and the relevant key forward-looking phrases
within the statements. Our sample begins in May 1999, when the FOMC began disclosing
information about the future stance of monetary policy in its post-meeting statements.
3.2. Loan-level variables
We match the FOMC statement dates with syndicated loan data, obtained from Thomson
Reuters LPC’s DealScan. An important feature of this data is that it records new loans, along
with their origination date, the spread over LIBOR, loan maturity, status of seniority, and
identities of lenders and borrowers. We exclude loans obtained by financial companies (SIC
codes 6000–6999) and loans without pricing or maturity information. We match borrowers

13
with their financial information using the Chava and Roberts (2008) DealScan–Compustat link
table. Next, we manually match the lead arrangers’ names and cities with call reports (for
standalone commercial banks) or with FR Y-9C reports (for bank holding companies). This
matching procedure allows us to obtain the lender’s financial statements at the time of loan
origination. Our full sample consists of 20,615 syndicated loans to 3,834 US firms from 329
US banks initiated from May 1999 to June 2017.
Among the loan-level variables, our key outcome variable is the all-in spread drawn
(AISD), which reflects the total (including fees and interest) annual spread paid over LIBOR
for each dollar drawn down from the loan. The literature uses this variable to identify the risk-
taking channel using syndicated loans (Delis, Hasan, and Mylonidis 2017; Paligorova and
Santos 2017). Ceteris paribus, a higher loan spread is an ex ante indicator of higher bank risk-
taking because it reflects a riskier borrower (demand-side risk) or a riskier stance by bank
management (supply-side risk).
We consider a large set of loan-level control variables, including loan amount (in USD
million), loan maturity (in years), type of loan (term loan or credit line), loan purpose (corporate
purpose, debt repayment, or working capital), loan category (secured or unsecured), use of
dividend restrictions, and the number of lenders in the syndicate. These variables capture a rich
set of information on the banks’ syndication process and control for loan-level heterogeneity.
3.3. Bank, firm, and macroeconomic characteristics
Concerning bank-level variables (quarterly data), and following our theoretical considerations,
we first use the capital ratio (Capital) as our key identifier of banks’ willingness to give out
new loans following forward guidance innovations. Moreover, we use the log of total assets, a
liquidity ratio, the bank’s return on assets (ROA), and the bank’s quarterly net loan charge-offs
to proxy for additional elements of bank health. At the firm level, and following out theoretical

14
discussion, our key proxies for firm risk are the book leverage and Altman’s Z-score. The firm
and bank variables are quarterly and enter our empirical model lagged once before a loan
origination.
We aim to identify the effect of forward guidance over and above the general monetary
conditions, and thus we control for the quarterly shadow rate (Krippner 2015). This measure
captures the effect of both the federal funds rate and (importantly) the effect of quantitative
easing after the financial crisis, when interest rates were constrained at the zero lower bound.
We also control for within-year changes in the macroeconomic environment using the quarterly
GDP growth rate and the CBOE Volatility Index (VIX).
3.4. Summary statistics
Table 2 reports summary statistics for the variables used in our analysis, distinguishing between
the pre-crisis period (May 1999 to September 2008) and the crisis and post-crisis period
(October 2008 to June 2017). Our sample includes 13,122 syndicated loans in the pre-crisis
period and 7,493 loans in the crisis and post-crisis period. In Appendix Table A2, we report
summary statistics for the full sample period.
The average AISD in the pre-crisis period is 181 bps, rising to 235 bps from October
2008 onward. We observe equivalent increases for loan amount and maturity. Notably, the
proportion of loans offered for corporate purposes more than doubles (from 32% to 67%) after
October 2008, whereas the other loan-purpose groups shrink during the same period. This trend
explains the increase in credit lines vis-à-vis term loans. In terms of the syndicate composition,
we observe a slight increase in the average number of lenders.
The relevant figures for bank and firm characteristics follow our theoretical priors and
empirical literature. We observe increases in the average bank capital and liquidity ratios,
whereas ROA drops from 0.7% to 0.4%. In addition, the average quarterly net loan charge-offs

15
increase from 0.1% to 0.2%. The average borrower’s debt composition increases; however, the
average Z-score slightly improves.
(Please insert Table 2 about here)
4. Identification method
For identification purposes, we conduct our analysis at the lead bank-loan facility level3 and
estimate the following model: 𝑙𝑜𝑔𝐴𝐼𝑆𝐷𝑙,𝑓,𝑏,𝑡 = 𝑎𝑓,𝑦 + 𝛿𝑛𝐹𝑜𝑟𝑤𝑎𝑟𝑑 𝑔𝑢𝑖𝑑𝑎𝑛𝑐𝑒 (𝑡− 𝑛) + 𝛼𝑆ℎ𝑎𝑑𝑜𝑤 𝑟𝑎𝑡𝑒𝑡−1 + 𝜷′𝑿𝒍,𝒕 + 𝜸′𝒀𝒃,𝒕−𝟏 + 𝝓′𝒁𝒇,𝒕−𝟏 + 𝝌′𝑬𝒕−𝟏 + 𝜀𝑙,𝑓,𝑏,𝑡 . (2)
The dependent variable, 𝑙𝑜𝑔𝐴𝐼𝑆𝐷𝑙,𝑓,𝑏 ,𝑡, is the natural log of the AISD of a syndicated loan (𝑙)
to firm (𝑓) from bank (𝑏) at time (𝑡). Forward guidance is the indicator variable capturing
Odyssean forward guidance issued one, two, or three months before the loan origination date,
as defined in Eq. (1). In addition, 𝑿𝒍, 𝒀𝒃, 𝒁𝒇, and E are vectors representing the loan, bank, firm,
and macroeconomic control variables, respectively. Our coefficient of interest is 𝛿𝑛, which is
expected to capture the negative effect of expansionary forward guidance on the loan spread
(based on H1).
Our identification strategy confronts three interrelated identification problems
(Ioannidou, Ongena, and Peydró 2014; Delis, Hasan, and Mylonidis 2017). The first is the fact
that any monetary policy innovation must affect new risk. Using syndicated loan data and the
3 This means that we have observations for each lead bank in our sample. Thus, we can have repeated observations for the same loan facility if that loan facility originates by more than one lead bank. This practice substantially improves our identification approach resulting from the use of firm × year fixed effects, as thoroughly discussed later. Moreover, the unit of our analysis is the loan facility, not the loan package. The loan facility refers to each individual portion of a deal (the package), with one package usually comprising multiple loan facilities. Loan facilities may have different starting dates, spreads, maturity, amount, and loan types. Hence, multiple loan facilities, even when in the same loan deal, are not fully dependent observations— simply adding facilities and ignoring their differences, for example, may introduce a bias in the estimates. The firm may use different loan facilities of the same package within a year, which introduces the heterogeneity allowing the use of firm × year fixed effects.

16
respective new loan facilities originated in the three months after forward guidance innovations
provides the key to solving this problem.
Second, we must effectively control for types of monetary policy other than f orward
guidance. Using the shadow rate symmetrically with Forward guidance, as shown in Eq. (2),
essentially achieves this goal. In other words, we extract the effect of forward guidance from
the total effect of monetary policy as captured by the shadow rate.
Third, any model of the risk-taking channel aims to identify shifts in loan supply from
shifts in loan demand. To this end, and in line with our testable hypotheses, we use a mix of
fixed effects and interaction terms with bank and firm characteristics (Delis, Hasan, and
Mylonidis 2017; Paligorova and Santos 2017). Thus, we consider a highly saturated model
with triple interactions of Forward guidance with bank capitalization and firm risk, along with
suppressing the effect from demand side using firm × year fixed effects.
The firm × year fixed effects are very important because they control for time- (year-)
variant demand (firm) characteristics. Including these fixed effects comes at the expense of
limiting our inferences from changes in loan spreads for firms obtaining at least two loans
within the same year: Obviously, the number of these loan facilities is relatively small
compared with our full sample. The structure of syndicated loans, however—with many lead
banks that naturally have different characteristics—eases concerns about limiting our sample.
To this end, the triple interaction term with Capital serves to improve the information extracted
from the model. The reasons are that (i) banks provide many syndicated loans in the same year,
(ii) Capital is observed at a quarterly level, and (iii) Capital is different across observations
even for the same loan facility if many lead banks provide the loan.
Formally, we estimate the following model: 𝑙𝑜𝑔𝐴𝐼𝑆𝐷𝑙,𝑓,𝑏,𝑡 = 𝑎𝑓,𝑦 + 𝛿𝑛𝐹𝑜𝑟𝑤𝑎𝑟𝑑 𝑔𝑢𝑖𝑑𝑎𝑛𝑐𝑒 (𝑡− 𝑛) + 𝜆1𝑛𝐹𝑜𝑟𝑤𝑎𝑟𝑑 𝑔𝑢𝑖𝑑𝑎𝑛𝑐𝑒 (𝑡− 𝑛)𝐶𝑎𝑝𝑖𝑡𝑎𝑙𝑏,𝑡−1 + 𝜆2𝑛𝐹𝑜𝑟𝑤𝑎𝑟𝑑 𝑔𝑢𝑖𝑑𝑎𝑛𝑐𝑒 (𝑡− 𝑛)𝑅𝑓,𝑡−1 + 𝜆3𝑛𝐹𝑜𝑟𝑤𝑎𝑟𝑑 𝑔𝑢𝑖𝑑𝑎𝑛𝑐𝑒 (𝑡− 𝑛)𝐶𝑎𝑝𝑖𝑡𝑎𝑙𝑏,𝑡−1𝑅𝑓,𝑡−1 +

17
𝛼𝑆ℎ𝑎𝑑𝑜𝑤 𝑟𝑎𝑡𝑒𝑡−1 + 𝜃1𝑆ℎ𝑎𝑑𝑜𝑤 𝑟𝑎𝑡𝑒𝑡−1𝐶𝑎𝑝𝑖𝑡𝑎𝑙𝑏,𝑡−1 + 𝜃2𝑆ℎ𝑎𝑑𝑜𝑤 𝑟𝑎𝑡𝑒𝑡−1𝑅𝑓,𝑡−1 + 𝜃3𝑆ℎ𝑎𝑑𝑜𝑤 𝑟𝑎𝑡𝑒𝑡−1𝐶𝑎𝑝𝑖𝑡𝑎𝑙𝑅𝑓,𝑡−1 + 𝜃4 𝐶𝑎𝑝𝑖𝑡𝑎𝑙𝑏,𝑡−1𝑅𝑓,𝑡−1 + 𝜷′𝑿𝒍,𝒕 + 𝜸′𝒀𝒃,𝒕−𝟏 + 𝝓′𝒁𝒇,𝒕−𝟏 + 𝝌′𝑬𝒕−𝟏 + 𝜀𝑙,𝑓,𝑏,𝑡 , (3)
where Capital is the capital ratio of bank (𝑏) and 𝑅𝑓 is the firm risk measure (Book leverage
or Z-score). The focus of the analysis concerns the interaction terms. In line with H2, a negative
and statistically significant 𝜆1𝑛 implies that the negative effect of expansionary forward
guidance is more pronounced for highly capitalized banks. In line with H3, a positive 𝜆3𝑛
indicates that the negative effect of expansionary forward guidance will be less pronounced for
highly capitalized banks that lend to riskier borrowers. We symmetrically control for the effect
of conventional monetary policy by including the interactions of shadow rate with the bank
capital ratio and firm risk measures.
Eq. (3) represents a model that tests our three hypotheses while effectively mitigating
the three identification problems. First, it identifies the pricing of new loans in the three months
following forward-guidance innovations. Second, the model disentangles the effect of the
general monetary environment from the effect of forward guidance. Third, the model saturates
shifts in loan supply from shifts in loan demand via the fielding of firm × year fixed effects and
the double and triple interaction terms (directly following the paradigm of , e.g., Kashyap and
Stein 2000; Jiménez, Ongena, Peydro, and Saurina, 2014; Ioannidou, Ongena, and Peydro,
2015; and many others henceforth).
5. Empirical results
5.1. Results from the model without interaction terms
Table 3 reports the results from the estimation of Eq. (2), which serves as a benchmark to show
the overall effects of the monetary environment on loan spreads. Columns 1 to 4 report the

18
results for the Odyssean forward guidance. The results show that loan spreads decrease
subsequent to expansionary forward guidance of an Odyssean nature. The effect is highest on
loans originating two months after the forward guidance is issued.4 This result is expected
because the syndication process (book-running stage) usually takes several weeks to complete.
We calculate the economic effect of forward guidance on loan spreads using the
estimation results in column 4 and report them in the lower part of Table 3. Odyssean forward
guidance issued one month ago decreases the spread of a new syndicated loan by 31.26 bps or
13.3% compared with the loan with an average spread (that equals 235 bps). The effect hits the
peak after two months with an equivalent 15.7% reduction in loan spread, corresponding to
36.90 bps. The corresponding reduction of interest expenses of a loan with average size and
maturity issued one month after Odyssean guidance is USD7.7 million (= USD 615 million
31.26 bps 4 years).
Columns 5 to 8 report the results for Delphic forward guidance. This exercise serves as
a placebo test, given that Delphic forward guidance does not reflect explicit commitment.
Further, this test substantially reduces the possibility that unobserved factors associated with
FOMC meetings affect the syndicated loan market. Further, in columns 9–12, we examine the
effect of forward guidance before the financial crisis. Because Odyssean guidance emerged
after the financial crisis and as the policy rates touched the zero lower bound, we also expect
the effect of forward guidance to be negligible prior to the crisis. Indeed, the coefficients on
forward guidance are never significant in these falsification tests.
(Please insert Table 3 about here)
Figure 1 provides a graphical representation of how forward guidance affects loan
spreads across different sample periods. Similar to Welch and Goyal (2007), we undertake the
4 Forward guidance issued more than three months before loan originations is found to be insignificant in the empirical tests.

19
following procedure. We estimate three regression models—benchmark model, shadow rate
model, and forward guidance model—using a three-year monthly moving estimation window,
and record their root-mean-square errors (RMSEs). The benchmark model regresses loan
spreads on the loan, bank, firm, and macroeconomic control variables. The shadow rate model
includes the shadow rate as an additional independent variable to the benchmark model. The
forward guidance model includes both the shadow rate and the forward guidance variables to
the benchmark model, as in Eq. (2). Next, the performance of the shadow rate model is
calculated as the cumulative RMSE of the benchmark model minus the cumulative RMSE of
the shadow rate model. Analogously, we calculate the performance of the forward guidance
model over and above the benchmark model. Finally, we plot line graphs of the performance
of both the shadow rate model and the forward guidance model over time.
This graph is informative because when the line shows an upward movement, the
benchmark model is weaker than the preferred model (i.e., the shadow rate model or the
forward guidance model). Similarly, when the line shows a downward movement, the
benchmark model performs better than the preferred model. Because the difference in
cumulative errors is plotted over time in the line graph, we can gauge the performance of a
preferred model for any given sample period. That is, if any two given points on the graph form
an upward curve, the preferred model contributes explanatory power to the loan spread during
the period between those two points.
In Figure 1, the dashed (dotted) line is the cumulative RMSE of the benchmark model
minus the cumulative RMSE of the forward guidance model (shadow rate model). The gap
between the two lines represent the extra explanatory power that forward guidance adds to the
model over and above the shadow rate. In the beginning of the sample period, the two models
both outperform the benchmark model but are quite close to each other. The gap widens around
the third quarter of 2008. This widening coincides with the FOMC’s statement with forward

20
guidance issued on October 8, 2008, which was the first accommodating Odyssean forward
guidance since May 4, 2004 in our sample. Since 2008, the forward guidance model has
provided significant explanatory power over and above the shadow rate model.
(Please insert Figure 1 about here)
Overall, consistent with H1, we find that forward guidance significantly affects
corporate loan spreads since the beginning of the financial crisis.
5.2. Results from the model with interaction terms
In Table 4, we report the results from the estimation of Eq. (3), which allows testing H2 and
H3. Moreover, as highlighted in Section 4, this model significantly improves the empirical
identification of the supply-side effects of forward guidance, by increasing the informational
content of our data using interaction terms in conjunction with the firm × year fixed effects.
Given the results from Eq. (2), we focus on the crisis and post-crisis period because this is
where we identify significant effects of Odyssean forward guidance.
Two important findings emerge from the results in Table 4. First, the negative effect of
forward guidance at t – 1 and t – 2 seems to be more potent for the well-capitalized banks. In
Appendix Table B1, we show that this remains the case when we do not include the triple
interaction terms within the specification. Based on the estimation in column 4 in Table B1,
the additional percentage reduction on loan spreads offered by highly capitalized banks (75th
percentile) compared with less capitalized banks (25th percentile) is 8.60%, after expansionary
forward guidance was issued two months before. Thus, consistent with H2, the results show
that the negative effect of forward guidance on loan spread intensifies for loans by highly
capitalized banks. Moreover, this finding is consistent with the negative effect of forward
guidance being supply-driven.

21
Second, consistent with H3, the negative coefficient on the triple interactions at t – 1
and t – 2 show that the negative effect of Odyssean forward guidance on the cost of loans is
more potent for loans originated by highly capitalized banks and to relatively riskier borrowers.
The results are fairly similar irrespective of whether we add the forward guidance terms
separately for the three periods t – 1 to t – 3 (results in columns 1 to 3) or whether we add all
terms in one specification (results in column 4); the significant terms are always those including
the first two lags. Further, our results are similar irrespective of the variable used to proxy firm
risk. In the first four columns, we use Book leverage (higher values reflect higher firm risk,
and hence the coefficient on the triple term is negative), and in the last four columns, we use
Z-score (higher values reflect lower firm risk, and hence the coefficient on the triple term is
positive).
This is the key finding of our paper, suggesting that banks—especially those with
higher capital ratios—take on more risk after forward guidance, as evidenced by their
willingness to offer cheaper loans to riskier firms. To provide inferences on the economic
magnitude of the risk-taking effects for highly capitalized banks, we report in the lower part of
Table 4 the marginal effects of the difference-in-difference—the additional percentage
reduction on loan spreads offered to riskier firms (25th percentile) compared with safer firms
(75th percentile) by highly capitalized banks (75th percentile), over and above the reduction
offered by less capitalized banks (25th percentile). Based on model specification (4) with book
leverage, a highly capitalized bank reduces the loan spread by 19.56% (13.66%) more than a
less capitalized bank one month (two months) after expansionary forward guidance, for a
borrowing firm with a weaker capital structure. Similarly, based on model specification (8)
with Z-score, the loan spread difference offered by highly versus less capitalized banks for
riskier borrowers are 12.48% (6.38%) lower than for safer borrowers, after expansionary
forward guidance one month (two months) before. The risk-taking effect is strongest in the

22
month after forward guidance, declines two months after the forward guidance, and is
insignificant in the third month.
Note that the shadow rate and its interaction terms are also statistically significant. This
result is as expected, because the shadow rate reflects the general monetary policy stance and
represents the effects of quantitative easing after the financial crisis. Nonetheless, and quite
importantly, the effects of forward guidance prevail over and above the effects from the shadow
rates.
(Please insert Table 4 about here)
5.3. Additional sensitivity tests
We conduct a series of additional sensitivity tests. First, we examine whether our findings
continue to hold when we use a quarterly measure of forward guidance, which records whether
Odyssean guidance was in play in the previous quarter (as defined in Section 3.1.1.). This
analysis provides an aggregate reflection on the effects of forward guidance compared to the
monthly measures used so far. We repeat the estimation of Eqs. (2) and (3) and find that
forward guidance issued in the previous quarter reduces loan spreads by 11% (column 1 of
Table 5). Further, irrespective of the measure used to proxy firm risk, the triple interactions are
statistically significant, consistent with the results in Table 4.
Second, we consider the effective federal funds rate, instead of the shadow rate, in the
estimation of Eqs. (2) and (3). The effective federal funds rate is the most straightforward
monetary policy tool used in previous research, but it disregards the novel monetary policy
tools implemented in the crisis and post-crisis periods. Table 6 replicates the results of Table
3, and Table 7 replicates those of Table 4, using the federal funds rate. We note that the
estimated effects of forward guidance are consistent with our baseline inferences.
(Please insert Tables 5, 6, and 7 about here)

23
Next, we split our sample into term loans and credit lines. These groups constitute the
vast majority of originations (about 95%) but have some important differences. Although term
loans provide new borrowers with one-time financing, credit lines allow new borrowers to
revolve their debt. Notably, several term loans appeal to institutional investors (non-bank
lenders) rather than banks. These loans typically include weak covenants, longer maturities,
and low amortization, which would have high capital requirements if banks were to hold them.
Given that banks tend not to hold such loans, we expect that our effects are stronger for credit
lines. The results reported in Appendix Table B1 show that forward guidance significantly
decreases the spreads for both term loans and credit lines, and this is the reason we keep both
groups in our baseline specifications. In line with our expectations, however, the economic
effect is stronger for credit lines.
Importantly, our results are robust to the inclusion of additional fixed effects.
Specifically, in alternative specifications, we include bank and firm fixed effects, bank × year
fixed effects, and bank × firm fixed effects. These fixed effects further saturate our model from
the time-invariant bank and firm characteristics, time-varying bank characteristics, and bank–
firm pair characteristics, respectively. The results in Appendix Tables B3 to B8 replicate those
of Tables 3 to 7, and show that all our main results remain essentially unchanged.
Finally, to ease any concerns that our baseline results are affected by other
macroeconomic factors such as credit risk and bond market conditions, in Tables B9 and B10
we additionally control for credit spread (Moody’s AAA–ABB corporate bond spread) and the
three-month T-bill rate. The results are again robust to the inclusion of these additional
variables.

24
5.4. Forward guidance and borrower-lender relationships
An important element in banks’ loan pricing decisions is their relationship with the borrowers.
Because of the related informational asymmetries, establishing new borrower relationships is
riskier than providing loans to borrowers with already well-established credit relationships.
The reduction in macroeconomic uncertainty following forward guidance implies that lenders
might be willing to take more risk by providing loans to new borrowers. We trace the history
of each borrower–lender relationship and define new borrowers as firms that have not
borrowed a syndicated loan from a specific lead bank in the recent past. We consider three
scenarios in which borrower relationships did not exist in the previous three, five, or eight years.
We first examine the effect of forward guidance on the establishment of a new lending
relationship. Table 8 reports probit estimates for the outcome variable, which takes the value 1
if the loan involves a new borrower and 0 otherwise. In the first three columns, we use the full
sample, and subsequently we differentiate between term loans and credit lines. Evidently, the
results come from credit lines, and we find no effect of forward guidance on the probability of
issuing term loans to new borrowers. More specifically, we find that the probability of
establishing new credit lines significantly increases two months after expansionary forward
guidance. This result implies that establishing new relationships for credit lines takes more
time compared with equivalent effects for existing borrower–lender relationships. Further,
there is virtually no effect of forward guidance for term loans, which mostly inv olve
institutional investors.
Next, we examine whether banks provide cheaper credit to new borrowers following
forward guidance innovations. Table 9 analyzes the spreads that banks charge for new term
loans and credit lines issued to new borrowers (as compared with the respective effects for
existing borrowers). The results show that, although new borrowers receive higher spreads (as
expected and reflected on the main term of New borrower), the negative effect of forward

25
guidance on loan spreads is more potent for new borrowers. For term loans, the effect is
significant two months after forward guidance, and for credit lines, the forward guidance effect
kicks in after three months. Consistent with our expectations, the results are economically more
significant for credit lines. Overall, we find evidence of banks engaging in new risks in the
presence of forward guidance, by initiating new borrower–lender relationships and offering
lower spreads to new borrowers.
(Please insert Tables 8 and 9 about here)
5.5. Forward guidance and the structure of syndicated loans
By reducing informational asymmetries on the stance of monetary policy and related firm
financing costs, forward guidance also reduces the frequency of lenders’ information
acquisition and can thus reflect differences in loan syndicate structure. Sufi (2007) and others
thereafter note that in light of lower informational asymmetry problems, the lead arrangers
keep smaller loan shares and form less concentrated loan syndicates, given that less monitoring
effort is required to provide the right incentives to participant investors. We thus expect these
effects to prevail following expansionary forward guidance.
We measure syndicate structure using the share held by the leader arrangers, the
Herfindahl–Hirschman index (HHI) based on the shares of all lenders, and the number of
participants. We also consider the borrowing firms’ reputation through repeated borrowing in
the syndicated loan market. To this end, we use the number of a firm’s previous loan deals in
the syndicated loan market.
We conduct these empirical tests at the loan-package level (as opposed to the loan-
facility level) because the loan structure does not change within a loan package. Table 10
reports the results. Consistent with our expectations, we find that forward guidance reduces the
share held by lead arrangers and the syndicate’s HHI, and it increases the number of new

26
participants. The positive sign of the interaction term with borrower reputation in column (1)
shows that lead arrangers take a smaller stake in a deal with a less reputable borrower after
forward guidance. Similarly, in column (2), the positive interaction term with borrower’s
reputation indicates that a deal is less concentrated for a less reputable borrower after forward
guidance. We conclude that in addition to affecting loan spreads, expansionary forward
guidance eases the lead banks’ monitoring efforts and allows larger loan syndicates.
(Please insert Table 10 about here)
6. Conclusions
Following the Great Recession and the monetary policy rates hitting the zero lower bound,
unconventional tools have taken up a key role for both policymakers and researchers. Forward
guidance, in particular, affects the real economy by creating expectations about the future
course of monetary policy. In this study, we consider for the first time the effects of forward
guidance on bank lending, using data from the syndicated loan market.
Our analysis features three novel findings. First, Odyssean forward guidance decreases
the loan spreads on newly issued syndicated loans in the next three months. The effect is
economically significant in the first two months after a forward guidance innovation, peaking
with a 15.7% reduction in loan spreads. This effect corresponds to a 36.90-bp reduction in
spreads or a USD 7.7 million reduction in the cost of a loan with mean size and maturity.
Second, the effect of forward guidance on loan spreads is more potent for highly
capitalized banks, especially when those highly capitalized banks lend to firms with weaker
capital structure or higher default probability. For example, a highly capitalized bank reduces
the loan spread by an average 17% more than a less capitalized bank for a borrowing firm with
a weak capital structure in the one to two months after expansionary forward guidance.

27
Third, expansionary forward guidance allows a higher probability of establishing new
bank–firm relationships, lowers the spreads of such loans, and reduces syndicate concentration
(more banks enter the syndicate and the lead bank holds a lower loan share). These effects are
consistent with the lower informational asymmetries regarding the stance of monetary policy
in particular and the monetary environment in general, as well as with the associated lower
monitoring effort that banks need to exert.

1
References
Ashcraft, A., 2006. New evidence on the lending channel. Journal of Money, Credit, and
Banking 38: 751–775.
Angeletos, G.-M., Lian, C., 2018. Forward guidance without common knowledge. American
Economic Review 108(9): 2477–2512.
Bernanke, B.S., Blinder, A.S., 1988. Credit, money, and aggregate demand. American
Economic Review 78(2): 435–439.
Bernanke, B.S., Blinder, A.S., 1992. The federal funds rate and the channels of monetary
transmission. American Economic Review 82(4): 901–921.
Bernanke, B.S., Gertler, M., 1989. Agency costs, net worth, and business fluctuations.
American Economic Review 79: 14–31.
Bernanke, B.S., Gertler, M., 1990. Financial fragility and economic performance. Quarterly
Journal of Economics 105(1): 87–114.
Bernanke, B.S., Gertler, M., 1995. Inside the black box: The credit channel of monetary
policy transmission. Journal of Economic Perspectives 9(4): 27–48.
Bernanke, B.S., Gertler, M., Gilchrist, S., 1999. The financial accelerator in a quantitative
business cycle framework. In Handbook of Macroeconomics, edited by J.B. Taylor and
M.J. Woodford. Amsterdam: Elsevier.
Bolton, P., Freixas, X., 2006. Corporate finance and the monetary transmission mechanism.
Review of Financial Studies 19(3): 829–870.
Boot, A.W., 2000. Relationship banking: What do we know? Journal of Financial
Intermediation 16: 452–476.
Borio, C., Zhu, H., 2012. Capital regulation, risk-taking and monetary policy: A missing link
in the transmission mechanism? Journal of Financial Stability 8(4): 236–251.
Campbell, J.R., Evans, C.L., Fisher, J.D., Justiniano, A., 2012. Macroeconomic effects of
Federal Reserve forward guidance. Brookings Papers on Economic Activity 43(1): 1–
80.
Campbell, J.R., Fisher, J.D., Justiniano, A., Melosi, L., 2017. Forward guidance and
macroeconomic outcomes since the financial crisis. NBER Macroeconomics Annual
31(1): 283–357.
Carlstrom, C.T., Fuerst, T.S., Paustian, M., 2015. Inflation and output in new Keynesian
models with a transient interest rate peg. Journal of Monetary Economics 76: 230–243.
Christiano, L., Eichenbaum, M., Evans, C., 2005. Nominal rigidities and the dynamic effects
of a shock to monetary policy. Journal of Political Economy 113(1): 1–45.

29
Chava, S., Roberts, M.R., 2008. How does financing impact investment? The role of debt
covenants. Journal of Finance 63(5): 2085–2121.
Clarida, R., Galí, J., Gertler, M., 1999. The science of monetary policy: A new Keynesian
perspective. Journal of Economic Literature 37(4): 1661–1707.
Degryse, H., Kim, M., Ongena, S., 2009. Microeconometrics of banking: Methods,
applications, and results. Oxford University Press: New York.
De Nicolò, G., Dell’Ariccia, G., Laeven, L., Valencia, F., 2010. Monetary policy and bank risk
taking. IMF Staff Position Note SPN/10/09.
Delis, M. D., Hasan, I., Mylonidis, N., 2017. The risk-taking channel of monetary policy in
the U.S.: Evidence from corporate loan data. Journal of Money, Credit and Banking
49(1): 187–213.
Dell’Ariccia, G., Laeven, L., Marquez, R., 2014. Real interest rates, leverage, and bank risk-
taking. Journal of Economic Theory 149: 56-99.
Dell’Ariccia, G., Laeven, L., Suarez, G.A., 2017. Bank leverage and monetary policy’s risk-
taking channel: Evidence from the United States. Journal of Finance 72(2): 613–654.
Dell’Ariccia, G., Laeven, L., Suarez, G.A., 2018. The credit channel of unconventional
monetary policy: Evidence from the United States. Working paper.
Drechsler, I., Savov, A., Schnabl, P., 2017. The deposits channel of monetary policy.
Quarterly Journal of Economics 132(4): 1819–1876.
Eggertsson, G. B., Woodford, M., 2003. The zero bound on interest rates and optimal monetary
policy. Brookings Papers on Economic Activity 2003(1): 139–211.
Ellingsen, T., Söderström, U., 2001. Monetary policy and market interest rates. American
Economic Review 91(5): 1594–1607.
Freixas, X., Rochet, J.C., 2008. Microeconomics of banking. 2nd edition, Cambridge,
MA: MIT Press.
Galí, J., 2008. Monetary policy, inflation, and the business cycle: An introduction to the New
Keynesian framework and its applications. Princeton, NJ: Princeton University Press.
Gertler, M., Gilchrist, S., 1994. Monetary policy, business cycles, and the behavior of
small manufacturing firms. Quarterly Journal of Economics 109(2): 309–340.
Hagedorn, M., Luo, J., Manovskii, I., Mitman, K., 2019. Forward guidance. Journal of
Monetary Economics 102: 1–23.
Holstrom, B., Tirole J., 1997. Financial intermediation, loanable funds, and the real sector.
Quarterly Journal of Economics 112: 663–691.
Ioannidou, V., Ongena, S., Peydró, J.L., 2015. Monetary policy, risk-taking, and pricing:
30
Evidence from a quasi-natural experiment. Review of Finance 19(1): 95–144.
Ivashina, V., 2009. Asymmetric information effects on loan spreads. Journal of Financial
Economics 92: 300–319.
Jayaratne, J., Morgan, M., 2000. Capital market frictions and deposit constraints at banks.
Journal of Money, Credit, and Banking 32: 74–92.
Jiménez, G., Ongena, S., Peydró, J.L., Saurina, J., 2012. Credit supply and monetary
policy: Identifying the bank balance-sheet channel with loan applications. American
Economic Review 102(5): 2301–26.
Jiménez, G., Ongena, S., Peydró, J.L., Saurina, J., 2014. Hazardous times for monetary
policy: What do twenty-three million bank loans say about the effects of monetary
policy on credit risk-taking? Econometrica 82(2): 463–505.
Justiniano, A., Primiceri, G.E., Tambalotti, A., 2011. Investment shocks and the relative price
of investment. Review of Economic Dynamics 14(1): 101–121.
Kashyap, A.K., Stein, J.C., 2000. What do a million observations on banks say about the
transmission of monetary policy? American Economic Review 90(3): 407–428.
Kashyap, A.K., Lamont, O.A., Stein, J.C., 1994. Credit conditions and the cyclical behavior of
inventories. Quarterly Journal of Economics 109(3): 565–592.
Kishan, R., Opiela, T., 2000. Bank size, bank capital, and the bank lending channel. Journal of
Money, Credit, and Banking 32: 121–141.
Kishan, R., Opiela, T., 2012. Monetary policy, bank lending, and the risk-pricing channel.
Journal of Money, Credit, and Banking 44(4): 573–602.
Kiyotaki, N., Moore, J., 1997. Credit cycles. Journal of Political Economy 105(2): 211–248.
Krippner, L., 2015. Zero lower bound term structure modeling: A practitioner’s guide. New
York: Palgrave Macmillan.
Krishnamurthy, A., Vissing-Jorgensen, A., 2011. The effects of quantitative easing on interest
rates: Channels and implications for policy. Brookings Papers of Economic Activity 2:
215–266.
Krugman, P.R., 1999. It’s baaack: Japan’s slump and the return of the liquidity trap. Brookings
Papers of Economic Activity 2:137–187.
Lang, W., Nakamura, L., 1995. “Flight to quality” in bank lending and economic activity.
Journal of Monetary Economics 36: 145–164.
McKay, A., Nakamura, E., Steinsson, J., 2016. The power of forward guidance. American
Economic Review 106(10): 3133–3158.
Paligorova, T., Santos, A.C., 2017. Monetary policy and bank risk-taking: Evidence fromthe

31
corporate loan market. Journal of Financial Intermediation 30: 35–49.
Qian, J., Strahan, P.E., 2007. How laws and institutions shape financial contracts: The case of
bank loans. Journal of Finance 62(6): 2803–2834.
Rajan, R.G., 2006. Has finance made the world riskier? European Financial Management
12(4): 499–533.
Romer, C.D., Romer, D.H., 2004. A new measure of monetary shocks: Derivation and
implications. American Economic Review 94: 1055–1084.
Rudebusch, G. D., Williams, J.C., 2008. Revealing the secrets of the temple: The value of
publishing central bank interest rate projections. In Asset Prices and Monetary Policy,
edited by J.Y. Campbell. Chicago: University of Chicago Press.
Shleifer, A., Vishny, R.W., 1992. Liquidation values and debt capacity: A market equilibrium
approach. Journal of Finance 47(4): 1343–1366.
Smets, F., Wouters, R., 2003. An estimated dynamic stochastic general equilibrium model of
the euro area. Journal of the European Economic Association 1(5): 1123–1175.
Sufi, A., 2007. Information asymmetry and financing arrangements: Evidence from syndicated
loans. Journal of Finance 62(2): 629–668.
Swanson, E.T., 2016. Measuring the effects of federal reserve forward guidance and asset
purchases on financial markets. National Bureau of Economic Research No. 23311.
Welch, I., Goyal, A., 2007. A comprehensive look at the empirical performance of equity
premium prediction. Review of Financial Studies 21(4): 1455–1508.
Woodford, M., 2003. Interest and prices: Foundations of a theory of monetary policy. Princeton,
NJ: Princeton University Press.

1
Figure 1. Explanatory power of forward guidance and shadow rate over time
This figure plots the performance of shadow rate over time (dotted line), which is calculated as the cumulative RMSE of the benchmark model minus the cumulative RMSE of the shadow rate model. Analogously, the performance of forward guidance over time (dashed line) is calculated as the cumulative RMSE of the benchmark model minus the cumulative RMSE of the forward guidance model. For the construction of the graphs, three regression models are estimated – benchmark model, shadow rate model and forward guidance model – using a 3-year monthly moving estimation window, and their respective RMSEs are recorded. The benchmark model regresses loan spreads on the loan, bank, firm, and economy-level control variables. The shadow rate model includes the shadow rate as an additional independent variable to the benchmark model, while the forward guidance model includes both the shadow rate and the forward guidance variables to the benchmark model. The definitions for all the variables used in the regressions are provided in Table 1.

33
Table 1. Variable definitions and sources
Variable Definition Source
Forward-guidance variables
Forward guidance (t – 1), Forward guidance (t – 2), Forward guidance (t – 3)
Three indicator variables measuring whether forward guidance is in play one month, two months, and three months, prior to the loan origination date (see section 3.2 for variables’ construction details)
FOMC
Quarterly forward guidance
Indicator variable takes the value 1 if there is expansionary forward guidance in the previous quarter, –1 for contractionary guidance, and 0 otherwise
FOMC
Loan-level variables
Loan spread Log of all-in-spread-drawn above LIBOR (in basis points) at origination DealScan
Loan amount Log of loan amount (in million US dollars) DealScan
Maturity Maturity of the loan (in years) DealScan
Credit line Indicator variable equal to 1 if a loan is a credit line, and 0 otherwise DealScan
Term loan Indicator variable equal to 1 if a loan is a term loan, and 0 otherwise DealScan
Corporate purpose Indicator variable equal to 1 if a loan is used for a corporate purpose, and 0 otherwise
DealScan
Working capital Indicator variable equal to 1 if the loan is used for working capital, and 0 otherwise
DealScan
Debt repayment Indicator variable equal to 1 if the loan is for repayment of previous debt, and 0 otherwise
DealScan
Secured Indicator variable equal to 2 if the loan is secured, 1 if unsecured, and 0 if the information is missing
DealScan
Dividend restriction Indicator variable equal to 2 if a loan has to meet a dividend restriction, 1 if no such restrictions are present, and 0 if the information is missing
DealScan
Lender number Log of the number of lenders in the syndicate DealScan
Firm-level variables
Book leverage The ratio of common equity over total assets, and multiplied by -1 for ease of interpretation (higher values for the ratio indicate higher book leverage)
Compustat
Z-score Altman’s (1968) Z-score = (1.2*working capital + 1.4*retained earnings + 3.3*EBIT + 0.999*sales)/total assets
Compustat
Bank-level variables
Total asset (log) Bank total assets (RCFD2170 and BHCK2170) Call reports and Y-9C reports
Capital ratio The ratio of bank equity over total assets (RCFD3210 and BHCK3210) Call reports and Y-9C reports
Liquidity The ratio of banks’ cash and treasuries over total assets (RFCD0010 and RFCD0400, BHCP6775 and BHCK1287)
Call reports and Y-9C reports
ROA The ratio of banks’ net income before taxes over total assets (RIAD4340 and BHCK4340)
Call reports and Y-9C reports
Charge-off The ratio of bank quarterly net charge-offs over total assets (RIAD4635 and BHCK2432)
Call reports and Y-9C reports
Economy-level variables
GDP growth quarterly GDP growth rate FRED
VIX quarterly averaged VIX close CBOE
Shadow rate quarterly average shadow rate Leo Krippner’s website

34
Table 2. Summary statistics This table reports the summary statistics of all variables used in the empirical analysis. The pre–financial crisis sample period stems from May 1999 to September 2008, and the sample period following the pre-financial crisis is from October 2008 to June 2017. The definitions for all the variables are provided in Table 1.
Pre-financial crisis sample period
Sample period following the pre-financial crisis
Obs Mean Std. Dev. Min Max Obs Mean Std. Dev. Min Max
Loan-level variables Loan spread 13,122 4.890 0.864 0.405 7.313 7,493 5.331 0.508 2.708 7.111
Loan amount 13,122 4.818 1.721 -6.639 10.309 7,493 5.602 1.380 -2.303 10.800
Maturity 13,122 3.580 1.962 0.005 20 7,493 4.482 1.459 0.083 16
Credit line 13,122 0.563 0.496 0 1 7,493 0.621 0.485 0 1
Term loan 13,122 0.246 0.431 0 1 7,493 0.330 0.470 0 1
Corporate purpose 13,122 0.320 0.467 0 1 7,493 0.671 0.470 0 1
Working capital 13,122 0.231 0.422 0 1 7,493 0.105 0.306 0 1
Debt repayment 13,122 0.115 0.319 0 1 7,493 0.030 0.170 0 1
Secured 13,122 1.246 0.856 0 2 7,493 1.249 0.859 0 2
Dividend restrictions 13,122 1.248 0.901 0 2 7,493 0.891 0.884 0 2
Number of lenders 13,122 1.677 1.041 0 5.088 7,493 1.888 0.827 0 4.248
Firm-level variables Book leverage 13,122 -0.409 0.198 0.000 -1.000 7,493 -0.389 0.194 0.000 -0.960
Z-score 13,122 0.629 0.823 -3.131 2.326 7,493 0.653 0.730 -3.131 2.441
Bank-level variables
Total asset 13,122 19.808 1.330 9.501 21.279 7,493 20.884 1.225 10.555 21.586
Capital ratio 13,122 0.079 0.015 0.056 0.149 7,493 0.102 0.018 0.056 0.149
ROA 13,122 0.007 0.004 -0.012 0.048 7,493 0.004 0.004 -0.039 0.031
Liquidity 13,122 0.047 0.026 0 0.212 7,493 0.062 0.048 0 0.474
Charge-off 13,122 0.002 0.002 0 0.016 7,493 0.002 0.003 0 0.028
Economy-level variables GDP growth 38 1.205 0.593 0.207 2.448 35 0.766 0.750 1.858 1.888
VIX 38 20.317 6.154 11.035 35.068 35 20.675 9.620 11.692 58.596
Shadow rate 38 3.261 1.947 0.402 6.224 35 -1.677 1.905 -5.301 1.725

35
Table 3. Response of loan spreads to forward guidance: Baseline specifications This table reports the regression results of Eq. (2), where the dependent variable is the log of loan spread. Forward guidance indicator variables capture forward guidance issued one, two, or three months before the loan origination date. Using the sample period following the pre-financial crisis (October 2008 to June 2017), columns (1) – (4) report results for Odyssean forward guidance and columns (5) – (8) report placebo test results for Delphic forward guidance. Columns (9) – (12) report placebo test results for forward guidance issued during the pre-financial crisis sample period (May 1999 to September 2008). Standard errors are clustered at the bank-year level. Y indicates that the set of control variables or fixed effects is included. The list of control variables and their definitions are provided in Table 1. ***, **, and * indicate statistical significance at the 1%, 5%, and 10% levels, respectively.
Odyssean forward guidance Placebo: Delphic forward guidance Placebo: Forward guidance before financial crisis
(1) (2) (3) (4) (5) (6) (7) (8) (9) (10) (11) (12)
Forward guidance (t-1) -0.089*** -0.133*** -0.021 -0.022 0.027 0.030
(-3.16) (-4.13) (-0.93) (-0.92) (0.86) (0.97)
Forward guidance (t-2) -0.114*** -0.157*** -0.008 -0.012 0.023 0.027
(-4.13) (-5.06) (-0.29) (-0.39) (0.64) (0.76)
Forward guidance (t-3) -0.111*** -0.150*** -0.012 -0.018 0.013 0.018
(-3.44) (-4.43) (-0.21) (-0.31) (0.43) (0.59)
Shadow rate 0.001 -0.001 -0.001 -0.010 0.002 0.002 0.002 0.002 -0.016* -0.016* -0.016* -0.015
(0.03) (-0.08) (-0.08) (-0.66) (0.10) (0.14) (0.14) (0.12) (-1.78) (-1.70) (-1.77) (-1.63)
Loan-level variables Y Y Y Y Y Y Y Y Y Y Y Y
Firm-level variables Y Y Y Y Y Y Y Y Y Y Y Y
Bank-level variables Y Y Y Y Y Y Y Y Y Y Y Y
Economy-level variables Y Y Y Y Y Y Y Y Y Y Y Y
Firm × year fixed effects Y Y Y Y Y Y Y Y Y Y Y Y
Number of observations 7,493 7,493 7,493 7,493 7,493 7,493 7,493 7,493 13,122 13,122 13,122 13,122
Economic impact of forward guidance on loans with mean spreads (in basis points)
Forward guidance (t-1) Forwards guidance (t-2) Forward guidance (t-3) Odyssean forward guidance (estimated from Column (4))
31.26 36.90 35.25

36
Table 4. Response of loan spreads to forward guidance: Triple interactions This table reports the regression results of Eq. (3), with the triple interaction of forward guidance, bank capital ratio and firm risk measures (denoted R). The dependent variable is the log of loan spread. The firm risk measure is book leverage in columns (1) – (4) and Z-score in columns (5) – (8). Forward guidance indicator variables capture Odyssean forward guidance issued one, two, or three months before the loan origination date. The sample period is from October 2008 to June 2017. Standard errors are clustered at the bank-year level. Y indicates that the set of control variables or fixed effects is included. The list of control variables and their definitions are provided in Table 1. ***, **, and * indicate statistical significance at the 1%, 5%, and 10% levels, respectively.
R = Book leverage R = Z-score
(1) (2) (3) (4) (5) (6) (7) (8)
Forward guidance (t-1)*Capital ratio -11.450** -11.920** -5.977** -6.132**
(-2.19) (-2.24) (-2.12) (-2.04)
Forward guidance (t-2)*Capital ratio -8.571*** -9.525*** -4.402** -4.822**
(-3.16) (-3.10) (-2.35) (-2.19)
Forward guidance (t-3)*Capital ratio 0.928 -1.304 2.251 0.999
(0.20) (-0.26) (0.99) (0.41)
Forward guidance (t-1)*R*Capital ratio -25.86** -27.250** 5.457** 5.594***
(2.41) (2.56) (2.57) (2.61)
Forward guidance (t-2)*R*Capital ratio -15.910** -19.010** 2.322 2.861*
(2.32) (2.58) (1.48) (1.70)
Forward guidance (t-3)*R*Capital ratio -1.841 -6.661 -2.463 -1.436
(0.20) (0.67) (-1.25) (-0.72)
Shadow rate -0.644*** -0.628*** -0.678*** -0.607*** -0.339*** -0.323*** -0.345*** -0.334***
(-6.63) (-6.30) (-6.65) (-6.40) (-4.77) (-4.59) (-4.75) (-5.09)
Shadow rate*Capital ratio 6.135*** 5.966*** 6.396*** 5.696*** 3.241*** 3.075*** 3.267*** 3.115***
(6.63) (6.36) (6.63) (6.39) (4.71) (4.49) (4.60) (4.91)
Shadow rate*R*capital ratio 13.320*** 12.920*** 13.70*** 12.130*** -2.685*** -2.499*** -2.612*** -2.558***
(-6.60) (-6.12) (-6.42) (-6.09) (-6.81) (-6.42) (-6.41) (-6.89)
Loan-level variables Y Y Y Y Y Y Y Y
Firm-level variables Y Y Y Y Y Y Y Y
Bank-level variables Y Y Y Y Y Y Y Y
Economy-level variables Y Y Y Y Y Y Y Y
Firm × year fixed effects Y Y Y Y Y Y Y Y

37
Number of observations 7,493 7,493 7,493 7,493 7,493 7,493 7,493 7,493
How much additional reduction in spreads do riskier firms (25 percentile) as compared to safer firms (75 percentile) receive from highly capitalized banks (75 percentile), over
and above those offered from less capitalized banks? (marginal effects of the difference-in-difference)
Forward guidance (t-1) Forward guidance (t-2) Forward guidance (t-3)
Model (4) 19.56% 13.66% Insignificant
Model (8) 12.48% 6.38% Insignificant
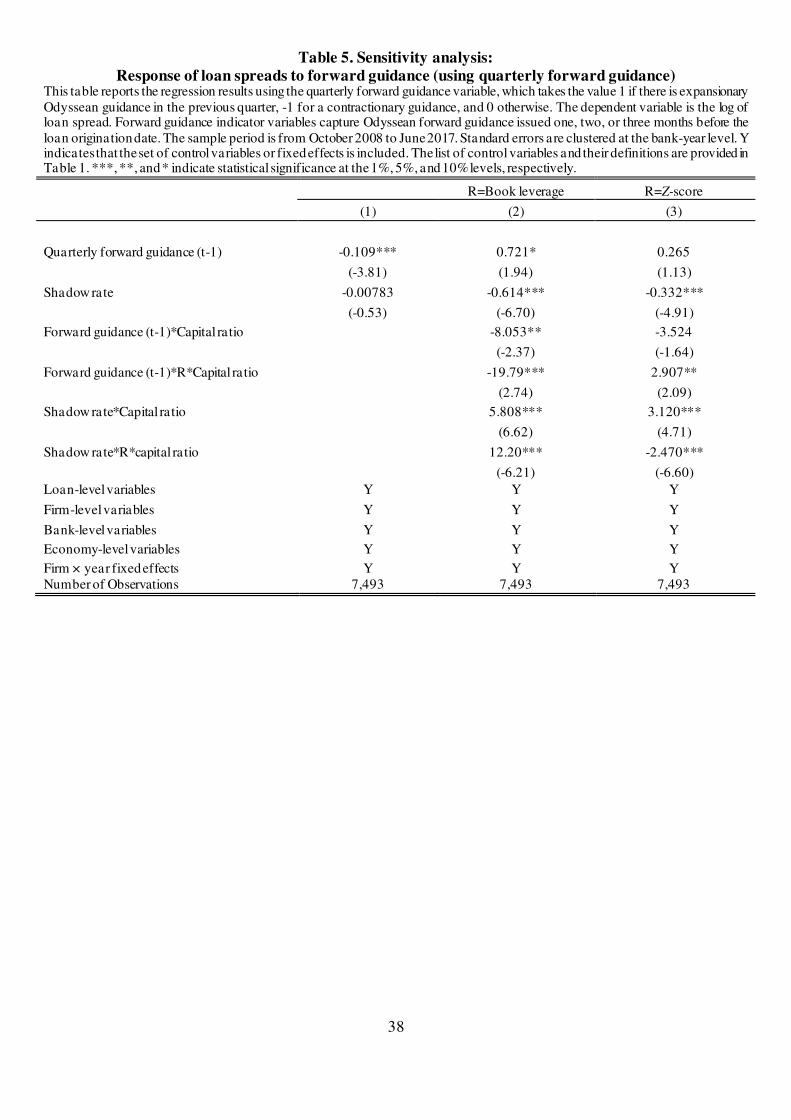
38
Table 5. Sensitivity analysis:
Response of loan spreads to forward guidance (using quarterly forward guidance) This table reports the regression results using the quarterly forward guidance variable, which takes the value 1 if there is expansionary Odyssean guidance in the previous quarter, -1 for a contractionary guidance, and 0 otherwise. The dependent variable is the log of loan spread. Forward guidance indicator variables capture Odyssean forward guidance issued one, two, or three months before the loan origination date. The sample period is from October 2008 to June 2017. Standard errors are clustered at the bank-year level. Y indicates that the set of control variables or fixed effects is included. The list of control variables and their definitions are provided in Table 1. ***, **, and * indicate statistical significance at the 1%, 5%, and 10% levels, respectively.
R=Book leverage R=Z-score
(1) (2) (3)
Quarterly forward guidance (t-1) -0.109*** 0.721* 0.265
(-3.81) (1.94) (1.13)
Shadow rate -0.00783 -0.614*** -0.332***
(-0.53) (-6.70) (-4.91)
Forward guidance (t-1)*Capital ratio -8.053** -3.524
(-2.37) (-1.64)
Forward guidance (t-1)*R*Capital ratio -19.79*** 2.907**
(2.74) (2.09)
Shadow rate*Capital ratio 5.808*** 3.120***
(6.62) (4.71)
Shadow rate*R*capital ratio 12.20*** -2.470***
(-6.21) (-6.60)
Loan-level variables Y Y Y
Firm-level variables Y Y Y
Bank-level variables Y Y Y
Economy-level variables Y Y Y
Firm × year fixed effects Y Y Y Number of Observations 7,493 7,493 7,493

39
Table 6. Sensitivity analysis:
Response of loan spreads to forward guidance (using the federal funds rate) This table reports the regression results for the baseline specifications using the federal funds rate as an alternative proxy for the conventional monetary policy stance. The dependent variable is the log of loan spread. Forward guidance indicator variables capture Odyssean forward guidance issued one, two, or three months before the loan origination date. The sample period is from October 2008 to June 2017. Standard errors are clustered at the bank-year level. Y indicates that the set of control variables or fixed effects is included. The list of control variables and their definitions are provided in Table 1. ***, **, and * indicate statistical significance at the 1%, 5%, and 10% levels, respectively.
(1) (2) (3) (4)
Forward guidance (t-1) -0.092*** -0.132***
(-3.14) (-4.00)
Forward guidance (t-2) -0.112*** -0.150***
(-4.05) (-4.89)
Forward guidance (t-3) -0.110*** -0.143***
(-3.42) (-4.33)
Federal funds rate 0.159** 0.143* 0.150* 0.154*
(2.07) (1.83) (1.90) (1.91)
Loan-level variables Y Y Y Y
Firm-level variables Y Y Y Y
Bank-level variables Y Y Y Y
Economy-level variables Y Y Y Y
Firm × year fixed effects Y Y Y Y
Number of Observations 7,493 7,493 7,493 7,493

40
Table 7. Sensitivity analysis:
Response of loan spreads to forward guidance: Triple interactions (using the federal funds rate) This table reports the regression results of Eq. (3), with the triple interaction of forward guidance, bank capital ratio and firm risk measures (denoted R) and using the federal funds rate as an alternative proxy for the conventional monetary policy stance. The dependent variable is the log of loan spread. The firm risk measure is book leverage in columns (1) – (4) and Z-score in columns (5) – (8). Forward guidance indicator variables capture Odyssean forward guidance issued one, two, or three months before the loan origination date. The sample period is from October 2008 to June 2017. Standard errors are clustered at the bank-year level. Y indicates that the set of control variables or fixed effects is included. The list of control variables and their definitions are provided in Table 1. ***, **, and * indicate statistical significance at the 1%, 5%, and 10% levels, respectively.
R=Book leverage R=Z-score
(1) (2) (3) (4) (5) (6) (7) (8)
Forward guidance (t-1)*Capital ratio -12.400*** -14.060*** -4.335* -5.299*
(-2.81) (-3.08) (-1.75) (-1.96)
Forward guidance (t-2)*Capital ratio -17.180*** -18.520*** -6.412** -7.299**
(-5.70) (-5.53) (-2.43) (-2.57)
Forward guidance (t-3)*Capital ratio -8.049 -10.000* -1.620 -2.938
(-1.56) (-1.76) (-0.74) (-1.24)
Forward guidance (t-1)*R*Capital ratio -26.660*** -30.190*** 3.215* 3.783*
(3.25) (3.64) (1.75) (1.90)
Forward guidance (t-2)*R*Capital ratio -34.450*** -37.620*** 2.859 3.502
(5.07) (5.12) (1.11) (1.32)
Forward guidance (t-3)*R*Capital ratio -21.000** -24.570** 0.775 1.547
(2.12) (2.21) (0.43) (0.81)
Federal funds rate 2.859** 2.977*** 3.128*** 2.792** 1.475* 1.463* 1.596* 1.455*
(2.50) (2.62) (2.64) (2.58) (1.87) (1.87) (1.96) (1.91)
Federal funds rate*Capital ratio -28.340** -29.260** -31.030** -27.750** -14.940* -14.840* -16.300* -14.730*
(-2.18) (-2.26) (-2.30) (-2.24) (-1.71) (-1.70) (-1.80) (-1.73)
Federal funds rate*R*capital ratio -48.530** -51.700** -54.070** -47.690** 7.489 7.519 8.185 7.177
(2.20) (2.33) (2.35) (2.26) (1.34) (1.37) (1.44) (1.34) Loan-level variables Y Y Y Y Y Y Y Y
Firm-level variables Y Y Y Y Y Y Y Y
Bank-level variables Y Y Y Y Y Y Y Y
Economy-level variables Y Y Y Y Y Y Y Y
Firm × year fixed effects Y Y Y Y Y Y Y Y
Clustered standard errors bank-year bank-year bank-year bank-year bank-year bank-year bank-year bank-year

41
Table 8. New borrower-lender relationships
This table reports the Probit regression results for the dependent variable capturing whether or not the bank enters into a new borrower-lender relationship. The dependent variables take the value of 1 if the borrowing firm has not borrowed a syndicated loan from the bank in the previous 3, 5, or 8 years. The results for the new of issuance term loans and credit lines are separately reported. Forward guidance indicator variables capture Odyssean forward guidance issued one, two, or three months before the loan origination date. The sample period is from October 2008 to June 2017. Y indicates that the set of control variables or fixed effects is included. The list of control variables and their definitions are provided in Table 1. ***, **, and * indicate statistical significance at the 1%, 5%, and 10% levels, respectively .
All loans Term loans Credit lines
3 years 5 years 8 years 3 years 5 years 8 years 3 years 5 years 8 years
Forward guidance (t-1) -0.123*** -0.086* -0.047 -0.003 0.122 0.062 -0.238*** -0.169*** -0.136**
(-2.76) (-1.87) (-1.07) (-0.04) (1.55) (0.79) (-4.15) (-3.01) (-2.42)
Forward guidance (t-2) 0.029 0.008 0.127*** 0.035 0.111 0.098 0.021 0.121** 0.144**
(0.64) (0.16) (2.89) (0.46) (1.49) (1.32) (0.34) (2.09) (2.50)
Forward guidance (t-3) -0.036 0.018 -0.066 -0.015 -0.015 -0.070 -0.009 0.020 -0.041
(-0.71) (0.35) (-1.31) (-0.18) (-0.17) (-0.81) (-0.14) (0.32) (-0.64)
Loan-level variables Y Y Y Y Y Y Y Y Y
Firm-level variables Y Y Y Y Y Y Y Y Y
Bank-level variables Y Y Y Y Y Y Y Y Y
Economy-level variables Y Y Y Y Y Y Y Y Y
Year fixed effects Y Y Y Y Y Y Y Y Y
Observations 7,493 7,493 7,493 2,469 2,469 2,469 4,654 4,654 4,654

42
Table 9. New borrower-lender relationships and loan spreads This table reports the loan-level regression estimates, where the dependent variable is the log of loan spread. The New borrower dummy equals 1 if the borrowing firm has not borrowed a syndicated loan from the bank in the previous 3, 5, or 8 years. The results for the new of issuance term loans and credit lines are separately reported. Forward guidance indicator variables capture Odyssean forward guidance issued one, two, or three months before the loan origination date. The sample period is from October 2008 to June 2017. Standard errors are clustered at the bank-year level. Y indicates that the set of control variables or fixed effects is included. The list of control variables and their definitions are provided in Table 1. ***, **, and * indicate statistical significance at the 1%, 5%, and 10% levels, respectively.
Results for term loans
3 years 5 years 8 years
(1) (2) (3) (4) (5) (6) (7) (8) (9) (10) (11) (12)
Forward guidance (t-1) -0.039 -0.0530 -0.061* -0.077** -0.050 -0.064*
(-1.18) (-1.40) (-1.90) (-2.10) (-1.61) (-1.84)
Forward guidance (t-2) 0.013 -0.008 0.013 -0.012 0.018 -0.006
(0.52) (-0.30) (0.53) (-0.39) (0.72) (-0.20)
Forward guidance (t-3) -0.060* -0.073** -0.072 -0.088* -0.074* -0.088*
(-1.72) (-2.00) (-1.53) (-1.77) (-1.69) (-1.91)
New borrower 0.017 0.031* 0.021 0.030 0.005 0.025 0.012 0.016 0.019 0.038** 0.0232 0.031
(0.81) (1.67) (1.11) (1.10) (0.27) (1.40) (0.69) (0.65) (0.98) (2.22) (1.33) (1.34)
Forward guidance (t-1)*New borrower 0.020 0.010 0.057 0.048 0.040 0.029
(0.44) (0.20) (1.28) (1.01) (0.92) (0.63)
Forward guidance (t-2)*New borrower -0.070** -0.069* -0.078** -0.071** -0.088*** -0.083**
(-2.29) (-1.97) (-2.49) (-2.01) (-2.84) (-2.40)
Forward guidance (t-3)*New borrower -0.023 -0.023 -0.005 -0.003 -0.001 -0.001
(-0.42) (-0.39) (-0.09) (-0.04) (-0.01) (-0.01)
Loan-level variables Y Y Y Y Y Y Y Y Y Y Y Y
Firm-level variables Y Y Y Y Y Y Y Y Y Y Y Y
Bank-level variables Y Y Y Y Y Y Y Y Y Y Y Y
Economy-level variables Y Y Y Y Y Y Y Y Y Y Y Y
Firm-year fixed effects Y Y Y Y Y Y Y Y Y Y Y Y
Number of Observations 2,469 2,469 2,469 2,469 2,469 2,469 2,469 2,469 2,469 2,469 2,469 2,469

43
Results for credit lines
3 years 5 years 8 years
(1) (2) (3) (4) (5) (6) (7) (8) (9) (10) (11) (12)
Forward guidance (t-1) -0.078** -0.088** -0.081**
-0.096*** -0.074** -0.090***
(-2.01) (-2.27) (-2.50) (-2.82) (-2.35) (-2.69)
Forward guidance (t-2) 0.000 -0.026 -0.009 -0.039 -0.014 -0.043
(0.02) (-0.88) (-0.32) (-1.25) (-0.51) (-1.43)
Forward guidance (t-3) -0.002 -0.025 -0.031 -0.054 -0.034 -0.057*
(-0.07) (-0.75) (-0.98) (-1.63) (-1.24) (-1.89)
New borrower 0.001 0.011 0.013 0.015 0.022 0.032* 0.0315** 0.030* 0.028* 0.036** 0.035** 0.035**
(0.06) (0.54) (0.72) (0.80) (1.31) (1.77) (2.02) (1.91) (1.74) (2.03) (2.36) (2.23)
Forward guidance (t-1)*New borrower 0.007 -0.007 0.018 0.010 0.005 -0.002
(0.16) (-0.17) (0.42) (0.23) (0.11) (-0.05)
Forward guidance (t-2)*New borrower -0.052 -0.056* -0.043 -0.042 -0.036 -0.035
(-1.58) (-1.80) (-1.14) (-1.12) (-0.93) (-0.91)
Forward guidance (t-3)*New borrower -0.107*** -0.104*** -0.075** -0.072** -0.075** -0.072**
(-3.06) (-3.12) (-2.24) (-2.20) (-2.57) (-2.54)
Loan-level variables Y Y Y Y Y Y Y Y Y Y Y Y
Firm-level variables Y Y Y Y Y Y Y Y Y Y Y Y
Bank-level variables Y Y Y Y Y Y Y Y Y Y Y Y
Economy-level variables Y Y Y Y Y Y Y Y Y Y Y Y
Firm-year fixed effects Y Y Y Y Y Y Y Y Y Y Y Y
Number of Observations 4,654 4,654 4,654 4,654 4,654 4,654 4,654 4,654 4,654 4,654 4,654 4,654

44
Table 10. Syndicate structure and borrowing firm reputation This table reports the regression results relating to the syndicate structure. The dependent variables are the number of new participant lenders, the share held by lead arrangers and a Herfindahl index (HHI) based on the shares held by all lenders. The firm controls include firm sales, an indicator variable equals to 1 if the firm is private and borrower reputation variable (measured as ln(1+previous loans by firm)). Forward guidance indicator variables capture Odyssean forward guidance issued one, two, or three months before the loan origination date. The sample period is from October 2008 to June 2017. Standard errors are clustered at the bank-year level. Y indicates that the set of control variables or fixed effects is included. The list of control variables and their definitions are provided in Table 1. ***, **, and * indicate statistical significance at the 1%, 5%, and 10% levels, respectively.
Share held by
lead HHI Number of new
participants
Forward guidance (t-1) -0.055* -682.9** 0.365
(-1.73) (-2.02) (0.99)
Forward guidance (t-2) 0.044 511.7 0.685*
(0.94) (0.98) (1.82)
Forward guidance (t-3) -0.033 -326.9 0.140
(-0.91) (-0.81) (0.34)
Forward guidance (t-1)*Borrower reputation 0.024* 306.2** -0.157
(1.78) (2.10) (-0.91)
Forward guidance (t-2)*Borrower reputation -0.015 -154.0 -0.381**
(-0.75) (-0.72) (-2.23)
Forward guidance (t-3)*Borrower reputation 0.014 133.4 0.071
(0.88) (0.77) (0.37)
Shadow rate 0.002 50.62 -0.016
(0.34) (0.65) (-0.19)
Loan controls Y Y Y
Firm Controls Y Y Y
Economy controls Y Y Y
Industry fixed effects Y Y Y
Year fixed effects Y Y Y
Observations 2048 1879 6667

1
Appendix with Supplementary Materials
Forward Guidance and Corporate Lending
Manthos D. Delis Montpellier Business School
Sizhe Hong
Durham University Business School
Nikos Paltalidis Durham University Business School
Dennis Philip
Durham University Business School

2
This document presents tables of results from additional tests that serve as robustness checks
and supplement the main tables in the paper. The following tables are presented:
A. List of Odyssean forward guidance statements, summary statistics
Table A1 lists the dates of Odyssean guidance statements used in the construction of the
forward guidance measures, with relevant key phrases within the statements with the forward-
looking (contractionary or expansionary) language.
Table A2 reports the summary statistics of the loan-, firm-, bank-, and economy-level control
variables for the whole sample period, May 1999 to June 2017.
B. Additional Sensitivity Tests
Part B of the Appendix presents additional sensitivity tests that supplement the main tables in
the paper and confirm the robustness of the results.
1. Response of loan spreads to forward guidance: results for term loans and credit lines
We test the baseline specification (estimation of Eq. (2)) for the two dominant types of
syndicated loans, namely, term loans and credit lines. We find that forward guidance
significantly reduces the spreads for both types of loans, with the economic magnitudes
associated with credit lines being slightly stronger.
2. Response of loan spreads to forward guidance: role of bank capitalization
We examine the role of bank capitalization in the relationship between cost of loans and
forward guidance. Specifically, Table B1 estimates regression models with double
interaction terms between forward guidance measures and bank capital ratio. The table also
reports the economic magnitude of the effects – the additional percentage reduction on loan
spreads offered by highly capitalized bank (75 percentile) as compared to less capitalized
bank (25 percentile), after expansionary forward guidance.

3
3. Tests with different fixed effects and sample periods
Tables B3, B4, and B5 estimate the regression models in Table 3 in the paper with bank
fixed effects, firm fixed effects, bank × year fixed effects and bank × firm fixed effects, in
order to test for the sensitivity of the findings. Table B3 presents the baseline regression
results using Odyssean forward guidance, Table B4 presents the placebo test results for
the effect of Delphic forward guidance on loan spreads, and Table B5 reports the placebo
test for the pre-crisis period. In all the sensitivity tests considered, we observe that the
findings reported in the paper continue to hold.
4. Testing with different fixed effects and using the effective federal funds rate (instead of the
shadow rate) as an alternative proxy of the monetary policy rate
Tables B6 to B8 replicates the results of Table 3 in the paper by including the effective
federal funds rate and using different fixed effects specifications. Notably, all the results
confirm the findings reported in the paper.
5. Additional economy-level control variables
To ease any concerns that the results may be influenced by other macroeconomic factors
such as credit risk and bond market conditions, in Tables B9 and B10 we replicate the
main results in the paper, by additionally controlling for credit spread (Moody’s AAA-
ABB corporate bond spread) and the 3-month T-Bill rate. The results remain robust to the
inclusion of these additional variables.

4
Table A1. Forward guidance statements with the forward-looking language This table lists the dates of Odyssean guidance statements and the relevant key phrases within the statements with the forward-looking (contractionary or expansionary) language.
Date Forward-looking language Type
18/05/1999
…the Committee was concerned about the potential for a buildup of inflationary imbalances that could undermine the favorable performance of the economy and therefore adopted a directive that is tilted toward the possibility of a firming in the stance of monetary policy.
contractionary
05/10/1999 …the Committee adopted a directive that was biased toward a possible firming of policy going forward.
contractionary
02/02/2000 …the Committee believes the risks are weighted mainly toward conditions that may generate heightened inflation pressures in the foreseeable future.
contractionary
19/12/2000 …the Committee consequently believes the risks are weighted mainly toward conditions that may generate economic weakness in the foresee-able future.
expansionary
13/08/2002 …the Committee believes that, for the foreseeable future…the risks are weighted mainly toward conditions that may generate economic weakness.
expansionary
12/08/2003 …the Committee believes that policy accommodation can be maintained for a considerable period.
expansionary
28/01/2004 With inflation quite low and resource use slack, the Committee believes that it can be patient in removing its policy accommodation.
expansionary
04/05/2004 …the Committee believes that policy accommodation can be removed at a pace that is likely to be measured.
contractionary
13/12/2005 The Committee judges that some further policy firming is likely to be needed to keep the risks to the attainment of both sustainable economic growth and price stability roughly in balance.
contractionary
29/06/2006 …the Committee judges that some inflation risks remain. contractionary
25/06/2008 Although downside risks to growth remain, they appear to have diminished somewhat, and the upside risks to inflation and inflation expectations have increased.
contractionary
08/10/2008 The recent intensification of the financial crisis has augmented the downside risks to growth and thus has diminished further the upside risks to price stability. Some easing of global monetary conditions is therefore warranted.
expansionary
16/12/2008
The Federal Open Market Committee decided today to establish a target range for the federal funds rate of 0 to 1/4 percent. ...The Federal Reserve will employ all available tools to promote the resumption of sustainable economic growth and to preserve price stability. In particular, the Committee anticipates that weak economic conditions are likely to warrant exceptionally low levels of the federal funds rate for some time.
expansionary
18/03/2009
…economic conditions are likely to warrant exceptionally low levels of the federal funds rate for an extended period. To provide greater support to mortgage lending and housing markets, the Committee decided today to increase the size of the Federal Reserve’s balance sheet further by purchasing up to an additional $750 billion of agency mortgage-backed securities, bringing its total purchases of these securities to up to $1.25 trillion this year, and to increase its purchases of agency debt this year by up to $100 billion to a total of up to $200 billion. Moreover, to help improve conditions in private credit markets, the Committee decided to purchase up to $300 billion of longer-term Treasury securities over the next six months. The Federal Reserve has launched the Term Asset-Backed Securities Loan Facility to facilitate the extension of credit to households and small businesses and anticipates that the range of eligible collateral for this facility is likely to be expanded to include other financial assets
expansionary
12/08/2009 To promote a smooth transition in markets as these purchases of Treasury securities are completed, the Committee has decided to gradually slow the pace of these transactions and anticipates that the full amount will be purchased by the end of October.
contractionary
16/12/2009
In light of ongoing improvements in the functioning of financial markets, the Committee and the Board of Governors anticipate that most of the Federal Reserve’s special liquidity facilities will expire on February 1, 2010, consistent with the Federal Reserve’s announcement of June 25, 2009. These facilities include the Asset-Backed Commercial
contractionary

5
Paper Money Market Mutual Fund Liquidity Facility, the Commercial Paper Funding Facility, the Primary Dealer Credit Facility, and the Term Securities Lending Facility. The Federal Reserve will also be working with its central bank counterparties to close its temporary liquidity swap arrangements by February 1. The Federal Reserve expects that amounts provided under the Term Auction Facility will continue to be scaled back in early 2010. The anticipated expiration dates for the Term Asset-Backed Securities Loan Facility remain set at June 30, 2010, for loans backed by new-issue commercial mortgage-backed securities and March 31, 2010, for loans backed by all other types of collateral.
03/11/2010
Although the Committee anticipates a gradual return to higher levels of resource utilization in a context of price stability, progress toward its objectives has been disappointingly slow. To promote a stronger pace of economic recovery and to help ensure that inflation, over time, is at levels consistent with its mandate, the Committee decided today to expand its holdings of securities. The Committee will maintain its existing policy of reinvesting principal payments from its securities holdings. In addition, the Committee intends to purchase a further $600 billion of longer-term Treasury securities by the end of the second quarter of 2011, a pace of about $75 billion per month. The Committee will regula rly review the pace of its securities purchases and the overall size of the asset-purchase program in light of incoming information and will adjust the program as needed to best foster maximum employment and price stability.
expansionary
09/08/2011 The Committee currently anticipates that economic conditions--including low rates of resource utilization and a subdued outlook for inflation over the medium run--are likely to warrant exceptionally low levels for the federal funds rate at least through mid-2013.
expansionary
21/09/2011
To support a stronger economic recovery and to help ensure that inflation, over time, is at levels consistent with the dual mandate, the Committee decided today to extend the average maturity of its holdings of securities. The Committee intends to purchase, by the end of June 2012, $400 billion of Treasury securities with remaining maturities of 6 years to 30 years and to sell an equal amount of Treasury securities with remaining maturities of 3 years or less...To help support conditions in mortgage markets, the Committee will now reinvest principal payments from its holdings of agency debt and agency mortgage-backed securities in agency mortgage-backed securities. In addition, the Committee will maintain its existing policy of rolling over maturing Treasury securities at auction.
expansionary
25/01/2012
the Committee decided today to keep the target range for the federal funds rate at 0 to 1/4 percent and currently anticipates that economic conditions--including low rates of resource utilization and a subdued outlook for inflation over the medium run--are likely to warrant exceptionally low levels for the federal funds rate at least through late 2014.
expansionary
13/09/2012
The Committee is concerned that, without further policy accommodation, economic growth might not be strong enough to generate sustained improvement in labor market conditions...the Committee agreed today to increase policy accommodation by purchasing additional agency mortgage-backed securities at a pace of $40 billion per month...If the outlook for the labor market does not improve substantially, the Committee will continue its purchases of agency mortgage-backed securities, undertake additional asset purchases, and employ its other policy tools as appropriate until such improvement is achieved in a context of price stability...In particular, the Committee also decided today to keep the target range for the federal funds rate at 0 to 1/4 percent and currently anticipates that exceptionally low levels for the federal funds rate are likely to be warranted at least through mid-2015.
expansionary
12/12/2012
The Committee also will purchase longer-term Treasury securities after its program to extend the average maturity of its holdings of Treasury securities is completed at the end of the year, initially at a pace of $45 billion per month...the Committee decided to keep the target range for the federal funds rate at 0 to 1/4 percent and currently anticipates that this exceptionally low range for the federal funds rate will be appropriate at least as long as the unemployment rate remains above 6-1/2 percent, inflation between one and two years ahead is projected to be no more than a half percentage point above the Committee’s 2 percent longer-run goal, and longer-term inflation expectations continue to be well anchored
expansionary
18/12/2013
In light of the cumulative progress toward maximum employment and the improvement in the outlook for labor market conditions, the Committee decided to modestly reduce the pace of its asset purchases. Beginning in January, the Committee will add to its hold ings of agency mortgage-backed securities at a pace of $35 billion per month rather than $40 billion per month, and will add to its holdings of longer-term Treasury securities at a pace of $40 billion per month rather than $45 billion per month...The Committee now anticipates, based on its assessment of these factors, that it likely will be appropriate to maintain the current target range for the federal funds rate well past the time that the unemployment rate declines
expansionary

6
below 6-1/2 percent, especially if projected inflation continues to run below the Committee's 2 percent longer-run goal.
19/03/2014
the Committee decided to make a further measured reduction in the pace of its asset purchases. Beginning in April, the Committee will add to its holdings of agency mortgage-backed securities at a pace of $25 billion per month rather than $30 billion per month, and will add to its holdings of longer-term Treasury securities at a pace of $30 billion per month rather than $35 billion per month...The Committee continues to anticipate, based on its assessment of these factors, that it likely will be appropriate to maintain the current target range for the federal funds rate for a considerable time after the asset purchase program ends, especially if projected inflation continues to run below the Committee's 2 percent longer-run goal, and provided that longer-term inflation expectations remain well anchored...When the Committee decides to begin to remove policy accommodation, it will take a balanced approach consistent with its longer-run goals of maximum employment and inflation of 2 percent. The Committee currently anticipates that, even after employment and inflation are near mandate-consistent levels, economic conditions may, for some time, warrant keeping the target federal funds rate below levels the Committee views as normal in the longer run. With the unemployment rate nearing 6-1/2 percent, the Committee has updated its forward guidance
expansionary
17/12/2014 Based on its current assessment, the Committee judges that it can be patient in beginning to normalize the stance of monetary policy.
expansionary
18/03/2015 . Consistent with its previous statement, the Committee judges that an increase in the target range for the federal funds rate remains unlikely at the April FOMC meeting.
expansionary
16/12/2015
The Committee judges that there has been considerable improvement in labor market conditions this year, and it is reasonably confident that inflation will rise, over the medium term, to its 2 percent objective. Given the economic outlook, and recognizing the time it takes for policy actions to affect future economic outcomes, the Committee decided to raise the target range for the federal funds rate to 1/4 to 1/2 percent. The stance of monetary policy remains accommodative after this increase, thereby supporting further improvement in labor market conditions and a return to 2 percent inflation...The Committee expects that economic conditions will evolve in a manner that will warrant only gradual increases in the federal funds rate; the federal funds rate is likely to remain, for some time, below levels that are expected to prevail in the longer run...The Committee is maintaining its existing policy of reinvesting principal payments from its holdings of agency debt and agency mortgage-backed securities in agency mortgage-backed securities and of rolling over maturing Treasury securities at auction, and it anticipates doing so until normalization of the level of the federal funds rate is well under way.
expansionary
21/09/2016
Against this backdrop, the Committee decided to maintain the target range for the federal funds rate at 1/4 to 1/2 percent. The Committee judges that the case for an increase in the federal funds rate has strengthened but decided, for the time being, to wait for further evidence of continued progress toward its objectives. The stance of monetary policy remains accommodative, thereby supporting further improvement in labor market conditions and a return to 2 percent inflation.
expansionary
14/12/2016
In view of realized and expected labor market conditions and inflation, the Committee decided to raise the target range for the federal funds rate to 1/2 to 3/4 percent. The stance of monetary policy remains accommodative, thereby supporting some further strengthening in labor market conditions and a return to 2 percent inflation
expansionary
15/03/2017 In view of realized and expected labor market conditions and inflation, the Committee decided to raise the target range for the federal funds rate to 3/4 to 1 percent. The stance of monetary policy remains accommodative, thereby supporting some further strengthening in labor market conditions and a sustained return to 2 percent inflation
expansionary
Table A2. Summary statistics This table reports the summary statistics of all variables for the whole sample period, May 1999 to June 2017. The definitions for all the variables are provided in Table 1.

7
Variable Obs Mean Std. Dev. Min Max
Loan-level variables Loan spread 20,615 5.050 0.783 0.405 7.313
Loan amount 20,615 5.103 1.649 -6.639 10.800
Maturity 20,615 3.908 1.847 0.005 20
Credit line 20,615 0.584 0.493 0 1
Term loan 20,615 0.276 0.447 0 1
Corporate purpose 20,615 0.448 0.497 0 1
Working capital 20,615 0.185 0.389 0 1
Debt repayment 20,615 0.084 0.277 0 1
Secured 20,615 1.247 0.857 0 2
Dividend restrictions 20,615 1.118 0.911 0 2
Number of lenders 20,615 1.754 0.974 0 5.088
Firm-level variables Book Leverage 20,615 -0.402 0.196 0.000 -1.000
Z-score 20,615 0.638 0.791 -3.131 2.441
Bank-level variables
Total asset 20,615 20.199 1.392 9.501 21.586
Capital ratio 20,615 0.087 0.019 0.056 0.149
ROA 20,615 0.006 0.004 -0.039 0.048
Liquidity 20,615 0.052 0.036 0 0.474
Charge-off 20,615 0.002 0.002 0 0.028
Economy-level variables
GDP growth 73 0.994 0.703 1.858 2.448
VIX 73 20.489 7.950 11.035 58.596
Shadow rate 73 0.893 3.136 -5.301 6.224

8
Table B1. Response of loan spreads to forward guidance: Double interactions This table reports the regression results with the double interaction of forward guidance and bank capital ratio. The dependent variable is the log of loan spread. Forward guidance indicator variables capture Odyssean forward guidance issued one, two, or three months before the loan origination date. The sample period is from October 2008 to June 2017. Standard errors are clustered at the bank-year level. Y indicates that the set of control variables or fixed effects is included. The list of control variables and their definitions are provided in Table 1. ***, ** and * indicate statistical significance at the 1, 5 and 10 percent, respectively.
(1) (2) (3) (4)
Forward guidance (t-1)*Capital ratio -2.519 -2.522
(-1.13) (-1.00)
Forward guidance (t-2)*Capital ratio -3.247** -3.276*
(-2.19) (-1.84)
Forward guidance (t-3)*Capital ratio 1.276 0.572
(0.59) (0.26)
Shadow rate -0.195*** -0.188*** -0.204*** -0.201***
(-2.83) (-2.76) (-2.94) (-3.16)
Shadow rate*Capital ratio 1.909*** 1.825*** 1.966*** 1.875***
(2.83) (2.75) (2.88) (3.00)
Loan-level variables Y Y Y Y
Firm-level variables Y Y Y Y
Bank-level variables Y Y Y Y
Economy-level variables Y Y Y Y
Firm-year FE Y Y Y Y
Number of observations 7,493 7,493 7,493 7,493
How much additional percentage reduction on loan spreads is offered by highly capitalized bank (75 percentile) as compared to less capitalized bank (25 percentile), after expansionary forward guidance?
Forward guidance (t-2) in Model (4) 8.60%

9
Table B2. Response of loan spreads to forward guidance: results for term loans
and credit lines This table reports the baseline regression results of Eq. (2) for loan spreads associated to the two main types of syndicated loans, namely, term loans and credit lines. The dependent variable is the log of loan spread. Forward guidance indicator variables capture Odyssean forward guidance issued one, two, or three months before the loan origination date. The sample period is from October 2008 to June 2017. Standard errors are clustered at the bank-year level. Y indicates that the set of control variables or fixed effects is included. The list of control variables and their definitions are provided in Table 1. ***, ** and * indicate statistical significance at the 1, 5 and 10 percent, respectively.
Term loans Credit lines
Forward guidance (t-1) -0.048* -0.094***
(-1.87) (-3.47)
Forward guidance (t-2) -0.050* -0.063**
(-1.88) (-2.44)
Forward guidance (t-3) -0.090*** -0.095***
(-2.77) (-3.42)
Shadow rate 0.012 0.020**
(1.42) (2.43) Loan-level variables Y Y
Firm-level variables Y Y
Bank-level variables Y Y
Economy-level variables Y Y
Firm × year fixed effects Y Y
Number of observations 2,469 4,654

10
Table B3. Response of loan spreads to Odyssean forward guidance This table reports the regression results of Eq. (2), where the dependent variable is the log of loan spread. Forward guidance indicator variables capture Odyssean forward guidance issued one, two, or three months before the loan origination date. The sample period is from October 2008 to June 2017. Columns (1) – (4) use bank fixed effects and firm fixed effects, columns (5) – (8) use bank × year fixed effects, and column (9) - (12) use bank× firm fixed effects. Standard errors are clustered at the bank-year level. Y indicates that the set of control variables or fixed effects is included. The list of control variables and their definitions are provided in Table 1. ***, ** and * indicate statistical significance at the 1, 5 and 10 percen t, respectively.
(1) (2) (3) (4) (5) (6) (7) (8) (9) (10) (11) (12)
Forward guidance (t-1) -0.050**
-0.071*** -0.063**
-0.098*** -0.062**
-0.084***
(-2.12)
(-2.89) (-2.40)
(-3.11) (-2.43)
(-2.96)
Forward guidance (t-2) -0.053***
-0.076***
-0.072***
-0.107***
-0.041*
-0.069***
(-3.01)
(-3.90)
(-2.66)
(-3.37)
(-1.92)
(-2.82)
Forward guidance (t-3)
-0.087*** -0.103***
-0.103*** -0.132***
-0.100*** -0.118***
(-4.29) (-4.98)
(-3.02) (-3.59)
(-3.96) (-4.55)
Shadow rate 0.015*** 0.013*** 0.013*** 0.010*** 0.000 -0.001 -0.002 -0.009 0.020*** 0.019*** 0.018*** 0.015***
(3.22) (2.99) (2.90) (2.65) (0.01) (-0.05) (-0.10) (-0.45) (3.27) (3.19) (3.03) (2.92)
Loan-level variables Y Y Y Y Y Y Y Y Y Y Y Y
Firm-level variables Y Y Y Y Y Y Y Y Y Y Y Y
Bank-level variables Y Y Y Y Y Y Y Y Y Y Y Y
Economy-level variables Y Y Y Y Y Y Y Y Y Y Y Y
Bank fixed effects Y Y Y Y
Firm fixed effects Y Y Y Y
Bank × year fixed effects Y Y Y Y
Bank × firm fixed effects
Y Y Y Y
Economic impact of forward guidance on loans with mean spreads (in basis points)
Forward guidance (t-1) Forwards guidance (t-2) Forward guidance (t-3) Model (4) 16.69 17.86 24.21 Model (8) 23.03 25.15 31.02 Model (12) 19.74 16.21 27.73

11
Table B4. Placebo test: Response of loan spreads to Delphic forward guidance This table reports the regression results of Eq. (2), where the dependent variable is the log of loan spread. Forward guidanc e indicator variables capture Delphic forward guidance issued one, two, or three months before the loan origination date. The sample period is from October 2008 to June 2017. Columns (1) – (4) use bank fixed effects and firm fixed effects, columns (5) – (8) use bank × year fixed effects and columns (9) – (12) use bank × firm fixed effects. Standard errors are clustered at the bank-year level. Y indicates that the set of control variables or fixed effects is included. The list of control variables and their definitions are provided in Table 1. ***, ** and * indicate statistical significance at the 1, 5 and 10 percent, respectively.
(1) (2) (3) (4) (5) (6) (7) (8) (9) (10) (11) (12)
Forward guidance (t-1) -0.013 -0.013 -0.018 -0.019 -0.023 -0.024
(-1.26) (-1.28) (-0.76) (-0.72) (-1.13) (-1.13)
Forward guidance (t-2) -0.005 -0.005 0.000 -0.003 -0.013 -0.015
(-0.35) (-0.39) (0.01) (-0.10) (-0.48) (-0.53)
Forward guidance (t-3) -0.027 -0.030 -0.010 -0.015 -0.048 -0.052
(-0.52) (-0.56) (-0.23) (-0.33) (-0.79) (-0.84)
Shadow rate 0.015*** 0.015*** 0.015*** 0.015*** 0.001 0.001 0.002 0.001 0.004 0.005 0.005 0.004
(3.09) (3.13) (3.04) (3.00) (0.06) (0.08) (0.08) (0.07) (0.33) (0.40) (0.44) (0.38)
Loan-level variables Y Y Y Y Y Y Y Y Y Y Y Y
Firm-level variables Y Y Y Y Y Y Y Y Y Y Y Y
Bank-level variables Y Y Y Y Y Y Y Y Y Y Y Y
Economy-level variables
Y Y Y Y Y Y Y Y Y Y Y Y
Bank fixed effects Y Y Y Y
Firm fixed effects Y Y Y Y
Bank × year fixed effects Y Y Y Y
Bank × firm fixed effects Y Y Y Y

12
Table B5. Response of loan spreads to forward guidance during the pre-financial crisis sample period This table reports the regression results of Eq. (2), where the dependent variable is the log of loan spread. Forward guidanc e indicator variables capture all forward guidance issued one, two, or three months before the loan origination date. The sample period is from May 1999 to September 2008. Columns (1) – (4) use bank fixed effects, columns (5) – (8) use bank × year fixed effects and columns (9) – (12) use bank × firm fixed effects. Standard errors are clustered at the bank-year level. Y indicates that the set of control variables or fixed effects is included. The list of control variables and their definitions are provided in Table 1. ***, ** and * indicate statistical significance at the 1, 5 and 10 percent, respectively.
(1) (2) (3) (4) (5) (6) (7) (8) (9) (10) (11) (12)
Forward guidance (t-1) 0.025 0.027 0.016 0.018 0.024 0.025
(1.38) (1.44) (0.49) (0.57) (0.83) (0.87)
Forward guidance (t-2) 0.021 0.024 0.023 0.025 0.0146 0.0162
(1.00) (1.12) (0.63) (0.67) (0.43) (0.48)
Forward guidance (t-3) 0.013 0.015 0.000 0.004 -0.002 0.000
(0.70) (0.83) (-0.01) (0.12) (-0.08) (0.01)
Shadow rate -0.052*** -0.052*** -0.052*** -0.051*** -0.001 -0.001 -0.001 -0.001 -0.019** -0.019** -0.020** -0.019**
(-12.66) (-11.61) (-12.71) (-11.63) (-0.12) (-0.07) (-0.12) (-0.06) (-2.45) (-2.34) (-2.48) (-2.27)
Loan-level variables Y Y Y Y Y Y Y Y
Firm-level variables Y Y Y Y Y Y Y Y
Bank-level variables Y Y Y Y Y Y Y Y
Economy-level variables Y Y Y Y Y Y Y Y
Bank fixed effects Y Y Y Y
Firm fixed effects Y Y Y Y
Bank × year fixed effects Y Y Y Y
Bank × firm fixed effects Y Y Y Y

13
Table B6. Response of loan spreads to Odyssean forward guidance, controlling for federal funds rate This table reports the regression results for the baseline specifications using the federal funds rate as an alternative proxy for the conventional monetary policy stance. The dependent variable is the log of loan spread. Forward guidance indicator variables capture Odyssean forward guidance issued one, two, or three months before the loan origination date. The sample period is from October 2008 to June 2017. Columns (1) – (4) use bank fixed effects, columns (5) – (8) use bank × year fixed effects and columns (9) – (12) use bank × firm fixed effects. Standard errors are clustered at the bank-year level. Y indicates that the set of control variables or fixed effects is included. The list of control variables and their definitions are provided in Table 1. ***, ** and * indicate statistical significance at the 1, 5 and 10 percent, respectively.
(1) (2) (3) (4) (5) (6) (7) (8) (9) (10) (11) (12)
Forward guidance (t-1) -0.049** -0.072*** -0.068** -0.098*** -0.092*** -0.126***
(-2.09) (-2.89) (-2.45) (-3.06) (-3.49) (-4.38)
Forward guidance (t-2) -0.062*** -0.084*** -0.068** -0.0997*** -0.107*** -0.139***
(-3.34) (-4.13) (-2.48) (-3.15) (-4.41) (-5.39)
Forward guidance (t-3) -0.097*** -0.111*** -0.101*** -0.125*** -0.118*** -0.144***
(-4.95) (-5.58) (-3.22) (-3.80) (-3.99) (-4.96)
Federal funds rate -0.065** -0.069** -0.071*** -0.058** 0.256*** 0.244*** 0.248*** 0.249*** 0.109* 0.090 0.093 0.105
(-2.26) (-2.51) (-2.62) (-2.12) (2.98) (2.90) (2.89) (2.88) (1.72) (1.42) (1.44) (1.56)
Loan-level variables Y Y Y Y Y Y Y Y Y Y Y Y
Firm-level variables Y Y Y Y Y Y Y Y Y Y Y Y
Bank-level variables Y Y Y Y Y Y Y Y Y Y Y Y
Economy-level variables Y Y Y Y Y Y Y Y Y Y Y Y
Bank fixed effects Y Y Y Y
Firm fixed effects Y Y Y Y
Bank × year fixed effects Y Y Y Y
Bank × firm fixed effects Y Y Y Y

14
Table B7. Response of loan spreads to Delphic forward guidance, controlling for federal funds rate This table reports the regression results for the baseline specifications using the federal funds rate as an alternative prox y for the conventional monetary policy stance. The dependent variable is the log of loan spread. Forward guidance indicator variables capture Delphic forward guidance issued one, two, or three months before the loan origination date. The sample period is from October 2008 to June 2017. Columns (1) – (4) use bank fixed effects and firm fixed effects, columns (5) – (8) use firm × year fixed effects, columns (9) – (12) use bank × year fixed effects and columns (13) – (16) use bank × firm fixed effects. Standard errors are clustered at the bank-year level. Y indicates that the set of control variables or fixed effects is included. The list of control variables and their definitions are provided in Table 1. ***, **, and * indicate statistical significance at the 1%, 5%, and 10% levels, respectively.
(1) (2) (3) (4) (5) (6) (7) (8)
Forward guidance (t-1) -0.018* -0.019* -0.021 -0.023
(-1.73) (-1.70) (-0.95) (-0.95)
Forward guidance (t-2) -0.003 -0.004 -0.011 -0.015
(-0.20) (-0.25) (-0.39) (-0.49)
Forward guidance (t-3) -0.007 -0.011 -0.013 -0.02
(-0.14) (-0.21) (-0.22) (-0.33)
Federal funds rate -0.071** -0.071** -0.071** -0.070** 0.149* 0.151* 0.150* 0.151**
(-2.49) (-2.46) (-2.51) (-2.43) (1.93) (1.96) (1.96) (1.98)
Loan-level variables Y Y Y Y Y Y Y Y
Firm-level variables Y Y Y Y Y Y Y Y
Bank-level variables Y Y Y Y Y Y Y Y
Economy-level variables Y Y Y Y Y Y Y Y
Bank fixed effects Y Y Y Y Firm fixed effects Y Y Y Y Firm × year fixed effects Y Y Y Y
(continued next page)

15
(9) (10) (11) (12) (13) (14) (15) (16)
Forward guidance (t-1) -0.019 -0.02 -0.025 -0.026
(-0.79) (-0.77) (-1.26) (-1.27)
Forward guidance (t-2) -0.005 -0.008 -0.017 -0.020
(-0.17) (-0.27) (-0.63) (-0.68)
Forward guidance (t-3) -0.012 -0.018 -0.044 -0.050
(-0.31) (-0.44) (-0.72) (-0.79)
Federal funds rate 0.250*** 0.250*** 0.250*** 0.251*** 0.096 0.098 0.096 0.100
(2.95) (2.94) (2.95) (2.99) (1.53) (1.56) (1.55) (1.61)
Loan-level variables Y Y Y Y Y Y Y Y
Firm-level variables Y Y Y Y Y Y Y Y
Bank-level variables Y Y Y Y Y Y Y Y
Economy-level variables Y Y Y Y Y Y Y Y
Bank × year fixed effects Y Y Y Y Y Y Y Y
Bank × firm fixed effects Y Y Y Y

16
Table B8. Response of loan spreads to forward guidance, controlling for federal funds rate (for the pre-financial crisis sample period) This table reports the regression results for the baseline specifications using the federal funds rate as an alternative proxy for the conventional monetary policy stance. The dependent variable is the log of loan spread. Forward guidance indicator variables capture all forward guidance issued one, two, or three months before the loan origination date. The sample period is from May 1999 to September 2008. Columns (1) – (4) use bank fixed effects and firm fixed effects, columns (5) – (8) use firm × year fixed effects, columns (9) – (12) use bank × year fixed effects and columns (13) - (16) use bank × firm fixed effects. Standard errors are clustered at the bank-year level. Y indicates that the set of control variables or fixed effects is included. The list of control variables and their definitions are provided in Table 1. ***, ** and * indicate statistical significance at the 1, 5 and 10 percent, respectively.
(1) (2) (3) (4) (5) (6) (7) (8)
Forward guidance (t-1) 0.029 0.032* 0.031 0.035
(1.58) (1.67) (1.01) (1.12)
Forward guidance (t-2) 0.028 0.032 0.024 0.028
(1.33) (1.49) (0.66) (0.78)
Forward guidance (t-3) 0.022 0.025 0.013 0.018
(1.22) (1.37) (0.44) (0.61)
Federal funds rate -0.051*** -0.051*** -0.051*** -0.050*** -0.017* -0.017 -0.017* -0.016
(-11.41) (-10.63) (-11.46) (-10.70) (-1.68) (-1.61) (-1.68) (-1.57)
Loan-level variables Y Y Y Y Y Y Y Y
Firm-level variables Y Y Y Y Y Y Y Y
Bank-level variables Y Y Y Y Y Y Y Y
Economy-level variables Y Y Y Y Y Y Y Y
Bank fixed effects Y Y Y Y Firm fixed effects Y Y Y Y Firm × year fixed effects Y Y Y Y
(continued next page)

17
(9) (10) (11) (12) (13) (14) (15) (16)
Forward guidance (t-1) 0.016 0.018 0.026 0.027
(0.49) (0.57) (0.89) (0.93)
Forward guidance (t-2) 0.024 0.026 0.017 0.019
(0.65) (0.68) (0.52) (0.57)
Forward guidance (t-3) 0.000 0.004 0.001 0.004
(-0.01) (0.13) (0.04) (0.14)
Federal funds rate 0.000 0.001 0.000 0.001 -0.020** -0.020** -0.021** -0.020**
(0.02) (0.05) (0.02) (0.06) (-2.36) (-2.26) (-2.38) (-2.20)
Loan-level variables Y Y Y Y Y Y Y Y
Firm-level variables Y Y Y Y Y Y Y Y
Bank-level variables Y Y Y Y Y Y Y Y
Economy-level variables Y Y Y Y Y Y Y Y
Bank × year fixed effects Y Y Y Y Y Y Y Y
Bank × firm fixed effects Y Y Y Y

18
Table B9. Response of loan spreads to forward guidance, after controlling for additional economy-level variables This table reports the regression results for the baseline specifications, after additionally controlling for two economy-level variables, namely credit spread (Moody’s AAA-ABB corporate bond spread) and 3-month T-bill rate. The dependent variable is the log of loan spread. Forward guidance indicator variables capture Odyssean forward guidance issued one, two, or three months before the loan origination date. The sample period is from October 2008 to June 2017. Columns (1) – (4) use bank fixed effects and firm fixed effects, columns (5) – (8) use firm × year fixed effects and columns (9) – (12) use bank × year fixed effects. Standard errors are clustered at the bank-year level. Y indicates that the set of control variables or fixed effects is included. The list of control variables and their definitions are provided in Table 1. ***, ** and * indicate statistical significance at the 1, 5 and 10 percent, respectively.
(1) (2) (3) (4) (5) (6) (7) (8) (9) (10) (11) (12)
Forward guidance (t-1) -0.039* -0.061*** -0.082*** -0.131*** -0.065** -0.107***
(-1.90) (-2.73) (-2.98) (-4.22) (-2.41) (-3.27)
Forward guidance (t-2) -0.049*** -0.071*** -0.121*** -0.167*** -0.082*** -0.125***
(-2.76) (-3.52) (-4.28) (-5.26) (-2.96) (-3.69)
Forward guidance (t-3) -0.084*** -0.100*** -0.138*** -0.179*** -0.136*** -0.170***
(-4.02) (-4.55) (-3.92) (-4.81) (-3.63) (-4.17)
Shadow rate 0.020*** 0.019*** 0.019*** 0.014*** -0.010 -0.011 -0.013 -0.023 -0.016 -0.017 -0.020 -0.028
(3.39) (3.19) (3.10) (2.75) (-0.54) (-0.64) (-0.70) (-1.39) (-0.77) (-0.81) (-0.91) (-1.33)
Loan-level variables Y Y Y Y Y Y Y Y Y Y Y Y
Firm-level variables Y Y Y Y Y Y Y Y Y Y Y Y
Bank-level variables Y Y Y Y Y Y Y Y Y Y Y Y
Economy-level variables
Y Y Y Y Y Y Y Y Y Y Y Y
Bank fixed effects Y Y Y Y
Firm fixed effects Y Y Y Y
Firm × year fixed effects Y Y Y Y Bank × year fixed effects Y Y Y Y
Observations 7,493 7,493 7,493 7,493 7,493 7,493 7,493 7,493 7,493 7,493 7,493 7,493

19
Table B10. Response of loan spreads to forward guidance: Triple interactions, after controlling for additional economy-level variables This table reports the regression results of Eq. (3), with the triple interaction of forward guidance, bank capital ratio and firm risk measures (denoted R). The regressions include additionally two economy-level variables, namely credit spread (Moody’s AAA-ABB corporate bond spread) and 3-month T-bill rate. The dependent variable is the log of loan spread. The firm risk measure is book leverage in columns (1) – (4) and Z-score in columns (5) – (8). Forward guidance indicator variables capture Odyssean forward guidance issued one, two, or three months before the loan origination date. The sample period is from October 2008 to June 2017. Standard errors are clustered at the bank-year level. Y indicates that the set of control variables or fixed effects is included. The list of control variables and their definitions are provided in Table 1. ***, ** and * indicate statistical significance at the 1, 5 and 10 percent, respectively.
R=Book leverage R=Z-score
(1) (2) (3) (4) (5) (6) (7) (8)
Forward guidance (t-1)*Capital ratio -11.080** -11.370** -5.977** -6.016**
(-2.26) (-2.27) (-2.27) (-2.13)
Forward guidance (t-2)*Capital ratio -8.454*** -9.342*** -4.370** -4.697**
(-3.03) (-3.06) (-2.35) (-2.18)
Forward guidance (t-3)*Capital ratio 0.870 -1.296 2.498 1.247
(0.18) (-0.25) (1.06) (0.50)
Forward guidance (t-1)*R*Capital ratio -24.100** -25.140** 5.052** 5.125**
(2.40) (2.54) (2.52) (2.55)
Forward guidance (t-2)*R*Capital ratio -15.550** -18.470** 2.280 2.725
(2.21) (2.50) (1.47) (1.64)
Forward guidance (t-3)*R*Capital ratio -2.440 -6.975 -2.383 -1.374
(0.27) (0.71) (-1.26) (-0.73)
Shadow rate -0.621*** -0.604*** -0.654*** -0.585*** -0.336*** -0.319*** -0.343*** -0.334***
(-6.42) (-6.11) (-6.45) (-6.26) (-4.62) (-4.47) (-4.63) (-4.99)
Shadow rate*Capital ratio 5.870*** 5.685*** 6.103*** 5.406*** 3.134*** 2.963*** 3.158*** 3.012***
(6.34) (6.09) (6.32) (6.08) (4.51) (4.32) (4.41) (4.69)
Shadow rate*R*capital ratio 12.61*** 12.17*** 12.90*** 11.26*** -2.485*** -2.303*** -2.403*** -2.312***
(-6.33) (-5.86) (-6.10) (-5.75) (-6.89) (-6.59) (-6.34) (-6.98)
Loan-level variables Y Y Y Y Y Y Y Y
Firm-level variables Y Y Y Y Y Y Y Y
Bank-level variables Y Y Y Y Y Y Y Y
Economy-level variables Y Y Y Y Y Y Y Y
Firm × year fixed effects Y Y Y Y Y Y Y Y
Observations 7,493 7,493 7,493 7,493 7,493 7,493 7,493 7,493