fourth quarter 2016 earnings call - eastman kodak company
TRANSCRIPT

Fourth Quarter 2016
Earnings Call
March 7, 2017

2
CAUTIONARY STATEMENT REGARDING FORWARD-LOOKING STATEMENTS PURSUANT TO SAFE HARBOR PROVISIONS OF THE PRIVATE SECURITIES LITIGATION REFORM ACT OF 1995
This presentation includes “forward-looking statements” as that term is defined under the Private Securities Litigation Reform Act of 1995.
Forward-looking statements include statements concerning Kodak’s plans, objectives, goals, strategies, future events, future revenue or
performance, capital expenditures, liquidity, investments, financing needs and business trends and other information that is not historical
information. When used in this presentation, the words “estimates,” “expects,” “anticipates,” “projects,” “plans,” “intends,” “believes,”
“predicts,” “forecasts,” “strategy,” “continues,” “goals,” “targets” or future or conditional verbs, such as “will,” “should,” “could,” or “may,” and
similar expressions, as well as statements that do not relate strictly to historical or current facts, are intended to identify forward-looking
statements.
All forward-looking statements, including management’s examination of historical operating trends and data, are based upon Kodak’s
expectations and various assumptions. Future events or results may differ from those anticipated or expressed in the forward-looking
statements. Important factors that could cause actual events or results to differ materially from the forward-looking statements include, among
others, the risks and uncertainties described in more detail in Kodak’s Annual Report on Form 10-K for the year ended December 31, 2016
under the headings “Business,” “Risk Factors,” “Legal Proceedings” and/or “Management’s Discussion and Analysis of Financial Condition and
Results of Operations—Liquidity and Capital Resources,” and in other filings Kodak makes with the U.S. Securities and Exchange Commission
from time to time, as well as the following: Kodak’s ability to improve and sustain its operating structure, cash flow, profitability and other
financial results; the ability of Kodak to achieve cash forecasts, financial projections, and projected growth; Kodak’s ability to achieve the
financial and operational results contained in its business plans; Kodak’s ability to fund continued investments, capital needs and restructuring
payments and service its debt and Series A Preferred Stock; Kodak’s ability to discontinue, sell or spin-off certain businesses or operations,
including the PROSPER business, or otherwise monetize assets; changes in foreign currency exchange rates, commodity prices and interest
rates; Kodak’s ability to effectively anticipate technology trends and develop and market new products, solutions and technologies; Kodak’s
ability to effectively compete with large, well-financed industry participants; Kodak’s ability to comply with the covenants in its various credit
facilities; continued sufficient availability of borrowings and letters of credit under Kodak’s revolving credit facility, Kodak’s ability to obtain
additional financing if and as needed and Kodak’s ability to provide or facilitate financing for its customers; the performance by third parties of
their obligations to supply products, components or services to Kodak; and the impact of the global economic environment on Kodak. There
may be other factors that may cause Kodak’s actual results to differ materially from the forward-looking statements.
All forward-looking statements attributable to Kodak or persons acting on its behalf apply only as of the date of this presentation and are
expressly qualified in their entirety by the cautionary statements included or referenced in this presentation. Kodak undertakes no obligation to
update or revise forward-looking statements to reflect events or circumstances that arise after the date made or to reflect the occurrence of
unanticipated events.

AGENDA
3
Introduction Bill Love, Treasurer and Investor
Relations
CEO Perspective on 2016 and
FY 2017 Guidance
Jeff Clarke, Chief Executive
Officer
2016 Fourth Quarter Results
and Financial Review
David Bullwinkle, Chief Financial
Officer
Concluding Remarks and
Q&A
Jeff Clarke and David Bullwinkle

4
2016 Results
Cash Flow
Prosper Update
Notable Achievements
Operational EBITDA
Flexcel NX Strength
PROSPER Growth
Improved Capital Structure
CEO Perspective

FY 2016 Results vs Guidance
5
2015 results recast for Discontinued Operations
This document should be read in conjunction with Eastman Kodak Company’s Annual Report on Form 10-K for the year ended December 31, 2016 (the “2016 Form 10-K”).
1 Operational EBITDA is equivalent to “Segment Operational EBITDA” as presented in Note 24. Segment Information to the financial statements included in the 2016 Form 10-K.2 Refer to page 41, footnote 11 of this presentation for the explanation on the calculation of constant currency.
Total Company
Q4 2016 Q4 2015 YTD 2016 YTD 2015 2016 Guidance
Revenue $404 $439 $1,543 $1,709 $1,500 - $1,700
Operational EBITDA 1 $46 $59 $144 $171 $135 - $150= =
Year over Year Change - B/(W)
Revenue ($) ($35) ($166)
Operational EBITDA ($) ($13) ($27)
Revenue (%) -8% -10%
Operational EBITDA (%) -22% -16%
Comparable Basis (excluding FX impact)(2) Q4 2016 Q4 2015 YTD 2016 YTD 2015
Revenue $410 $439 $1,554 $1,709
Year over Year Change - B/(W) ($29) ($155)
Comparable Basis (excluding FX impact)(2) Q4 2016 Q4 2015 YTD 2016 YTD 2015
Operational EBITDA $49 $59 $156 $171
Year over Year Change - B/(W) ($10) ($15)
($ millions)
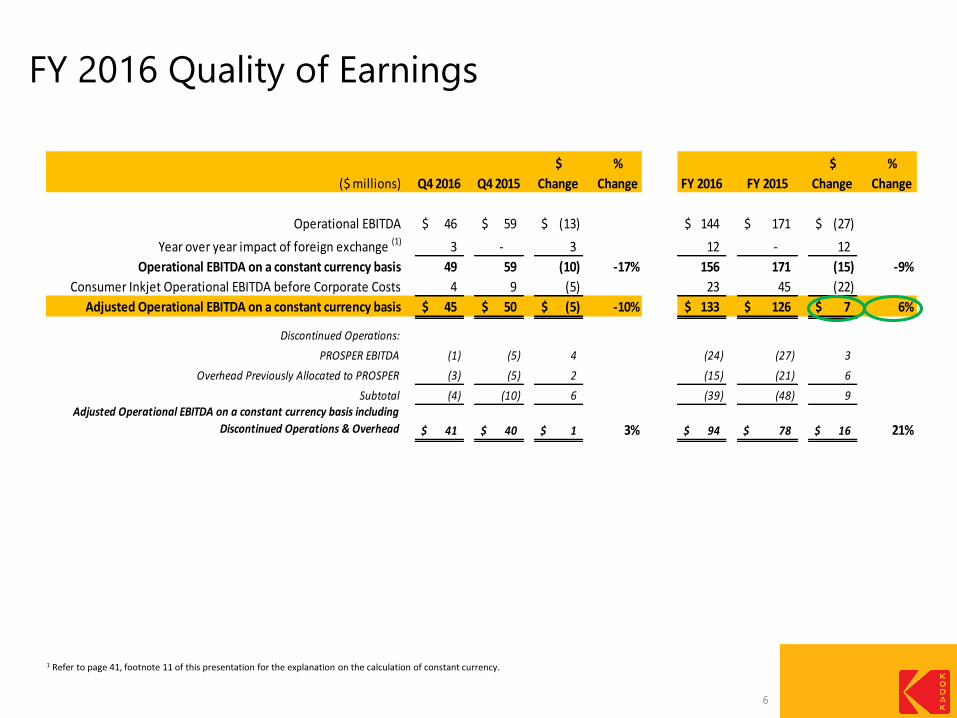
($ millions) Q4 2016 Q4 2015
$
Change
%
Change FY 2016 FY 2015
$
Change
%
Change
Operational EBITDA 46$ 59$ (13)$ 144$ 171$ (27)$
Year over year impact of foreign exchange (1) 3 - 3 12 - 12
Operational EBITDA on a constant currency basis 49 59 (10) -17% 156 171 (15) -9%
Consumer Inkjet Operational EBITDA before Corporate Costs 4 9 (5) 23 45 (22)
Adjusted Operational EBITDA on a constant currency basis 45$ 50$ (5)$ -10% 133$ 126$ 7$ 6%
Discontinued Operations:
PROSPER EBITDA (1) (5) 4 (24) (27) 3
Overhead Previously Allocated to PROSPER (3) (5) 2 (15) (21) 6
Subtotal (4) (10) 6 (39) (48) 9 Adjusted Operational EBITDA on a constant currency basis including
Discontinued Operations & Overhead 41$ 40$ 1$ 3% 94$ 78$ 16$ 21%
FY 2016 Quality of Earnings
6
1 Refer to page 41, footnote 11 of this presentation for the explanation on the calculation of constant currency.
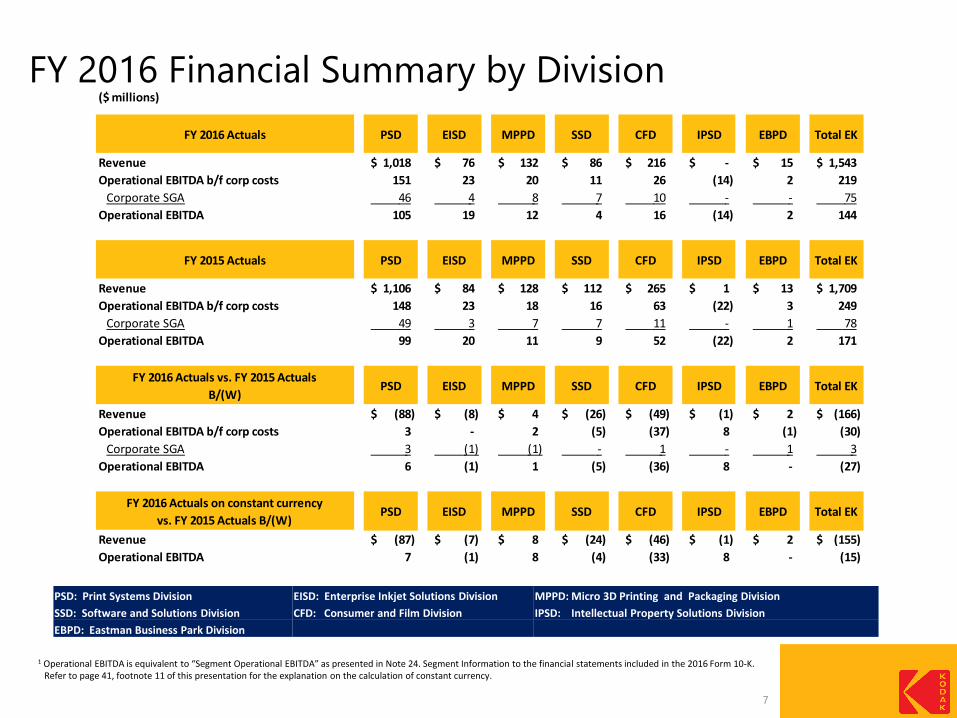
FY 2016 Financial Summary by Division
7
PSD: Print Systems Division EISD: Enterprise Inkjet Solutions Division MPPD: Micro 3D Printing and Packaging Division
SSD: Software and Solutions Division CFD: Consumer and Film Division IPSD: Intellectual Property Solutions Division
EBPD: Eastman Business Park Division
1 Operational EBITDA is equivalent to “Segment Operational EBITDA” as presented in Note 24. Segment Information to the financial statements included in the 2016 Form 10-K. Refer to page 41, footnote 11 of this presentation for the explanation on the calculation of constant currency.
($ millions)
FY 2016 Actuals PSD EISD MPPD SSD CFD IPSD EBPD Total EK
Revenue 1,018$ 76$ 132$ 86$ 216$ -$ 15$ 1,543$
Operational EBITDA b/f corp costs 151 23 20 11 26 (14) 2 219
Corporate SGA 46 4 8 7 10 - - 75
Operational EBITDA 105 19 12 4 16 (14) 2 144
FY 2015 Actuals PSD EISD MPPD SSD CFD IPSD EBPD Total EK
Revenue 1,106$ 84$ 128$ 112$ 265$ 1$ 13$ 1,709$
Operational EBITDA b/f corp costs 148 23 18 16 63 (22) 3 249
Corporate SGA 49 3 7 7 11 - 1 78
Operational EBITDA 99 20 11 9 52 (22) 2 171
FY 2016 Actuals vs. FY 2015 Actuals
B/(W)PSD EISD MPPD SSD CFD IPSD EBPD Total EK
Revenue (88)$ (8)$ 4$ (26)$ (49)$ (1)$ 2$ (166)$
Operational EBITDA b/f corp costs 3 - 2 (5) (37) 8 (1) (30)
Corporate SGA 3 (1) (1) - 1 - 1 3
Operational EBITDA 6 (1) 1 (5) (36) 8 - (27)
FY 2016 Actuals on constant currency
vs. FY 2015 Actuals B/(W)PSD EISD MPPD SSD CFD IPSD EBPD Total EK
Revenue (87)$ (7)$ 8$ (24)$ (46)$ (1)$ 2$ (155)$
Operational EBITDA 7 (1) 8 (4) (33) 8 - (15)
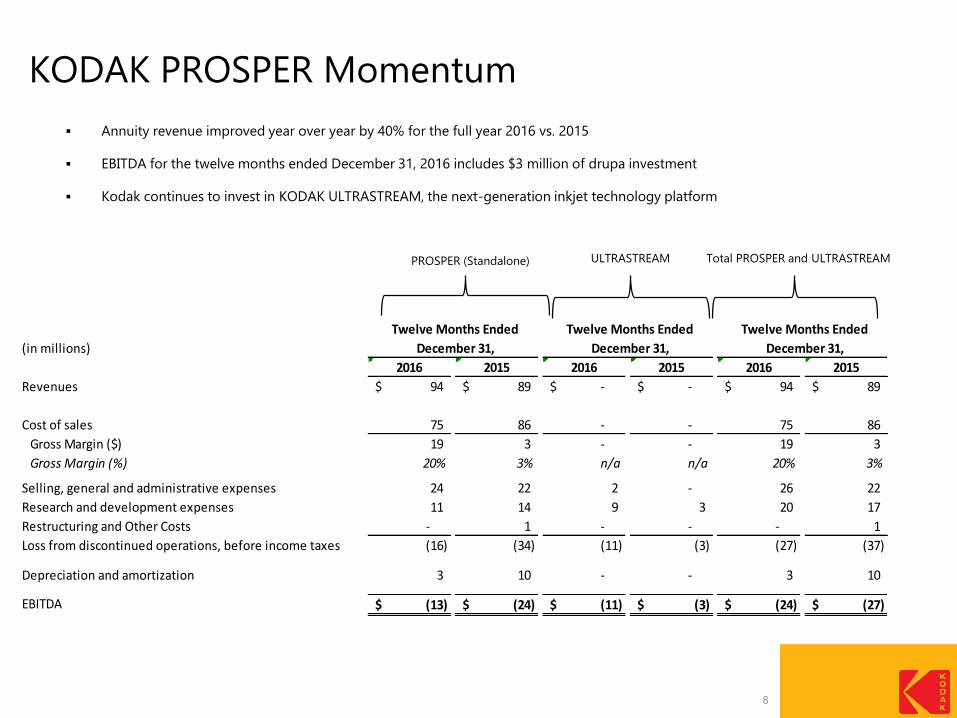
KODAK PROSPER Momentum
8
Annuity revenue improved year over year by 40% for the full year 2016 vs. 2015
EBITDA for the twelve months ended December 31, 2016 includes $3 million of drupa investment
Kodak continues to invest in KODAK ULTRASTREAM, the next-generation inkjet technology platform
PROSPER (Standalone) ULTRASTREAM Total PROSPER and ULTRASTREAM
(in millions)
Twelve Months Ended
December 31,
Twelve Months Ended
December 31,
Twelve Months Ended
December 31,
2016 2015 2016 2015 2016 2015
Revenues 94$ 89$ -$ -$ 94$ 89$
Cost of sales 75 86 - - 75 86
Gross Margin ($) 19 3 - - 19 3
Gross Margin (%) 20% 3% n/a n/a 20% 3%
Selling, general and administrative expenses 24 22 2 - 26 22
Research and development expenses 11 14 9 3 20 17
Restructuring and Other Costs - 1 - - - 1
Loss from discontinued operations, before income taxes (16) (34) (11) (3) (27) (37)
Depreciation and amortization 3 10 - - 3 10
EBITDA (13)$ (24)$ (11)$ (3)$ (24)$ (27)$

PROSPER Performance
9
PROSPER Annuities grew by 40% to $50M for the full year 2016 vs. 2015
Sales of PROSPER systems generate future annuity revenues.
9
2014 2015 2016
PROSPER Installed Base (Units) 39 55 65
Imprinting Systems Installed Base (Units) 974 1,144 1,299
Recurring Revenues ($ millions) $29 $36 $50
% Change 24% 40%
Twelve Months Ended
December 31

10
FY 2016 Summary
PROSPER sale taking longer than expected First year with GAAP Net Income since 2013 Improved capital structure Improved quality of earnings
Prosper annuities grew by 40 percent year over year Volume for KODAK SONORA Process Free Plates grew by 9 percent for the full year Volume for KODAK FLEXCEL NX Plates grew by 16 percent for the full year
Predictability: Year over year cash flow improved by $132 million net of debt repayments and
preferred stock proceeds Short of projected cash generation of $10 – $30 million
Met full year revenue guidance of $1,500 – $1,700 million Met high end for EBITDA Guidance of $135 – $150 million when adjusted for the
impact of foreign exchange

2017 Guidance
11
Full Year 2016 Operational EBITDA $144
Consumer Inkjet Reduction (13)
Impact of Foreign Exchange 2017 vs. 2016 (5)
Baseline 2016 Operational EBITDA $126
2017 Projected Operational EBITDA $130 - $145
Year over Year Growth 3% to 15%
($ millions)
2016 Full Year
Actual
2017 Full Year
Guidance
Revenue $1,543 $1,400 - $1,500
Operational EBITDA $144 $130 - $145

FINANCIAL
OVERVIEW
Interest and Debt Summary
Fourth Quarter Financial Results
Cost Reduction Update
Cash Performance
12

Interest and Debt Summary
13
($ millions) After
9/30/2016 Repayment $ Change
Debt:
First Lien Term Loan 402$ 402$ 0$
Second Lien Term Loan 262 - (262)
Total Term Debt 664 402 (262)
Series A Preferred Stock - 200 200
Interest: Rate
First Lien Term Loan 7.25% 29 29 0
Second Lien Term Loan 10.75% 28 - (28)
Total Term Debt Interest 57 29 (28)
Series A Preferred Stock Dividends 5.50% - 11 11
Total Cash Paid for Interest and Dividends 57$ 40$ (17)$
Weigthed Average Rate with Preferred 8.63% 6.67% -1.96%
Expensive Second Lien Term Loan repaid reducing debt by $262 million or 39%
Annual Interest savings of $28 million partially offset by $11 million Series A Preferred dividend
Effective interest rate lowered from 8.63% to 6.67% when including preferred stock
Annualized Impact of Repaying 2nd Lien Term Debt with Series A Preferred Stock and Balance Sheet Cash

($ millions)
2016 2015
Income (loss) from continuing operations before income taxes 78$ 2$
Provision for income taxes 32 30
Income (loss) from continuing operations 46 (28)
Loss from discontinued operations, net of income taxes (30) (47)
Net earnings (loss) 16$ (75)$
Twelve Months Ended December 31,
14
2015 to 2016 Net Earnings Improvement
Improvement of $91 million
Significant improvement in GAAP earnings full year 2016 driven by operational improvements, including depreciation and amortization expense reduction as
well as pension income
1 Operational EBITDA is equivalent to “Segment Operational EBITDA” as presented in Note 24. Segment Information to the financial statements included in the 2016 Form 10-K. Refer to page 41, footnote 11 of this presentation for the explanation on the calculation of constant currency.
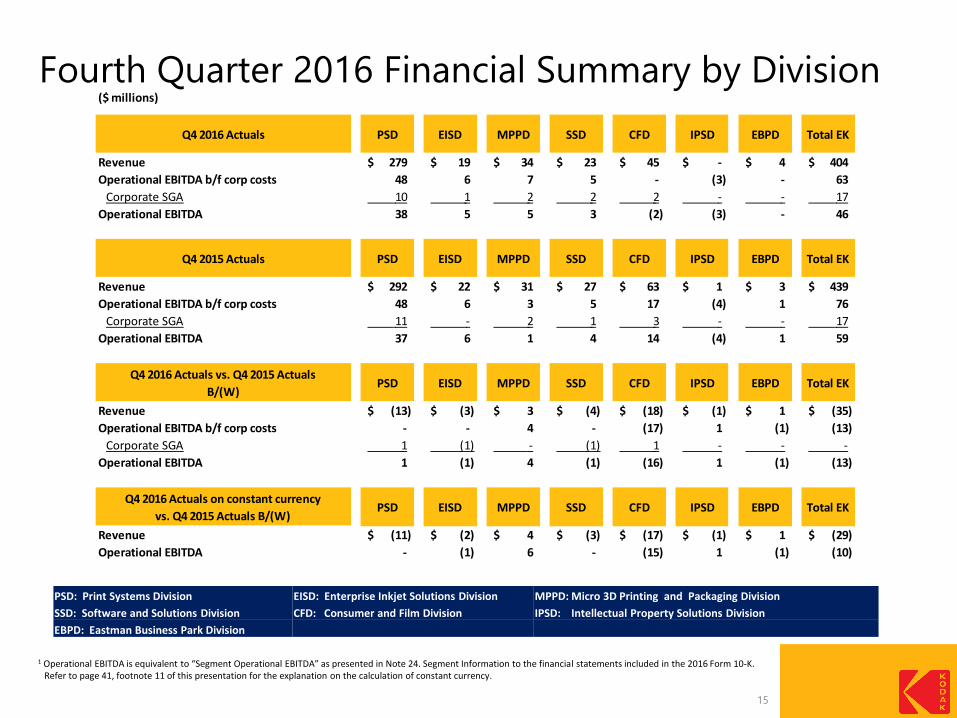
Fourth Quarter 2016 Financial Summary by Division
15
PSD: Print Systems Division EISD: Enterprise Inkjet Solutions Division MPPD: Micro 3D Printing and Packaging Division
SSD: Software and Solutions Division CFD: Consumer and Film Division IPSD: Intellectual Property Solutions Division
EBPD: Eastman Business Park Division
($ millions)
Q4 2016 Actuals PSD EISD MPPD SSD CFD IPSD EBPD Total EK
Revenue 279$ 19$ 34$ 23$ 45$ -$ 4$ 404$
Operational EBITDA b/f corp costs 48 6 7 5 - (3) - 63
Corporate SGA 10 1 2 2 2 - - 17
Operational EBITDA 38 5 5 3 (2) (3) - 46
Q4 2015 Actuals PSD EISD MPPD SSD CFD IPSD EBPD Total EK
Revenue 292$ 22$ 31$ 27$ 63$ 1$ 3$ 439$
Operational EBITDA b/f corp costs 48 6 3 5 17 (4) 1 76
Corporate SGA 11 - 2 1 3 - - 17
Operational EBITDA 37 6 1 4 14 (4) 1 59
Q4 2016 Actuals vs. Q4 2015 Actuals
B/(W)PSD EISD MPPD SSD CFD IPSD EBPD Total EK
Revenue (13)$ (3)$ 3$ (4)$ (18)$ (1)$ 1$ (35)$
Operational EBITDA b/f corp costs - - 4 - (17) 1 (1) (13)
Corporate SGA 1 (1) - (1) 1 - - -
Operational EBITDA 1 (1) 4 (1) (16) 1 (1) (13)
Q4 2016 Actuals on constant currency
vs. Q4 2015 Actuals B/(W)PSD EISD MPPD SSD CFD IPSD EBPD Total EK
Revenue (11)$ (2)$ 4$ (3)$ (17)$ (1)$ 1$ (29)$
Operational EBITDA - (1) 6 - (15) 1 (1) (10)

Cost Reduction Update
16
($ millions)
Year Ended
December
31, 2015
Year Ended
December
31, 2016
2015 - 2016
%
Reduction
Headcount 6,400 6,100 5%
Operating Expense $248 $212 15%
Corporate Costs $78 $75 4%
Year over Year Operating Expense Reductions
Year Ended
December
31, 2013
Year Ended
December
31, 2016
2013 - 2016
%
Reduction
Headcount 8,800 6,100 31%
Operating Expense $451 $212 53%
Corporate Costs $132 $75 43%
Operating Expense Reductions

17
2016 Fourth Quarter Cash Flow($ millions)
$15M Decline in Cash Flow from Net Earnings
$14M Decline in Cash Flow from Balance Sheet Changes
2016 Fourth Quarter reported change of $(56)M is a source of cash of $20M when excluding:
Debt Payments, net of Preferred Stock Proceeds; Effect of
exchange rate changes on cash; and Reduction in cash due to
deconsolidation of RED
Q4 2016 Q4 2015 Change
Primary Drivers of Cash:
Cash from Operations:
Net earnings 11$ 23$ (12)$
Depreciation and amortization 23 32 (9)
Pension and other postretirement income (37) (26) (11)
Non-cash restructuring costs, asset impairments and other charges, net - 2 (2)
Loss on deconsolidation of RED 15 - 15
Non-cash changes in employee benefit reserves (8) (20) 12
Other (3) 5 (8)
Payment of Claims - - -
(Increase) decrease in receivables (10) 3 (13)
Decrease in inventories 25 52 (27)
Increase in trade accounts payable 24 20 4
Decrease in liabilities excluding borrowings (15) (61) 46
Other (6) 18 (24)
Net cash provided by operating activities 19 48 (29)
Cash flows from investing activities:
Funding of restricted cash (1) (4) 3
Additions to properties (15) (18) 3
Proceeds from sales of businesses/assets, net 3 - 3
Reduction in cash due to deconsolidation of RED (3) - (3)
Marketable securities – sales 2 - 2
Net cash used in investing activities (14) (22) 8
Cash flows from financing activities:
Repayment of emergence credit facilities (262) (1) (261)
Net proceeds from the issuance of preferred stock 198 - 198
Equity transactions of noncontrolling interests 13 (1) 14
Other (1) 6 (7)
Net cash (used in) provided by financing activities (52) 4 (56)
Effect of exchange rate changes on cash (9) (4) (5)
Net (decrease) increase in cash and cash equivalents (56)$ 26$ (82)$
Cash and cash equivalents, beginning of period 490$ 521$
Cash and cash equivalents, end of period 434$ 547$

18
2016 Cash Flow($ millions)
$35M Improvement in Cash Flow from Net Earnings
$47M Improvement in Cash Flow from Balance Sheet Changes
2016 reported change of $(113)M is a use of cash of
$(19)M when excluding: Debt Payments, net of Preferred Stock Proceeds; Effect of
exchange rate changes on cash; and Reduction in cash due to
deconsolidation of RED
FY 2016 FY 2015 Change
Primary Drivers of Cash:
Cash from Operations:
Net earnings (loss) 16$ (75)$ 91$
Depreciation and amortization 105 145 (40)
Pension and other postretirement income (147) (107) (40)
Non-cash restructuring costs, asset impairments and other charges, net 20 9 11
Loss on deconsolidation of RED 15 - 15
Non-cash changes in employee benefit reserves (8) (25) 17
Other (4) 15 (19)
Payment of Claims - (10) 10
Decrease in receivables 37 15 22
Decrease in inventories 16 12 4
Increase in trade accounts payable 13 3 10
Decrease in liabilities excluding borrowings (74) (104) 30
Other (2) 27 (29)
Net cash used in operating activities (13) (95) 82
Cash flows from investing activities:
Release (funding) of restricted cash 8 (10) 18
Additions to properties (41) (43) 2
Proceeds from sales of businesses/assets, net 13 2 11
Reduction in cash due to deconsolidation of RED (3) - (3)
Marketable securities – sales 2 - 2
Net cash used in investing activities (21) (51) 30
Cash flows from financing activities:
Repayment of emergence credit facilities (282) (4) (278)
Net proceeds from the issuance of preferred stock 198 - 198
Equity transactions of noncontrolling interests 15 (1) 16
Other (3) 4 (7)
Net cash used in financing activities (72) (1) (71)
Effect of exchange rate changes on cash (7) (18) 11
Net decrease in cash and cash equivalents (113)$ (165)$ 52$
Cash and cash equivalents, beginning of period 547$ 712$
Cash and cash equivalents, end of period 434$ 547$

19
First Quarter 2015 through Fourth Quarter 2016 Cash Flow
19
$29M cash use(excluding Debt Payments,
net of Preferred Stock Proceeds)
$161M cash use(excluding Debt Payments)
1 Beginning Cash Balance reconciles to the Cash and cash equivalents, beginning of period and Ending Cash Balance reconciles to the Cash and cash equivalents, end of period in the Company’s Consolidated Statement of Cash Flows in the 2016 Form 10-K. Debt Payments reconciles to Repayment of emergence credit facilities on the Consolidated Statement of Cash Flows.
($ millions)
Q1 2015 Q2 2015 Q3 2015 Q4 2015 Q1 2016 Q2 2016 Q3 2016 Q4 2016
Beginning Cash Balance * 712 609 576 521 547 513 515 490
Cash Flow - Generation/(Use) (102) (32) (54) 27 (33) 3 (7) 8
Debt Payments * (1) (1) (1) (1) (1) (1) (18) (64)
0
100
200
300
400
500
600
700
800
Cash Balance from Q4 2014 - Q3 2016

2017 Cash Flow Outlook
20
Reflects generation of cash from Working Capital Legacy Payments include Foreign Pension of $15 million and Workers
Compensation of $10 million Working Capital is defined as the change in Trade Accounts Receivable plus
the change in Trade Accounts Payable plus the change in Net Inventories
* Capital expenditures include $13 million projected for the FLEXCEL NX packaging plate line capacity expansion
($ millions)
Operational EBITDA $130 - $145
Working Capital 30
Interest and Dividend Payments (40)
Capital Expenditures* (35)
Legacy Payments (32)
PROSPER (20)
Cash Paid for Taxes (primarily outside U.S.) (20)
Restructuring Payments (8)
Other (6)
Cash Generation $0 - $10
21
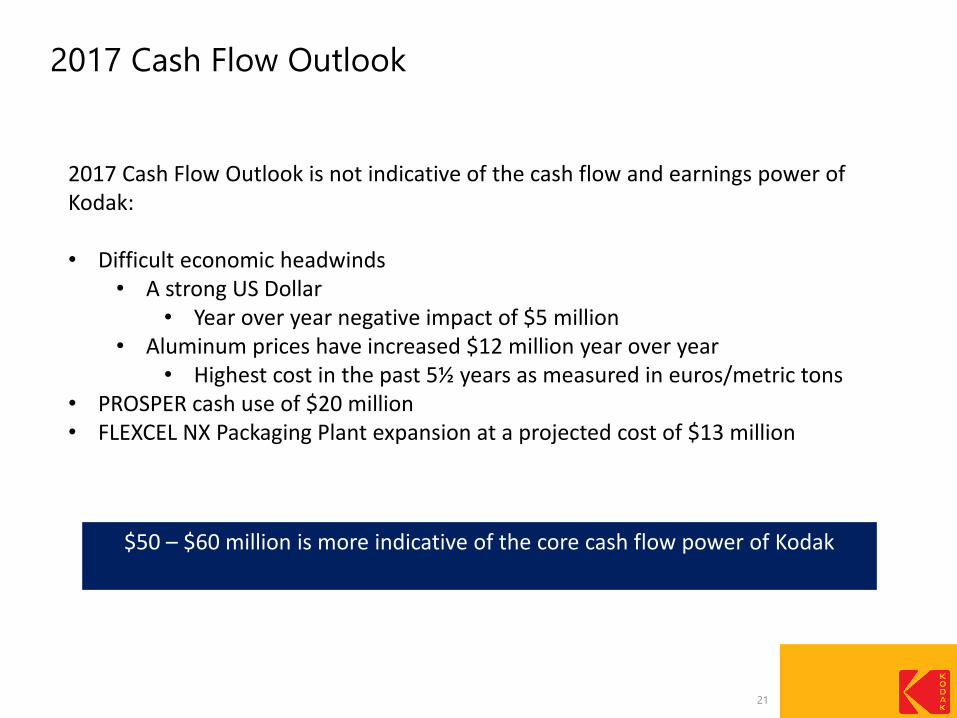
2017 Cash Flow Outlook is not indicative of the cash flow and earnings power of Kodak:
• Difficult economic headwinds• A strong US Dollar
• Year over year negative impact of $5 million• Aluminum prices have increased $12 million year over year
• Highest cost in the past 5½ years as measured in euros/metric tons• PROSPER cash use of $20 million• FLEXCEL NX Packaging Plant expansion at a projected cost of $13 million
2017 Cash Flow Outlook
$50 – $60 million is more indicative of the core cash flow power of Kodak

Q&A
22

CONCLUDING REMARKS
23

APPENDIX
24

Non-GAAP MeasuresIn this fourth quarter and full year 2016 earnings presentation, reference is made to the following non-GAAP financial measures:
• Cash usage excluding foreign currency and debt prepayments net of preferred stock proceeds;
• Improvement in Prosper EBITDA;
• Decline in cash usage excluding debt prepayments net of preferred stock proceeds;
• Operational EBITDA;
• Operational EBITDA and Revenues on a constant currency basis;
• Operational EBITDA on a constant currency basis excluding Consumer Inkjet Operational EBITDA before corporate costs;
• Operational EBITDA on a constant currency basis including PROSPER EBITDA and overhead costs previously allocated to PROSPER but excluding
Consumer Inkjet Operational EBITDA before Corporate Costs;
• Consumer Inkjet Operational EBITDA before corporate costs;
• Flexcel NX revenues on a constant currency basis;
• Kodak Technology Solutions revenues on a constant currency basis;
• Consumer Inkjet revenues on a constant currency basis;
• Improvement in Operating performance excluding depreciation and amortization and pension and other postretirement income;
• Packaging Business Operational EBITDA before corporate costs on a constant currency basis;
• Improvement in PROSPER Standalone Operational EBITDA;
• Improvement in net earnings excluding loss on deconsolidation of RED;
• Cash generated / used excluding debt repayments net of preferred stock proceeds, deconsolidation of RED and effect of exchange rates on cash; and
• Operational EBITDA before corporate costs
Kodak believes that these non-GAAP measures represent important internal measures of performance as used by management. Accordingly, where
they are provided, it is to give investors the same financial data management uses with the belief that this information will assist the investment
community in properly assessing the underlying performance of Kodak, its financial condition, results of operations and cash flow.
Kodak’s segment measure of profit and loss is an adjusted earnings before interest, taxes, depreciation and amortization (“Operational EBITDA”).
This presentation contains a forward-looking estimate of full-year 2017 Operational EBITDA and full-year Cash Generation. Kodak is unable to provide a
reconciliation of full-year 2017 Operational EBITDA to a forward-looking estimate of GAAP net income / loss and a reconciliation of full-year Cash
Generation to changes in cash and cash equivalents because projected GAAP net income / loss for the full year and changes in cash and cash
equivalents would require inclusion of the projected impact of future excluded items, including items that are not currently determinable or dependent on
future events which may be uncertain or outside of Kodak’s control, such as assets sales, asset impairments, foreign exchange gains / losses, changes
in the fair value of the conversion option derivative liability, unanticipated non-recurring items not reflective of ongoing operations, or other items. Due to
the uncertainty of the likelihood, amount and timing of any such items, Kodak does not have information available to provide quantitative reconciliations of
full-year 2017 projected net income / loss and changes in cash and cash equivalents.
25

Non-GAAP Measures
The following table reconciles the most directly comparable GAAP measure of decrease in cash and cash equivalents,
end of period, to the use of cash excluding foreign currency and debt prepayments net of preferred stock proceeds for
the twelve months ended December 31, 2016:
Refer to Page 41 of this presentation for footnote explanations.
26
(in millions)December 31,
2016
December 31,
2015
Change 2016 vs
2015
Cash and cash equivalents, end of period (GAAP Basis) * 434$ 547$ (113)$
Repayment of emergence credit facilities 282
Net Proceeds from issuance of preferred stock (198)
Effect of exchange rate changes on cash 7
Cash usage excluding foreign currency and debt prepayments net of preferred stock proceeds (22)$
* Cash and cash equivalents, end of period for 2016 and 2015 includes $433 million and $546 million, respectively, of cash reported in
the Statement of Financial Position and $1 million and $1 million, respectively, of cash reported in Current assets held for sale.

Non-GAAP Measures
The following tables reconcile the most directly comparable GAAP measure of Loss from discontinued operations, net
of income taxes to the improvement in PROSPER EBITDA for the three and twelve months ended December 31, 2016
and 2015, respectively:
Refer to Page 41 of this presentation for footnote explanations.
27
(in millions) YTD 2016 YTD 2015 $ Change % Change
Loss from discontinued operations, net of income taxes (GAAP basis) (30)$ (47)$ 17$ -36%
Loss from other discontinued operations (2) (8) 6 -75%
PROSPER loss from discontinued operations, net of income taxes (28) (39) 11 -28%
Depreciation and amortization 3 10 (7) -70%
Provision for income taxes 1 2 (1) -50%
PROSPER EBITDA (24)$ (27)$ 3$ -11%
(in millions) Q4 2016 Q4 2015 $ Change % Change
Loss from discontinued operations, net of income taxes (GAAP basis) (1)$ (7)$ 6$ -86%
Depreciation and amortization - 2 (2) -100%
PROSPER EBITDA (1)$ (5)$ 4$ -80%

Non-GAAP Measures
The following table reconciles the most directly comparable GAAP measure of decrease in cash and cash equivalents,
end of period, to the decline in cash usage excluding debt prepayments net of preferred stock proceeds for the twelve
months ended December 31, 2016 and 2015, respectively:
Refer to Page 41 of this presentation for footnote explanations.
28
(in millions) December 31,
2016
December 31,
2015
December 31,
2014
Change 2016
vs 2015
Change 2015
vs 2014
Improvement
in Cash Decline
2016 vs 2015
Cash and cash equivalents, end of period (GAAP Basis) * 434$ 547$ 712$ (113)$ (165)$ 52$
Repayment of emergence credit facilities 282 4 278
Net Proceeds from issuance of preferred stock (198) - (198)
Cash usage excluding debt prepayments net of preferred stock proceeds (29)$ (161)$ 132$
* Cash and cash equivalents, end of period for 2016 and 2015 includes $433 million and $546 million, respectively, of cash reported in
the Statement of Financial Position and $1 million and $1 million, respectively, of cash reported in Current assets held for sale.
There is no cash reported in Current assets held for sale at the end of 2014

Non-GAAP Measures
The following table reconciles to the most directly comparable GAAP measure of Net Income (Loss) Attributable to
Eastman Kodak Company to Operational EBITDA, Operational EBITDA on a constant currency basis, Operational
EBITDA on a constant currency basis excluding Consumer Inkjet Operational EBITDA before corporate costs,
Operational EBITDA on a constant currency basis including Prosper EBITDA and overhead costs previously allocated
to PROSPER but excluding Consumer Inkjet Operational EBITDA before corporate costs for the twelve months ended
December 31, 2016 and 2015, respectively:
Refer to Page 41 of this presentation for footnote explanations.
29
(in millions)
YTD 2016 YTD 2015 $ Change % Change
Net Income (Loss) Attributable to Eastman Kodak Company (GAAP basis) 15$ (80)$ 95$ -119%
Net income attributable to noncontrolling interests (10) 1 5 (4) -80%
Net Earnings (Loss) 16$ (75)$ 91$ -121%
All Other (1) (3) (4) 1 -25%
Corporate components of pension and OPEB income (2) (161) (133) (28) 21%
Depreciation and amortization 102 134 (32) -24%
Restructuring costs and other (3) 16 37 (21) -57%
Overhead supporting, but not directly absorbed by discontinued operations (4) 15 21 (6) -29%
Stock-based compensation 8 17 (9) -53%
Change in U.S. vacation benefits (5) - (16) 16 -100%
Consulting and other costs (6) 5 14 (9) -64%
Idle costs (7) 3 3 - 0%
Manufacturing costs originally planned to be absorbed by silver metal mesh touch screen
production (8) 3 2 1 50%
Other operating expense, net excluding gain related to UniPixel termination (9) 16 5 11 220%
Interest expense (10) 60 63 (3) -5%
Loss on early extinguishment of debt (10) 4 - 4 n/a
Other charges, net (10) 4 21 (17) -81%
Reorganization items, net (10) (6) 5 (11) -220%
Provision for income taxes (10) 32 30 2 7%
Loss from discontinued operations, net of income taxes (10) 30 47 (17) -36%
Operational EBITDA 144$ 171$ (27)$ -16%
Impact of foreign exchange (11) 12
Operational EBITDA on a constant currency basis 156$ 171$ (15)$ -9%
Less: Consumer Inkjet Operational EBITDA before Corporate Costs (23) (45) 22 -49%
Operational EBITDA on a constant currency basis excluding Consumer Inkjet
Operational EBITDA before Corporate Costs 133$ 126$ 7$ 6%
Add: Prosper EBITDA (24) (27) 3 -11%
Add: Overhead supporting, but not directly absorbed by discontinued operations (4) (15) (21) 6 -29%
Operational EBITDA on a constant currency basis including Prosper EBITDA and
overhead costs previously allocated to Prosper but excluding Consumer Inkjet
Operational EBITDA before Corporate Costs 94$ 78$ 16$ 21%

Non-GAAP Measures
The following table reconciles to the most directly comparable GAAP measure of Net Income Attributable to Eastman
Kodak Company to Operational EBITDA, Operational EBITDA on a constant currency basis, Operational EBITDA on a
constant currency basis excluding Consumer Inkjet Operational EBITDA before corporate costs, Operational EBITDA
on a constant currency basis including PROSPER EBITDA and overhead costs previously allocated to PROSPER but
excluding Consumer Inkjet Operational EBITDA before corporate costs for the three months ended December 31, 2016
and 2015, respectively:
Refer to Page 41 of this presentation for footnote explanations.
30
(in millions)
Q4 2016 Q4 2015 $ Change % Change
Net Income Attributable to Eastman Kodak Company (GAAP basis) 10$ 24$ (14)$ -58%
Net income attributable to noncontrolling interests 1 (1) 2 -200%
Net Earnings 11$ 23$ (12)$ -52%
All Other (1) (1) 1 (2) -200%
Corporate components of pension and OPEB income (2) (40) (33) (7) 21%
Depreciation and amortization 23 29 (6) -21%
Restructuring costs and other (3) 3 9 (6) -67%
Overhead supporting, but not directly absorbed by discontinued operations (4) 3 5 (2) -40%
Stock-based compensation 2 1 1 100%
Change in U.S. vacation benefits (5) - (16) 16 -100%
Consulting and other costs (6) 1 2 (1) -50%
Idle costs (7) 1 1 - 0%
Manufacturing costs originally planned to be absorbed by silver metal mesh touch screen
production (8) 1 2 (1) -50%
Other operating expense 14 2 12 600%
Interest expense 12 17 (5) -29%
Loss on early extinguishment of debt 4 - 4 n/a
Other charges, net 1 6 (5) -83%
Reorganization items, net (6) - (6) n/a
Provision for income taxes 16 3 13 433%
Loss from discontinued operations, net of income taxes 1 7 (6) -86%
Operational EBITDA 46$ 59$ (13)$ -22%
Impact of foreign exchange (11) 3
Operational EBITDA on a constant currency basis 49$ 59$ (10)$ -17%
Less: Consumer Inkjet Operational EBITDA before Corporate Costs (4) (9) 5 -56%
Operational EBITDA on a constant currency basis excluding Consumer Inkjet
Operational EBITDA before Corporate Costs 45$ 50$ (5)$ -10%
Add: Prosper EBITDA (1) (5) 4 -80%
Add: Overhead supporting, but not directly absorbed by discontinued operations (4) (3) (5) 2 -40%
Operational EBITDA on a constant currency basis including Prosper EBITDA and
overhead costs previously allocated to Prosper but excluding Consumer Inkjet
Operational EBITDA before Corporate Costs 41$ 40$ 1$ 3%

Non-GAAP Measures
The following tables reconcile the most directly comparable GAAP measure of Consumer and Film Division Operational
EBITDA (Segment Measure) to Consumer Inkjet Operational EBITDA before corporate costs for the three and twelve
months ended December, 31, 2016 and 2015, respectively:
Refer to Page 41 of this presentation for footnote explanations.
31
(in millions) YTD 2016 YTD 2015 $ Change % Change
Consumer and Film Division Operational EBITDA (Segment Measure) 16$ 52$ (36)$ -69%
Consumer and Film Division Corporate Costs 10 10 - 0%
Motion Picture, Industrial Chemicals and Films and Consumer Products
Operational EBITDA before Corporate Costs (3) (17) 14 -82%
Consumer Inkjet Operational EBITDA before Corporate Costs 23$ 45$ (22)$ -49%
(in millions) Q4 2016 Q4 2015 $ Change % Change
Consumer Inkjet Operational EBITDA before Corporate Costs 4$ 9$ (5)$ -56%
Motion Picture, Industrial Chemicals and Films and Consumer Products
Operational EBITDA before Corporate Costs (4) 7 (11) -157%
Consumer and Film Division Corporate Costs (2) (2) - 0%
Consumer and Film Division Operational EBITDA (Segment Measure) (2)$ 14$ (16)$ -114%

Non-GAAP Measures
The following tables reconcile the most directly comparable GAAP measure of Revenues (Segment Measure) to the
change in FLEXCEL NX, Kodak Technology Solutions and Consumer Inkjet revenues on a constant currency basis for
the twelve months ended December 31, 2016 and 2015, respectively:
Refer to Page 41 of this presentation for footnote explanations.
32
(in millions) YTD 2016 YTD 2015 $ Change % Change
FLEXCEL NX revenues as reported (GAAP Basis) 94$ 86$ 8$ 9%
Impact of foreign exchange (11) 3 3
FLEXCEL NX revenues on a constant currency basis 97$ 86$ 11$ 13%
(in millions) YTD 2016 YTD 2015 $ Change % Change
Kodak Technology Solutions revenues as reported (GAAP Basis) 19$ 42$ (23)$ -55%
Impact of foreign exchange (11) 2 2
Kodak Technology Solutions revenues on a constant currency basis 21$ 42$ (21)$ -50%
(in millions) YTD 2016 YTD 2015 $ Change % Change
Consumer Inkjet revenues as reported (GAAP Basis) 42$ 74$ (32)$ -43%
Impact of foreign exchange (11) 1 1
Consumer Inkjet revenues on a constant currency basis 43$ 74$ (31)$ -42%

Non-GAAP Measures
The following table reconciles the most directly comparable GAAP measure of Net Income (Loss) Attributable to
Eastman Kodak Company to the improvement in Operating performance excluding depreciation and amortization and
pension and other postretirement income for the twelve months ended December 31, 2016 and 2015, respectively:
Refer to Page 41 of this presentation for footnote explanations.
33
(in millions) YTD 2016 YTD 2015 $ Change
Net Income (Loss) Attributable to Eastman Kodak Company (GAAP basis) 15$ (80)$ 95$
Net income attributable to noncontrolling interests (10) 1 5 (4)
Net Earnings (Loss) 16$ (75)$ 91$
Depreciation and amortization 105 145 (40)
Pension and other postretirement income (147) (107) (40)
Operating Performance excluding depreciation and amortization and pension and other
postretirement income (26)$ (37)$ 11$

Non-GAAP Measures
The following table reconciles the most directly comparable GAAP measure of Micro 3D Printing and Packaging
Operational EBITDA (Segment Measure) to the Packaging Business Operational EBITDA before corporate costs on a
constant currency basis for the twelve months ended December 31, 2016 and 2015, respectively:
Refer to Page 41 of this presentation for footnote explanations.
34
(in millions) YTD 2016 YTD 2015 $ Change
Micro 3D Printing and Packaging Operational EBITDA (Segment Measure) 12$ 11$ 1$
Micro 3D Printing and Packaging Division Corporate Costs 8 7 1
Micro 3D Printing Operational EBITDA before Corporate Costs 17 19 (2)
Packaging Business Operational EBITDA Before Corporate Costs 37 37 -
Impact of foreign exchange (11) 7 -
Packaging Business Operational EBITDA before Corporate Costs on a
constant currency basis 44$ 37$ 7$

Non-GAAP Measures
The following tables reconcile the most directly comparable GAAP measure of Loss from discontinued operations, net
of income taxes to the improvement in PROSPER Standalone Operational EBITDA for the twelve months ended
December 31, 2016 and 2015, respectively:
Refer to Page 41 of this presentation for footnote explanations.
35
(in millions) YTD 2016 YTD 2015 $ Change
Loss from discontinued operations, net of income taxes (GAAP basis) (30)$ (47)$ 17$
Loss from other discontinued operations 2 8 (6)
Provision for income taxes 1 2 (1)
ULTRASTREAM loss from discontinued operations, before income taxes 11 3 8
PROSPER standalone loss from discontinued operations, before income taxes (16) (34) 18
PROSPER standalone depreciation and amortization 3 10 (7)
PROSPER Standalone Operational EBITDA (13)$ (24)$ 11$

Non-GAAP Measures
The following table reconciles the most directly comparable GAAP measure of Net Income (Loss) Attributable to
Eastman Kodak Company to the improvement in net earnings excluding loss on deconsolidation of RED for the twelve
months ended December 31, 2016 and 2015, respectively:
Refer to Page 41 of this presentation for footnote explanations.
36
(in millions) YTD 2016 YTD 2015 $ Change
Net Income (Loss) Attributable to Eastman Kodak Company (GAAP basis) 15$ (80)$ 95$
Net income attributable to noncontrolling interests (10) 1 5 (4)
Net Earnings (Loss) 16$ (75)$ 91$
Loss on deconsolidation of RED 15 - 15
Net Earnings (Loss) excluding loss on deconsolidation of RED 31$ (75)$ 106$

Non-GAAP Measures
The following table reconciles the most directly comparable GAAP measure of decrease in cash and cash equivalents,
end of period, to Cash generated excluding debt repayments net of preferred stock proceeds, deconsolidation of RED
and effect of exchange rates on cash for the three months ended December 31, 2016:
Refer to Page 41 of this presentation for footnote explanations.
37
(in millions)December 31,
2016
September 30,
2016
Q4 2016 vs Q3
2016
Cash and cash equivalents, end of period (GAAP Basis) * 434$ 490$ (56)$
Repayment of emergence credit facilities 262
Net Proceeds from issuance of preferred stock (198)
Deconsolidation of RED cash and cash equivalents 3
Effect of exchange rate changes on cash 9
Cash generated excluding debt repayments net of preferred stock proceeds,
deconsolidation of RED and effect of exchange rates on cash 20$
* Cash and cash equivalents, end of period for 2016 and 2015 includes $433 million and $546 million, respectively, of cash reported in
the Statement of Financial Position and $1 million and $1 million, respectively, of cash reported in Current assets held for sale.
Non-GAAP Measures
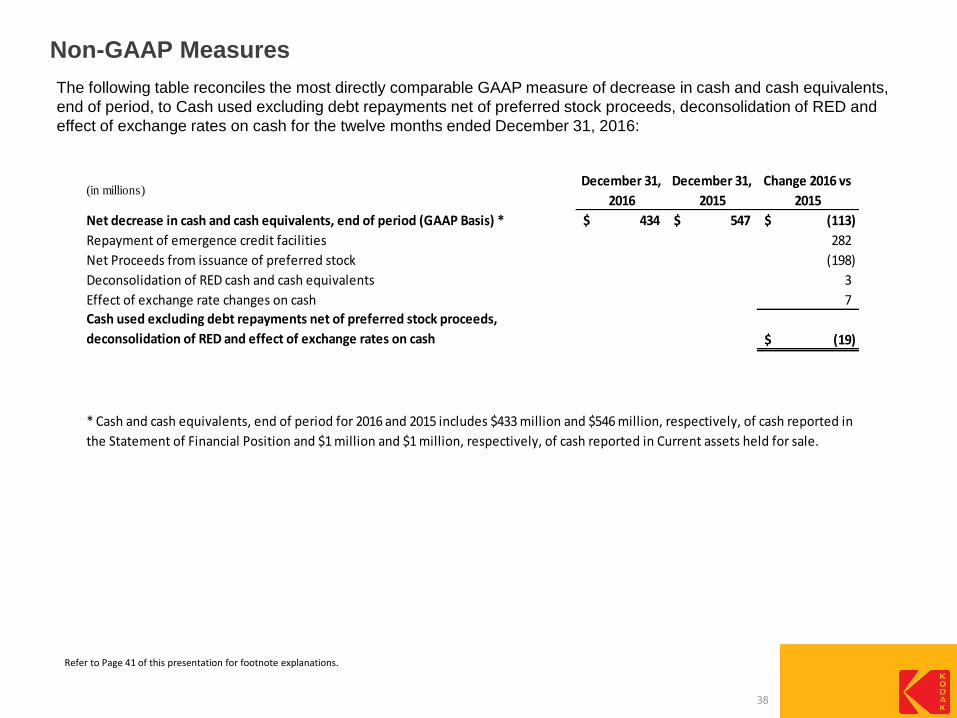
The following table reconciles the most directly comparable GAAP measure of decrease in cash and cash equivalents,
end of period, to Cash used excluding debt repayments net of preferred stock proceeds, deconsolidation of RED and
effect of exchange rates on cash for the twelve months ended December 31, 2016:
Refer to Page 41 of this presentation for footnote explanations.
38
(in millions)December 31,
2016
December 31,
2015
Change 2016 vs
2015
Net decrease in cash and cash equivalents, end of period (GAAP Basis) * 434$ 547$ (113)$
Repayment of emergence credit facilities 282
Net Proceeds from issuance of preferred stock (198)
Deconsolidation of RED cash and cash equivalents 3
Effect of exchange rate changes on cash 7
Cash used excluding debt repayments net of preferred stock proceeds,
deconsolidation of RED and effect of exchange rates on cash (19)$
* Cash and cash equivalents, end of period for 2016 and 2015 includes $433 million and $546 million, respectively, of cash reported in
the Statement of Financial Position and $1 million and $1 million, respectively, of cash reported in Current assets held for sale.

Non-GAAP Measures
The following tables reconcile the most directly comparable GAAP measure of Operational EBITDA (Segment
Measure) to Operational EBITDA before Corporate Cost for each Division for the twelve months ended December 31,
2016, and 2015, respectively:
Refer to Page 41 of this presentation for footnote explanations.
39
(in millions)
Systems
Enterprise
Inkjet
Systems
Micro 3D
Printing and
Packaging
Software and
Solutions
Consumer
and Film
Intellectual
Property
Solutions
Eastman
Business
Park Total
Operational EBITDA (Segment Measure) 105$ 19$ 12$ 4$ 16$ (14)$ 2$ 144$
Corporate Costs 46 4 8 7 10 - - 75
Operational EBITDA Before Corporate Costs 151$ 23$ 20$ 11$ 26$ (14)$ 2$ 219$
(in millions)
Systems
Enterprise
Inkjet
Systems
Micro 3D
Printing and
Packaging
Software and
Solutions
Consumer
and Film
Intellectual
Property
Solutions
Eastman
Business
Park Total
Operational EBITDA (Segment Measure) 99$ 20$ 11$ 9$ 52$ (22)$ 2$ 171$
Corporate Costs 49 3 7 7 11 - 1 78
Operational EBITDA Before Corporate Costs 148$ 23$ 18$ 16$ 63$ (22)$ 3$ 249$
For the Year Ended December 31, 2016
For the Year Ended December 31, 2015

Non-GAAP Measures
The following tables reconcile the most directly comparable GAAP measure of Operational EBITDA (Segment
Measure) to Operational EBITDA before Corporate Cost for each Division for the three months ended December 31,
2016, and 2015, respectively:
Refer to Page 41 of this presentation for footnote explanations.
40
(in millions)
Systems
Enterprise
Inkjet
Systems
Micro 3D
Printing and
Packaging
Software and
Solutions
Consumer
and Film
Intellectual
Property
Solutions
Eastman
Business
Park Total
Operational EBITDA (Segment Measure) 38$ 5$ 5$ 3$ (2)$ (3)$ -$ 46$
Corporate Costs 10 1 2 2 2 - - 17
Operational EBITDA Before Corporate Costs 48$ 6$ 7$ 5$ -$ (3)$ -$ 63$
(in millions)
Systems
Enterprise
Inkjet
Systems
Micro 3D
Printing and
Packaging
Software and
Solutions
Consumer
and Film
Intellectual
Property
Solutions
Eastman
Business
Park Total
Operational EBITDA (Segment Measure) 37$ 6$ 1$ 4$ 14$ (4)$ 1$ 59$
Corporate Costs 11 - 2 1 3 - - 17
Operational EBITDA Before Corporate Costs 48$ 6$ 3$ 5$ 17$ (4)$ 1$ 76$
For the Three Months Ended December 31, 2016
For the Three Months Ended December 31, 2015

Non-GAAP MeasuresFootnote Explanations:(1) RED utilities variable interest entity (interest and depreciation of RED are included in the respective lines in the table).
(2) Composed of interest cost, expected return on plan assets, amortization of actuarial gains and losses, and curtailments and settlement components of pension and other postretirement benefit expenses.
(3) Restructuring costs and other as reported in the Consolidated Statement of Operations plus $1 million of inventory write-downs included in cost of revenues for the twelve months ended December 31, 2016.
(4) Primarily consists of costs for shared resources allocated to the PROSPER Enterprise Inkjet business discontinued operation in the prior-year periods which are now included in the results of continuing operations and an estimate of costs for shared resources which would have been allocated to the PROSPER Enterprise Inkjet business discontinued operation in the current-year period had the business remained in continuing operations.
(5) In the fourth quarter of 2015, Kodak changed the timing of when affected U.S. employees earn their vacation benefits, which reduced Kodak’s obligation to employees and the related accrual by $17 million as of December 31, 2015. The reduction in the accrual impacted gross profit by approximately $9 million, SG&A by approximately $5 million, R&D by approximately $2 million, and discontinued operations by $1 million.
(6) Consulting and other costs are primarily related to professional services provided for corporate strategic initiatives in 2016 and 2015.
(7) Consists of third party costs such as security, maintenance, and utilities required to maintain land and buildings in certain locations not used in any Kodak operations.
(8) Consists of manufacturing costs originally planned to be absorbed by silver metal mesh touch screen production that are now excluded from the measure of segment profit and loss.
(9) In 2015 a $3 million gain was recognized related to assets that were acquired for no monetary consideration as a part of the termination of the relationship with UniPixel. The gain was reported in Other operating (income) expense, net in the Consolidated Statement of Operations. Other operating (income) expense, net is typically excluded from the segment measure. However, this particular gain was included in the Micro 3D Printing and Packaging segment’s earnings in 2015.
(10) As reported in the Consolidated Statement of Operations.
(11) The change in revenues and Operational EBITDA on a constant currency basis, as presented in this presentation, is calculated by using average foreign exchange rates for the three or twelve months ended December 31, 2015, rather than the actual exchange rates in effect for the three or twelve months ended December 31, 2016.
41

42