fr family f mc family - fujitsu global€¦ · starting language tools, such as a compiler and...
TRANSCRIPT

FR FAMILY F2MC FAMILY
32/16/8-BIT MICROCONTROLLER SOFTUNE FIRST STEP GUIDE
- 2 -
Preface Purpose of Manual This manual provides a general description of Softune, the procedure for software development using Softune, and the functions of Softune. This manual is intended to give a quick understanding of how to operate Softune efficiently. Readers This manual is intended for engineers to actually develop software using Softune. Features of Manual This manual introduces the procedure for software development using Softune through the use of simple samples. This manual also describes the useful functions and technical knowledge of Softune. Versions of Tools The versions of the tools used in this manual are as follows: FFMC-16 Family Softune Professional Pack REV: 300010
• Softune Workbench V30L26 • Softune C Compiler V30L06 • Softune Assembler Pack REV:300009 • Softune C Checker V30L07 • Softune C Analyzer V30L09
FFMC-16 Family Softune REALOS/907 Basic Version REV: 300004
• Softune REALOS/907 Kernel V30L05 • Softune REALOS Configurator V30L08 • Softune REALOS/907 Analyzer V30L21
- 3 -
Contents Chapter 1 General 4 -7 page
This chapter describes the functions and features of Softune. Chapter 2 Installing 8 - 10 page
This chapter explains how to install Softune. Chapter 3 Development Procedure 11 page
This chapter covers the procedure for software development using Softune. Chapter 4 Tutorial 12 - 110 page
This chapter gives examples of software development using the FFMC-16 family Softune V3, including Project creation and Debugger operation through the use of simple samples.
Chapter 5 Useful Functions 111 - 124 page
This chapter describes the useful functions of Softune Workbench. Chapter 6 Operating C Checker 125 - 131 page
This chapter explains how to operate the C Checker. Chapter 7 Operating C Analyzer 132 - 140 page
This chapter explains how to operate the C Analyzer. Chapter 8 Program Development using Softune REALOS 141 - 171 page
This chapter explains how to operate the Project using REALOS. Appendix A How to Create an I/O Area Module 172 - 175 page
Appendix A explains how to create an I/O area module. Appendix B Q&A 176 - 218 page
Appendix B lists common questions and technical knowledge in question-and-answer form.

- 4 -
Chapter 1 General Outline of Softune • 1.1 Functions • 1.2 Features
- 5 -
1.1 Functions Manager Function Operations, such as coding, debugging and compiling, performed in software development are supported in a comprehensive manner. This function enables the user to perform software development without paying attention to starting language tools, such as a compiler and Debugger, and creating option setting files. Debugging Function Three Debuggers (Simulator Debugger, emulator Debugger and monitor Debugger) are supported; each can be used as needed. It is also possible to easily set the environments, such as the debugging environment and operating environment of the MCU. Function for Checking and Analyzing Source Files The Softune Professional Pack has C Checker and C Analyzer tools to check and analyze source files written in C. Function for Setting Editors and Tools Although Softune has an editor, any editor can be loaded and used. Any execution file can be set and executed from the Softune Workbench desktop. This function can be used to install source management tools (Visual Source Safe, Clear Case, etc.) into the system. For details, refer to the manual for linking the corresponding tool. Function for Linking Other Tools Installation of the communication module enables linking with other tools. Link with ZIPC (CATS CO.,LTD.) enables simulation using a virtual target and debugging linked with the state transition table. For details, refer to the manual for linking the corresponding tool.
- 6 -
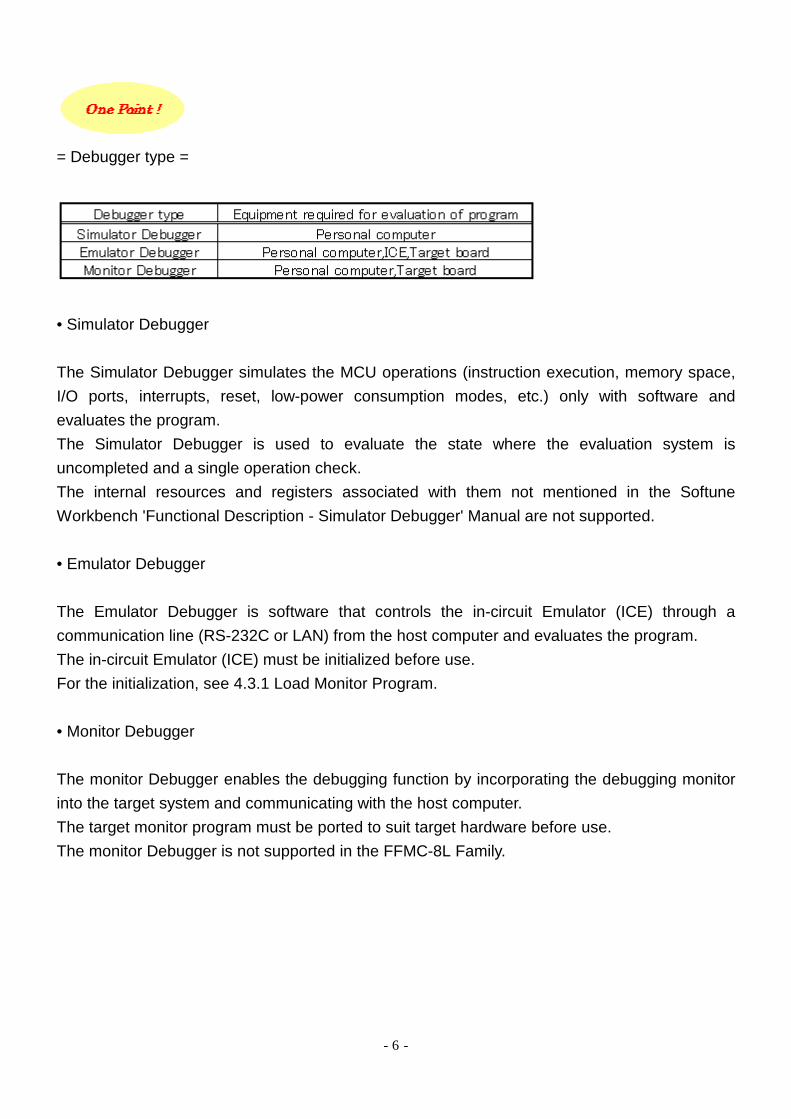
= Debugger type =
• Simulator Debugger The Simulator Debugger simulates the MCU operations (instruction execution, memory space, I/O ports, interrupts, reset, low-power consumption modes, etc.) only with software and evaluates the program. The Simulator Debugger is used to evaluate the state where the evaluation system is uncompleted and a single operation check. The internal resources and registers associated with them not mentioned in the Softune Workbench 'Functional Description - Simulator Debugger' Manual are not supported. • Emulator Debugger The Emulator Debugger is software that controls the in-circuit Emulator (ICE) through a communication line (RS-232C or LAN) from the host computer and evaluates the program. The in-circuit Emulator (ICE) must be initialized before use. For the initialization, see 4.3.1 Load Monitor Program. • Monitor Debugger The monitor Debugger enables the debugging function by incorporating the debugging monitor into the target system and communicating with the host computer. The target monitor program must be ported to suit target hardware before use. The monitor Debugger is not supported in the FFMC-8L Family.
- 7 -
1.2 Features Features
• Fully integrated development environment
• High-performance C and C++ compilers (C++ Compiler only for FR)
• Development support by C and C++ Checkers, and C and C++ Analyzers (C++ Checker and Analyzer only for FR)
• Development support using REALOS (Configurator and Analyzer)
• Installation of user tools (source generation management tool, etc.)
• Link with external editors (Hidemaru, WZ, MIFES, etc.)
• Supports both Japanese and English versions (menu, help, manual)
• Substantial solutions to linkage with CASE tools (ZIPC, etc.)
- 8 -
Chapter 2 Installing
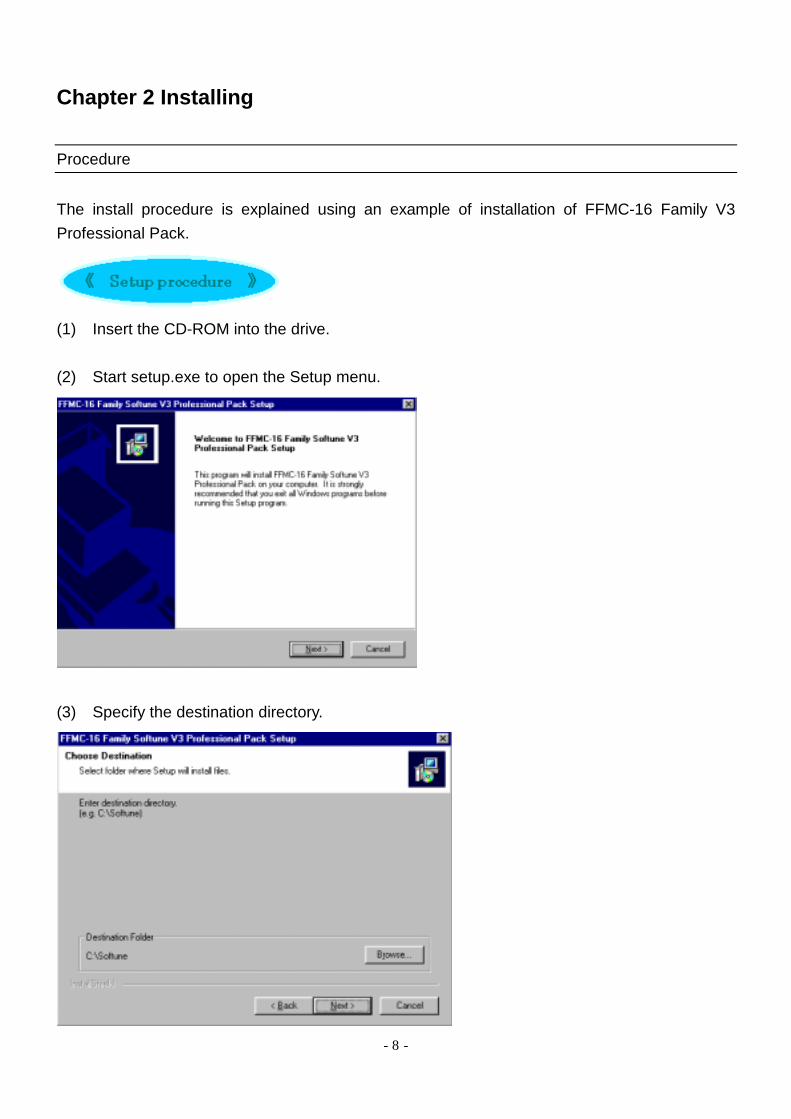
Procedure The install procedure is explained using an example of installation of FFMC-16 Family V3 Professional Pack.
(1) Insert the CD-ROM into the drive. (2) Start setup.exe to open the Setup menu.
(3) Specify the destination directory.
- 9 -
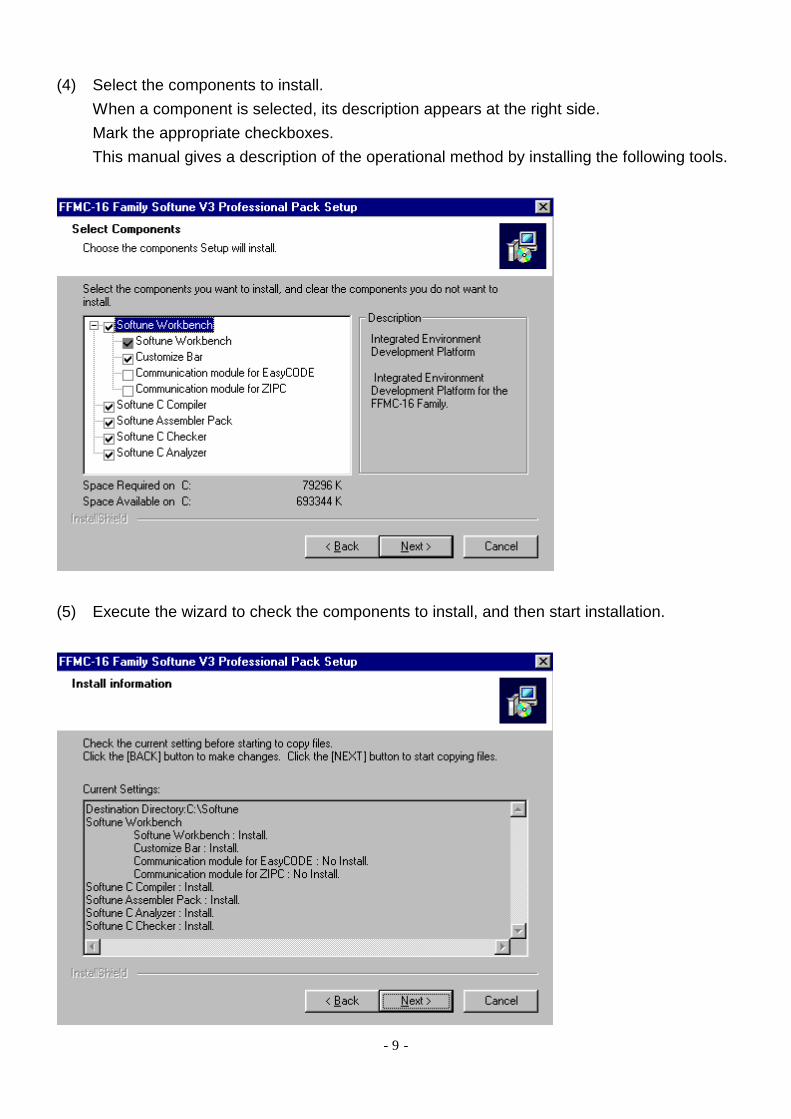
(4) Select the components to install. When a component is selected, its description appears at the right side. Mark the appropriate checkboxes. This manual gives a description of the operational method by installing the following tools.
(5) Execute the wizard to check the components to install, and then start installation.
- 10 -
Cautions
• Refer to the installation manual before installation. • When installing more than one Softune V3 product (for FFMC-8L, FFMC-16, and FR
Families) on one personal computer, specify the same destination folder. • When installing Softune V3 and Softune V5 on one personal computer, always specify
different destination folders. Installation in the same folder is prohibited.
• When installing Softune V5 in a directory where Softune V3 has been installed, uninstall
Softune V3 and then install Softune V5. The same operation should be done when changing from Softune V5 to Softune V3.
- 11 -
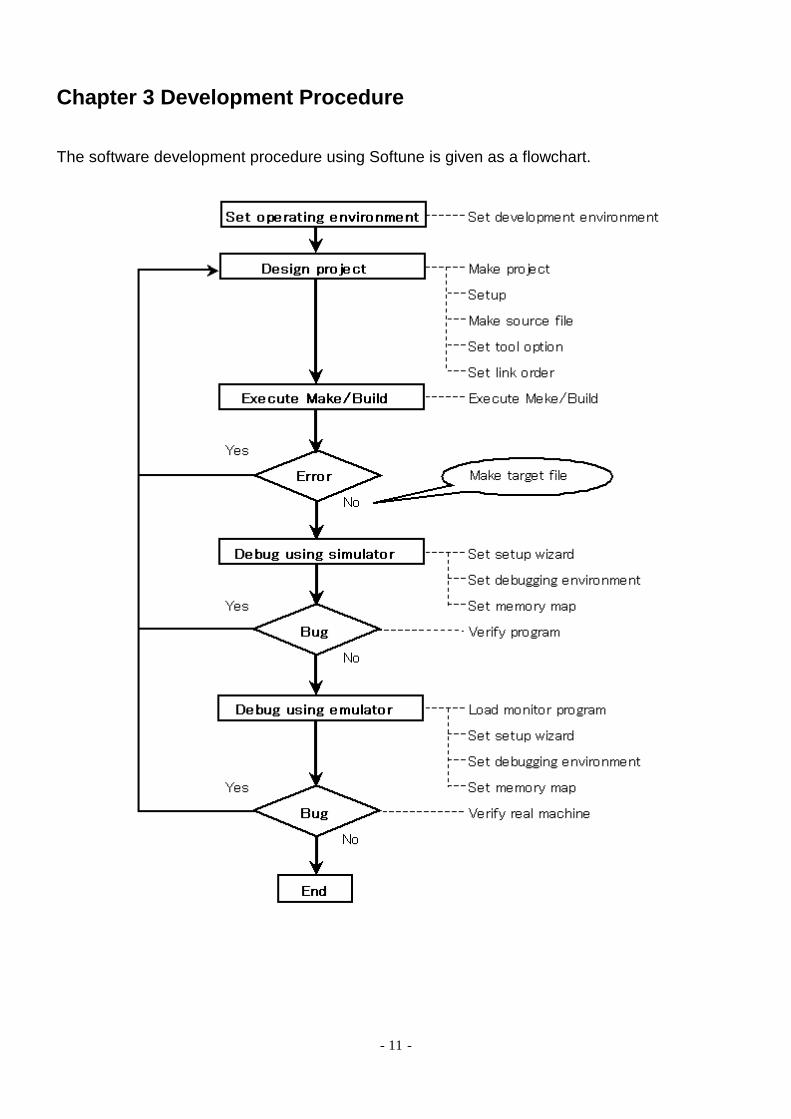
Chapter 3 Development Procedure The software development procedure using Softune is given as a flowchart.

- 12 -
Chapter 4 Tutorial Outline This chapter gives a concrete example of the software development procedure using Softune by using simple examples. This chapter also briefly explains Project creation using Softune for the FFMC-16 Family, debugging using the Simulator and Emulator, and an example of using the object-type converter. • 4.1 Design Project • 4.2 Debugging by Simulator • 4.3 Debugging by Emulator • 4.4 Using Object-type Converter

- 13 -
4.1 Design Project
Design Project This section explains the procedures from Project creation to target file creation. The sample creates Project that the target MCU is the FMC-16LX(MB90F598), and it does not use OS. The explanation assumes that Softune Workbench, C Compiler and Assembler pack are installed in C:¥Softune. • 4.1.1 Setup Development Environment • 4.1.2 Create Project • 4.1.3 Setup • 4.1.4 Create Source File • 4.1.5 Add Member Files to Project • 4.1.6 Setup Tool Option • 4.1.7 Set Linkage Order • 4.1.8 Create Target File
- 14 -
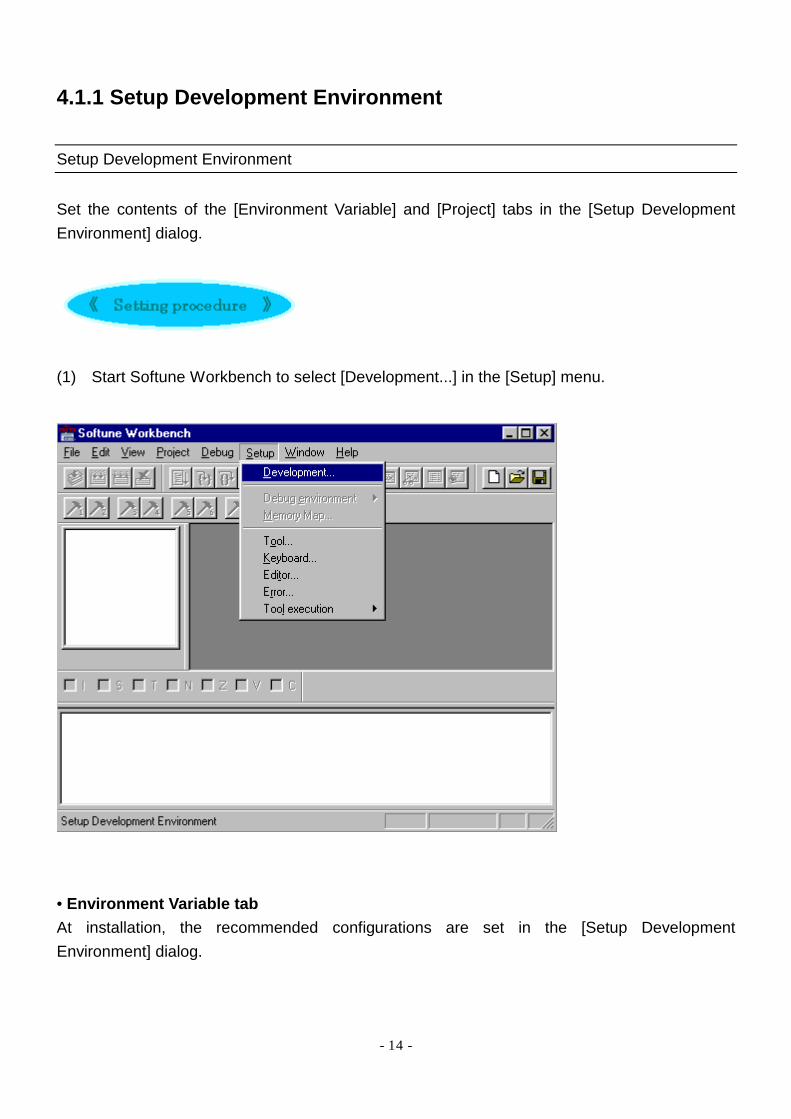
4.1.1 Setup Development Environment
Setup Development Environment Set the contents of the [Environment Variable] and [Project] tabs in the [Setup Development Environment] dialog.
(1) Start Softune Workbench to select [Development...] in the [Setup] menu.
• Environment Variable tab At installation, the recommended configurations are set in the [Setup Development Environment] dialog.

- 15 -
• Project tab Make the basic settings required to operate Softune Workbench. Mark the appropriate checkboxes. In this tutorial, mark the checkboxes given in the following dialog.
- 16 -
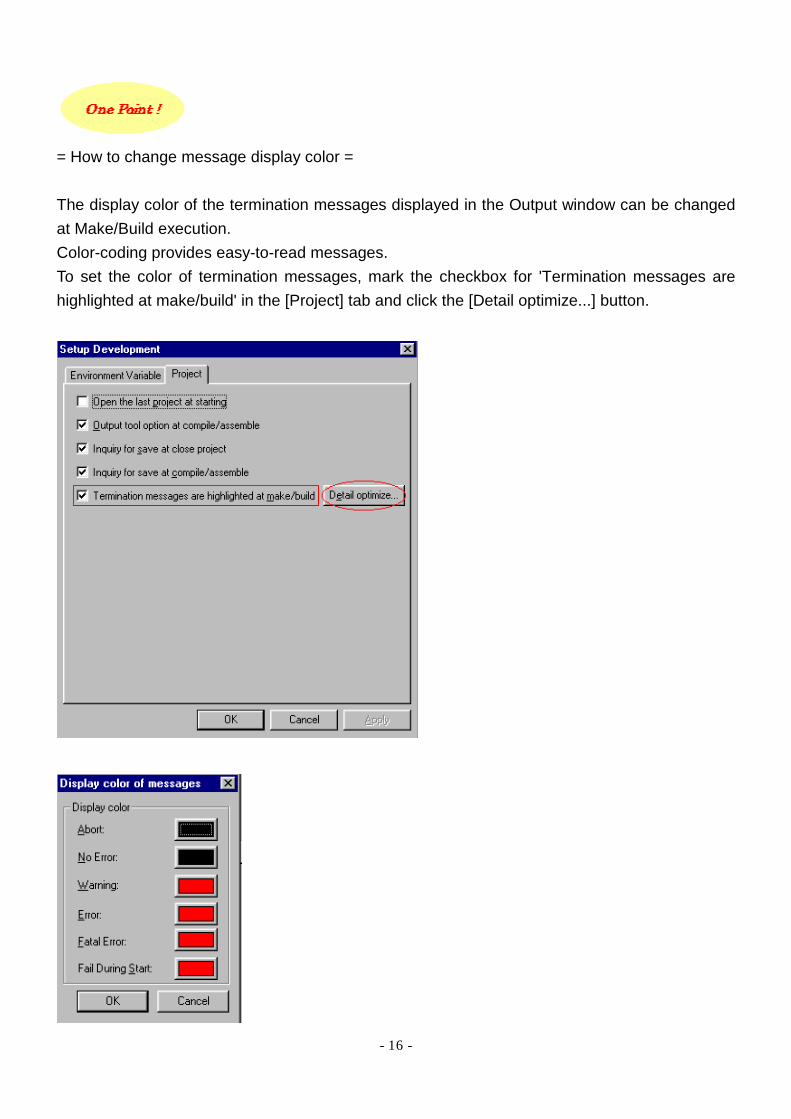
= How to change message display color = The display color of the termination messages displayed in the Output window can be changed at Make/Build execution. Color-coding provides easy-to-read messages. To set the color of termination messages, mark the checkbox for 'Termination messages are highlighted at make/build' in the [Project] tab and click the [Detail optimize...] button.
- 17 -
- 18 -
4.1.2 Create Project
Create Project Create a Project to generate an absolute-type target file.
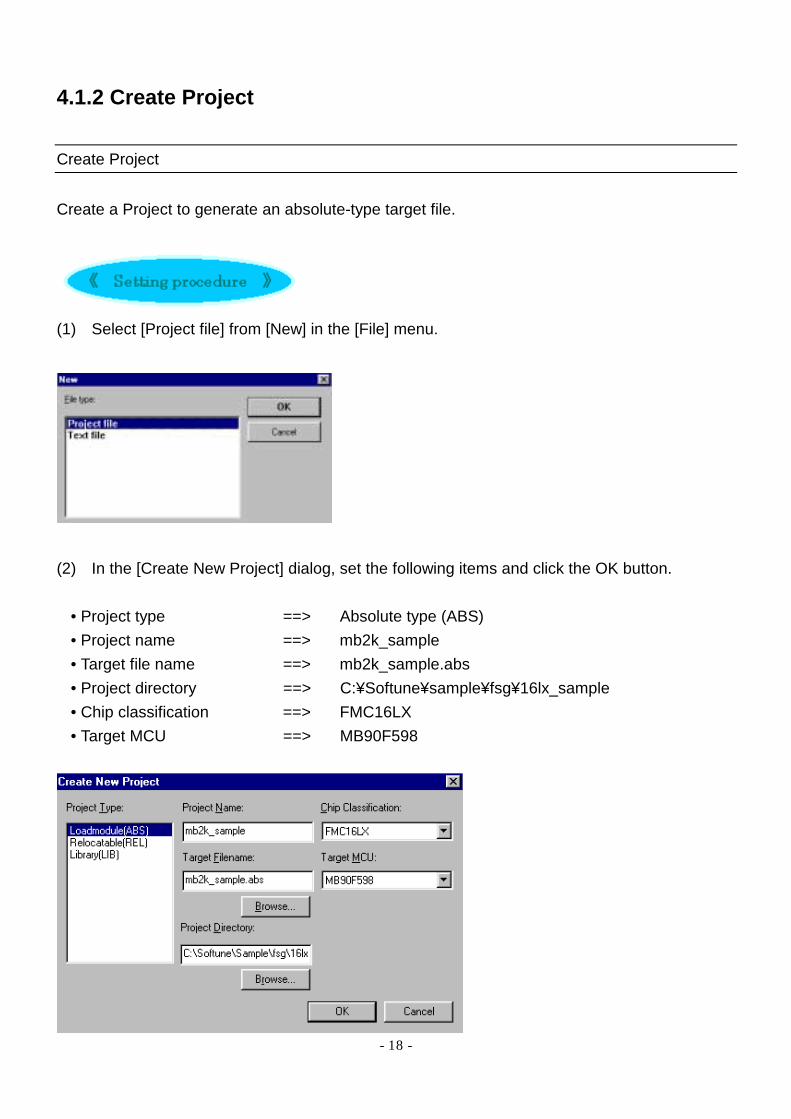
(1) Select [Project file] from [New] in the [File] menu.
(2) In the [Create New Project] dialog, set the following items and click the OK button.
• Project type ==> Absolute type (ABS) • Project name ==> mb2k_sample • Target file name ==> mb2k_sample.abs • Project directory ==> C:¥Softune¥sample¥fsg¥16lx_sample • Chip classification ==> FMC16LX • Target MCU ==> MB90F598
- 19 -
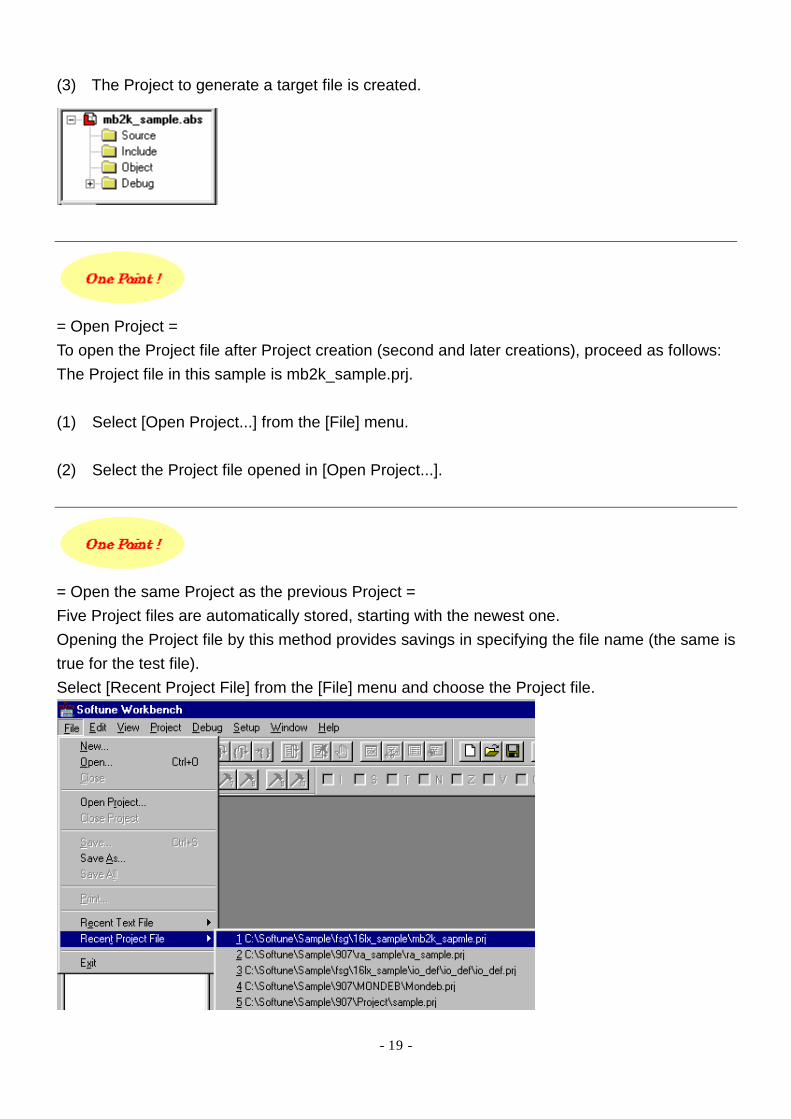
(3) The Project to generate a target file is created.
= Open Project = To open the Project file after Project creation (second and later creations), proceed as follows: The Project file in this sample is mb2k_sample.prj. (1) Select [Open Project...] from the [File] menu. (2) Select the Project file opened in [Open Project...].
= Open the same Project as the previous Project = Five Project files are automatically stored, starting with the newest one. Opening the Project file by this method provides savings in specifying the file name (the same is true for the test file). Select [Recent Project File] from the [File] menu and choose the Project file.
- 20 -
4.1.3 Setup
Setup Procedure for Setup Information on Project creation and basic Project information are set. There is no special setting required in this sample. The settings are given for reference.
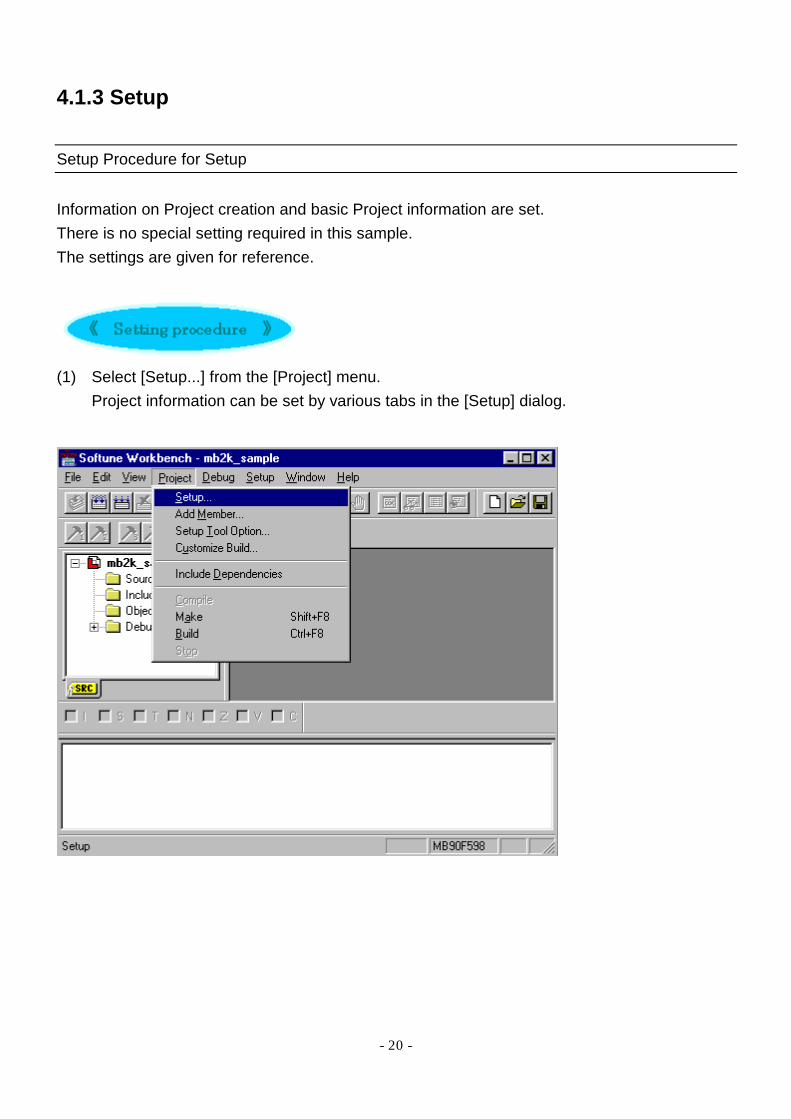
(1) Select [Setup...] from the [Project] menu.
Project information can be set by various tabs in the [Setup] dialog.
- 21 -
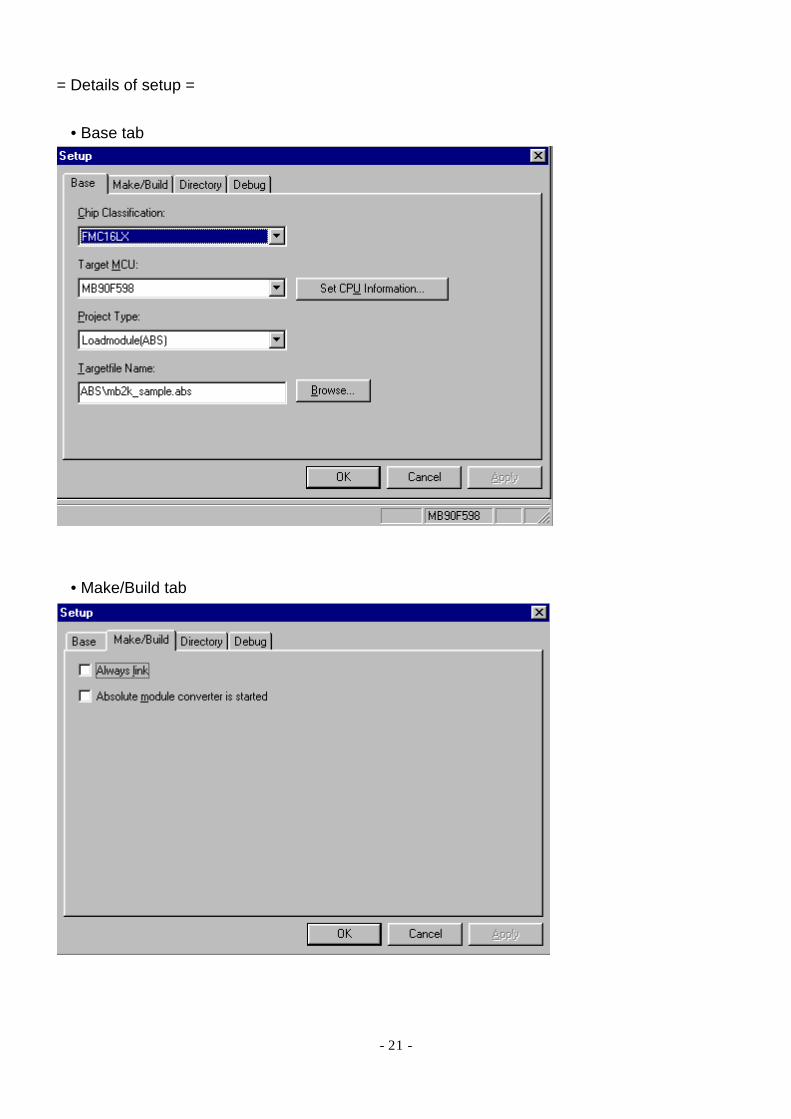
= Details of setup =
• Base tab
• Make/Build tab

- 22 -
• Directory tab
• Debug tab
- 23 -
4.1.4 Create Source File
Create Source File This sample uses a simple program in which LEDs on the target board go on at regular intervals. Use the cut and paste functions to manipulate the following files:
• init.c • sample.c • start905s.asm • define.h
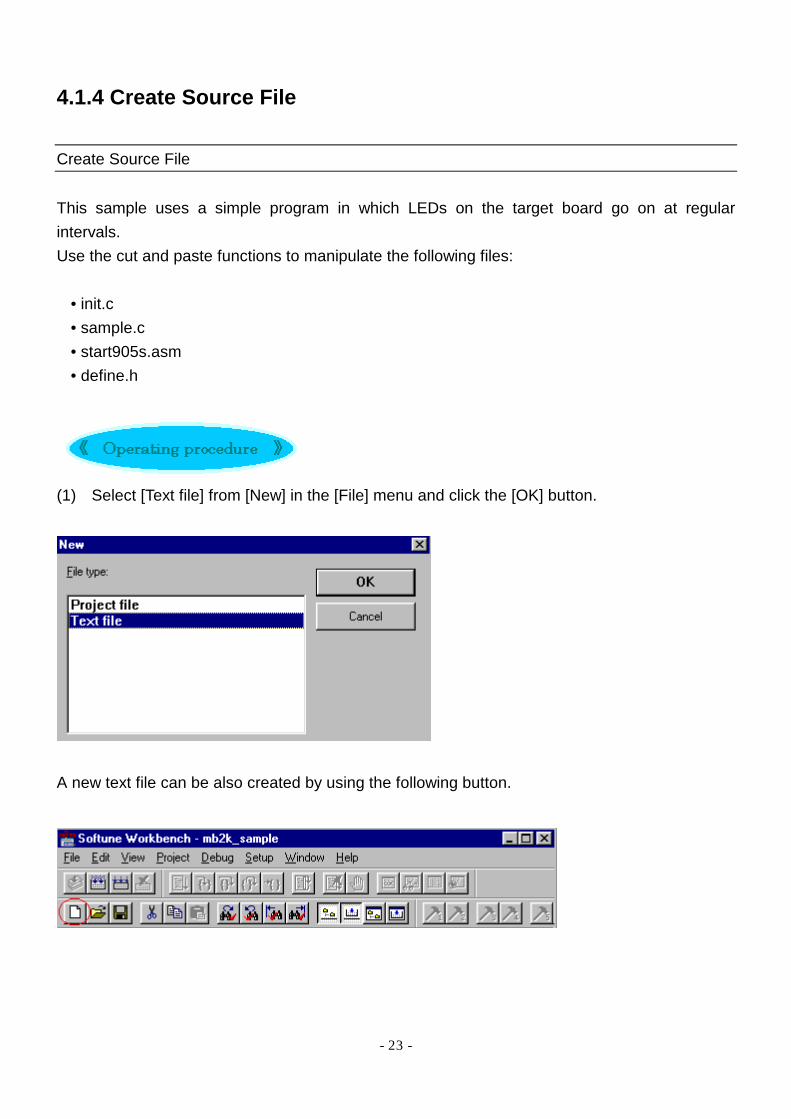
(1) Select [Text file] from [New] in the [File] menu and click the [OK] button.
A new text file can be also created by using the following button.
- 24 -
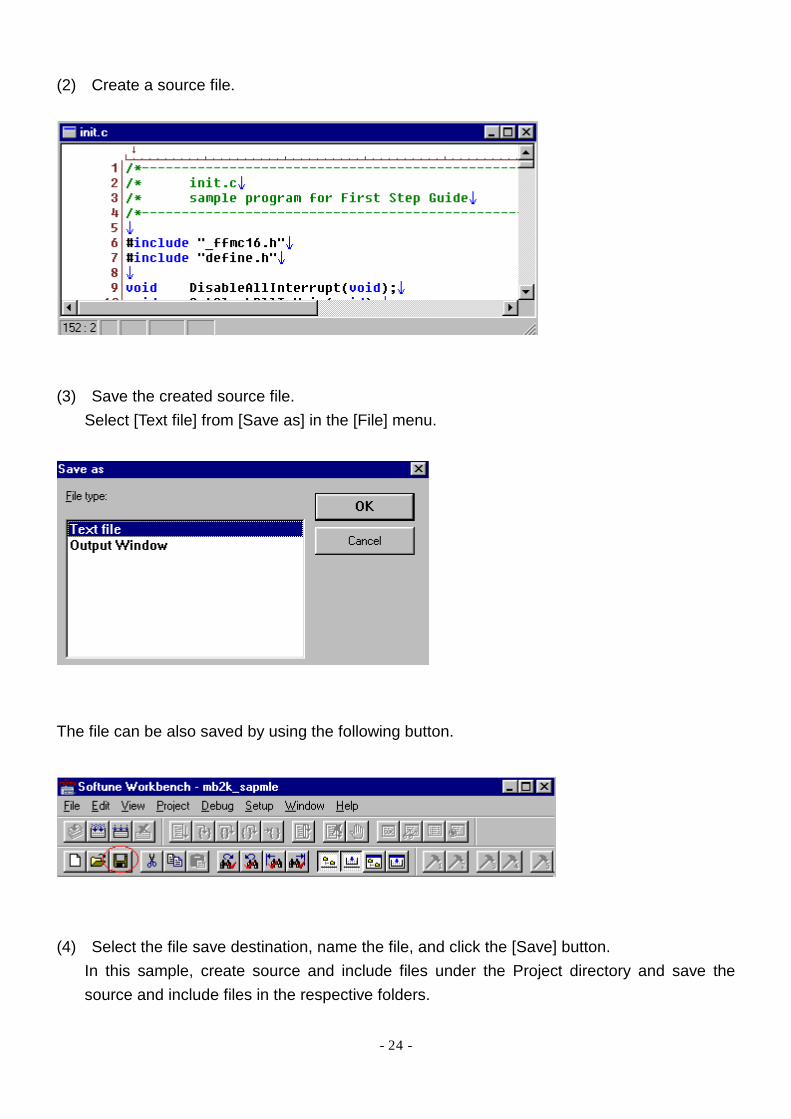
(2) Create a source file.
(3) Save the created source file.
Select [Text file] from [Save as] in the [File] menu.
The file can be also saved by using the following button.
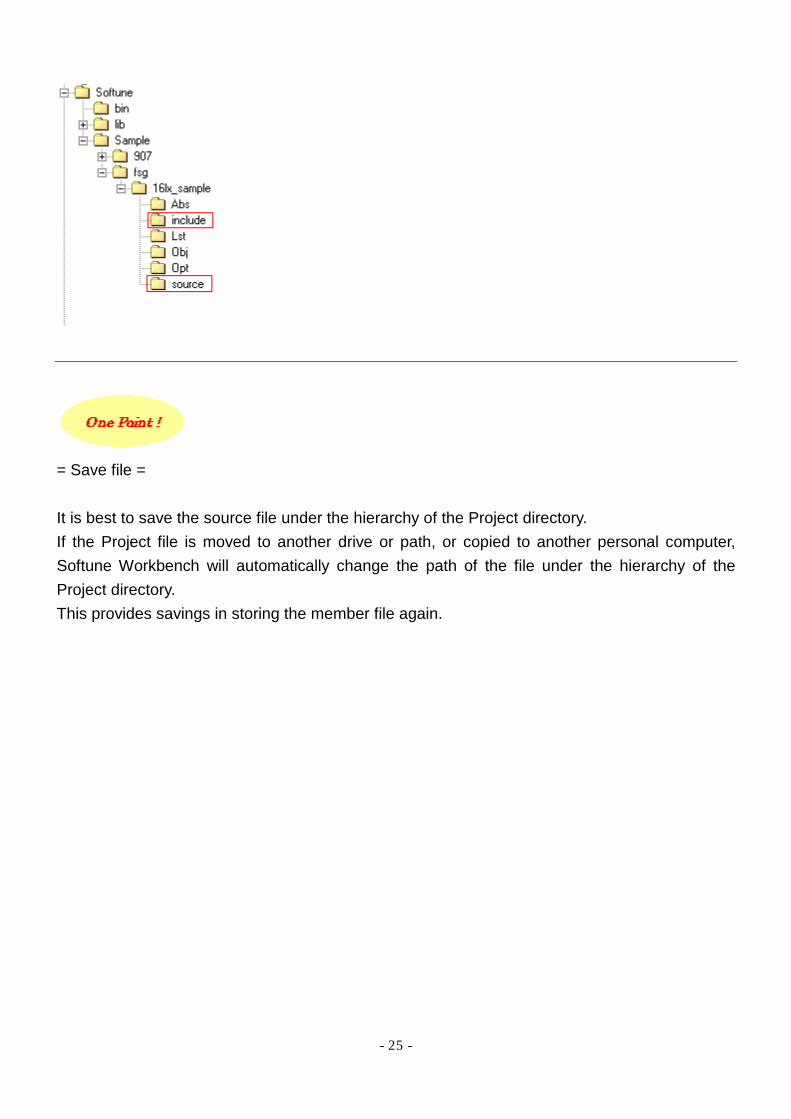
(4) Select the file save destination, name the file, and click the [Save] button.
In this sample, create source and include files under the Project directory and save the source and include files in the respective folders.
- 25 -
= Save file = It is best to save the source file under the hierarchy of the Project directory. If the Project file is moved to another drive or path, or copied to another personal computer, Softune Workbench will automatically change the path of the file under the hierarchy of the Project directory. This provides savings in storing the member file again.

- 26 -
4.1.4 Sample Source init.c /*--------------------------------------------------------------------------*/ /* init.c /* sample program for First Step Guide /*--------------------------------------------------------------------------*/ #include "_ffmc16.h" #include "define.h" void DisableAllInterrupt(void); void SetClockPllToMain(void); void ResetPort(void); void init_timer16(void); void SetClockMainToPll(void); /*--------------------------------------------------------------------------*/ /* Initialize /*--------------------------------------------------------------------------*/ void Initialize( void ) { DisableAllInterrupt(); /* Disable all interrupts */ SetClockPllToMain(); /* Select main clock (Source oscillation: 4 MHz, Main clock: 2 MHz) */ ResetPort(); /* Initialize port */ init_timer16(); /* Set 16-bit reload timer 0 */ SetClockMainToPll(); /* Select the PLL clock (Source oscillation: 4 MHz, × 4, 16 MHz)*/ return; } /*--------------------------------------------------------------------------*/ /* Stop all interrupts /*--------------------------------------------------------------------------*/ void DisableAllInterrupt( void )
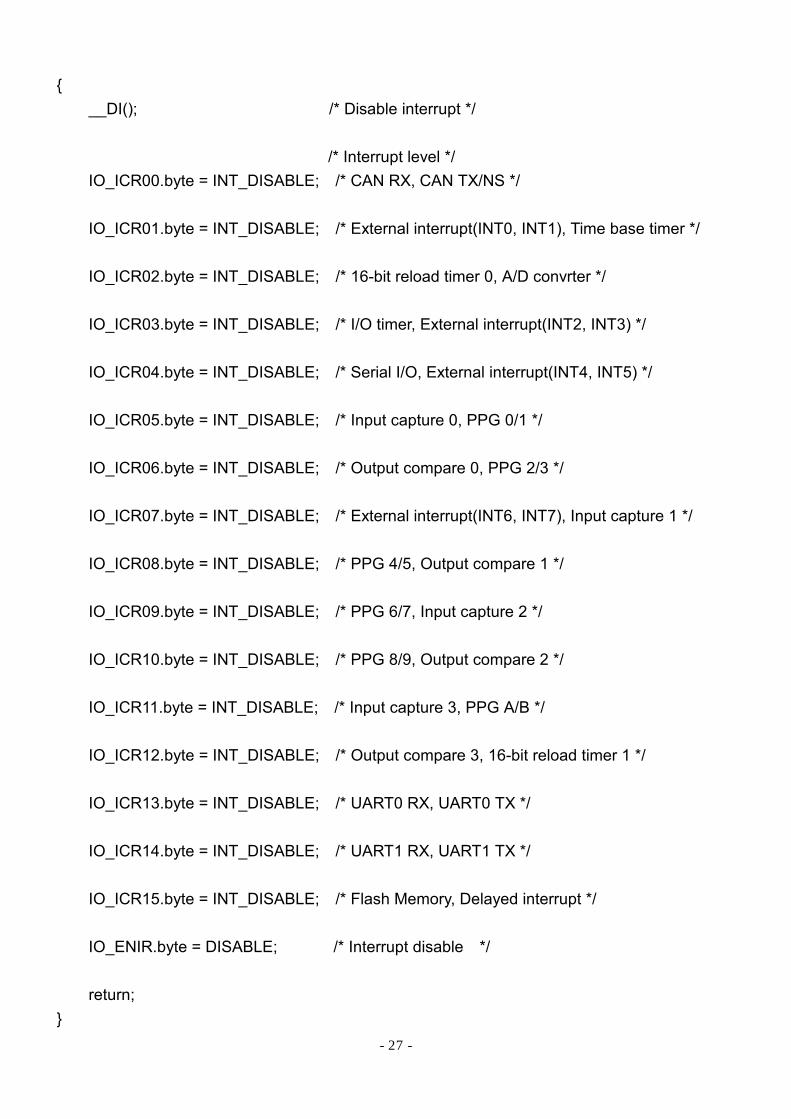
- 27 -
{ __DI(); /* Disable interrupt */ /* Interrupt level */ IO_ICR00.byte = INT_DISABLE; /* CAN RX, CAN TX/NS */ IO_ICR01.byte = INT_DISABLE; /* External interrupt(INT0, INT1), Time base timer */ IO_ICR02.byte = INT_DISABLE; /* 16-bit reload timer 0, A/D convrter */ IO_ICR03.byte = INT_DISABLE; /* I/O timer, External interrupt(INT2, INT3) */ IO_ICR04.byte = INT_DISABLE; /* Serial I/O, External interrupt(INT4, INT5) */ IO_ICR05.byte = INT_DISABLE; /* Input capture 0, PPG 0/1 */ IO_ICR06.byte = INT_DISABLE; /* Output compare 0, PPG 2/3 */ IO_ICR07.byte = INT_DISABLE; /* External interrupt(INT6, INT7), Input capture 1 */ IO_ICR08.byte = INT_DISABLE; /* PPG 4/5, Output compare 1 */ IO_ICR09.byte = INT_DISABLE; /* PPG 6/7, Input capture 2 */ IO_ICR10.byte = INT_DISABLE; /* PPG 8/9, Output compare 2 */ IO_ICR11.byte = INT_DISABLE; /* Input capture 3, PPG A/B */ IO_ICR12.byte = INT_DISABLE; /* Output compare 3, 16-bit reload timer 1 */ IO_ICR13.byte = INT_DISABLE; /* UART0 RX, UART0 TX */ IO_ICR14.byte = INT_DISABLE; /* UART1 RX, UART1 TX */ IO_ICR15.byte = INT_DISABLE; /* Flash Memory, Delayed interrupt */ IO_ENIR.byte = DISABLE; /* Interrupt disable */ return; }
- 28 -
/*--------------------------------------------------------------------------*/ /* PLL → Main clock /*--------------------------------------------------------------------------*/ void SetClockPllToMain(void) { if( !IO_CKSCR.bit.MCM ){ IO_CKSCR.byte = 0xEC; /* Select the MAIN clock */ while( !IO_CKSCR.bit.MCM ){;} } return; } /*--------------------------------------------------------------------------*/ /* Port/Initialization /*--------------------------------------------------------------------------*/ void ResetPort( void ) { IO_PDR4.byte = IO_OFF; IO_DDR4.byte = IO_OUTPUT; /* P40: O: */ /* P41: O: */ /* P42: O: */ /* P43: O: */ /* P44: O: */ /* P45: O: */ /* P46: O: */ /* P47: O: */ return; } /*--------------------------------------------------------------------------*/ /* Set 16-bit reload timer 0 /*--------------------------------------------------------------------------*/ void init_timer16(void) {

- 29 -
IO_ICR02.byte = 0x00; /* Set interrupt level */ IO_TMR0 = 0x5000; /* Set reload value in reload register */ IO_TMCSR0.word = 0x089b; /* Set control status register */ /* Initialize timer to start timer operation */ /* CSL = 2 Selection of clock source */ /* MOD = 1 Falling edge of trigger input */ /* RELD = 1 Reload mode */ /* INTE = 1 Timer interrupt request enable bit */ /* CNTE = 1, TRG = 1 Count start */ return; } /*--------------------------------------------------------------------------*/ /* Main → PLL clock /*--------------------------------------------------------------------------*/ void SetClockMainToPll(void) { if( IO_CKSCR.bit.MCM ){ IO_CKSCR.byte = 0xEB; /* Select the PLL clock [16MHz=4MHz*4] */ while( IO_CKSCR.bit.MCM ){;} } return; }
- 30 -
4.1.4 Sample source sample.c /*--------------------------------------------------------------------------*/ /* sample.c /* sample program for First Step Guide /*--------------------------------------------------------------------------*/ #include "_ffmc16.h" #include "define.h" unsigned char flag = 0x01; unsigned char counter = 0x00; extern void Initialize(void); const unsigned char LED_pat[9]={ 0xff, /* -------- */ 0x7f, /* *------- */ 0xbf, /* -*------ */ 0xdf, /* --*----- */ 0xef, /* ---*---- */ 0xf7, /* ----*--- */ 0xfb, /* -----*-- */ 0xfd, /* ------*- */ 0xfe, /* -------* */ }; void main(void) { Initialize(); /* Stop all interrupts */ __set_il(7); /* Set interrupt level of entire system to 7 (lowest) */ __EI(); /* Set I (interrupt enable) flag to 1 */ /* to enable entire system for interrupts */ while(1){
- 31 -
} } /*--------------------------------------------------------------------------*/ /* Interrupt processing of 16-bit reload timer 0 /*--------------------------------------------------------------------------*/ __interrupt void timer_int(void) { IO_TMCSR0.bit.UF = 0; /* Timer interrupt of 16-bit reload timer */ /* Clear request flag */ if (++counter > 5) { counter = 0; switch (flag){ /* Determine value output to LED by flag value */ case 0x01: IO_PDR4.byte = LED_pat[1]; break; case 0x02: IO_PDR4.byte = LED_pat[2]; break; case 0x04: IO_PDR4.byte = LED_pat[3]; break; case 0x08: IO_PDR4.byte = LED_pat[4]; break; case 0x10: IO_PDR4.byte = LED_pat[5]; break; case 0x20: IO_PDR4.byte = LED_pat[6]; break; case 0x40: IO_PDR4.byte = LED_pat[7]; break; case 0x80: IO_PDR4.byte = LED_pat[8]; break; } if(!(flag <<= 1)){ /* Move LED output digit */ flag = 0x01; } } }

- 32 -
/*--------------------------------------------------------------------------*/ /* Set interrupt function in interrupt vector /*--------------------------------------------------------------------------*/ extern __interrupt void _start(void); /* Declare reference to interrupt function to be set */ extern __interrupt void timer_int(void); #pragma intvect _start 0x8 0 /* Enter startup routine _start */ /* in reset vector (0) */ #pragma intvect timer_int 0x0F /* Enter interrupt vector (15) */ /* of 16-bit reload timer 0 */
- 33 -
4.1.4 Sample Source start905s.asm ;======================================================================== ; FFMC-16 Family Softune C Compiler's startup routine, ; ALL RIGHTS RESERVED, COPYRIGHT (C) FUJITSU LIMITED 1986-1999 ; LICENSED MATERIAL - PROGRAM PROPERTY OF FUJITSU LIMITED 1999.9 ;======================================================================== ; Sample program for initialization (small model) ;-------------------------------------------------------------------------- .PROGRAM start .TITLE start ;-------------------------------------------------------------------------- ; external declaration of symbols ;-------------------------------------------------------------------------- .EXPORT __start ; .EXPORT __exit .IMPORT _main .IMPORT _exit .IMPORT __stream_init .IMPORT _errno ;-------------------------------------------------------------------------- ; definition to stack area ;-------------------------------------------------------------------------- .SECTION STACK, STACK, ALIGN=1 .RES.B 254 SSTACK_TOP: .RES.B 2 .RES.B 254 USTACK_TOP: .RES.B 2 ;-------------------------------------------------------------------------- ; definition to start address of data, const and code section ;-------------------------------------------------------------------------- .SECTION DIRDATA, DIR, ALIGN=2 DIRDATA_S:
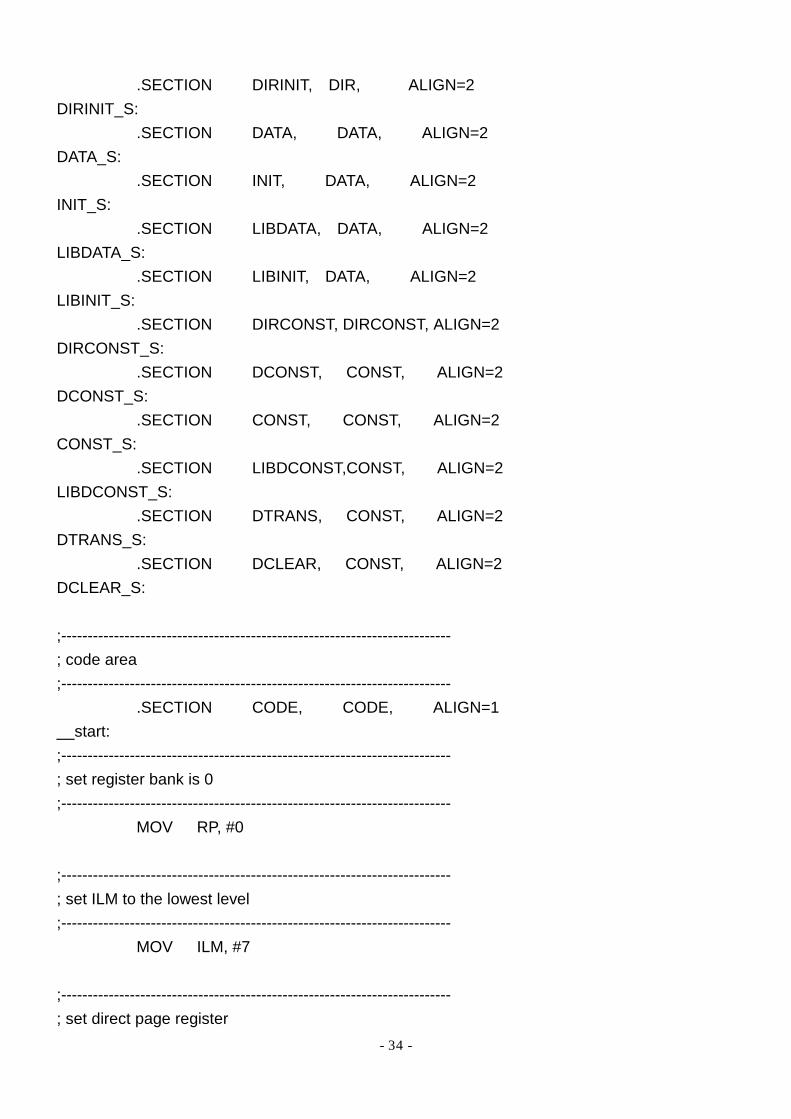
- 34 -
.SECTION DIRINIT, DIR, ALIGN=2 DIRINIT_S: .SECTION DATA, DATA, ALIGN=2 DATA_S: .SECTION INIT, DATA, ALIGN=2 INIT_S: .SECTION LIBDATA, DATA, ALIGN=2 LIBDATA_S: .SECTION LIBINIT, DATA, ALIGN=2 LIBINIT_S: .SECTION DIRCONST, DIRCONST, ALIGN=2 DIRCONST_S: .SECTION DCONST, CONST, ALIGN=2 DCONST_S: .SECTION CONST, CONST, ALIGN=2 CONST_S: .SECTION LIBDCONST,CONST, ALIGN=2 LIBDCONST_S: .SECTION DTRANS, CONST, ALIGN=2 DTRANS_S: .SECTION DCLEAR, CONST, ALIGN=2 DCLEAR_S: ;-------------------------------------------------------------------------- ; code area ;-------------------------------------------------------------------------- .SECTION CODE, CODE, ALIGN=1 __start: ;-------------------------------------------------------------------------- ; set register bank is 0 ;-------------------------------------------------------------------------- MOV RP, #0 ;-------------------------------------------------------------------------- ; set ILM to the lowest level ;-------------------------------------------------------------------------- MOV ILM, #7 ;-------------------------------------------------------------------------- ; set direct page register

- 35 -
;-------------------------------------------------------------------------- MOV A, #PAGE DIRDATA_S MOV DPR, A ;-------------------------------------------------------------------------- ; set system stack ;-------------------------------------------------------------------------- AND CCR, #0x20 MOV A, #BNKSYM SSTACK_TOP MOV SSB, A MOVW A, #SSTACK_TOP MOVW SP, A AND CCR, #0x00DF ;-------------------------------------------------------------------------- ; copy initial value *CONST section to *INIT section ;-------------------------------------------------------------------------- #macro ICOPY src_addr, dest_addr, src_segment MOV A, #BNKSYM ¥src_addr MOV ADB, A MOV A, #BNKSYM ¥dest_addr MOV DTB, A MOVW RW0, #SIZEOF (¥src_segment) MOVW A, #¥dest_addr MOVW A, #¥src_addr MOVSI DTB, ADB #endm ICOPY DIRCONST_S, DIRINIT_S, DIRCONST ICOPY DCONST_S, INIT_S, DCONST ICOPY LIBDCONST_S,LIBINIT_S, LIBDCONST ;-------------------------------------------------------------------------- ; zero clear of *VAR section ;-------------------------------------------------------------------------- #macro FILL0 src_addr, src_segment MOV A, #BNKSYM ¥src_addr MOV DTB, A MOVW RW0, #SIZEOF (¥src_segment) MOVW A, #¥src_addr

- 36 -
MOVN A, #0 FILSI DTB #endm FILL0 DIRDATA_S, DIRDATA FILL0 DATA_S, DATA FILL0 LIBDATA_S, LIBDATA ;-------------------------------------------------------------------------- ; copy initial value DCONST_module section to INIT_module section ;-------------------------------------------------------------------------- MOV A, #BNKSYM DTRANS_S MOV DTB, A MOVW RW1, #DTRANS_S BRA LABEL2 LABEL1: MOVW A, @RW1+6 MOV USB, A MOVW A, @RW1+2 MOV ADB, A MOVW A, @RW1+4 MOVW A, @RW1 MOVW RW0, @RW1+8 MOVSI SPB, ADB MOVN A, #10 ADDW RW1, A LABEL2: MOVW A, RW1 SUBW A, #DTRANS_S CMPW A, #SIZEOF (DTRANS) BNE LABEL1 ;-------------------------------------------------------------------------- ; zero clear of DATA_module section ;-------------------------------------------------------------------------- MOV A, #BNKSYM DCLEAR_S MOV DTB, A MOVW RW1, #DCLEAR_S BRA LABEL4 LABEL3:
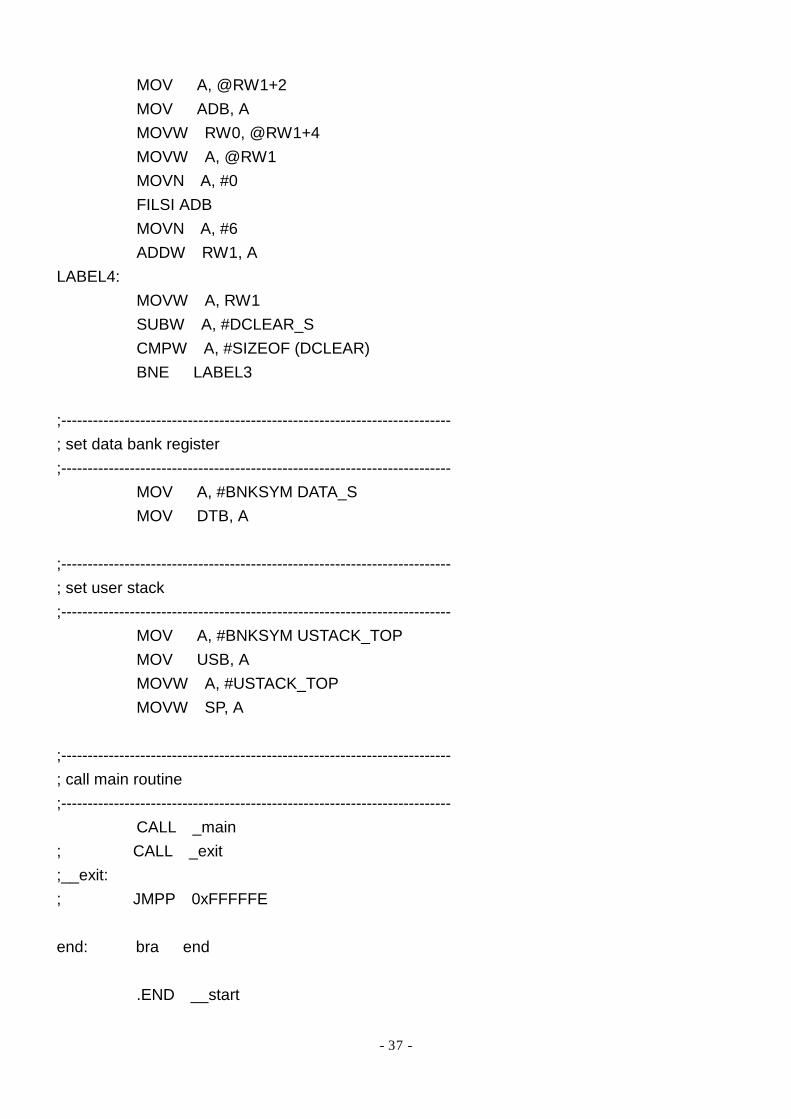
- 37 -
MOV A, @RW1+2 MOV ADB, A MOVW RW0, @RW1+4 MOVW A, @RW1 MOVN A, #0 FILSI ADB MOVN A, #6 ADDW RW1, A LABEL4: MOVW A, RW1 SUBW A, #DCLEAR_S CMPW A, #SIZEOF (DCLEAR) BNE LABEL3 ;-------------------------------------------------------------------------- ; set data bank register ;-------------------------------------------------------------------------- MOV A, #BNKSYM DATA_S MOV DTB, A ;-------------------------------------------------------------------------- ; set user stack ;-------------------------------------------------------------------------- MOV A, #BNKSYM USTACK_TOP MOV USB, A MOVW A, #USTACK_TOP MOVW SP, A ;-------------------------------------------------------------------------- ; call main routine ;-------------------------------------------------------------------------- CALL _main ; CALL _exit ;__exit: ; JMPP 0xFFFFFE end: bra end .END __start

- 38 -
4.1.4 Sample Source define.h /*--------------------------------------------------------------------------*/ /* define.h /* sample program for First Step Guide /*--------------------------------------------------------------------------*/ #define INT_DISABLE 0x07 #define DISABLE 0x00 #define IO_OFF 0xFF #define IO_OUTPUT 0xFF
- 39 -
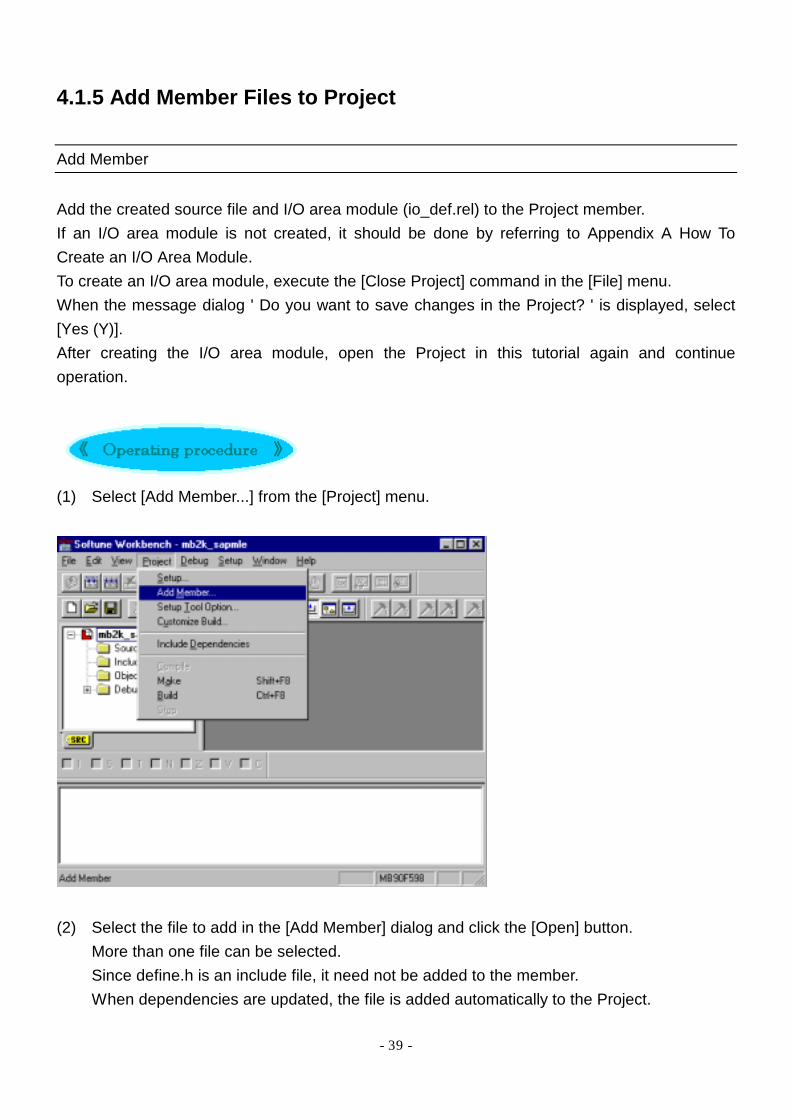
4.1.5 Add Member Files to Project Add Member Add the created source file and I/O area module (io_def.rel) to the Project member. If an I/O area module is not created, it should be done by referring to Appendix A How To Create an I/O Area Module. To create an I/O area module, execute the [Close Project] command in the [File] menu. When the message dialog ' Do you want to save changes in the Project? ' is displayed, select [Yes (Y)]. After creating the I/O area module, open the Project in this tutorial again and continue operation.
(1) Select [Add Member...] from the [Project] menu.
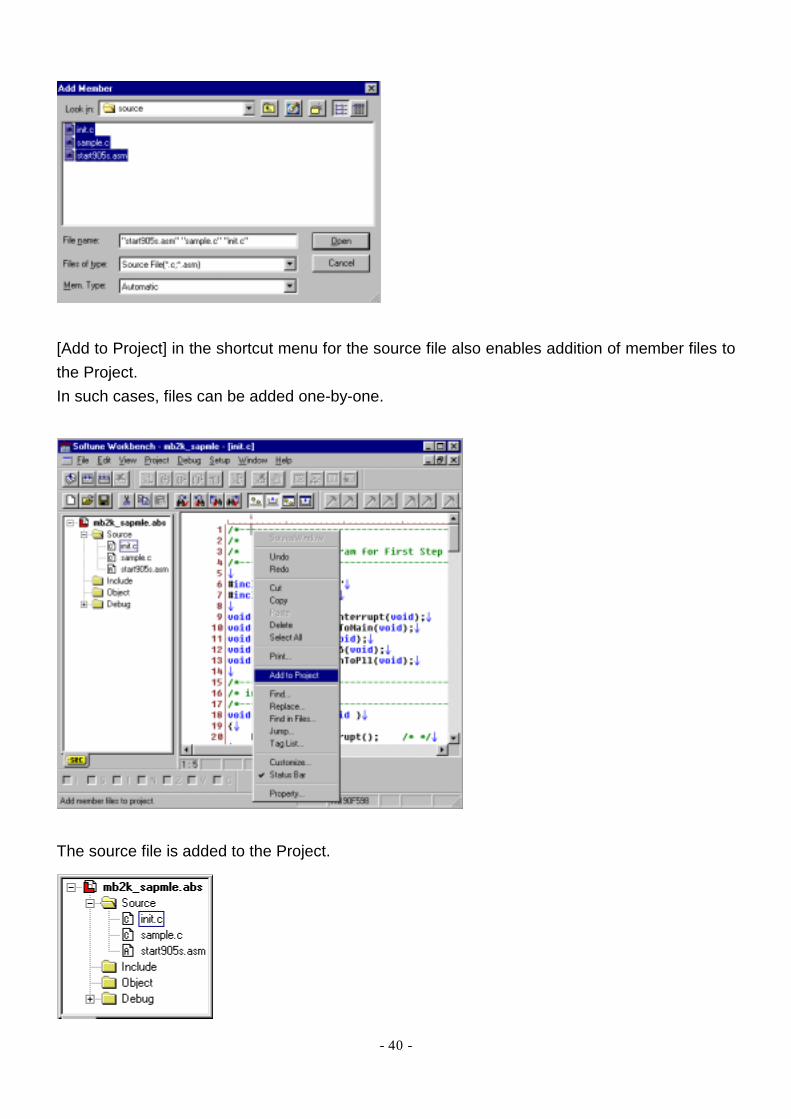
(2) Select the file to add in the [Add Member] dialog and click the [Open] button.
More than one file can be selected. Since define.h is an include file, it need not be added to the member. When dependencies are updated, the file is added automatically to the Project.
- 40 -
[Add to Project] in the shortcut menu for the source file also enables addition of member files to the Project. In such cases, files can be added one-by-one.
The source file is added to the Project.
- 41 -
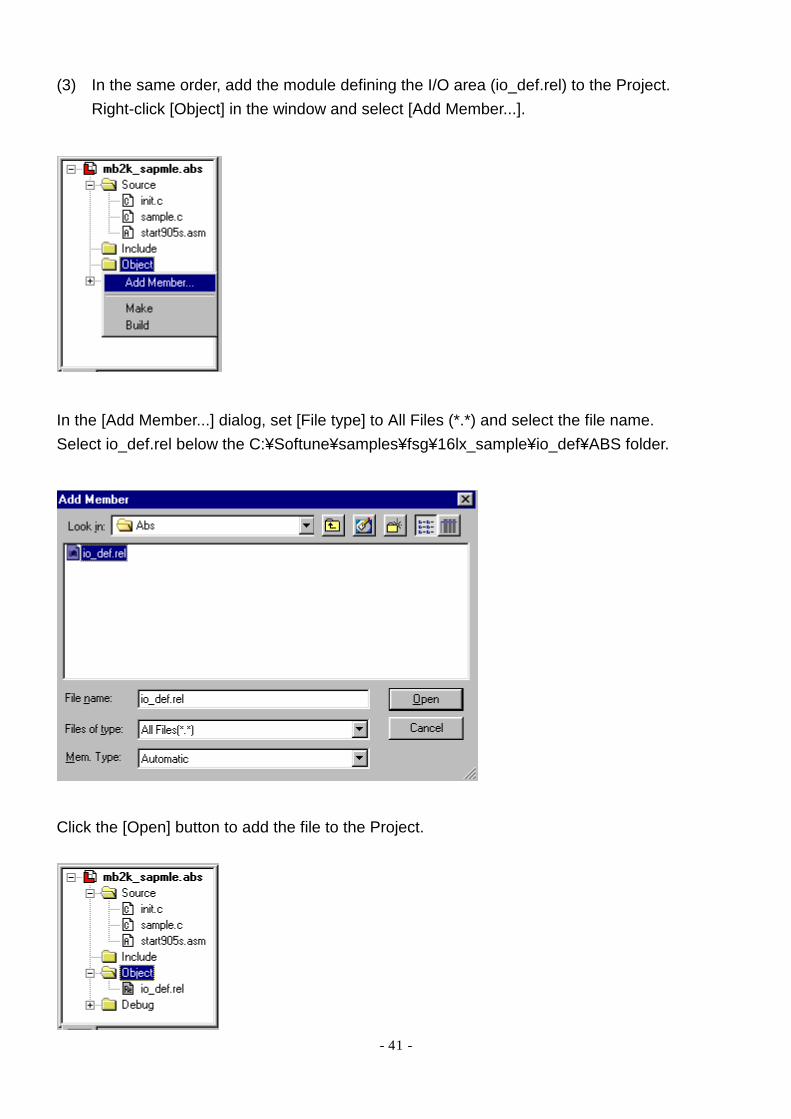
(3) In the same order, add the module defining the I/O area (io_def.rel) to the Project. Right-click [Object] in the window and select [Add Member...].
In the [Add Member...] dialog, set [File type] to All Files (*.*) and select the file name. Select io_def.rel below the C:¥Softune¥samples¥fsg¥16lx_sample¥io_def¥ABS folder.
Click the [Open] button to add the file to the Project.
- 42 -
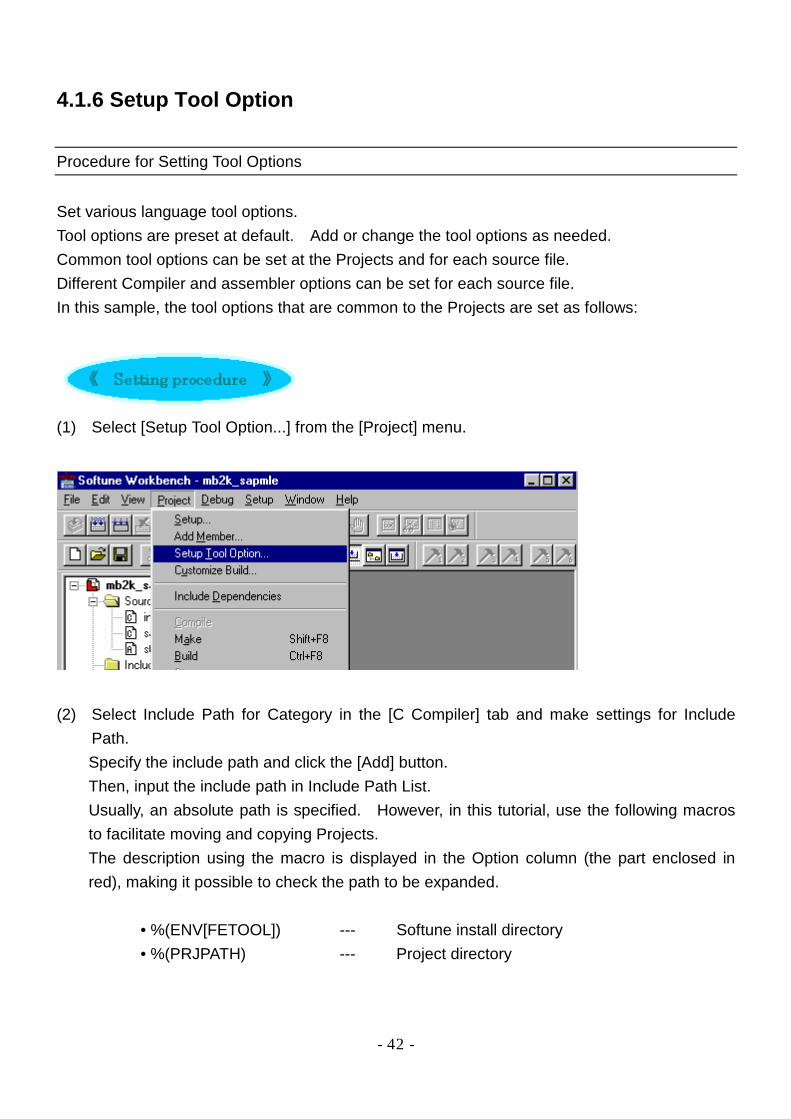
4.1.6 Setup Tool Option
Procedure for Setting Tool Options Set various language tool options. Tool options are preset at default. Add or change the tool options as needed. Common tool options can be set at the Projects and for each source file. Different Compiler and assembler options can be set for each source file. In this sample, the tool options that are common to the Projects are set as follows:
(1) Select [Setup Tool Option...] from the [Project] menu.
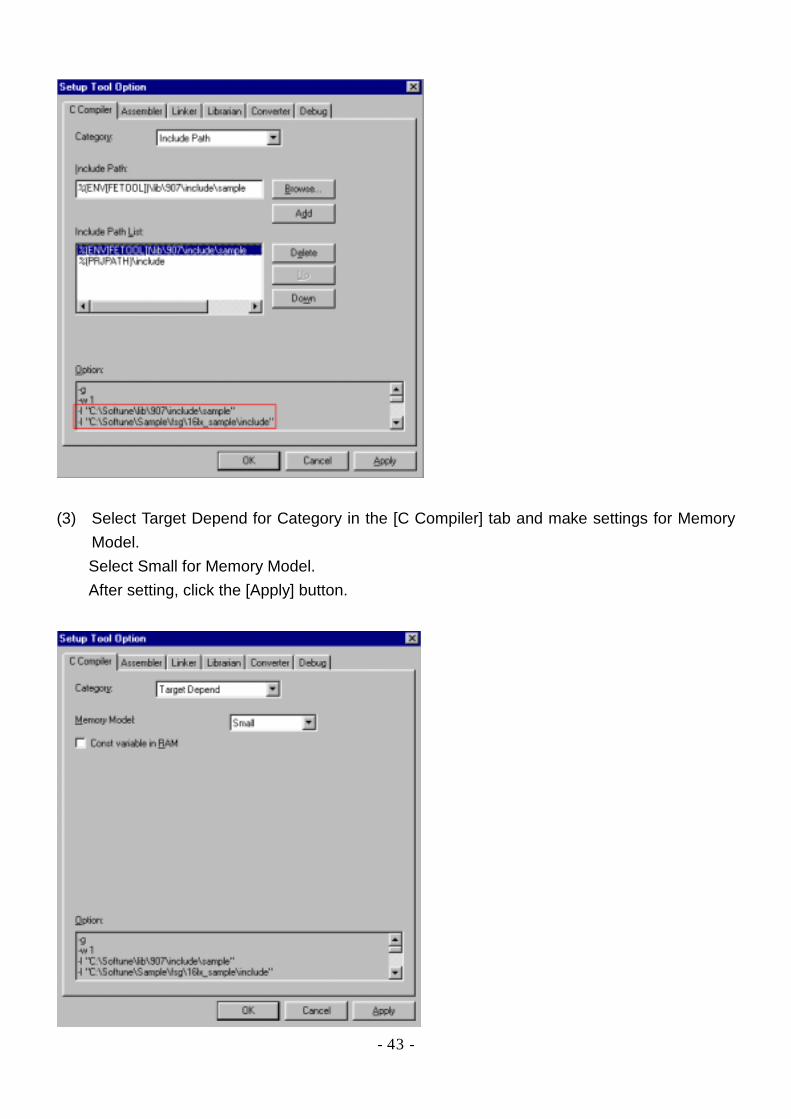
(2) Select Include Path for Category in the [C Compiler] tab and make settings for Include
Path. Specify the include path and click the [Add] button. Then, input the include path in Include Path List. Usually, an absolute path is specified. However, in this tutorial, use the following macros to facilitate moving and copying Projects. The description using the macro is displayed in the Option column (the part enclosed in red), making it possible to check the path to be expanded.
• %(ENV[FETOOL]) --- Softune install directory • %(PRJPATH) --- Project directory
- 43 -
(3) Select Target Depend for Category in the [C Compiler] tab and make settings for Memory
Model. Select Small for Memory Model. After setting, click the [Apply] button.
- 44 -
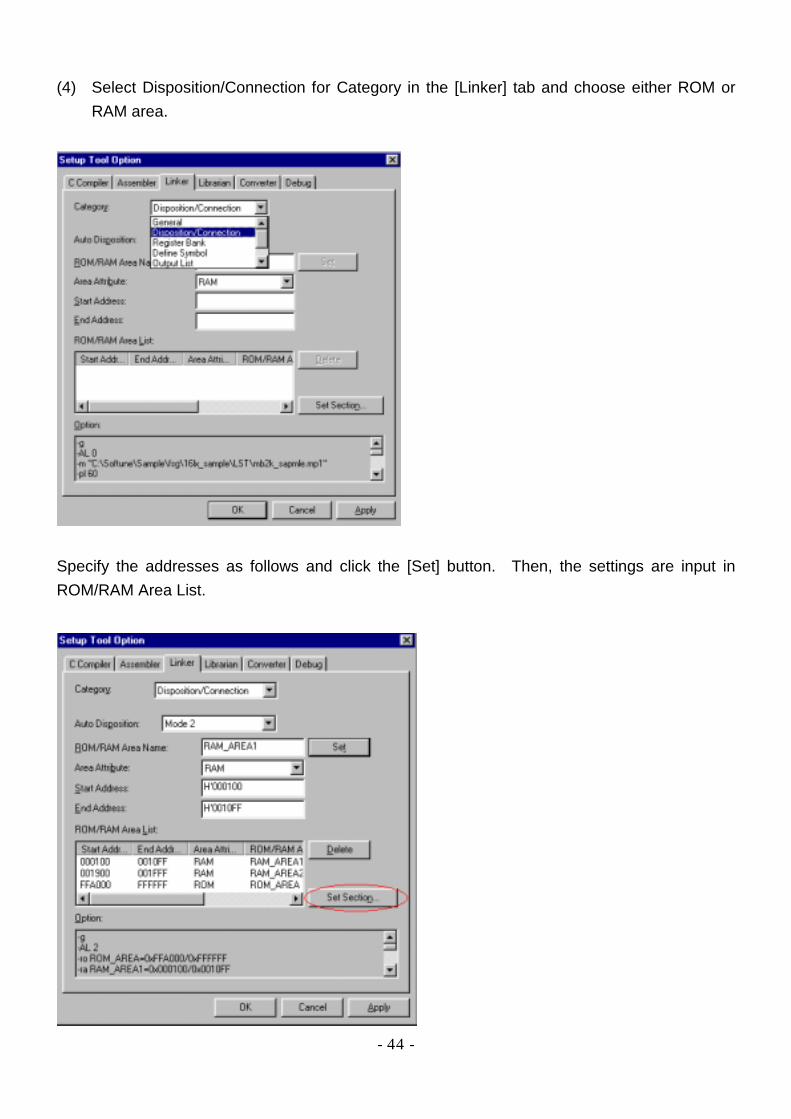
(4) Select Disposition/Connection for Category in the [Linker] tab and choose either ROM or RAM area.
Specify the addresses as follows and click the [Set] button. Then, the settings are input in ROM/RAM Area List.
- 45 -
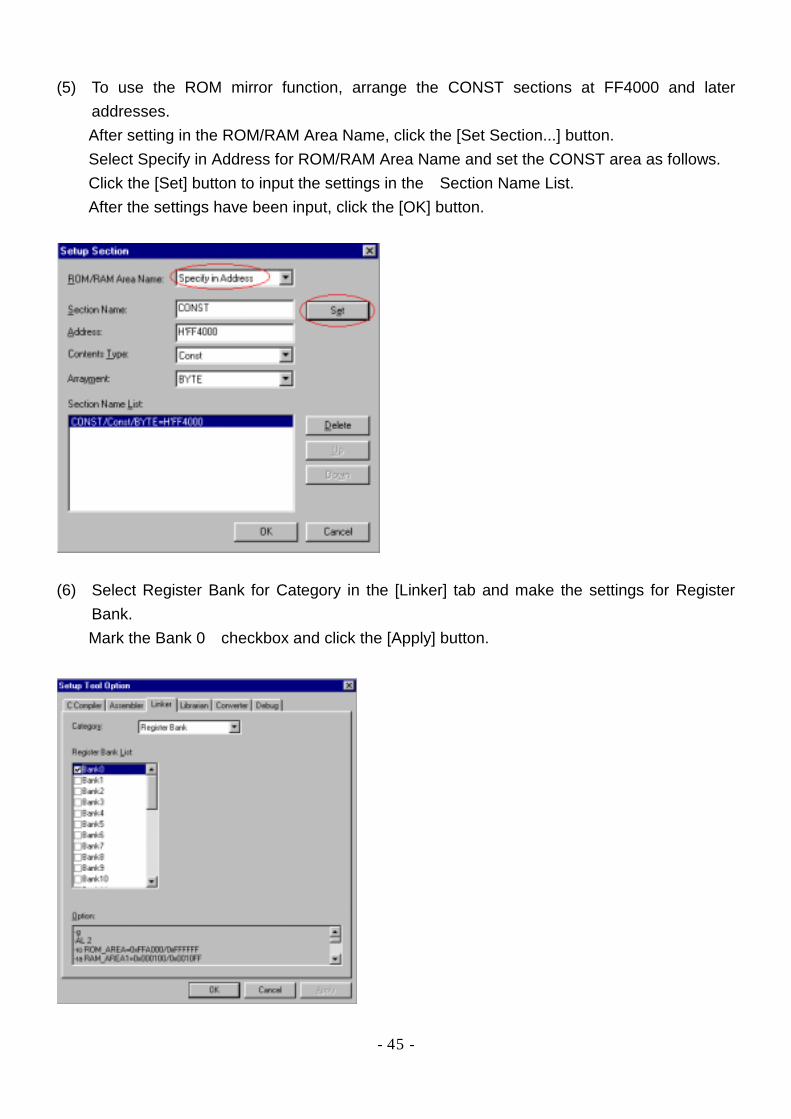
(5) To use the ROM mirror function, arrange the CONST sections at FF4000 and later addresses. After setting in the ROM/RAM Area Name, click the [Set Section...] button. Select Specify in Address for ROM/RAM Area Name and set the CONST area as follows. Click the [Set] button to input the settings in the Section Name List. After the settings have been input, click the [OK] button.
(6) Select Register Bank for Category in the [Linker] tab and make the settings for Register
Bank. Mark the Bank 0 checkbox and click the [Apply] button.

- 46 -
= How to set tool options for each source file = (1) Select the source file to be set individually and display the shortcut menu.
(2) Make the settings for the C Compiler or assembler.

- 47 -
(3) Click the [OK] button. The individually option-set source file is marked in blue and can be identified easily.
- 48 -
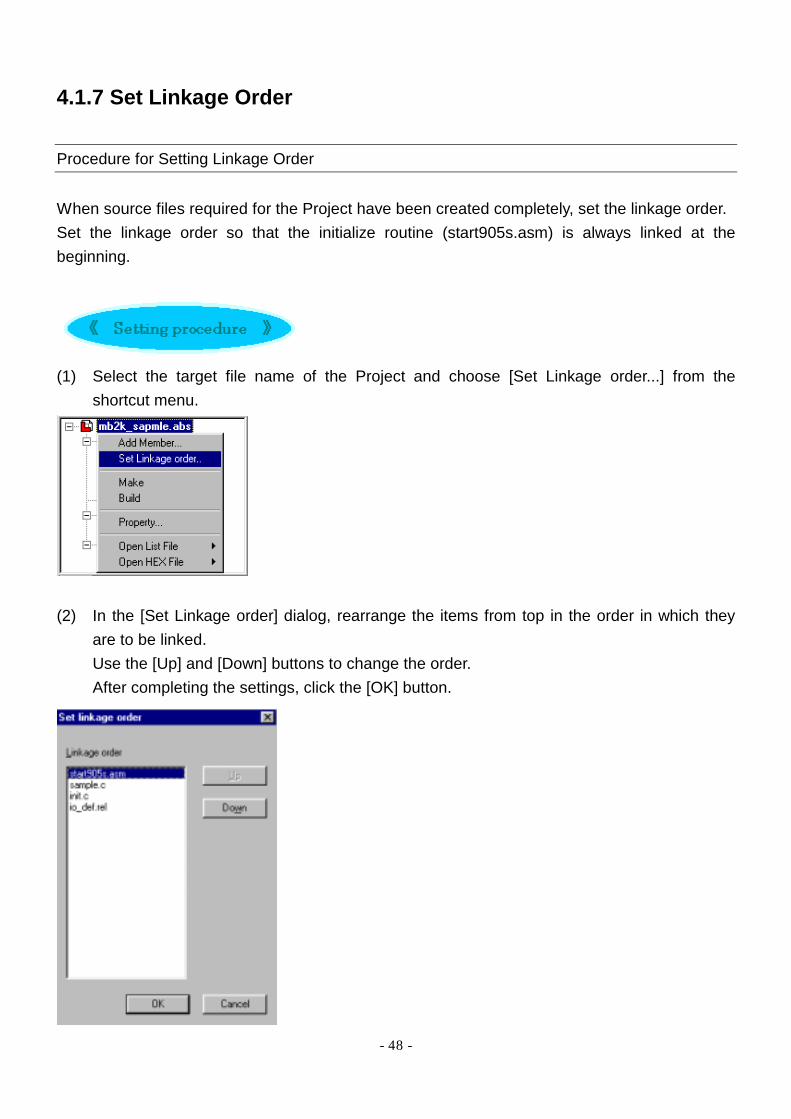
4.1.7 Set Linkage Order
Procedure for Setting Linkage Order When source files required for the Project have been created completely, set the linkage order. Set the linkage order so that the initialize routine (start905s.asm) is always linked at the beginning.
(1) Select the target file name of the Project and choose [Set Linkage order...] from the
shortcut menu.
(2) In the [Set Linkage order] dialog, rearrange the items from top in the order in which they
are to be linked. Use the [Up] and [Down] buttons to change the order. After completing the settings, click the [OK] button.
- 49 -
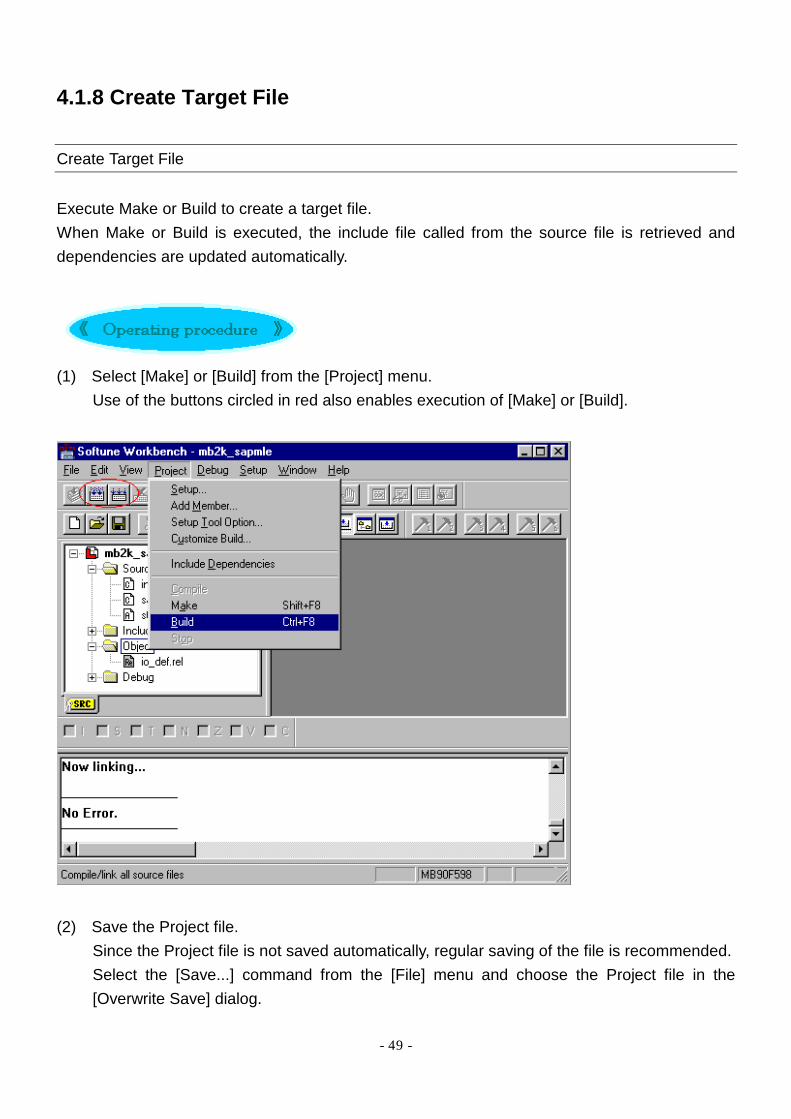
4.1.8 Create Target File
Create Target File Execute Make or Build to create a target file. When Make or Build is executed, the include file called from the source file is retrieved and dependencies are updated automatically.
(1) Select [Make] or [Build] from the [Project] menu.
Use of the buttons circled in red also enables execution of [Make] or [Build].
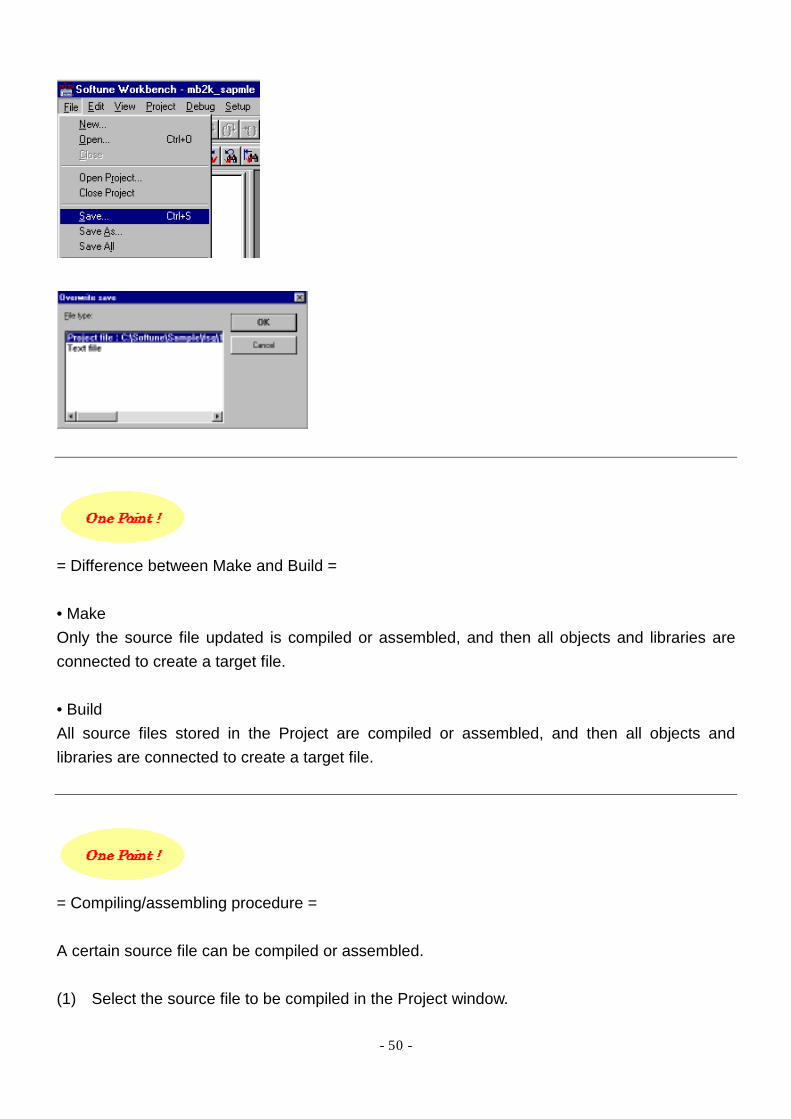
(2) Save the Project file.
Since the Project file is not saved automatically, regular saving of the file is recommended. Select the [Save...] command from the [File] menu and choose the Project file in the [Overwrite Save] dialog.
- 50 -
= Difference between Make and Build = • Make Only the source file updated is compiled or assembled, and then all objects and libraries are connected to create a target file. • Build All source files stored in the Project are compiled or assembled, and then all objects and libraries are connected to create a target file.
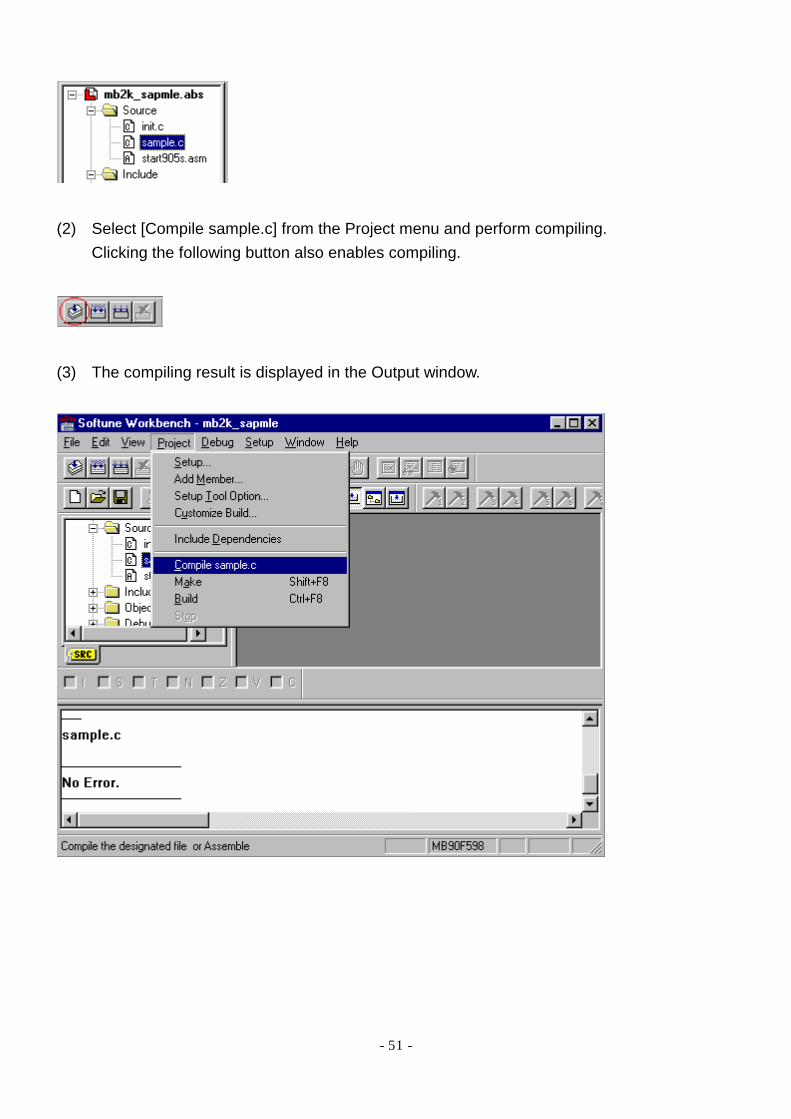
= Compiling/assembling procedure = A certain source file can be compiled or assembled. (1) Select the source file to be compiled in the Project window.
- 51 -
(2) Select [Compile sample.c] from the Project menu and perform compiling.
Clicking the following button also enables compiling.
(3) The compiling result is displayed in the Output window.

- 52 -
= Error jump function = Softune Workbench has an error jump function. When an error occurs in compiling or assembling, the error message is displayed in the Output window. When the error message is double-clicked, the source file is started to jump to the error line.
= Using external editor = When an external editor is used, the source file being edited is not saved automatically. Therefore, it is necessary to save the source file before compiling.

- 53 -
Recommended Use of C Checker When correcting a compiling error in the source file, the C Checker should be used. Use of the C Checker enables bug checking free of compiling and portability coding errors. For details, see Chapter 6 Recommended Use of C Analyzer After creating a target file, the C Analyzer should be used. Use of the C Analyzer enables visual checking of the program structure. For details, see Chapter 7
- 54 -
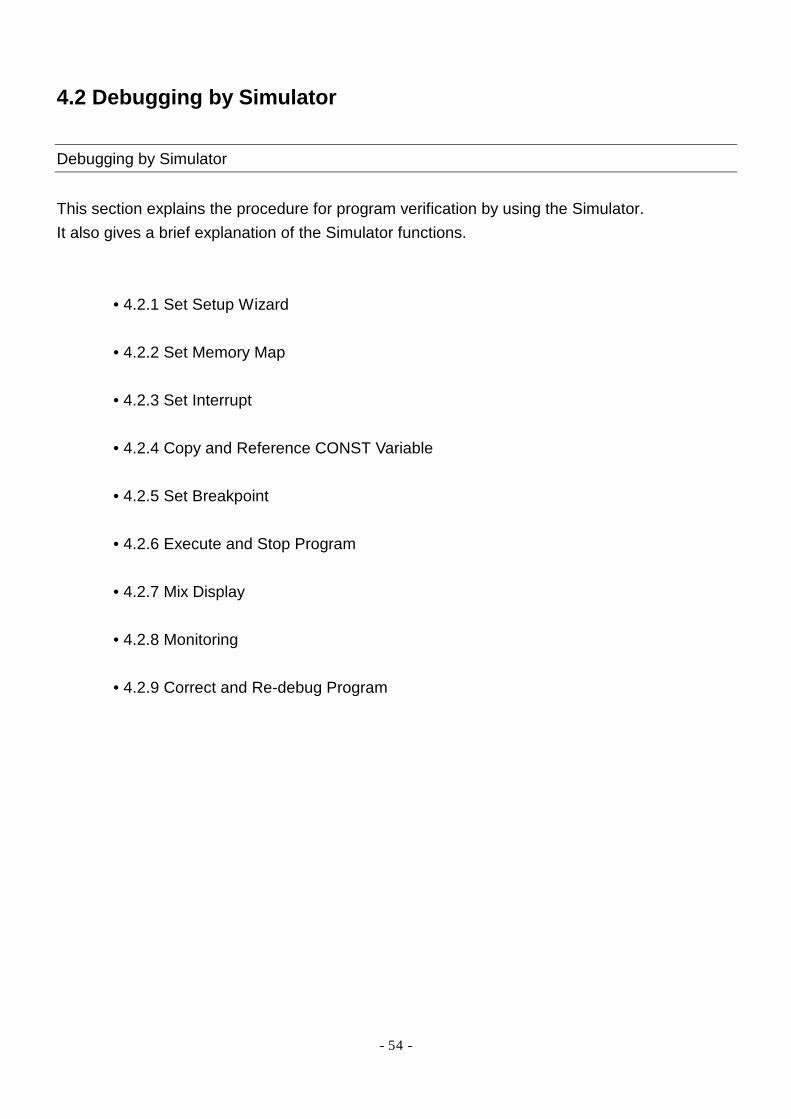
4.2 Debugging by Simulator
Debugging by Simulator This section explains the procedure for program verification by using the Simulator. It also gives a brief explanation of the Simulator functions. • 4.2.1 Set Setup Wizard • 4.2.2 Set Memory Map • 4.2.3 Set Interrupt • 4.2.4 Copy and Reference CONST Variable • 4.2.5 Set Breakpoint • 4.2.6 Execute and Stop Program • 4.2.7 Mix Display • 4.2.8 Monitoring • 4.2.9 Correct and Re-debug Program

- 55 -
4.2.1 Set Setup Wizard
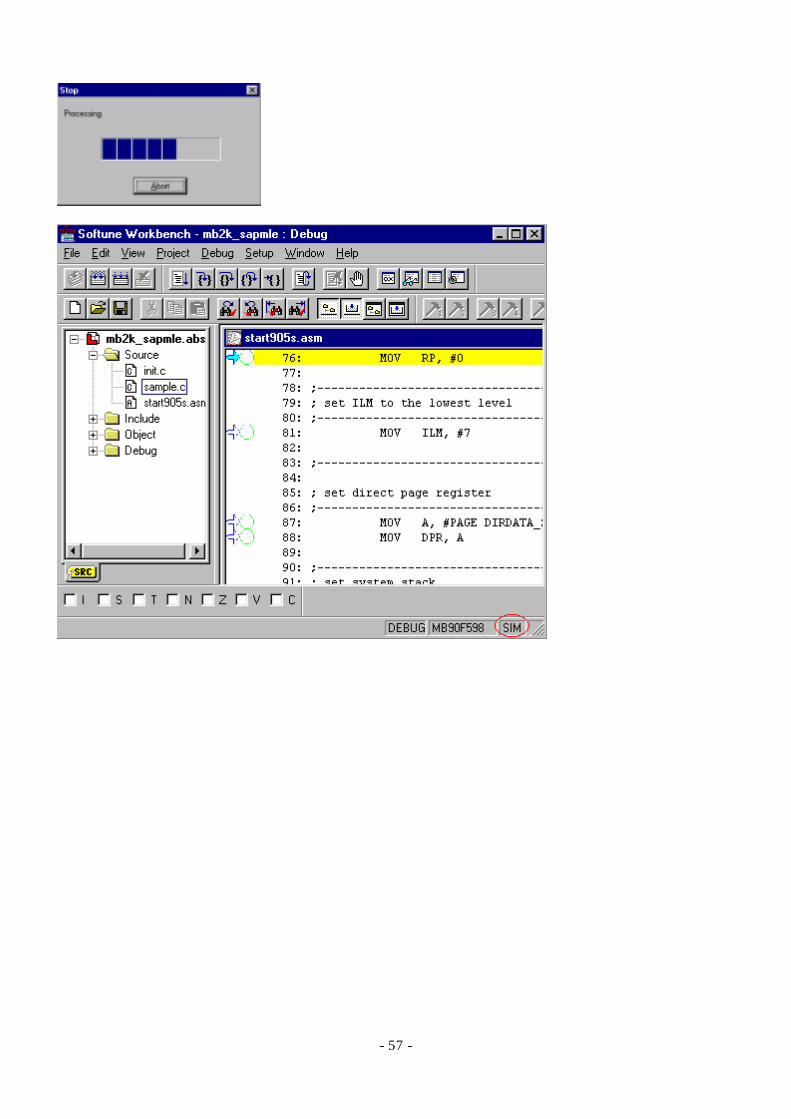
Procedure for Setting Setup Wizard When performing debugging for the first time after Project creation, execute [Start debug] in the [Debug] menu to start the Debugger setup wizard. Perform the settings according to the menu.
(1) Select [Start debug] from the [Debug] menu.
When the setup wizard is started, click [Next].
(2) Select Simulator Debugger for Debugger Type.
- 56 -
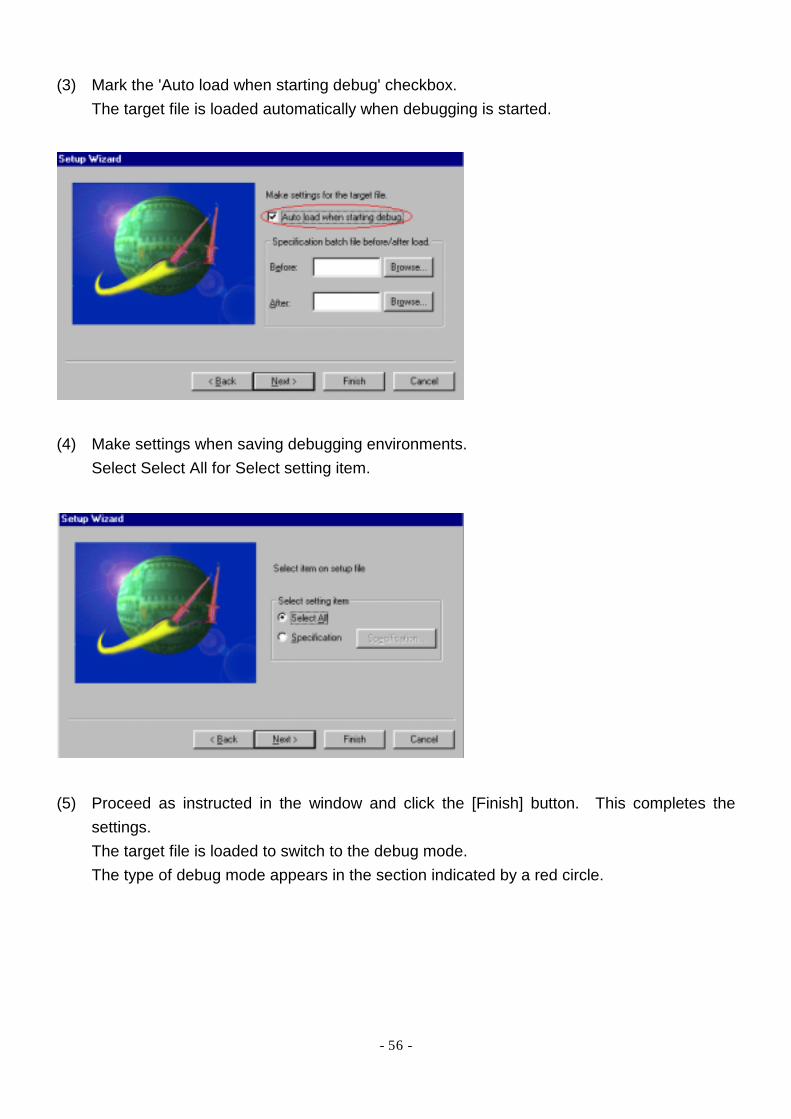
(3) Mark the 'Auto load when starting debug' checkbox. The target file is loaded automatically when debugging is started.
(4) Make settings when saving debugging environments.
Select Select All for Select setting item.
(5) Proceed as instructed in the window and click the [Finish] button. This completes the
settings. The target file is loaded to switch to the debug mode. The type of debug mode appears in the section indicated by a red circle.
- 57 -
- 58 -
4.2.2 Set Memory Map
Set Memory Map Set the memory map. If program access is made with anything other than the set attribute, an access violation occurs to stop the program. In this sample, the areas for access to CONST variables are set.
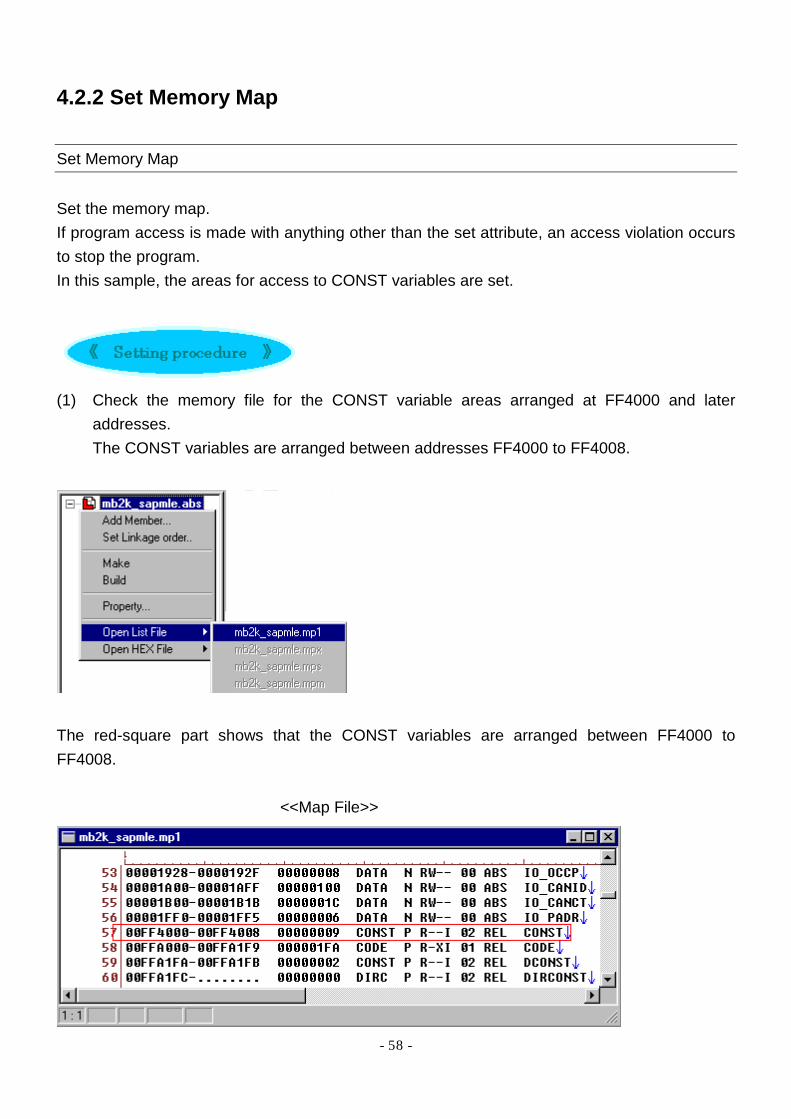
(1) Check the memory file for the CONST variable areas arranged at FF4000 and later
addresses. The CONST variables are arranged between addresses FF4000 to FF4008.
The red-square part shows that the CONST variables are arranged between FF4000 to FF4008.
<<Map File>>

- 59 -
(2) Select [Memory Map] from the [Setup] menu.
(3) Click the [Setup...] button in the [Map List] tab.
(4) Set the area for access to CONST variables using the mirror function.

- 60 -
= Delete defined areas = Undefined areas may be changed into defined areas (read/write/code). However, defined areas cannot be changed into undefined areas in the [Map Setup] dialog. Delete defined areas to change into undefined areas.

- 61 -
4.2.3 Set Interrupt
Simulation of Timer Interrupt In this sample, interrupts are generated every fixed period of time using the timer resource. However, since the Simulator has no timer resource, it is first necessary to generate specified interrupts within a fixed cycle in order to simulate the interrupt processing. This setting is saved at debugging completion.
(1) Select [Interrupt] from [Debug environment] in the [Setup] menu. (2) Set the interrupt number (vector number), request timing, and cycle count in the [Interrupt]
dialog. In this sample, make the settings as follows:

- 62 -
4.2.4 Copy and Reference CONST Variables
Copy and Reference CONST Variables This sample uses the ROM mirror function. Since the Simulator does not support the ROM mirror function, it is necessary to first copy CONST variables to the RAM area before debugging. Copy CONST variables to the RAM area and check the copied variables in the Watch and Register windows.
(1) Select [Command] from the [View] menu and display the Command window.
MOVE FF4000..FF4008, 4000 is executed to copy CONST sections to 4000 and later addresses.
(2) Display the Watch window.
Select [Watch] from the [View] menu.
- 63 -
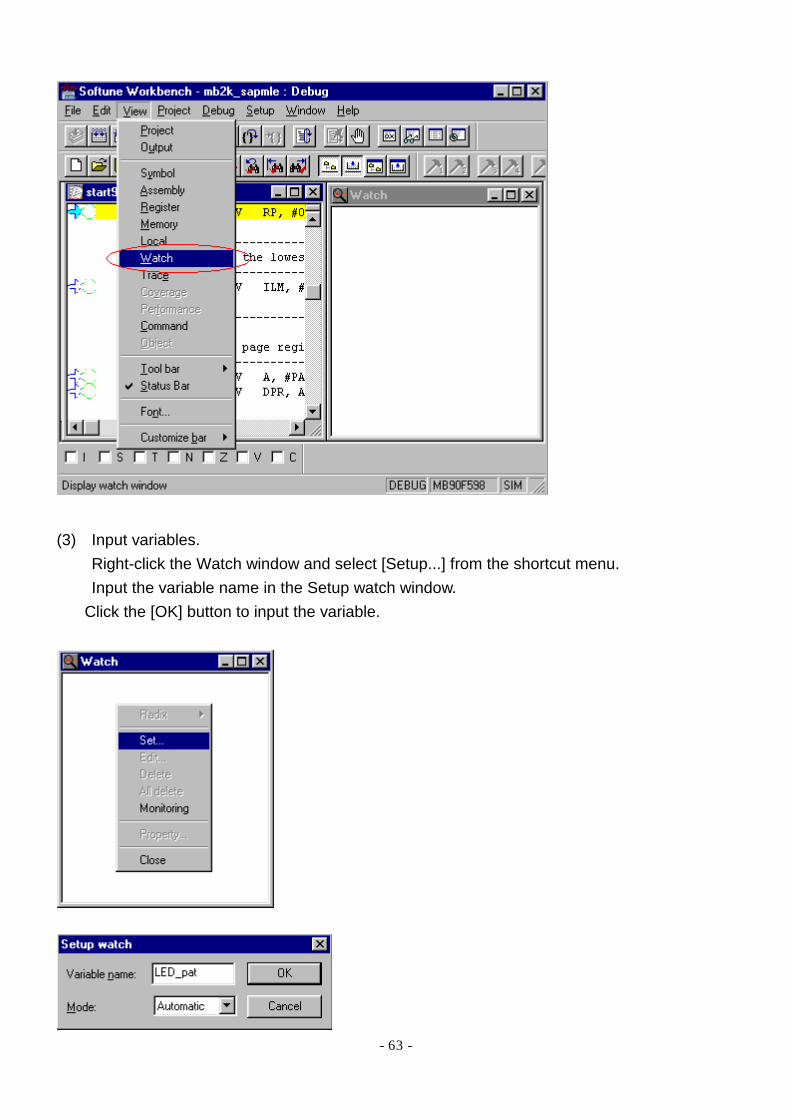
(3) Input variables.
Right-click the Watch window and select [Setup...] from the shortcut menu. Input the variable name in the Setup watch window.
Click the [OK] button to input the variable.

- 64 -
Use the same procedure to input the following variables.
(4) Select [Memory] from the [View] menu and display the Memory window.
Specify the display position in the [Jump] dialog and display address 4000.
This permits checking that the CONST variable (LED_pat) has been copied to address 4000.

- 65 -
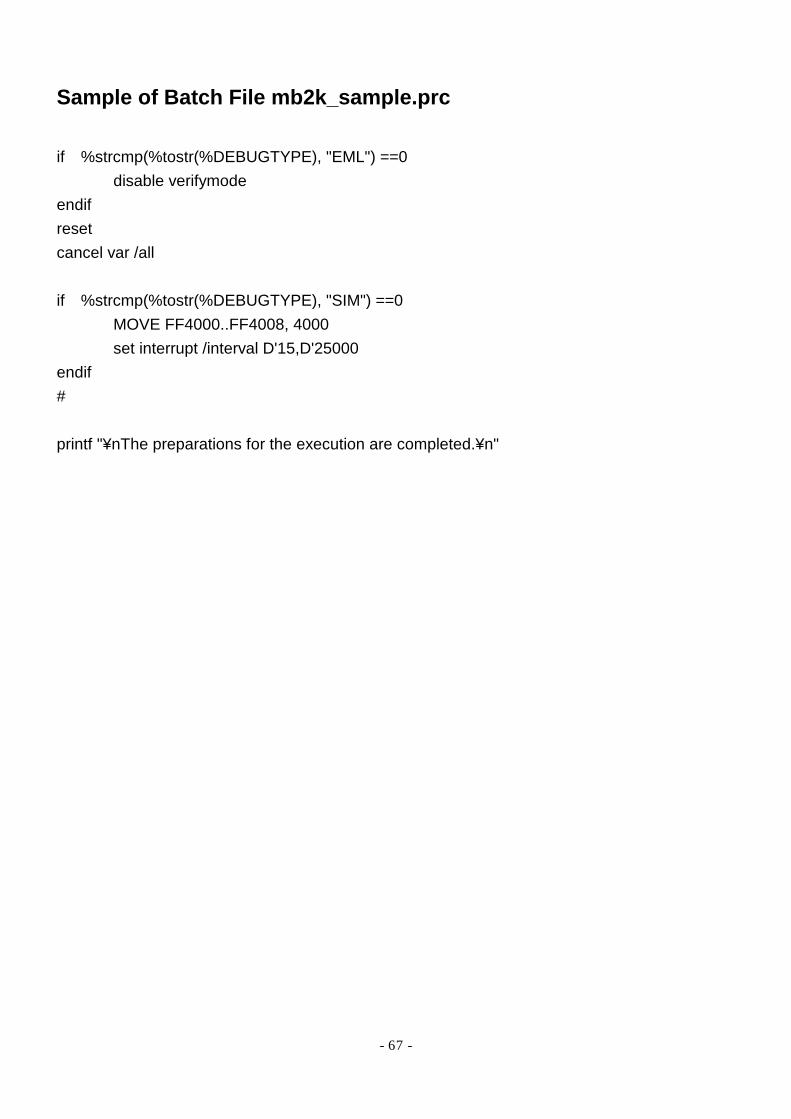
= Create batch file = Batch file creation enables automatic execution of 'Set interrupt' and 'Copy CONST variables' in switching to the debug mode. Executing the batch file provides savings in setting from the dialog. Automatic execution of the batch file can be set in the Setup Wizard window. Cut and copy the file shown below as a batch file. Saving the file in the Project directory eliminates the need for path specification.
• mb2k_sample.prc

- 66 -
- 67 -
Sample of Batch File mb2k_sample.prc if %strcmp(%tostr(%DEBUGTYPE), "EML") ==0 disable verifymode endif reset cancel var /all if %strcmp(%tostr(%DEBUGTYPE), "SIM") ==0 MOVE FF4000..FF4008, 4000 set interrupt /interval D'15,D'25000 endif # printf "¥nThe preparations for the execution are completed.¥n"
- 68 -
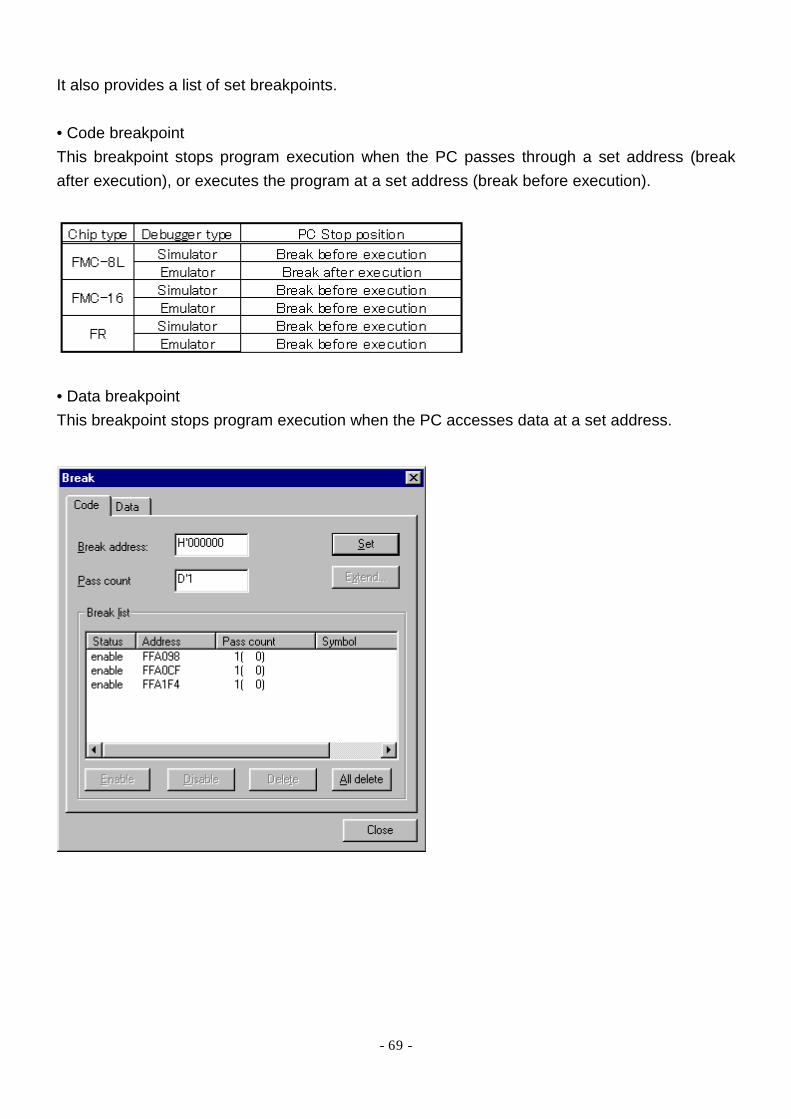
4.2.5 Set Breakpoint
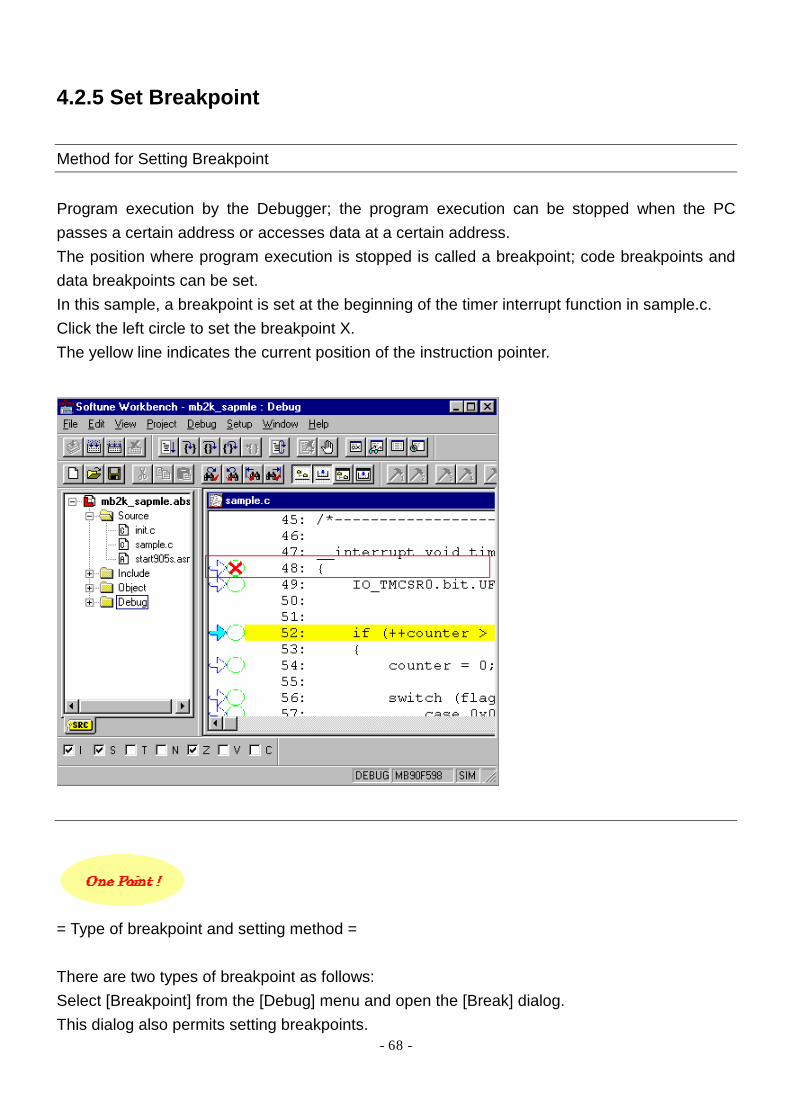
Method for Setting Breakpoint Program execution by the Debugger; the program execution can be stopped when the PC passes a certain address or accesses data at a certain address. The position where program execution is stopped is called a breakpoint; code breakpoints and data breakpoints can be set. In this sample, a breakpoint is set at the beginning of the timer interrupt function in sample.c. Click the left circle to set the breakpoint X. The yellow line indicates the current position of the instruction pointer.
= Type of breakpoint and setting method = There are two types of breakpoint as follows: Select [Breakpoint] from the [Debug] menu and open the [Break] dialog. This dialog also permits setting breakpoints.
- 69 -
It also provides a list of set breakpoints. • Code breakpoint This breakpoint stops program execution when the PC passes through a set address (break after execution), or executes the program at a set address (break before execution).
• Data breakpoint This breakpoint stops program execution when the PC accesses data at a set address.
- 70 -
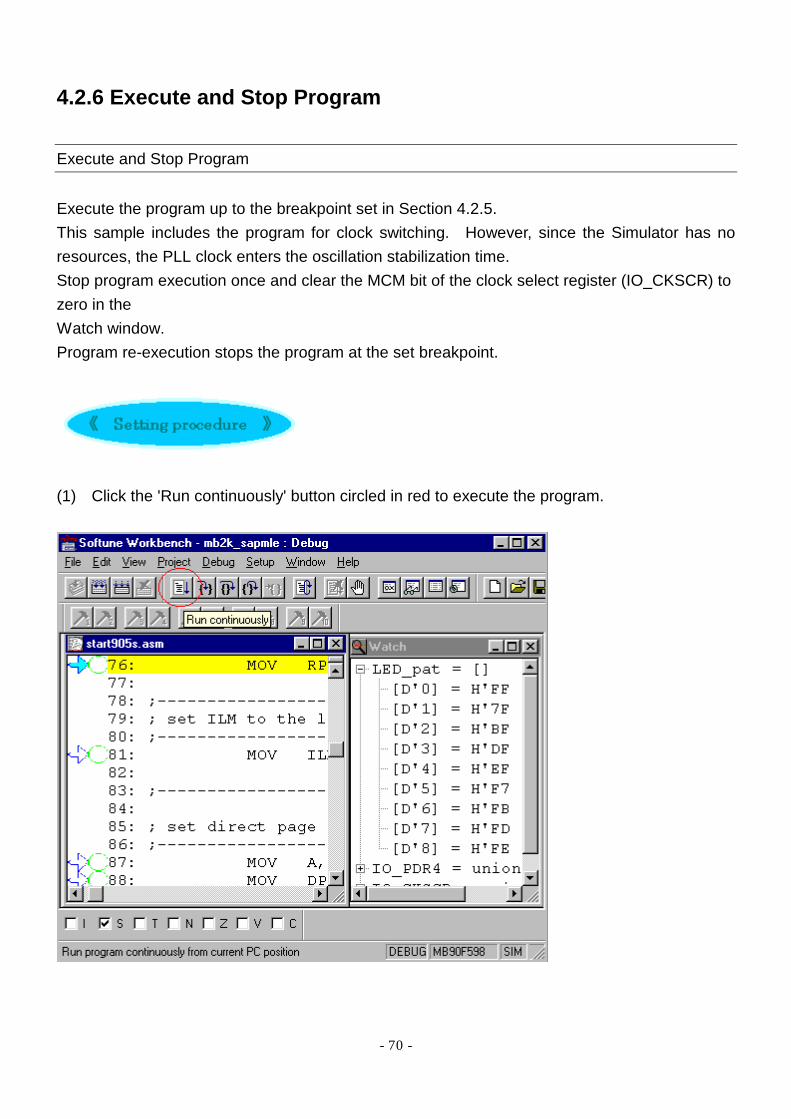
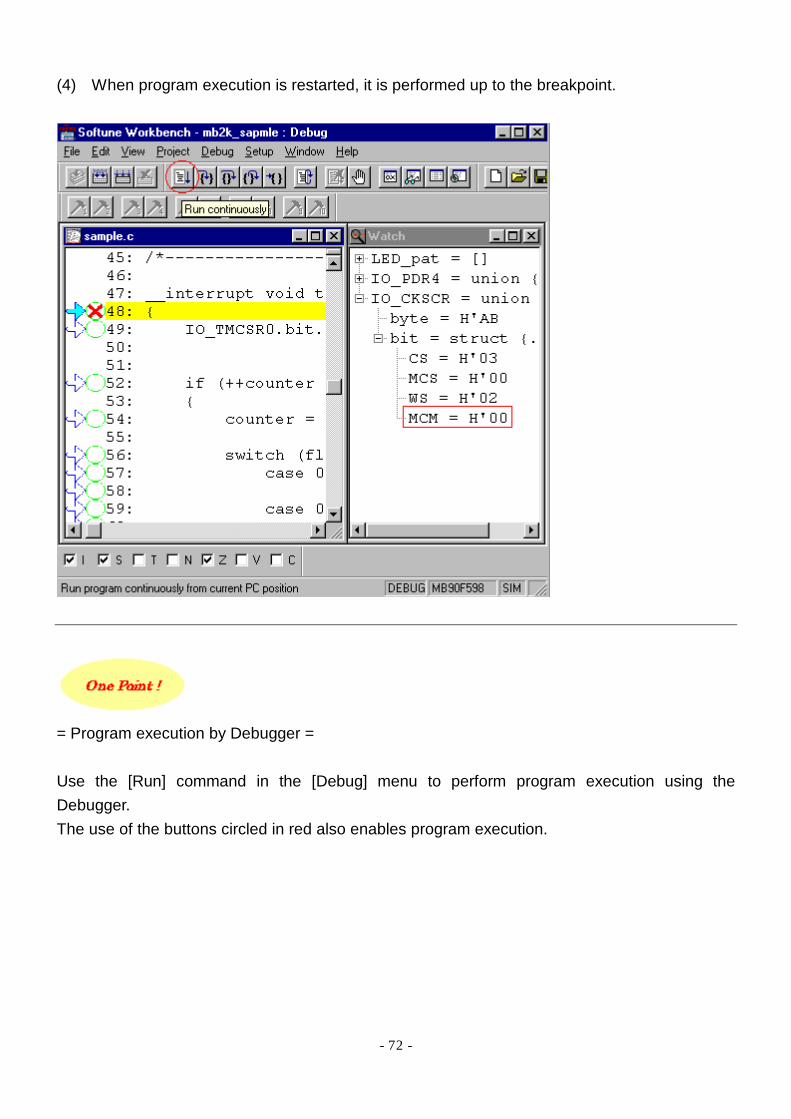
4.2.6 Execute and Stop Program
Execute and Stop Program Execute the program up to the breakpoint set in Section 4.2.5. This sample includes the program for clock switching. However, since the Simulator has no resources, the PLL clock enters the oscillation stabilization time. Stop program execution once and clear the MCM bit of the clock select register (IO_CKSCR) to zero in the Watch window. Program re-execution stops the program at the set breakpoint.
(1) Click the 'Run continuously' button circled in red to execute the program.

- 71 -
(2) Click the 'Stop execution' button circled in red to stop program execution once.
(3) Edit the MCM bit of the IO_CKSCR register in the Watch window.
Select the MCM bit and [Edit...] from the shortcut menu, and clear the MCM bit to zero in the [Edit variable] dialog.
- 72 -
(4) When program execution is restarted, it is performed up to the breakpoint.
= Program execution by Debugger = Use the [Run] command in the [Debug] menu to perform program execution using the Debugger. The use of the buttons circled in red also enables program execution.

- 73 -
(1) Go The program is executed continuously from the current PC position. Program execution is stopped when program execution reaches the breakpoint or [Abort] is selected from the [Debug] menu. (2) Step In Step-by-step program execution is performed and stopped after moving the PC to the address of the next instruction. When the function call instruction is executed, program execution is stopped at the beginning of the function. (3) Step Over Step-by-step program execution is performed and stopped after moving the PC to the beginning of the next instruction. When the function call instruction is executed, all the functions are executed and program execution is stopped after moving the PC to the address of the instruction next to the function call instruction. (4) Step Out The current function is executed up to its end, returning to the function call source and program execution is stopped after moving the PC to the address of the instruction next to the function call instruction.

- 74 -
(5) Run Until Cursor Program execution is performed up to the immediately preceding instruction at the address at which the current cursor is in the Source or Disassemble window, and stopped after moving the PC to the address at the cursor. To reset program execution, click on [Reset of MCU] in the [Debug] menu or the button circled in red.
= Display of Register window = When [Register] is selected from the [View] menu, the Register window is opened. The register with a value changed by program execution is displayed in red in the Register window. To display the register, select [Setup display register] from the shortcut menu. Then, select the register to be displayed in the [Setup display register] dialog.

- 75 -
= Status display of MCU condition flag = The status of the condition flag is displayed. Clicking on this checkbox enables each flag to be reset or cleared. If the checkbox is not displayed, select [Flag] from [Tool bar] in the [View] menu.
= Display of status bar = The following descriptions are displayed in the status bar. If the status bar is not displayed, select [Status Bar] from the [View] menu.
- 76 -
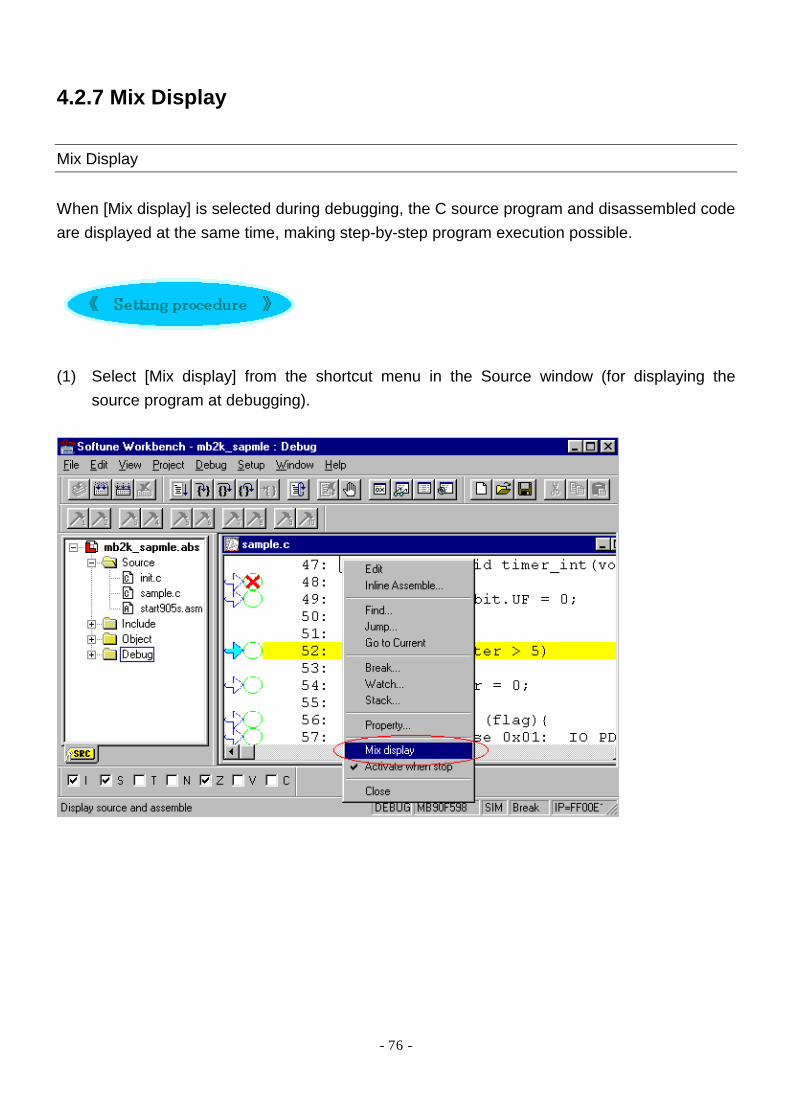
4.2.7 Mix Display
Mix Display When [Mix display] is selected during debugging, the C source program and disassembled code are displayed at the same time, making step-by-step program execution possible.
(1) Select [Mix display] from the shortcut menu in the Source window (for displaying the
source program at debugging).
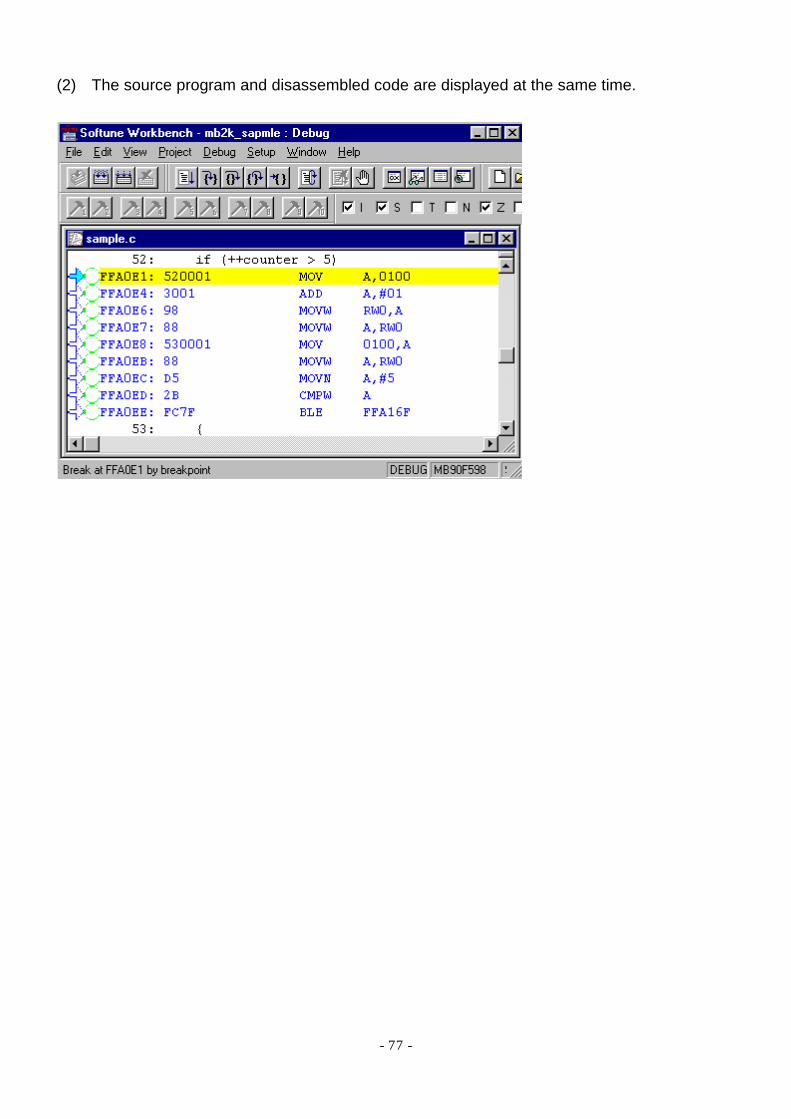
- 77 -
(2) The source program and disassembled code are displayed at the same time.
- 78 -
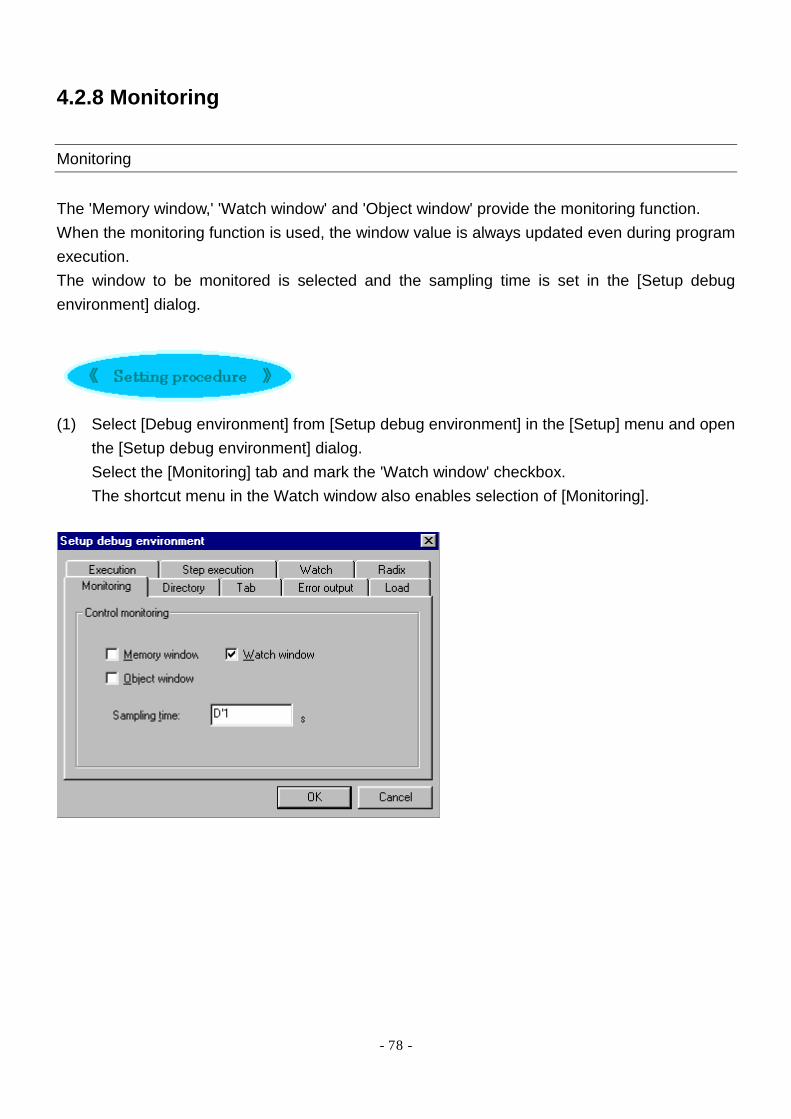
4.2.8 Monitoring
Monitoring The 'Memory window,' 'Watch window' and 'Object window' provide the monitoring function. When the monitoring function is used, the window value is always updated even during program execution. The window to be monitored is selected and the sampling time is set in the [Setup debug environment] dialog.
(1) Select [Debug environment] from [Setup debug environment] in the [Setup] menu and open
the [Setup debug environment] dialog. Select the [Monitoring] tab and mark the 'Watch window' checkbox. The shortcut menu in the Watch window also enables selection of [Monitoring].
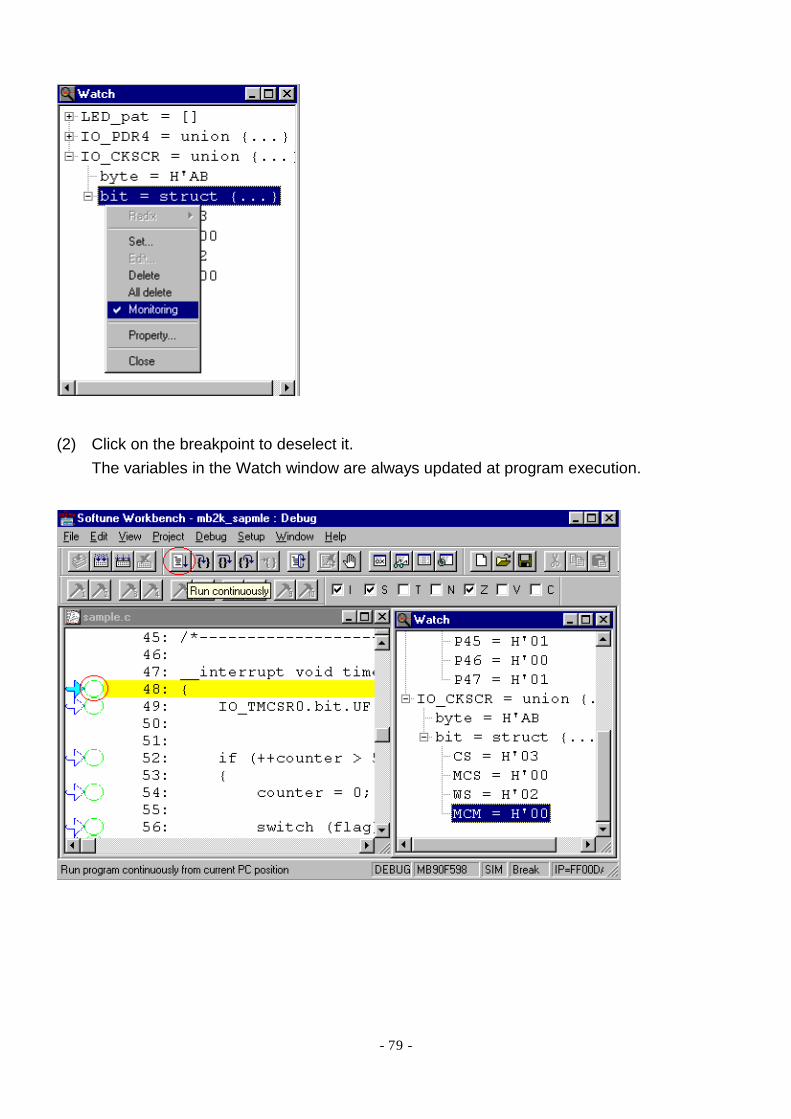
- 79 -
(2) Click on the breakpoint to deselect it.
The variables in the Watch window are always updated at program execution.
- 80 -
4.2.9 Correct and Re-debug Program
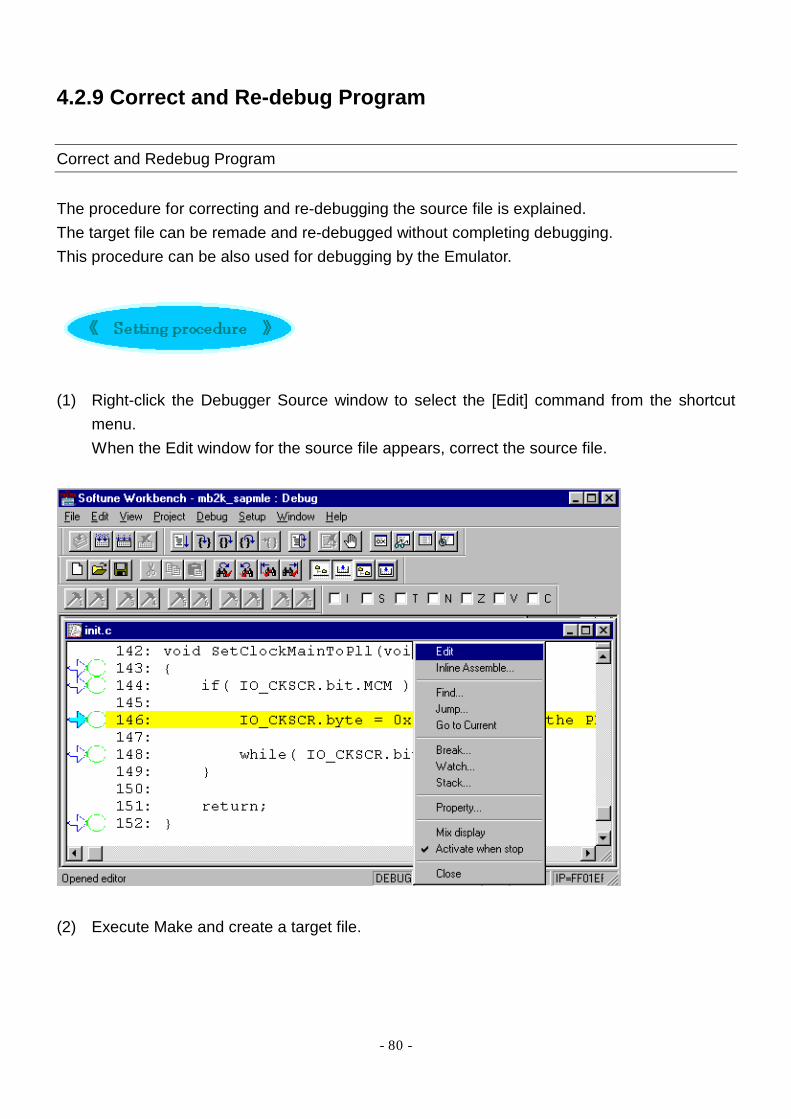
Correct and Redebug Program The procedure for correcting and re-debugging the source file is explained. The target file can be remade and re-debugged without completing debugging. This procedure can be also used for debugging by the Emulator.
(1) Right-click the Debugger Source window to select the [Edit] command from the shortcut
menu. When the Edit window for the source file appears, correct the source file.
(2) Execute Make and create a target file.
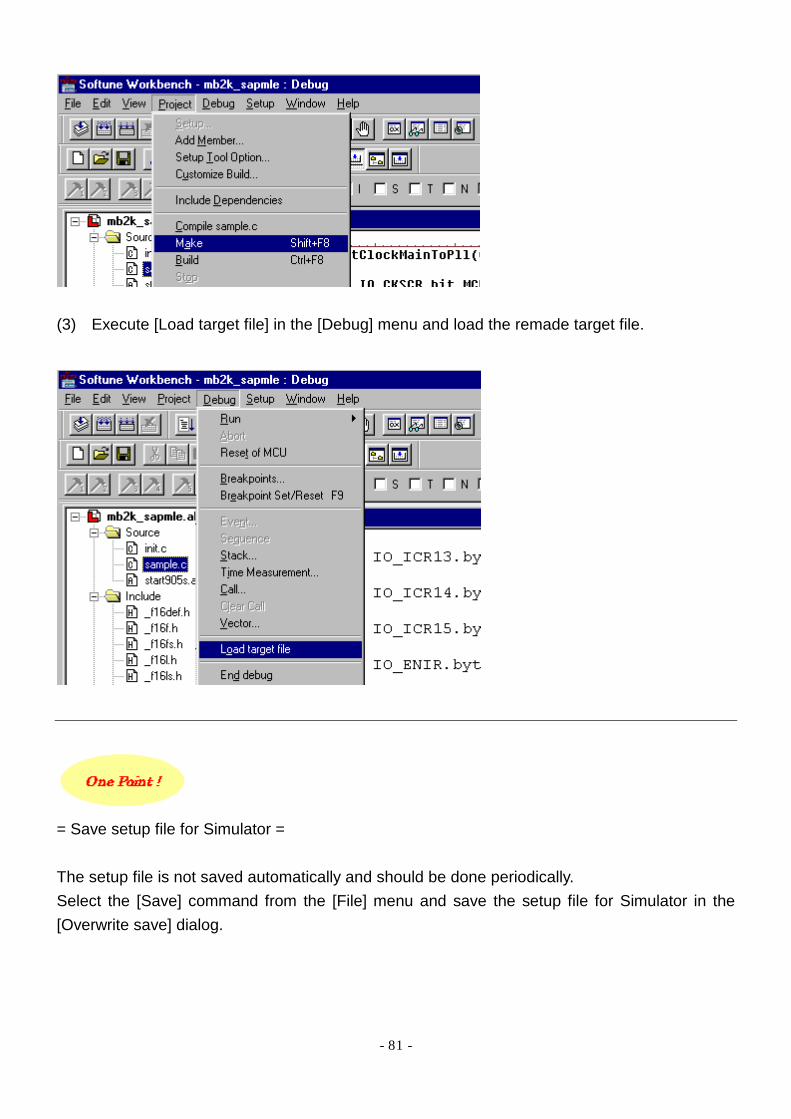
- 81 -
(3) Execute [Load target file] in the [Debug] menu and load the remade target file.
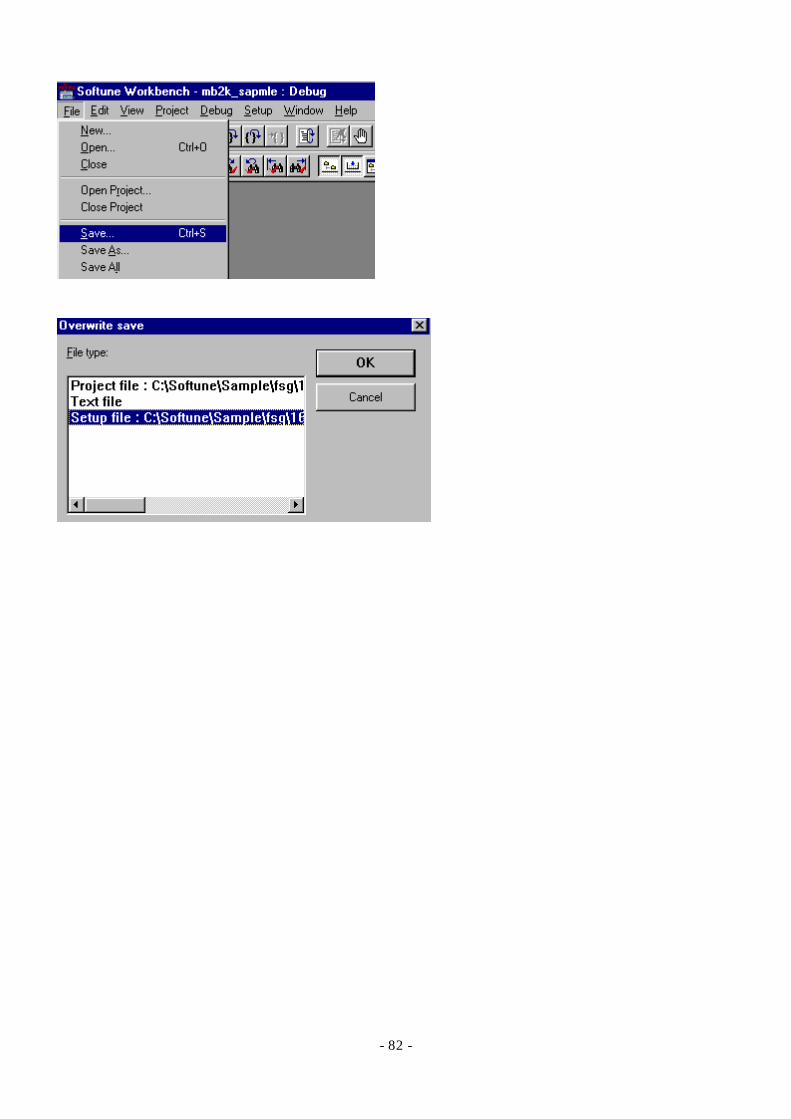
= Save setup file for Simulator = The setup file is not saved automatically and should be done periodically. Select the [Save] command from the [File] menu and save the setup file for Simulator in the [Overwrite save] dialog.
- 82 -
- 83 -
4.3 Debugging by Emulator
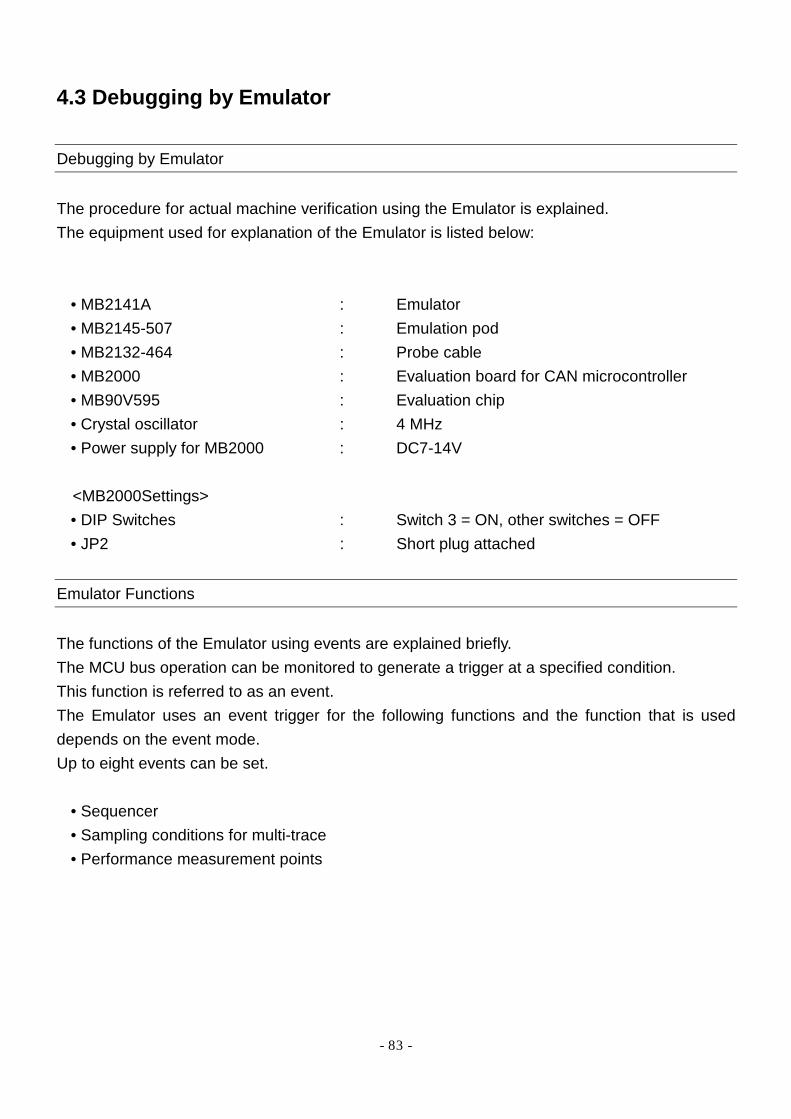
Debugging by Emulator The procedure for actual machine verification using the Emulator is explained. The equipment used for explanation of the Emulator is listed below:
• MB2141A : Emulator • MB2145-507 : Emulation pod • MB2132-464 : Probe cable • MB2000 : Evaluation board for CAN microcontroller • MB90V595 : Evaluation chip • Crystal oscillator : 4 MHz • Power supply for MB2000 : DC7-14V
<MB2000Settings>
• DIP Switches : Switch 3 = ON, other switches = OFF • JP2 : Short plug attached
Emulator Functions The functions of the Emulator using events are explained briefly. The MCU bus operation can be monitored to generate a trigger at a specified condition. This function is referred to as an event. The Emulator uses an event trigger for the following functions and the function that is used depends on the event mode. Up to eight events can be set.
• Sequencer • Sampling conditions for multi-trace • Performance measurement points

- 84 -
• 4.3.1 Load Monitor Program • 4.3.2 Set Setup Wizard • 4.3.3 Set Memory Map • 4.3.4 Performance Measurement • 4.3.5 Sequential Break • 4.5.6 Single Trace • 4.3.7 Multi Trace
- 85 -
4.3.1 Load Monitor Program
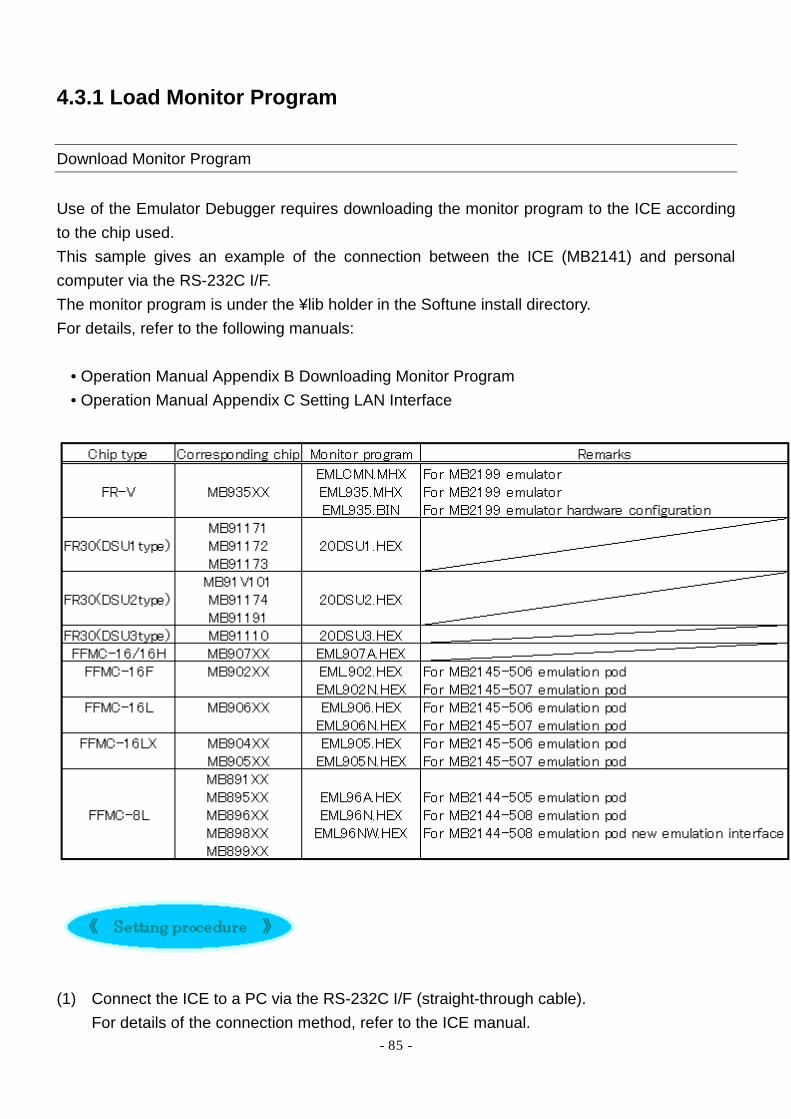
Download Monitor Program Use of the Emulator Debugger requires downloading the monitor program to the ICE according to the chip used. This sample gives an example of the connection between the ICE (MB2141) and personal computer via the RS-232C I/F. The monitor program is under the ¥lib holder in the Softune install directory. For details, refer to the following manuals:
• Operation Manual Appendix B Downloading Monitor Program • Operation Manual Appendix C Setting LAN Interface
(1) Connect the ICE to a PC via the RS-232C I/F (straight-through cable).
For details of the connection method, refer to the ICE manual.
- 86 -
(2) Turn on the power supply with the ICE reset switch pressed down. Press the reset switch for about 3 seconds. After releasing the reset switch, check that both the ICE READY and POWER LEDs are on.
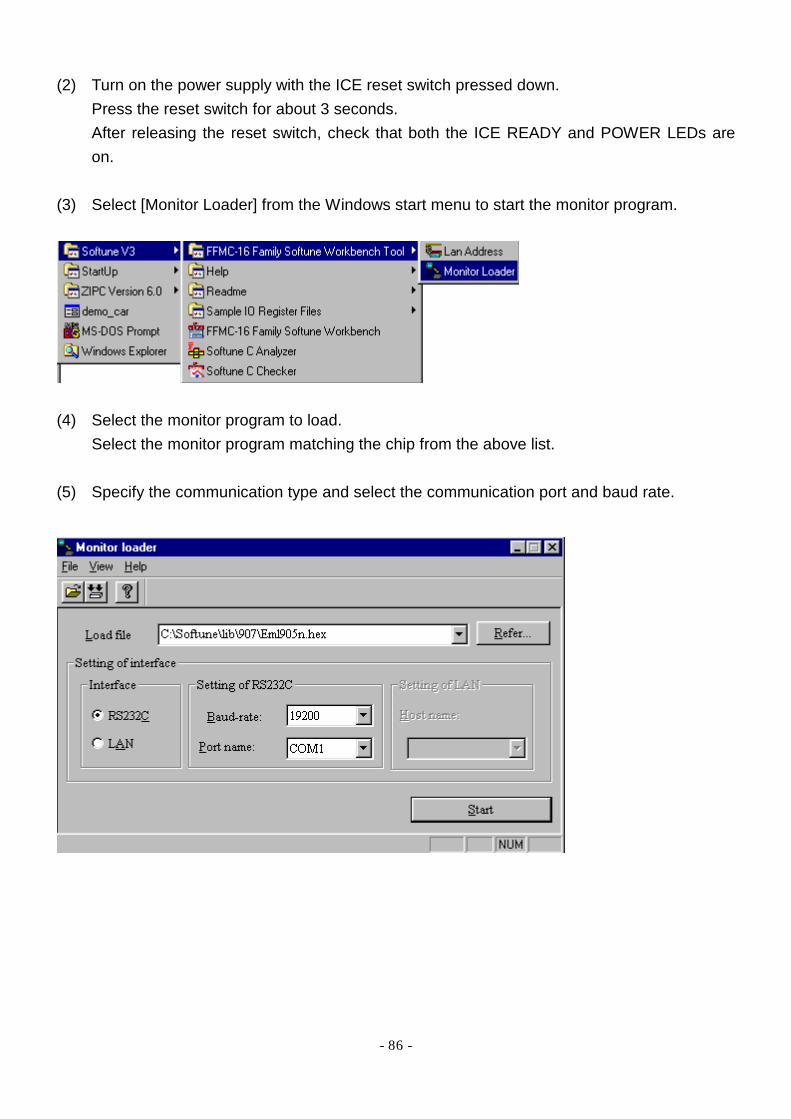
(3) Select [Monitor Loader] from the Windows start menu to start the monitor program.
(4) Select the monitor program to load.
Select the monitor program matching the chip from the above list. (5) Specify the communication type and select the communication port and baud rate.

- 87 -
(6) Click the [Start] button to load the monitor program to the ICE.
(7) Click [Exit] in the [File] menu to exit from the monitor program.
Turn off the ICE power supply.
- 88 -
4.3.2 Set Setup Wizard
Procedure for Setting Setup Wizard Create a setup file for the Emulator.
(1) Select [Setup...] from the [Project] menu.
The above menu cannot be selected in the debug mode. Use the [End debug] command in the [Debug] menu to end the debug mode.
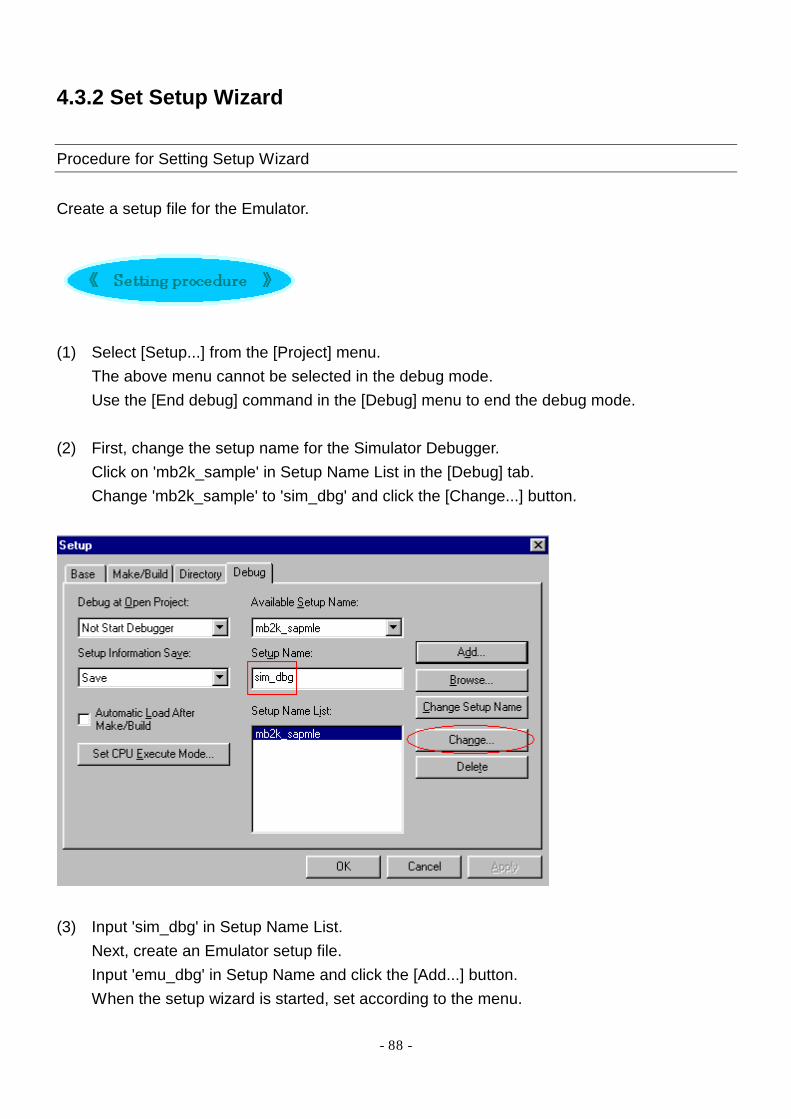
(2) First, change the setup name for the Simulator Debugger.
Click on 'mb2k_sample' in Setup Name List in the [Debug] tab. Change 'mb2k_sample' to 'sim_dbg' and click the [Change...] button.
(3) Input 'sim_dbg' in Setup Name List.
Next, create an Emulator setup file. Input 'emu_dbg' in Setup Name and click the [Add...] button. When the setup wizard is started, set according to the menu.

- 89 -

- 90 -
(4) After completing the settings in the Setup Wizard window, click the [OK] button to input the
Emulator setup file.
(5) The setup file input is displayed in the window.
The setup file started when the [Start debug] command in the [Debug] menu is executed is displayed in blue. When the setup file is double-clicked, the Debugger is started according to its setup imformation.
- 91 -
4.3.3 Set Memory Map
Setup Memory Map Set the memory map. When a program is accessed with anything other than the set attribute, an access violation occurs to stop the program.
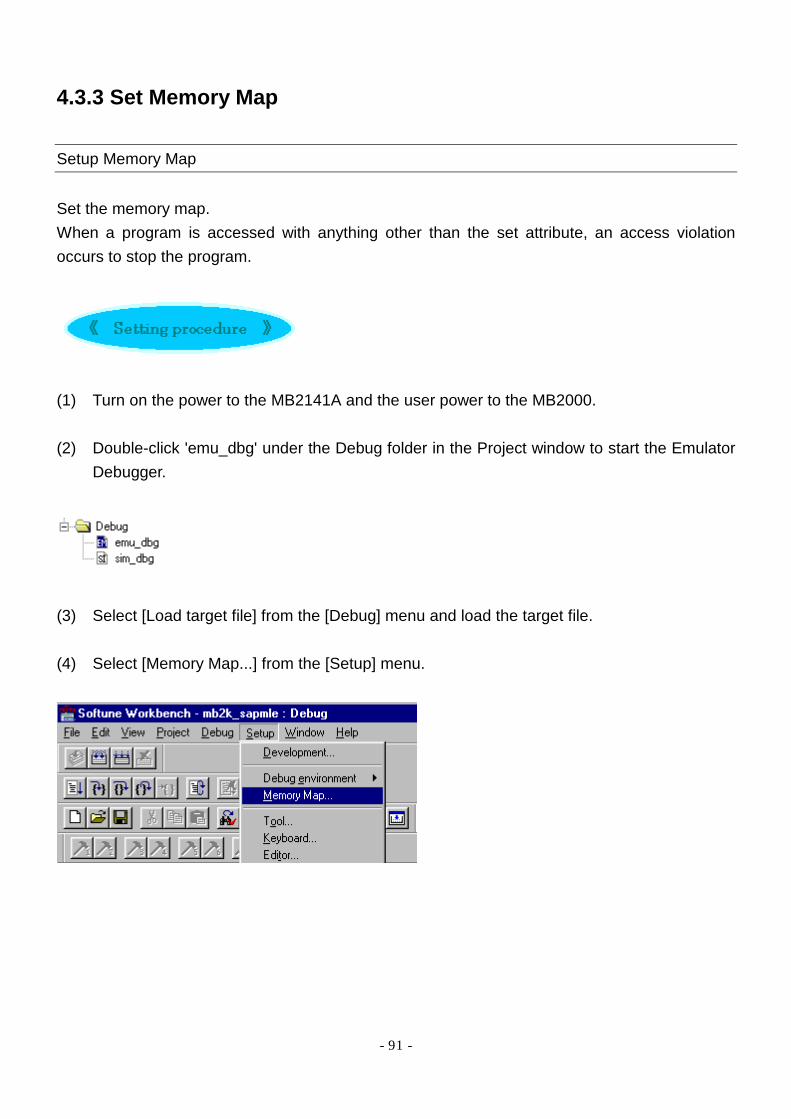
(1) Turn on the power to the MB2141A and the user power to the MB2000. (2) Double-click 'emu_dbg' under the Debug folder in the Project window to start the Emulator
Debugger.
(3) Select [Load target file] from the [Debug] menu and load the target file. (4) Select [Memory Map...] from the [Setup] menu.

- 92 -
(5) In the [Map list] tab, set the map area as follows:
(6) Reset the MCU before program execution.
(7) When the program is executed continuously, the MB2000 LEDs come on in sequence.
(8) After checking that each LED is on, stop and reset the program.
- 93 -
4.3.4 Performance Measurement
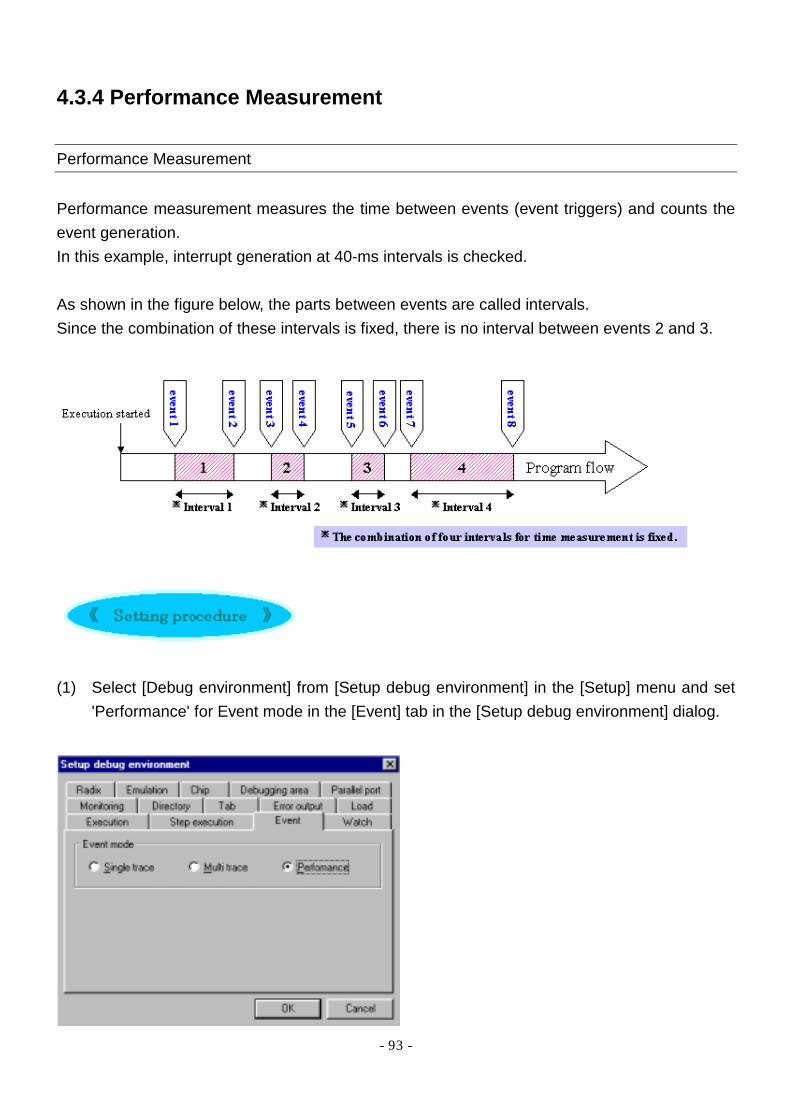
Performance Measurement Performance measurement measures the time between events (event triggers) and counts the event generation. In this example, interrupt generation at 40-ms intervals is checked. As shown in the figure below, the parts between events are called intervals. Since the combination of these intervals is fixed, there is no interval between events 2 and 3.
(1) Select [Debug environment] from [Setup debug environment] in the [Setup] menu and set
'Performance' for Event mode in the [Event] tab in the [Setup debug environment] dialog.

- 94 -
(2) Select [Event...] from the [Debug] menu and input events 1 and 2. The interval between events 1 and 2 is called 'interval 1' and its time is measured.
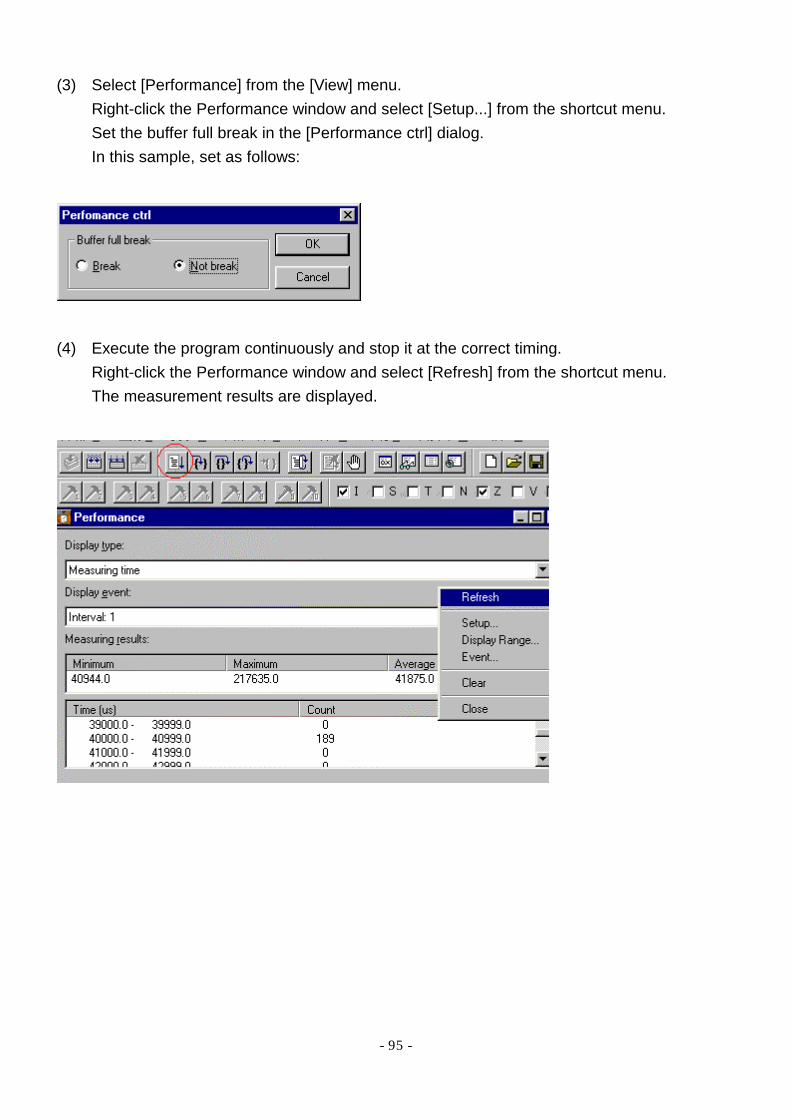
- 95 -
(3) Select [Performance] from the [View] menu. Right-click the Performance window and select [Setup...] from the shortcut menu. Set the buffer full break in the [Performance ctrl] dialog. In this sample, set as follows:
(4) Execute the program continuously and stop it at the correct timing.
Right-click the Performance window and select [Refresh] from the shortcut menu. The measurement results are displayed.

- 96 -
4.3.5 Sequential Break
Sequential Break If the sequential conditions are met, program execution can be stopped.
(1) Select [Debug environment] from [Setup debug environment] in the [Setup] menu and set
'Single trace' for Event mode in the [Event] tab in the [Setup debug environment] dialog.
(2) Select [Event...] from the [Debug] menu and input the event.
- 97 -
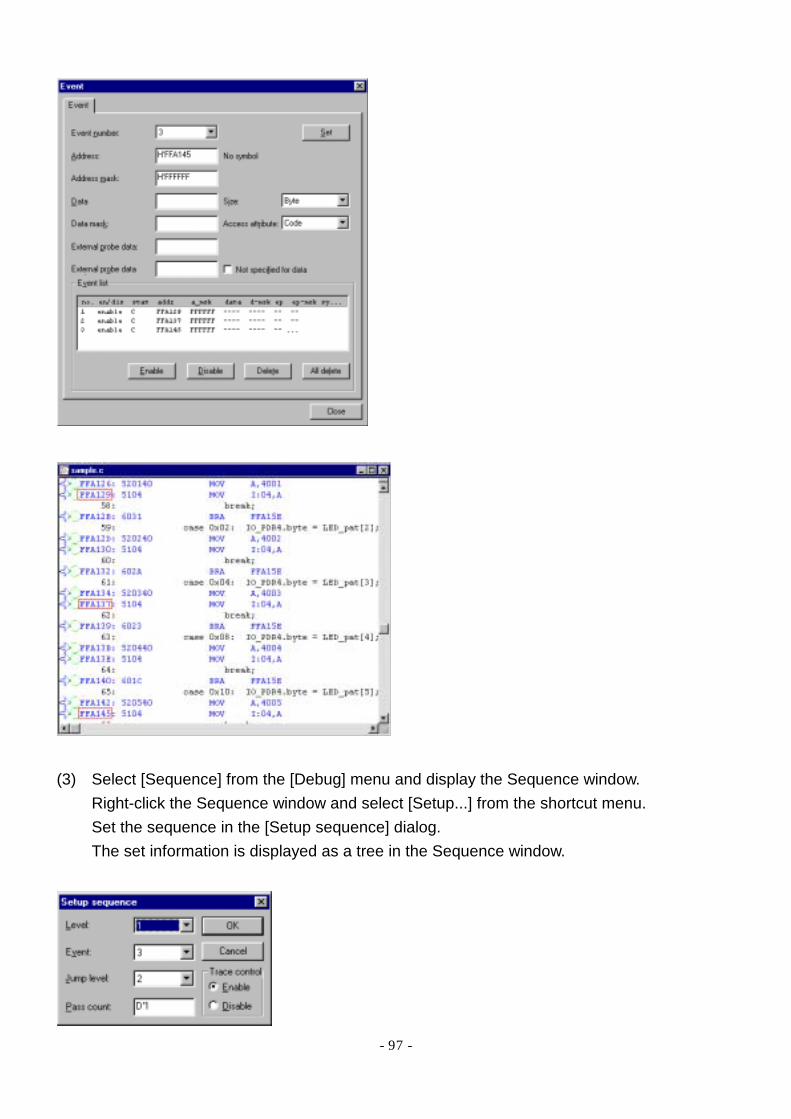
(3) Select [Sequence] from the [Debug] menu and display the Sequence window.
Right-click the Sequence window and select [Setup...] from the shortcut menu. Set the sequence in the [Setup sequence] dialog. The set information is displayed as a tree in the Sequence window.
- 98 -
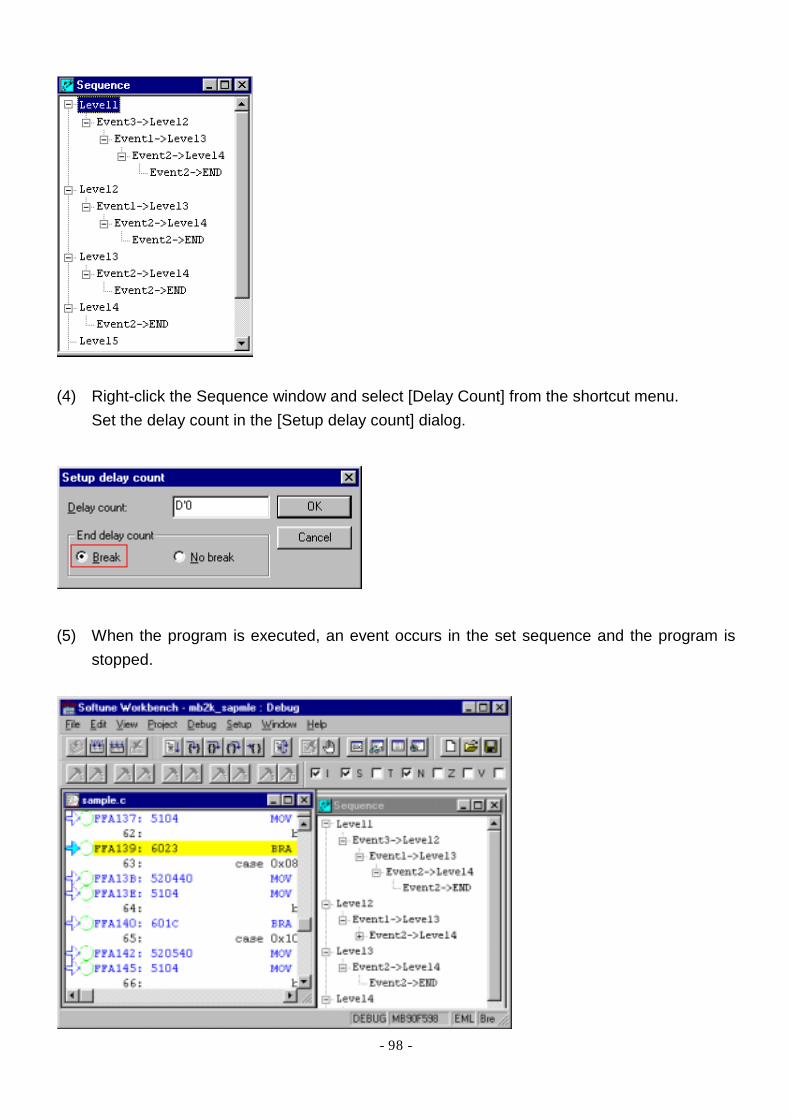
(4) Right-click the Sequence window and select [Delay Count] from the shortcut menu.
Set the delay count in the [Setup delay count] dialog.
(5) When the program is executed, an event occurs in the set sequence and the program is
stopped.

- 99 -
4.3.6 Single Trace
Single Trace In single trace, all data required from when program execution is started until it is terminated is traced. The event sequencer can be used to control suspending and restarting of trace data sampling in process. Since the delay between the generation of a sequencer end trigger and the end of trace can be set, it is possible to trace the flow of the program after an event. Counting is performed in bus cycles, so the delay count matches the count of sampled trace data. After completion of delay count, a sequential break usually occurs. However, only the trace can be terminated without break. The trace capacity is 32 K (32768) frames.
(1) Select [Debug environment] from [Setup debug environment] in the [Setup] menu and set
'Single trace' for Event mode in the [Event] tab in the [Setup debug environment] dialog.

- 100 -
(2) Select [Trace] from the [View] menu and display the Trace window. Right-click in the Trace window and select [Setup...] from the shortcut menu. Set 'Enable' for Status in the [Setup trace] dialog.
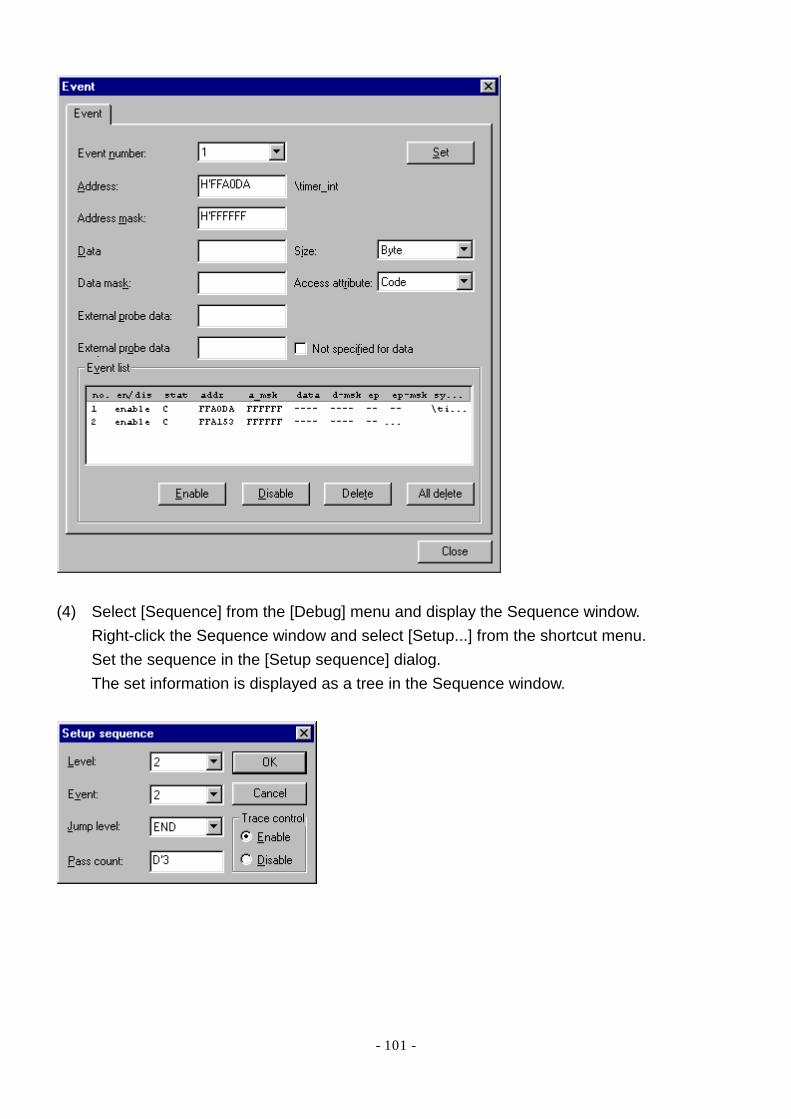
(3) Select [Event...] from the [Debug] menu and input the event.
- 101 -
(4) Select [Sequence] from the [Debug] menu and display the Sequence window.
Right-click the Sequence window and select [Setup...] from the shortcut menu. Set the sequence in the [Setup sequence] dialog. The set information is displayed as a tree in the Sequence window.
- 102 -
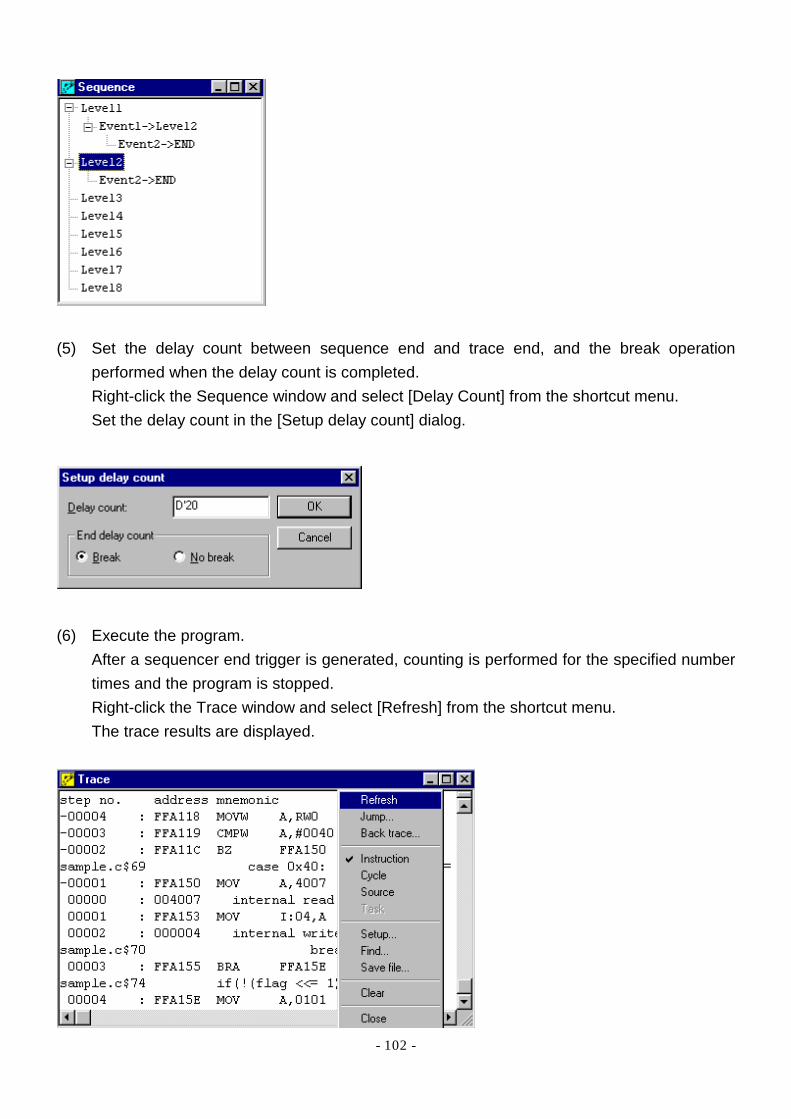
(5) Set the delay count between sequence end and trace end, and the break operation
performed when the delay count is completed. Right-click the Sequence window and select [Delay Count] from the shortcut menu. Set the delay count in the [Setup delay count] dialog.
(6) Execute the program.
After a sequencer end trigger is generated, counting is performed for the specified number times and the program is stopped. Right-click the Trace window and select [Refresh] from the shortcut menu. The trace results are displayed.
- 103 -
4.3.7 Multi Trace
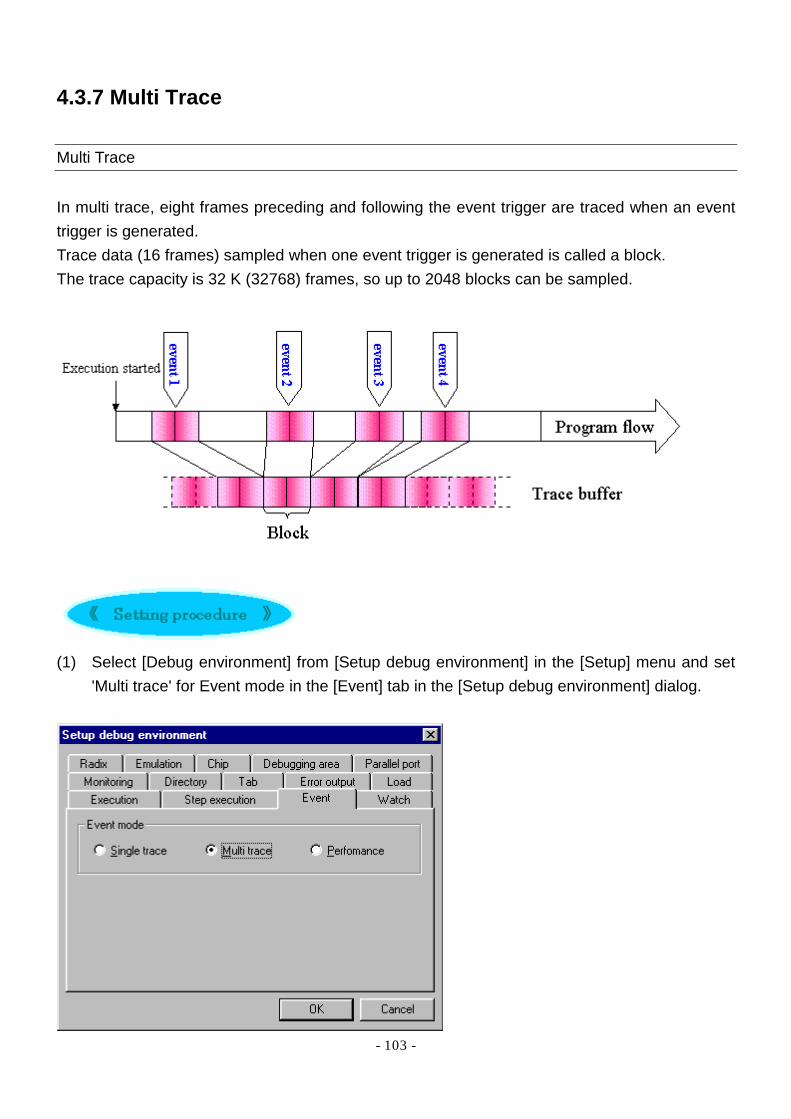
Multi Trace In multi trace, eight frames preceding and following the event trigger are traced when an event trigger is generated. Trace data (16 frames) sampled when one event trigger is generated is called a block. The trace capacity is 32 K (32768) frames, so up to 2048 blocks can be sampled.
(1) Select [Debug environment] from [Setup debug environment] in the [Setup] menu and set
'Multi trace' for Event mode in the [Event] tab in the [Setup debug environment] dialog.

- 104 -
(2) Select [Trace] from the [View] menu and display the Trace window. Right-click the Trace window and select [Setup...] from the shortcut menu. Set 'Enable' for Status in the [Setup trace] dialog. Also set the buffer full break.
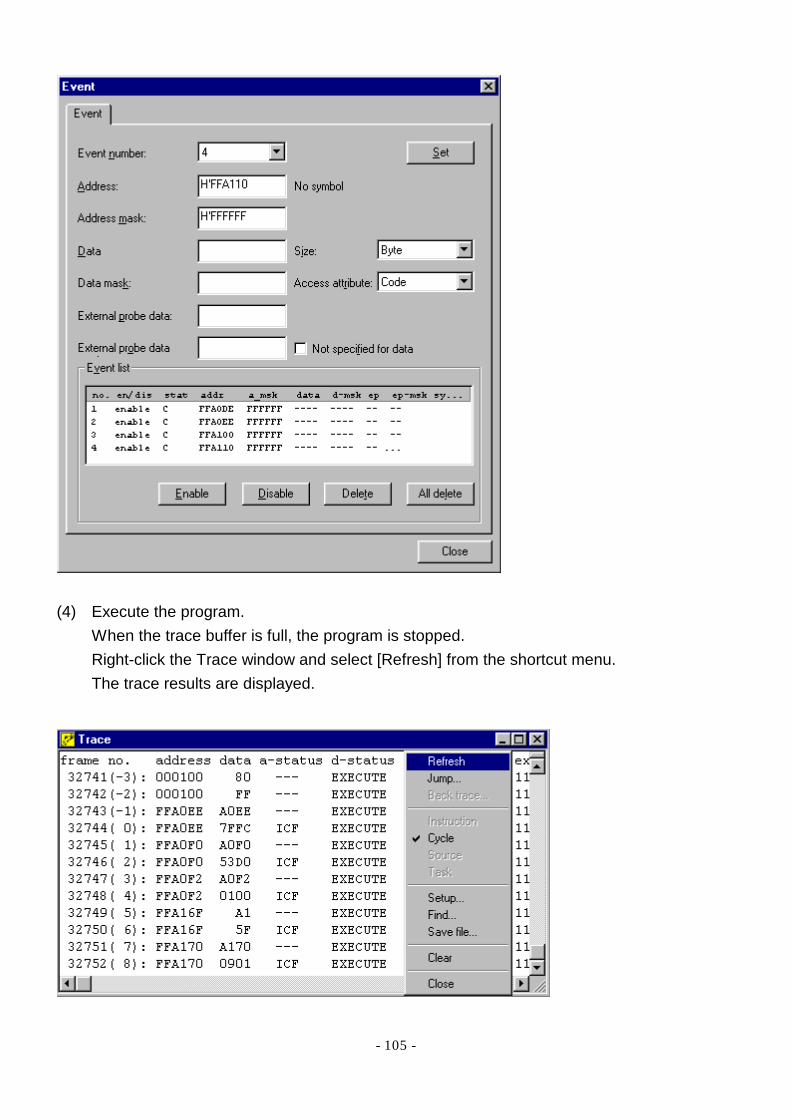
(3) Select [Event...] from the [Debug] menu and input the event.
- 105 -
(4) Execute the program.
When the trace buffer is full, the program is stopped. Right-click the Trace window and select [Refresh] from the shortcut menu. The trace results are displayed.
- 106 -
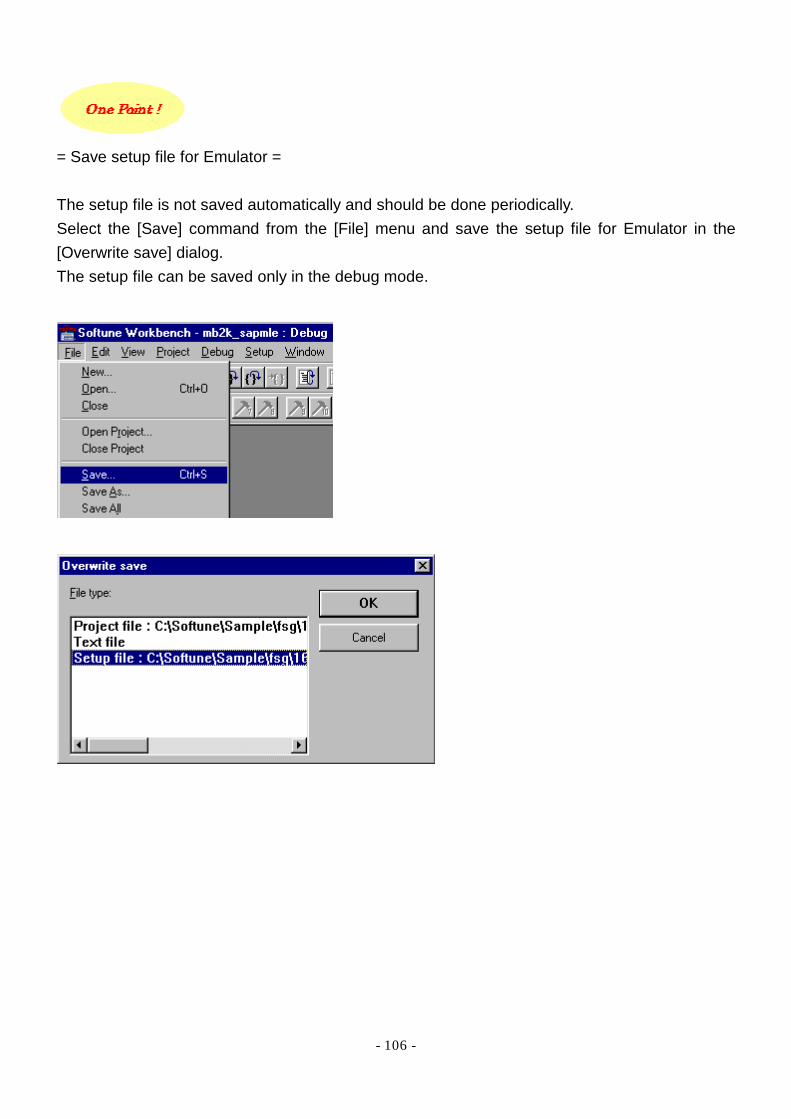
= Save setup file for Emulator = The setup file is not saved automatically and should be done periodically. Select the [Save] command from the [File] menu and save the setup file for Emulator in the [Overwrite save] dialog. The setup file can be saved only in the debug mode.

- 107 -
4.4 Use of Object Type Converter
Use of Object Type Converter The types of object type converters and the method for file creation are briefly explained. • 4.4.1 Types of Converters • 4.4.1 Types of Converters
- 108 -
4.4.1 Types of Converters
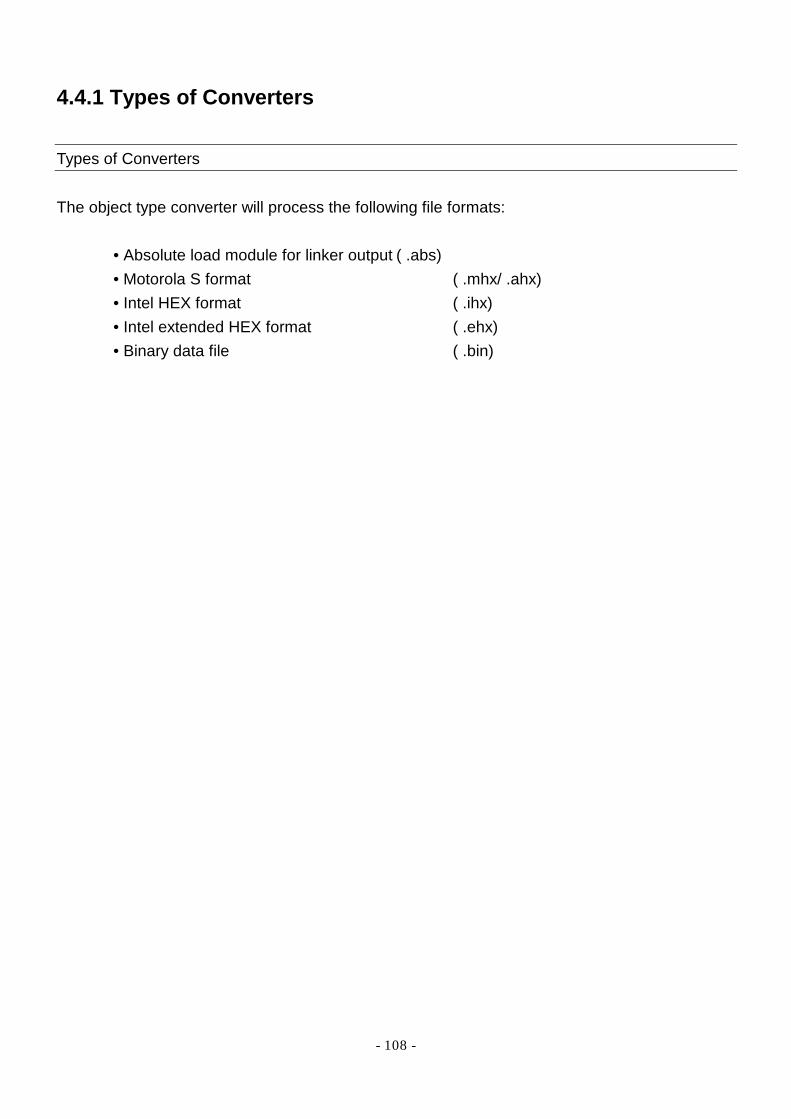
Types of Converters The object type converter will process the following file formats: • Absolute load module for linker output ( .abs) • Motorola S format ( .mhx/ .ahx) • Intel HEX format ( .ihx) • Intel extended HEX format ( .ehx) • Binary data file ( .bin)

- 109 -
4.4.2 Use of Object Type Converter
How to Use Converter In this sample, convert the created target file (mb2k_sample.abs) into a Motorola S format (mb2k_sample.mhx).
(1) Select [Setup] from the [Project] menu and mark the 'Absolute module converter is started'
checkbox in the [Make/Build] tab in the [Setup] dialog.
(2) Specify the conversion format.
Select [Setup Tool Option...] from the [Project] menu and set 'Motorola S Format' for Output Data Format in the [Converter] tab in the [Setup Tool Option] dialog.
- 110 -
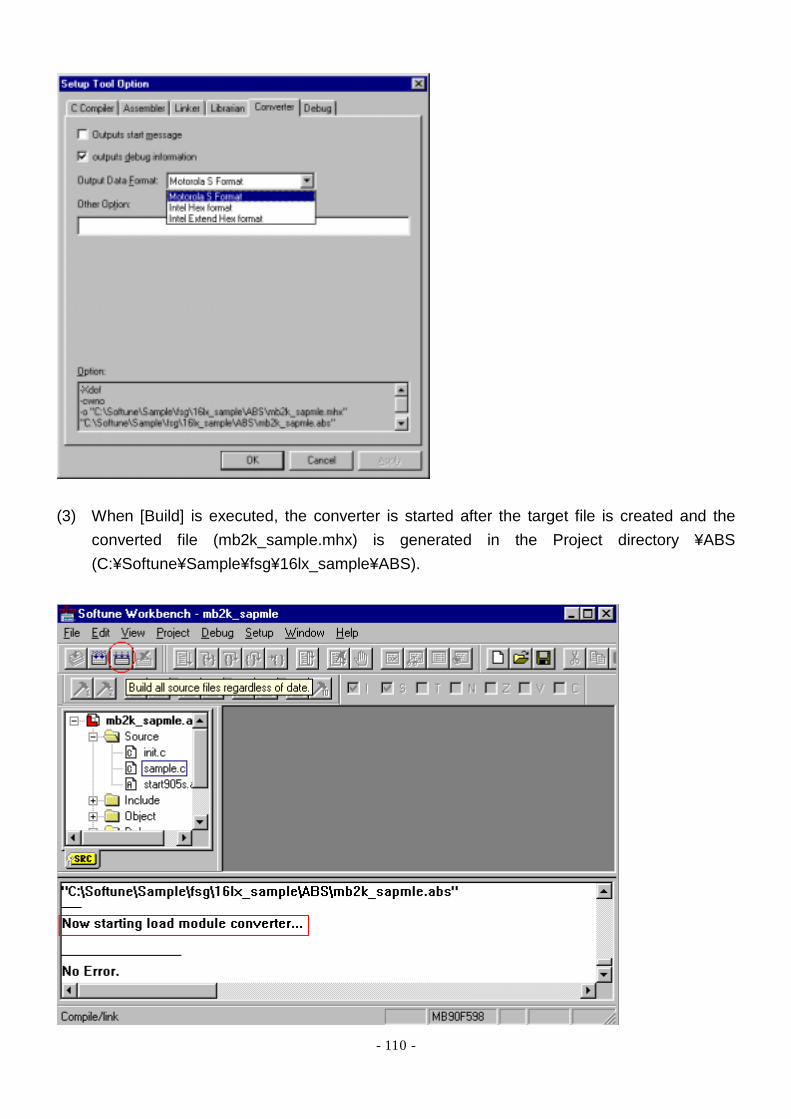
(3) When [Build] is executed, the converter is started after the target file is created and the
converted file (mb2k_sample.mhx) is generated in the Project directory ¥ABS (C:¥Softune¥Sample¥fsg¥16lx_sample¥ABS).
- 111 -
Chapter 5 Useful Functions • 5.1 Set External Tool • 5.2 Set External Editor • 5.3 Set Customize Bar • 5.4 Set Customize Build

- 112 -
5.1 Set External Tool Merit of Setting External Tool Entering various tool commands facilitates start of commands from the desktop of Softune Workbench. As a setting example, the object type converter (S format adjuster) is entered. As a usage example, the Motorola S format (mb2k_sample.mhx) created as described in Section 4.4.2 is converted.
= What is the S format adjuster? = The S format adjuster rearranges data created in Motorola S format in ascending address order and aligns the data count included in one record on a specified value. Use of the S format adjuster enables the formatted file to be created in Motorola S format as is. For details of the adjuster, refer to Softune help (Softune Linkage Kit - Part 4 Object Type Converter). Setting and Using External Tool
(1) Select [Tool...] from the [Setup] menu.
- 113 -
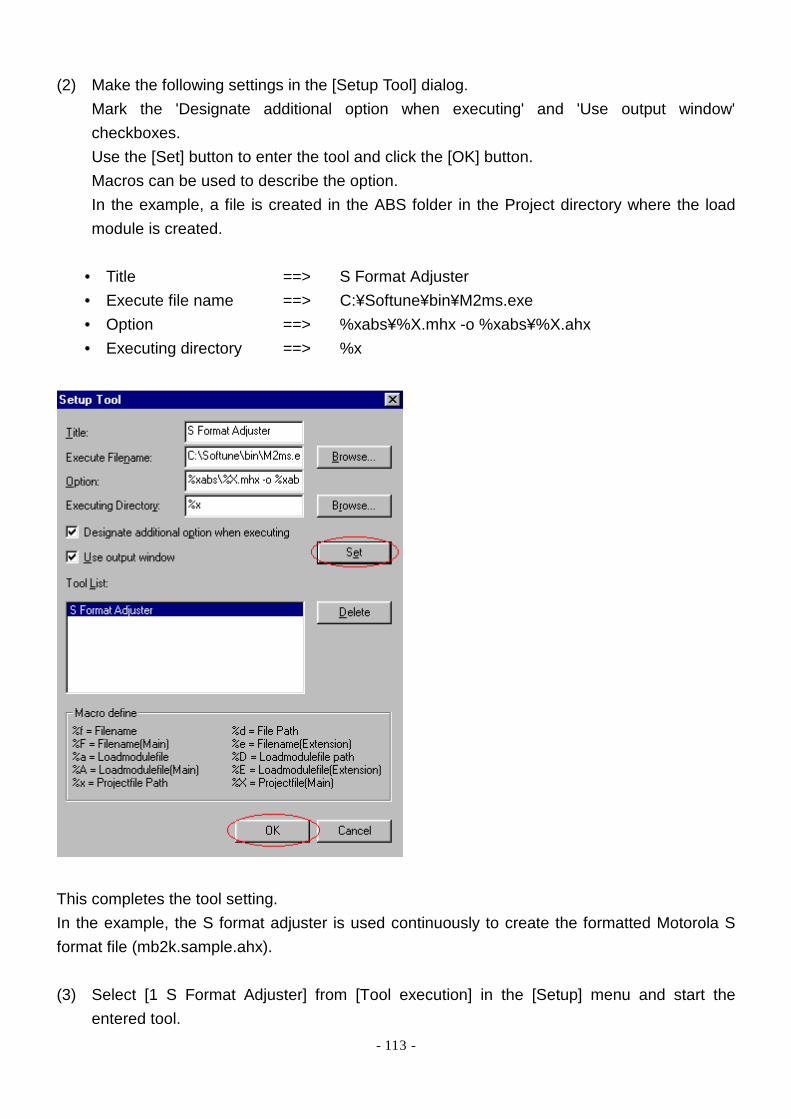
(2) Make the following settings in the [Setup Tool] dialog. Mark the 'Designate additional option when executing' and 'Use output window' checkboxes. Use the [Set] button to enter the tool and click the [OK] button. Macros can be used to describe the option. In the example, a file is created in the ABS folder in the Project directory where the load module is created.
• Title ==> S Format Adjuster • Execute file name ==> C:¥Softune¥bin¥M2ms.exe • Option ==> %xabs¥%X.mhx -o %xabs¥%X.ahx • Executing directory ==> %x
This completes the tool setting. In the example, the S format adjuster is used continuously to create the formatted Motorola S format file (mb2k.sample.ahx). (3) Select [1 S Format Adjuster] from [Tool execution] in the [Setup] menu and start the
entered tool.

- 114 -
(4) When the [Specify Other Parameter] dialog is opened, specify the parameters.
Space must be given when specifying the parameters.
The following items are specified as parameters:
• Output range (-ran = range) • Output record (-S1/-S2/-S3)
= Output range (-ran) = Specify the ROM area of the load module. To check whether the ROM area is specified, select [Setup Tool Option...] from the [Project] menu and choose Disposition/Connection in the [Linker] tab.

- 115 -
= Output record (-S1/-S2/-S3) = The output record depends on the ROM range. In the sample, the ROM area ranges from 0xFF0000 to 0xFFFFFF and '-S2' is specified.
(5) The S format adjuster is started to create the formatted Motorola S format file
(C:¥Softune¥Sample¥fsg¥16lx_sample¥ABS¥mb2k_sample.ahx).

- 116 -
5.2 Set External Editor
Merit of External Editor Any editor can be used instead of the external editor. It is also possible to start the source file entered in the Project and cause an error jump. An example of setting WZ Editor V4.0 is given. Procedure for Setting External Editor
(1) Select [Editor...] from the [Setup] menu.
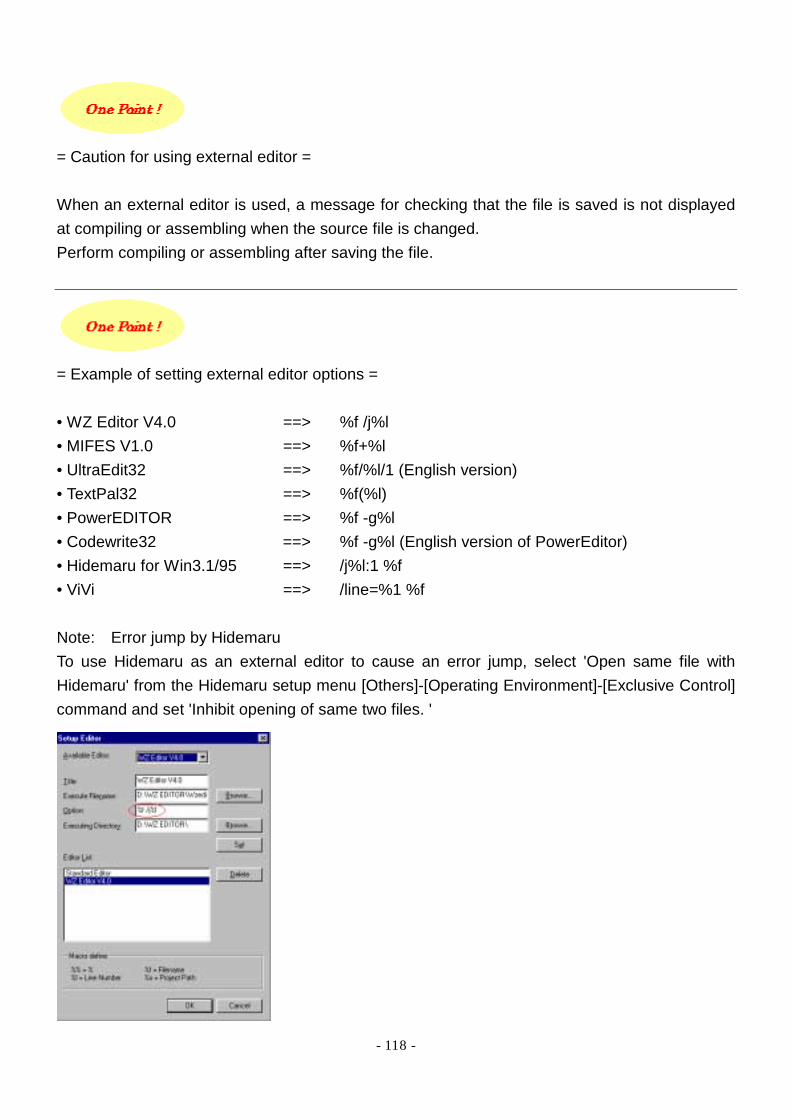
(2) Make the following settings in the [Setup Editor] dialog.
• Title ==> WZ Editor V4.0 • Execute file name ==> C:¥Program Files¥WZ EDITOR¥Wzeditor.exe • Option ==> %f /j%l • Executing directory ==> C:¥Program Files¥WZ EDITOR¥

- 117 -
(3) Click the [Set] button to enter the editor in [Editor List].
(4) Select WZ Editor V4.0 for Available Editor and click the [OK] button.
- 118 -
= Caution for using external editor = When an external editor is used, a message for checking that the file is saved is not displayed at compiling or assembling when the source file is changed. Perform compiling or assembling after saving the file.
= Example of setting external editor options = • WZ Editor V4.0 ==> %f /j%l • MIFES V1.0 ==> %f+%l • UltraEdit32 ==> %f/%l/1 (English version) • TextPal32 ==> %f(%l) • PowerEDITOR ==> %f -g%l • Codewrite32 ==> %f -g%l (English version of PowerEditor) • Hidemaru for Win3.1/95 ==> /j%l:1 %f • ViVi ==> /line=%1 %f Note: Error jump by Hidemaru To use Hidemaru as an external editor to cause an error jump, select 'Open same file with Hidemaru' from the Hidemaru setup menu [Others]-[Operating Environment]-[Exclusive Control] command and set 'Inhibit opening of same two files. '
- 119 -
5.3 Set Customize Bar
Merit of Setting Customize Bar Setting the Customize bar enables any batch file to be executed at the touch of a button. The customize bar must be installed together with FFMC-16 Family Softune V3 Professional Pack. The method for entering any batch file is explained as an example. Up to ten customize bars can be entered.
Procedure for Setting Customize Bar
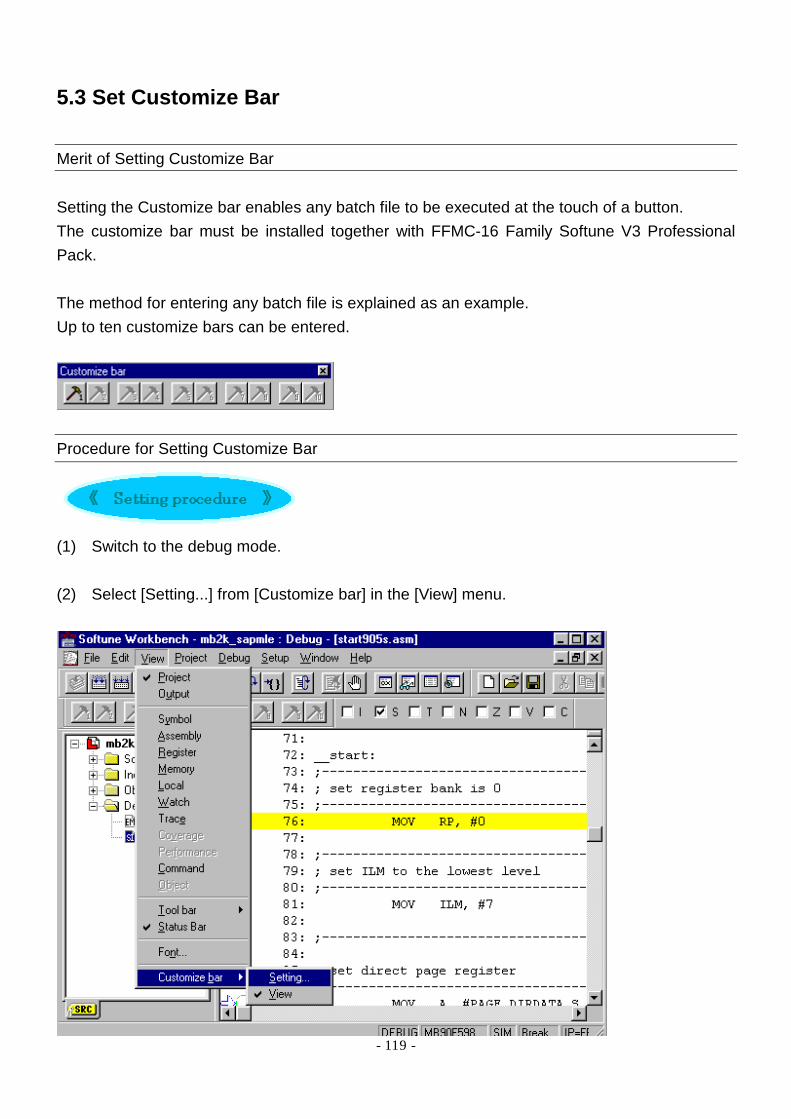
(1) Switch to the debug mode. (2) Select [Setting...] from [Customize bar] in the [View] menu.
- 120 -
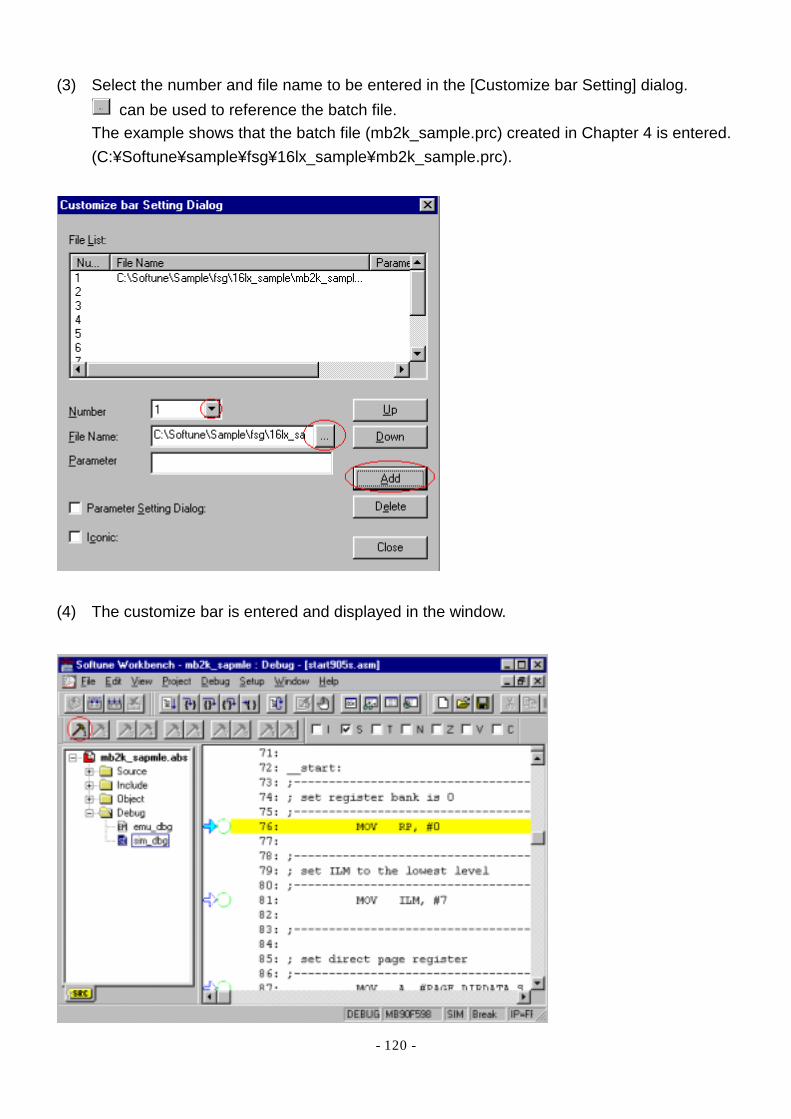
(3) Select the number and file name to be entered in the [Customize bar Setting] dialog. can be used to reference the batch file.
The example shows that the batch file (mb2k_sample.prc) created in Chapter 4 is entered. (C:¥Softune¥sample¥fsg¥16lx_sample¥mb2k_sample.prc).
(4) The customize bar is entered and displayed in the window.
- 121 -
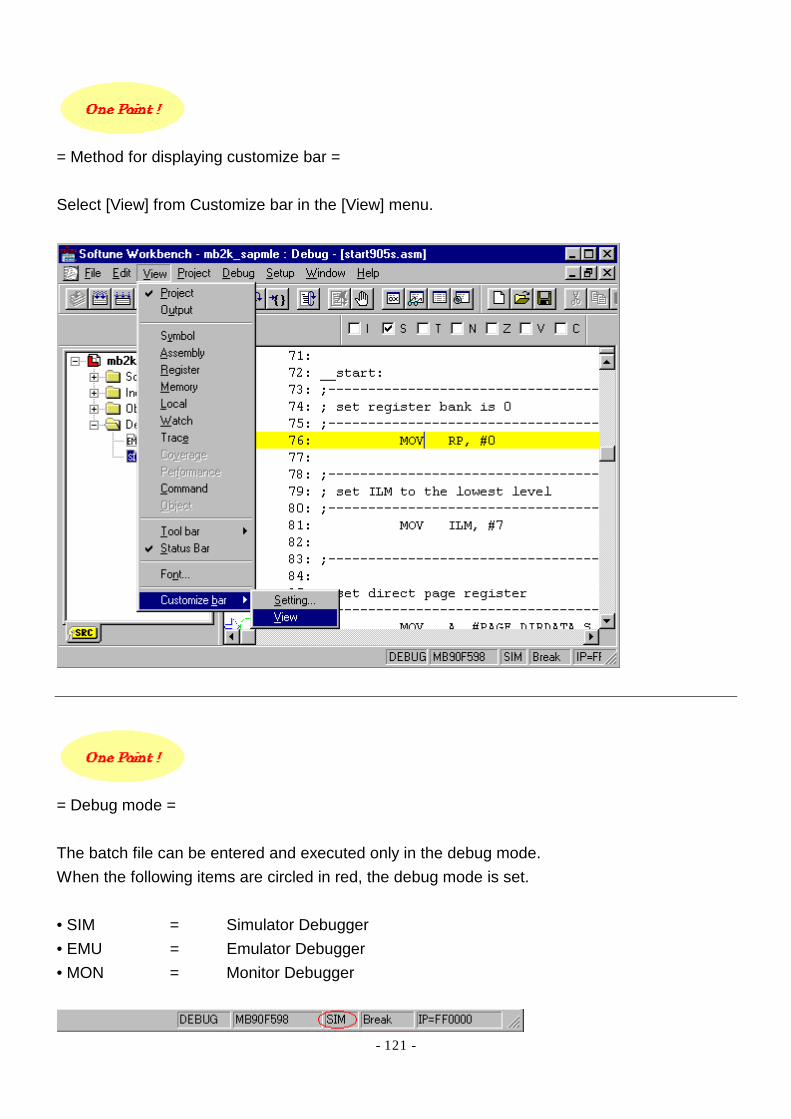
= Method for displaying customize bar = Select [View] from Customize bar in the [View] menu.
= Debug mode = The batch file can be entered and executed only in the debug mode. When the following items are circled in red, the debug mode is set. • SIM = Simulator Debugger • EMU = Emulator Debugger • MON = Monitor Debugger
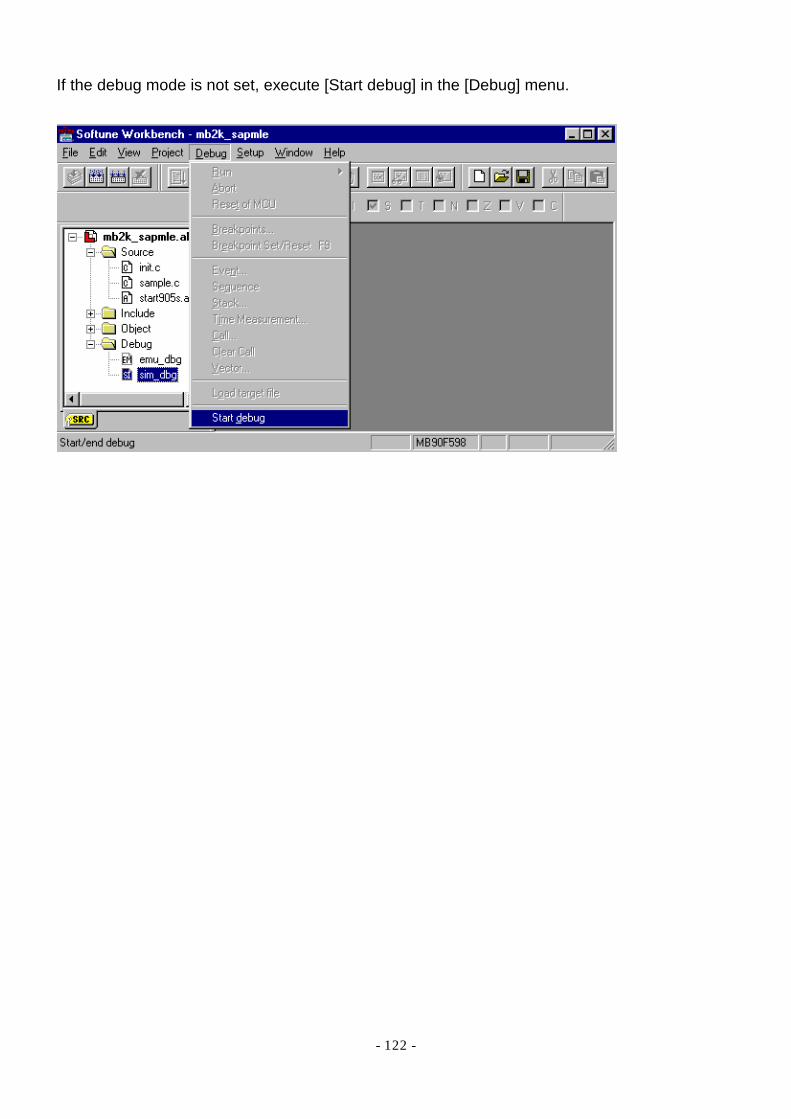
- 122 -
If the debug mode is not set, execute [Start debug] in the [Debug] menu.
- 123 -
5.4 Set Customize Build
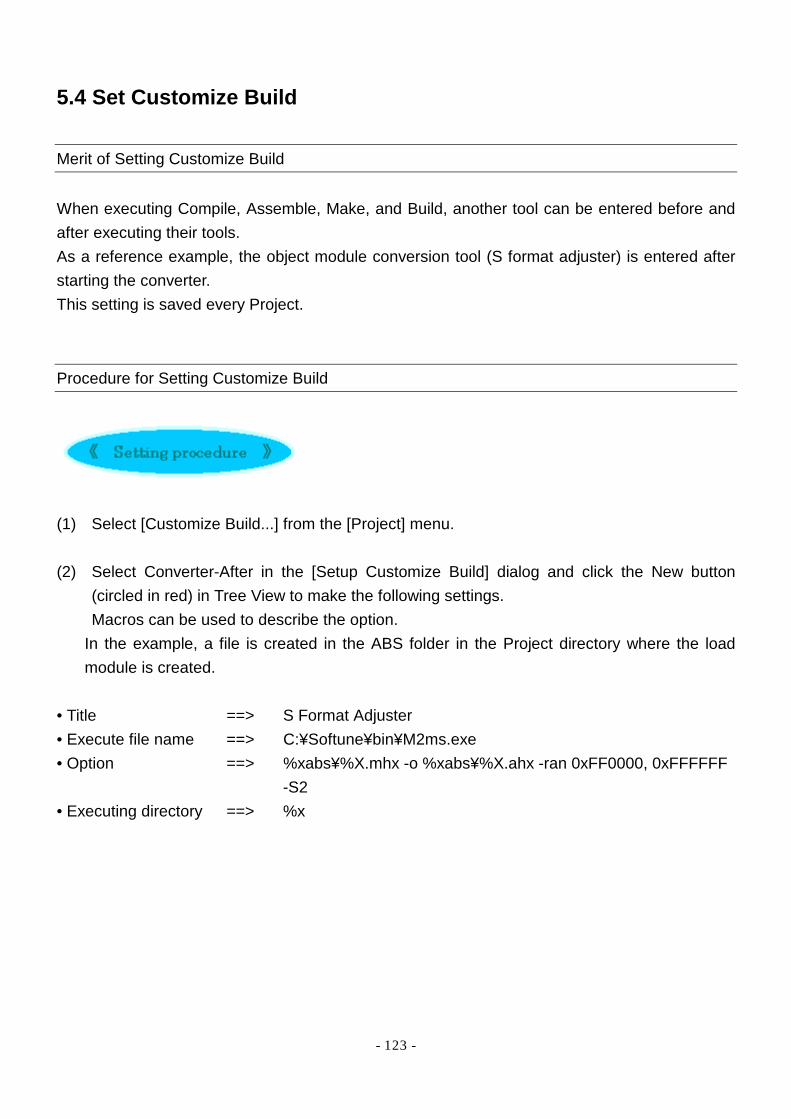
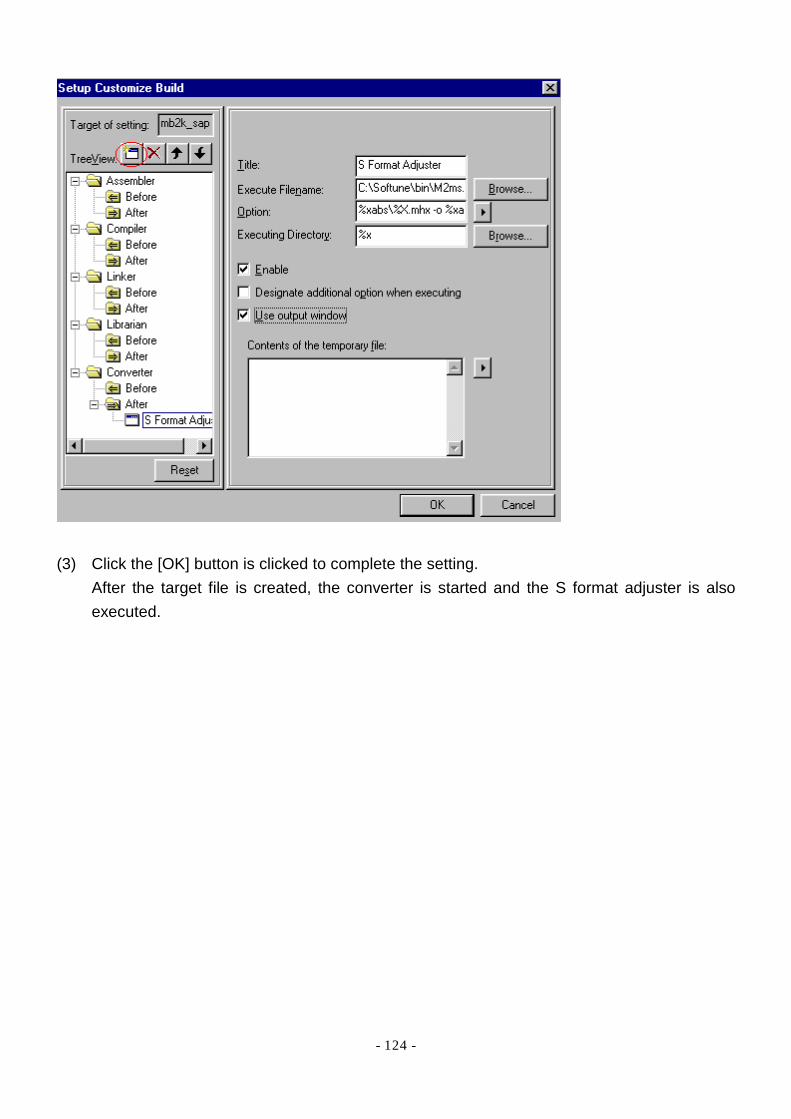
Merit of Setting Customize Build When executing Compile, Assemble, Make, and Build, another tool can be entered before and after executing their tools. As a reference example, the object module conversion tool (S format adjuster) is entered after starting the converter. This setting is saved every Project. Procedure for Setting Customize Build
(1) Select [Customize Build...] from the [Project] menu. (2) Select Converter-After in the [Setup Customize Build] dialog and click the New button
(circled in red) in Tree View to make the following settings. Macros can be used to describe the option.
In the example, a file is created in the ABS folder in the Project directory where the load module is created.
• Title ==> S Format Adjuster • Execute file name ==> C:¥Softune¥bin¥M2ms.exe • Option ==> %xabs¥%X.mhx -o %xabs¥%X.ahx -ran 0xFF0000, 0xFFFFFF
-S2 • Executing directory ==> %x
- 124 -
(3) Click the [OK] button is clicked to complete the setting.
After the target file is created, the converter is started and the S format adjuster is also executed.

- 125 -
Chapter 6 Using C Checker • 6.1 Function and Features of C Checker • 6.2 Using C Checker

- 126 -
6.1 Function and Feature of C Checker
Function of C Checker C Checker indicates where the quality and performance of a C source program should be improved and provides a useful diagnosis message. Features of C Checker C Checker is useful for C-language users at all levels of expertise. It is effective for:
• Eliminating coding errors early
• High-quality coding even beginners for C
• High-performance coding
• Time-saving program review
• Porting software from other CPUs to Fujitsu CPUs
• Understanding features of the Fujitsu C Compiler
- 127 -
6.2 Using C Checker
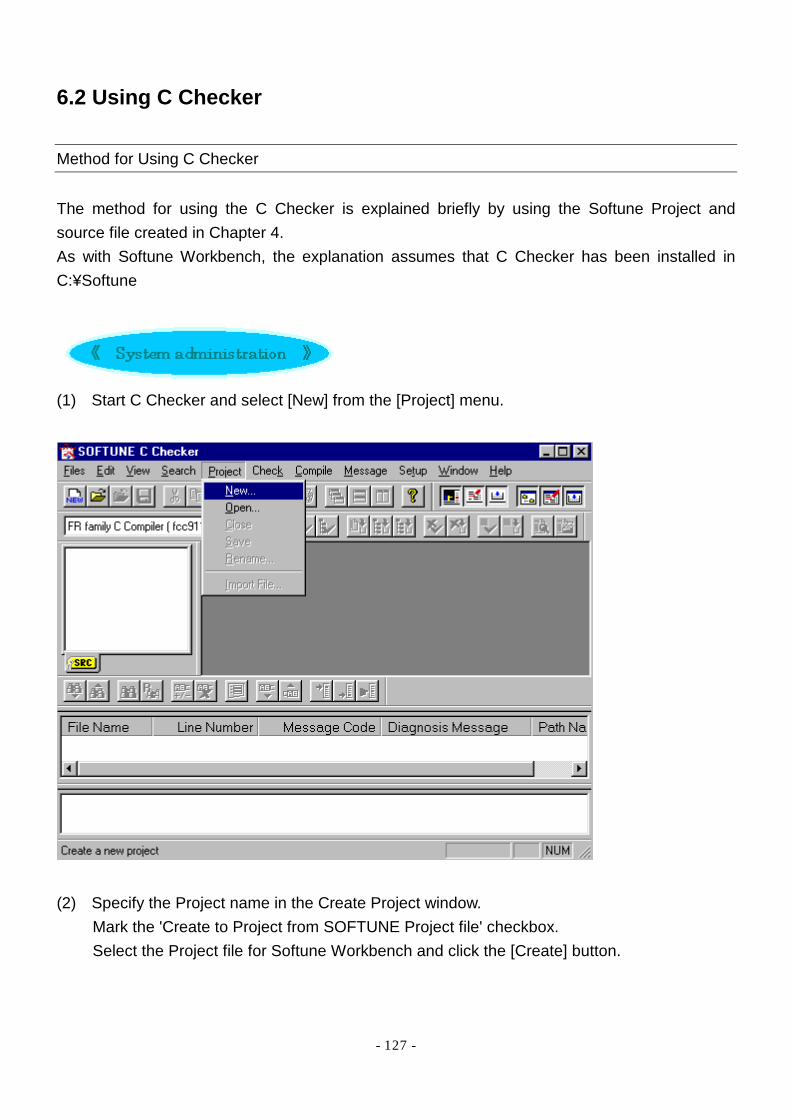
Method for Using C Checker The method for using the C Checker is explained briefly by using the Softune Project and source file created in Chapter 4. As with Softune Workbench, the explanation assumes that C Checker has been installed in C:¥Softune
(1) Start C Checker and select [New] from the [Project] menu.
(2) Specify the Project name in the Create Project window.
Mark the 'Create to Project from SOFTUNE Project file' checkbox. Select the Project file for Softune Workbench and click the [Create] button.
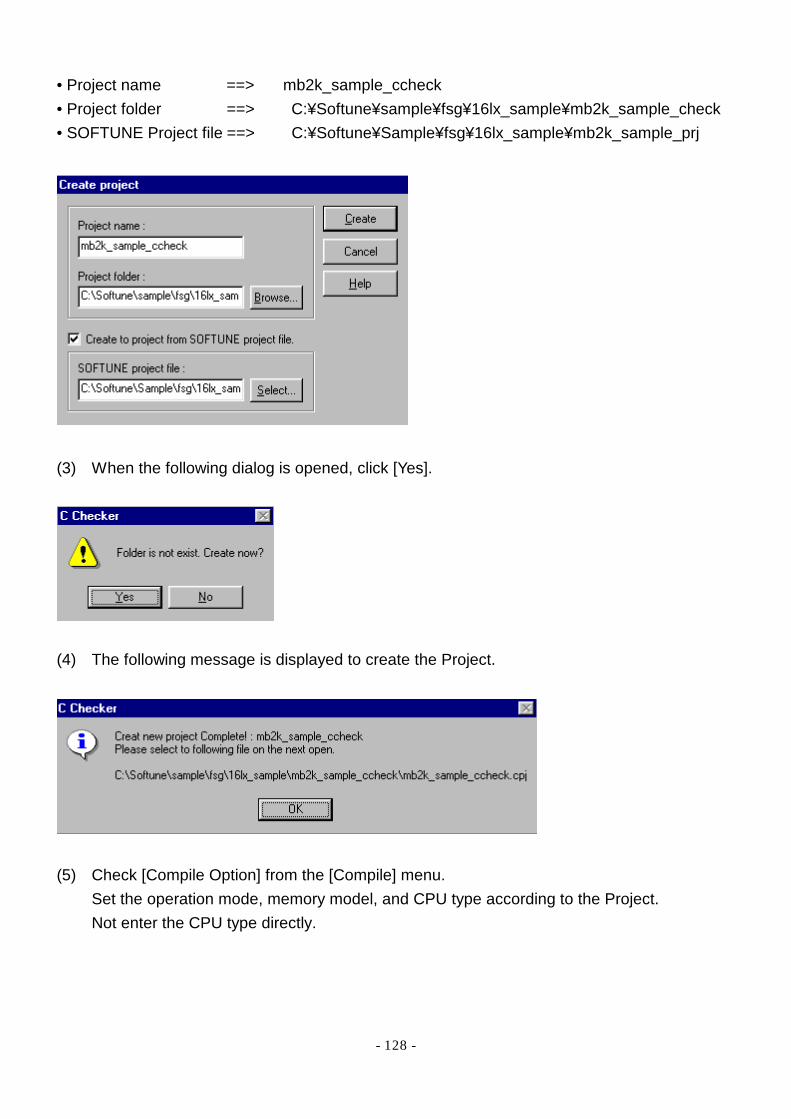
- 128 -
• Project name ==> mb2k_sample_ccheck • Project folder ==> C:¥Softune¥sample¥fsg¥16lx_sample¥mb2k_sample_check • SOFTUNE Project file ==> C:¥Softune¥Sample¥fsg¥16lx_sample¥mb2k_sample_prj
(3) When the following dialog is opened, click [Yes].
(4) The following message is displayed to create the Project.
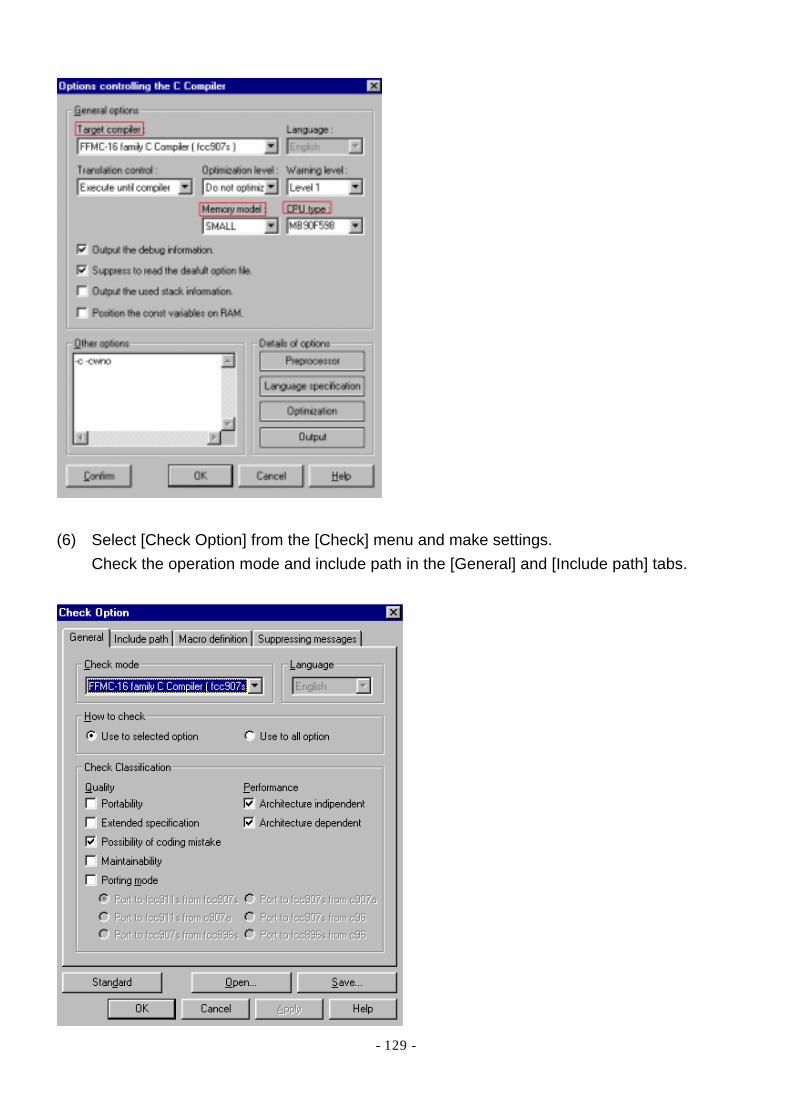
(5) Check [Compile Option] from the [Compile] menu.
Set the operation mode, memory model, and CPU type according to the Project. Not enter the CPU type directly.
- 129 -
(6) Select [Check Option] from the [Check] menu and make settings.
Check the operation mode and include path in the [General] and [Include path] tabs.
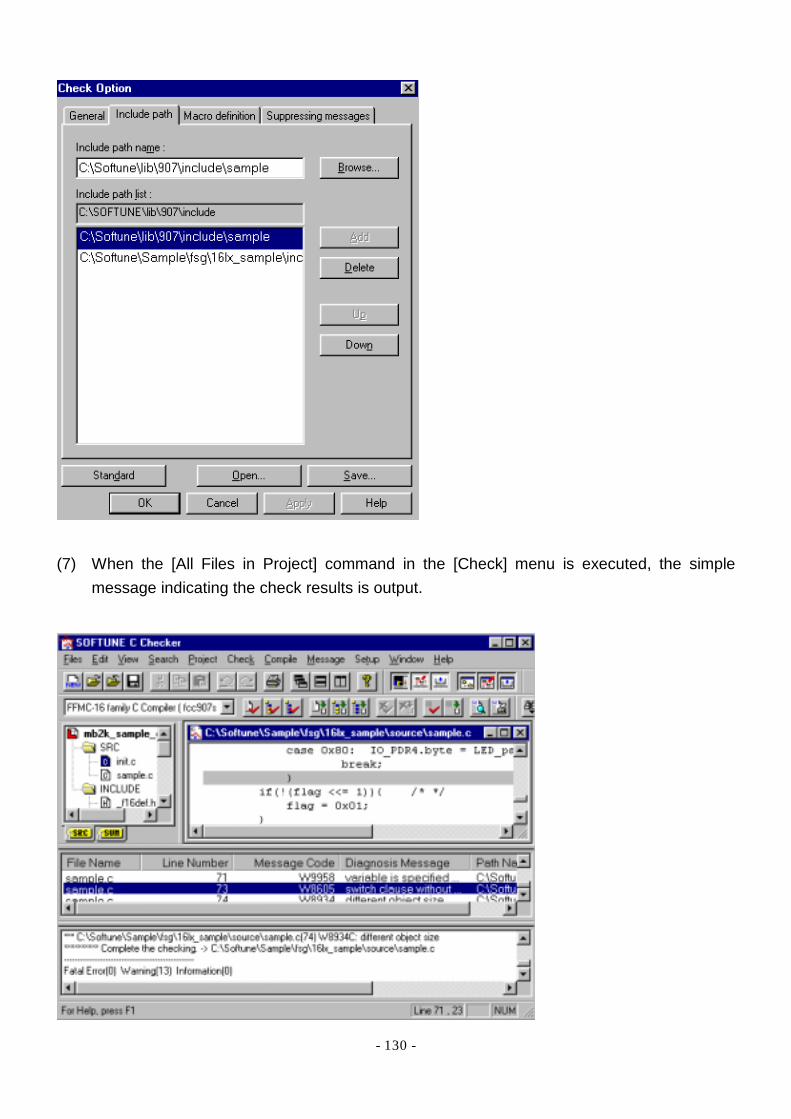
- 130 -
(7) When the [All Files in Project] command in the [Check] menu is executed, the simple
message indicating the check results is output.
- 131 -
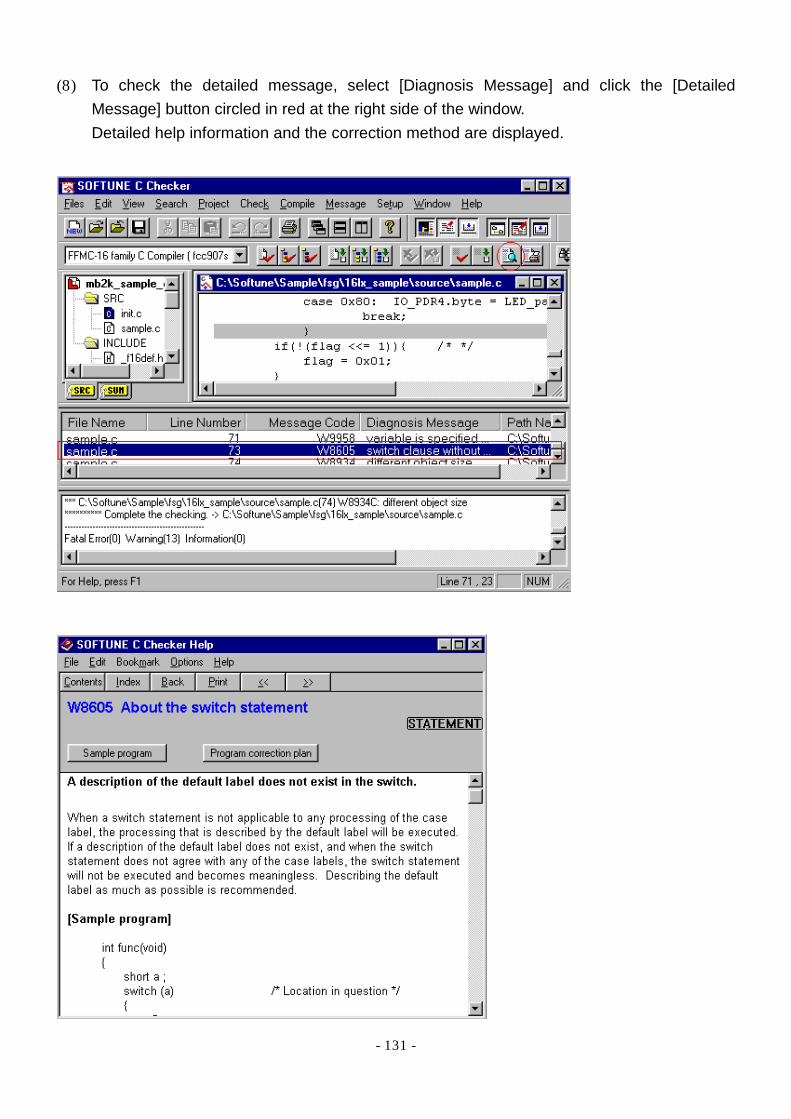
(8) To check the detailed message, select [Diagnosis Message] and click the [Detailed Message] button circled in red at the right side of the window. Detailed help information and the correction method are displayed.

- 132 -
Chapter 7 Using C Analyzer • 7.1 Function and Features of C Analyzer • 7.2 Using C Analyzer
- 133 -
7.1 Function and Feature of C Analyzer
Function of C Analyzer C Analyzer displays and prints the structure and data usage of a C source program. Features of C Analyzer C Analyzer meets the following needs of C users of all levels of expertise.
• Checking structure and processing description of program with unknown internalprocessing due to absence of the developer who created the program or missing documentation
• Creating structural program while grasping structure and processing logic at development • Checking effect of program correction • Preparing program documents
- 134 -
7.2 Using C Analyzer
Procedure for Using C Analyzer The method for using C Analyzer is explained briefly using the Softune project and source file created in Chapter 4. As with Softune Workbench, the explanation assumes that C Analyzer has been installed in C:¥Softune.
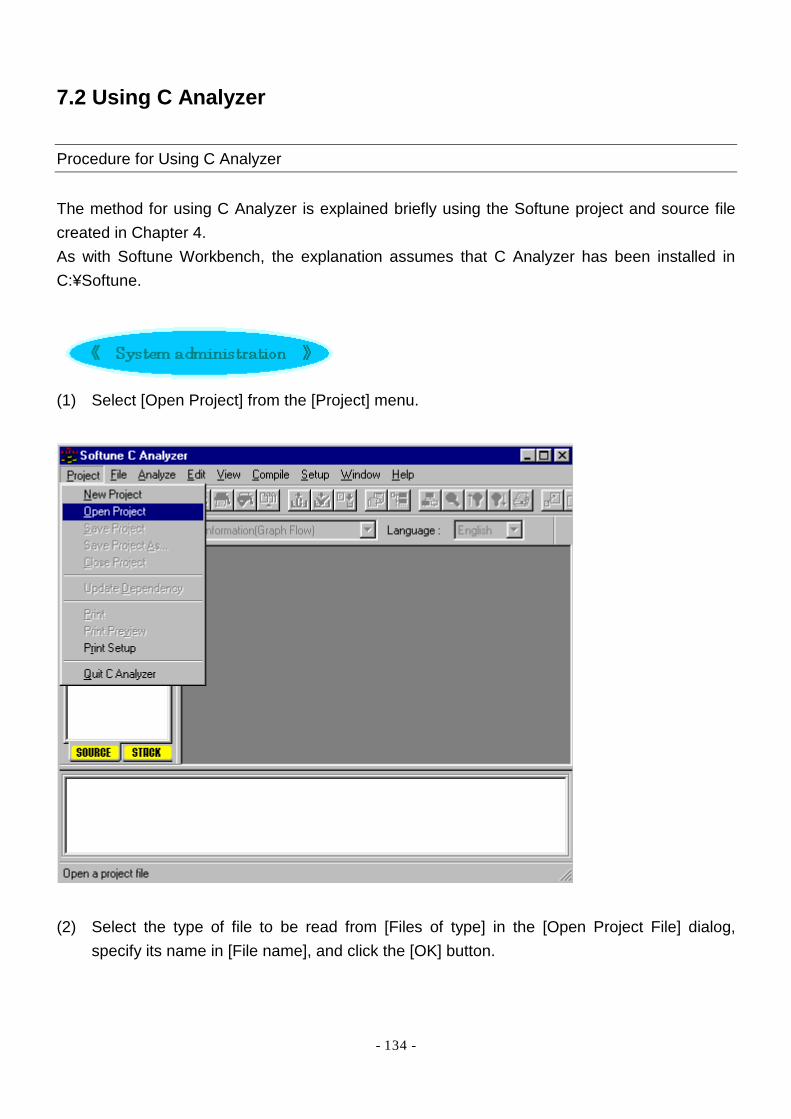
(1) Select [Open Project] from the [Project] menu.
(2) Select the type of file to be read from [Files of type] in the [Open Project File] dialog,
specify its name in [File name], and click the [OK] button.

- 135 -
(3) The read project file is opened.
(4) Select [Compile Option] from the [Compile] menu.
Set the compiler type, CPU type, and memory model, according to the project. Enter the CPU type directly. To display the maximum stack path, put a check in the 'Output STACK information' checkbox. After setting, specify the include path in [Setup Processor].

- 136 -
(5) Select [Start Compiler] from the [Compile] menu and start the Compiler.

- 137 -
(6) Select [Analystic Option] from the [Analyze] menu and check the settings. To display the maximum stack path, put a check in the 'Call MUSC (Max Used Stack Calculator) ' checkbox.
(7) Select [Start Analysis] in the [Analyze] menu.
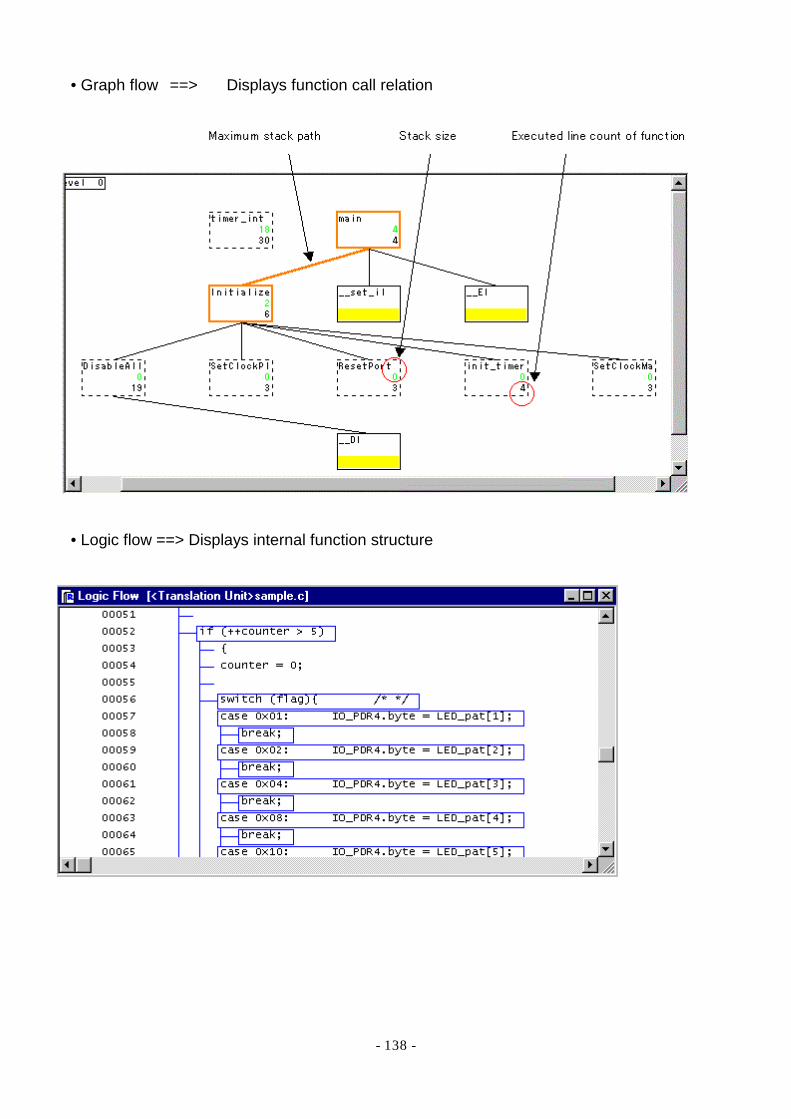
At completion of analysis, the graph flow chart shown below is displayed. Right-clicking the function displayed in the graph flow chart enables various analysis results to be selected from the shortcut menu.
- 138 -
• Graph flow ==> Displays function call relation
• Logic flow ==> Displays internal function structure

- 139 -
• Cross-reference information ==> Displays data usage for each function
• Call tree ==> Displays function call relation as list data structure
• Global information ==> Displays usage of global variables and variables to be const type qualified
- 140 -
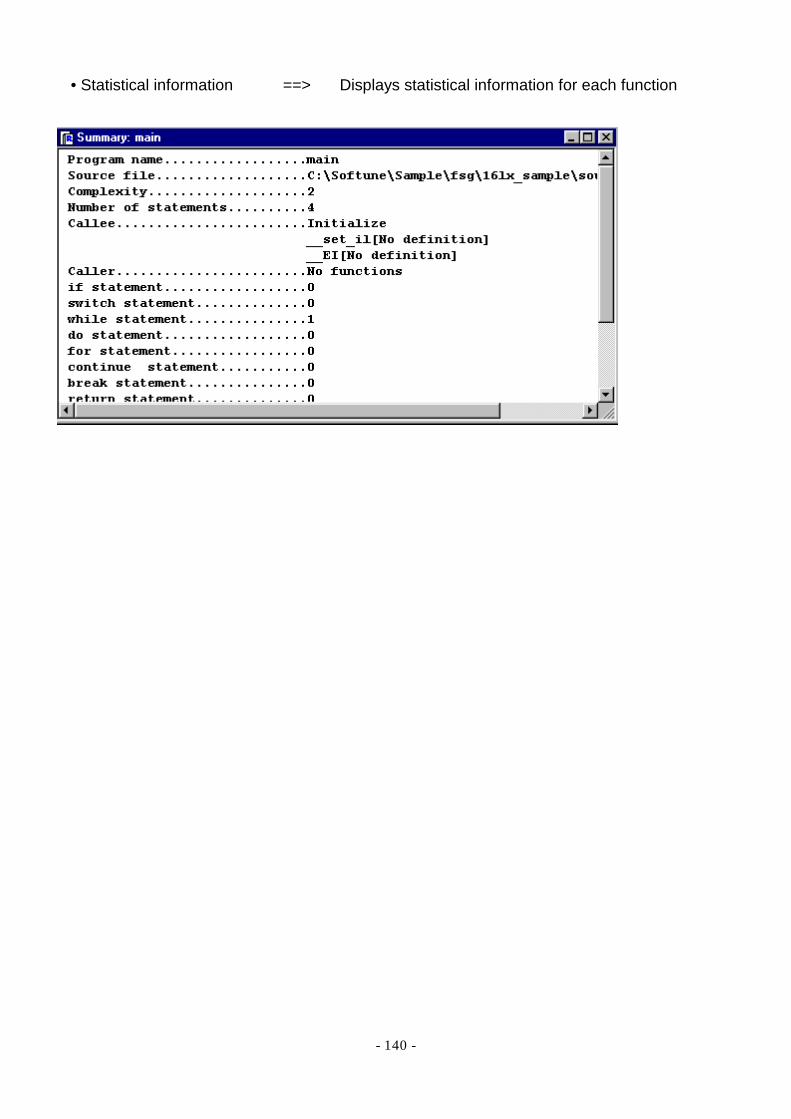
• Statistical information ==> Displays statistical information for each function
- 141 -
Chapter 8 Program Development using REALOS Using the sample Project attached to Softune REALOS, this chapter briefly outlines Softune REALOS and the program development features, as well as the Project creation, the Debugger and the REALOS Analyzer functions and usage method. • 8.1 Outline • 8.2 Install • 8.3 Features of Program Development using Softune REALOS • 8.4 Functions of REALOS Analyzer and Usage Method

- 142 -
8.1 Outline
Outline Softune Workbench alone does not have the REALOS support function. Additional installation of Softune REALOS automatically expands the Softune Workbench functions to use the REALOS support function. It also enables REALOS Analyzer to display the state transition and stack usage of each task visually. • 8.1.1 Features of Softune REALOS • 8.1.2 Features of REALOS Analyzer
- 143 -
8.1.1 Features of Softune REALOS
This section describes the features of Softune REALOS as used with Softune Workbench. Configurator A Softune Workbench project can be created with configuration information. Setting required items according to instructions from the GUI window facilitates the setting of kernel configuration information. Multi-task Debug Function The following debug functions that are required when building the system using REALOS are supported.
• State display of object • Issuing of system call • Task trace function • System call break • Task dispatch break
REALOS Analyzer The performance of the system in which REALOS is installed and the state transition of each task are displayed graphically. This provides a visual image of the system operation.
- 144 -
8.1.2 Features of REALOS Analyzer
Task Transition Diagram The task transition diagram of REALOS Analyzer provides a time-stamped check of task transition at the expected design timing and sequence. Graphical Display The task trace function of REALOS Analyzer provides a graphical check of waste in each object and the task used. Object Listing The object listing function of REALOS Analyzer provides a list of the states of each object. The current states of each object are listed when the debugger is stopped. Stack Usage Analysis The stack usage and stack area of each task can be analyzed. The stack usage analysis function of REALOS Analyzer provides a check on whether the stack usage of each task falls within the expected range. Monitoring The monitoring function of REALOS Analyzer enables monitoring of the status and stack usage of each executing task.

- 145 -
8.2 Installing
Procedure This section explains the procedure for installing FFMC-16 Family Softune REALOS/907 BASIC.
(1) Insert the CD-ROM into the drive. (2) Execute setup.exe to open the Setup menu.
(3) Specify the install directory.
- 146 -
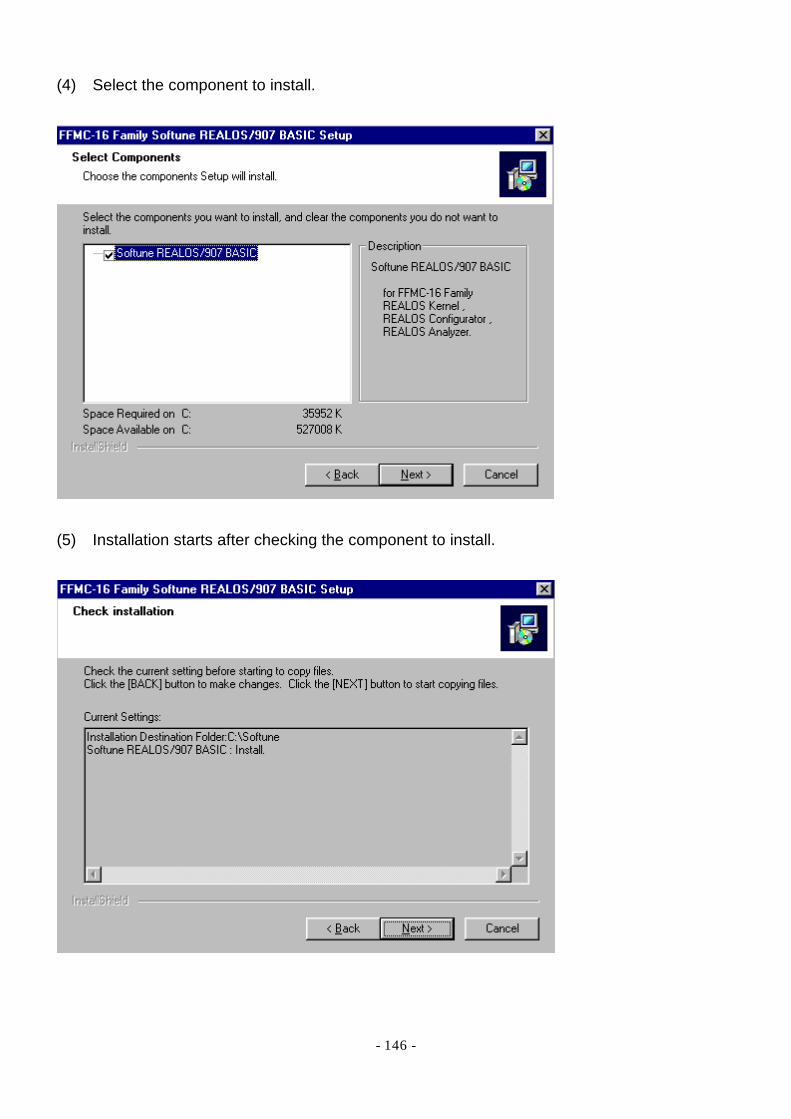
(4) Select the component to install.
(5) Installation starts after checking the component to install.
- 147 -
8.3 Features of Program Development using Softune REALOS
Outline This section explains the features, such as Configurator setting, supported only for program development using Softune REALOS. Section 8.3.2 and later explains the debug function. To check each dialog or window, it is necessary to set the debug mode by selecting [Start debug] from the [Debug] menu for Softune Workbench. • 8.3.1 Set Configurator • 8.3.2 Display Object Status • 8.3.3 Issue System Call • 8.3.4 Task Trace • 8.3.5 Task Dispatch Break • 8.3.6 System Call Break
- 148 -
8.3.1 Set Configurator
Create Project with Configuration Information Softune REALOS can be installed to create a Softune Workbench with configuration information. Setting required items according to instructions from the GUI window facilitates the setting of kernel configuration information. The procedure for creating the target file excluding the setting of configuration information is the same as when as the OS is not used. Refer to the procedure created in Chapter 4.
(1) Start Softune Workbench and execute the [New] command in the [File] menu.
Select REALOS(ABS) in [Project Type] in the [Create New Project] dialog and set the project.
(2) Click the [OK] button to open the [Create Configuration File] dialog. Set according to the
window instructions. Do not use two-byte characters for the file name and directory name specified in Configurator. For details of the settings, see the Configurator Help.
• CPU Setting
- 149 -
• System definition • Memory definition • Task definition • Semaphore definition • Event flag definition • Mailbox definition • Memory pool definition • Vector definition • Debug setting
(3) When configuration information is set, the project for Softune Workbench in which the
configuration file (project name.rcf) is added to the member is created. (4) Double-click 'project name.rcf' in the Project window to open the [Set Configuration File]
dialog for adding, deleting, and changing settings.

- 150 -
- 151 -
8.3.2 Display Object Status
The debug mode adds the REALOS Project window to provide a hierarchical display of initial information on each object set in the Configurator. When the window is right-clicked after selecting the object, the shortcut menu is displayed, enabling a jump to the source line, setting breaks, and checking the data size of each object.
- 152 -
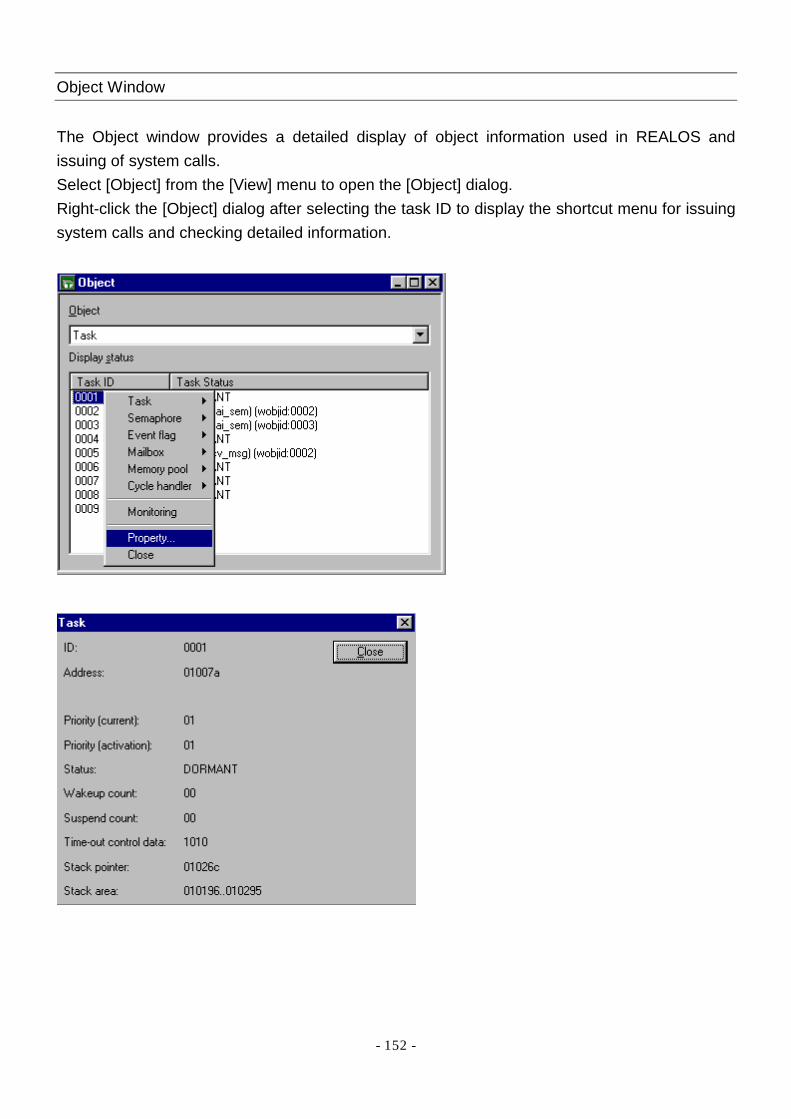
Object Window The Object window provides a detailed display of object information used in REALOS and issuing of system calls. Select [Object] from the [View] menu to open the [Object] dialog. Right-click the [Object] dialog after selecting the task ID to display the shortcut menu for issuing system calls and checking detailed information.

- 153 -
8.3.3 Issue System Call
Issue System Call This function issues a system call when the Debugger is stopped. It enables a task state to be changed to another state. This function is available in all Debugger types. Select [Object] from the [View] menu to open the [Object] dialog where settings can be made. Right-click the Object window to open the shortcut menu. Select [Task]-[System Call] from the shortcut menu. Select the task ID in the [Issue system call] dialog. Supported system calls are calls that can be issued from the task independent section. For details, see Help (Section 4.4.1 of Softune Workbench Operation Manual).

- 154 -
8.3.4 Task Trace
Task Trace This function enables tracing of the events for dispatching tasks and issuing system calls. The FFMC-16 family Softune REALOS does not support this function. The following Trace window gives an example when using the FR Family Softune REALOS. Use of REALOS Analyzer causes the time-stamped trace function to be supported for either the FFMC-16 Family or FR Family Softune REALOS. For the REALOS Analyzer trace function, see Section 8.4.2 Display Task Transition Diagram.
- 155 -
8.3.5 Task Dispatch Break
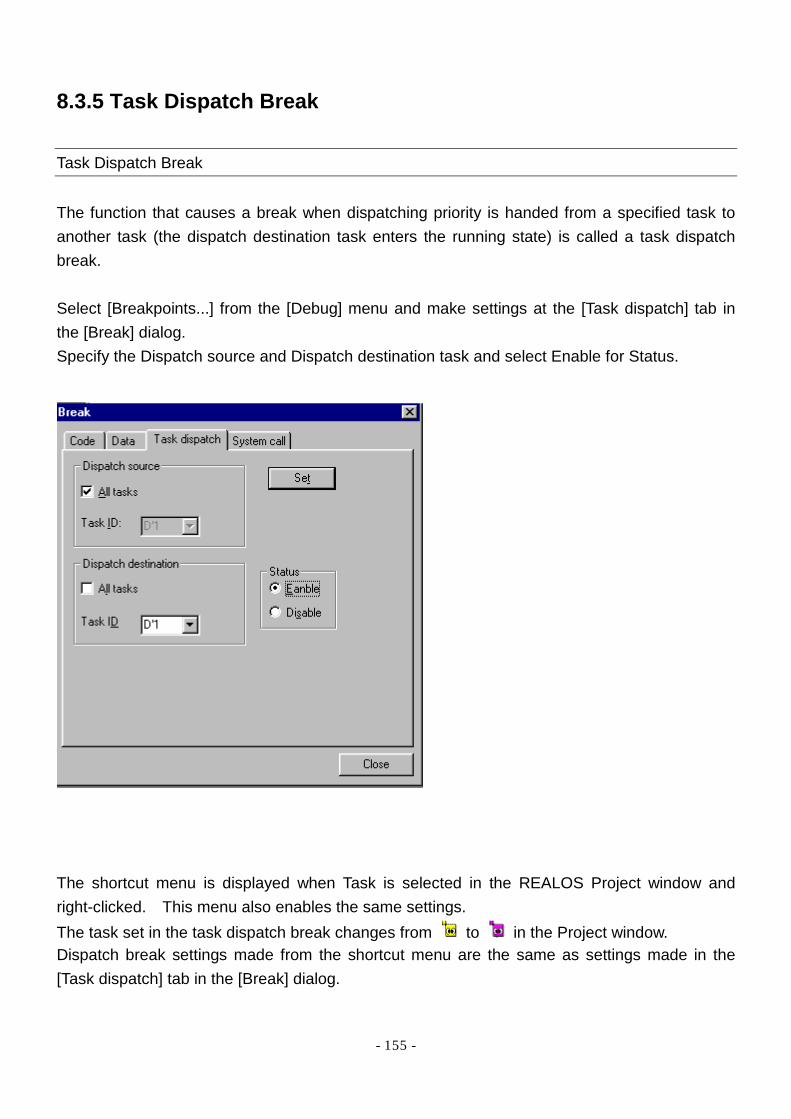
Task Dispatch Break The function that causes a break when dispatching priority is handed from a specified task to another task (the dispatch destination task enters the running state) is called a task dispatch break. Select [Breakpoints...] from the [Debug] menu and make settings at the [Task dispatch] tab in the [Break] dialog. Specify the Dispatch source and Dispatch destination task and select Enable for Status.
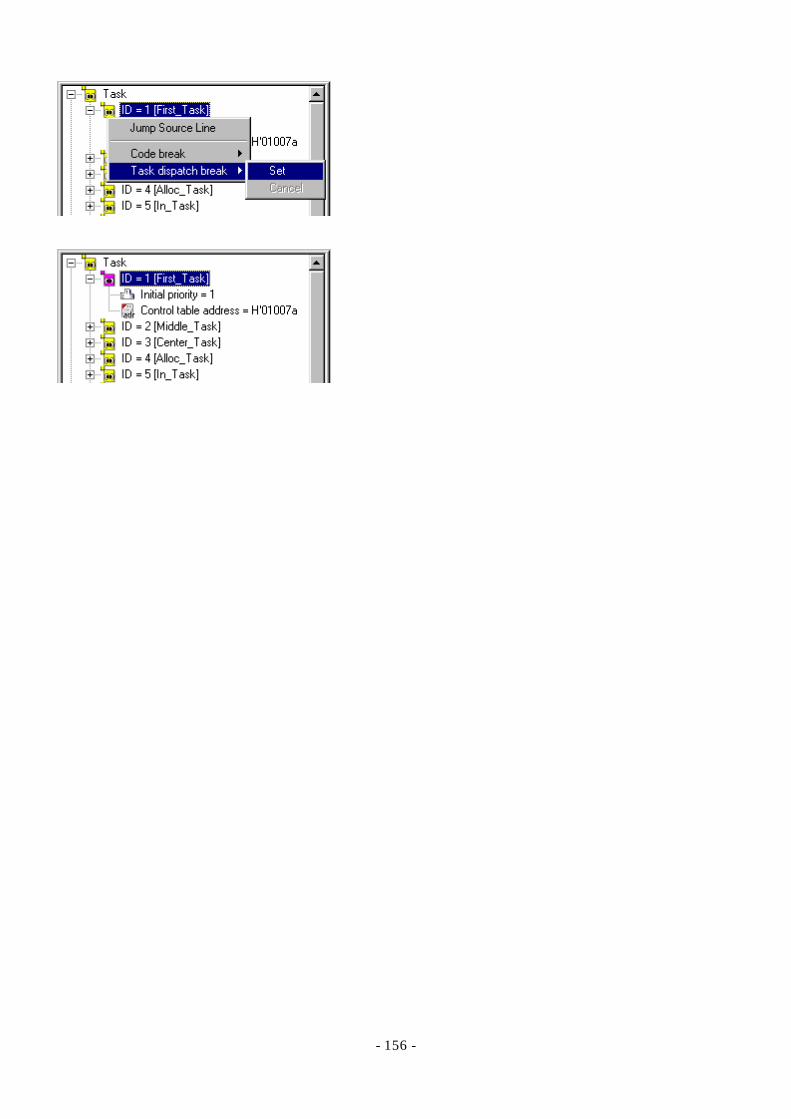
The shortcut menu is displayed when Task is selected in the REALOS Project window and right-clicked. This menu also enables the same settings. The task set in the task dispatch break changes from to in the Project window. Dispatch break settings made from the shortcut menu are the same as settings made in the [Task dispatch] tab in the [Break] dialog.
- 156 -
- 157 -
8.3.6 System Call Break
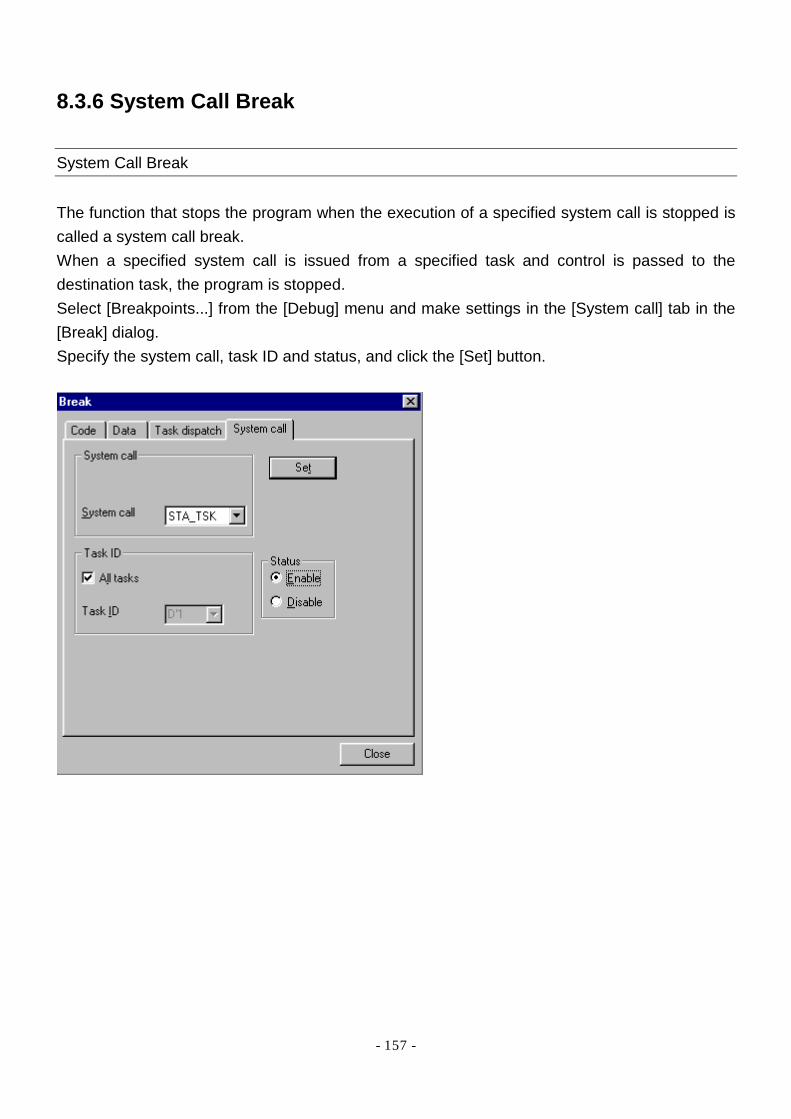
System Call Break The function that stops the program when the execution of a specified system call is stopped is called a system call break. When a specified system call is issued from a specified task and control is passed to the destination task, the program is stopped. Select [Breakpoints...] from the [Debug] menu and make settings in the [System call] tab in the [Break] dialog. Specify the system call, task ID and status, and click the [Set] button.

- 158 -
8.4 Functions of REALOS Analyzer and Usage Method
Outline This section briefly explains the functions of REALOS Analyzer and the usage method, using the sample project for the FFMC-16 Family. • 8.4.1 Start REALOS Analyzer • 8.4.2 Display Task Transition Diagram • 8.4.3 Graphical Display • 8.4.4 Object Listing • 8.4.5 Stack Usage Analysis • 8.4.6 Monitoring

- 159 -
8.4.1 Start REALOS Analyzer
Start REALOS Analyzer REALOS Analyzer can be started only when Softune Workbench is in the debug mode. It cannot be started by itself. The procedure for opening a sample project in Softune Workbench and starting REALOS Analyzer is explained. The explanation assumes that both Softune Workbench and Softune REALOS are installed in the same directory.
(1) Start Softune Workbench, select [Open Project...] from the [File] menu, and choose
¥sample¥907¥ra_sample¥ra_sample.prj for the Softune install directory.
(2) Choose the setup file in the Project window and select [Change...] from the shortcut menu.

- 160 -
(3) Change the settings as follows according to the Setup Wizard.
(4) Select [Start debug] from the [Debug] men to start debug.
The target file loads to switch to the debug mode. Check that the [REALOS] dialog is added to the Project window and that the 'The preparations for execution are completed. ' dialog is displayed in the Command window.

- 161 -
(5) Select [REALOS Analyzer]-[Start] from the [Project] menu.
REALOS Analyzer starts and display the task list.

- 162 -
8.4.2 Display Task Transition Diagram
Display Task Transition Diagram The REALOS Analyzer task transition diagram is updated when the program is executed or stopped. The program execution commands can be executed by either Softune Workbench or REALOS Analyzer. The REALOS Analyzer task transition diagram provides a time-stamped check of the task transition at the design timing and sequence.
(1) Use Softune Workbench to set a breakpoint at the beginning of almhdr1() of the source file
Set_hdr.c.
(2) Use the button circled in red to execute the program continuously.
When the program is stopped at the breakpoint set by Softune Workbench, the task transition diagram up to the beginning of almhdr() is displayed.

- 163 -
= Details of task transition diagram =
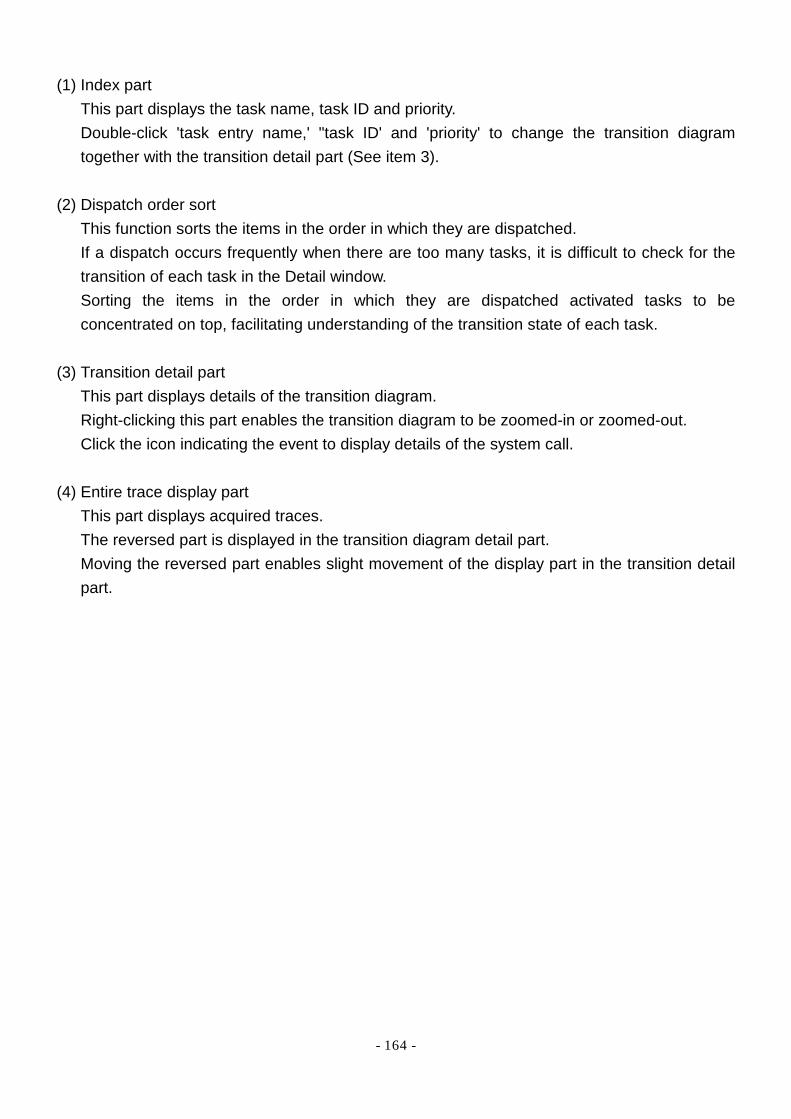
- 164 -
(1) Index part This part displays the task name, task ID and priority. Double-click 'task entry name,' "task ID' and 'priority' to change the transition diagram together with the transition detail part (See item 3).
(2) Dispatch order sort
This function sorts the items in the order in which they are dispatched. If a dispatch occurs frequently when there are too many tasks, it is difficult to check for the transition of each task in the Detail window. Sorting the items in the order in which they are dispatched activated tasks to be concentrated on top, facilitating understanding of the transition state of each task.
(3) Transition detail part
This part displays details of the transition diagram. Right-clicking this part enables the transition diagram to be zoomed-in or zoomed-out. Click the icon indicating the event to display details of the system call.
(4) Entire trace display part
This part displays acquired traces. The reversed part is displayed in the transition diagram detail part. Moving the reversed part enables slight movement of the display part in the transition detail part.

- 165 -
8.4.3 Graphical Display
Graphical Display This function provides a graphical analysis of the run time for the task transition diagram. It is possible to check graphically for waste in each object and task used when executing the task trace function of REALOS Analyzer.
(1) Click the [graph] button in the [Task Trace Figure] diagram to display the run time graph.
(2) The [Run Time Analysis] dialog opens.
Click the column headers for run time and dispatch count to display a graph of the run time and dispatch count.
- 166 -
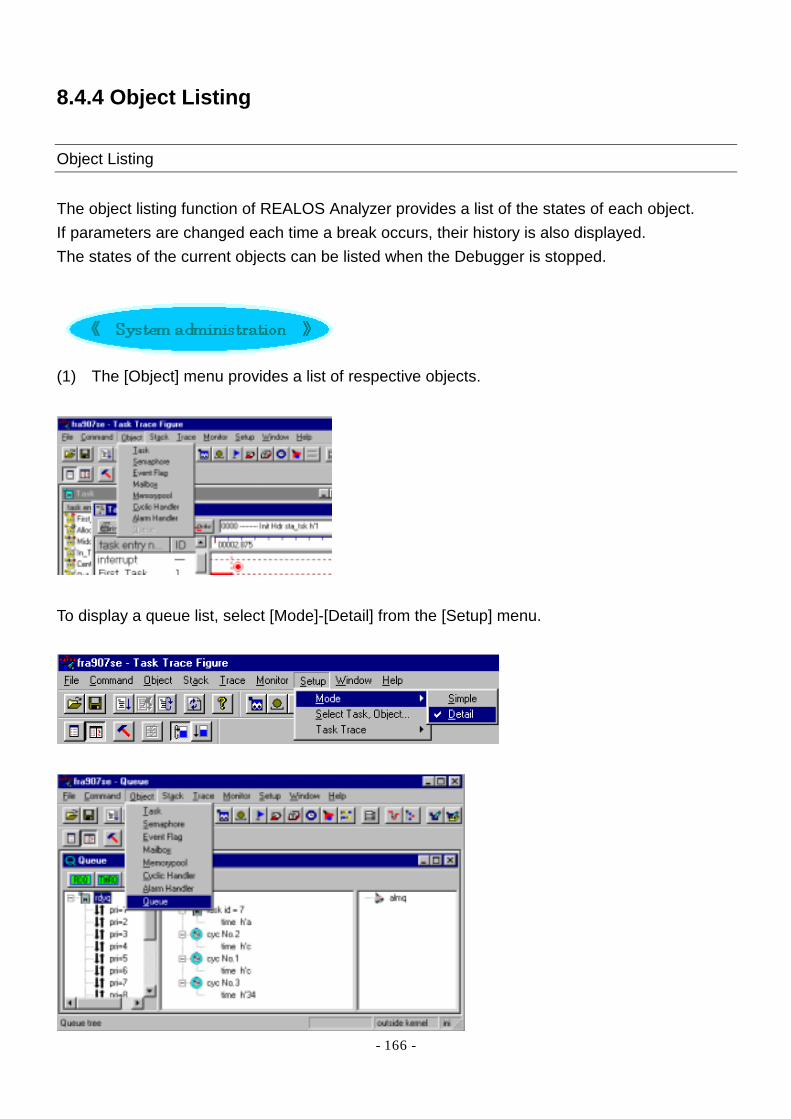
8.4.4 Object Listing
Object Listing The object listing function of REALOS Analyzer provides a list of the states of each object. If parameters are changed each time a break occurs, their history is also displayed. The states of the current objects can be listed when the Debugger is stopped.
(1) The [Object] menu provides a list of respective objects.
To display a queue list, select [Mode]-[Detail] from the [Setup] menu.
- 167 -
8.4.5 Stack Usage Analysis
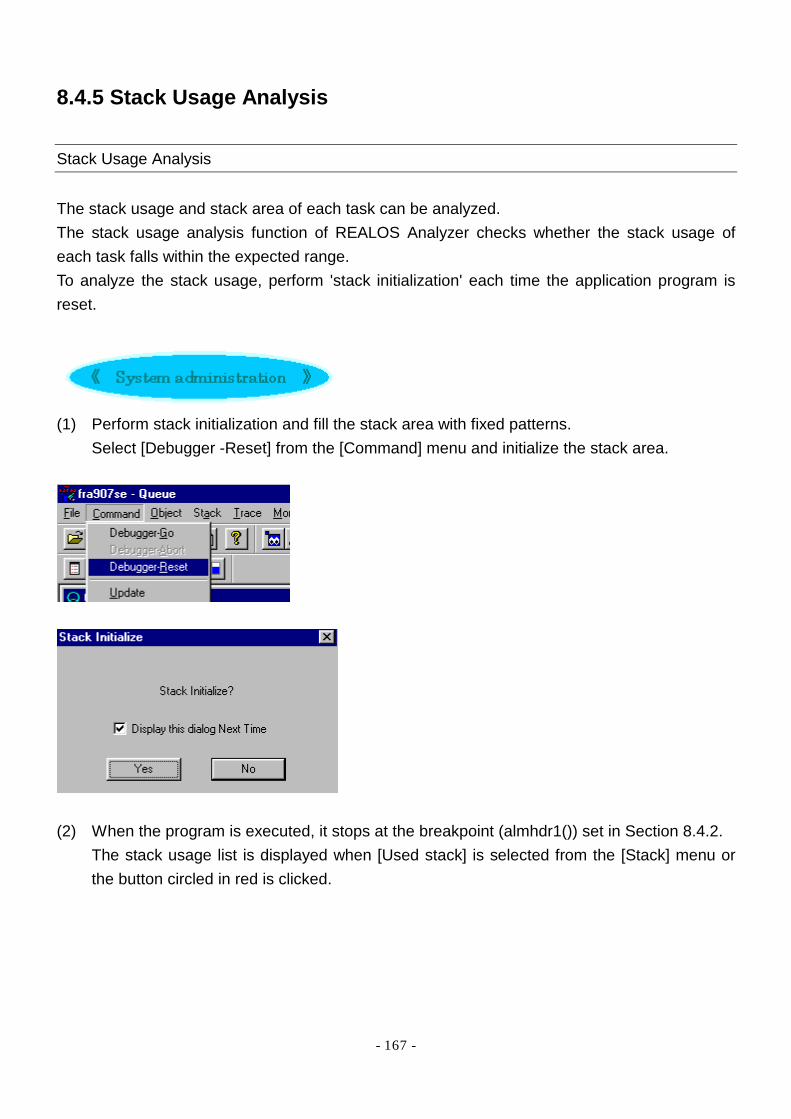
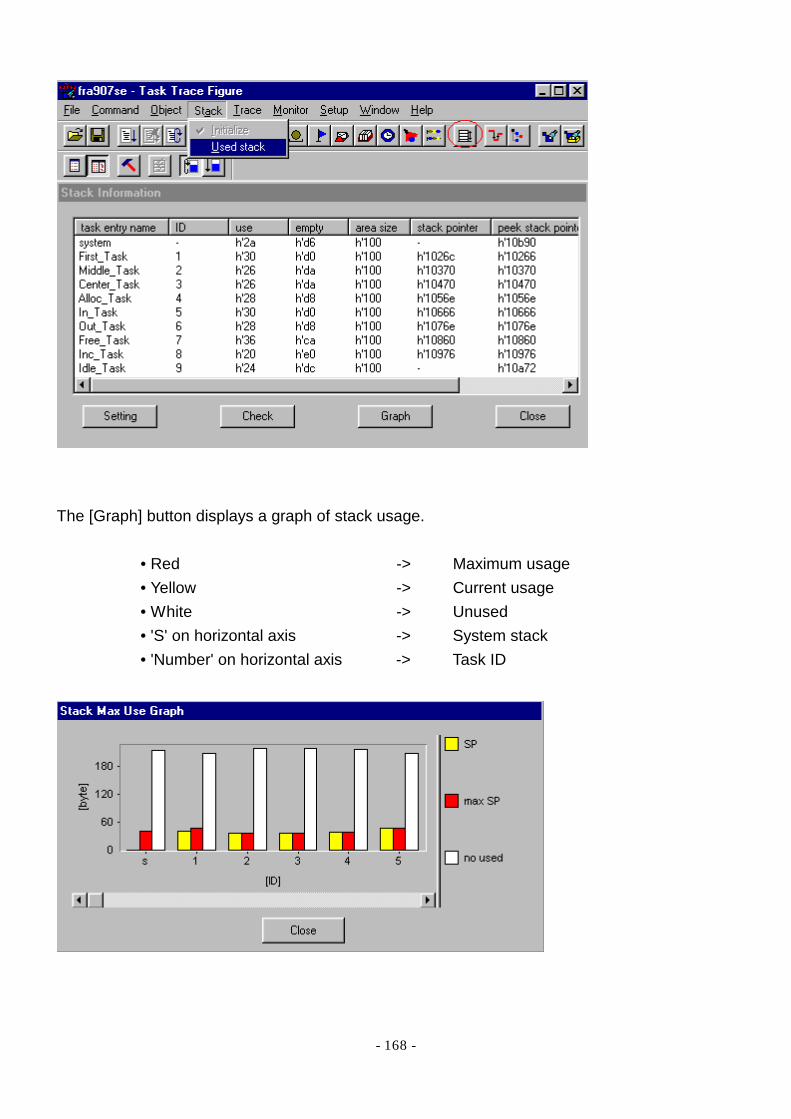
Stack Usage Analysis The stack usage and stack area of each task can be analyzed. The stack usage analysis function of REALOS Analyzer checks whether the stack usage of each task falls within the expected range. To analyze the stack usage, perform 'stack initialization' each time the application program is reset.
(1) Perform stack initialization and fill the stack area with fixed patterns.
Select [Debugger -Reset] from the [Command] menu and initialize the stack area.
(2) When the program is executed, it stops at the breakpoint (almhdr1()) set in Section 8.4.2.
The stack usage list is displayed when [Used stack] is selected from the [Stack] menu or the button circled in red is clicked.
- 168 -
The [Graph] button displays a graph of stack usage.
• Red -> Maximum usage • Yellow -> Current usage • White -> Unused • 'S' on horizontal axis -> System stack • 'Number' on horizontal axis -> Task ID
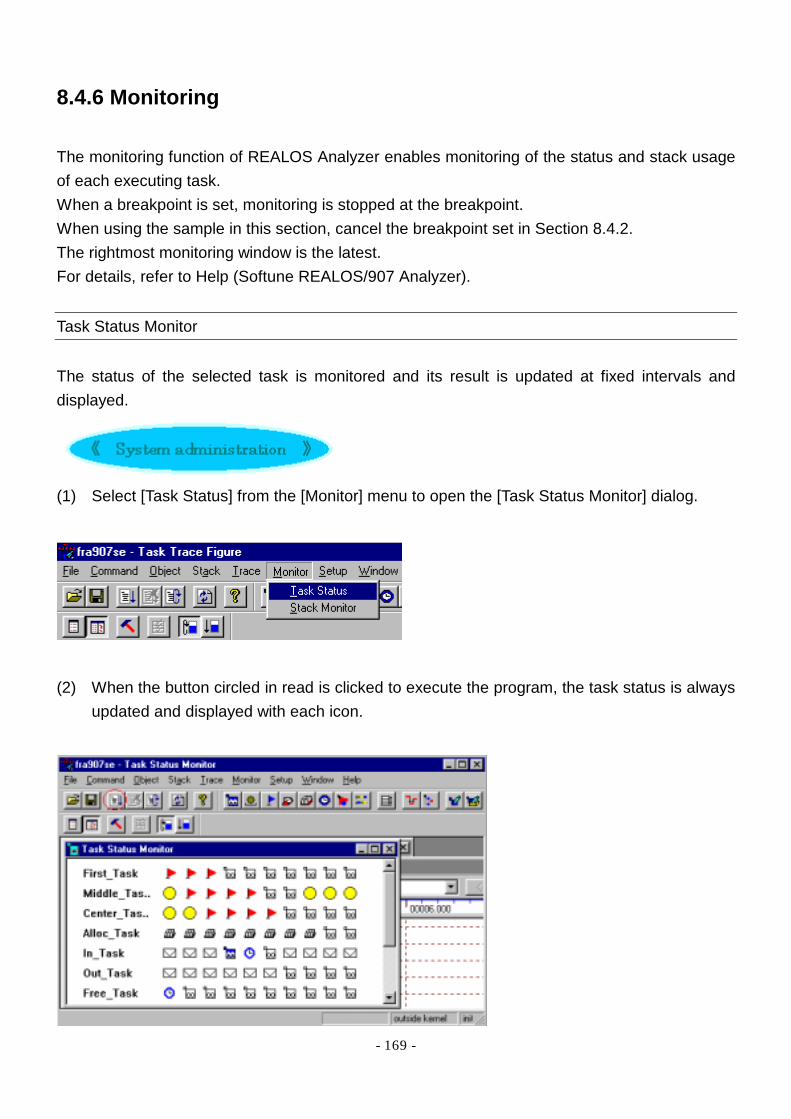
- 169 -
8.4.6 Monitoring
The monitoring function of REALOS Analyzer enables monitoring of the status and stack usage of each executing task. When a breakpoint is set, monitoring is stopped at the breakpoint. When using the sample in this section, cancel the breakpoint set in Section 8.4.2. The rightmost monitoring window is the latest. For details, refer to Help (Softune REALOS/907 Analyzer). Task Status Monitor The status of the selected task is monitored and its result is updated at fixed intervals and displayed.
(1) Select [Task Status] from the [Monitor] menu to open the [Task Status Monitor] dialog.
(2) When the button circled in read is clicked to execute the program, the task status is always
updated and displayed with each icon.
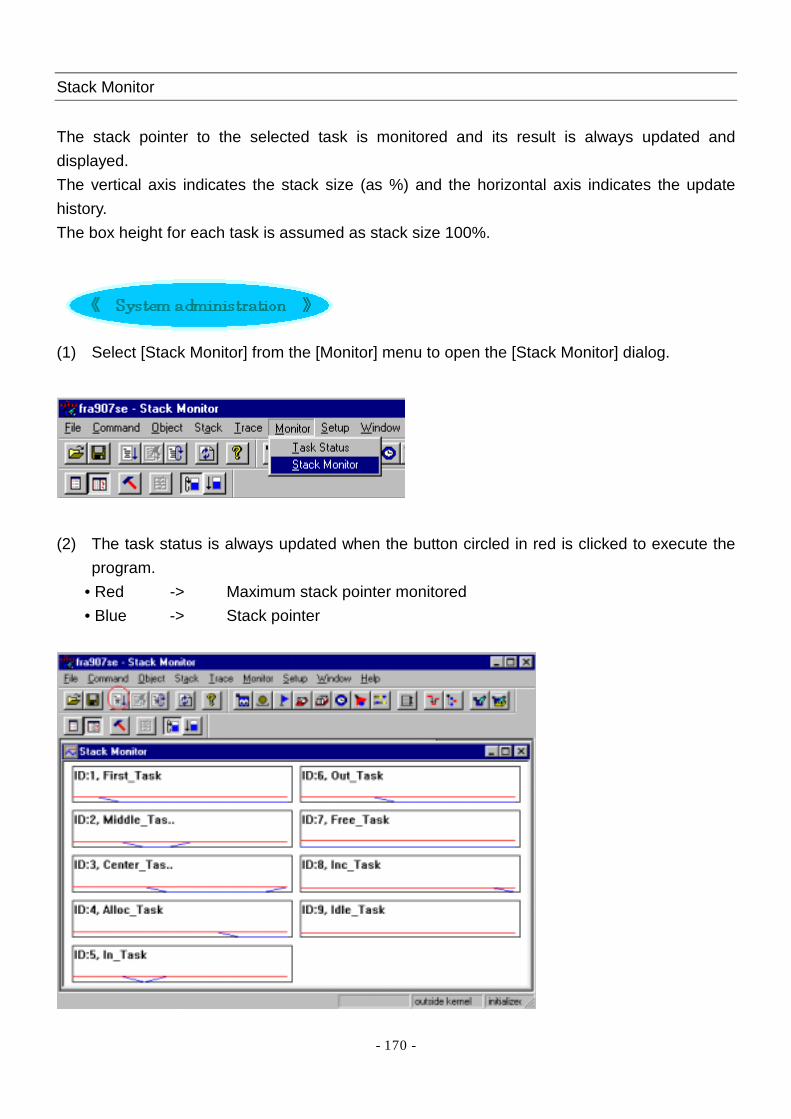
- 170 -
Stack Monitor The stack pointer to the selected task is monitored and its result is always updated and displayed. The vertical axis indicates the stack size (as %) and the horizontal axis indicates the update history. The box height for each task is assumed as stack size 100%.
(1) Select [Stack Monitor] from the [Monitor] menu to open the [Stack Monitor] dialog.
(2) The task status is always updated when the button circled in red is clicked to execute the
program. • Red -> Maximum stack pointer monitored • Blue -> Stack pointer
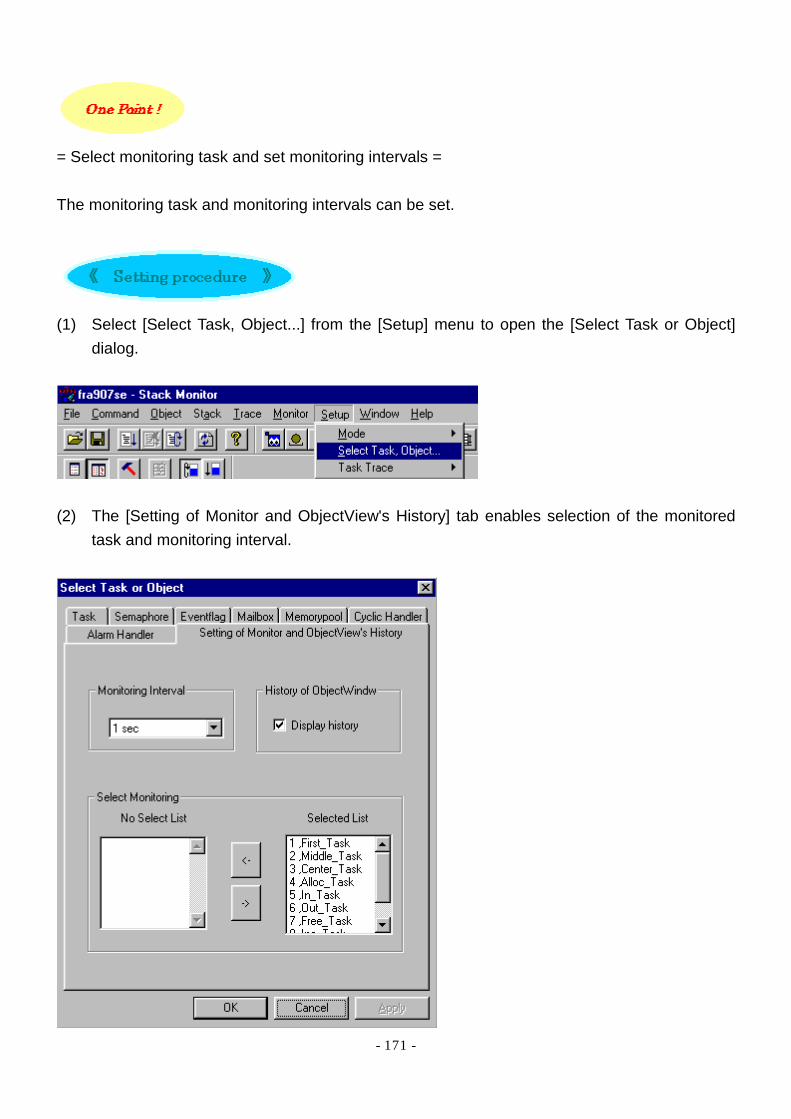
- 171 -
= Select monitoring task and set monitoring intervals = The monitoring task and monitoring intervals can be set.
(1) Select [Select Task, Object...] from the [Setup] menu to open the [Select Task or Object]
dialog.
(2) The [Setting of Monitor and ObjectView's History] tab enables selection of the monitored
task and monitoring interval.
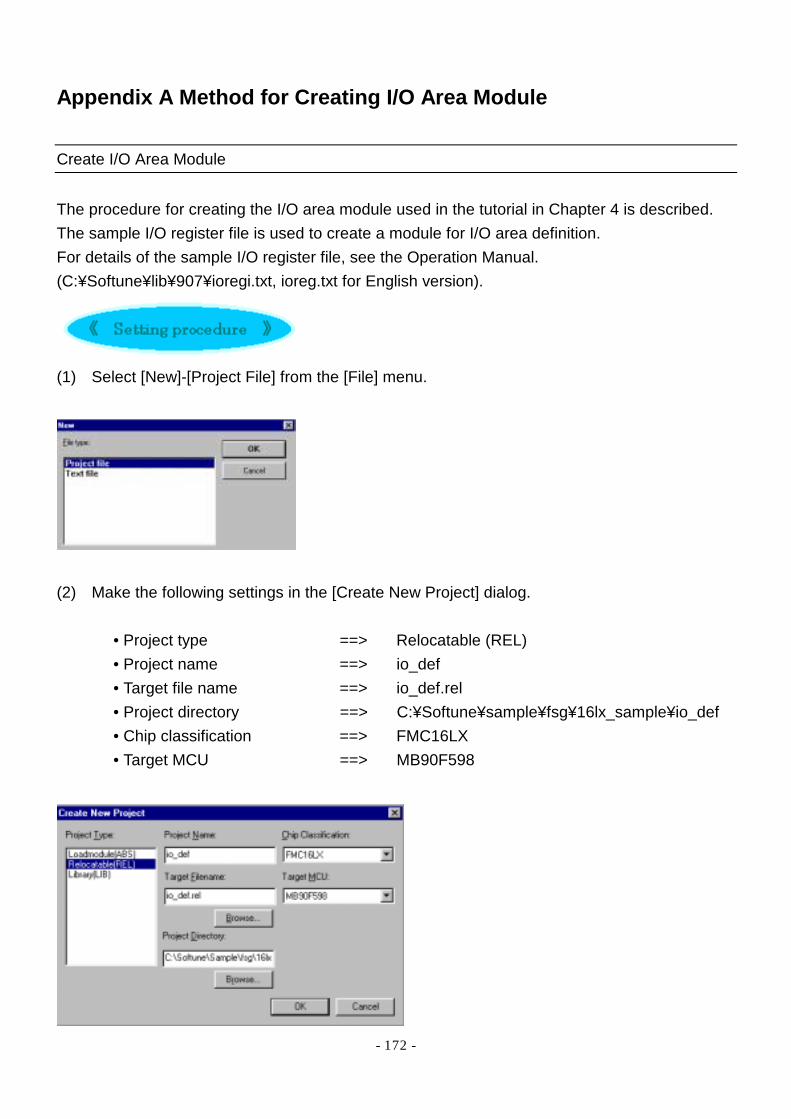
- 172 -
Appendix A Method for Creating I/O Area Module
Create I/O Area Module The procedure for creating the I/O area module used in the tutorial in Chapter 4 is described. The sample I/O register file is used to create a module for I/O area definition. For details of the sample I/O register file, see the Operation Manual. (C:¥Softune¥lib¥907¥ioregi.txt, ioreg.txt for English version).
(1) Select [New]-[Project File] from the [File] menu.
(2) Make the following settings in the [Create New Project] dialog.
• Project type ==> Relocatable (REL) • Project name ==> io_def • Target file name ==> io_def.rel • Project directory ==> C:¥Softune¥sample¥fsg¥16lx_sample¥io_def • Chip classification ==> FMC16LX • Target MCU ==> MB90F598

- 173 -
(3) Set the member required for I/O area definition. Select [Add Member...] from the [Project] menu.
(4) Select all files with the .c extension in C:¥Softune¥lib¥907¥include¥sample and click the
[Open] button. The member is added to the project.
(5) Select [Setup Tool Option...] from the [Project] menu.
Select 'Target Depend' for Category and 'Small' for Memory Model at the [C Compiler] tab in the [Setup Tool Option] dialog. The relocatable file for I/O register definition and absolute target file must be created by the same memory model. If the memory model is different, a link error occurs when creating the absolute target file.
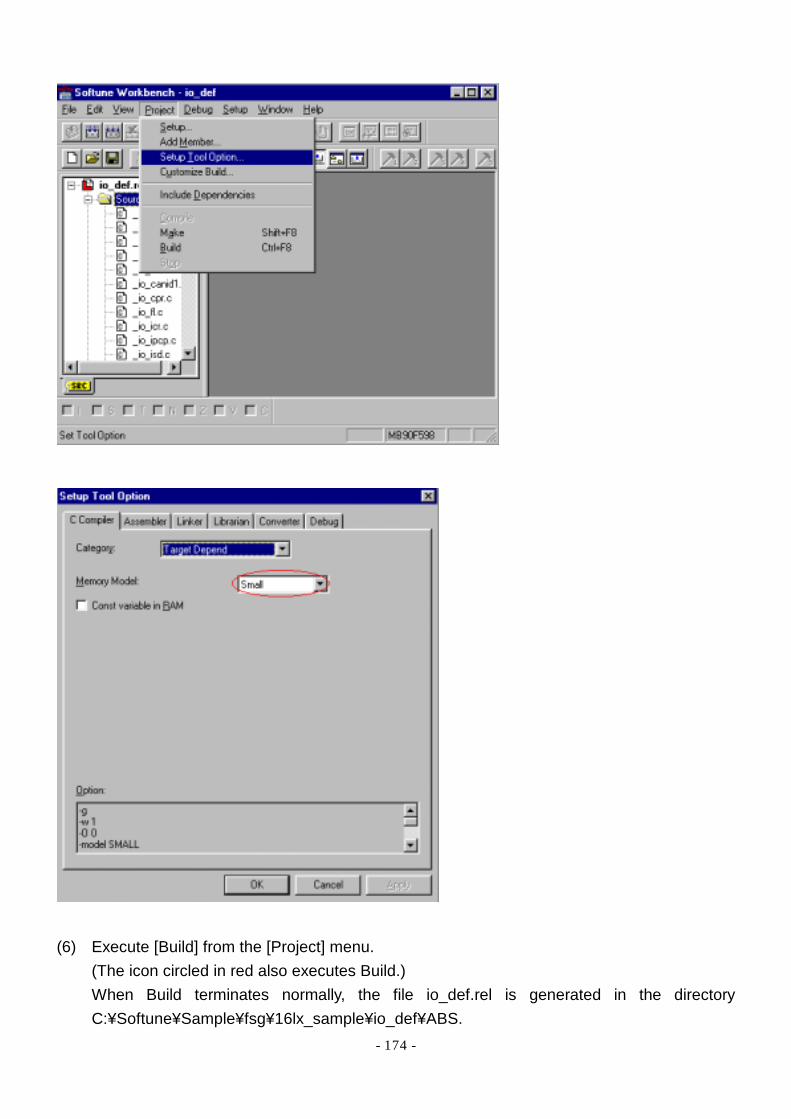
- 174 -
(6) Execute [Build] from the [Project] menu.
(The icon circled in red also executes Build.) When Build terminates normally, the file io_def.rel is generated in the directory C:¥Softune¥Sample¥fsg¥16lx_sample¥io_def¥ABS.
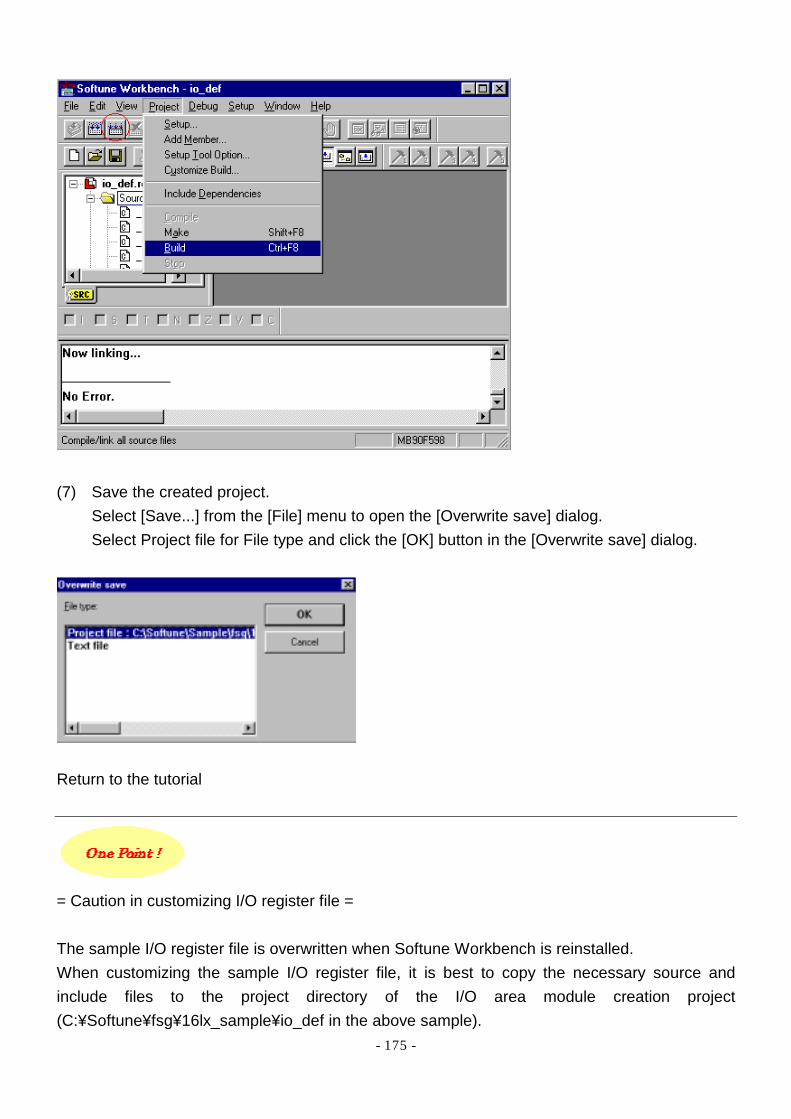
- 175 -
(7) Save the created project.
Select [Save...] from the [File] menu to open the [Overwrite save] dialog. Select Project file for File type and click the [OK] button in the [Overwrite save] dialog.
Return to the tutorial
= Caution in customizing I/O register file = The sample I/O register file is overwritten when Softune Workbench is reinstalled. When customizing the sample I/O register file, it is best to copy the necessary source and include files to the project directory of the I/O area module creation project (C:¥Softune¥fsg¥16lx_sample¥io_def in the above sample).

- 176 -
Appendix B Q & A B1 Questions on Project Design
Q1 How should we move the Softune Workbench project to another machine or drive?
Q2 What should we do when the source file is not displayed when debugging is performed by a machine that did not execute Build?
Q3 How do we reproduce the language tool options set in Softune Workbench?
Q4 What should we do to allow more than one developer to work on the same project
information?
Q5 What should we do to create projects with different language tool options and member configurations for source files?
Q6 What is the difference between project types (absolute, relocatable, and library)?
Q7 What does information specified in Target MCU in the [Create New Project] dialog
reflect?
Q8 What is information set in the [Setup CPU Information] dialog used for?
Q9 Is the extension determined by the file type?
Q10 What should we do to change the linkage order?
Q11 Is the source file dependent at Make execution compiled if only the include file is changed?
B2 Questions on Debugger
Q1 What should we do if the Debugger cannot be started?
Q2 What should we do when normal conversion is not performed when symbolic addressing is performed?
Q3 Does the Softune simulator for the FMC-16 Family support the ROM mirror function?

- 177 -
Q4 What should we do to set a data break when the Emulator Debugger is used?
Q5 What should we do to set the path count of a breakpoint when the Emulator Debugger
is used?
Q6 What should we do if the [Extend...] button in the [Break] dialog does not become active?
Q7 What should we do if the settings of breakpoints when the target file is changed?
Q8 How do we save the trace result and evaluation result such as memory dump in a file?
Q9 How do we disable trace up to the first event using the single trace function?
Q10 How do we check the procedure for coverage measurement?
B3 Others
Q1 How do we check the version of Softune Workbench and each language tool?
Q2 How do we change the font size in each Softune Workbench window?
Q3 How do we retrieve a file displayed in the Softune Workbench project window?
Q4 How do we check details of the sample I/O register file?
Q5 How do we change the record length of Motorola S format data?
Q6 How do we check the cautions in using the C assembler?

- 178 -
Q1 How do we move the Softune Workbench project to another machine or drive?
Answer. When moving the project to another machine or drive, it is necessary to check the following description. Change the various settings as needed. (1) If the project is moved to other machines or drives, Softune Workbench will automatically
recognize the changed path with respect to the member file below the hierarchy of the project directory. However, if the source file and object file are not below the hierarchy of the project directory, the member file must be input again. To check the project directory, select [Setup...] from the [Project] menu and open the [Setup] dialog. The project directory can be checked in the [Directory] tab in the [Setup] dialog.
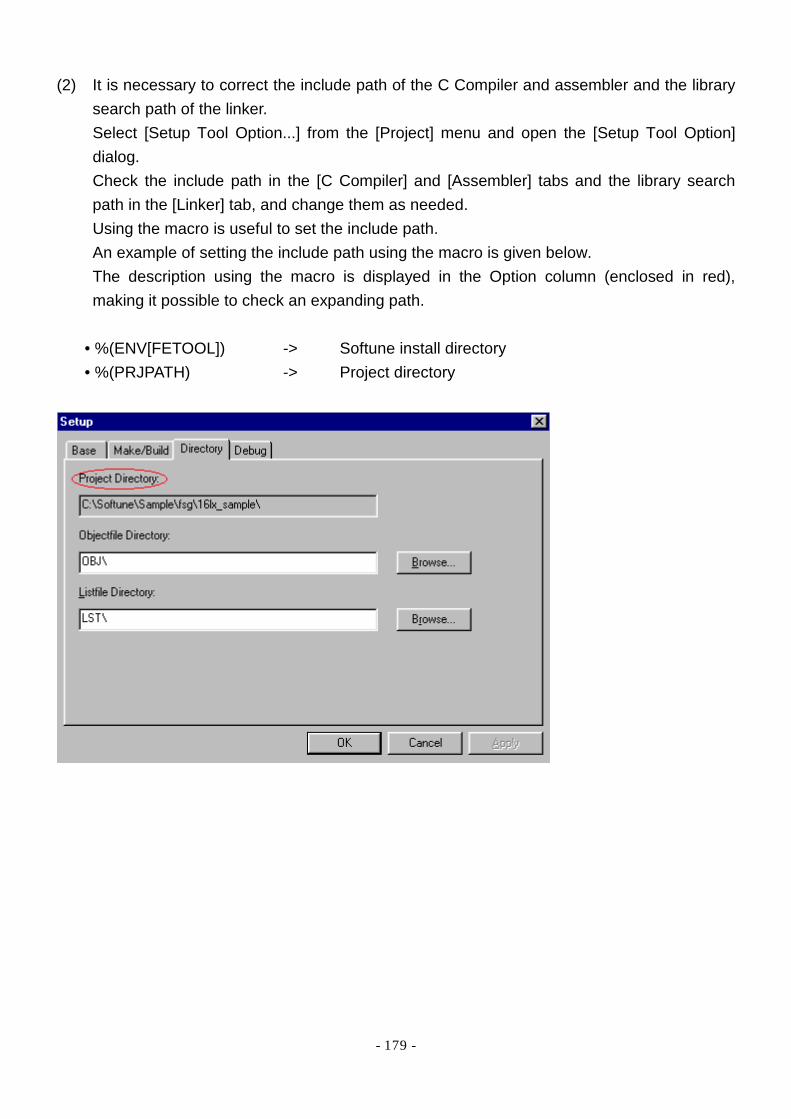
- 179 -
(2) It is necessary to correct the include path of the C Compiler and assembler and the library search path of the linker. Select [Setup Tool Option...] from the [Project] menu and open the [Setup Tool Option] dialog. Check the include path in the [C Compiler] and [Assembler] tabs and the library search path in the [Linker] tab, and change them as needed. Using the macro is useful to set the include path. An example of setting the include path using the macro is given below. The description using the macro is displayed in the Option column (enclosed in red), making it possible to check an expanding path.
• %(ENV[FETOOL]) -> Softune install directory • %(PRJPATH) -> Project directory
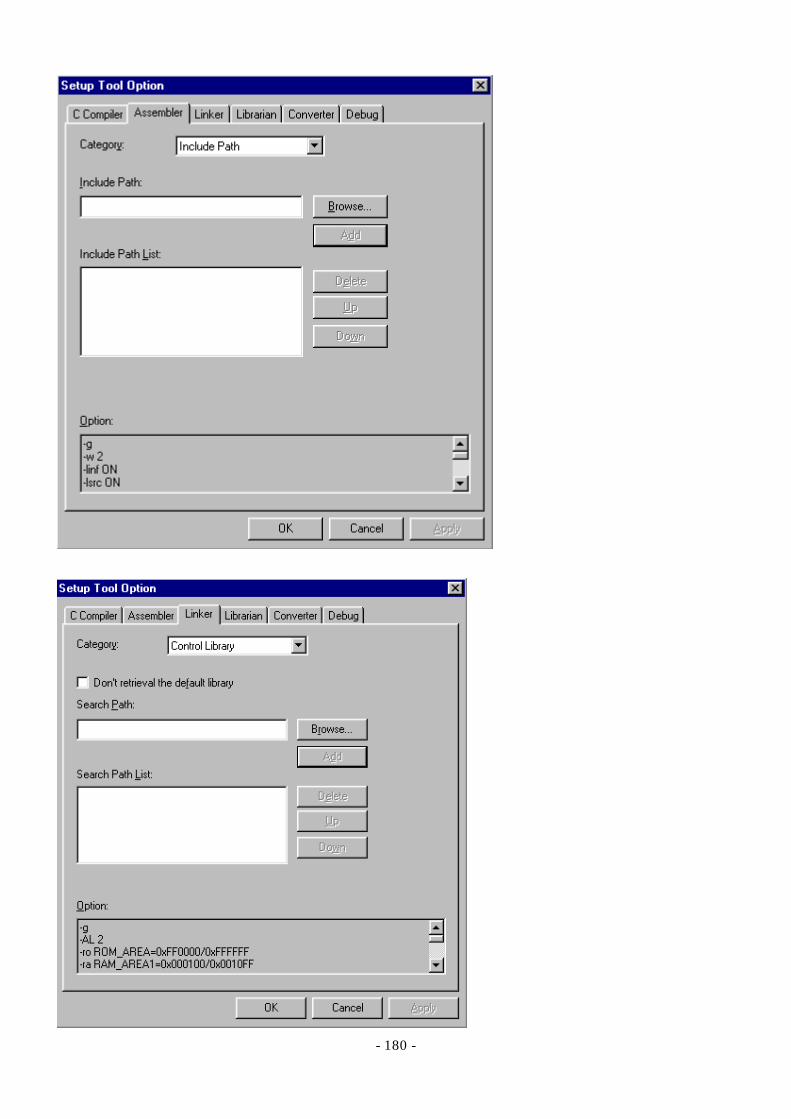
- 180 -
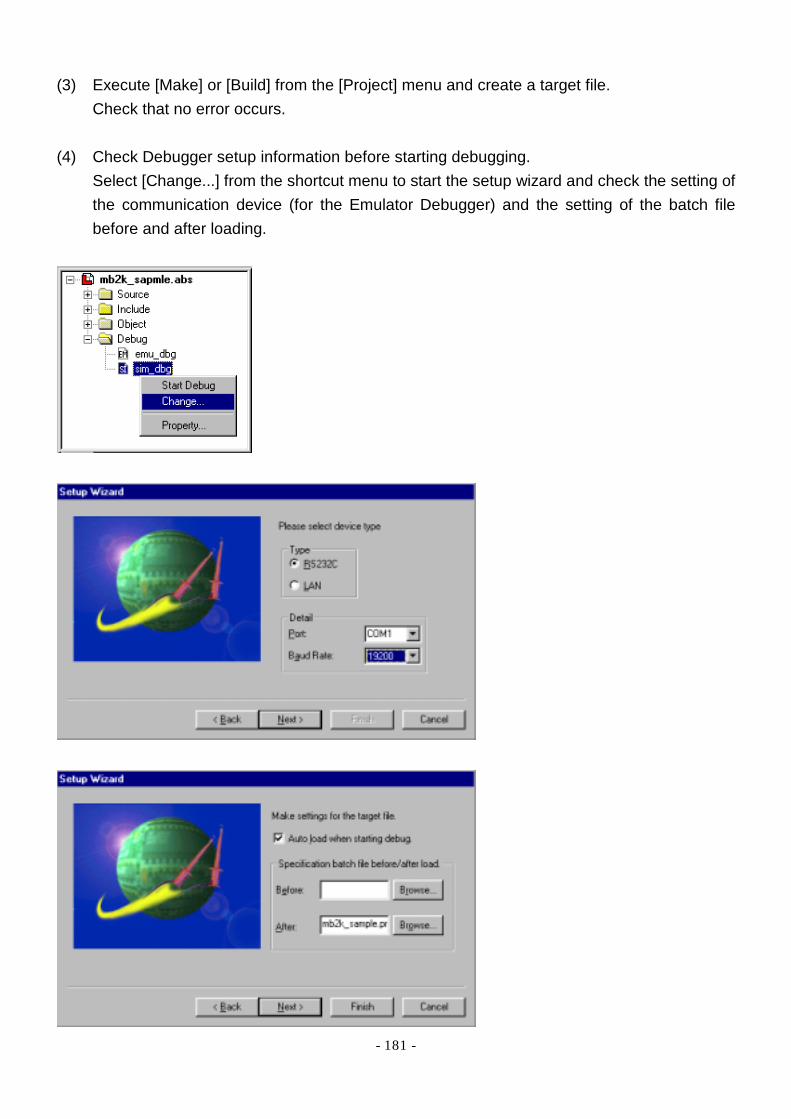
- 181 -
(3) Execute [Make] or [Build] from the [Project] menu and create a target file. Check that no error occurs.
(4) Check Debugger setup information before starting debugging.
Select [Change...] from the shortcut menu to start the setup wizard and check the setting of the communication device (for the Emulator Debugger) and the setting of the batch file before and after loading.

- 182 -
= Setting in [Directory] tab in [Setup] dialog = For the object file directory and list file directory, the [Browse...] button can be used to change the path. When the absolute path is specified, resetting is necessary if the project is moved. It is best to perform operation at the default setting.
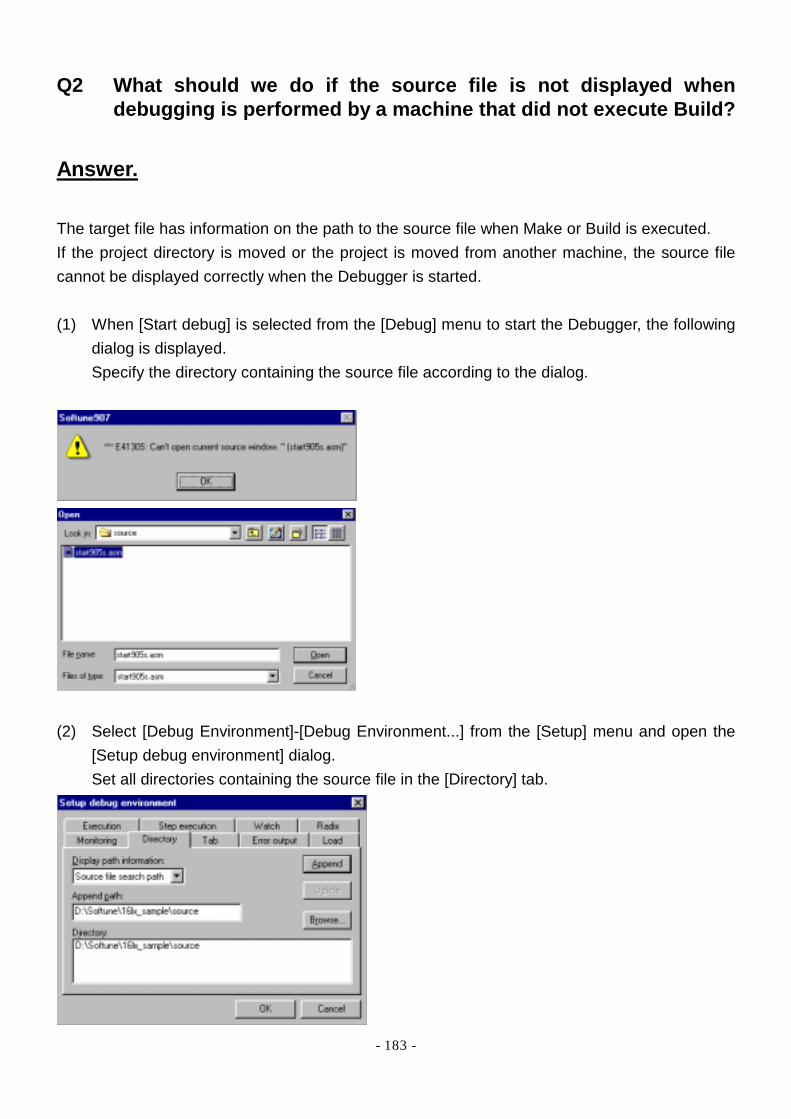
- 183 -
Q2 What should we do if the source file is not displayed when debugging is performed by a machine that did not execute Build?
Answer. The target file has information on the path to the source file when Make or Build is executed. If the project directory is moved or the project is moved from another machine, the source file cannot be displayed correctly when the Debugger is started. (1) When [Start debug] is selected from the [Debug] menu to start the Debugger, the following
dialog is displayed. Specify the directory containing the source file according to the dialog.
(2) Select [Debug Environment]-[Debug Environment...] from the [Setup] menu and open the
[Setup debug environment] dialog. Set all directories containing the source file in the [Directory] tab.
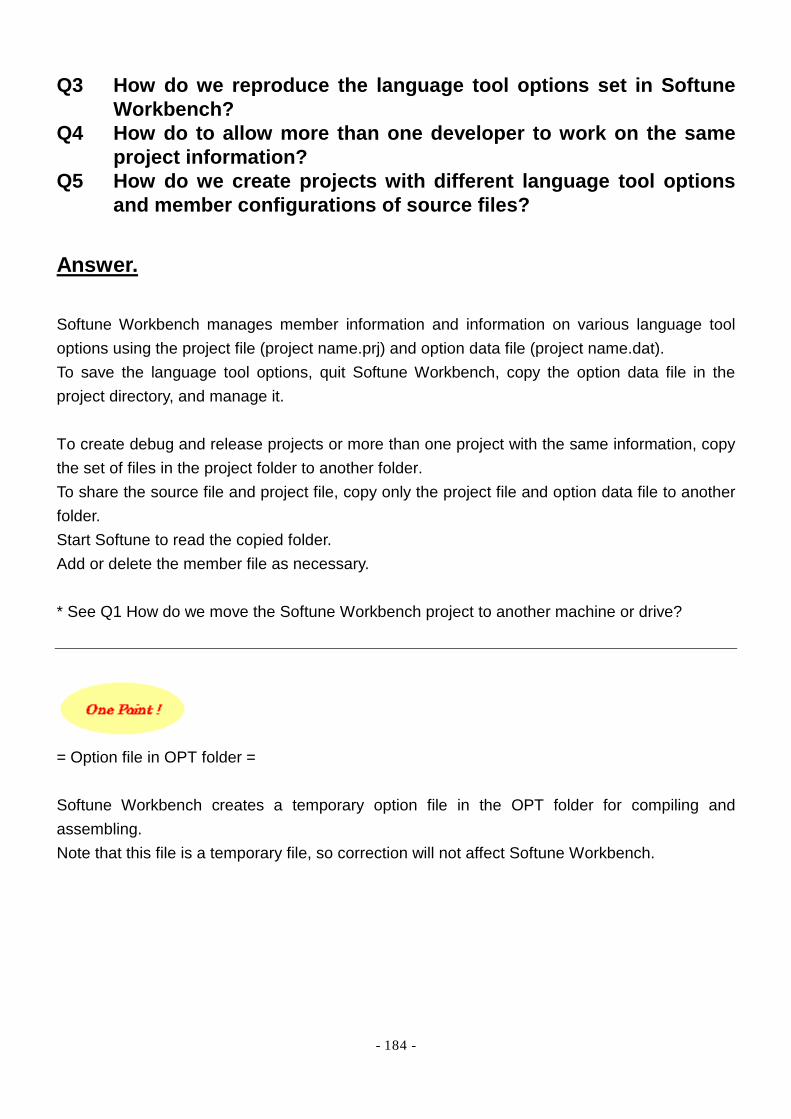
- 184 -
Q3 How do we reproduce the language tool options set in Softune Workbench?
Q4 How do to allow more than one developer to work on the same project information?
Q5 How do we create projects with different language tool options and member configurations of source files?
Answer. Softune Workbench manages member information and information on various language tool options using the project file (project name.prj) and option data file (project name.dat). To save the language tool options, quit Softune Workbench, copy the option data file in the project directory, and manage it. To create debug and release projects or more than one project with the same information, copy the set of files in the project folder to another folder. To share the source file and project file, copy only the project file and option data file to another folder. Start Softune to read the copied folder. Add or delete the member file as necessary. * See Q1 How do we move the Softune Workbench project to another machine or drive?
= Option file in OPT folder = Softune Workbench creates a temporary option file in the OPT folder for compiling and assembling. Note that this file is a temporary file, so correction will not affect Softune Workbench.
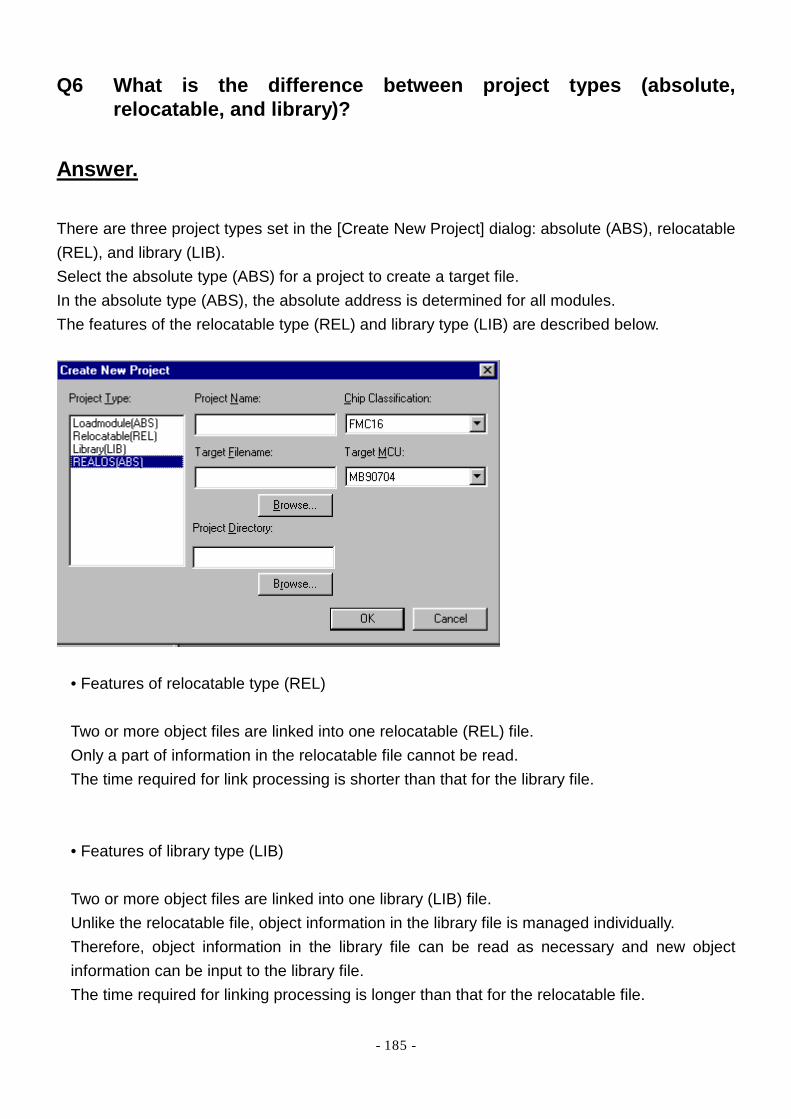
- 185 -
Q6 What is the difference between project types (absolute, relocatable, and library)?
Answer. There are three project types set in the [Create New Project] dialog: absolute (ABS), relocatable (REL), and library (LIB). Select the absolute type (ABS) for a project to create a target file. In the absolute type (ABS), the absolute address is determined for all modules. The features of the relocatable type (REL) and library type (LIB) are described below.
• Features of relocatable type (REL) Two or more object files are linked into one relocatable (REL) file. Only a part of information in the relocatable file cannot be read. The time required for link processing is shorter than that for the library file. • Features of library type (LIB) Two or more object files are linked into one library (LIB) file. Unlike the relocatable file, object information in the library file is managed individually. Therefore, object information in the library file can be read as necessary and new object information can be input to the library file. The time required for linking processing is longer than that for the relocatable file.
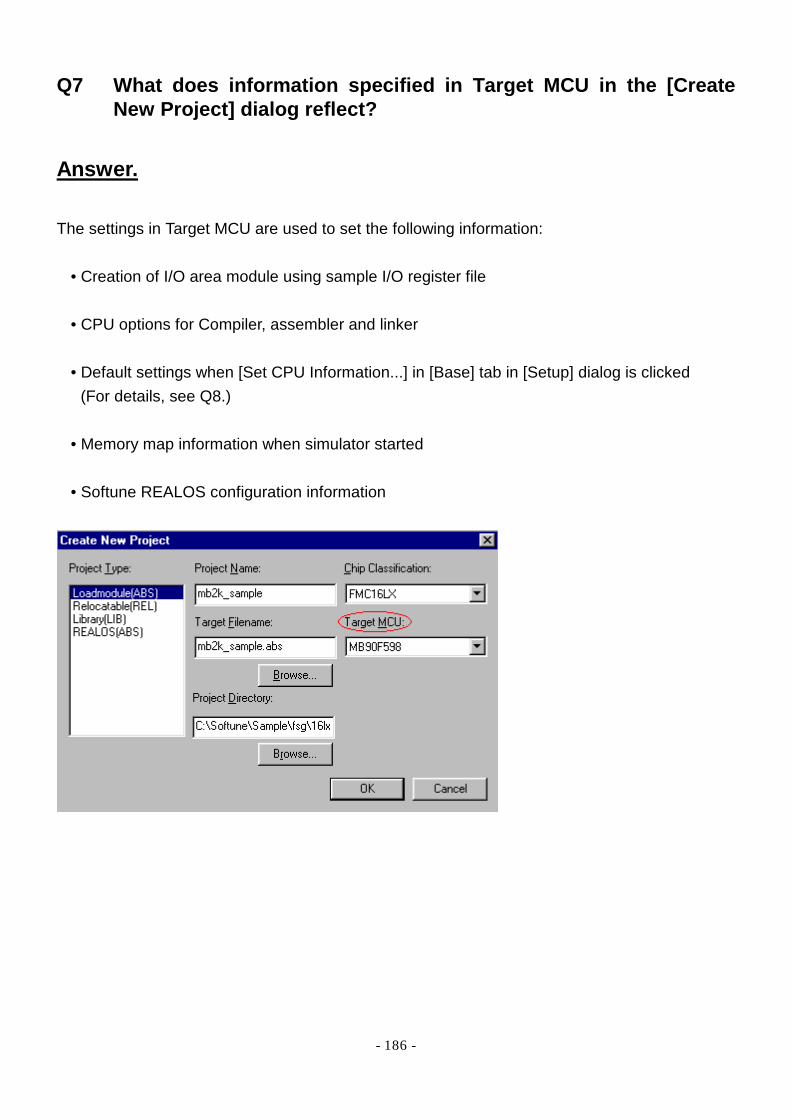
- 186 -
Q7 What does information specified in Target MCU in the [Create New Project] dialog reflect?
Answer. The settings in Target MCU are used to set the following information:
• Creation of I/O area module using sample I/O register file • CPU options for Compiler, assembler and linker • Default settings when [Set CPU Information...] in [Base] tab in [Setup] dialog is clicked
(For details, see Q8.)
• Memory map information when simulator started • Softune REALOS configuration information
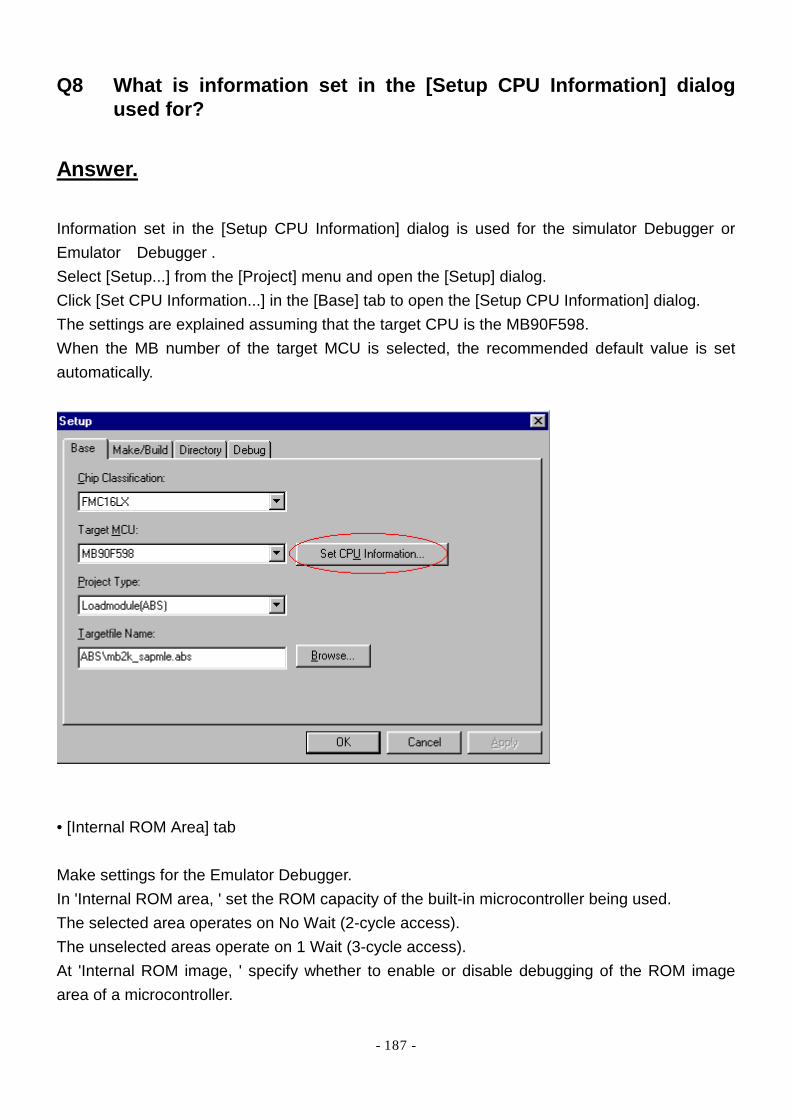
- 187 -
Q8 What is information set in the [Setup CPU Information] dialog used for?
Answer. Information set in the [Setup CPU Information] dialog is used for the simulator Debugger or Emulator Debugger . Select [Setup...] from the [Project] menu and open the [Setup] dialog. Click [Set CPU Information...] in the [Base] tab to open the [Setup CPU Information] dialog. The settings are explained assuming that the target CPU is the MB90F598. When the MB number of the target MCU is selected, the recommended default value is set automatically.
• [Internal ROM Area] tab Make settings for the Emulator Debugger. In 'Internal ROM area, ' set the ROM capacity of the built-in microcontroller being used. The selected area operates on No Wait (2-cycle access). The unselected areas operate on 1 Wait (3-cycle access). At 'Internal ROM image, ' specify whether to enable or disable debugging of the ROM image area of a microcontroller.
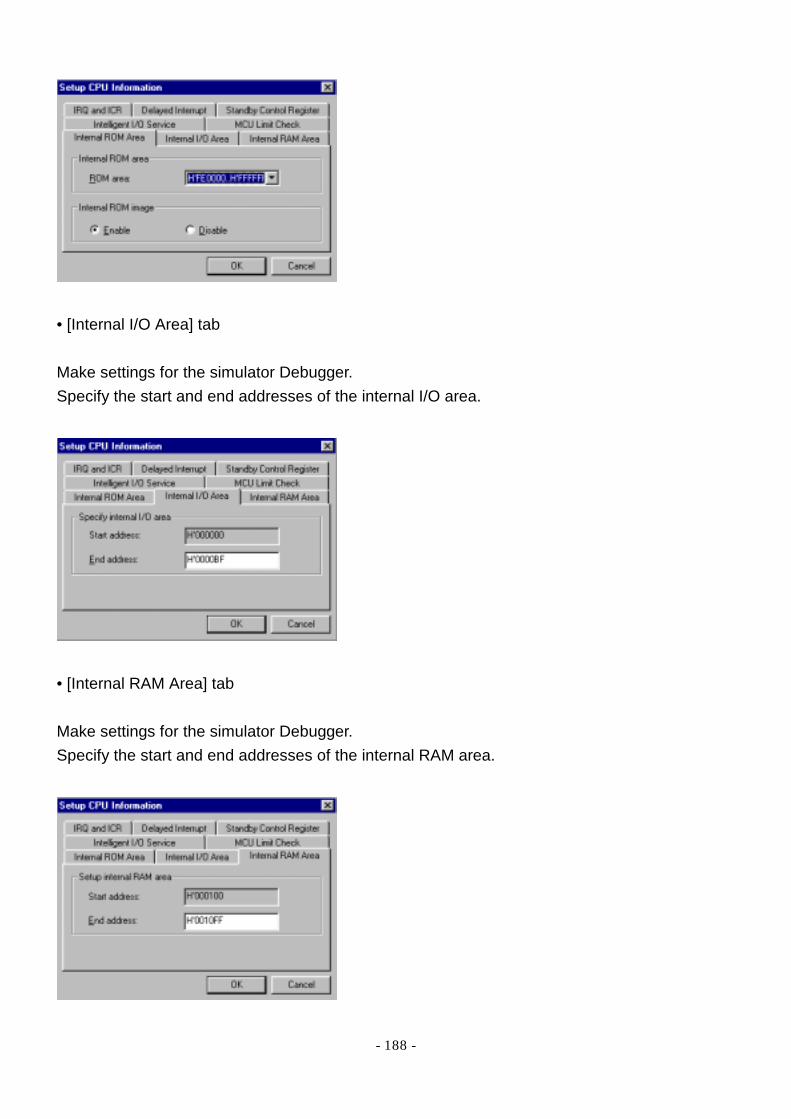
- 188 -
• [Internal I/O Area] tab Make settings for the simulator Debugger. Specify the start and end addresses of the internal I/O area.
• [Internal RAM Area] tab Make settings for the simulator Debugger. Specify the start and end addresses of the internal RAM area.

- 189 -
• [IRQ and ICR] tab Make settings for the simulator Debugger. Specify the correspondence between external interrupts and ICRs.
• [Delayed Interrupt] tab Make settings for the simulator Debugger. Specify the vector number of the delayed interrupt.
• [Standby Control Register] tab Make settings for the simulator Debugger. Specify the address of the standby control register.

- 190 -
• [Intelligent I/O Service] tab Make settings for the simulator Debugger. Select either 'Normal' or 'Extended. '
• [MCU Limit Check] tab Make settings for the Emulator Debugger. Specify whether to enable or disable the native check. Select 'Disable' for the FMC16LX. Select 'Enable' for the FMC16H/16H CPU Family.
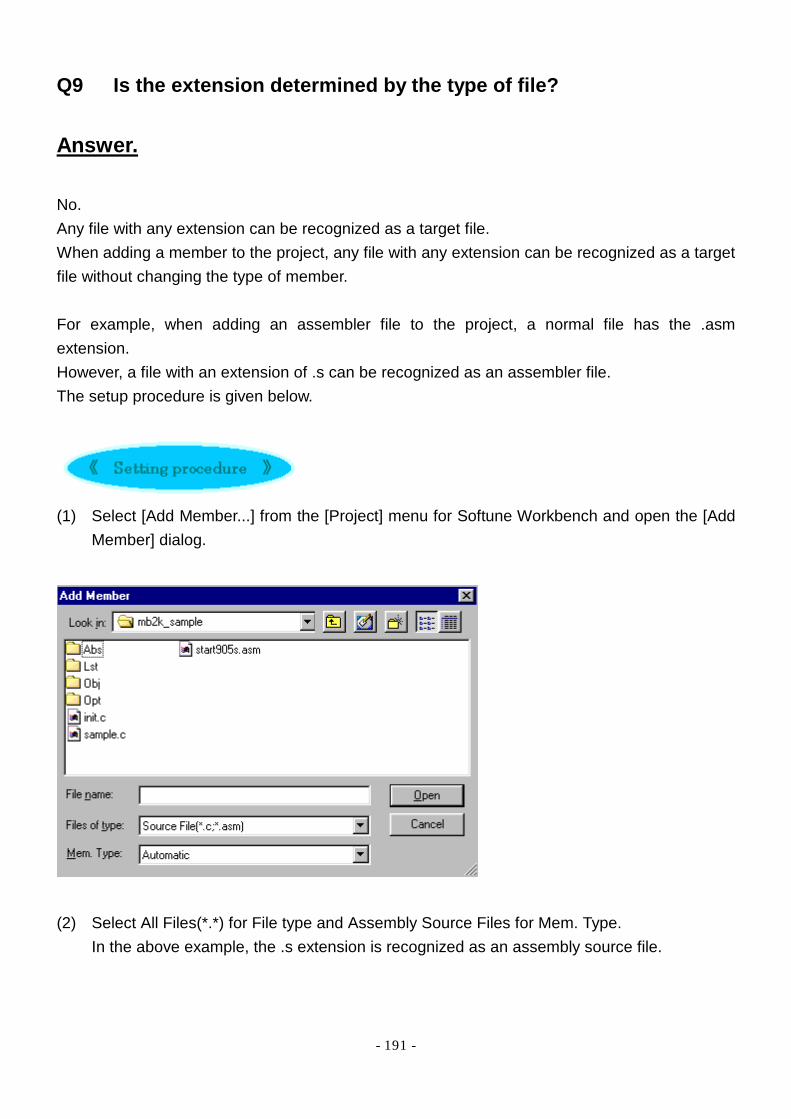
- 191 -
Q9 Is the extension determined by the type of file?
Answer. No. Any file with any extension can be recognized as a target file. When adding a member to the project, any file with any extension can be recognized as a target file without changing the type of member. For example, when adding an assembler file to the project, a normal file has the .asm extension. However, a file with an extension of .s can be recognized as an assembler file. The setup procedure is given below.
(1) Select [Add Member...] from the [Project] menu for Softune Workbench and open the [Add
Member] dialog.
(2) Select All Files(*.*) for File type and Assembly Source Files for Mem. Type.
In the above example, the .s extension is recognized as an assembly source file.
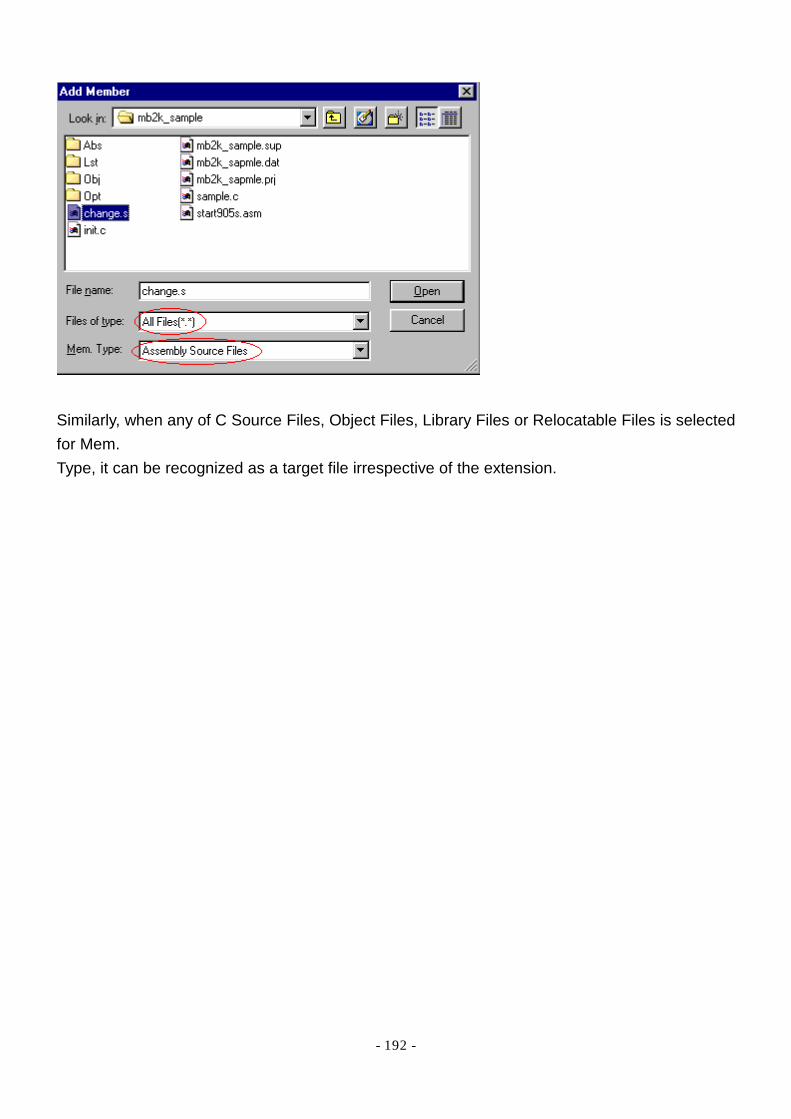
- 192 -
Similarly, when any of C Source Files, Object Files, Library Files or Relocatable Files is selected for Mem. Type, it can be recognized as a target file irrespective of the extension.

- 193 -
Q10 How do we change the linkage order?
Answer. The linkage order can be changed in the Project window. Before the change, the order in which source files are added to the project member is the linkage order. For the method for setting the linkage order, see Section 4.1.7 Set Linkage Order.

- 194 -
Q11 Is the dependent source file at Make execution compiled when only the include file is changed?
Answer. When the include file is changed even when there is no change in the source file, all the dependent files at Make execution are compiled.
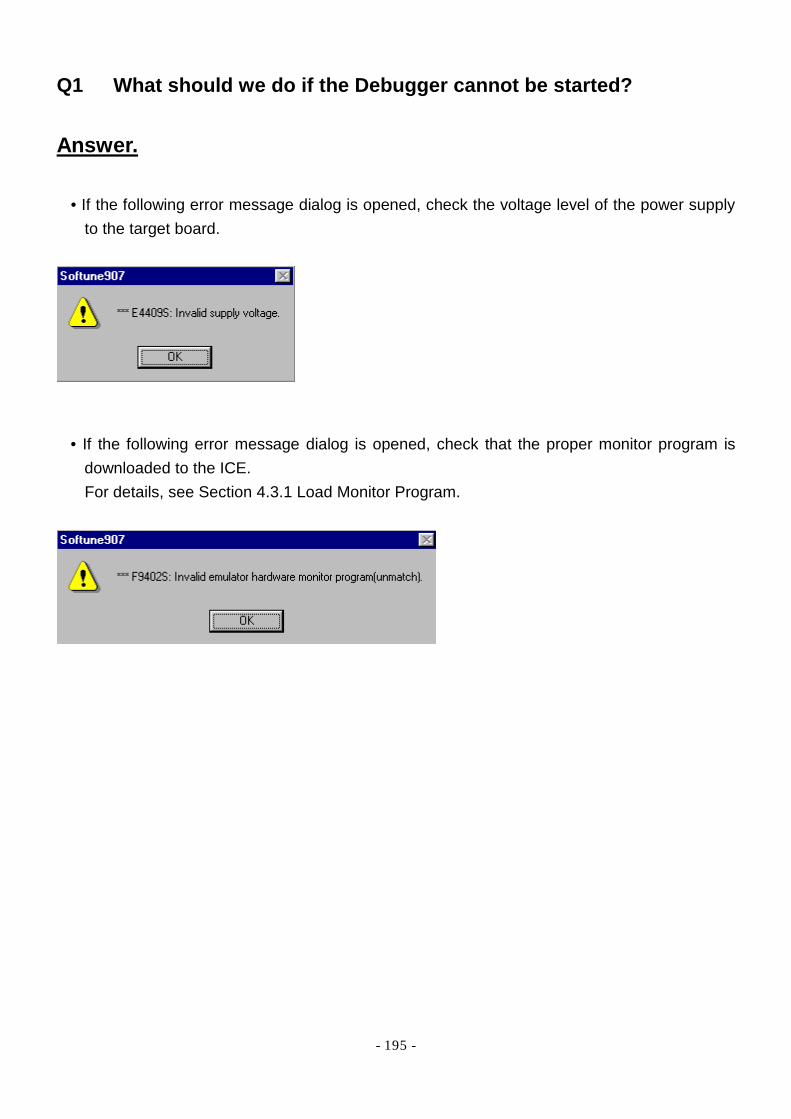
- 195 -
Q1 What should we do if the Debugger cannot be started?
Answer.
• If the following error message dialog is opened, check the voltage level of the power supply to the target board.
• If the following error message dialog is opened, check that the proper monitor program is downloaded to the ICE. For details, see Section 4.3.1 Load Monitor Program.

- 196 -
Q2 What should we do if normal conversion is not performed when symbolic addressing is performed.
Answer. At setting line assembly and events, and at the jump function in the Memory window, the address can be specified using the symbol. Address symbols such as arrays can be specified using the symbol name. However, a value symbol such as array elements should be specified with the symbol name + an address operator of '&.' An example is given using the project created in Chapter 4.
(1) Start the simulator Debugger.
Select [Memory] from the [View] menu to open the Memory window. Right-click the Memory window and select [Jump...] from the shortcut menu to open the [Jump] dialog.
(2) When the array symbol 'LED_pat' is specified at Position, jump to the address FF4000
where the array is placed.
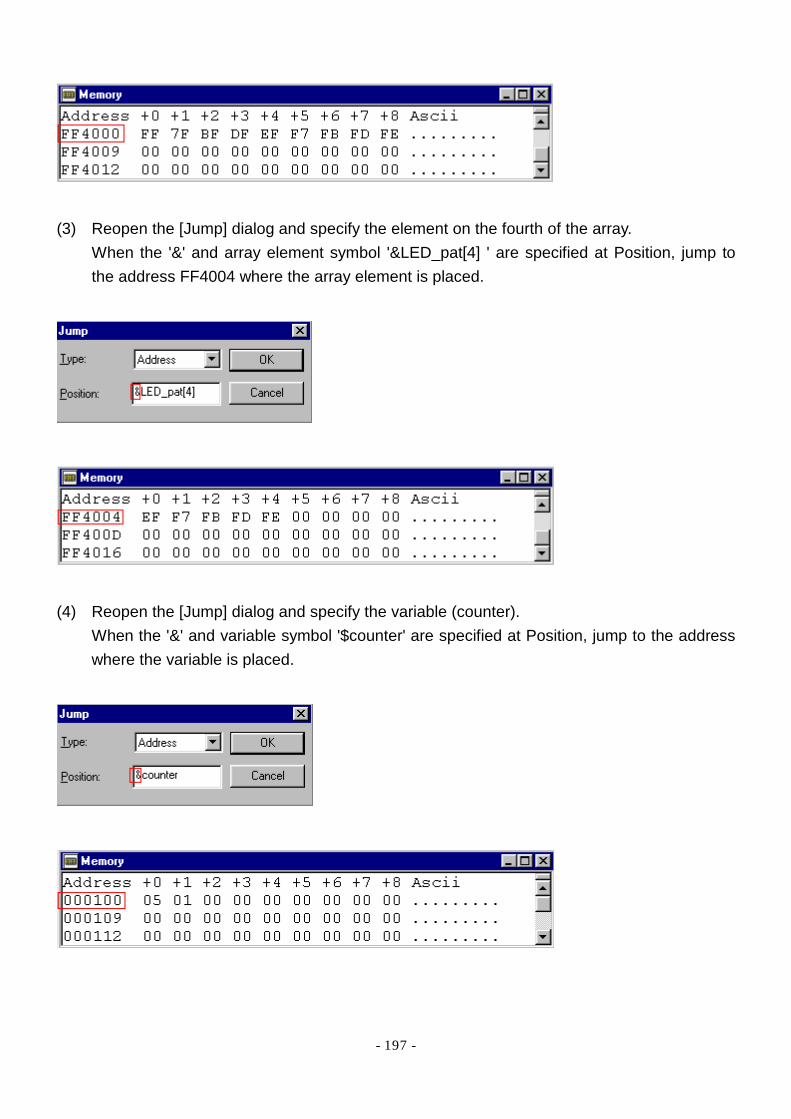
- 197 -
(3) Reopen the [Jump] dialog and specify the element on the fourth of the array.
When the '&' and array element symbol '&LED_pat[4] ' are specified at Position, jump to the address FF4004 where the array element is placed.
(4) Reopen the [Jump] dialog and specify the variable (counter).
When the '&' and variable symbol '$counter' are specified at Position, jump to the address where the variable is placed.
- 198 -
Q3 Does the Softune Simulator for the FMC-16 Family support the ROM mirror function?
Answer. The Simulator does not support the ROM mirror function. The ROM mirror function is made available by precopying CONST variables to RAM before debugging. Chapter 4 describes how to make the ROM mirror function available in the explanation of using the Simulator. See Section 4.2.4 Copy and Reference CONST Variables.
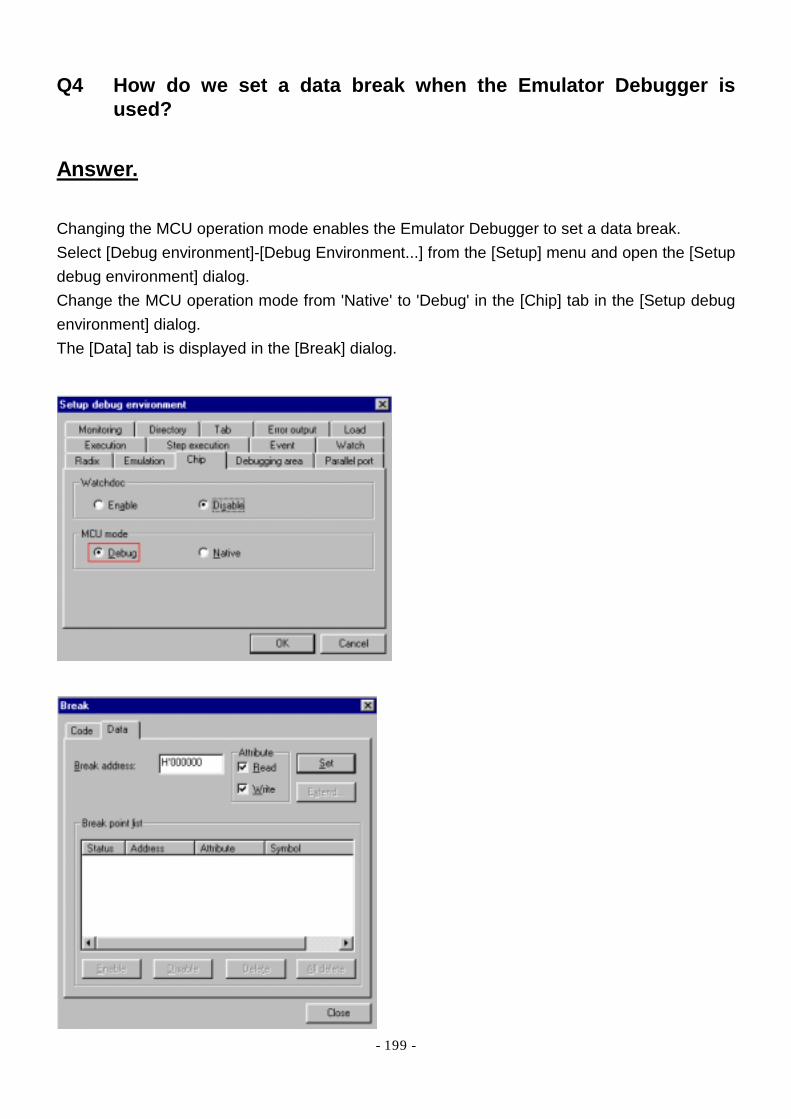
- 199 -
Q4 How do we set a data break when the Emulator Debugger is used?
Answer. Changing the MCU operation mode enables the Emulator Debugger to set a data break. Select [Debug environment]-[Debug Environment...] from the [Setup] menu and open the [Setup debug environment] dialog. Change the MCU operation mode from 'Native' to 'Debug' in the [Chip] tab in the [Setup debug environment] dialog. The [Data] tab is displayed in the [Break] dialog.
- 200 -
Q5 How do we set the path count of a breakpoint when the Emulator Debugger is used?
Answer. The method for setting the path count of a breakpoint described in Help (Softune Workbench Operation Manual - 4.6.4 Breakpoint) is enabled only in the Simulator mode. To enable this function in the Emulator, set the event and sequence in combination in the single trace mode. For the setting method, see Section 4.3.5 Sequential Break ([Setup sequence] dialog in (3)).

- 201 -
Q6 What should we do if the [Extend...] button in the [Break] dialog does not become active?
Answer. The [Extend...] button in the [Break] dialog becomes active only when the Emulator Debugger for the FR Family is used.
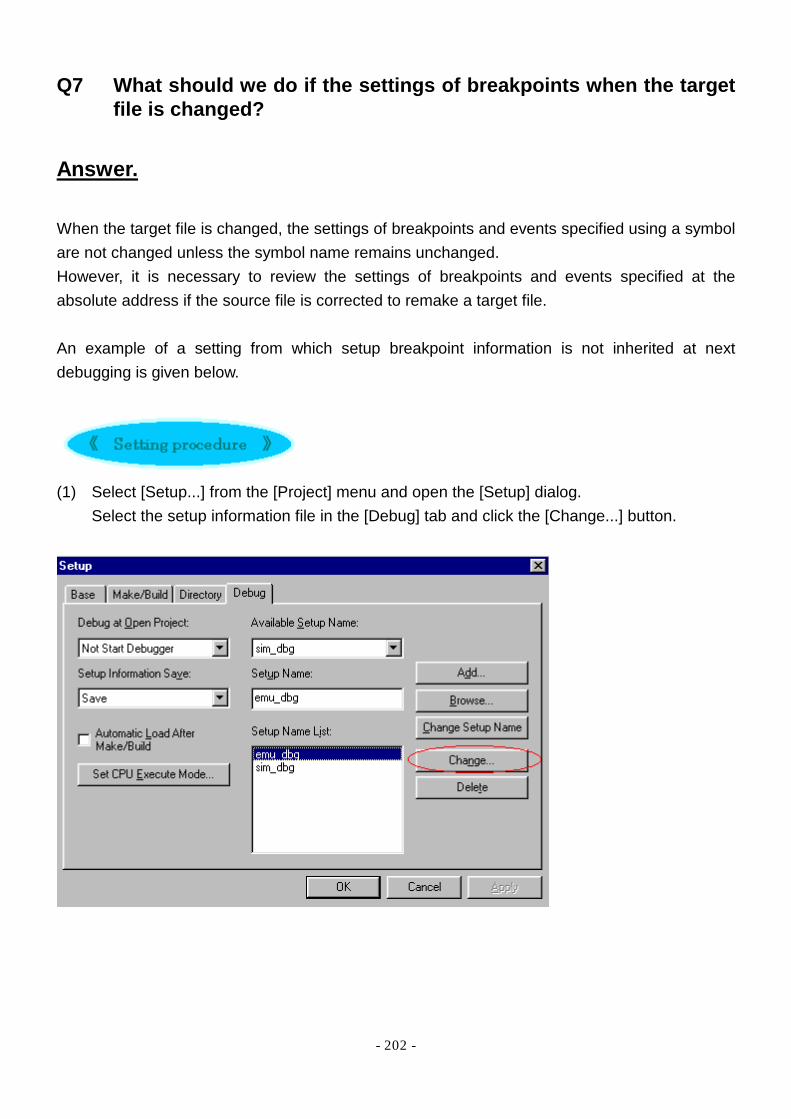
- 202 -
Q7 What should we do if the settings of breakpoints when the target file is changed?
Answer. When the target file is changed, the settings of breakpoints and events specified using a symbol are not changed unless the symbol name remains unchanged. However, it is necessary to review the settings of breakpoints and events specified at the absolute address if the source file is corrected to remake a target file. An example of a setting from which setup breakpoint information is not inherited at next debugging is given below.
(1) Select [Setup...] from the [Project] menu and open the [Setup] dialog.
Select the setup information file in the [Debug] tab and click the [Change...] button.
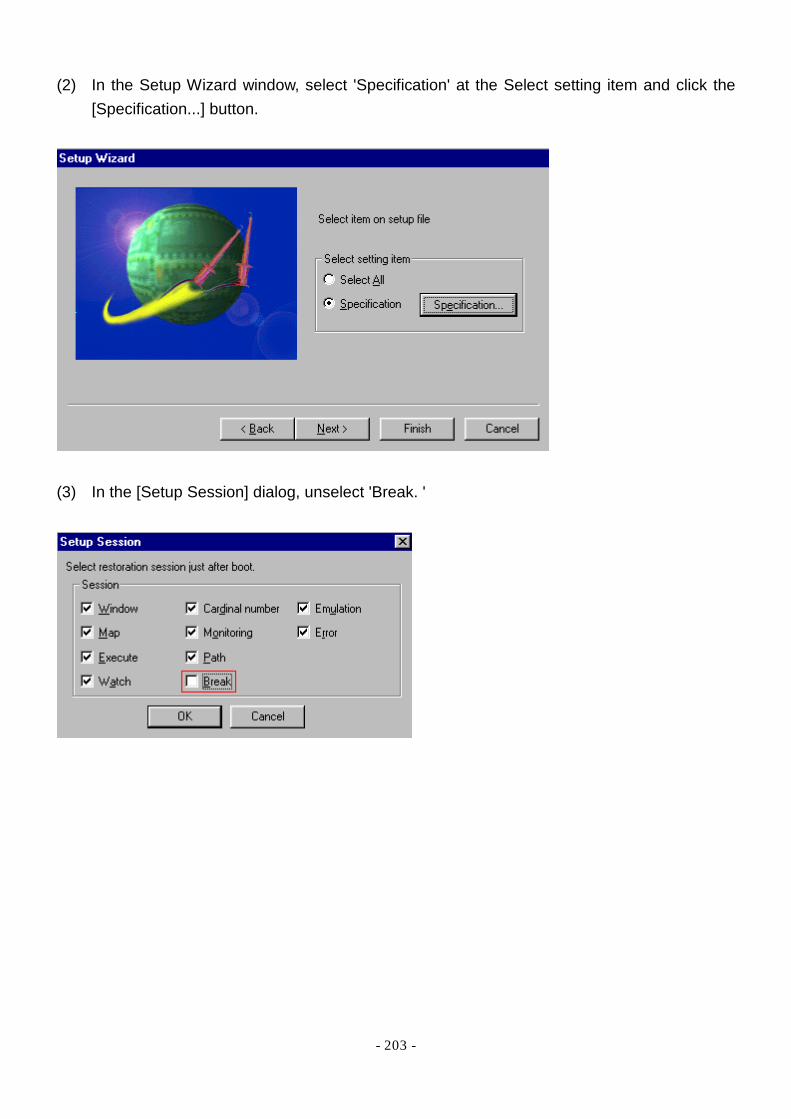
- 203 -
(2) In the Setup Wizard window, select 'Specification' at the Select setting item and click the [Specification...] button.
(3) In the [Setup Session] dialog, unselect 'Break. '

- 204 -
Q8 How do we save the trace result and evaluation result such as memory dump in a file?
Answer. To save the trace result, right-click the Trace window and select [Save...] from the shortcut menu. Specify the file name. Information in the Output and Command windows can be saved in the file. The procedure for logging information in the Command window and saving it in a file is given below.
(1) Select [Command] from the [View] menu and open the Command window.
Right-click the Command window and select [Logging]-[Start...] from the shortcut menu. The log file is created in the specified folder.
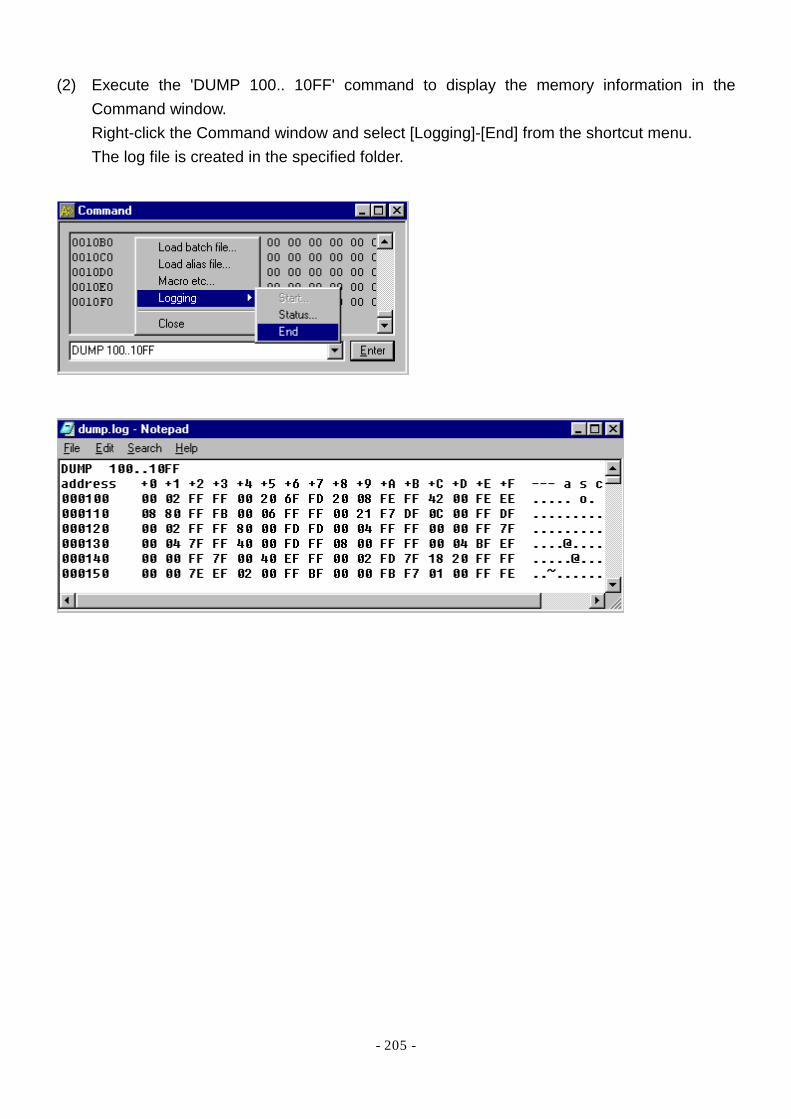
- 205 -
(2) Execute the 'DUMP 100.. 10FF' command to display the memory information in the Command window. Right-click the Command window and select [Logging]-[End] from the shortcut menu. The log file is created in the specified folder.
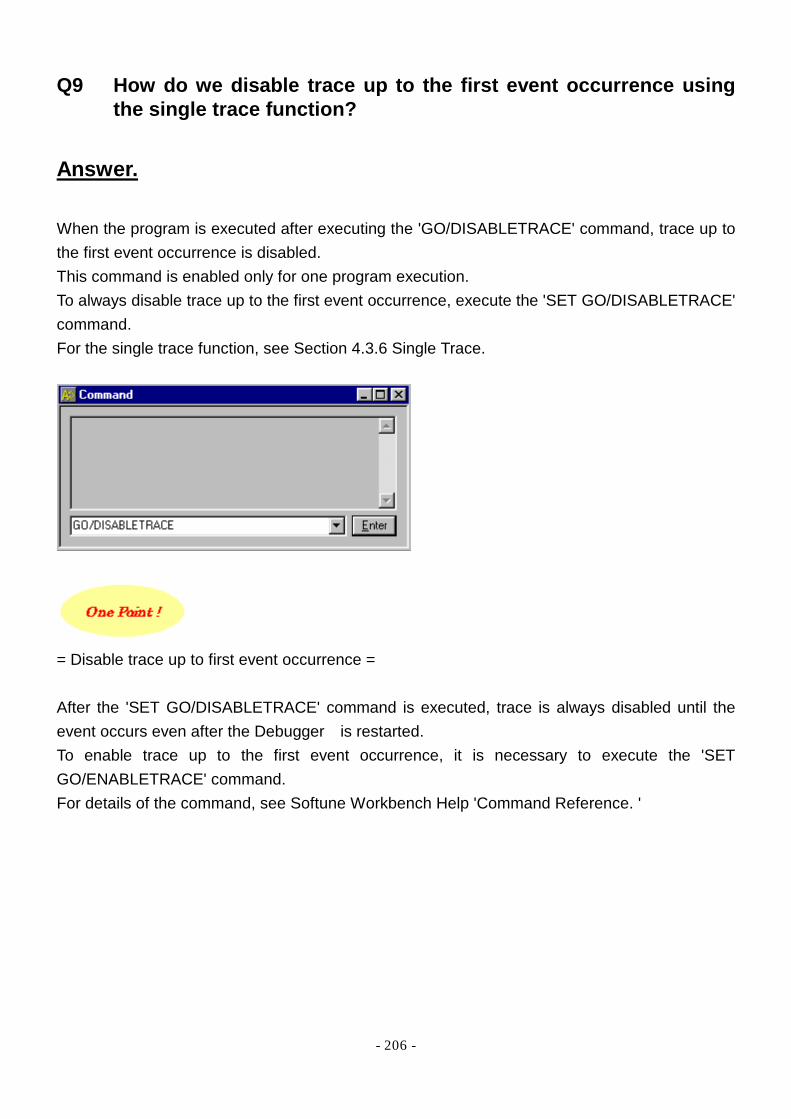
- 206 -
Q9 How do we disable trace up to the first event occurrence using the single trace function?
Answer. When the program is executed after executing the 'GO/DISABLETRACE' command, trace up to the first event occurrence is disabled. This command is enabled only for one program execution. To always disable trace up to the first event occurrence, execute the 'SET GO/DISABLETRACE' command. For the single trace function, see Section 4.3.6 Single Trace.
= Disable trace up to first event occurrence = After the 'SET GO/DISABLETRACE' command is executed, trace is always disabled until the event occurs even after the Debugger is restarted. To enable trace up to the first event occurrence, it is necessary to execute the 'SET GO/ENABLETRACE' command. For details of the command, see Softune Workbench Help 'Command Reference. '
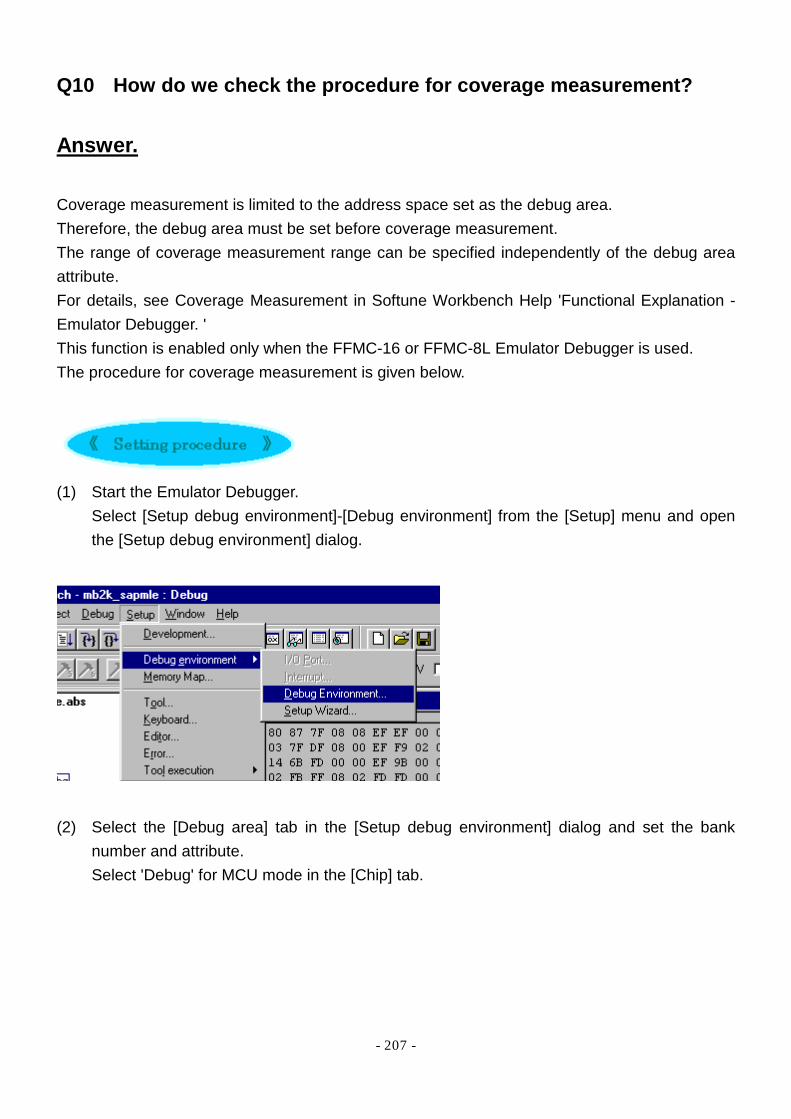
- 207 -
Q10 How do we check the procedure for coverage measurement?
Answer. Coverage measurement is limited to the address space set as the debug area. Therefore, the debug area must be set before coverage measurement. The range of coverage measurement range can be specified independently of the debug area attribute. For details, see Coverage Measurement in Softune Workbench Help 'Functional Explanation - Emulator Debugger. ' This function is enabled only when the FFMC-16 or FFMC-8L Emulator Debugger is used. The procedure for coverage measurement is given below.
(1) Start the Emulator Debugger.
Select [Setup debug environment]-[Debug environment] from the [Setup] menu and open the [Setup debug environment] dialog.
(2) Select the [Debug area] tab in the [Setup debug environment] dialog and set the bank
number and attribute. Select 'Debug' for MCU mode in the [Chip] tab.
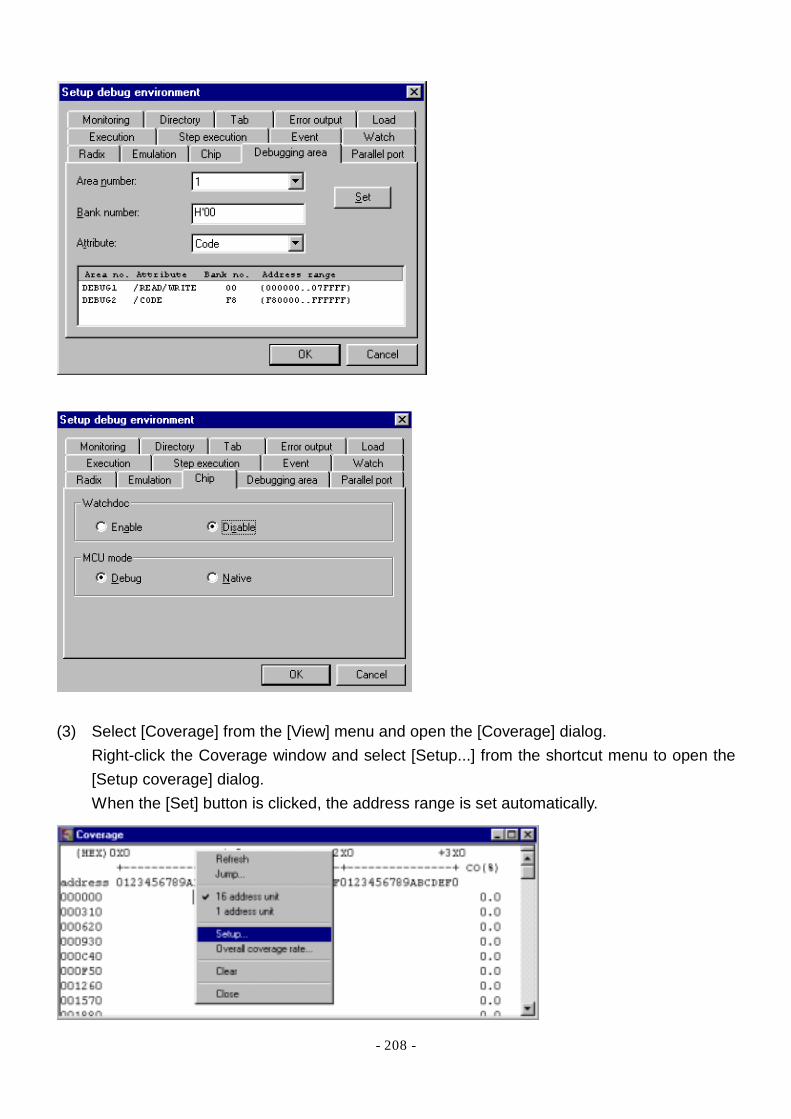
- 208 -
(3) Select [Coverage] from the [View] menu and open the [Coverage] dialog.
Right-click the Coverage window and select [Setup...] from the shortcut menu to open the [Setup coverage] dialog. When the [Set] button is clicked, the address range is set automatically.
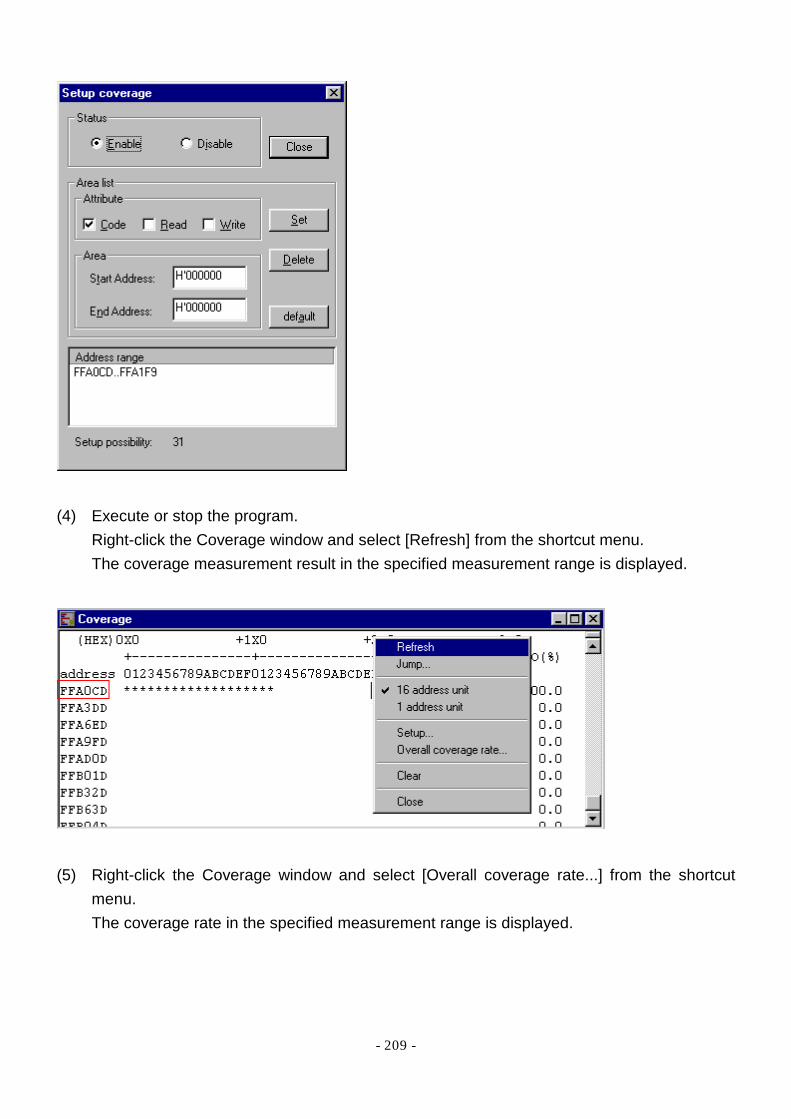
- 209 -
(4) Execute or stop the program.
Right-click the Coverage window and select [Refresh] from the shortcut menu. The coverage measurement result in the specified measurement range is displayed.
(5) Right-click the Coverage window and select [Overall coverage rate...] from the shortcut
menu. The coverage rate in the specified measurement range is displayed.
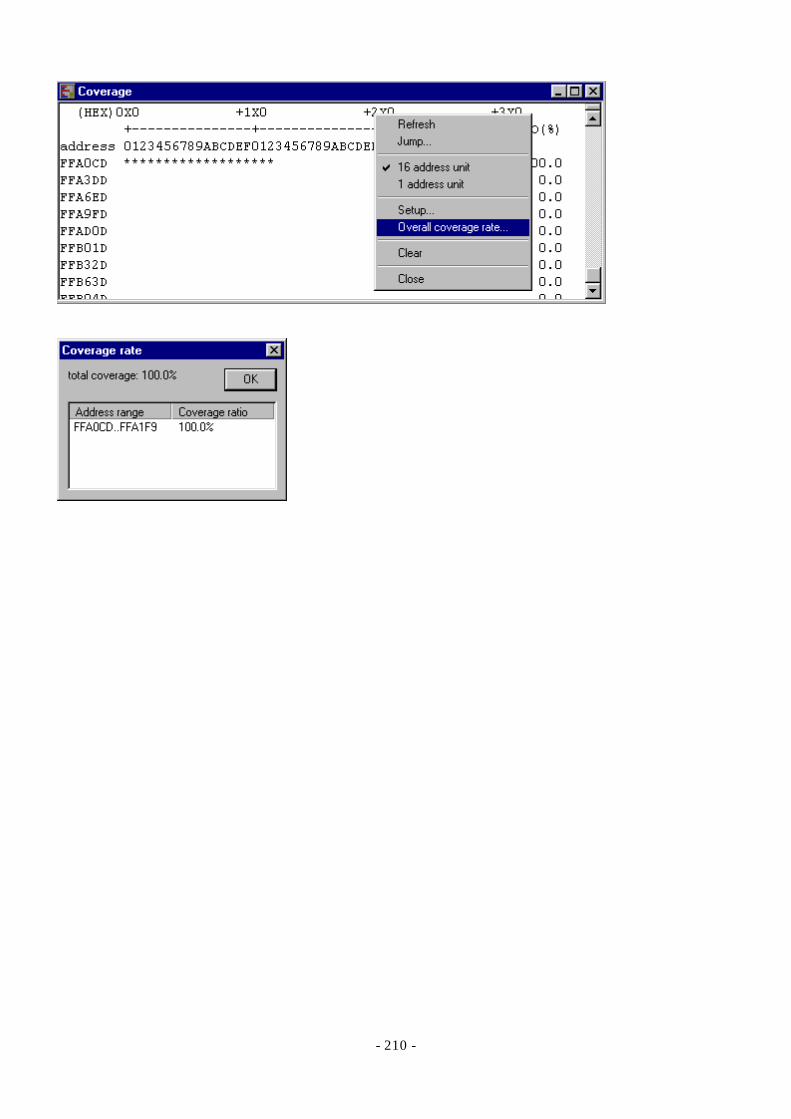
- 210 -
- 211 -
Q1 How do we check the version of Softune Workbench and each language tool?
Answer. The installation manual can be checked for the version of the Softune tool. Select the installation manual for each tool from [Program]-[SoftuneV3]-[Readme] in the Windows start menu and check each version. The version of the following tools can be checked using [Version Information] in the [Help] menu:
• Softune Workbench • C Checker • C Analyzer • Softune REALOS Analyzer
For the language tools such as the Compiler and assembler pack, version information can be displayed in the Softune Workbench Output window by making the following setting.
(1) Select [Setup Tool Option...] from the [Project] menu and open the [Setup Tool Option]
dialog. Select the tab corresponding to the language tool version to be checked and put a mark in the 'Output start message' checkbox.
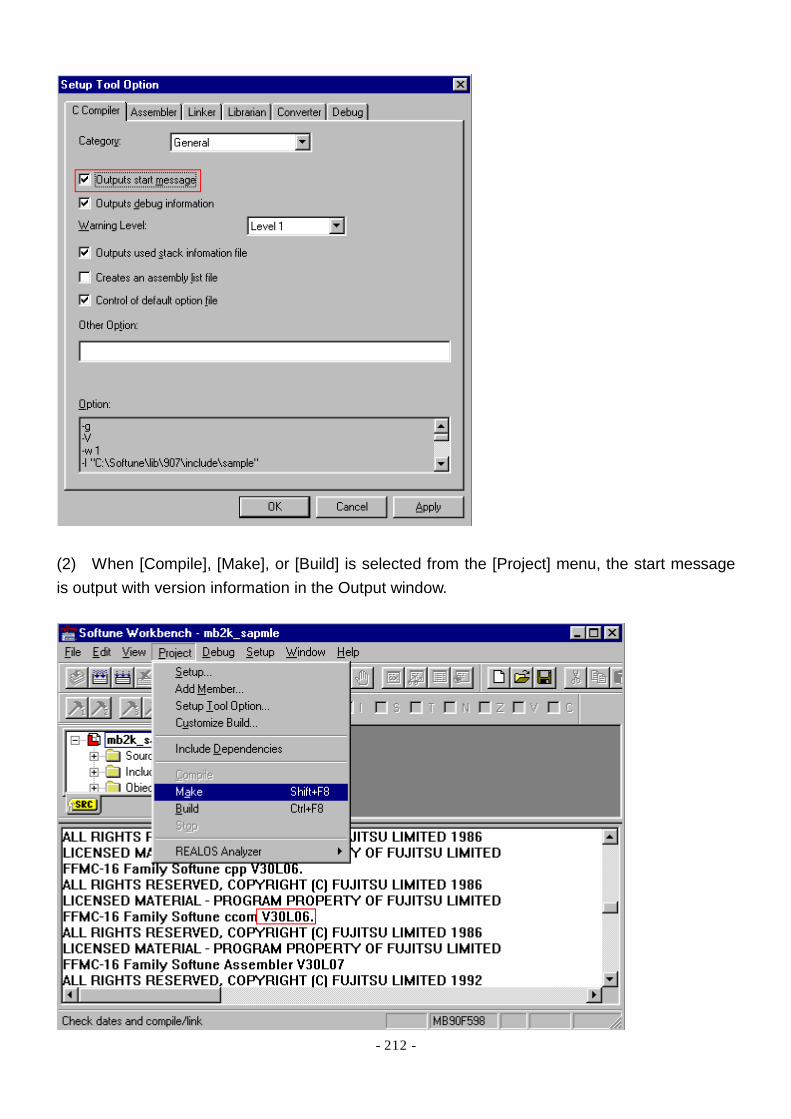
- 212 -
(2) When [Compile], [Make], or [Build] is selected from the [Project] menu, the start message is output with version information in the Output window.

- 213 -
Q2 How do we change the size of the font displayed in each Softune Workbench window?
Answer. The font size can be changed as follows:
(1) Select [Font...] from the [View] menu and open the [Set Font] dialog.
(2) Select the window to be changed and click the [Font...] button.
The font and size are changed in the [Set Font] dialog. Only the Edit and Output windows can be changed when not in the debug mode.
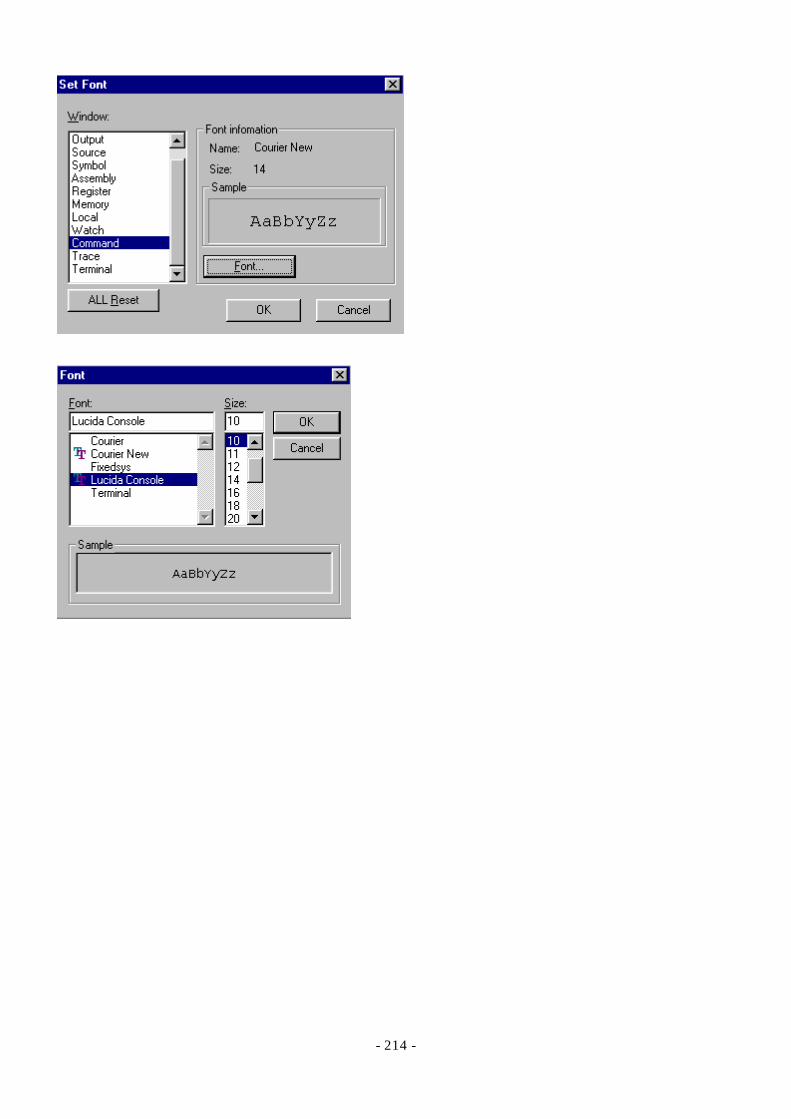
- 214 -
- 215 -
Q3 How do we retrieve a file displayed in the Softune Workbench project window?
Answer. When the name (alphabetic) of the file to be retrieved is input from the keyboard with focus on any place on the Project window, focus moves to the retrieved file. Note that the files in closed folders cannot be retrieved. An example of retrieving is given below.

- 216 -
Q4 How do we check details of the sample I/O register file?
Answer. The Sample I/O Register Files USERS MANUAL is opened when [Program]-[SoftuneV3]- [Sample I/O Register Files USERS MANUAL] is selected from the Windows start menu. Refer to this manual.

- 217 -
Q5 How do we change the record length of Motorola S format data?
Answer. The default length of one data record in Motorola S format created by the load module converter is fixed at 16 bytes. To change the length, use the '-len' option for the S format adjuster. For the method for setting the S format adjuster, see Section 5.1 Set External Tool. An example of the option that is added when the S format adjuster is started is given below.

- 218 -
Q6 How do we check the cautions in using the assembler in C?
Answer. The accumulator may be used without restrictions but the general-purpose registers should be saved by the programmer. For details, see Softune Workbench Help 'Softune C Compiler 5.1 Assembler Description Function. '