interactive debugging for extensible languages in...
TRANSCRIPT
Interactive Debugging for Extensible Languages inMulti-Stage Transformation Environments
Domenik Pavleticitemis AG
Stuttgart, [email protected]
Kim HaßlbauerStuttgart, Germany
Abstract—Extensible languages have a base language thatcan be extended incrementally with new language extensions,forming a stack with high-level languages on top and lower levellanguages at the bottom. Programs written with these languagesare usually a mixture of code using base language and severallanguage extensions. These extensions come with generators thattranslate higher level language constructs to lower levels andultimately to base language. Program bugs appearing at runtimecan be introduced on the source level by language users orthrough faulty transformation rules by language engineers. Thelatter category of bugs are often analyzed with a base languagedebugger, because language constructs introducing the bug onintermediate levels usually have no representation on the sourcelevel. However, due to the semantic gap between generated codeand the intermediate program where a bug is introduced, usershave to map between abstraction levels manually, which is errorprone and requires additional effort besides analyzing the bug.
In this paper we present an approach to build multi-leveldebuggers for extensible languages that allow language users todebug their code on the source level and language engineers todebug on intermediate levels created during code generation. Weillustrate this approach with an implementation for the MPSlanguage workbench and mbeddr C, an extensible C language.
Index Terms—Formal languages, Software debugging.
I. INTRODUCTION
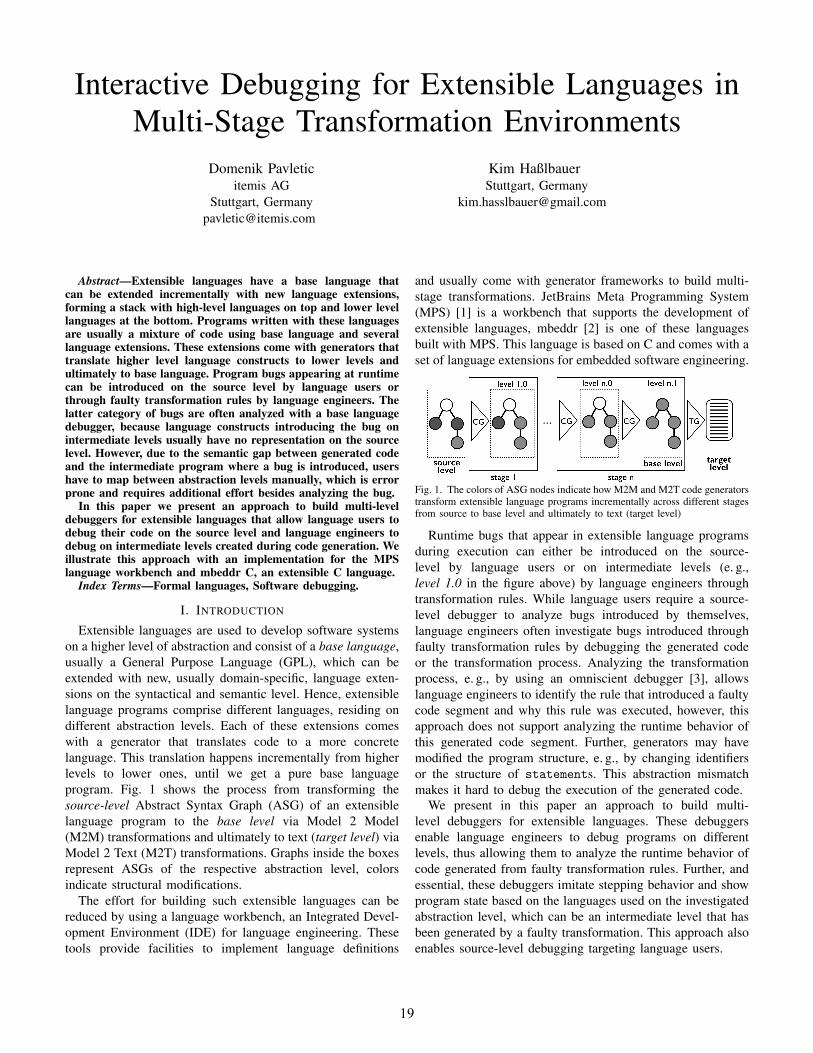
Extensible languages are used to develop software systemson a higher level of abstraction and consist of a base language,usually a General Purpose Language (GPL), which can beextended with new, usually domain-specific, language exten-sions on the syntactical and semantic level. Hence, extensiblelanguage programs comprise different languages, residing ondifferent abstraction levels. Each of these extensions comeswith a generator that translates code to a more concretelanguage. This translation happens incrementally from higherlevels to lower ones, until we get a pure base languageprogram. Fig. 1 shows the process from transforming thesource-level Abstract Syntax Graph (ASG) of an extensiblelanguage program to the base level via Model 2 Model(M2M) transformations and ultimately to text (target level) viaModel 2 Text (M2T) transformations. Graphs inside the boxesrepresent ASGs of the respective abstraction level, colorsindicate structural modifications.
The effort for building such extensible languages can bereduced by using a language workbench, an Integrated Devel-opment Environment (IDE) for language engineering. Thesetools provide facilities to implement language definitions
and usually come with generator frameworks to build multi-stage transformations. JetBrains Meta Programming System(MPS) [1] is a workbench that supports the development ofextensible languages, mbeddr [2] is one of these languagesbuilt with MPS. This language is based on C and comes with aset of language extensions for embedded software engineering.
Fig. 1. The colors of ASG nodes indicate how M2M and M2T code generatorstransform extensible language programs incrementally across different stagesfrom source to base level and ultimately to text (target level)
Runtime bugs that appear in extensible language programsduring execution can either be introduced on the source-level by language users or on intermediate levels (e. g.,level 1.0 in the figure above) by language engineers throughtransformation rules. While language users require a source-level debugger to analyze bugs introduced by themselves,language engineers often investigate bugs introduced throughfaulty transformation rules by debugging the generated codeor the transformation process. Analyzing the transformationprocess, e. g., by using an omniscient debugger [3], allowslanguage engineers to identify the rule that introduced a faultycode segment and why this rule was executed, however, thisapproach does not support analyzing the runtime behavior ofthis generated code segment. Further, generators may havemodified the program structure, e. g., by changing identifiersor the structure of statements. This abstraction mismatchmakes it hard to debug the execution of the generated code.
We present in this paper an approach to build multi-level debuggers for extensible languages. These debuggersenable language engineers to debug programs on differentlevels, thus allowing them to analyze the runtime behavior ofcode generated from faulty transformation rules. Further, andessential, these debuggers imitate stepping behavior and showprogram state based on the languages used on the investigatedabstraction level, which can be an intermediate level that hasbeen generated by a faulty transformation. This approach alsoenables source-level debugging targeting language users.
19
II. DEBUGGING EXTENSIBLE LANGUAGES
Interactive debuggers allow users to inspect and animate theexecution of a program. These debuggers usually operate onthe source level and provide, depending on the actual tool,different functionalities: users can put breakpoints on sourcelines or memory addresses. Further, they can use steppingcommands to animate the execution and inspect the programstate. Some debuggers even allow users to manipulate valuesof watch variables or interpret arbitrary expressions.
Programming languages usually support source-level de-bugging, as multi-level debugging makes little sense in thiscontext: first, these languages are usually not extensible andget transformed to the target language, via a single interme-diate language. Debugging intermediate levels is not useful tolanguage users or compiler engineers, as this code is usuallysimilar to the target level representation. Second, languageusers are often not familiar with the underlying target language(e. g., assembler). They rather consider the compiler as ablack box that is configurable via parameters. With extensiblelanguages, the situation is different: while extensions have acommon base language, they can be stacked in an arbitraryhierarchical way. That is, new language extensions can behooked into the generation process. This flexibility increasesthe complexity and the possibility for introducing bugs intothe program through faulty transformations. As described atthe end of the section above, bugs introduced by languageusers can be analyzed with a source-level debugger, whileother bugs introduced by faulty transformations are harder toanalyze. To support both categories of users we propose multi-level debugging that enables inspecting the program state andcontrolling execution on different abstraction levels.
To illustrate the usage of multi-level debuggers we consideran example language extension for mbeddr: we introduce anloop abstraction for C that allows users to specify iterationswith lower and upper boundaries. To test the generator ofthis language abstraction, we start by writing a testcase(an mbeddr extension). Listing 1 below shows the test code:a main function invokes the testcase sumTesting, via atest expression. This testcase uses the loop to addup numbers from 0 to 10 in a variable sum. Finally, anassert statement verifies that the value of sum equals 55.If the assertion fails, the process returns a positive number,representing the number of failed assertions.1 testcase sumTesting {2 int32 sum = 0;3 loop [0 to 10] {4 sum += it;5 }
6 assert sum == 55;7 }8 int32 main() {9 return test[sumTesting];
10 }
Listing 1. Testing the loop generator
Looking at the code shown in Listing 1 and considering thesemantics of our loop, the test should succeed. However, itfails with a return code 1 indicating a failed assertion. Supposewe have an interactive source-level debugger that allows us todebug Listing 1. By using this debugger we can see that theloop body is never reached. Instead, execution jumps directlyto the assert from the loop header. Since we cannot detect
the reason for this behavior on the source level, we are forcedto use the base language debugger with the generated codeshown in Listing 2. A starting point could be to locate thesource lines representing our loop. Since our generated codeonly contains one while, this is trivial. In more complexscenarios, this would require additional effort.1 int __testcases2323() {2 int __failures = 0;3 { int sum = 0;4 { int __index = 10;5 while(__index <= 0) {6 sum += __index;7 __index++;8 }9 }
10 if(!(sum == 55)) {11 __failures++;12 }13 }14 return __failures;15 }16 void main() {17 return __testcases2323();18 }
Listing 2. Generated code for testing the loop statement
As we can see on line number 4 and 5 in Listing 2, theinitialization of the lower and upper bound was accidentallyswapped by the code generator. Therefore the while conditionnever evaluates to true and the loop body is not entered. Thisis exactly the behavior we experienced when debugging on thesource level. After identifying the bug, we can fix the problemin the generator first. Afterwards, knowing which programlocation caused the error, we can use a multi-level debugger todebug on the intermediate level where the loop is reduced, butall other abstractions are still present (see Listing 3). This way,we can verify the bug fix we have made in the generator andconcentrate on the reduced loop while debugging, ignoringirrelevant, generated details.1 testcase sumTesting {2 int sum = 0;3 { int __index = 0;4 while(__index <= 10) {5 sum += __index;6 }
7 }8 assert sum == 55;9 }
10 int32 main() {11 return test[sumTesting];12 }
Listing 3. Intermediate code used for debugging the loop
In the context of extensible languages we believe multi-leveldebuggers support language engineers in the language imple-mentation and maintenance phase. Further, we believe source-level debuggers targeting users of these languages should bebuilt in a way to support multi-level debugging as well. Thatis, program state and stepping behavior should be lifted incre-mentally from base to source level, considering all programmodifications made by transformation rules in between. Incontrast, debuggers for extensible languages operating directlybetween source and target level have limitations [4]. First, theyusually cannot support multiple generators per language andmultiple transformation rules per language construct. Second,since they depend on the structure of the generated code,modifying a code generator usually implies updating thedebugger implementation.
III. THE MULDER FRAMEWORK
The Multi-Level Debugger (MuLDer) framework presentedin this paper is based on an incremental approach liftingprogram state from the target level to the currently investigatedabstraction level. To describe debugging semantics, debuggerdevelopers associate language constructs with debug semanticsand specify rules in M2M and M2T transformations to lift the
20
program state from the generated level back to the originallevel. These rules annotate the generated code, but do not influ-ence its semantics. They specify how the debugger should liftthe lower level program state and get processed incrementallyfrom target level to the currently investigated abstraction level.Further, to imitate stepping behavior, the framework providestwo approaches: a control-flow based approach using target-level breakpoints and a single-stepping based approach usingsingle-stepping functionality of an underlying GPL debugger.
A. Architecture
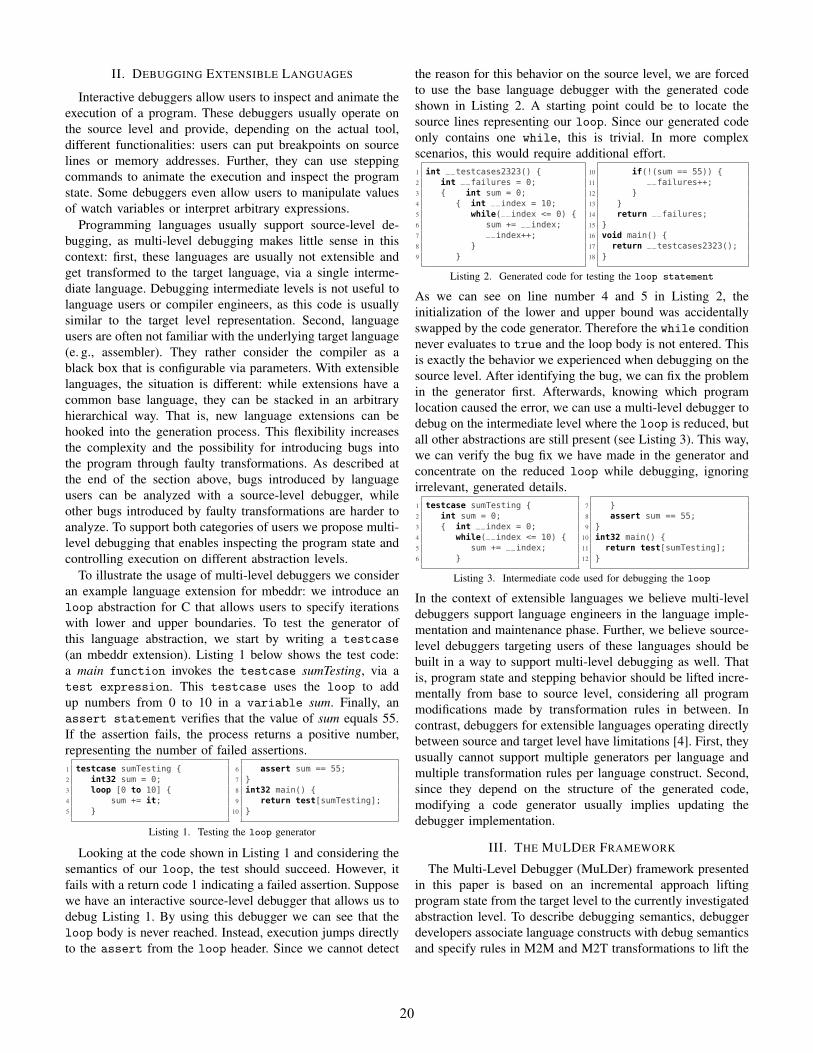
Fig. 2 illustrates with a Unified Modeling Language (UML)component diagram the software components that make upthe framework architecture. Grey colored software compo-nents and interfaces describe functionality required from thelanguage workbench (MPS in our reference implementation).They comprise the following parts: ASG access via IASG,possibility to retrieve control-flow information for a givenprogram that we require for imitating stepping behavior viaIControlFlowProvider, adding preference pages to configuredebugging via IPreferences and contribution of User Interface(UI) components, e. g., a debugger view, via IUIContribution.
Fig. 2. UML component diagram showing the MuLDer software architecture
White colored boxes represent abstractions, languages,components and interfaces from MuLDer. Both ProgramState Abstractions & Specification and Execution ControlAbstractions & Specification contain language abstractions andspecification languages used to describe program state lifting,stepping behavior and translation of breakpoints. Following,Program Annotator operates on these language abstractionsand accesses via IASG the ASG to automatically attach liftingrules to ASG nodes (discussed later). Next, Debug Preferencescontributes via IPreferences and IUIContribution preferencepages to the language workbench. It also provides a UI tomanage these preferences, comprising options for defining thecurrently selected stepping algorithm and configuring visibledebug information, e. g., lifting rules, in ASGs. Further, Step-ping Processor operates on the Execution Control Abstractionsand provides via IStepper an interface to imitate steppingcommands by using the currently selected stepping algorithm.This component requires the interface ITLDebugger to invoketarget-level stepping commands, used by the single-steppingalgorithm, and to manage breakpoints, required by our control-flow based stepping algorithms. Stepping Processor requiresfor some of its algorithms the program state being accessedfrom Call Stack Unwinder via IPState, access to the ASG via
IASG and control-flow information being retrieved from ICon-trolFlowProvider. However, the latter is only required by thecontrol-flow related stepping algorithms. Next, the call stack islifted by Call Stack Unwinder, which operates on the ProgramState Abstractions and requires ASG access via IASG, theincrementally lifted base-level program state obtained via IBL-ProgramState, tracing information being accessed via ITracesand the lifted watch variables provided by Watch VariablesLifter via IWatchLifter. The previously described Multi-LevelTracer maintains tracing information describing how ASGnodes are translated across all abstraction levels and providesaccess to this information via ITraces. Finally, Watch VariablesLifter lifts lower level watch variables and their associatedvalues based on the program state abstractions.
B. Language Abstractions
MuLDer provides a set of abstractions represented by inter-faces to specify debugging semantics of language constructs.Debugger developers implement these interfaces by creating aset of queries using a language extension for Base Language(an extensible Java coming with MPS). We do not describethese queries in detail, instead, we discuss those being requiredby our case study in Section IV. The following list containsall abstractions coming with MuLDer: Steppable lives insidea Steppable Composite (e. g., statement list) and is alanguage construct comparable to statement on which wecan invoke a stepping command. Next, Callable representsa reusable code fragment similar to function and can beinvoked from other program locations via a Callable Call(e. g., function call). Control Flow Provider is a Callableand provides control-flow information for the contained code.Watch Providers contribute watch variables to the debuggerview and are usually represented by variables. They arecontained in a nestable Scope Provider (e. g., statementlist) and resolve their value by a Value Provider, e. g., thetype of the variable.
C. Value Contracts
Value Contracts define default value lifting rules and thestructure of watch variable values that Value Providers con-tribute. While the structure is used for writing formal ValueTransformations (discussed later), we use the rule to lift low-level watch variable values for which the generated (leveln) and origin Value Provider (level n-1) are the same. TheProgram Annotator (see Section III-A) is responsible for at-taching these rules to intermediate ASGs after code generation.Consider we use a base language type (a Value Provider) inour program that is simply translated to text and not modifiedby any of the code generators. This is one example where theProgram Annotator would attach the default value lifting ruleof this type to instances of each level, where the input nodeof a type is the same type.
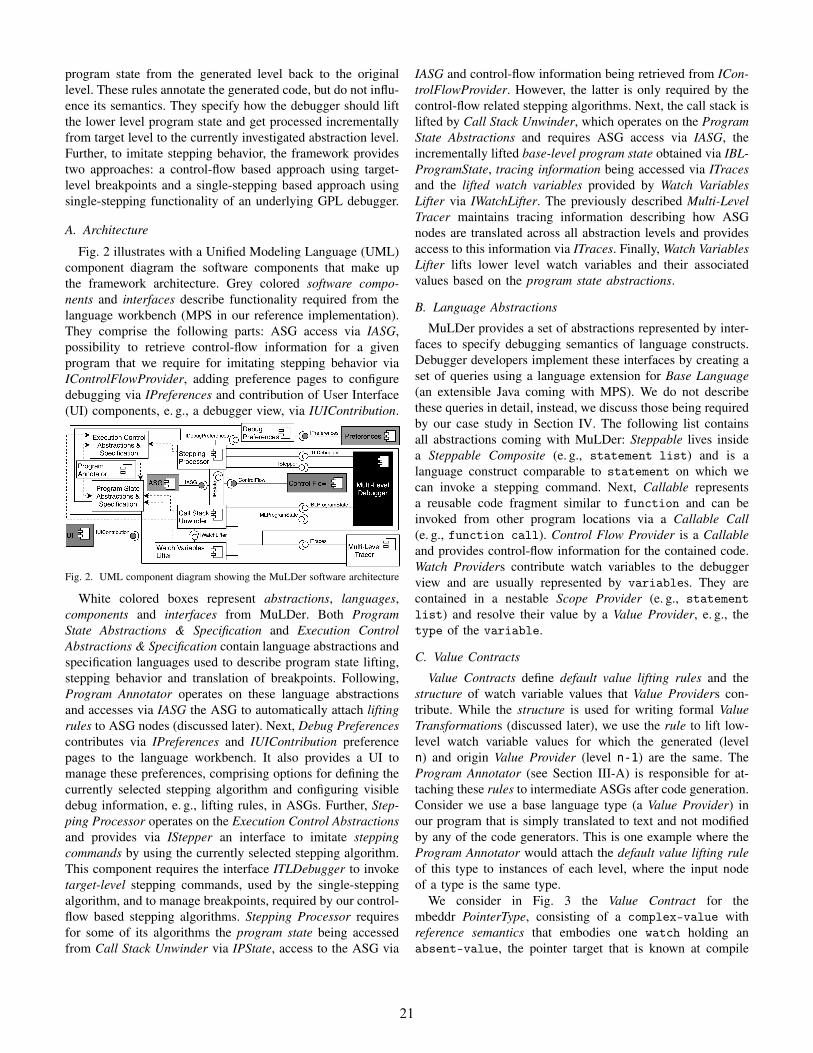
We consider in Fig. 3 the Value Contract for thembeddr PointerType, consisting of a complex-value withreference semantics that embodies one watch holding anabsent-value, the pointer target that is known at compile
21
time (e. g., an int type). The code snippet in the box belowshows the implementation of the default value lifting rule forcomplex-value, other parts, e. g., for absent-value, arenot shown. In this rule, we use a Domain-Specific Language(DSL) to return the textual presentation of the watchvariable value. However, as seen in the code completion menu,we can also access other value properties, e. g., subvalue(s),because we have defined the value to be a complex-valueand isNull as the value has reference semantics (*->).
Fig. 3. Value Contract for the mbeddr PointerType
D. Value Transformations
Value Transformations operate on Value Contracts anddescribe transformations of watch variable values being as-sociated with different Value Providers. To implement suchtransformations, developers specify the structure of a sourceand target watch and annotate the latter with lifting rules usedto construct the lifted value.
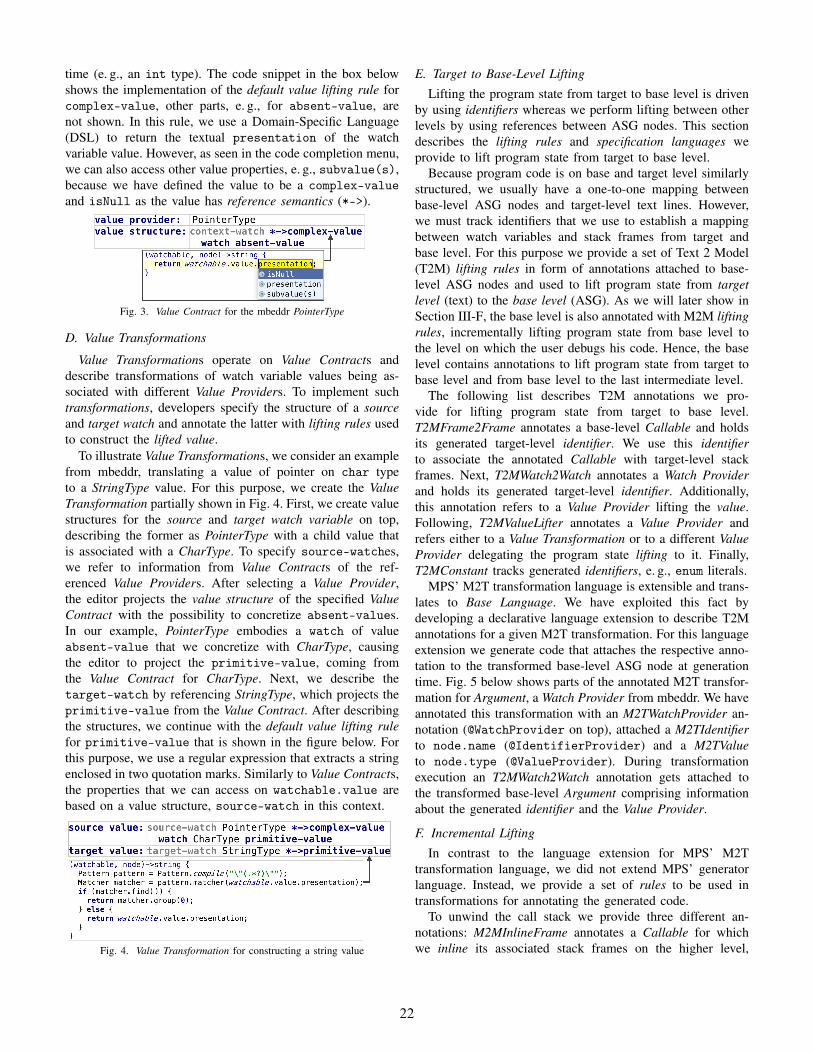
To illustrate Value Transformations, we consider an examplefrom mbeddr, translating a value of pointer on char typeto a StringType value. For this purpose, we create the ValueTransformation partially shown in Fig. 4. First, we create valuestructures for the source and target watch variable on top,describing the former as PointerType with a child value thatis associated with a CharType. To specify source-watches,we refer to information from Value Contracts of the ref-erenced Value Providers. After selecting a Value Provider,the editor projects the value structure of the specified ValueContract with the possibility to concretize absent-values.In our example, PointerType embodies a watch of valueabsent-value that we concretize with CharType, causingthe editor to project the primitive-value, coming fromthe Value Contract for CharType. Next, we describe thetarget-watch by referencing StringType, which projects theprimitive-value from the Value Contract. After describingthe structures, we continue with the default value lifting rulefor primitive-value that is shown in the figure below. Forthis purpose, we use a regular expression that extracts a stringenclosed in two quotation marks. Similarly to Value Contracts,the properties that we can access on watchable.value arebased on a value structure, source-watch in this context.
Fig. 4. Value Transformation for constructing a string value
E. Target to Base-Level Lifting
Lifting the program state from target to base level is drivenby using identifiers whereas we perform lifting between otherlevels by using references between ASG nodes. This sectiondescribes the lifting rules and specification languages weprovide to lift program state from target to base level.
Because program code is on base and target level similarlystructured, we usually have a one-to-one mapping betweenbase-level ASG nodes and target-level text lines. However,we must track identifiers that we use to establish a mappingbetween watch variables and stack frames from target andbase level. For this purpose we provide a set of Text 2 Model(T2M) lifting rules in form of annotations attached to base-level ASG nodes and used to lift program state from targetlevel (text) to the base level (ASG). As we will later show inSection III-F, the base level is also annotated with M2M liftingrules, incrementally lifting program state from base level tothe level on which the user debugs his code. Hence, the baselevel contains annotations to lift program state from target tobase level and from base level to the last intermediate level.
The following list describes T2M annotations we pro-vide for lifting program state from target to base level.T2MFrame2Frame annotates a base-level Callable and holdsits generated target-level identifier. We use this identifierto associate the annotated Callable with target-level stackframes. Next, T2MWatch2Watch annotates a Watch Providerand holds its generated target-level identifier. Additionally,this annotation refers to a Value Provider lifting the value.Following, T2MValueLifter annotates a Value Provider andrefers either to a Value Transformation or to a different ValueProvider delegating the program state lifting to it. Finally,T2MConstant tracks generated identifiers, e. g., enum literals.
MPS’ M2T transformation language is extensible and trans-lates to Base Language. We have exploited this fact bydeveloping a declarative language extension to describe T2Mannotations for a given M2T transformation. For this languageextension we generate code that attaches the respective anno-tation to the transformed base-level ASG node at generationtime. Fig. 5 below shows parts of the annotated M2T transfor-mation for Argument, a Watch Provider from mbeddr. We haveannotated this transformation with an M2TWatchProvider an-notation (@WatchProvider on top), attached a M2TIdentifierto node.name (@IdentifierProvider) and a M2TValueto node.type (@ValueProvider). During transformationexecution an T2MWatch2Watch annotation gets attached tothe transformed base-level Argument comprising informationabout the generated identifier and the Value Provider.
F. Incremental Lifting
In contrast to the language extension for MPS’ M2Ttransformation language, we did not extend MPS’ generatorlanguage. Instead, we provide a set of rules to be used intransformations for annotating the generated code.
To unwind the call stack we provide three different an-notations: M2MInlineFrame annotates a Callable for whichwe inline its associated stack frames on the higher level,
22
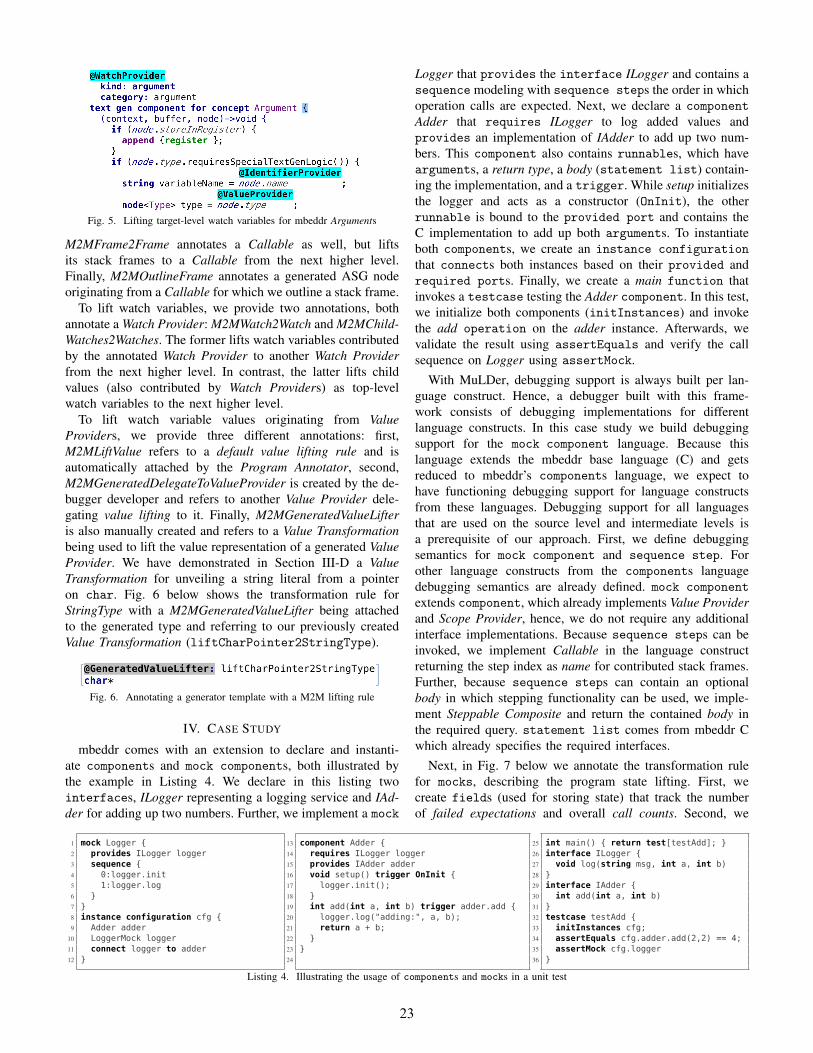
Fig. 5. Lifting target-level watch variables for mbeddr Arguments
M2MFrame2Frame annotates a Callable as well, but liftsits stack frames to a Callable from the next higher level.Finally, M2MOutlineFrame annotates a generated ASG nodeoriginating from a Callable for which we outline a stack frame.
To lift watch variables, we provide two annotations, bothannotate a Watch Provider: M2MWatch2Watch and M2MChild-Watches2Watches. The former lifts watch variables contributedby the annotated Watch Provider to another Watch Providerfrom the next higher level. In contrast, the latter lifts childvalues (also contributed by Watch Providers) as top-levelwatch variables to the next higher level.
To lift watch variable values originating from ValueProviders, we provide three different annotations: first,M2MLiftValue refers to a default value lifting rule and isautomatically attached by the Program Annotator, second,M2MGeneratedDelegateToValueProvider is created by the de-bugger developer and refers to another Value Provider dele-gating value lifting to it. Finally, M2MGeneratedValueLifteris also manually created and refers to a Value Transformationbeing used to lift the value representation of a generated ValueProvider. We have demonstrated in Section III-D a ValueTransformation for unveiling a string literal from a pointeron char. Fig. 6 below shows the transformation rule forStringType with a M2MGeneratedValueLifter being attachedto the generated type and referring to our previously createdValue Transformation (liftCharPointer2StringType).
Fig. 6. Annotating a generator template with a M2M lifting rule
IV. CASE STUDY
mbeddr comes with an extension to declare and instanti-ate components and mock components, both illustrated bythe example in Listing 4. We declare in this listing twointerfaces, ILogger representing a logging service and IAd-der for adding up two numbers. Further, we implement a mock
Logger that provides the interface ILogger and contains asequence modeling with sequence steps the order in whichoperation calls are expected. Next, we declare a componentAdder that requires ILogger to log added values andprovides an implementation of IAdder to add up two num-bers. This component also contains runnables, which havearguments, a return type, a body (statement list) contain-ing the implementation, and a trigger. While setup initializesthe logger and acts as a constructor (OnInit), the otherrunnable is bound to the provided port and contains theC implementation to add up both arguments. To instantiateboth components, we create an instance configurationthat connects both instances based on their provided andrequired ports. Finally, we create a main function thatinvokes a testcase testing the Adder component. In this test,we initialize both components (initInstances) and invokethe add operation on the adder instance. Afterwards, wevalidate the result using assertEquals and verify the callsequence on Logger using assertMock.
With MuLDer, debugging support is always built per lan-guage construct. Hence, a debugger built with this frame-work consists of debugging implementations for differentlanguage constructs. In this case study we build debuggingsupport for the mock component language. Because thislanguage extends the mbeddr base language (C) and getsreduced to mbeddr’s components language, we expect tohave functioning debugging support for language constructsfrom these languages. Debugging support for all languagesthat are used on the source level and intermediate levels isa prerequisite of our approach. First, we define debuggingsemantics for mock component and sequence step. Forother language constructs from the components languagedebugging semantics are already defined. mock componentextends component, which already implements Value Providerand Scope Provider, hence, we do not require any additionalinterface implementations. Because sequence steps can beinvoked, we implement Callable in the language constructreturning the step index as name for contributed stack frames.Further, because sequence steps can contain an optionalbody in which stepping functionality can be used, we imple-ment Steppable Composite and return the contained body inthe required query. statement list comes from mbeddr Cwhich already specifies the required interfaces.
Next, in Fig. 7 below we annotate the transformation rulefor mocks, describing the program state lifting. First, wecreate fields (used for storing state) that track the numberof failed expectations and overall call counts. Second, we
1 mock Logger {2 provides ILogger logger3 sequence {4 0:logger.init5 1:logger.log6 }7 }8 instance configuration cfg {9 Adder adder
10 LoggerMock logger11 connect logger to adder12 }
13 component Adder {14 requires ILogger logger15 provides IAdder adder16 void setup() trigger OnInit {17 logger.init();18 }19 int add(int a, int b) trigger adder.add {20 logger.log("adding:", a, b);21 return a + b;22 }23 }24
25 int main() { return test[testAdd]; }26 interface ILogger {27 void log(string msg, int a, int b)28 }29 interface IAdder {30 int add(int a, int b)31 }32 testcase testAdd {33 initInstances cfg;34 assertEquals cfg.adder.add(2,2) == 4;35 assertMock cfg.logger36 }
Listing 4. Illustrating the usage of components and mocks in a unit test
23
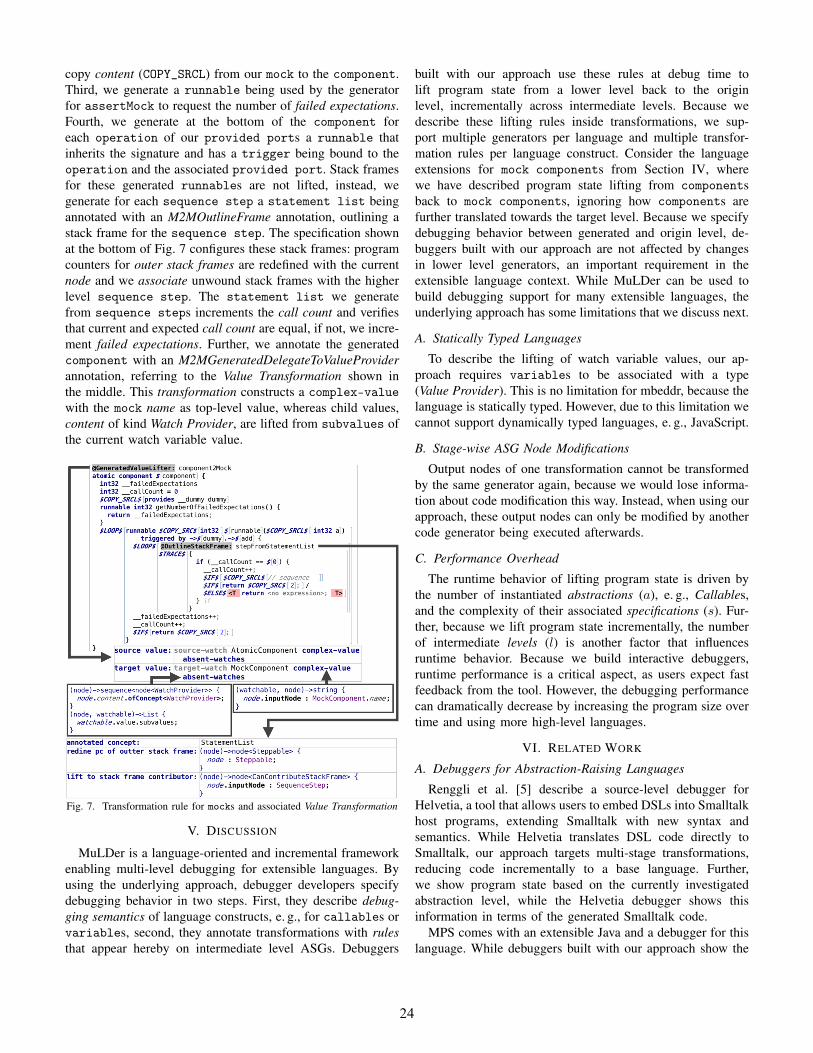
copy content (COPY_SRCL) from our mock to the component.Third, we generate a runnable being used by the generatorfor assertMock to request the number of failed expectations.Fourth, we generate at the bottom of the component foreach operation of our provided ports a runnable thatinherits the signature and has a trigger being bound to theoperation and the associated provided port. Stack framesfor these generated runnables are not lifted, instead, wegenerate for each sequence step a statement list beingannotated with an M2MOutlineFrame annotation, outlining astack frame for the sequence step. The specification shownat the bottom of Fig. 7 configures these stack frames: programcounters for outer stack frames are redefined with the currentnode and we associate unwound stack frames with the higherlevel sequence step. The statement list we generatefrom sequence steps increments the call count and verifiesthat current and expected call count are equal, if not, we incre-ment failed expectations. Further, we annotate the generatedcomponent with an M2MGeneratedDelegateToValueProviderannotation, referring to the Value Transformation shown inthe middle. This transformation constructs a complex-valuewith the mock name as top-level value, whereas child values,content of kind Watch Provider, are lifted from subvalues ofthe current watch variable value.
Fig. 7. Transformation rule for mocks and associated Value Transformation
V. DISCUSSION
MuLDer is a language-oriented and incremental frameworkenabling multi-level debugging for extensible languages. Byusing the underlying approach, debugger developers specifydebugging behavior in two steps. First, they describe debug-ging semantics of language constructs, e. g., for callables orvariables, second, they annotate transformations with rulesthat appear hereby on intermediate level ASGs. Debuggers
built with our approach use these rules at debug time tolift program state from a lower level back to the originlevel, incrementally across intermediate levels. Because wedescribe these lifting rules inside transformations, we sup-port multiple generators per language and multiple transfor-mation rules per language construct. Consider the languageextensions for mock components from Section IV, wherewe have described program state lifting from componentsback to mock components, ignoring how components arefurther translated towards the target level. Because we specifydebugging behavior between generated and origin level, de-buggers built with our approach are not affected by changesin lower level generators, an important requirement in theextensible language context. While MuLDer can be used tobuild debugging support for many extensible languages, theunderlying approach has some limitations that we discuss next.
A. Statically Typed Languages
To describe the lifting of watch variable values, our ap-proach requires variables to be associated with a type(Value Provider). This is no limitation for mbeddr, because thelanguage is statically typed. However, due to this limitation wecannot support dynamically typed languages, e. g., JavaScript.
B. Stage-wise ASG Node Modifications
Output nodes of one transformation cannot be transformedby the same generator again, because we would lose informa-tion about code modification this way. Instead, when using ourapproach, these output nodes can only be modified by anothercode generator being executed afterwards.
C. Performance Overhead
The runtime behavior of lifting program state is driven bythe number of instantiated abstractions (a), e. g., Callables,and the complexity of their associated specifications (s). Fur-ther, because we lift program state incrementally, the numberof intermediate levels (l) is another factor that influencesruntime behavior. Because we build interactive debuggers,runtime performance is a critical aspect, as users expect fastfeedback from the tool. However, the debugging performancecan dramatically decrease by increasing the program size overtime and using more high-level languages.
VI. RELATED WORK
A. Debuggers for Abstraction-Raising Languages
Renggli et al. [5] describe a source-level debugger forHelvetia, a tool that allows users to embed DSLs into Smalltalkhost programs, extending Smalltalk with new syntax andsemantics. While Helvetia translates DSL code directly toSmalltalk, our approach targets multi-stage transformations,reducing code incrementally to a base language. Further,we show program state based on the currently investigatedabstraction level, while the Helvetia debugger shows thisinformation in terms of the generated Smalltalk code.
MPS comes with an extensible Java and a debugger for thislanguage. While debuggers built with our approach show the
24
program state and imitate stepping commands based on thecurrently investigated abstraction level, MPS’ Java debuggershows the target-level call stack and directs each stepping com-mand to the target level, not imitating the expected behavior.
We have built a source-level debugger framework formbeddr that maps debug information directly between targetand source level [6]. While MuLDer enables encapsulateddebugger modules that are not affected by changes in lowerlevel generators, debuggers built with the mbeddr frameworkdepend on the structure of the generated target-level code.Hence, modifying lower level generators usually implies up-dating debuggers that have been built with this framework.
Mierlo [7] describes a debugging approach for modelinglanguages. With this approach, the modal behavior of a sim-ulator for the language is described as a state chart, whichis extended with debugging information. While this approachtargets modeling languages with a fixed set of languageconstructs, our approach targets extensible languages. Further,the approach presented by Mierlo is used for debuggingmodels on the source-level, while our approach allows multi-level debugging. Finally, Mierlo requires language engineers todescribe the executable semantics by using state charts, whilewith our approach debugging semantics of language constructsare described and transformation rules are annotated.
B. Multi-Level Debuggers
Florisson [8] describes a multi-level debugger for Cython, alanguage allowing users to mix C and Python code in the sameprogram. Such programs are compiled to C and integratedwith a Python Application Programming Interface (API) forC, thus being accessible from Python. The resulting C code isfurther translated to a CPython extension module, which canafterwards be called from regular Python code. While codewritten with Cython interacts with Python code, users cannotdebug it with a Python debugger. For this purpose, Florissonproposes a multi-level debugger that allows users to debugPython, Cython and C code simultaneously. While debuggingcalls from Python to Cython, the debugger follows controlflow skipping the C abstraction level, such as calls to thePython interpreter (Python API). Thus, during stepping, theuser will see Python code calling Cython code calling C codeand can investigate the program state in terms of the respectivelanguage. Our approach also covers debugging mixed languageprograms, however, we support multiple abstraction levels anddo not switch between them while performing a steppingcommand. Instead, our users switch manually between thevarious abstraction levels. Additionally, we target extensiblelanguages, while Cython, Python and C have a fixed syntax.
Xia et al. [9] present in their work multi-level debugging, anapproach for automatically detecting bugs in transformationrules. This approach is based on a set of error checkingalgorithms that analyze sequential and parallel aspects ofprograms created during transformation. While their approachautomatically detects bugs, we allow users to debug theirprogram execution on the source level and intermediate levelscreated by transformation rules.
Mannadiar and Vangheluwe [10] describe a debugger for alanguage that is used to model mobile applications. Becausetheir modeling tool enables tracing across intermediate levelscreated during code generation, they can debug their model byinspecting on each intermediate level the currently involvedmodel elements. While they provide tracing for intermediaterepresentations, we allow interactive debugging on each level.
VII. SUMMARY AND FUTURE WORK
In this paper we have presented an incremental approachto build debuggers for extensible languages. While this ap-proach enables source-level debugging for language users,it additionally allows language engineers to debug programson intermediate levels to analyze bugs introduced by faultytransformation rules. Further, we have illustrated the MuLDerframework, an MPS-based implementation of this approach.We have used this framework to build a multi-level debuggerfor mbeddr and demonstrated in this paper how debuggingbehavior for mock components is implemented.
In the future, we plan to use MuLDer to build debuggersfor other extensible languages and in other workbenches toevaluate its genericity. Additionally, we plan to extend thespecification languages coming with MuLDer for specifyingnot only debuggers, but also interpreters to allow multi-levelinterpretation of extensible language programs.
REFERENCES
[1] JetBrains, “Meta Programming System,” http://jetbrains.com/mps, 2015.[2] M. Voelter, D. Ratiu, B. Schaetz, and B. Kolb, “Mbeddr: An Extensible
C-based Programming Language and IDE for Embedded Systems,” inProceedings of the 3rd Annual Conference on Systems, Programming,and Applications: Software for Humanity, ser. SPLASH ’12. New York,NY, USA: ACM, 2012, pp. 121–140.
[3] E. Bousse, J. Corley, B. Combemale, J. G. Gray, and B. Baudry,“Supporting efficient and advanced omniscient debugging for xdsmls,”in Proceedings of the 2015 ACM SIGPLAN International Conferenceon Software Language Engineering, SLE 2015, Pittsburgh, PA, USA,October 25-27, 2015, R. F. Paige, D. D. Ruscio, and M. Völter, Eds.ACM, 2015, pp. 137–148.
[4] D. Pavletic and S. A. Raza, “Multi-Level Debugging for ExtensibleLanguages,” Softwaretechnik-Trends, vol. 35, no. 1, 2015.
[5] L. Renggli, T. Gîrba, and O. Nierstrasz, “Embedding Languages withoutBreaking Tools,” in ECOOP 2010 - Object-Oriented Programming,24th European Conference, Maribor, Slovenia, ser. Lecture Notes inComputer Science, vol. 6183. Springer, June 2010, pp. 380–404.
[6] D. Pavletic, M. Voelter, S. A. Raza, B. Kolb, and T. Kehrer, “ExtensibleDebugger Framework for Extensible Languages,” in 20th Ada-EuropeInternational Conference on Reliable Software Technologies, MadridSpain, June 22-26, 2015, Proceedings, ser. Lecture Notes in ComputerScience, vol. 9111. Springer, 2015, pp. 33–49.
[7] S. V. Mierlo, “Explicit modelling of model debugging and experi-mentation,” in Proceedings of Doctoral Symposium co-located with17th International Conference on Model Driven Engineering Languagesand Systems (2014), Valencia, Spain, September 30, 2014., ser. CEURWorkshop Proceedings, B. Baudry, Ed., vol. 1321, 2014.
[8] M. Florisson, “Multi-Level Debugging for Cython,” 14th Twente StudentConference on IT, vol. 14, no. 1, Jan. 2011.
[9] R. Xia, T. Elmas, S. A. Kamil, A. Fox, and K. Sen, “Multi-levelDebugging for Multi-stage, Parallelizing Compilers,” EECS Department,University of California, Berkeley, Tech. Rep., Dec 2012.
[10] R. Mannadiar and H. Vangheluwe, “Debugging in Domain-SpecificModelling,” in Software Language Engineering - Third InternationalConference, SLE 2010, Eindhoven, The Netherlands, October 12-13,2010, Revised Selected Papers, ser. Lecture Notes in Computer Science,vol. 6563. Berlin, Heidelberg: Springer, 2010, pp. 276–285.
25