fracflow consultants inc
TRANSCRIPT
154 Major’s Path, St. John’s, Newfoundland and Labrador, Canada A1A 5A1Tel: (709) 739-7270 Fax: (709) 753-5101 E-Mail: [email protected] Web: www.fracflow.com
Fracflow Consultants Inc.
Environmental, Hydrogeological andGeotechnical Engineering Consultants
TECHNICAL MEMORANDUM
TO: Cold Ocean Salmon Ltd. FFC-NL-500-003j Cooke Aquaculture Inc.874 Main StreetBlack’s Harbour, NB E5H 1E6
FROM: Fracflow Consultants Inc.
DATE: September 8, 2009
SUBJECT: Results of Drilling and Aquifer Testing, St. Alban’s, Newfoundland
Summary
This report presents a summary of the aquifer tests that were completed by and under thesupervision of Fracflow Consultants Inc. in St. Alban’s, NL between June 30 and July 25, 2009to investigate a potential water supply for a proposed fish hatchery in St. Alban’s, NL.
Aquifer tests were carried out to determine the capacity of two individual bedrock wells (ChurchWell, Sea Farm Well) and the properties of the underlying bedrock aquifer. In addition, theinteraction or connection between the two production bedrock wells and the overlyingoverburden aquifer from which the Town of St. Alban’s draws its water supply was monitoredusing the new and existing piezometers and observation wells. The well performance and aquifercharacteristics were determined by carrying out a step-drawdown test, followed by a 48-hourand/or 72-hour aquifer test followed by monitoring of the recovery of the water levels in each ofthe two wells. The well interference was assessed by pumping both production wells,simultaneously, at or close to their maximum pumping rate with the installed pumps andoverlapping this combined pumping with the aquifer test that was conducted on the new well thatwas installed in the Town’s well field. Water samples were collected and field geochemicalparameters were measured periodically through out the aquifer test program.
Based on the specific capacity of approximately 73 L/min/m the Church well, assuming amoderate well efficiency, would have a short term capacity in excess of 600 L/min. Based on thespecific capacity that was computed for the Sea Farm well, 17.6 L/min/m, the short term wellyield would be in excess of 500 Lpm, assuming a low to moderate well efficiency.

Technical Memorandum to: Cold Ocean Salmon Ltd. FFC-NL-500-003
September 8, 2009 Page 2 of 9
The aquifer tests that were completed during this hydrogeological investigation, demonstratedthat the bedrock wells have the capacity to meet the short term requirements of the proposed fishhatchery. The extended aquifer tests demonstrated that the bedrock aquifer, or the aquifer that thewells produce from when they are cased through the overburden and drilled into bedrock,contains high permeability zones and that the three bedrock wells (Church Well, Sea Farm Welland the DFA well) are all well connected.
The proposed average daily water usage for each month for the proposed fish hatchery has been compared to the average daily water usage by the Town of St. Alban’s for the period of August toNovember, 2008, including the fish plant, and to the maximum exploitable daily water volume oravailable water from the overburden aquifer (2,160 m /day) as estimated by Morrison Beatty and3
Associates Ltd. (1990). In addition, the average daily water volume that would be required by atown with a population of 1,250 persons was calculated.
Based on this comparison, the volume of water that is available to other users, the differencebetween the Town’s average water usage and the Morrison Beatty and Associates Ltd. (1990)estimate of 2,160 m /day of available water, exceeds that which would be withdrawn by the3
proposed fish hatchery since the fish hatchery’s water demands would be buffered throughstorage in the overburden aquifer. It is important to note that Morrison Beatty and Associates Ltd.(1990) did not consider any contribution from the bedrock aquifer.
It is Fracflow’s opinion that the additional water needed to service the proposed fish hatcheryexists in the overburden even with the current Town water demands or usage. However, theproposed fish hatchery proposes to draw its water from the bedrock aquifer and part of this waterwill be obtained by leakage through and from the overburden aquifer. It is clear that the Town’swater needs are much less than the current water usage due to leaks in the Town’s waterpipelines. If the leaks are fixed or reduced an additional volume of potable water, up to 1,000m /day, would become available to the stakeholders. 3
Introduction
This report presents a summary of the field work and the aquifer tests that were completed by andunder the supervision of Fracflow Consultants Inc. in St. Alban’s, NL between June 30 andJuly 25, 2009 to investigate a potential water supply for a proposed fish hatchery in St. Alban’s,NL. Figure 1 is an aerial photograph of part of St. Alban’s showing the well locations and otherpoints that are relevant to the proposed fish hatchery.
Scope of Work
A 150 mm diameter casing was driven on July 1 - 2, 2009 approximately 14.63 m east of theexisting Church Well (Figure 1) and three piezometers P1, P2, P3 were installed at selectedvertical depths to serve as observation wells for the aquifer tests on the Church Well(CW on

Technical Memorandum to: Cold Ocean Salmon Ltd. FFC-NL-500-003
September 8, 2009 Page 3 of 9
Figure 1). On July 5, 2009 static water levels for P1, P2 and P3 were 7.3 m, 6.8 m, and 5.4 m,respectively, measured from the top of each casing. Key elevation data for each production wellare tabulated in Figure 1.
During the period of July 2 - 9, 2009, a 150 mm diameter casing was also driven 16.8 m west ofthe Sea Farm or Incubation (SFW or IW on Figure 1) well and piezometer P1 was installed at orclose to the overburden-bedrock contact. On July 15, 2009, piezometer P2 was installedapproximately 20.42 m west of the Sea Farm/Incubation pumping well. On July 15, 2009 staticwater levels for P1, P2 and the DFA well respectively were 14.9 m, 13.7 m and 14.7 m below thetop of each casing. Refer to Table 1.1 for well details. These piezometers and observation wells,along with the Department of Fisheries and Aquaculture (DFA) well, were used as observationwells during the aquifer tests on the Sea Farm well.
Table 1.1 Well construction data obtained during drilling and/or borehole camera viewing.
LocationDepth
(m)
Casing
Depth (m)Drill Date
Screen
Depth (m)
Geologic
Depth (m)Geology
Church Well 47.5 45.7 1995 ? No screen0 - 45.7
45.7 - 47.5
n/a
bedrock
Church Well 2009 - P1 49.1 9.8July 1,
200946.0 - 49.1
0 - 6.1
6.1 - 13.7
13.7 - 49.1
49.1 - 49.7
Brown, moist, med-coarse
grained sand
Light brown fine grained sand
Grey fine grained silty sand
Bedrock - black
Church Well 2009 - P2 34.4 9.8July 1,
200931.4 - 34.4
Church Well 2009 - P3 18 9.8July 1,
200914.9 - 18.0
Sea Farm Well 122.5 73.8 1995 ? No screen0 - 73.8
Bedrock
n/a
Bedrock
Sea Farm Well 2009 - P1 73.8 7July 7,
200970.4 - 73.5
0 - 4.6
4.6 - 24.4
24.4 - 30.5
30.5 - 73.2
73.2 - 73.8
Brown, coarse grained sand
and gravel
Brown, coarse grained sand
Grey fine grained sand
Grey fine grained silty sand
Bedrock - Grey shale
Sea Farm Well 2009 - P2 17.7 0.9July 15,
200914.6 - 17.8
0 - 4.6
4.6 - 18.3
Brown, coarse grained sand
and gravel
Brown, coarse grained sand
Salt Water Well 75.3 55.5 1995 ? No screen
0 - 55.5
55.5 - 75.3
No information
Bedrock - fractured dark rock
w/ quartz veins

Technical Memorandum to: Cold Ocean Salmon Ltd. FFC-NL-500-003
September 8, 2009 Page 4 of 9
On July 10, 2009, a 48-hour aquifer test was conducted on the Church well with a flowrate of329 L/min. The pumping rate remained steady at 329 L/min and the drawdown stabilized atapproximately 4.5 m. The three observation wells were monitored during the aquifer test anddrawdowns within P1, P2 and P3 were 1.3 m, 0.13 m and 0.14 m, respectively.
On July 15, 2009, a 72-hour aquifer test was conducted on the Sea Farm well with a flowrate of225 L/min producing a total drawdown of 12.8 m at the end of the 72-hour test period.Drawdowns in SFW-P1, SFW-P2 and the DFA well during this 72-hour period were 1.7 m,0.04 m and 1.4 m, respectively.
Water samples were collected from each well after 24 hours, 48 hours, 72 hours (Sea Farm Well)and again on July 23, 2009. Selected water samples have been analyzed and the laboratory dataare provided in Appendix A.
The Town of St. Alban’s constructed Well PW#8 in the well field area on approximately July 21,2009, to a depth of 18.3 m. A 48-hour pumping test was completed on well PW#8 at aproduction rate of 379 L/min. The PW#8 pumping well and two observation wells in the Town’swell field were monitored during this aquifer test, while the other two wells, the Church and theSea Farm wells were also pumping at 329 L/min and 225 L/min, respectively.
A Borehole TV Camera was used to examine the well bores in both the Church Well, the SeaFarm Well and the Salt-Water Well, to determine well depth and casing depth in each well.
The results from the drilling of observation wells and analysis of aquifer tests carried out on twobedrock water wells are described below.
Aquifer Test Results
The aquifer tests were carried out to determine the capacity of the individual wells and theproperties of the underlying aquifer. In addition, the interaction or connection between the twoproduction wells and the overlying overburden aquifer from which the Town of St. Alban’sdraws its water supply was monitored using the new and existing piezometers and observationwells. The well performance and aquifer characteristics were determined by carrying out a step-drawdown test, followed by a 48-hour and/or 72-hour aquifer test followed by monitoring of therecovery of the water levels in each of the two wells. The well interference was assessed bypumping both production wells, simultaneously, at or close to their maximum pumping rate withthe installed pumps and overlapping this combined pumping with the aquifer test that wasconducted on the new well that was installed in the Town’s well field. The well testing and watersampling were carried out according to guidelines set out by the Water Resources ManagementDivision of the Newfoundland Department of Environment and Conservation (Robinson, 1986).A brief description and performance of each well are summarized below.

Technical Memorandum to: Cold Ocean Salmon Ltd. FFC-NL-500-003
September 8, 2009 Page 5 of 9
Church Well
There is one water supply well (Church Well) and three observation wells within an adjacentwell (nested piezometers P1, P2, P3) at this location (Figure 1). The Church Well is located inthe northwest corner of a large exposed sandy area adjacent the Church and was drilled sometimearound 1995. This Church Well is 47.6 m deep and the end of the casing or the casing shoe waslocated at 45.8 m using the borehole TV camera.
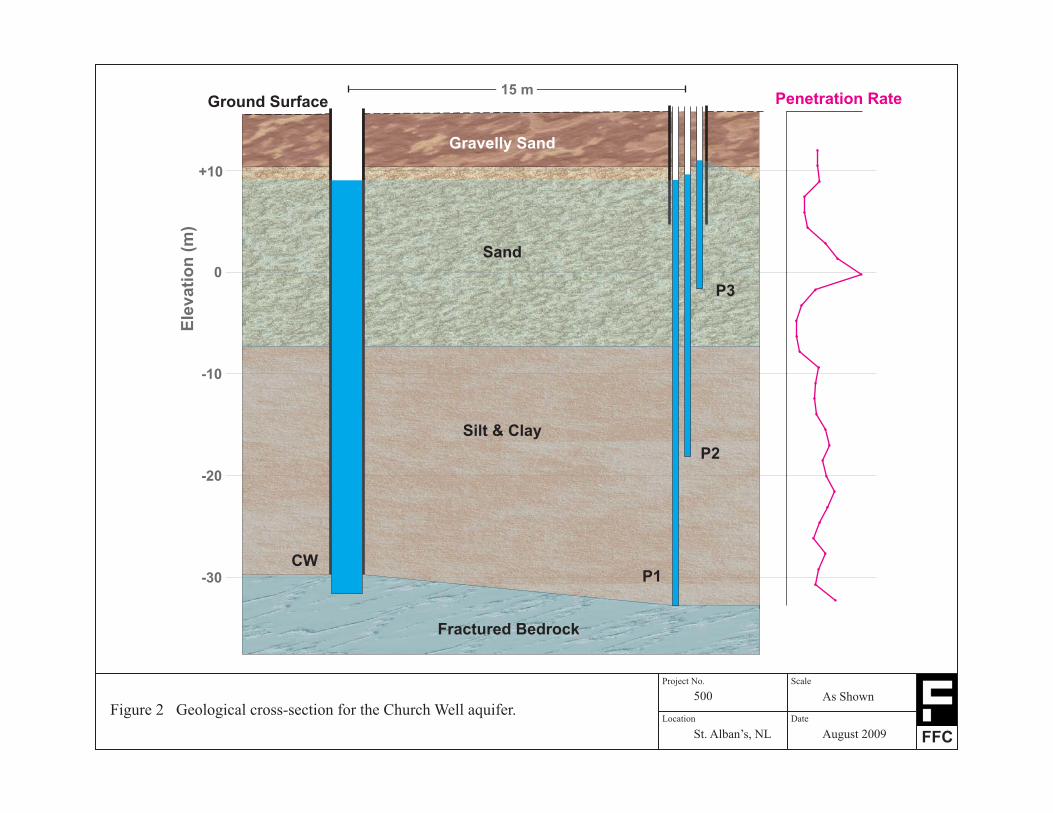
The observation wells are located approximately 14.63 m (48 feet) east of the Church Well. Thissecond well, containing the three observation wells (P1, P2, P3), was drilled on July 1, 2009 byNortheast Drilling Ltd. under the supervision of Fracflow. The well was drilled to 49.7 m(163 feet). The first observation well screen (P1) was installed from 46.03 m to 47.07 m (151 feetto 161 feet), within or at the top of the bedrock. The second observation well screen (P2) wasinstalled from 31.4 m to 34.4 m (103 feet to 113 feet) within a grey fine-grained silty sand layer.The third observation well screen (P3) was installed 14.9 to 18.0 m (49 feet to 59 feet) in theupper portion of the aquifer within a grey fine-grained silty sand layer. These nested piezometerswere then used as observation wells during the Church Well aquifer test to monitor howhydraulic heads were affected within the overburden aquifer at different depths during the aquifertests. The geological cross-section for this well location is provided in Figure 2.
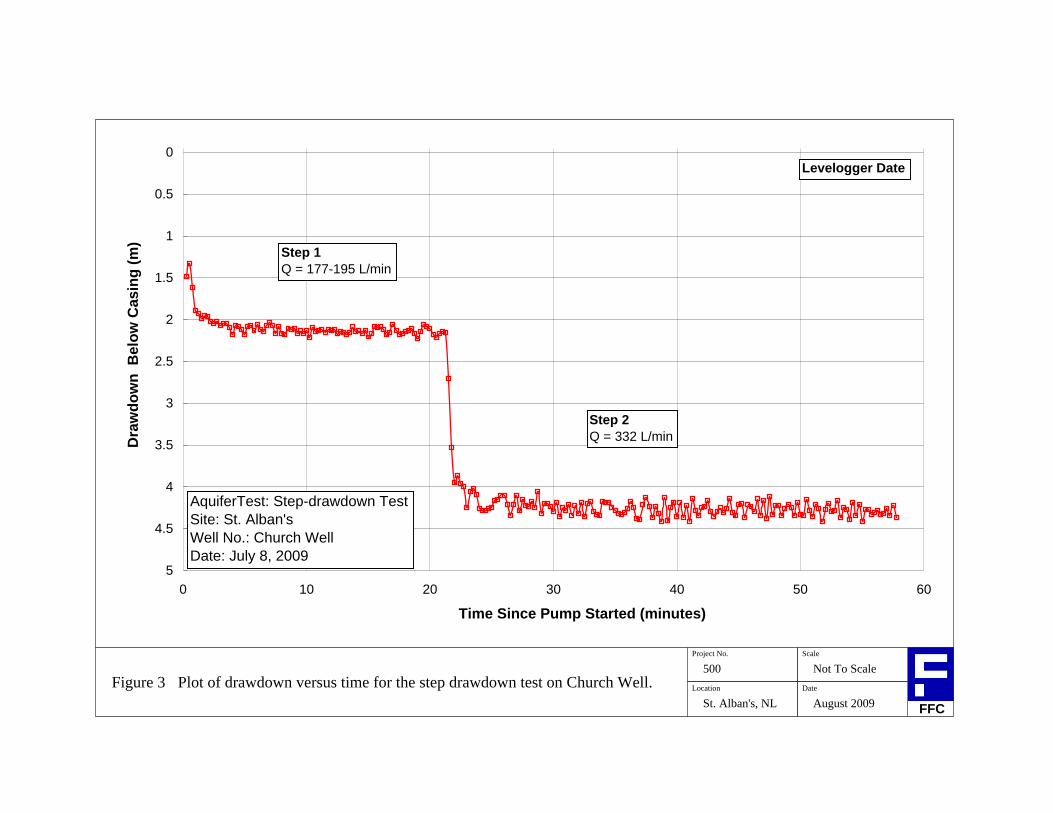
Three steps were completed on this well for the step-drawdown test using rates of 202 L/min,264 L/min and the highest setting of 329 L/min, which was the full capacity of the pump. Thefirst three steps in the step-drawdown test reached a quasi steady-state within the 30-minuteperiod of the step. Drawdowns within the Church pumping well during the three steps were2.4 m, 3.4 m and 4.5 m, respectively.
The pumping rate for the 48-hour aquifer test for the Church well was set at 329 L/min. Thepumping rate remained steady at 329 L/min and the drawdown stabilized at approximately 4.5 mof drawdown. The three observation wells were monitored during the pumping test anddrawdowns within P1, P2 and P3 were 1.3 m, 0.13 m and 0.14 m, respectively. The availabledrawdown in this well was approximately 32 m (water table is at approximately 7 m belowground surface and the producing zone is at approximately 47 m, assuming that the pump isplaced at the bottom of the well and that the water level is maintained at approximately 6 mabove the top of the pump). Based on the specific capacity of approximately 73 L/min/m thiswell, assuming a moderate well efficiency, would have a short term capacity in excess of600 L/min
The aquifer test data for the Church Well are provided in Figures 3 and 4. Additional aquifer testfigures for the Church Well are provided in Appendix B. The storativity that was calculated fromthe observation well data indicates that the producing aquifer is a leaky confined aquifer. Theobservation well data gave a transmissivity of 2.67 × 10 m /s if we assume that the aquifer is-3 2
50 m thick. However note that, at this well location, the producing well was only openapproximately 3 m into bedrock.

Technical Memorandum to: Cold Ocean Salmon Ltd. FFC-NL-500-003
September 8, 2009 Page 6 of 9
Water samples were collected during this test at the 5-hour, 24-hour and 48-hour mark, and againon July 23, 2009. Water chemistry data are provided in Appendix A.
Sea Farm Well
At the Sea Farm well location, two new observation wells were installed to support aquifertesting of the existing production water well. The drill date for the existing production well wasassumed to be sometime in 1995 but this could not be confirmed. The well is 122.5 m deep(401.9 ft) and the casing depth is at 73.7 m (242 ft). The bottom of the casing was confirmedusing a borehole TV camera after the aquifer tests had been completed. The geological cross-section for this location, based on the overburden samples that were collected during thepiezometer construction is provided in Figure 5.
One observation well, SFW-P1, is located approximately 16.8 m (55 feet) west of the Sea Farmpumping well and was drilled on July 7, 2009, by Northeast Drilling Ltd. to a depth of 73.7 m(242 feet). A screen was installed from 70.41 m to 73.4 m (231 to 241 feet) within a grey finegrained silty sand, at the top of the bedrock or the bottom of the overburden unit. A secondpiezometer (observation SFW-P2) is located approximately 20.42 m (67 feet) west of the SeaFarm pumping well and was augered on July 15, 2009 by Formation Drilling Ltd. to a depth of18.29 m (60 feet). A screen was installed from 14.63 m to 17.68 m (48 to 58 feet) within abrown, coarse grained sand unit. These two piezometers were used as observation wells duringthe Sea Farm Well aquifer test to monitor how hydraulic heads were affected within theoverburden aquifer at different depths during the aquifer test on the Sea Farm well. In addition tothese two wells, a third well drilled to bedrock by the Department of Fisheries and Aquaculture(DFA) in January 2008, located approximately 61 m from the Sea Farm pumping well, was usedas an observation well.
Three steps were completed for the step-drawdown test using flow rates of 113 L/min, 144 L/minand 225 L/min. The three steps in the step-drawdown test reached a quasi steady-state within the30-minute period of each step. Drawdowns during the three steps within the Sea Farm pumpingwell were 7.1 m, 9.4 m and 13.3 m, respectively.
The pumping rate for the 72-hour aquifer test on the Sea Farm well was set at 225 L/min and atotal drawdown of 12.8 m was recorded at the end of the 72-hour test period. Drawdowns inSFW-P1, SFW-P2 and the DFA well during this 72-hour period were 1.7 m, 0.04 m and 1.4 m,respectively. The Sea Farm well has total available drawdown of approximately 48 m. Based onthe preliminary specific capacity that was computed for this well, 17.6 L/min/m, the short termwell yield would be in excess of 500 Lpm, assuming a low to moderate well efficiency.
The aquifer test data for the Sea Farm well are presented in Figures 6 and 7 with additionalaquifer test data being provided in Appendix B. The storativity that was calculated from theobservation well data indicates that the producing aquifer is a leaky confined aquifer. The
Technical Memorandum to: Cold Ocean Salmon Ltd. FFC-NL-500-003
September 8, 2009 Page 7 of 9
observation well data and the producing well data gave a transmissivity of 8.09 × 10 m /s if we-4 2
assume that the aquifer is 50 m thick.
Water samples were collected during this test at the 24-hour, 48-hour and 72-hour mark, andagain on July 23, 2009. The water chemistry data are presented in Appendix A and compared tothe freshwater aquatic life guidelines with highlights indicating when those guideline values areexceeded.
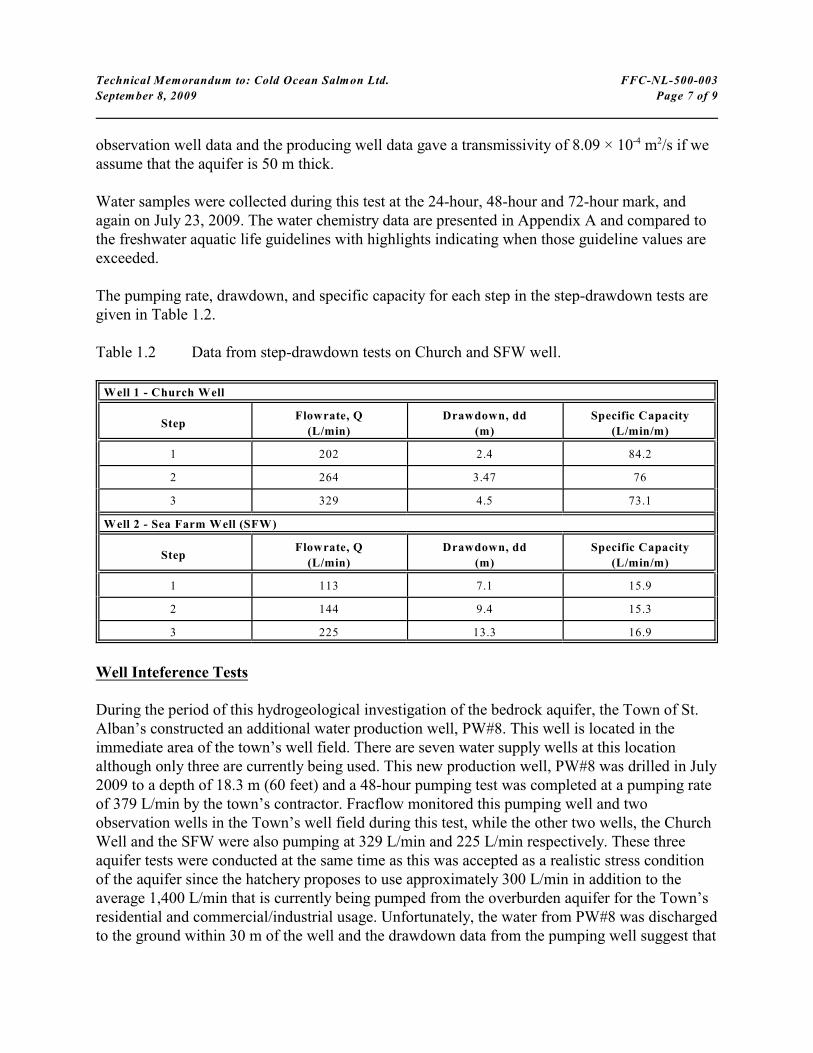
The pumping rate, drawdown, and specific capacity for each step in the step-drawdown tests aregiven in Table 1.2.
Table 1.2 Data from step-drawdown tests on Church and SFW well.
Well 1 - Church Well
StepFlowrate, Q
(L/min)
Drawdown, dd
(m)
Specific Capacity
(L/min/m)
1 202 2.4 84.2
2 264 3.47 76
3 329 4.5 73.1
Well 2 - Sea Farm Well (SFW)
StepFlowrate, Q
(L/min)
Drawdown, dd
(m)
Specific Capacity
(L/min/m)
1 113 7.1 15.9
2 144 9.4 15.3
3 225 13.3 16.9
Well Inteference Tests
During the period of this hydrogeological investigation of the bedrock aquifer, the Town of St.Alban’s constructed an additional water production well, PW#8. This well is located in theimmediate area of the town’s well field. There are seven water supply wells at this locationalthough only three are currently being used. This new production well, PW#8 was drilled in July2009 to a depth of 18.3 m (60 feet) and a 48-hour pumping test was completed at a pumping rateof 379 L/min by the town’s contractor. Fracflow monitored this pumping well and twoobservation wells in the Town’s well field during this test, while the other two wells, the ChurchWell and the SFW were also pumping at 329 L/min and 225 L/min respectively. These threeaquifer tests were conducted at the same time as this was accepted as a realistic stress conditionof the aquifer since the hatchery proposes to use approximately 300 L/min in addition to theaverage 1,400 L/min that is currently being pumped from the overburden aquifer for the Town’sresidential and commercial/industrial usage. Unfortunately, the water from PW#8 was dischargedto the ground within 30 m of the well and the drawdown data from the pumping well suggest that

Technical Memorandum to: Cold Ocean Salmon Ltd. FFC-NL-500-003
September 8, 2009 Page 8 of 9
the discharge water was most likely recharged back to the overburden aquifer within a fewminutes. However, the normal withdrawals from the overburden aquifer by the Town continuedduring this extended period of aquifer testing.
Conclusions
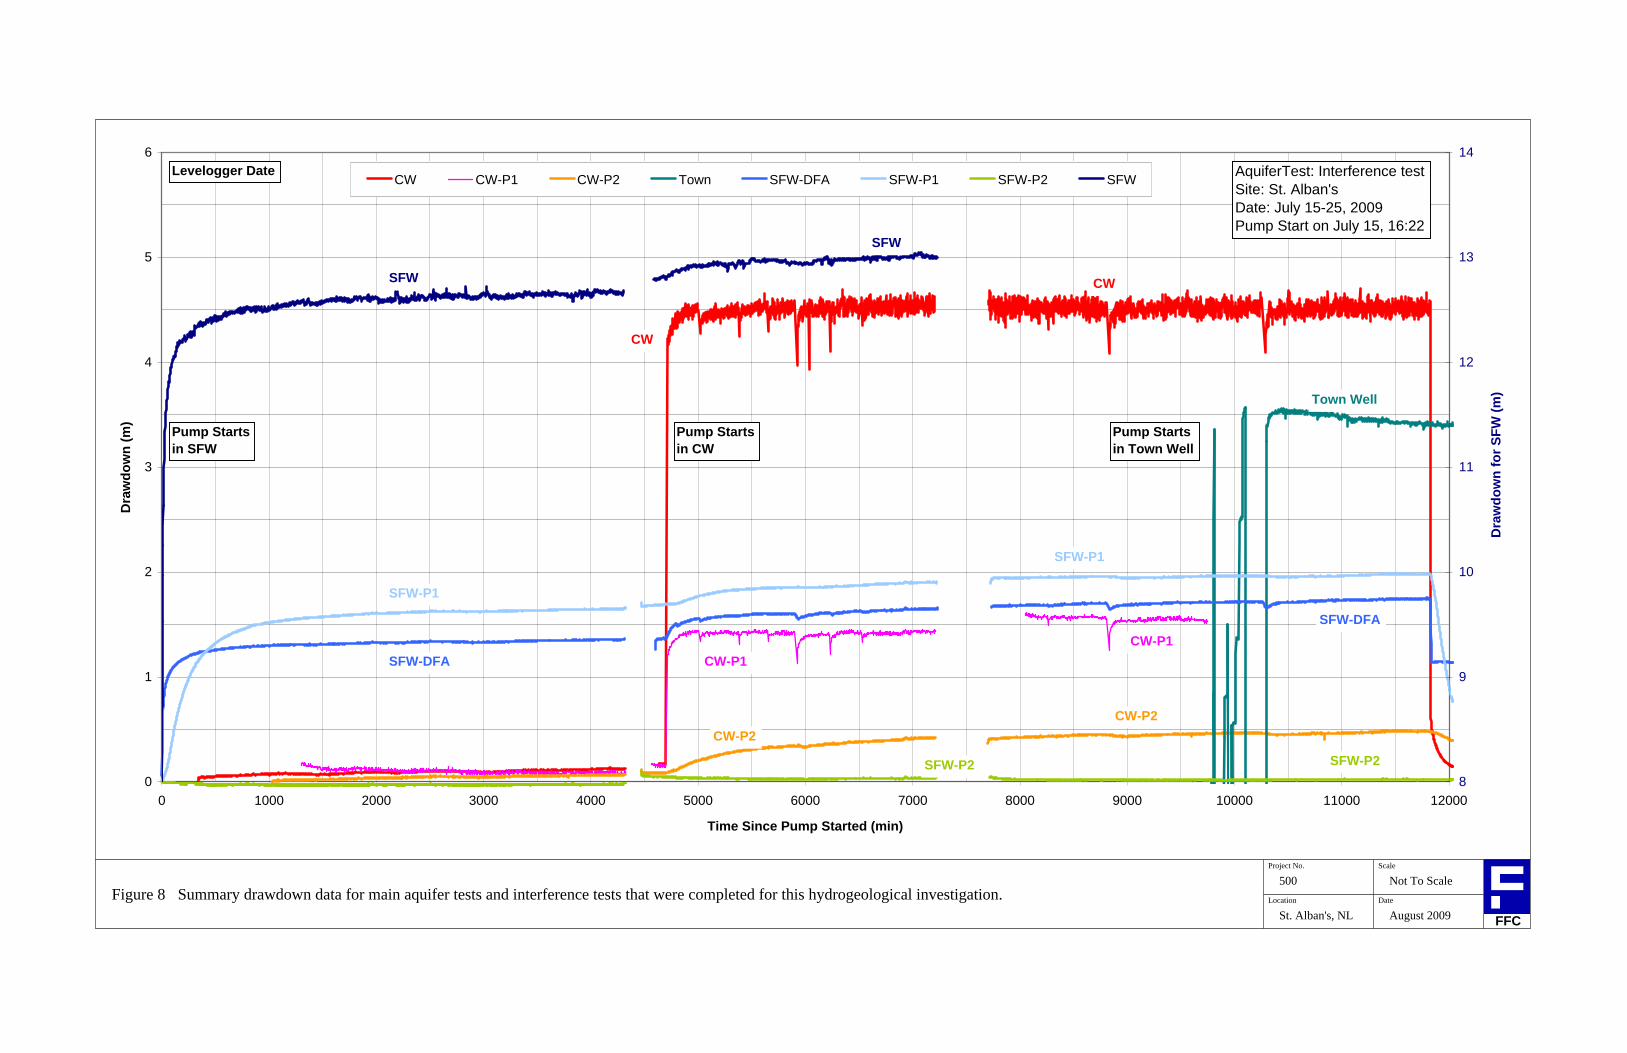
The aquifer tests that were completed during this hydrogeological investigation, demonstratedthat the bedrock wells have the capacity to meet the short term requirements of the proposed fishhatchery. The extended aquifer tests (Figure 8) demonstrated that the bedrock aquifer, or theaquifer that the wells produce from when they are cased through the overburden and drilled intobedrock, contains high permeability zones and that the three bedrock wells (Church Well, SeaFarm Well and the DFA well) are all well connected. The water level in each bedrock wellresponds rapidly to pumping in the individual wells. The piezometers that were constructed inthe overburden showed hydraulic responses to water withdrawal from the bedrock aquifer. Theseresponses confirm that the overburden and bedrock aquifers are interconnected to some degree.
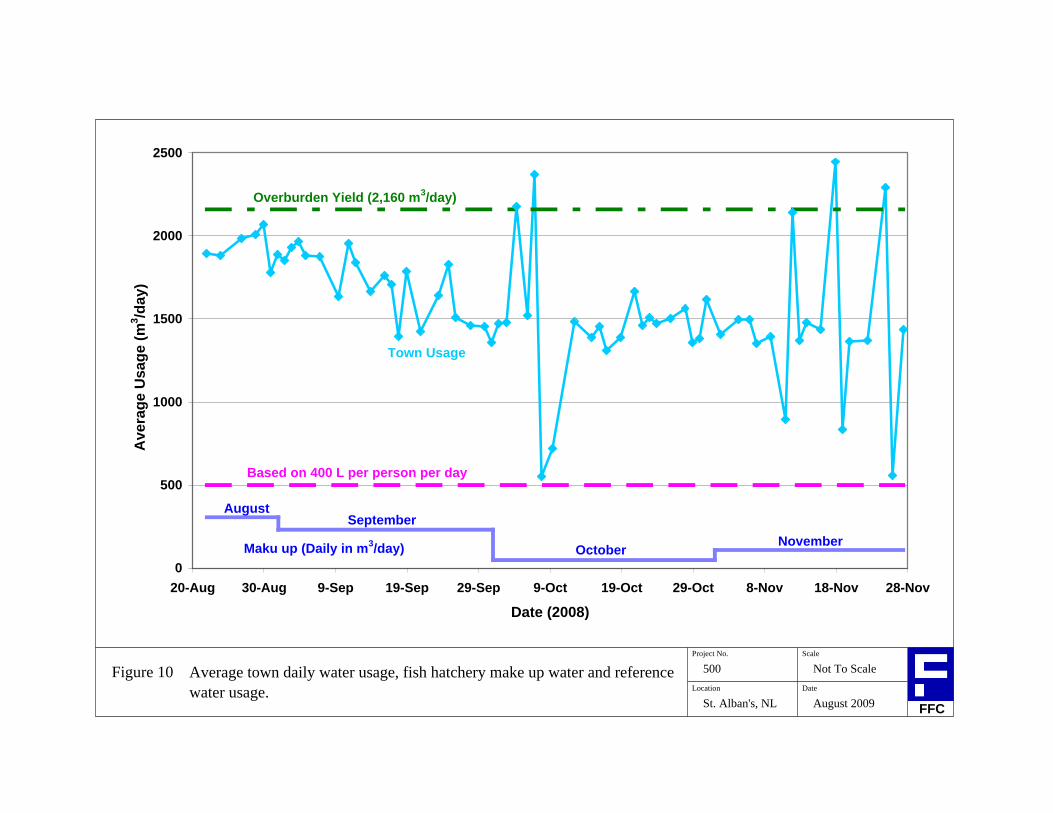
Figure 9 shows the proposed average daily water usage for each month for the proposed fishhatchery. Figure 10 shows the average daily water usage by the Town of St. Alban’s for theperiod of August to November, 2008, including the fish plant, the maximum exploitable dailywater volume or available water from the overburden aquifer (2,160 m /day) as estimated by3
Morrison Beatty and Associates Ltd. (1990), the average daily water volume that would berequired by a town with a population of 1,250 persons, along with the average daily water usagefor each month for the proposed fish hatchery.
For the August to November 2008 time period, the Town’s usage varied from about 550 to 2,400m /day while the actual volume of water needed by the Town based on population statistics is3
about 500 m /day. The fish plant requirements have been estimated at 300 to 600 m /day3 3
producing a total Town need for water of approximately 1,100 m /day. Obviously, fire flows3
have to be provided from storage (tank and cistern) and overall well capacity. Note that thiswater is being produced from the overburden aquifer with significant induced infiltration fromthe Swanger Cove River.
Based on these records, Figure 10 shows that the volume of water that is available, the differencebetween the Town’s average water usage and the Morrison Beatty and Associates Ltd. (1990)estimate of 2,160 m /day of available water, exceeds that which would be withdrawn by the3
proposed fish hatchery. It is important to note that Morrison Beatty and Associates Ltd. (1990)did not consider any contribution from the bedrock aquifer. Based on the short term aquifer teststhat were completed for this investigation, the bedrock wells can produce in excess of 600 L/minin the short term. Since the bedrock aquifer is a leaky confined aquifer the potential long termyield from bedrock wells is estimated to range from 100 to 600 m /day. In addition, it is3
estimated that Swanger Cove area, which is considered to be down gradient of the existing Townwell field, is estimated to yield about 15 to 50 m /day of fresh to brackish water. Finally, it3

Technical Memorandum to: Cold Ocean Salmon Ltd. FFC-NL-500-003
September 8, 2009 Page 9 of 9
should be noted that the proposed fish hatchery demand is expected to peak in April of each year,during spring snow melt or run-off.
There are a number of stakeholders that have a vested interest in the potable water that can bedeveloped from the overburden and bedrock aquifers in the Swanger Cove River valley andadjacent areas. These include the town of St. Alban’s, the existing fish plant, DFA to service theproposed aquaculture research/service facility, DMA and DOEC with a mandate to protect theexisting Town water supply, the proposed fish Hatchery, FFO with a need to ensure that theSwanger Cove River low flows are not reduced, and future industrial developments that might beattracted to establish in the Town of St. Alban’s.
It is Fracflow’s opinion that the additional water needed to service the proposed fish hatcheryexists in the overburden even with the current Town water demands or usage. However, theproposed fish hatchery proposes to draw its water from the bedrock aquifer and part of this waterwill be obtained by leakage through and from the overburden aquifer. It is clear that the Town’swater needs are much less than the current water usage due to leaks in Town’s water pipelines. Ifthe leaks are fixed or reduced, an additional volume of potable water, up to 1,000 m /day, would3
become available to the stakeholders.
Cold Ocean Salmon Inc. has collected a significant set of data on the bedrock aquifer that can beused to calibrate a future 3D flow and transport model to estimate the long term contribution thatthe bedrock aquifer can make to the potable water supplies of the area.
References
Morrison Beatty and Associates Limited, 1990. Hydrogeological Study of the St. Alban’s WellField Area, St. Alban’s, Newfoundland, Water Resources Report 3-3, Department ofEnvironment and Lands, Water Resources Division, Groundwater Section, Governmentof Newfoundland and Labrador, 99 p.
Robinson, J.W., 1986. Guidelines for Aquifer Pumping Tests, Water Resources ManagementDivision, Groundwater Section, Department of Environment, Government ofNewfoundland and Labrador, 27 p.

CW
SFW(IW)SFW(IW)
PW 8PW 8
Swanger Cove River
DFA
SW
CW IW PW 8PW 8DFA SW
-29.8 -50.2 –-65.8 -45.5Bedrock (m)
9.0 9.1 7.78.9 5.1Static Water
Level (m)
15.5 23.5 10.522.6 9.6Ground
Surface (m)
73 17.6 –– –Speific Capacity
(L/min/m)
1 KM
Project No.
FFC
Location Date
Scale
August 2009
As Shown
St. Alban’s, NL
500Figure 1 Aerial photograph of part of St. Alban’s, NL, showing location
of and elevation data for Church Well (CW), Incubator Well(IW) or Sea Farm Well (SFW), DFA well, PW8, and SaltWater Well (SW).
Penetration Rate
CWP1
P2
P3
Ground Surface
Fractured Bedrock
Silt & Clay
Sand
Gravelly Sand
0
-10
-20
-30
+10E
lev
ati
on
(m)
15 m
Project No.
FFC
Location Date
Scale
August 2009
As Shown
St. Alban’s, NL
500
Figure 2 Geological cross-section for the Church Well aquifer.
Project No. Scale
500 Not To Scale Location Date
FFCSt. Alban's, NL August 2009
Plot of drawdown versus time for the step drawdown test on Church Well.Figure 3
0
0.5
1
1.5
2
2.5
3
3.5
4
4.5
50 10 20 30 40 50 60
Time Since Pump Started (minutes)
Dra
wdo
wn
Bel
ow C
asin
g (m
)
Step 1Q = 177-195 L/min
Step 2Q = 332 L/min
AquiferTest: Step-drawdown Test Site: St. Alban'sWell No.: Church WellDate: July 8, 2009
Levelogger Date

Project No. Scale
500 Not To Scale Location Date
FFC
Figure 4
St. Alban's, NL August 2009
Log-log plot of drawdown versus time for Church Well (CW), CW-P1, CW-P2, and CW-P3 during the 53 hour aquifer test on Church Well (332 L/min).
0.001
0.01
0.1
1
10
0.1 1 10 100 1000 10000
Time Since Pump Started (min)
Dra
wdo
wn
(m)
CWP1P2P3
Levelogger Date
AquiferTest: 53 hr Aquifer Test Site: St. Alban'sWell No.: Church WellDate: July 10-12, 2009
Q = 332 L/min

Penetration Rate
DFA
SFW
P1
P2
Ground Surface
FracturedBedrock
Silt & Clay
Sand
Gravelly Sand
0
-20
-40
-60
-80
-100
+20
Ele
va
tio
n(m
)
61 m 17 m 4 m
Project No.
FFC
Location Date
Scale
August 2009
As Shown
St. Alban’s, NL
500
Figure 5 Geological cross-section for the Sea Farm Well aquifer.

Project No. Scale
500 Not To Scale Location Date
FFCSt. Alban's, NL August 2009
Plot of drawdown versus time for the step drawdown test on Sea Farm Well.Figure 6
0
2
4
6
8
10
12
140 20 40 60 80 100 120 140
Time Since Pump Started (minutes)
Dra
wdo
wn
Bel
ow C
asin
g (m
)
Step 3Q = 227 L/min
Step 1Q = 114 L/min
Step 2Q = 136-145 L/min
AquiferTest: Step-drawdown Test Site: St. Alban'sWell No.: Sea Farm WellDate: July 13, 2009
Levelogger Date

500 Not To Scale Location Date
Log-log plot of drawdown versus time for Sea Farm Well (SFW), DFA, SFW-P1, and SFW-P2 during the 72 hour aquifer test on Sea Farm Well (232 L/min).
Figure 7
FFCSt. Alban's, NL August 2009
Project No. Scale
0.001
0.01
0.1
1
10
100
0.1 1 10 100 1000 10000
Time Since Pump Started (min)
Dra
wdo
wn
(m)
SFWDFASFW-P1SFW-P2
Levelogger Date
AquiferTest: 72 hr Aquifer Test Site: St. Alban'sWell No.: Sea Farm WellDate: July 15-18, 2009
Q = 232 L/min
Project No. Scale
500 Not To Scale Location Date
August 2009 FFC
Figure 8 Summary drawdown data for main aquifer tests and interference tests that were completed for this hydrogeological investigation.St. Alban's, NL
0
1
2
3
4
5
6
0 1000 2000 3000 4000 5000 6000 7000 8000 9000 10000 11000 12000
Time Since Pump Started (min)
Dra
wdo
wn
(m)
8
9
10
11
12
13
14
Dra
wdo
wn
for S
FW (m
)
CW CW-P1 CW-P2 Town SFW-DFA SFW-P1 SFW-P2 SFWLevelogger Date AquiferTest: Interference test
Site: St. Alban'sDate: July 15-25, 2009Pump Start on July 15, 16:22
Pump Startsin SFW
Pump Startsin CW
Pump Startsin Town Well
SFW
SFW-P2
SFW-DFA
SFW-P1
SFW
SFW-P2
SFW-DFA
SFW-P1
CW
CW-P2
CW-P1
CW
CW-P2
CW-P1
Town Well

Project No. Scale
Figure 9 500 Not To Scale Location Date
FFCSt. Alban's, NL August 2009
Proposed water usage for new fish hatchery facility, St. Alban's, NL (J. Elliott, personal communication, 2009).
0
50
100
150
200
250
300M
ake
up (D
aily
in L
pm)
JAN FEB MAR APR MAY JUN JUL AUG SEP OCT NOV DEC
Month
Project No. Scale
Figure 10 500 Not To Scale Location Date
FFCSt. Alban's, NL August 2009
Average town daily water usage, fish hatchery make up water and reference water usage.
0
500
1000
1500
2000
2500
20-Aug 30-Aug 9-Sep 19-Sep 29-Sep 9-Oct 19-Oct 29-Oct 8-Nov 18-Nov 28-Nov
Date (2008)
Ave
rage
Usa
ge (m
3 /day
)
Based on 400 L per person per day
Overburden Yield (2,160 m3/day)
Maku up (Daily in m3/day)
AugustSeptember
October November
Town Usage

APPENDIX A
Water Chemistry

Your P.O. #: 2897 Your Project #: 500 Site: ST. ALBAN'S NL Your C.O.C. #: 30133
Attention: John GaleFracflow Consultants Inc154 Major's PathSt. John's, NLA1A 5A1
Report Date: 2009/08/21
CERTIFICATE OF ANALYSIS
MAXXAM JOB #: A9A4219Received: 2009/08/12, 10:19
Sample Matrix: Water# Samples Received: 7
Date Date MethodAnalyses Quantity Extracted Analyzed Laboratory Method ReferenceCarbonate, Bicarbonate and Hydroxide 2 N/A 2009/08/18 Alkalinity 2 N/A 2009/08/18 ATL SOP 00013 R4 Based on EPA310.2 Chloride 2 N/A 2009/08/18 ATL SOP 00014 R6 Based on SM4500-Cl- Colour 2 N/A 2009/08/18 ATL SOP 00020 R3. Based on SM2120C Conductance - water 2 N/A 2009/08/18 ATL SOP 00004 Based on SM2510B
R4/00006 R4Hardness (calculated as CaCO3) 2 N/A 2009/08/18 ATL SOP 00048 Based on SM2340B Metals Water Total OES - Partial Scan 2 N/A 2009/08/18 ATL SOP 00025 R4 Based on EPA200.7 Metals Water Diss. MS - Low Level 5 N/A 2009/08/20 ATL SOP 00024 R4 Based on EPA6020A Metals Water Total MS - Low Level 5 N/A 2009/08/21 ATL SOP 00024 R4 Based on EPA6020A Ion Balance (% Difference) 2 N/A 2009/08/20 Anion and Cation Sum 2 N/A 2009/08/20 Nitrogen Ammonia - water 2 N/A 2009/08/19 ATL SOP 00015 R5 Based on USEPA 350.1Nitrogen - Nitrate + Nitrite 2 N/A 2009/08/18 ATL SOP 00016 R4 Based on USGS - Enz.pH 2 N/A 2009/08/18 ATL SOP 00003 Based on EPA150.1
R5/00005 R6Phosphorus - ortho 2 N/A 2009/08/18 ATL SOP 00021 R3 Based on USEPA 365.1Sat. pH and Langelier Index (@ 20C) 2 N/A 2009/08/20 Sat. pH and Langelier Index (@ 4C) 2 N/A 2009/08/20 Reactive Silica 2 N/A 2009/08/18 ATL SOP 00022 R3 Based on EPA 366.0 Sulphate 2 N/A 2009/08/18 ATL SOP 00023 R3 Based on EPA 375.4 Total Dissolved Solids (TDS calc) 2 N/A 2009/08/20 Organic carbon - Total (TOC) 2 N/A 2009/08/25 ATL SOP 00037 R3 Based on SM5310C Turbidity 2 N/A 2009/08/19 ATL SOP 00011 R4 based on EPA 180.1
* RPDs calculated using raw data. The rounding of final results may result in the apparent difference.
../2
This document is in electronic format, hard copy is available on request.
Page 1 of 19
Your P.O. #: 2897 Your Project #: 500 Site: ST. ALBAN'S NL Your C.O.C. #: 30133
Attention: John GaleFracflow Consultants Inc154 Major's PathSt. John's, NLA1A 5A1
Report Date: 2009/08/21
CERTIFICATE OF ANALYSIS-2-
Encryption Key
Please direct all questions regarding this Certificate of Analysis to your Project Manager.
STACY JOSEPH, Project ManagerEmail: [email protected]# (902) 420-0203
====================================================================Maxxam has procedures in place to guard against improper use of the electronic signature and have the required "signatories", as per section5.10.2 of ISO/IEC 17025:2005(E), signing the reports. SCC and CALA have approved this reporting process and electronic report format.
Total cover pages: 2
This document is in electronic format, hard copy is available on request.
Page 2 of 19

Fracflow Consultants IncMaxxam Job #: A9A4219 Client Project #: 500Report Date: 2009/08/21 Project name: ST. ALBAN'S NL
Your P.O. #: 2897
RESULTS OF ANALYSES OF WATER
Maxxam ID D J 3 8 6 0Sampling Date 2009/07/23COC Number 30133Registration # U n i t s Criteria A 500-CHURCH R D L QC Batch
WELL-JULY23-09
Calculated Parameters
Anion Sum me/L - 2.44 N/A 1907060
Bicarb. Alkalinity (calc. as CaCO3) mg/L - 94 1 1907056
Calculated TDS mg/L - 138 1 1907063
Carb. Alkalinity (calc. as CaCO3) mg/L - ND 1 1907056
Cation Sum me/L - 2.33 N/A 1907060
Hardness (CaCO3) mg/L - 100 1 1907146
Ion Balance (% Difference) % - 2.31 N/A 1907059
Langelier Index (@ 20C) N/A - -0.0270 1907061
Langelier Index (@ 4C) N/A - -0.278 1907062
Saturation pH (@ 20C) N/A - 7.88 1907061
Saturation pH (@ 4C) N/A - 8.13 1907062
Inorganics
Total Alkalinity (Total as CaCO3) mg/L - 94 5 1909489
Dissolved Chloride (Cl) mg/L - 5 1 1909492
Colour TCU - ND 5 1909508
Nitrate + Nitrite mg/L - ND 0.05 1909510
Nitrogen (Ammonia Nitrogen) mg/L - ND 0.05 1911655
Total Organic Carbon (C) mg/L - ND 0.5 1910518
Orthophosphate (P) mg/L - ND 0.01 1909509
pH pH 6.5 : 9.0 7.85 N/A 1910419
Reactive Silica (SiO2) mg/L - 10 0.5 1909503
Dissolved Sulphate (SO4) mg/L - 20 2 1909499
Turbidity NTU - 0.2 0.1 1911841
Conductivity uS/cm - 220 1 1910422
ND = Not detectedRDL = Reportable Detection LimitQC Batch = Quality Control BatchCriteria A: Water - CCME Freshwater Aquatic LifeCanadian Council of ministers of the Environment, "Canadian Water Quality Guidelines for the Protectionof Aquatic Life", 2005 (Freshwater Aquatic Life).Note: Confirm Criteria B excedence versus guidelne, when Criteria A is not an excedence, as theguideline is also dependent on other criteria such as Calcium level.
Page 3 of 19

Fracflow Consultants IncMaxxam Job #: A9A4219 Client Project #: 500Report Date: 2009/08/21 Project name: ST. ALBAN'S NL
Your P.O. #: 2897
RESULTS OF ANALYSES OF WATER
Maxxam ID D J 3 8 6 6Sampling Date 2009/07/23COC Number 30133Registration # U n i t s Criteria A 500-SFW-JULY23-09 R D L QC Batch
Calculated Parameters
Anion Sum me/L - 2.49 N/A 1907060
Bicarb. Alkalinity (calc. as CaCO3) mg/L - 93 1 1907056
Calculated TDS mg/L - 143 1 1907063
Carb. Alkalinity (calc. as CaCO3) mg/L - ND 1 1907056
Cation Sum me/L - 2.49 N/A 1907060
Hardness (CaCO3) mg/L - 98 1 1907146
Ion Balance (% Difference) % - 0.00 N/A 1907059
Langelier Index (@ 20C) N/A - 0.0790 1907061
Langelier Index (@ 4C) N/A - -0.171 1907062
Saturation pH (@ 20C) N/A - 7.91 1907061
Saturation pH (@ 4C) N/A - 8.16 1907062
Inorganics
Total Alkalinity (Total as CaCO3) mg/L - 94 5 1909489
Dissolved Chloride (Cl) mg/L - 8 1 1909492
Colour TCU - ND 5 1909508
Nitrate + Nitrite mg/L - ND 0.05 1909510
Nitrogen (Ammonia Nitrogen) mg/L - ND 0.05 1911655
Total Organic Carbon (C) mg/L - ND 0.5 1910518
Orthophosphate (P) mg/L - ND 0.01 1909509
pH pH 6.5 : 9.0 7.99 N/A 1910419
Reactive Silica (SiO2) mg/L - 10 0.5 1909503
Dissolved Sulphate (SO4) mg/L - 18 2 1909499
Turbidity NTU - 0.2 0.1 1911841
Conductivity uS/cm - 230 1 1910422
ND = Not detectedRDL = Reportable Detection LimitQC Batch = Quality Control BatchCriteria A: Water - CCME Freshwater Aquatic LifeCanadian Council of ministers of the Environment, "Canadian Water Quality Guidelines for theProtection of Aquatic Life", 2005 (Freshwater Aquatic Life).Note: Confirm Criteria B excedence versus guidelne, when Criteria A is not an excedence, asthe guideline is also dependent on other criteria such as Calcium level.
Page 4 of 19

Fracflow Consultants IncMaxxam Job #: A9A4219 Client Project #: 500Report Date: 2009/08/21 Project name: ST. ALBAN'S NL
Your P.O. #: 2897
ELEMENTS BY ICP-AES (WATER)
Maxxam ID D J 3 8 6 0Sampling Date 2009/07/23COC Number 30133Registration # U n i t s Criteria A Criteria B 500-CHURCH R D L QC Batch
WELL-JULY23-09
Metals
Total Calcium (Ca) mg/L - - 33 0.1 1911362
Total Copper (Cu) mg/L 0.004 .002 -.004 ND 0.01 1911362
Total Iron (Fe) mg/L 0.3 - 0.09 0.02 1911362
Total Magnesium (Mg) mg/L - - 5.2 0.1 1911362
Total Manganese (Mn) mg/L - - 0.09 0.01 1911362
Total Potassium (K) mg/L - - 3.3 0.1 1911362
Total Sodium (Na) mg/L - - 5.7 0.1 1911362
Total Zinc (Zn) mg/L 0.03 - ND 0.05 1911362
ND = Not detectedRDL = Reportable Detection LimitQC Batch = Quality Control BatchCriteria A,Criteria B: Water - CCME Freshwater Aquatic LifeCanadian Council of ministers of the Environment, "Canadian Water Quality Guidelines for the Protectionof Aquatic Life", 2005 (Freshwater Aquatic Life).Note: Confirm Criteria B excedence versus guidelne, when Criteria A is not an excedence, as theguideline is also dependent on other criteria such as Calcium level.
Page 5 of 19

Fracflow Consultants IncMaxxam Job #: A9A4219 Client Project #: 500Report Date: 2009/08/21 Project name: ST. ALBAN'S NL
Your P.O. #: 2897
ELEMENTS BY ICP-AES (WATER)
Maxxam ID D J 3 8 6 6Sampling Date 2009/07/23COC Number 30133Registration # U n i t s Criteria A Criteria B 500-SFW-JULY23-09 R D L QC Batch
Metals
Total Calcium (Ca) mg/L - - 30 0.1 1911362
Total Copper (Cu) mg/L 0.004 .002 -.004 ND 0.01 1911362
Total Iron (Fe) mg/L 0.3 - 0.07 0.02 1911362
Total Magnesium (Mg) mg/L - - 4.3 0.1 1911362
Total Manganese (Mn) mg/L - - 0.04 0.01 1911362
Total Potassium (K) mg/L - - 3.3 0.1 1911362
Total Sodium (Na) mg/L - - 12 0.1 1911362
Total Zinc (Zn) mg/L 0.03 - ND 0.05 1911362
ND = Not detectedRDL = Reportable Detection LimitQC Batch = Quality Control BatchCriteria A,Criteria B: Water - CCME Freshwater Aquatic LifeCanadian Council of ministers of the Environment, "Canadian Water Quality Guidelines forthe Protection of Aquatic Life", 2005 (Freshwater Aquatic Life).Note: Confirm Criteria B excedence versus guidelne, when Criteria A is not an excedence, asthe guideline is also dependent on other criteria such as Calcium level.
Page 6 of 19
Fracflow Consultants IncMaxxam Job #: A9A4219 Client Project #: 500Report Date: 2009/08/21 Project name: ST. ALBAN'S NL
Your P.O. #: 2897
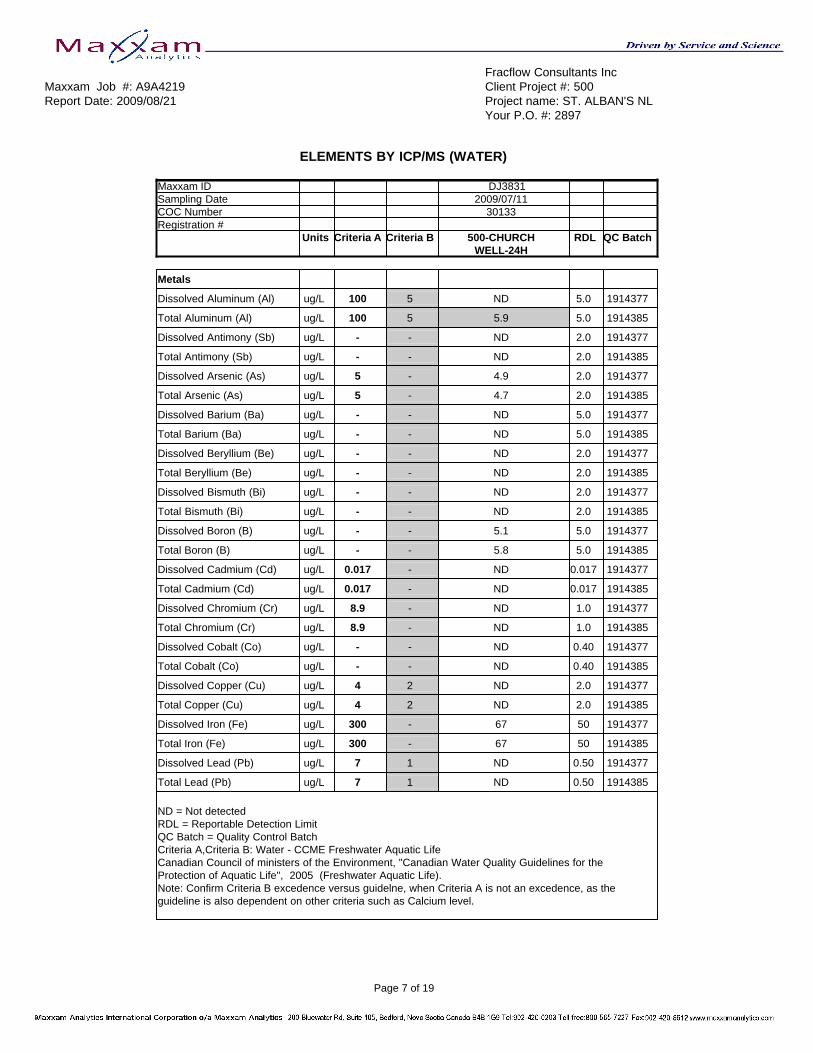
ELEMENTS BY ICP/MS (WATER)
Maxxam ID D J 3 8 3 1Sampling Date 2009/07/11COC Number 30133Registration # U n i t s Criteria A Criteria B 500-CHURCH R D L QC Batch
WELL-24H
Metals
Dissolved Aluminum (Al) ug/L 100 5 ND 5.0 1914377
Total Aluminum (Al) ug/L 100 5 5.9 5.0 1914385
Dissolved Antimony (Sb) ug/L - - ND 2.0 1914377
Total Antimony (Sb) ug/L - - ND 2.0 1914385
Dissolved Arsenic (As) ug/L 5 - 4.9 2.0 1914377
Total Arsenic (As) ug/L 5 - 4.7 2.0 1914385
Dissolved Barium (Ba) ug/L - - ND 5.0 1914377
Total Barium (Ba) ug/L - - ND 5.0 1914385
Dissolved Beryllium (Be) ug/L - - ND 2.0 1914377
Total Beryllium (Be) ug/L - - ND 2.0 1914385
Dissolved Bismuth (Bi) ug/L - - ND 2.0 1914377
Total Bismuth (Bi) ug/L - - ND 2.0 1914385
Dissolved Boron (B) ug/L - - 5.1 5.0 1914377
Total Boron (B) ug/L - - 5.8 5.0 1914385
Dissolved Cadmium (Cd) ug/L 0.017 - ND 0.017 1914377
Total Cadmium (Cd) ug/L 0.017 - ND 0.017 1914385
Dissolved Chromium (Cr) ug/L 8.9 - ND 1.0 1914377
Total Chromium (Cr) ug/L 8.9 - ND 1.0 1914385
Dissolved Cobalt (Co) ug/L - - ND 0.40 1914377
Total Cobalt (Co) ug/L - - ND 0.40 1914385
Dissolved Copper (Cu) ug/L 4 2 ND 2.0 1914377
Total Copper (Cu) ug/L 4 2 ND 2.0 1914385
Dissolved Iron (Fe) ug/L 300 - 67 50 1914377
Total Iron (Fe) ug/L 300 - 67 50 1914385
Dissolved Lead (Pb) ug/L 7 1 ND 0.50 1914377
Total Lead (Pb) ug/L 7 1 ND 0.50 1914385
ND = Not detectedRDL = Reportable Detection LimitQC Batch = Quality Control BatchCriteria A,Criteria B: Water - CCME Freshwater Aquatic LifeCanadian Council of ministers of the Environment, "Canadian Water Quality Guidelines for theProtection of Aquatic Life", 2005 (Freshwater Aquatic Life).Note: Confirm Criteria B excedence versus guidelne, when Criteria A is not an excedence, as theguideline is also dependent on other criteria such as Calcium level.
Page 7 of 19

Fracflow Consultants IncMaxxam Job #: A9A4219 Client Project #: 500Report Date: 2009/08/21 Project name: ST. ALBAN'S NL
Your P.O. #: 2897
ELEMENTS BY ICP/MS (WATER)
Maxxam ID D J 3 8 3 1Sampling Date 2009/07/11COC Number 30133Registration # U n i t s Criteria A Criteria B 500-CHURCH R D L QC Batch
WELL-24H
Dissolved Manganese (Mn) ug/L - - 87.3 2.0 1914377
Total Manganese (Mn) ug/L - - 86.6 2.0 1914385
Dissolved Molybdenum (Mo) ug/L 73 - ND 2.0 1914377
Total Molybdenum (Mo) ug/L 73 - ND 2.0 1914385
Dissolved Nickel (Ni) ug/L 25 25 ND 2.0 1914377
Total Nickel (Ni) ug/L 25 25 ND 2.0 1914385
Dissolved Selenium (Se) ug/L 1 - ND 1.0 1914377
Total Selenium (Se) ug/L 1 - ND 1.0 1914385
Dissolved Silver (Ag) ug/L 0.1 - ND 0.10 1914377
Total Silver (Ag) ug/L 0.1 - ND 0.10 1914385
Dissolved Strontium (Sr) ug/L - - 138 5.0 1914377
Total Strontium (Sr) ug/L - - 141 5.0 1914385
Dissolved Thallium (Tl) ug/L 0.8 - ND 0.10 1914377
Total Thallium (Tl) ug/L 0.8 - ND 0.10 1914385
Dissolved Tin (Sn) ug/L - - ND 2.0 1914377
Total Tin (Sn) ug/L - - ND 2.0 1914385
Dissolved Titanium (Ti) ug/L - - ND 2.0 1914377
Total Titanium (Ti) ug/L - - ND 2.0 1914385
Dissolved Uranium (U) ug/L - - 0.41 0.10 1914377
Total Uranium (U) ug/L - - 0.48 0.10 1914385
Dissolved Vanadium (V) ug/L - - ND 2.0 1914377
Total Vanadium (V) ug/L - - ND 2.0 1914385
Dissolved Zinc (Zn) ug/L 30 - ND 5.0 1914377
Total Zinc (Zn) ug/L 30 - ND 5.0 1914385
ND = Not detectedRDL = Reportable Detection LimitQC Batch = Quality Control BatchCriteria A,Criteria B: Water - CCME Freshwater Aquatic LifeCanadian Council of ministers of the Environment, "Canadian Water Quality Guidelines for theProtection of Aquatic Life", 2005 (Freshwater Aquatic Life).Note: Confirm Criteria B excedence versus guidelne, when Criteria A is not an excedence, as theguideline is also dependent on other criteria such as Calcium level.
Page 8 of 19

Fracflow Consultants IncMaxxam Job #: A9A4219 Client Project #: 500Report Date: 2009/08/21 Project name: ST. ALBAN'S NL
Your P.O. #: 2897
ELEMENTS BY ICP/MS (WATER)
Maxxam ID D J 3 8 4 1 D J 3 8 4 2Sampling Date 2009/07/12 2009/07/16COC Number 30133 30133Registration # U n i t s Criteria A Criteria B 500-CHURCH 500-SFW-24H R D L QC Batch
WELL-48H
Metals
Dissolved Aluminum (Al) ug/L 100 5 132 6.3 5.0 1914377
Total Aluminum (Al) ug/L 100 5 7.9 10.8 5.0 1914385
Dissolved Antimony (Sb) ug/L - - ND ND 2.0 1914377
Total Antimony (Sb) ug/L - - ND ND 2.0 1914385
Dissolved Arsenic (As) ug/L 5 - 5.1 2.9 2.0 1914377
Total Arsenic (As) ug/L 5 - 4.7 ND 2.0 1914385
Dissolved Barium (Ba) ug/L - - ND ND 5.0 1914377
Total Barium (Ba) ug/L - - ND ND 5.0 1914385
Dissolved Beryllium (Be) ug/L - - ND ND 2.0 1914377
Total Beryllium (Be) ug/L - - ND ND 2.0 1914385
Dissolved Bismuth (Bi) ug/L - - ND ND 2.0 1914377
Total Bismuth (Bi) ug/L - - ND ND 2.0 1914385
Dissolved Boron (B) ug/L - - 5.2 7.0 5.0 1914377
Total Boron (B) ug/L - - 5.4 6.8 5.0 1914385
Dissolved Cadmium (Cd) ug/L 0.017 - ND ND 0.017 1914377
Total Cadmium (Cd) ug/L 0.017 - ND ND 0.017 1914385
Dissolved Chromium (Cr) ug/L 8.9 - ND ND 1.0 1914377
Total Chromium (Cr) ug/L 8.9 - ND ND 1.0 1914385
Dissolved Cobalt (Co) ug/L - - ND ND 0.40 1914377
Total Cobalt (Co) ug/L - - ND ND 0.40 1914385
Dissolved Copper (Cu) ug/L 4 2 ND ND 2.0 1914377
Total Copper (Cu) ug/L 4 2 ND 2.1 2.0 1914385
Dissolved Iron (Fe) ug/L 300 - 102 ND 50 1914377
Total Iron (Fe) ug/L 300 - 70 ND 50 1914385
Dissolved Lead (Pb) ug/L 7 1 ND ND 0.50 1914377
Total Lead (Pb) ug/L 7 1 ND ND 0.50 1914385
ND = Not detectedRDL = Reportable Detection LimitQC Batch = Quality Control BatchCriteria A,Criteria B: Water - CCME Freshwater Aquatic LifeCanadian Council of ministers of the Environment, "Canadian Water Quality Guidelines for the Protection of AquaticLife", 2005 (Freshwater Aquatic Life).Note: Confirm Criteria B excedence versus guidelne, when Criteria A is not an excedence, as the guideline is alsodependent on other criteria such as Calcium level.
Page 9 of 19

Fracflow Consultants IncMaxxam Job #: A9A4219 Client Project #: 500Report Date: 2009/08/21 Project name: ST. ALBAN'S NL
Your P.O. #: 2897
ELEMENTS BY ICP/MS (WATER)
Maxxam ID D J 3 8 4 1 D J 3 8 4 2Sampling Date 2009/07/12 2009/07/16COC Number 30133 30133Registration # U n i t s Criteria A Criteria B 500-CHURCH 500-SFW-24H R D L QC Batch
WELL-48H
Dissolved Manganese (Mn) ug/L - - 88.7 34.4 2.0 1914377
Total Manganese (Mn) ug/L - - 90.4 27.3 2.0 1914385
Dissolved Molybdenum (Mo) ug/L 73 - ND ND 2.0 1914377
Total Molybdenum (Mo) ug/L 73 - ND ND 2.0 1914385
Dissolved Nickel (Ni) ug/L 25 25 ND ND 2.0 1914377
Total Nickel (Ni) ug/L 25 25 ND ND 2.0 1914385
Dissolved Selenium (Se) ug/L 1 - ND ND 1.0 1914377
Total Selenium (Se) ug/L 1 - ND ND 1.0 1914385
Dissolved Silver (Ag) ug/L 0.1 - ND ND 0.10 1914377
Total Silver (Ag) ug/L 0.1 - ND ND 0.10 1914385
Dissolved Strontium (Sr) ug/L - - 140 124 5.0 1914377
Total Strontium (Sr) ug/L - - 146 126 5.0 1914385
Dissolved Thallium (Tl) ug/L 0.8 - ND ND 0.10 1914377
Total Thallium (Tl) ug/L 0.8 - ND ND 0.10 1914385
Dissolved Tin (Sn) ug/L - - ND ND 2.0 1914377
Total Tin (Sn) ug/L - - ND ND 2.0 1914385
Dissolved Titanium (Ti) ug/L - - ND ND 2.0 1914377
Total Titanium (Ti) ug/L - - ND ND 2.0 1914385
Dissolved Uranium (U) ug/L - - 0.49 0.26 0.10 1914377
Total Uranium (U) ug/L - - 0.48 0.32 0.10 1914385
Dissolved Vanadium (V) ug/L - - ND ND 2.0 1914377
Total Vanadium (V) ug/L - - ND ND 2.0 1914385
Dissolved Zinc (Zn) ug/L 30 - ND 7.3 5.0 1914377
Total Zinc (Zn) ug/L 30 - ND 5.4 5.0 1914385
ND = Not detectedRDL = Reportable Detection LimitQC Batch = Quality Control BatchCriteria A,Criteria B: Water - CCME Freshwater Aquatic LifeCanadian Council of ministers of the Environment, "Canadian Water Quality Guidelines for the Protection of AquaticLife", 2005 (Freshwater Aquatic Life).Note: Confirm Criteria B excedence versus guidelne, when Criteria A is not an excedence, as the guideline is alsodependent on other criteria such as Calcium level.
Page 10 of 19

Fracflow Consultants IncMaxxam Job #: A9A4219 Client Project #: 500Report Date: 2009/08/21 Project name: ST. ALBAN'S NL
Your P.O. #: 2897
ELEMENTS BY ICP/MS (WATER)
Maxxam ID D J 3 8 4 3 D J 3 8 4 4Sampling Date 2009/07/17 2009/07/18COC Number 30133 30133Registration # U n i t s Criteria A Criteria B 500-SFW-48H 500-SFW-72H R D L QC Batch
Metals
Dissolved Aluminum (Al) ug/L 100 5 ND 9.6 5.0 1914377
Total Aluminum (Al) ug/L 100 5 5.8 ND 5.0 1914385
Dissolved Antimony (Sb) ug/L - - ND ND 2.0 1914377
Total Antimony (Sb) ug/L - - ND ND 2.0 1914385
Dissolved Arsenic (As) ug/L 5 - 3.1 3.3 2.0 1914377
Total Arsenic (As) ug/L 5 - 3.1 2.9 2.0 1914385
Dissolved Barium (Ba) ug/L - - ND ND 5.0 1914377
Total Barium (Ba) ug/L - - ND ND 5.0 1914385
Dissolved Beryllium (Be) ug/L - - ND ND 2.0 1914377
Total Beryllium (Be) ug/L - - ND ND 2.0 1914385
Dissolved Bismuth (Bi) ug/L - - ND ND 2.0 1914377
Total Bismuth (Bi) ug/L - - ND ND 2.0 1914385
Dissolved Boron (B) ug/L - - 6.9 6.6 5.0 1914377
Total Boron (B) ug/L - - 8.0 7.7 5.0 1914385
Dissolved Cadmium (Cd) ug/L 0.017 - ND ND 0.017 1914377
Total Cadmium (Cd) ug/L 0.017 - ND ND 0.017 1914385
Dissolved Chromium (Cr) ug/L 8.9 - ND ND 1.0 1914377
Total Chromium (Cr) ug/L 8.9 - ND ND 1.0 1914385
Dissolved Cobalt (Co) ug/L - - ND ND 0.40 1914377
Total Cobalt (Co) ug/L - - ND ND 0.40 1914385
Dissolved Copper (Cu) ug/L 4 2 ND ND 2.0 1914377
Total Copper (Cu) ug/L 4 2 ND ND 2.0 1914385
Dissolved Iron (Fe) ug/L 300 - ND ND 50 1914377
Total Iron (Fe) ug/L 300 - ND ND 50 1914385
Dissolved Lead (Pb) ug/L 7 1 ND ND 0.50 1914377
Total Lead (Pb) ug/L 7 1 ND ND 0.50 1914385
Dissolved Manganese (Mn) ug/L - - 34.2 34.6 2.0 1914377
ND = Not detectedRDL = Reportable Detection LimitQC Batch = Quality Control BatchCriteria A,Criteria B: Water - CCME Freshwater Aquatic LifeCanadian Council of ministers of the Environment, "Canadian Water Quality Guidelines for the Protection ofAquatic Life", 2005 (Freshwater Aquatic Life).Note: Confirm Criteria B excedence versus guidelne, when Criteria A is not an excedence, as the guideline isalso dependent on other criteria such as Calcium level.
Page 11 of 19

Fracflow Consultants IncMaxxam Job #: A9A4219 Client Project #: 500Report Date: 2009/08/21 Project name: ST. ALBAN'S NL
Your P.O. #: 2897
ELEMENTS BY ICP/MS (WATER)
Maxxam ID D J 3 8 4 3 D J 3 8 4 4Sampling Date 2009/07/17 2009/07/18COC Number 30133 30133Registration # U n i t s Criteria A Criteria B 500-SFW-48H 500-SFW-72H R D L QC Batch
Total Manganese (Mn) ug/L - - 34.6 33.3 2.0 1914385
Dissolved Molybdenum (Mo) ug/L 73 - ND ND 2.0 1914377
Total Molybdenum (Mo) ug/L 73 - ND ND 2.0 1914385
Dissolved Nickel (Ni) ug/L 25 25 ND ND 2.0 1914377
Total Nickel (Ni) ug/L 25 25 ND ND 2.0 1914385
Dissolved Selenium (Se) ug/L 1 - ND ND 1.0 1914377
Total Selenium (Se) ug/L 1 - ND ND 1.0 1914385
Dissolved Silver (Ag) ug/L 0.1 - ND ND 0.10 1914377
Total Silver (Ag) ug/L 0.1 - ND ND 0.10 1914385
Dissolved Strontium (Sr) ug/L - - 121 124 5.0 1914377
Total Strontium (Sr) ug/L - - 132 127 5.0 1914385
Dissolved Thallium (Tl) ug/L 0.8 - ND ND 0.10 1914377
Total Thallium (Tl) ug/L 0.8 - ND ND 0.10 1914385
Dissolved Tin (Sn) ug/L - - ND ND 2.0 1914377
Total Tin (Sn) ug/L - - ND ND 2.0 1914385
Dissolved Titanium (Ti) ug/L - - ND ND 2.0 1914377
Total Titanium (Ti) ug/L - - ND ND 2.0 1914385
Dissolved Uranium (U) ug/L - - 0.25 0.26 0.10 1914377
Total Uranium (U) ug/L - - 0.28 0.27 0.10 1914385
Dissolved Vanadium (V) ug/L - - ND ND 2.0 1914377
Total Vanadium (V) ug/L - - ND ND 2.0 1914385
Dissolved Zinc (Zn) ug/L 30 - ND 20.2 5.0 1914377
Total Zinc (Zn) ug/L 30 - ND ND 5.0 1914385
ND = Not detectedRDL = Reportable Detection LimitQC Batch = Quality Control BatchCriteria A,Criteria B: Water - CCME Freshwater Aquatic LifeCanadian Council of ministers of the Environment, "Canadian Water Quality Guidelines for the Protection ofAquatic Life", 2005 (Freshwater Aquatic Life).Note: Confirm Criteria B excedence versus guidelne, when Criteria A is not an excedence, as the guideline isalso dependent on other criteria such as Calcium level.
Page 12 of 19

Fracflow Consultants IncMaxxam Job #: A9A4219 Client Project #: 500Report Date: 2009/08/21 Project name: ST. ALBAN'S NL
Your P.O. #: 2897
GENERAL COMMENTS
Sample DJ3841-01: Poor Total vs Dissolved agreement for Aluminum verified by repeat analysis.
Results relate only to the items tested.
Page 13 of 19

Fracflow Consultants IncAttention: John Gale Client Project #: 500P.O. #: 2897Project name: ST. ALBAN'S NL
Quality Assurance ReportMaxxam Job Number: DA9A4219
QA/QC DateBatch AnalyzedNum Init QC Type Parameter yyyy/mm/dd Value Recovery Units QC Limits
1909489 MCN Matrix Spike Total Alkalinity (Total as CaCO3) 2009/08/18 NC % 80 - 120QC Standard Total Alkalinity (Total as CaCO3) 2009/08/18 106 % 80 - 120Spiked Blank Total Alkalinity (Total as CaCO3) 2009/08/18 109 % 80 - 120Method Blank Total Alkalinity (Total as CaCO3) 2009/08/18 ND, RDL=5 mg/LRPD Total Alkalinity (Total as CaCO3) 2009/08/18 NC % 25
1909492 JOA Matrix Spike Dissolved Chloride (Cl) 2009/08/18 104 % 80 - 120QC Standard Dissolved Chloride (Cl) 2009/08/18 102 % 80 - 120Spiked Blank Dissolved Chloride (Cl) 2009/08/18 105 % 80 - 120Method Blank Dissolved Chloride (Cl) 2009/08/18 ND, RDL=1 mg/LRPD Dissolved Chloride (Cl) 2009/08/18 NC % 25
1909499 SMT Matrix Spike Dissolved Sulphate (SO4) 2009/08/18 109 % 80 - 120QC Standard Dissolved Sulphate (SO4) 2009/08/18 109 % 80 - 120Spiked Blank Dissolved Sulphate (SO4) 2009/08/18 108 % 80 - 120Method Blank Dissolved Sulphate (SO4) 2009/08/18 ND, RDL=2 mg/LRPD Dissolved Sulphate (SO4) 2009/08/18 NC % 25
1909503 MCN Matrix Spike Reactive Silica (SiO2) 2009/08/18 NC % 80 - 120QC Standard Reactive Silica (SiO2) 2009/08/18 99 % 75 - 125Spiked Blank Reactive Silica (SiO2) 2009/08/18 98 % 80 - 120Method Blank Reactive Silica (SiO2) 2009/08/18 ND, RDL=0.5 mg/LRPD Reactive Silica (SiO2) 2009/08/18 0.5 % 25
1909508 MCN QC Standard Colour 2009/08/18 104 % 80 - 120Method Blank Colour 2009/08/18 ND, RDL=5 TCURPD Colour 2009/08/18 NC % 25
1909509 JOA Matrix Spike Orthophosphate (P) 2009/08/18 NC % 80 - 120QC Standard Orthophosphate (P) 2009/08/18 96 % 80 - 120Spiked Blank Orthophosphate (P) 2009/08/18 95 % 80 - 120Method Blank Orthophosphate (P) 2009/08/18 ND, RDL=0.01 mg/LRPD Orthophosphate (P) 2009/08/18 1.6 % 25
1909510 SMT Matrix Spike Nitrate + Nitrite 2009/08/18 101 % 80 - 120QC Standard Nitrate + Nitrite 2009/08/18 101 % 80 - 120Spiked Blank Nitrate + Nitrite 2009/08/18 102 % 80 - 120Method Blank Nitrate + Nitrite 2009/08/18 ND, RDL=0.05 mg/LRPD Nitrate + Nitrite 2009/08/18 NC % 25
1910419 ARS QC Standard pH 2009/08/18 100 % 80 - 120Method Blank pH 2009/08/18 6.23, RDL=0 pHRPD pH 2009/08/18 1.4 % 25
1910422 ARS QC Standard Conductivity 2009/08/18 102 % 80 - 120Method Blank Conductivity 2009/08/18 ND, RDL=1 uS/cmRPD Conductivity 2009/08/18 5.4 % 25
1910518 BMM Matrix Spike Total Organic Carbon (C) 2009/08/25 97 % 75 - 125QC Standard Total Organic Carbon (C) 2009/08/18 104 % 80 - 120Spiked Blank Total Organic Carbon (C) 2009/08/25 102 % 75 - 125RPD Total Organic Carbon (C) 2009/08/25 NC % 25
1911362 SSI Matrix Spike Total Calcium (Ca) 2009/08/18 92 % 80 - 120Total Copper (Cu) 2009/08/18 96 % 80 - 120Total Iron (Fe) 2009/08/18 93 % 80 - 120Total Magnesium (Mg) 2009/08/18 92 % 80 - 120Total Manganese (Mn) 2009/08/18 95 % 80 - 120Total Potassium (K) 2009/08/18 101 % 80 - 120Total Sodium (Na) 2009/08/18 101 % 80 - 120Total Zinc (Zn) 2009/08/18 94 % 80 - 120
QC Standard Total Calcium (Ca) 2009/08/18 99 % 80 - 120Total Copper (Cu) 2009/08/18 106 % 80 - 120Total Iron (Fe) 2009/08/18 99 % 80 - 120Total Magnesium (Mg) 2009/08/18 96 % 80 - 120
This document is in electronic format, hard copy is available on request.Page 14 of 19

Fracflow Consultants IncAttention: John Gale Client Project #: 500P.O. #: 2897Project name: ST. ALBAN'S NL
Quality Assurance Report (Continued)Maxxam Job Number: DA9A4219
QA/QC DateBatch AnalyzedNum Init QC Type Parameter yyyy/mm/dd Value Recovery Units QC Limits
1911362 SSI QC Standard Total Manganese (Mn) 2009/08/18 99 % 80 - 120Total Potassium (K) 2009/08/18 103 % 80 - 120Total Sodium (Na) 2009/08/18 102 % 80 - 120Total Zinc (Zn) 2009/08/18 96 % 80 - 120
Spiked Blank Total Calcium (Ca) 2009/08/18 92 % 80 - 120Total Copper (Cu) 2009/08/18 94 % 80 - 120Total Iron (Fe) 2009/08/18 92 % 80 - 120Total Magnesium (Mg) 2009/08/18 94 % 80 - 120Total Manganese (Mn) 2009/08/18 94 % 80 - 120Total Potassium (K) 2009/08/18 100 % 80 - 120Total Sodium (Na) 2009/08/18 99 % 80 - 120Total Zinc (Zn) 2009/08/18 93 % 80 - 120
Method Blank Total Calcium (Ca) 2009/08/18 ND, RDL=0.1 mg/LTotal Copper (Cu) 2009/08/18 ND, RDL=0.01 mg/LTotal Iron (Fe) 2009/08/18 ND, RDL=0.02 mg/LTotal Magnesium (Mg) 2009/08/18 ND, RDL=0.1 mg/LTotal Manganese (Mn) 2009/08/18 ND, RDL=0.01 mg/LTotal Potassium (K) 2009/08/18 ND, RDL=0.1 mg/LTotal Sodium (Na) 2009/08/18 ND, RDL=0.1 mg/LTotal Zinc (Zn) 2009/08/18 ND, RDL=0.05 mg/L
RPD Total Calcium (Ca) 2009/08/18 0.8 % 25Total Magnesium (Mg) 2009/08/18 1.3 % 25Total Potassium (K) 2009/08/18 0.9 % 25Total Sodium (Na) 2009/08/18 0.6 % 25
1911655 JOA Matrix Spike Nitrogen (Ammonia Nitrogen) 2009/08/19 95 % 80 - 120QC Standard Nitrogen (Ammonia Nitrogen) 2009/08/19 100 % 80 - 120Spiked Blank Nitrogen (Ammonia Nitrogen) 2009/08/19 97 % 80 - 120Method Blank Nitrogen (Ammonia Nitrogen) 2009/08/19 ND, RDL=0.05 mg/LRPD Nitrogen (Ammonia Nitrogen) 2009/08/19 NC % 25
1911841 JRC QC Standard Turbidity 2009/08/19 100 % 80 - 120Method Blank Turbidity 2009/08/19 ND, RDL=0.1 NTURPD Turbidity 2009/08/19 8.5 % 25
1914377 KGU QC Standard Dissolved Aluminum (Al) 2009/08/20 99 % 80 - 120Dissolved Antimony (Sb) 2009/08/20 129 ( 1 ) % 80 - 120Dissolved Arsenic (As) 2009/08/20 92 % 80 - 120Dissolved Barium (Ba) 2009/08/20 99 % 80 - 120Dissolved Beryllium (Be) 2009/08/20 93 % 80 - 120Dissolved Bismuth (Bi) 2009/08/20 108 % 80 - 120Dissolved Boron (B) 2009/08/20 94 % 80 - 120Dissolved Cadmium (Cd) 2009/08/20 102 % 80 - 120Dissolved Chromium (Cr) 2009/08/20 101 % 80 - 120Dissolved Cobalt (Co) 2009/08/20 98 % 80 - 120Dissolved Copper (Cu) 2009/08/20 90 % 80 - 120Dissolved Iron (Fe) 2009/08/20 96 % 80 - 120Dissolved Lead (Pb) 2009/08/20 96 % 80 - 120Dissolved Manganese (Mn) 2009/08/20 93 % 80 - 120Dissolved Molybdenum (Mo) 2009/08/20 110 % 80 - 120Dissolved Nickel (Ni) 2009/08/20 95 % 80 - 120Dissolved Selenium (Se) 2009/08/20 91 % 80 - 120Dissolved Silver (Ag) 2009/08/20 90 % 80 - 120Dissolved Strontium (Sr) 2009/08/20 99 % 80 - 120Dissolved Thallium (Tl) 2009/08/20 92 % 80 - 120Dissolved Vanadium (V) 2009/08/20 100 % 80 - 120Dissolved Zinc (Zn) 2009/08/20 83 % 80 - 120
Spiked Blank Dissolved Aluminum (Al) 2009/08/20 109 % 80 - 120
This document is in electronic format, hard copy is available on request.Page 15 of 19

Fracflow Consultants IncAttention: John Gale Client Project #: 500P.O. #: 2897Project name: ST. ALBAN'S NL
Quality Assurance Report (Continued)Maxxam Job Number: DA9A4219
QA/QC DateBatch AnalyzedNum Init QC Type Parameter yyyy/mm/dd Value Recovery Units QC Limits
1914377 KGU Spiked Blank Dissolved Antimony (Sb) 2009/08/20 100 % 80 - 120Dissolved Arsenic (As) 2009/08/20 103 % 80 - 120Dissolved Barium (Ba) 2009/08/20 103 % 80 - 120Dissolved Beryllium (Be) 2009/08/20 107 % 80 - 120Dissolved Bismuth (Bi) 2009/08/20 112 % 80 - 120Dissolved Boron (B) 2009/08/20 102 % 80 - 120Dissolved Cadmium (Cd) 2009/08/20 103 % 80 - 120Dissolved Chromium (Cr) 2009/08/20 108 % 80 - 120Dissolved Cobalt (Co) 2009/08/20 107 % 80 - 120Dissolved Copper (Cu) 2009/08/20 111 % 80 - 120Dissolved Lead (Pb) 2009/08/20 107 % 80 - 120Dissolved Manganese (Mn) 2009/08/20 106 % 80 - 120Dissolved Molybdenum (Mo) 2009/08/20 106 % 80 - 120Dissolved Nickel (Ni) 2009/08/20 108 % 80 - 120Dissolved Selenium (Se) 2009/08/20 98 % 80 - 120Dissolved Silver (Ag) 2009/08/20 98 % 80 - 120Dissolved Strontium (Sr) 2009/08/20 106 % 80 - 120Dissolved Thallium (Tl) 2009/08/20 111 % 80 - 120Dissolved Tin (Sn) 2009/08/20 109 % 80 - 120Dissolved Titanium (Ti) 2009/08/20 106 % 80 - 120Dissolved Uranium (U) 2009/08/20 112 % 80 - 120Dissolved Vanadium (V) 2009/08/20 110 % 80 - 120Dissolved Zinc (Zn) 2009/08/20 109 % 80 - 120
Method Blank Dissolved Aluminum (Al) 2009/08/20 ND, RDL=5.0 ug/LDissolved Antimony (Sb) 2009/08/20 ND, RDL=2.0 ug/LDissolved Arsenic (As) 2009/08/20 ND, RDL=2.0 ug/LDissolved Barium (Ba) 2009/08/20 ND, RDL=5.0 ug/LDissolved Beryllium (Be) 2009/08/20 ND, RDL=2.0 ug/LDissolved Bismuth (Bi) 2009/08/20 ND, RDL=2.0 ug/LDissolved Boron (B) 2009/08/20 ND, RDL=5.0 ug/LDissolved Cadmium (Cd) 2009/08/20 ND, RDL=0.017 ug/LDissolved Chromium (Cr) 2009/08/20 ND, RDL=1.0 ug/LDissolved Cobalt (Co) 2009/08/20 ND, RDL=0.40 ug/LDissolved Copper (Cu) 2009/08/20 ND, RDL=2.0 ug/LDissolved Iron (Fe) 2009/08/20 ND, RDL=50 ug/LDissolved Lead (Pb) 2009/08/20 ND, RDL=0.50 ug/LDissolved Manganese (Mn) 2009/08/20 ND, RDL=2.0 ug/LDissolved Molybdenum (Mo) 2009/08/20 ND, RDL=2.0 ug/LDissolved Nickel (Ni) 2009/08/20 ND, RDL=2.0 ug/LDissolved Selenium (Se) 2009/08/20 ND, RDL=1.0 ug/LDissolved Silver (Ag) 2009/08/20 ND, RDL=0.10 ug/LDissolved Strontium (Sr) 2009/08/20 ND, RDL=5.0 ug/LDissolved Thallium (Tl) 2009/08/20 ND, RDL=0.10 ug/LDissolved Tin (Sn) 2009/08/20 ND, RDL=2.0 ug/LDissolved Titanium (Ti) 2009/08/20 ND, RDL=2.0 ug/LDissolved Uranium (U) 2009/08/20 ND, RDL=0.10 ug/LDissolved Vanadium (V) 2009/08/20 ND, RDL=2.0 ug/LDissolved Zinc (Zn) 2009/08/20 ND, RDL=5.0 ug/L
1914385 MPT QC Standard Total Aluminum (Al) 2009/08/21 100 % 80 - 120Total Antimony (Sb) 2009/08/21 134 ( 2 ) % 80 - 120Total Arsenic (As) 2009/08/21 99 % 80 - 120Total Barium (Ba) 2009/08/21 98 % 80 - 120Total Beryllium (Be) 2009/08/21 95 % 80 - 120Total Boron (B) 2009/08/21 87 % 80 - 120Total Cadmium (Cd) 2009/08/21 99 % 80 - 120
This document is in electronic format, hard copy is available on request.Page 16 of 19

Fracflow Consultants IncAttention: John Gale Client Project #: 500P.O. #: 2897Project name: ST. ALBAN'S NL
Quality Assurance Report (Continued)Maxxam Job Number: DA9A4219
QA/QC DateBatch AnalyzedNum Init QC Type Parameter yyyy/mm/dd Value Recovery Units QC Limits
1914385 MPT QC Standard Total Chromium (Cr) 2009/08/21 98 % 80 - 120Total Cobalt (Co) 2009/08/21 103 % 80 - 120Total Copper (Cu) 2009/08/21 102 % 80 - 120Total Iron (Fe) 2009/08/21 108 % 80 - 120Total Lead (Pb) 2009/08/21 100 % 80 - 120Total Manganese (Mn) 2009/08/21 100 % 80 - 120Total Molybdenum (Mo) 2009/08/21 111 % 80 - 120Total Nickel (Ni) 2009/08/21 103 % 80 - 120Total Selenium (Se) 2009/08/21 105 % 80 - 120Total Strontium (Sr) 2009/08/21 103 % 80 - 120Total Thallium (Tl) 2009/08/21 121 ( 1 ) % 80 - 120Total Uranium (U) 2009/08/21 91 % 80 - 120Total Vanadium (V) 2009/08/21 102 % 80 - 120Total Zinc (Zn) 2009/08/21 98 % 80 - 120
Spiked Blank Total Aluminum (Al) 2009/08/21 104 % 80 - 120Total Antimony (Sb) 2009/08/21 103 % 80 - 120Total Arsenic (As) 2009/08/21 96 % 80 - 120Total Barium (Ba) 2009/08/21 99 % 80 - 120Total Beryllium (Be) 2009/08/21 95 % 80 - 120Total Bismuth (Bi) 2009/08/21 105 % 80 - 120Total Boron (B) 2009/08/21 94 % 80 - 120Total Cadmium (Cd) 2009/08/21 98 % 80 - 120Total Chromium (Cr) 2009/08/21 97 % 80 - 120Total Cobalt (Co) 2009/08/21 98 % 80 - 120Total Copper (Cu) 2009/08/21 98 % 80 - 120Total Lead (Pb) 2009/08/21 96 % 80 - 120Total Manganese (Mn) 2009/08/21 102 % 80 - 120Total Molybdenum (Mo) 2009/08/21 103 % 80 - 120Total Nickel (Ni) 2009/08/21 97 % 80 - 120Total Selenium (Se) 2009/08/21 97 % 80 - 120Total Silver (Ag) 2009/08/21 102 % 80 - 120Total Strontium (Sr) 2009/08/21 99 % 80 - 120Total Thallium (Tl) 2009/08/21 101 % 80 - 120Total Tin (Sn) 2009/08/21 108 % 80 - 120Total Titanium (Ti) 2009/08/21 101 % 80 - 120Total Uranium (U) 2009/08/21 104 % 80 - 120Total Vanadium (V) 2009/08/21 99 % 80 - 120Total Zinc (Zn) 2009/08/21 97 % 80 - 120
Method Blank Total Aluminum (Al) 2009/08/21 ND, RDL=5.0 ug/LTotal Antimony (Sb) 2009/08/21 ND, RDL=2.0 ug/LTotal Arsenic (As) 2009/08/21 ND, RDL=2.0 ug/LTotal Barium (Ba) 2009/08/21 ND, RDL=5.0 ug/LTotal Beryllium (Be) 2009/08/21 ND, RDL=2.0 ug/LTotal Bismuth (Bi) 2009/08/21 ND, RDL=2.0 ug/LTotal Boron (B) 2009/08/21 ND, RDL=5.0 ug/LTotal Cadmium (Cd) 2009/08/21 ND, RDL=0.017 ug/LTotal Chromium (Cr) 2009/08/21 ND, RDL=1.0 ug/LTotal Cobalt (Co) 2009/08/21 ND, RDL=0.40 ug/LTotal Copper (Cu) 2009/08/21 ND, RDL=2.0 ug/LTotal Iron (Fe) 2009/08/21 ND, RDL=50 ug/LTotal Lead (Pb) 2009/08/21 ND, RDL=0.50 ug/LTotal Manganese (Mn) 2009/08/21 ND, RDL=2.0 ug/LTotal Molybdenum (Mo) 2009/08/21 ND, RDL=2.0 ug/LTotal Nickel (Ni) 2009/08/21 ND, RDL=2.0 ug/LTotal Selenium (Se) 2009/08/21 ND, RDL=1.0 ug/L
This document is in electronic format, hard copy is available on request.Page 17 of 19
Fracflow Consultants IncAttention: John Gale Client Project #: 500P.O. #: 2897Project name: ST. ALBAN'S NL
Quality Assurance Report (Continued)Maxxam Job Number: DA9A4219
QA/QC DateBatch AnalyzedNum Init QC Type Parameter yyyy/mm/dd Value Recovery Units QC Limits
1914385 MPT Method Blank Total Silver (Ag) 2009/08/21 ND, RDL=0.10 ug/LTotal Strontium (Sr) 2009/08/21 ND, RDL=5.0 ug/LTotal Thallium (Tl) 2009/08/21 ND, RDL=0.10 ug/LTotal Tin (Sn) 2009/08/21 ND, RDL=2.0 ug/LTotal Titanium (Ti) 2009/08/21 ND, RDL=2.0 ug/LTotal Uranium (U) 2009/08/21 ND, RDL=0.10 ug/LTotal Vanadium (V) 2009/08/21 ND, RDL=2.0 ug/LTotal Zinc (Zn) 2009/08/21 ND, RDL=5.0 ug/L
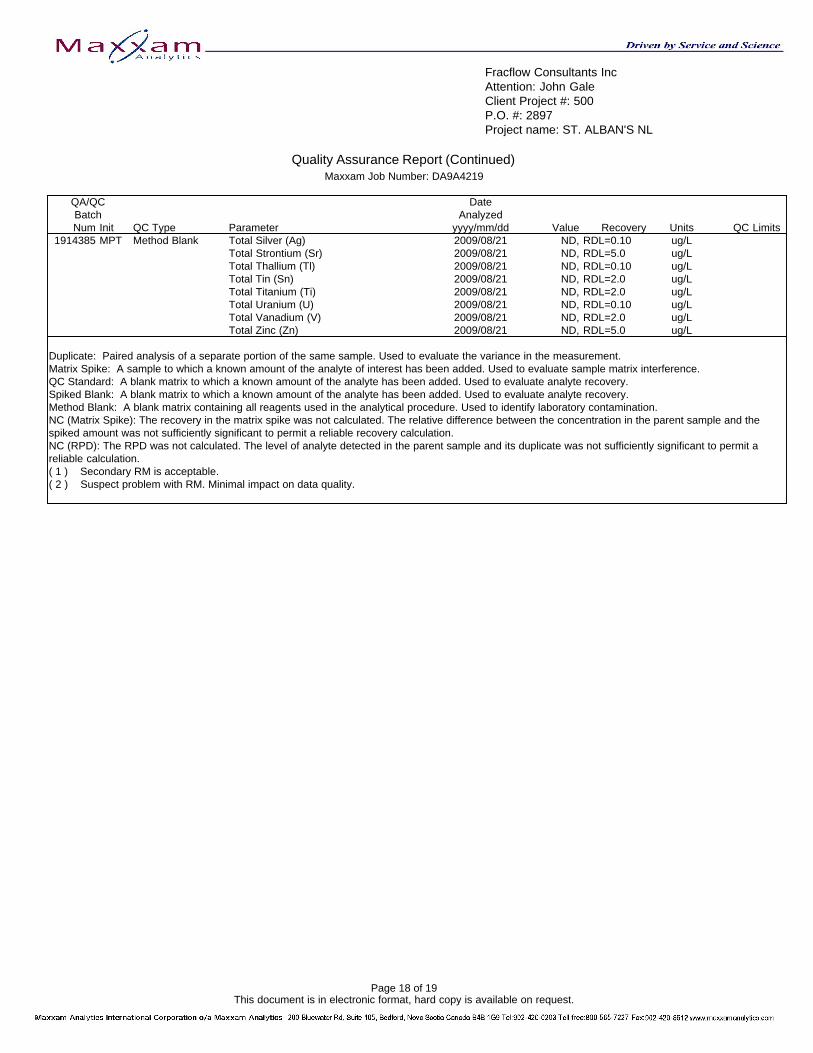
Duplicate: Paired analysis of a separate portion of the same sample. Used to evaluate the variance in the measurement.Matrix Spike: A sample to which a known amount of the analyte of interest has been added. Used to evaluate sample matrix interference.QC Standard: A blank matrix to which a known amount of the analyte has been added. Used to evaluate analyte recovery.Spiked Blank: A blank matrix to which a known amount of the analyte has been added. Used to evaluate analyte recovery.Method Blank: A blank matrix containing all reagents used in the analytical procedure. Used to identify laboratory contamination.NC (Matrix Spike): The recovery in the matrix spike was not calculated. The relative difference between the concentration in the parent sample and thespiked amount was not sufficiently significant to permit a reliable recovery calculation.NC (RPD): The RPD was not calculated. The level of analyte detected in the parent sample and its duplicate was not sufficiently significant to permit areliable calculation.( 1 ) Secondary RM is acceptable.( 2 ) Suspect problem with RM. Minimal impact on data quality.
This document is in electronic format, hard copy is available on request.Page 18 of 19

Sample Integrity Form
Invoice To: Maxxam Job #: A9A4219Fracflow Consultants Inc Date Received: 2009/08/12ATTN: John Gale Your C.O.C. #: 3 0 1 3 3154 Major's Path Your Project #: 5 0 0 St. John's, NL Your P.O. #: 2 8 9 7 A1A 5A1 Maxxam Project Manager: STACY JOSEPHClient Contact: Quote #: A90807John Gale
No discrepancies noted.
Report Comments
Received Date: 2009/08/12 T i m e : 10:19 B y :
Inspected Date: T i m e : B y :
SIF Created Date: T i m e : 00:00 B y :
Page 19 of 19


CLIENT: Fracflow Consultants Inc Select Guideline Values from the Dropdown List Below. Exceedences (& "ND") will turn BOLD with Yellow Background.PROJECT #: 500 , MAXXAM JOB : A9A4219INORGANIC PARAMETERS Bold with Blue Background indicates non-detected but DL > Guideline (due to dilution etc)
MATRIX: GROUND WATER ** Guideline flagging is correct only when result units correspond with guideline units on spreadsheet. Every effort has been made to ensure report and guideline units are aligned.
Note: Window zoom values other than 75% may cause unstable performa***Programmers' Note: Do not insert or delete Parameter rows unless Guidelines, DropDownConstants & BaseTables are also adjusted.
Sample ID Guideline Detection Units 500-CHURCH WELL-24H 500-CHURCH WELL-48H 500-SFW-24H 500-SFW-48H 500-SFW-72H 0-CHURCH WELL-JULY23 500-SFW-JULY23-09Laboratory ID 3. CWQG Aquatic Life Limit DJ3831 DJ3841 DJ3842 DJ3843 DJ3844 DJ3860 DJ3866Maxxam Job # Freshwater A9A4219 A9A4219 A9A4219 A9A4219 A9A4219 A9A4219 A9A4219
Sampling Date Coarse Grained 11-July-2009 12-July-2009 16-July-2009 17-July-2009 18-July-2009 23-July-2009 23-July-2009Aluminium (mg/L)3,4 0.005 - -Aluminium (ug/L)3,4 5 5.0 ug/L ND 132 6.3 ND 9.6Ammonia (total) NV 0.05 mg/L ND NDAmmonia (un-ionized) 0.019 - -Antimony NV 2.0 ug/L ND ND ND ND NDArsenic 5 2.0 ug/L 4.9 5.1 2.9 3.1 3.3Barium NV 5.0 ug/L ND ND ND ND NDBoron NV 5.0 ug/L 5.1 5.2 7 6.9 6.6Bromate NV - -Cadmium 0.017 0.017 ug/L ND ND ND ND NDChloramines—total NV - -Chlorate NV - -Chloride NV 1 mg/L 5 8Chlorite NV - -Chromium (mg/L) NV - -Chromium (ug/L) NV 1.0 ug/L ND ND ND ND NDHexavalent chromium (Cr(VI)) 0.001 - -Trivalent chromium (Cr(III)) 0.0089 - -Colour NV 5 TCU ND NDCopper (mg/L)5 0.002 0.01 mg/L ND NDCopper (ug/L)5 2 2.0 ug/L ND ND ND ND NDCyanide NV - -Cyanide (as free CN) 5 - -Dissolved oxygen6,7 5.5 - -Fluoride 0.12 - -Iron (mg/L) 0.3 0.02 mg/L 0.09 0.07Iron (ug/L) 300 50 ug/L 67 102 ND ND NDLead (mg/L)8 0.001 - -Lead (ug/L)8 1 0.50 ug/L ND ND ND ND NDManganese (mg/L) NV 0.01 mg/L 0.09 0.04Manganese (ug/L) NV 2.0 ug/L 87.3 88.7 34.4 34.2 34.6Mercury 0.026 - -Methylmercury 0.004 - -Molybdenum 73 2.0 ug/L ND ND ND ND NDNickel9 25 2.0 ug/L ND ND ND ND NDNitrate (as N) 2.9 - -Nitrilotriacetic acid (NTA) NV - -Nitrite (as N) 0.06 - -Odour10 NV - -pH12,12 NV 0 pH 7.85 7.99Phosphorus (total) NV - -Reactive chlorine species (hypochlorous 0.5 - -Salinity13 NV - -Selenium 1 1.0 ug/L ND ND ND ND NDSilver 0.1 0.10 ug/L ND ND ND ND NDSodium (mg/L) NV 0.1 mg/L 5.7 12Sodium (ug/L) NV - -Sulphate NV 2 mg/L 20 18Sulphide (as H2S) NV - -Taste14 NV - -Temperature15 NV - -Thallium 0.8 0.10 ug/L ND ND ND ND NDTotal dissolved solids (TDS-Measured) NV - -Total dissolved solids (TDS-Calculated) NV 1 mg/L 138 143
3. CWQG Aquatic Life - Freshwater, Coarse Grained

Tributyltin 0.008 - -Triphenyltin 0.022 - -Turbidity NV 0.1 NTU 0.2 0.2Uranium NV 0.10 ug/L 0.41 0.49 0.26 0.25 0.26Zinc (mg/L) 0.03 0.05 mg/L ND NDZinc (ug/L) 30 5.0 ug/L ND ND 7.3 ND 20.2
NOTES:NV = no valueCDWQ DW Guidelines: May 2008, CDWQ Aquatic Life Guidelines Update 7.0: Sep 2007Coarse/Fine Designation only applies to Atlantic RBCA (PIRI) Water Guidelines, for all other guidelines this designation may be ignored.1. This table represents a summary of the data presented in the Laboratory Certificate of Analysis for convenience purposes only2. This summary is to be used in conjunction with, not as a replacement of the Laboratory Certificate of Analysis which contains all QA/QC information3. Aluminum Aesthetic Objective (CDWQ - AO): Conventional Treatment Plants = 0.1 mg/L (100 ug/L), Other Treatment Systems = 0.2 mg/L (200 ug/L)4. Aluminum Guideline (CWQG Aquatic Life - Freshwater): if pH < 6.5 then 0.005 mg/L (5 ug/L), else if pH >= 6.5 then 0.1 mg/L (100 ug/L)5. Copper Guideline (CWQG Aquatic Life - Freshwater): if CaCO 3 < 120 mg/L then 0.002 mg/L (2 ug/L), if CaCO3 = 120-180 mg/L then 0.003 mg/L (3 ug/L), if CaCO3 > 180 mg/L then 0.004 mg/L (4 ug/L),
6. Dissolved Oxygen Guideline (CWQG Aquatic Life - Freshwater): Warm-water biota (WWB) early life stages 6000 ug/L, WWB other life stages 5500 ug/L, Cold-water biota (CWB) early life stages 9500 ug/L, other life stages 6500 ug/L7. Dissolved Oxygen Guideline (CWQG Aquatic Life - Marinewater): > 8000 ug/L8. Lead Guideline (CWQG Aquatic Life - Freshwater): if CaCO 3 < 60 mg/L then 0.001 mg/L (1 ug/L), if CaCO3 = 60-120 mg/L then 0.002 mg/L (2 ug/L), if CaCO3 = 120-180 mg/L then 0.004 mg/L (4 ug/L), if CaCO3 > 180 mg/L then 0.007 mg/L (7 ug/L),9. Nickel Guideline (CWQG Aquatic Life - Freshwater): if CaCO 3 < 60 mg/L then 0.025 mg/L (25 ug/L), if CaCO3 = 60-120 mg/L then 0.065 mg/L (65 ug/L), if CaCO3 = 120-180 mg/L then 0.110 mg/L (110 ug/L), if CaCO3 > 180 mg/L then 0.150 mg/L (150 ug/L),
10. Odour Aesthetic Objective (CDWQ): "Inoffensive"11. pH Objective (CDWQ): 6.5 - 8.512. pH Guideline (CWQG Aquatic Life): Freshwater 6.5 - 9, Marine 7.0 - 8.713. Salinity Guideline (CWQG Aquatic Life - Marinewater): < 10% fluctuation.14. Taste Aesthetic Objective (CDWQ): "Inoffensive"15. Temperature Aesthetic Objective (CDWQ): <= 15 oC16. Calculated result only includes measured parameters. Actual TDS may be higher.

Fracflow Consultants IncMaxxam Job #: A9A4219 Client Project #: 500Report Date: 2009/08/21 Project name: ST. ALBAN'S NL
Your P.O. #: 2897Sampler Initials:
RESULTS OF ANALYSES OF WATERMaxxam ID DJ3860 DJ3866Sampling Date 7/23/2009 7/23/2009COC Number 30133 30133Registration #
Units Criteria A500-CHURCH
WELL-JULY23-09500-SFW-JULY23-09 RDL QC Batch
Calculated ParametersAnion Sum me/L - 2.44 2.49 N/A 1907060Bicarb. Alkalinity (calc. as CaCO3) mg/L - 94 93 1 1907056Calculated TDS mg/L - 138 143 1 1907063Carb. Alkalinity (calc. as CaCO3) mg/L - ND ND 1 1907056Cation Sum me/L - 2.33 2.49 N/A 1907060Hardness (CaCO3) mg/L - 100 98 1 1907146Ion Balance (% Difference) % - 2.31 0 N/A 1907059Langelier Index (@ 20C) N/A - -0.0270 0.0790 1907061Langelier Index (@ 4C) N/A - -0.278 -0.171 1907062Saturation pH (@ 20C) N/A - 7.88 7.91 1907061Saturation pH (@ 4C) N/A - 8.13 8.16 1907062InorganicsTotal Alkalinity (Total as CaCO3) mg/L - 94 94 5 1909489Dissolved Chloride (Cl) mg/L - 5 8 1 1909492Colour TCU - ND ND 5 1909508Nitrate + Nitrite mg/L - ND ND 0.05 1909510Nitrogen (Ammonia Nitrogen) mg/L - ND ND 0.05 1911655Total Organic Carbon (C) mg/L - ND ND 0.5 1910518Orthophosphate (P) mg/L - ND ND 0.01 1909509pH pH 6.5 : 9.0 7.85 7.99 N/A 1910419Reactive Silica (SiO2) mg/L - 10 10 0.5 1909503Dissolved Sulphate (SO4) mg/L - 20 18 2 1909499Turbidity NTU - 0.2 0.2 0.1 1911841Conductivity uS/cm - 220 230 1 1910422
ND = Not detectedRDL = Reportable Detection LimitQC Batch = Quality Control BatchCriteria A: Water - CCME Freshwater Aquatic Life Canadian Council of ministers of the Environment, "Canadian Water Quality Guidelines for the Protection of Aquatic Life", 2005 (Freshwater Aquatic Life).Note: Confirm Criteria B excedence versus guidelne, when Criteria A is not an excedence, as the guideline is also dependent on other criteria such as Calcium level.

Fracflow Consultants IncMaxxam Job #: A9A4219 Client Project #: 500Report Date: 2009/08/21 Project name: ST. ALBAN'S NL
Your P.O. #: 2897Sampler Initials:
ELEMENTS BY ICP-AES (WATER)Maxxam ID DJ3860 DJ3866Sampling Date 7/23/2009 7/23/2009COC Number 30133 30133Registration #
Units Criteria A Criteria B500-CHURCH
WELL-JULY23-09500-SFW-JULY23-09 RDL QC Batch
MetalsTotal Calcium (Ca) mg/L - - 33 30 0.1 1911362Total Copper (Cu) mg/L 0.004 .002 -.004 ND ND 0.01 1911362Total Iron (Fe) mg/L 0.3 - 0.09 0.07 0.02 1911362Total Magnesium (Mg) mg/L - - 5.2 4.3 0.1 1911362Total Manganese (Mn) mg/L - - 0.09 0.04 0.01 1911362Total Potassium (K) mg/L - - 3.3 3.3 0.1 1911362Total Sodium (Na) mg/L - - 5.7 12 0.1 1911362Total Zinc (Zn) mg/L 0.03 - ND ND 0.05 1911362
ND = Not detectedRDL = Reportable Detection LimitQC Batch = Quality Control BatchCriteria A,Criteria B: Water - CCME Freshwater Aquatic Life Canadian Council of ministers of the Environment, "Canadian Water Quality Guidelines for the Protection of Aquatic Life", 2005 (Freshwater Aquatic Life).Note: Confirm Criteria B excedence versus guidelne, when Criteria A is not an excedence, as the guideline is also dependent on other criteria such as Calcium level.

Fracflow Consultants IncMaxxam Job #: A9A4219 Client Project #: 500Report Date: 2009/08/21 Project name: ST. ALBAN'S NL
Your P.O. #: 2897Sampler Initials:
ELEMENTS BY ICP/MS (WATER)Maxxam ID DJ3831 DJ3841 DJ3842 DJ3843 DJ3844Sampling Date 7/11/2009 7/12/2009 7/16/2009 7/17/2009 7/18/2009COC Number 30133 30133 30133 30133 30133Registration #
Units Criteria A Criteria B500-CHURCH
WELL-24H500-CHURCH
WELL-48H 500-SFW-24H 500-SFW-48H 500-SFW-72H RDL QC BatchMetalsDissolved Aluminum (Al) ug/L 100 5 ND 132 6.3 ND 9.6 5.0 1914377Total Aluminum (Al) ug/L 100 5 5.9 7.9 10.8 5.8 ND 5.0 1914385Dissolved Antimony (Sb) ug/L - - ND ND ND ND ND 2.0 1914377Total Antimony (Sb) ug/L - - ND ND ND ND ND 2.0 1914385Dissolved Arsenic (As) ug/L 5 - 4.9 5.1 2.9 3.1 3.3 2.0 1914377Total Arsenic (As) ug/L 5 - 4.7 4.7 ND 3.1 2.9 2.0 1914385Dissolved Barium (Ba) ug/L - - ND ND ND ND ND 5.0 1914377Total Barium (Ba) ug/L - - ND ND ND ND ND 5.0 1914385Dissolved Beryllium (Be) ug/L - - ND ND ND ND ND 2.0 1914377Total Beryllium (Be) ug/L - - ND ND ND ND ND 2.0 1914385Dissolved Bismuth (Bi) ug/L - - ND ND ND ND ND 2.0 1914377Total Bismuth (Bi) ug/L - - ND ND ND ND ND 2.0 1914385Dissolved Boron (B) ug/L - - 5.1 5.2 7.0 6.9 6.6 5.0 1914377Total Boron (B) ug/L - - 5.8 5.4 6.8 8.0 7.7 5.0 1914385Dissolved Cadmium (Cd) ug/L 0.017 - ND ND ND ND ND 0.017 1914377Total Cadmium (Cd) ug/L 0.017 - ND ND ND ND ND 0.017 1914385Dissolved Chromium (Cr) ug/L 8.9 - ND ND ND ND ND 1.0 1914377Total Chromium (Cr) ug/L 8.9 - ND ND ND ND ND 1.0 1914385Dissolved Cobalt (Co) ug/L - - ND ND ND ND ND 0.40 1914377Total Cobalt (Co) ug/L - - ND ND ND ND ND 0.40 1914385Dissolved Copper (Cu) ug/L 4 2 ND ND ND ND ND 2.0 1914377Total Copper (Cu) ug/L 4 2 ND ND 2.1 ND ND 2.0 1914385Dissolved Iron (Fe) ug/L 300 - 67 102 ND ND ND 50 1914377Total Iron (Fe) ug/L 300 - 67 70 ND ND ND 50 1914385Dissolved Lead (Pb) ug/L 7 1 ND ND ND ND ND 0.50 1914377Total Lead (Pb) ug/L 7 1 ND ND ND ND ND 0.50 1914385Dissolved Manganese (Mn) ug/L - - 87.3 88.7 34.4 34.2 34.6 2.0 1914377

Maxxam ID DJ3831 DJ3841 DJ3842 DJ3843 DJ3844Sampling Date 7/11/2009 7/12/2009 7/16/2009 7/17/2009 7/18/2009COC Number 30133 30133 30133 30133 30133Registration #
Units Criteria A Criteria B500-CHURCH
WELL-24H500-CHURCH
WELL-48H 500-SFW-24H 500-SFW-48H 500-SFW-72H RDL QC BatchTotal Manganese (Mn) ug/L - - 86.6 90.4 27.3 34.6 33.3 2.0 1914385Dissolved Molybdenum (Mo) ug/L 73 - ND ND ND ND ND 2.0 1914377Total Molybdenum (Mo) ug/L 73 - ND ND ND ND ND 2.0 1914385Dissolved Nickel (Ni) ug/L 25 25 ND ND ND ND ND 2.0 1914377Total Nickel (Ni) ug/L 25 25 ND ND ND ND ND 2.0 1914385Dissolved Selenium (Se) ug/L 1 - ND ND ND ND ND 1.0 1914377Total Selenium (Se) ug/L 1 - ND ND ND ND ND 1.0 1914385Dissolved Silver (Ag) ug/L 0.1 - ND ND ND ND ND 0.10 1914377Total Silver (Ag) ug/L 0.1 - ND ND ND ND ND 0.10 1914385Dissolved Strontium (Sr) ug/L - - 138 140 124 121 124 5.0 1914377Total Strontium (Sr) ug/L - - 141 146 126 132 127 5.0 1914385Dissolved Thallium (Tl) ug/L 0.8 - ND ND ND ND ND 0.10 1914377Total Thallium (Tl) ug/L 0.8 - ND ND ND ND ND 0.10 1914385Dissolved Tin (Sn) ug/L - - ND ND ND ND ND 2.0 1914377Total Tin (Sn) ug/L - - ND ND ND ND ND 2.0 1914385Dissolved Titanium (Ti) ug/L - - ND ND ND ND ND 2.0 1914377Total Titanium (Ti) ug/L - - ND ND ND ND ND 2.0 1914385Dissolved Uranium (U) ug/L - - 0.41 0.49 0.26 0.25 0.26 0.10 1914377Total Uranium (U) ug/L - - 0.48 0.48 0.32 0.28 0.27 0.10 1914385Dissolved Vanadium (V) ug/L - - ND ND ND ND ND 2.0 1914377Total Vanadium (V) ug/L - - ND ND ND ND ND 2.0 1914385Dissolved Zinc (Zn) ug/L 30 - ND ND 7.3 ND 20.2 5.0 1914377Total Zinc (Zn) ug/L 30 - ND ND 5.4 ND ND 5.0 1914385
ND = Not detectedRDL = Reportable Detection LimitQC Batch = Quality Control BatchCriteria A,Criteria B: Water - CCME Freshwater Aquatic Life Canadian Council of ministers of the Environment, "Canadian Water Quality Guidelines for the Protection of Aquatic Life", 2005 (Freshwater Aquatic Life).Note: Confirm Criteria B excedence versus guidelne, when Criteria A is not an excedence, as the guideline is also dependent on other criteria such as Calcium level.

GENERAL COMMENTSSample DJ3841-01: Poor Total vs Dissolved agreement for Aluminum verified by repeat analysis.
Results relate only to the items tested.

Fracflow Consultants IncAttention: John Gale Client Project #: 500P.O. #: 2897Project name: ST. ALBAN'S NL
Quality Assurance ReportMaxxam Job Number: DA9A4219
QA/QC DateBatch AnalyzedNum Init QC Type Parameter yyyy/mm/dd Value Recovery Units QC Limits1909489 MCN Matrix Spike Total Alkalinity (Total as CaCO3) 8/18/2009 NC % 80 - 120
QC Standard Total Alkalinity (Total as CaCO3) 8/18/2009 106 % 80 - 120Spiked Blank Total Alkalinity (Total as CaCO3) 8/18/2009 109 % 80 - 120Method Blank Total Alkalinity (Total as CaCO3) 8/18/2009 ND RDL=5 mg/LRPD Total Alkalinity (Total as CaCO3) 8/18/2009 NC % 25
1909492 JOA Matrix Spike Dissolved Chloride (Cl) 8/18/2009 104 % 80 - 120QC Standard Dissolved Chloride (Cl) 8/18/2009 102 % 80 - 120Spiked Blank Dissolved Chloride (Cl) 8/18/2009 105 % 80 - 120Method Blank Dissolved Chloride (Cl) 8/18/2009 ND RDL=1 mg/LRPD Dissolved Chloride (Cl) 8/18/2009 NC % 25
1909499 SMT Matrix Spike Dissolved Sulphate (SO4) 8/18/2009 109 % 80 - 120QC Standard Dissolved Sulphate (SO4) 8/18/2009 109 % 80 - 120Spiked Blank Dissolved Sulphate (SO4) 8/18/2009 108 % 80 - 120Method Blank Dissolved Sulphate (SO4) 8/18/2009 ND RDL=2 mg/LRPD Dissolved Sulphate (SO4) 8/18/2009 NC % 25
1909503 MCN Matrix Spike Reactive Silica (SiO2) 8/18/2009 NC % 80 - 120QC Standard Reactive Silica (SiO2) 8/18/2009 99 % 75 - 125Spiked Blank Reactive Silica (SiO2) 8/18/2009 98 % 80 - 120Method Blank Reactive Silica (SiO2) 8/18/2009 ND RDL=0.5 mg/LRPD Reactive Silica (SiO2) 8/18/2009 0.5 % 25
1909508 MCN QC Standard Colour 8/18/2009 104 % 80 - 120Method Blank Colour 8/18/2009 ND RDL=5 TCURPD Colour 8/18/2009 NC % 25
1909509 JOA Matrix Spike Orthophosphate (P) 8/18/2009 NC % 80 - 120QC Standard Orthophosphate (P) 8/18/2009 96 % 80 - 120Spiked Blank Orthophosphate (P) 8/18/2009 95 % 80 - 120Method Blank Orthophosphate (P) 8/18/2009 ND RDL=0.01 mg/LRPD Orthophosphate (P) 8/18/2009 1.6 % 25
1909510 SMT Matrix Spike Nitrate + Nitrite 8/18/2009 101 % 80 - 120QC Standard Nitrate + Nitrite 8/18/2009 101 % 80 - 120Spiked Blank Nitrate + Nitrite 8/18/2009 102 % 80 - 120Method Blank Nitrate + Nitrite 8/18/2009 ND RDL=0.05 mg/LRPD Nitrate + Nitrite 8/18/2009 NC % 25
1910419 ARS QC Standard pH 8/18/2009 100 % 80 - 120Method Blank pH 8/18/2009 6.23 RDL=0 pHRPD pH 8/18/2009 1.4 % 25
1910422 ARS QC Standard Conductivity 8/18/2009 102 % 80 - 120Method Blank Conductivity 8/18/2009 ND RDL=1 uS/cmRPD Conductivity 8/18/2009 5.4 % 25
1910518 BMM Matrix Spike Total Organic Carbon (C) 8/25/2009 97 % 75 - 125QC Standard Total Organic Carbon (C) 8/18/2009 104 % 80 - 120Spiked Blank Total Organic Carbon (C) 8/25/2009 102 % 75 - 125

QA/QC DateBatch AnalyzedNum Init QC Type Parameter yyyy/mm/dd Value Recovery Units QC Limits
RPD Total Organic Carbon (C) 8/25/2009 NC % 251911362 SSI Matrix Spike Total Calcium (Ca) 8/18/2009 92 % 80 - 120
Total Copper (Cu) 8/18/2009 96 % 80 - 120Total Iron (Fe) 8/18/2009 93 % 80 - 120Total Magnesium (Mg) 8/18/2009 92 % 80 - 120Total Manganese (Mn) 8/18/2009 95 % 80 - 120Total Potassium (K) 8/18/2009 101 % 80 - 120Total Sodium (Na) 8/18/2009 101 % 80 - 120Total Zinc (Zn) 8/18/2009 94 % 80 - 120
QC Standard Total Calcium (Ca) 8/18/2009 99 % 80 - 120Total Copper (Cu) 8/18/2009 106 % 80 - 120Total Iron (Fe) 8/18/2009 99 % 80 - 120Total Magnesium (Mg) 8/18/2009 96 % 80 - 120Total Manganese (Mn) 8/18/2009 99 % 80 - 120Total Potassium (K) 8/18/2009 103 % 80 - 120Total Sodium (Na) 8/18/2009 102 % 80 - 120Total Zinc (Zn) 8/18/2009 96 % 80 - 120
Spiked Blank Total Calcium (Ca) 8/18/2009 92 % 80 - 120Total Copper (Cu) 8/18/2009 94 % 80 - 120Total Iron (Fe) 8/18/2009 92 % 80 - 120Total Magnesium (Mg) 8/18/2009 94 % 80 - 120Total Manganese (Mn) 8/18/2009 94 % 80 - 120Total Potassium (K) 8/18/2009 100 % 80 - 120Total Sodium (Na) 8/18/2009 99 % 80 - 120Total Zinc (Zn) 8/18/2009 93 % 80 - 120
Method Blank Total Calcium (Ca) 8/18/2009 ND RDL=0.1 mg/LTotal Copper (Cu) 8/18/2009 ND RDL=0.01 mg/LTotal Iron (Fe) 8/18/2009 ND RDL=0.02 mg/LTotal Magnesium (Mg) 8/18/2009 ND RDL=0.1 mg/LTotal Manganese (Mn) 8/18/2009 ND RDL=0.01 mg/LTotal Potassium (K) 8/18/2009 ND RDL=0.1 mg/LTotal Sodium (Na) 8/18/2009 ND RDL=0.1 mg/LTotal Zinc (Zn) 8/18/2009 ND RDL=0.05 mg/L
RPD Total Calcium (Ca) 8/18/2009 0.8 % 25Total Magnesium (Mg) 8/18/2009 1.3 % 25Total Potassium (K) 8/18/2009 0.9 % 25Total Sodium (Na) 8/18/2009 0.6 % 25
1911655 JOA Matrix Spike Nitrogen (Ammonia Nitrogen) 8/19/2009 95 % 80 - 120QC Standard Nitrogen (Ammonia Nitrogen) 8/19/2009 100 % 80 - 120Spiked Blank Nitrogen (Ammonia Nitrogen) 8/19/2009 97 % 80 - 120Method Blank Nitrogen (Ammonia Nitrogen) 8/19/2009 ND RDL=0.05 mg/LRPD Nitrogen (Ammonia Nitrogen) 8/19/2009 NC % 25
1911841 JRC QC Standard Turbidity 8/19/2009 100 % 80 - 120Method Blank Turbidity 8/19/2009 ND RDL=0.1 NTURPD Turbidity 8/19/2009 8.5 % 25
1914377 KGU QC Standard Dissolved Aluminum (Al) 8/20/2009 99 % 80 - 120Dissolved Antimony (Sb) 8/20/2009 129 ( 1 ) % 80 - 120Dissolved Arsenic (As) 8/20/2009 92 % 80 - 120Dissolved Barium (Ba) 8/20/2009 99 % 80 - 120Dissolved Beryllium (Be) 8/20/2009 93 % 80 - 120Dissolved Bismuth (Bi) 8/20/2009 108 % 80 - 120Dissolved Boron (B) 8/20/2009 94 % 80 - 120

QA/QC DateBatch AnalyzedNum Init QC Type Parameter yyyy/mm/dd Value Recovery Units QC Limits
Dissolved Cadmium (Cd) 8/20/2009 102 % 80 - 120Dissolved Chromium (Cr) 8/20/2009 101 % 80 - 120Dissolved Cobalt (Co) 8/20/2009 98 % 80 - 120Dissolved Copper (Cu) 8/20/2009 90 % 80 - 120Dissolved Iron (Fe) 8/20/2009 96 % 80 - 120Dissolved Lead (Pb) 8/20/2009 96 % 80 - 120Dissolved Manganese (Mn) 8/20/2009 93 % 80 - 120Dissolved Molybdenum (Mo) 8/20/2009 110 % 80 - 120Dissolved Nickel (Ni) 8/20/2009 95 % 80 - 120Dissolved Selenium (Se) 8/20/2009 91 % 80 - 120Dissolved Silver (Ag) 8/20/2009 90 % 80 - 120Dissolved Strontium (Sr) 8/20/2009 99 % 80 - 120Dissolved Thallium (Tl) 8/20/2009 92 % 80 - 120Dissolved Vanadium (V) 8/20/2009 100 % 80 - 120Dissolved Zinc (Zn) 8/20/2009 83 % 80 - 120
Spiked Blank Dissolved Aluminum (Al) 8/20/2009 109 % 80 - 120Dissolved Antimony (Sb) 8/20/2009 100 % 80 - 120Dissolved Arsenic (As) 8/20/2009 103 % 80 - 120Dissolved Barium (Ba) 8/20/2009 103 % 80 - 120Dissolved Beryllium (Be) 8/20/2009 107 % 80 - 120Dissolved Bismuth (Bi) 8/20/2009 112 % 80 - 120Dissolved Boron (B) 8/20/2009 102 % 80 - 120Dissolved Cadmium (Cd) 8/20/2009 103 % 80 - 120Dissolved Chromium (Cr) 8/20/2009 108 % 80 - 120Dissolved Cobalt (Co) 8/20/2009 107 % 80 - 120Dissolved Copper (Cu) 8/20/2009 111 % 80 - 120Dissolved Lead (Pb) 8/20/2009 107 % 80 - 120Dissolved Manganese (Mn) 8/20/2009 106 % 80 - 120Dissolved Molybdenum (Mo) 8/20/2009 106 % 80 - 120Dissolved Nickel (Ni) 8/20/2009 108 % 80 - 120Dissolved Selenium (Se) 8/20/2009 98 % 80 - 120Dissolved Silver (Ag) 8/20/2009 98 % 80 - 120Dissolved Strontium (Sr) 8/20/2009 106 % 80 - 120Dissolved Thallium (Tl) 8/20/2009 111 % 80 - 120Dissolved Tin (Sn) 8/20/2009 109 % 80 - 120Dissolved Titanium (Ti) 8/20/2009 106 % 80 - 120Dissolved Uranium (U) 8/20/2009 112 % 80 - 120Dissolved Vanadium (V) 8/20/2009 110 % 80 - 120Dissolved Zinc (Zn) 8/20/2009 109 % 80 - 120
Method Blank Dissolved Aluminum (Al) 8/20/2009 ND RDL=5.0 ug/LDissolved Antimony (Sb) 8/20/2009 ND RDL=2.0 ug/LDissolved Arsenic (As) 8/20/2009 ND RDL=2.0 ug/LDissolved Barium (Ba) 8/20/2009 ND RDL=5.0 ug/LDissolved Beryllium (Be) 8/20/2009 ND RDL=2.0 ug/LDissolved Bismuth (Bi) 8/20/2009 ND RDL=2.0 ug/LDissolved Boron (B) 8/20/2009 ND RDL=5.0 ug/LDissolved Cadmium (Cd) 8/20/2009 ND RDL=0.017 ug/LDissolved Chromium (Cr) 8/20/2009 ND RDL=1.0 ug/LDissolved Cobalt (Co) 8/20/2009 ND RDL=0.40 ug/LDissolved Copper (Cu) 8/20/2009 ND RDL=2.0 ug/LDissolved Iron (Fe) 8/20/2009 ND RDL=50 ug/LDissolved Lead (Pb) 8/20/2009 ND RDL=0.50 ug/L

QA/QC DateBatch AnalyzedNum Init QC Type Parameter yyyy/mm/dd Value Recovery Units QC Limits
Dissolved Manganese (Mn) 8/20/2009 ND RDL=2.0 ug/LDissolved Molybdenum (Mo) 8/20/2009 ND RDL=2.0 ug/LDissolved Nickel (Ni) 8/20/2009 ND RDL=2.0 ug/LDissolved Selenium (Se) 8/20/2009 ND RDL=1.0 ug/LDissolved Silver (Ag) 8/20/2009 ND RDL=0.10 ug/LDissolved Strontium (Sr) 8/20/2009 ND RDL=5.0 ug/LDissolved Thallium (Tl) 8/20/2009 ND RDL=0.10 ug/LDissolved Tin (Sn) 8/20/2009 ND RDL=2.0 ug/LDissolved Titanium (Ti) 8/20/2009 ND RDL=2.0 ug/LDissolved Uranium (U) 8/20/2009 ND RDL=0.10 ug/LDissolved Vanadium (V) 8/20/2009 ND RDL=2.0 ug/LDissolved Zinc (Zn) 8/20/2009 ND RDL=5.0 ug/L
1914385 MPT QC Standard Total Aluminum (Al) 8/21/2009 100 % 80 - 120Total Antimony (Sb) 8/21/2009 134 ( 2 ) % 80 - 120Total Arsenic (As) 8/21/2009 99 % 80 - 120Total Barium (Ba) 8/21/2009 98 % 80 - 120Total Beryllium (Be) 8/21/2009 95 % 80 - 120Total Boron (B) 8/21/2009 87 % 80 - 120Total Cadmium (Cd) 8/21/2009 99 % 80 - 120Total Chromium (Cr) 8/21/2009 98 % 80 - 120Total Cobalt (Co) 8/21/2009 103 % 80 - 120Total Copper (Cu) 8/21/2009 102 % 80 - 120Total Iron (Fe) 8/21/2009 108 % 80 - 120Total Lead (Pb) 8/21/2009 100 % 80 - 120Total Manganese (Mn) 8/21/2009 100 % 80 - 120Total Molybdenum (Mo) 8/21/2009 111 % 80 - 120Total Nickel (Ni) 8/21/2009 103 % 80 - 120Total Selenium (Se) 8/21/2009 105 % 80 - 120Total Strontium (Sr) 8/21/2009 103 % 80 - 120Total Thallium (Tl) 8/21/2009 121 ( 1 ) % 80 - 120Total Uranium (U) 8/21/2009 91 % 80 - 120Total Vanadium (V) 8/21/2009 102 % 80 - 120Total Zinc (Zn) 8/21/2009 98 % 80 - 120
Spiked Blank Total Aluminum (Al) 8/21/2009 104 % 80 - 120Total Antimony (Sb) 8/21/2009 103 % 80 - 120Total Arsenic (As) 8/21/2009 96 % 80 - 120Total Barium (Ba) 8/21/2009 99 % 80 - 120Total Beryllium (Be) 8/21/2009 95 % 80 - 120Total Bismuth (Bi) 8/21/2009 105 % 80 - 120Total Boron (B) 8/21/2009 94 % 80 - 120Total Cadmium (Cd) 8/21/2009 98 % 80 - 120Total Chromium (Cr) 8/21/2009 97 % 80 - 120Total Cobalt (Co) 8/21/2009 98 % 80 - 120Total Copper (Cu) 8/21/2009 98 % 80 - 120Total Lead (Pb) 8/21/2009 96 % 80 - 120Total Manganese (Mn) 8/21/2009 102 % 80 - 120Total Molybdenum (Mo) 8/21/2009 103 % 80 - 120Total Nickel (Ni) 8/21/2009 97 % 80 - 120Total Selenium (Se) 8/21/2009 97 % 80 - 120Total Silver (Ag) 8/21/2009 102 % 80 - 120Total Strontium (Sr) 8/21/2009 99 % 80 - 120Total Thallium (Tl) 8/21/2009 101 % 80 - 120
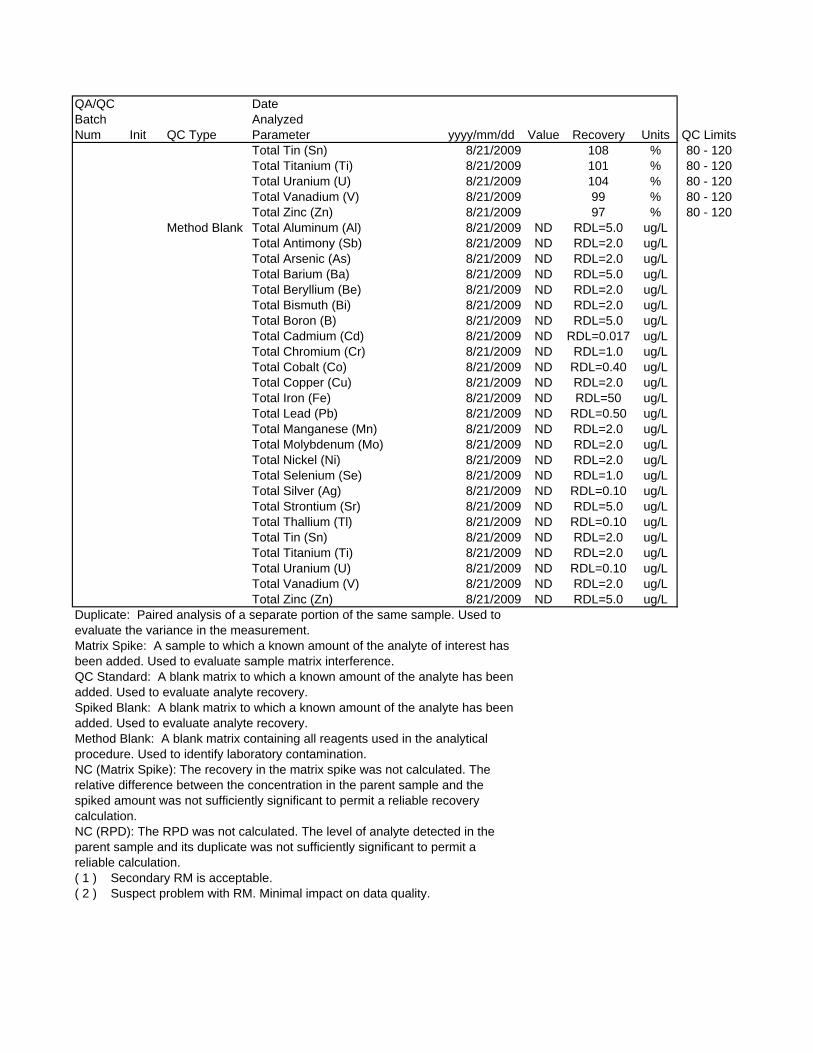
QA/QC DateBatch AnalyzedNum Init QC Type Parameter yyyy/mm/dd Value Recovery Units QC Limits
Total Tin (Sn) 8/21/2009 108 % 80 - 120Total Titanium (Ti) 8/21/2009 101 % 80 - 120Total Uranium (U) 8/21/2009 104 % 80 - 120Total Vanadium (V) 8/21/2009 99 % 80 - 120Total Zinc (Zn) 8/21/2009 97 % 80 - 120
Method Blank Total Aluminum (Al) 8/21/2009 ND RDL=5.0 ug/LTotal Antimony (Sb) 8/21/2009 ND RDL=2.0 ug/LTotal Arsenic (As) 8/21/2009 ND RDL=2.0 ug/LTotal Barium (Ba) 8/21/2009 ND RDL=5.0 ug/LTotal Beryllium (Be) 8/21/2009 ND RDL=2.0 ug/LTotal Bismuth (Bi) 8/21/2009 ND RDL=2.0 ug/LTotal Boron (B) 8/21/2009 ND RDL=5.0 ug/LTotal Cadmium (Cd) 8/21/2009 ND RDL=0.017 ug/LTotal Chromium (Cr) 8/21/2009 ND RDL=1.0 ug/LTotal Cobalt (Co) 8/21/2009 ND RDL=0.40 ug/LTotal Copper (Cu) 8/21/2009 ND RDL=2.0 ug/LTotal Iron (Fe) 8/21/2009 ND RDL=50 ug/LTotal Lead (Pb) 8/21/2009 ND RDL=0.50 ug/LTotal Manganese (Mn) 8/21/2009 ND RDL=2.0 ug/LTotal Molybdenum (Mo) 8/21/2009 ND RDL=2.0 ug/LTotal Nickel (Ni) 8/21/2009 ND RDL=2.0 ug/LTotal Selenium (Se) 8/21/2009 ND RDL=1.0 ug/LTotal Silver (Ag) 8/21/2009 ND RDL=0.10 ug/LTotal Strontium (Sr) 8/21/2009 ND RDL=5.0 ug/LTotal Thallium (Tl) 8/21/2009 ND RDL=0.10 ug/LTotal Tin (Sn) 8/21/2009 ND RDL=2.0 ug/LTotal Titanium (Ti) 8/21/2009 ND RDL=2.0 ug/LTotal Uranium (U) 8/21/2009 ND RDL=0.10 ug/LTotal Vanadium (V) 8/21/2009 ND RDL=2.0 ug/LTotal Zinc (Zn) 8/21/2009 ND RDL=5.0 ug/L
Duplicate: Paired analysis of a separate portion of the same sample. Used to evaluate the variance in the measurement.Matrix Spike: A sample to which a known amount of the analyte of interest has been added. Used to evaluate sample matrix interference.QC Standard: A blank matrix to which a known amount of the analyte has been added. Used to evaluate analyte recovery.Spiked Blank: A blank matrix to which a known amount of the analyte has been added. Used to evaluate analyte recovery.Method Blank: A blank matrix containing all reagents used in the analytical procedure. Used to identify laboratory contamination.NC (Matrix Spike): The recovery in the matrix spike was not calculated. The relative difference between the concentration in the parent sample and the spiked amount was not sufficiently significant to permit a reliable recovery calculation.NC (RPD): The RPD was not calculated. The level of analyte detected in the parent sample and its duplicate was not sufficiently significant to permit a reliable calculation.( 1 ) Secondary RM is acceptable.( 2 ) Suspect problem with RM. Minimal impact on data quality.
APPENDIX B
Additional Aquifer Test Figures

500 Not To Scale Location Date
FFC
Log-log plot of drawdown versus time for Church Well (CW), CW-P1, CW-P2, and CW-P3 during the 17 hour aquifer test on Church Well (209 L/min).
Figure B1 Project No. Scale
St. Alban's, NL August 2009
0.0001
0.001
0.01
0.1
1
10
0.1 1 10 100 1000
Time Since Pump Started (minutes)
Dra
wdo
wn
(m)
CWP1P2P3
Q = 209 L/min
AquiferTest: 17 hr Aquifer Test Site: St. Alban'sWell No.: Church WellDate: July 8-9, 2009
Levelogger Date

Project No. Scale
500 Not To Scale Location Date
FFC
Figure B2
St. Alban's, NL August 2009
Log-log plot of drawdown versus time for Church Well (CW), CW-P1, CW-P2, and CW-P3 during the 24 hour aquifer test on Church Well (273 L/min).
0.001
0.01
0.1
1
10
0.1 1 10 100 1000 10000
Time Since Pump Started (minutes)
Dra
wdo
wn
(m)
CWP1P2P3
Q = 273 L/min
AquiferTest: 24 hr Aquifer Test Site: St. Alban'sWell No.: Church WellDate: July 9-10, 2009
Levelogger Date

Fracflow Consultants Inc.154 Major's Path
St. John's, NL
(709) 739-7270
Project:
No:
Client:
500_Aquifer Test
500
Cold Ocean Salmon Inc.
Pumping Test Analysis Report
CW
CW-53 (Hantush-Jacob)
t [min]1E-2 1E-1 1E+0 1E+1 1E+2 1E+3 1E+4 1E+5
1/u1E-1 1E+0 1E+1 1E+2 1E+3 1E+4 1E+5 1E+6 1E+7
W(u
,r/L
1E-3
1E-2
1E-1
1E+0
1E+1
1E+2
s [m]
1E-2
1E-1
1E+0
1E+1
1E+2
THEIS0.010.05
0.5
1
2
3
4
5
6
0.01
Conductivity: 3.80E-6 [m/s]
Figure B3 Analysis of 53 hour aquifer test on Church Well using the Hantush-Jacob method on a log-log plot.
CWPumping well:
Discharge rate: 5.5311 [l/s]
Casing radius 0.0762 [m]
Screen length: 3 [m]
Screen radius: 0.0762 [m]
Test parameters:
CW-53
Analysis method: Hantush-Jacob
Aquifer thickness: 50 [m]
Analysis results:
Date: 8/13/2009
Test name:

Fracflow Consultants Inc.154 Major's Path
St. John's, NL
(709) 739-7270
Project:
No:
Client:
500_Aquifer Test
500
Cold Ocean Salmon Inc.
Pumping Test Analysis Report
CW-P1
CW-53-P1 (Hantush-Jacob)
t [min]1E-3 1E-2 1E-1 1E+0 1E+1 1E+2 1E+3 1E+4
1/u1E-1 1E+0 1E+1 1E+2 1E+3 1E+4 1E+5 1E+6 1E+7
W(u
,r/L
1E-3
1E-2
1E-1
1E+0
1E+1
1E+2
s [m]
1E-3
1E-2
1E-1
1E+0
1E+1
THEIS0.010.05
0.5
1
2
3
4
5
6
0.01
Transmissivity: 2.67E-3 [m²/s] Conductivity: 5.34E-5 [m/s]
Figure B4 Analysis of aquifer test on CW-P1 (observation well) using the Hantush-Jacob method on a log-log plot during 53 hour aquifer test on Church Well (pumping well).
CWPumping well:
Discharge rate: 5.5311 [l/s]
Casing radius 0.0762 [m]
Screen length: 3 [m]
Screen radius: 0.0762 [m]
0.01
Test parameters:
CW-53-P1
Analysis method: Hantush-Jacob
Aquifer thickness: 50 [m]
Analysis results:
Date:
r/L:
8/13/2009
Test name:
Storativity: 7.15E-6 c: 1.34E+7 [min]

Fracflow Consultants Inc.154 Major's Path
St. John's, NL
(709) 739-7270
Project:
No:
Client:
500_Aquifer Test
500
Cold Ocean Salmon Inc.
Pumping Test Analysis Report
SFW
SFW-72 (Hantush-Jacob)
t [min]1E-1 1E+0 1E+1 1E+2 1E+3 1E+4 1E+5 1E+6
1/u1E-1 1E+0 1E+1 1E+2 1E+3 1E+4 1E+5 1E+6 1E+7
W(u
,r/L
1E-3
1E-2
1E-1
1E+0
1E+1
1E+2
s [m]
1E-2
1E-1
1E+0
1E+1
1E+2
THEIS0.010.05
0.5
1
2
3
4
5
6
0.01
Conductivity: 1.44E-6 [m/s]
Figure B5 Analysis of 72 hour aquifer test on Sea Farm Well using the Hantush-Jacob method on a log-log plot.
SFWPumping well:
Discharge rate: 3.8642 [l/s]
Casing radius 0.0762 [m]
Screen length: 50 [m]
Screen radius: 0.0762 [m]
Test parameters:
SFW-72
Analysis method: Hantush-Jacob
Aquifer thickness: 50 [m]
Analysis results:
Date: 8/13/2009
Test name:

Fracflow Consultants Inc.154 Major's Path
St. John's, NL
(709) 739-7270
Project:
No:
Client:
500_Aquifer Test
500
Cold Ocean Salmon Inc.
Pumping Test Analysis Report
DFA
SFW-72-DFA (Hantush-Jacob)
t [min]1E-1 1E+0 1E+1 1E+2 1E+3 1E+4 1E+5 1E+6
1/u1E-1 1E+0 1E+1 1E+2 1E+3 1E+4 1E+5 1E+6 1E+7
W(u
,r/L
1E-3
1E-2
1E-1
1E+0
1E+1
1E+2
s [m]
1E-3
1E-2
1E-1
1E+0
1E+1
THEIS0.010.05
0.5
1
2
3
4
5
6
0.01
Transmissivity: 8.09E-4 [m²/s] Conductivity: 1.62E-5 [m/s]
Figure B6 Analysis of aquifer test on DFA Well (observation well) using the Hantush-Jacob method on a log-log plot during 72 hour aquifer test on Sea Farm Well (pumping well).
SFWPumping well:
Discharge rate: 3.8642 [l/s]
Casing radius 0.0762 [m]
Screen length: 50 [m]
Screen radius: 0.0762 [m]
0.01
Test parameters:
SFW-72-DFA
Analysis method: Hantush-Jacob
Aquifer thickness: 50 [m]
Analysis results:
Date:
r/L:
8/13/2009
Test name:
Storativity: 4.44E-5 c: 7.67E+8 [min]

Project No. Scale
500 Not To Scale Location Date
St. Alban's NL August 2009
Plot of drawdown versus time for the step drawdown test on Town Well #8.FFC
Figure B7
0
0.5
1
1.5
2
2.5
3
3.5
4
4.50 20 40 60 80 100 120
Time Since Pump Started (minutes)
Dra
wdo
wn
Bel
ow C
asin
g (m
)
Step 1Q = 65 L/min ?
Step 2Q = 189 L/min ?
AquiferTest: Step-drawdown Test Site: St. Alban'sWell No.: Town WellDate: July 22, 2009
Levelogger Date
Step 4Q = 379 L/min ?
Step 3Q = 284 L/min ?

Project No. Scale
500 Not To Scale Location Date
St. Alban's NL August 2009
Log-log plot of drawdown versus time for Town Well #8 for aquifer test.FFC
Figure B8
1
10
0 1 10 100 1000 10000
Time Since Pump Started (minutes)
Dra
wdo
wn
(m)
AquiferTest: 48 hr Aquifer Test Site: St. Alban'sWell No.: Town WellDate: July 22-24, 2009
Levelogger Date