fragmentation in financial markets: the rise of dark … · fragmentation in financial markets: the...
TRANSCRIPT

Fragmentation in
Financial Markets:
The Rise of Dark Liquidity
Sabrina Buti
Global Risk Institute – April 7th 2016
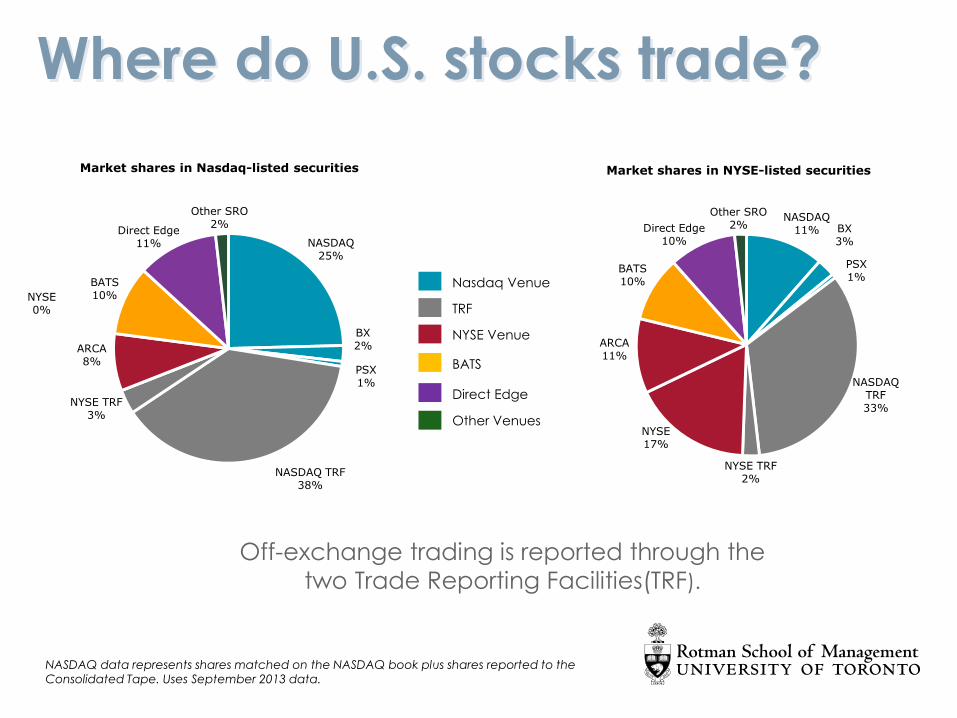
Where do U.S. stocks trade?
NASDAQ 25%
BX 2%
PSX 1%
NASDAQ TRF 38%
NYSE TRF 3%
NYSE 0%
ARCA 8%
BATS 10%
Direct Edge 11%
Other SRO 2%
Market shares in Nasdaq-listed securities
Nasdaq Venue
TRF
NYSE Venue
BATS
Direct Edge
Other Venues
NASDAQ 11% BX
3%
PSX 1%
NASDAQ TRF 33%
NYSE TRF 2%
NYSE 17%
ARCA 11%
BATS 10%
Direct Edge 10%
Other SRO 2%
Market shares in NYSE-listed securities
NASDAQ data represents shares matched on the NASDAQ book plus shares reported to the
Consolidated Tape. Uses September 2013 data.
Off-exchange trading is reported through the
two Trade Reporting Facilities(TRF).
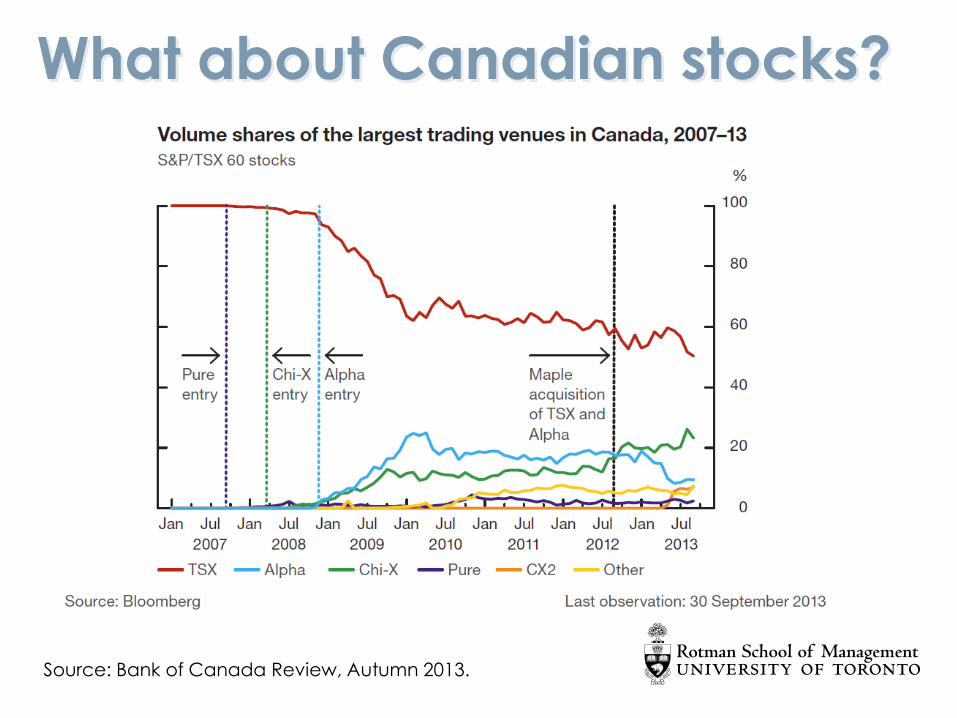
What about Canadian stocks?
Source: Bank of Canada Review, Autumn 2013.
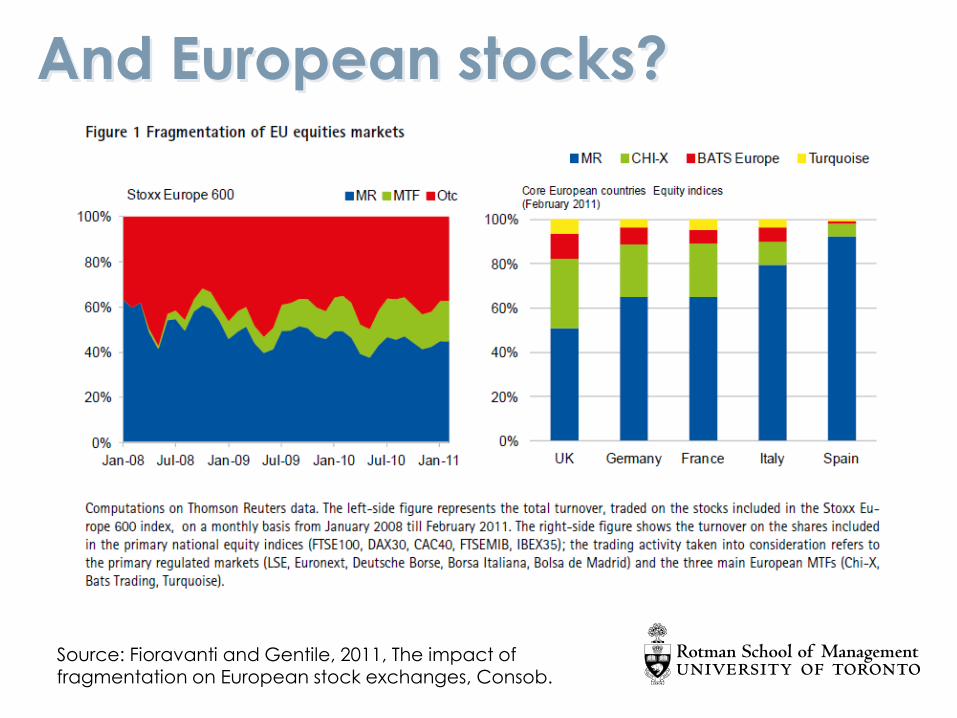
And European stocks?
Source: Fioravanti and Gentile, 2011, The impact of fragmentation on European stock exchanges, Consob.
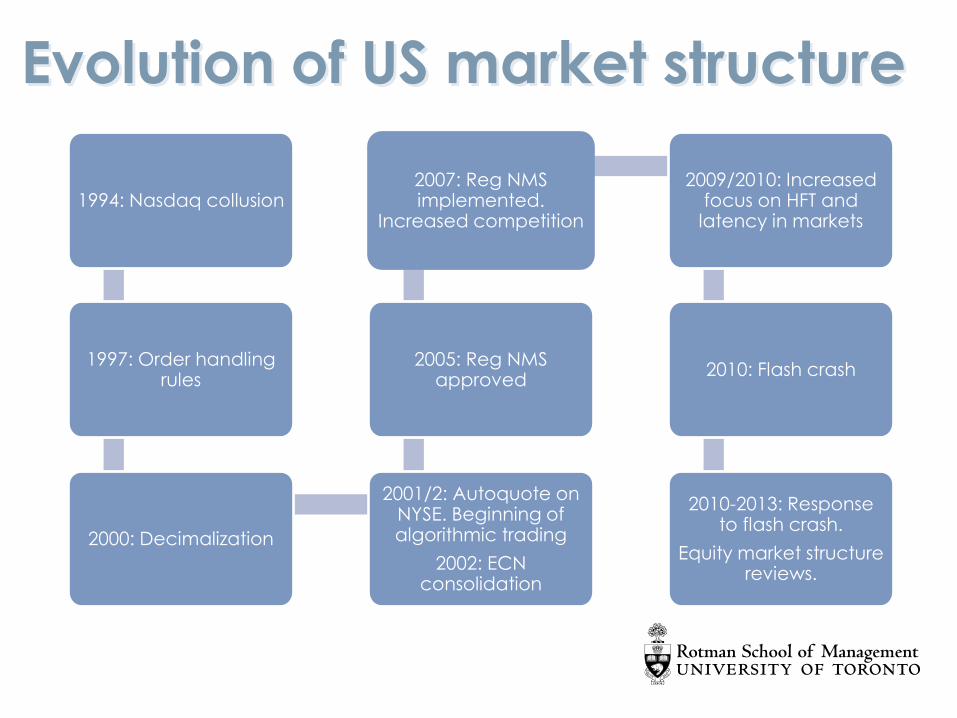
Evolution of US market structure
1994: Nasdaq collusion
1997: Order handling rules
2000: Decimalization
2001/2: Autoquote on NYSE. Beginning of algorithmic trading
2002: ECN consolidation
2005: Reg NMS approved
2007: Reg NMS implemented.
Increased competition
2009/2010: Increased focus on HFT and
latency in markets
2010: Flash crash
2010-2013: Response to flash crash.
Equity market structure reviews.

State of the market
Source: Barclays research.

A new world: Trading complexity
Lit Venues
Dark Venues
10
29
50
16
13
16
2002 2009 2012
Source: Nasdaq
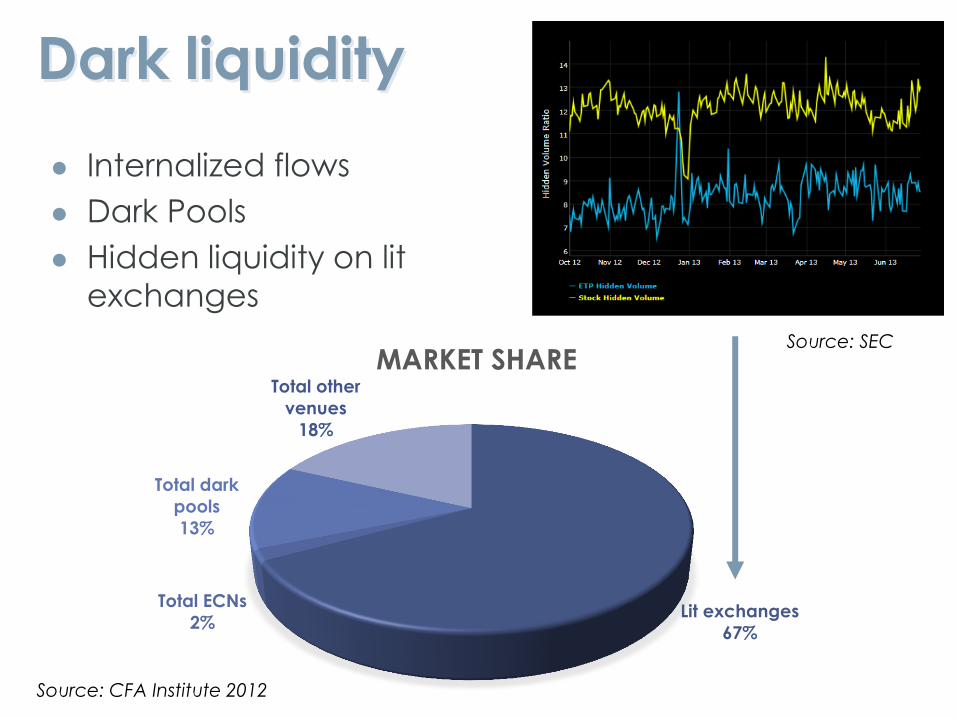
Dark liquidity
Internalized flows
Dark Pools
Hidden liquidity on lit
exchanges
Lit exchanges
67%
Total ECNs
2%
Total dark
pools
13%
Total other
venues
18%
MARKET SHARE
Source: CFA Institute 2012
Source: SEC
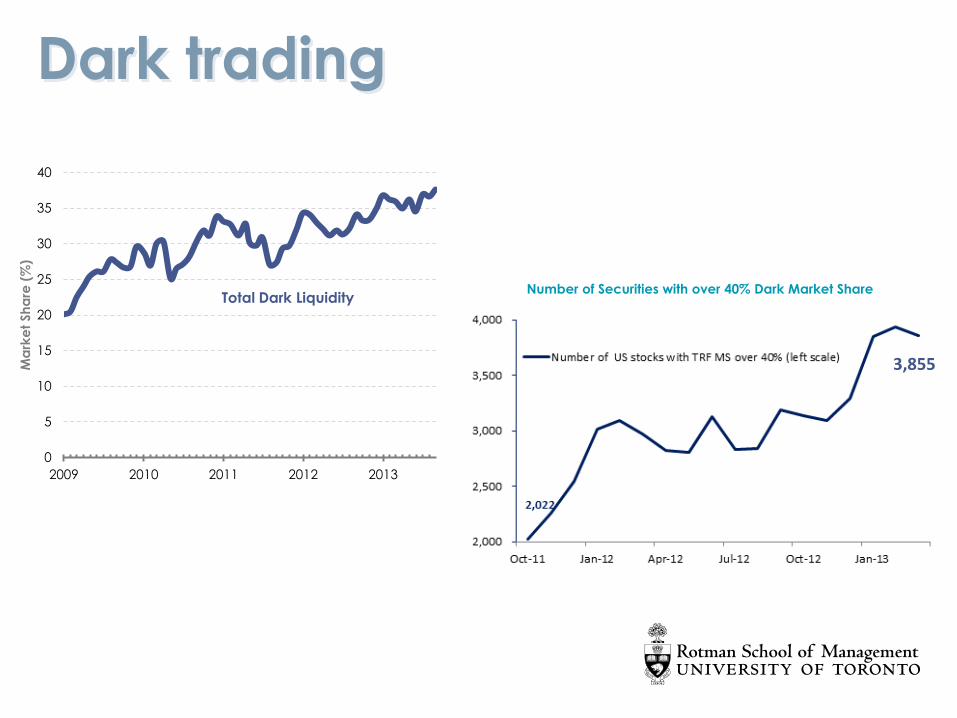
Dark trading
0
5
10
15
20
25
30
35
40
2009 2010 2011 2012 2013
Ma
rke
t Sh
are
(%
)
Total Dark Liquidity Number of Securities with over 40% Dark Market Share
3,855
What are dark pools?
Alternative Trading Systems that do
not provide their best-priced orders
for inclusion in the consolidated
quotation data
Provide anonymity and opacity pre-
trade to institutions
Derivative pricing, mid-quote, inside,
at-quotes (controversial)
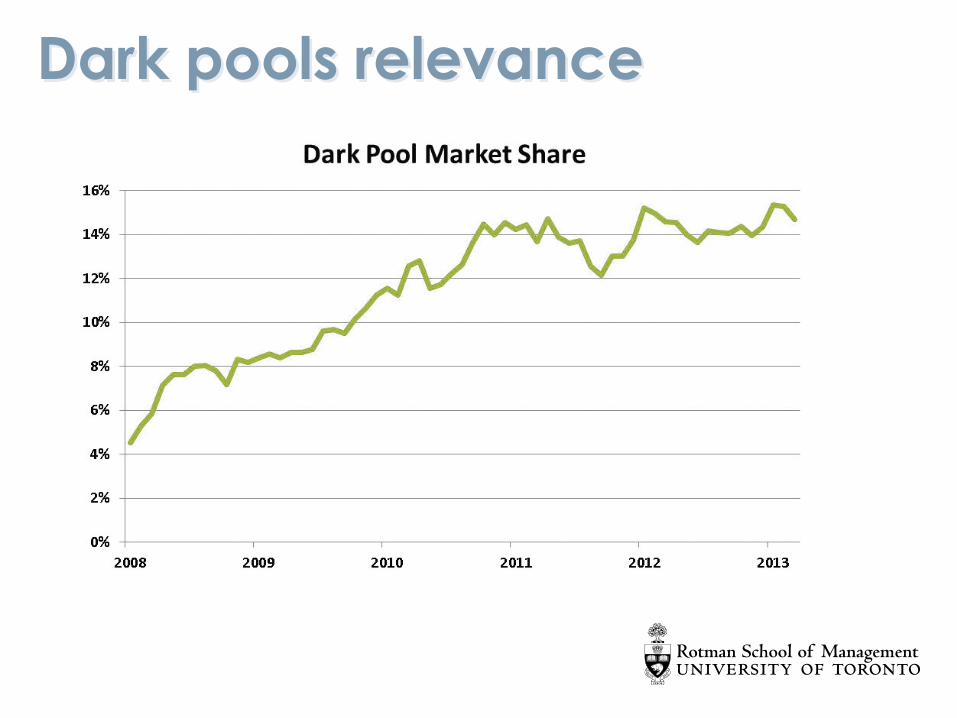
Dark pools relevance

Dark pools classification (I)
Dark Pools classification based on:
market model [periodic vs continuous crossing, blind vs
advertisement based, ...]
ownership [traditional exchange vs single or a group of broker-
dealers]
access [buy or sell side, both retail vs institutional, ...]

Dark pools classification (II)
Independent/Agency pools
Bank/Brokers pools
Market Maker pools
Consortium-Sponsored pools
Exchange-Based dark pools
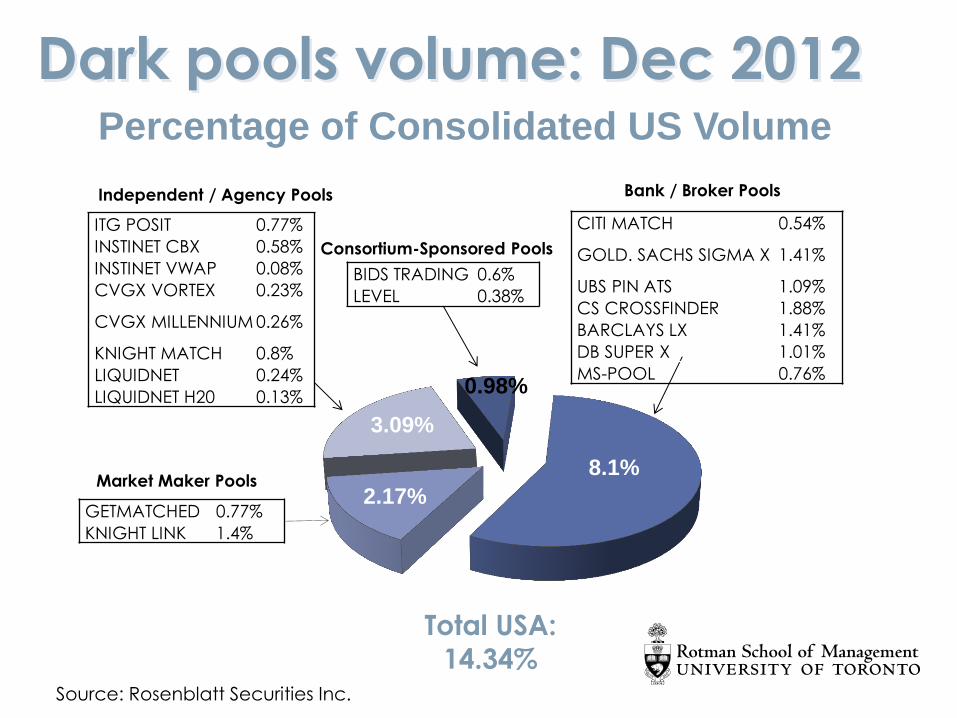
Dark pools volume: Dec 2012 Percentage of Consolidated US Volume
Source: Rosenblatt Securities Inc.
Independent / Agency Pools
0.98%
3.09%
2.17%
8.1%
ITG POSIT 0.77%
INSTINET CBX 0.58%
INSTINET VWAP 0.08%
CVGX VORTEX 0.23%
CVGX MILLENNIUM 0.26%
KNIGHT MATCH 0.8%
LIQUIDNET 0.24%
LIQUIDNET H20 0.13%
CITI MATCH 0.54%
GOLD. SACHS SIGMA X 1.41%
UBS PIN ATS 1.09%
CS CROSSFINDER 1.88%
BARCLAYS LX 1.41%
DB SUPER X 1.01%
MS-POOL 0.76%
Bank / Broker Pools
BIDS TRADING 0.6%
LEVEL 0.38%
Consortium-Sponsored Pools
Market Maker Pools
GETMATCHED 0.77%
KNIGHT LINK 1.4%
Total USA:
14.34%
A few questions about dark pools
Who wants to hide in the dark?
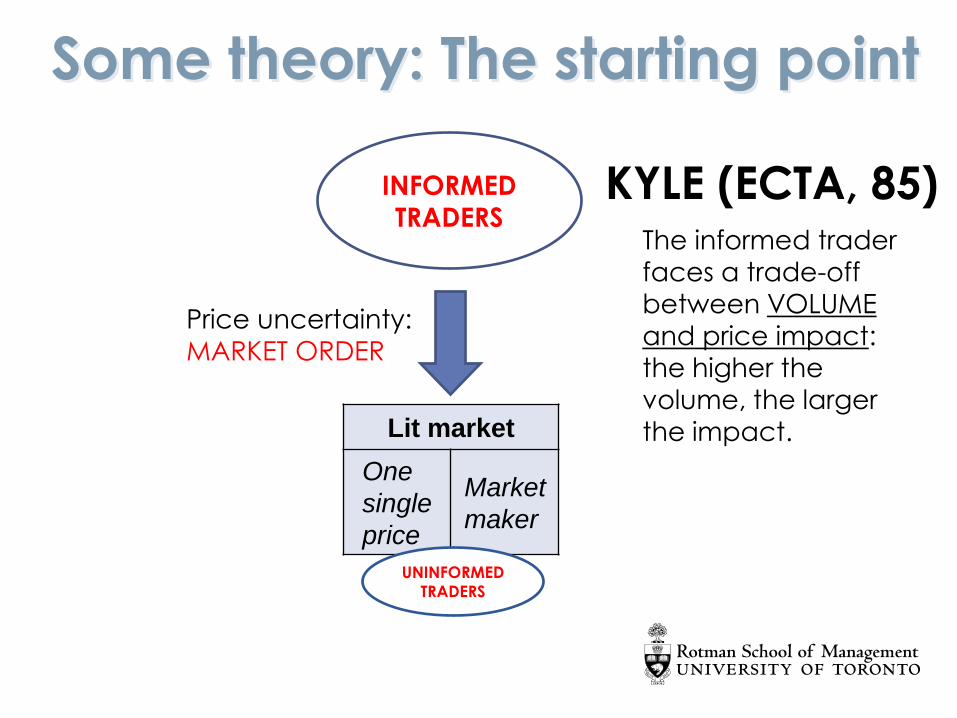
Some theory: The starting point
Price uncertainty:
MARKET ORDER
KYLE (ECTA, 85) The informed trader
faces a trade-off
between VOLUME
and price impact:
the higher the
volume, the larger
the impact.
INFORMED TRADERS
Lit market
One
single
price
Market
maker
UNINFORMED
TRADERS

INFORMED TRADERS
Derivative Price
Dark Pool (DP):
Crossing Network
UNINFORMED
TRADERS
The informed trader still
faces a trade-off
between VOLUME and price impact.
Incentives to move to
the DP, where there is
NO PRICE IMPACT.
BUT the more you
trade on the DP, the
lower is the probability of execution.
Go dark as long as it is
profitable to do so!
Execution uncertainty:
UNKNOWN IMBALANCE
Ye (WP, 2011): Informed go dark
Lit market
One
single
price
Market
maker
UNINFORMED
TRADERS
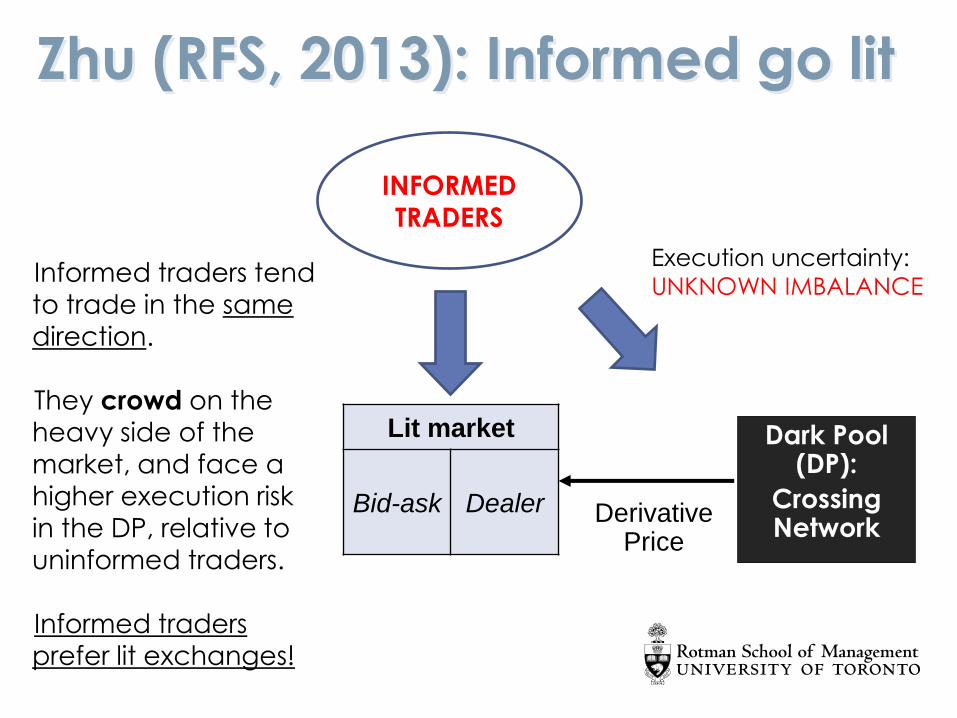
Zhu (RFS, 2013): Informed go lit
INFORMED TRADERS
Lit market
Bid-ask Dealer Derivative Price
Informed traders tend
to trade in the same
direction.
They crowd on the
heavy side of the
market, and face a
higher execution risk
in the DP, relative to
uninformed traders.
Informed traders prefer lit exchanges!
Execution uncertainty:
UNKNOWN IMBALANCE
Dark Pool (DP):
Crossing Network

To summarize…
Ye (WP, 2011):
DPs attract informed traders, harm price discovery
and decrease adverse selection on the lit market
DPs have incentives to get rid of informed traders
Zhu (RFS, 2013):
Exchanges are more attractive to informed traders,
and DPs are more attractive to uninformed traders
Adding a DP could concentrate price-relevant info
on the exchange and improve price discovery, but
reduce exchange liquidity (spread)

Now to the data!
Buti, Rindi and Werner (WP, 2011):
DP activity in the U.S. results in improved price
efficiency based on short-term volatility measures
Comerton-Forde and Putnins (JFE, 2015):
in Australia, orders executed in the dark are less
informed that orders executed in the lit
dark trades increase adverse selection on the
main market, worsening market quality
low levels of dark trading are benign or even
beneficial for informational efficiency, but high
levels are harmful
Who wants to hide in the dark?
Price improvement in dark pools?
Should we be afraid of the dark?
A few questions about dark pools

Better prices in dark pools?
Source: Nasdaq analysis

SEC Reg NMS Rule 612
Introduced on August 29, 2005
Established minimum price variation for lit markets:
$0.01 for stocks priced higher than $1
$0.0001 for stocks priced at $1 and below
Dark markets are exempt from Rule 612 provided:
execute less than 5% of the volume
do not display their orders
So Rule 612 allows for:
broker-dealer internalization
dark trading in sub-penny

Queue jumping…
𝐴2
𝐴1
𝐵1
𝐵2
𝑣
𝑎5
𝑎2
𝑎3
𝑎4
𝑏1
𝑎1
𝑏3
𝑏2
𝑏5
𝑏4
Exchange Dark pool or
Internalization
Market order
Sub-penny trade

How does sub-penny trading work?
In theory…
Rule 612 states that no market participant can
accept, rank, or display orders priced in sub-pennies.
In practice…
On Jan. 2015 the SEC fined a dark pool operator
$14.4 million for accepting and ranking hundreds of
millions of orders priced in increments smaller than
one cent that were submitted to his dark pool.
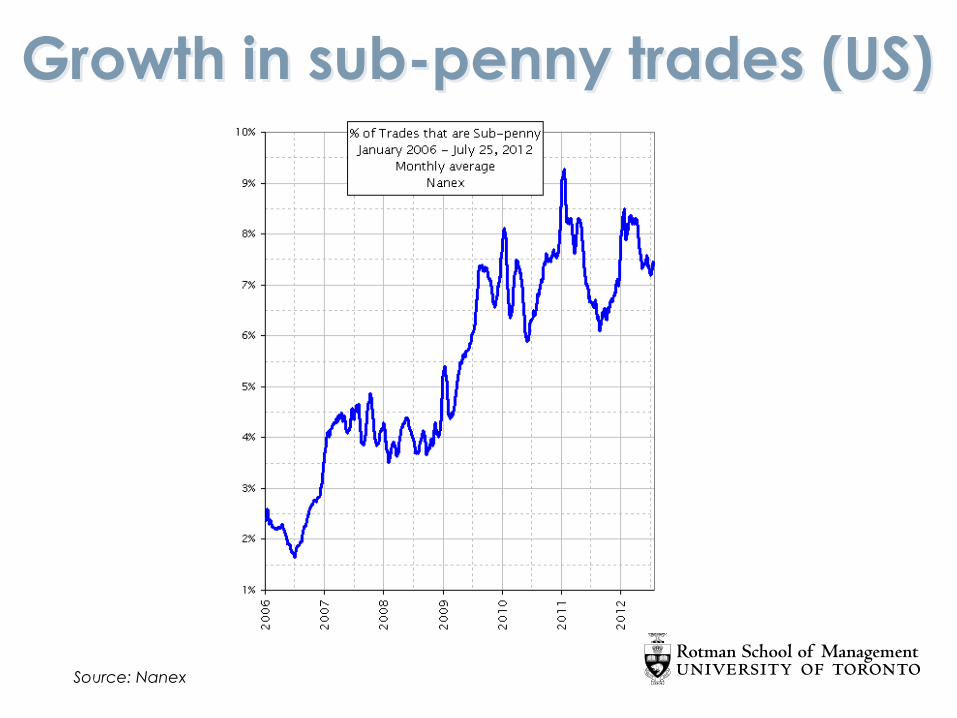
Growth in sub-penny trades (US)
Source: Nanex

Canadian experiment
Source: IIROC
On October 15, 2012, Canadian regulators made
providing liquidity in the dark more expensive
The new rule specifies the improvement that dark
liquidity providing orders must offer relative to the
best lit bid and offer:
At least 1 cent (1/2 if the lit spread is 1 cent)
Applies to marketable orders below 5,000 shares or $100,000 in value
Does not affect midpoint orders and block trading
Dark markets moved from fractional pricing (90/10
and 80/20) to midpoint
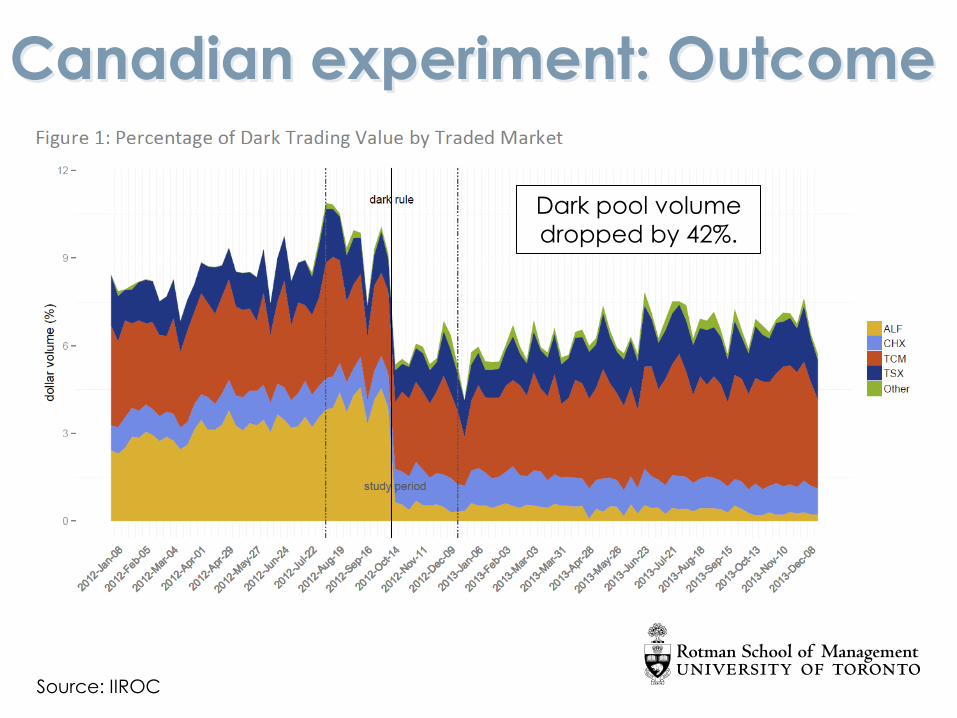
Canadian experiment: Outcome
Source: IIROC
Dark pool volume
dropped by 42%.
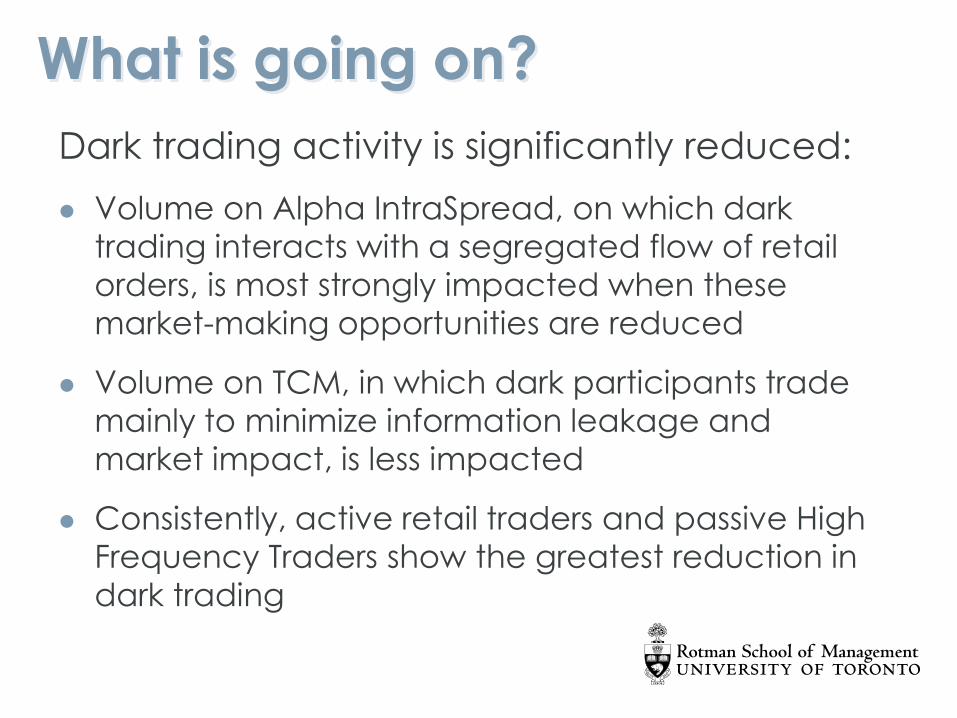
What is going on?
Dark trading activity is significantly reduced:
Volume on Alpha IntraSpread, on which dark
trading interacts with a segregated flow of retail
orders, is most strongly impacted when these
market-making opportunities are reduced
Volume on TCM, in which dark participants trade
mainly to minimize information leakage and
market impact, is less impacted
Consistently, active retail traders and passive High
Frequency Traders show the greatest reduction in
dark trading
Successful experiment?
Reduction in dark volume without meaningful
price improvement
Minimal market-wide impact as most
measures of market quality showed no
deterioration
However… Talis and Putnins (JFE, forthcoming)
analyze the same experiment and find that
midpoint crossing systems do not benefit
market quality, but dark limit order markets are
beneficial to market quality
Why separate?
There are two main reasons why trades execute
on alternative trading systems at fractions of
penny:
Undercutting orders posted at the top of public limit
order books (queue-jumping& mid-crossing)
The execution system of some dark pools and broker-
dealers internalization systems follows a derivative pricing rule: trades execute at the midpoint of the
primary market inside spread (mid-crossing)
Mid-crossing therefore does not necessarily
include only undercutting and could potentially
mix different trading strategies

Back to the U.S.
October 1st – November 30th, 2010 (42
trading days)
Stratified sample of 90 Nasdaq and 90 NYSE
listed common stocks, sorted into terciles by
market capitalization and price as of the end
of 2009
Sub-penny trading is further divided into:
Mid-crossing
Queue-jumping

Example in TAQ data: IBM
ID Symbol Date Time Exchange
Price Size Rounded Price Price Improvement
Type of Sub-Penny
1 IBM 20101001 10:00:00 K 135,76 100 135,76 0 None
2 IBM 20101001 10:00:00 K 135,77 100 135,77 0 None
3 IBM 20101001 10:00:00 K 135,84 100 135,84 0 None
… IBM 20101001 10:00:00 … … … … … …
17 IBM 20101001 10:00:00 T 135,84 200 135,84 0 None
18 IBM 20101001 10:00:01 D 135,64 196 135,64 0 None
19 IBM 20101001 10:00:01 D 135,7375 200 135,74 0,0025 Queue-Jumping
20 IBM 20101001 10:00:01 N 135,67 100 135,67 0 None
… IBM 20101001 10:00:01 … … … … … …
28 IBM 20101001 10:00:03 B 135,76 100 135,76 0 None
29 IBM 20101001 10:00:03 D 135,76 100 135,76 0 None
30 IBM 20101001 10:00:03 D 135,825 300 135,83 0,005 Mid-Crossing
Queue-jumping:
price improvement ≠ 0.005
Mid-crossing:
price improvement = 0.005
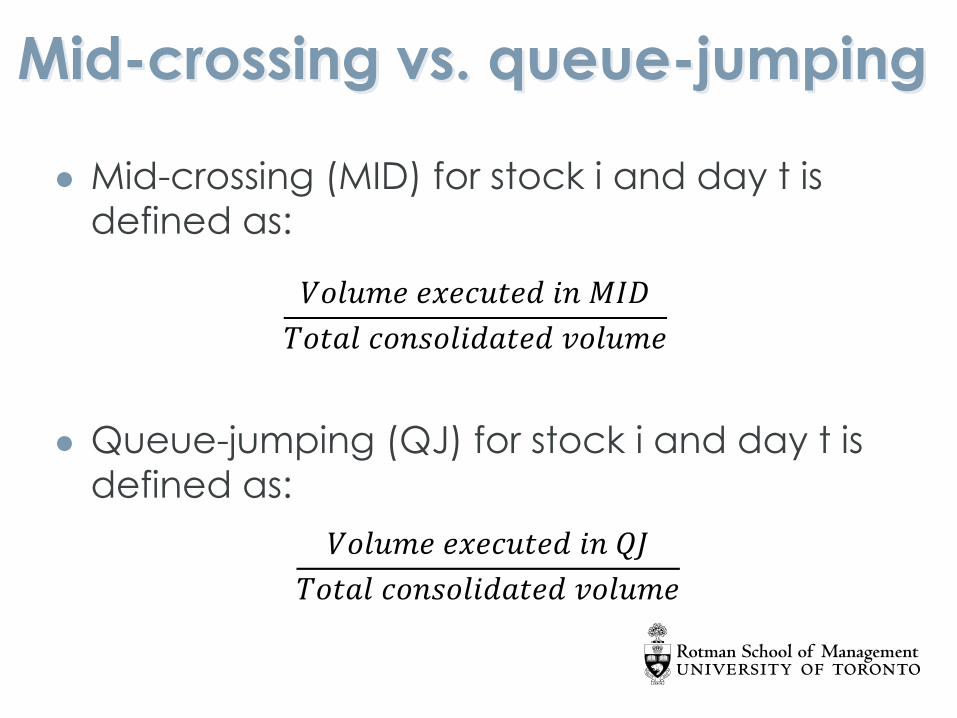
Mid-crossing vs. queue-jumping
Mid-crossing (MID) for stock i and day t is
defined as:
Queue-jumping (QJ) for stock i and day t is
defined as:
𝑉𝑜𝑙𝑢𝑚𝑒 𝑒𝑥𝑒𝑐𝑢𝑡𝑒𝑑 𝑖𝑛 𝑀𝐼𝐷
𝑇𝑜𝑡𝑎𝑙 𝑐𝑜𝑛𝑠𝑜𝑙𝑖𝑑𝑎𝑡𝑒𝑑 𝑣𝑜𝑙𝑢𝑚𝑒
𝑉𝑜𝑙𝑢𝑚𝑒 𝑒𝑥𝑒𝑐𝑢𝑡𝑒𝑑 𝑖𝑛 𝑄𝐽
𝑇𝑜𝑡𝑎𝑙 𝑐𝑜𝑛𝑠𝑜𝑙𝑖𝑑𝑎𝑡𝑒𝑑 𝑣𝑜𝑙𝑢𝑚𝑒
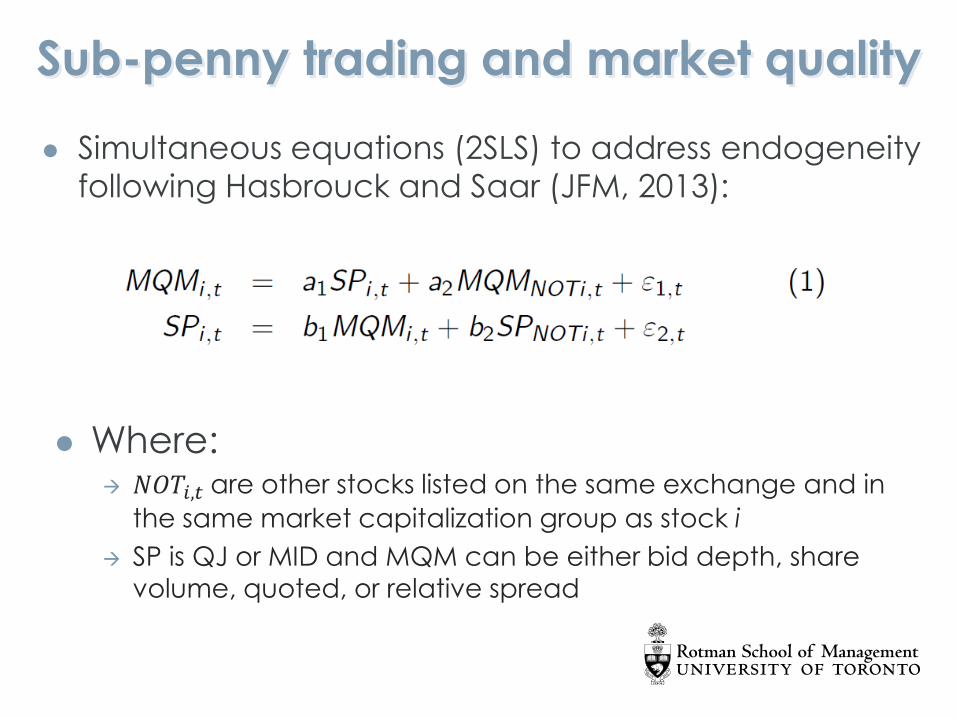
Sub-penny trading and market quality
Simultaneous equations (2SLS) to address endogeneity
following Hasbrouck and Saar (JFM, 2013):
Where: 𝑁𝑂𝑇𝑖,𝑡 are other stocks listed on the same exchange and in
the same market capitalization group as stock i
SP is QJ or MID and MQM can be either bid depth, share
volume, quoted, or relative spread

Empirical analysis
Full sample Small Large
𝑎1 0.342*** 0.044 0.281*
(3.358) (0.240) (2.338)
𝑎2 0.523*** 0.371*** 0.645***
(10.266) (4.294) (8.665)
Observations 7,560 2,520 2,520
Bid depth and QJ
Full sample Small Large
𝑎1 -0.493*** -0.551 -0.288*
(-3.749) (-1.837) (-2.339)
𝑎2 0.631*** 0.582*** 0.684***
(11.720) (5.614) (9.592)
Observations 7,560 2,520 2,520
Relative spread and QJ
Full sample Small Large
𝑎1 0.202 -0.041 0.253
(0.940) (-0.198) (0.790)
𝑎2 0.602*** 0.368*** 0.719***
(13.768) (4.279) (9.500)
Observations 7,560 2,520 2,520
Bid depth and MID
Full sample Small Large
𝑎1 -0.321 -0.076 -0.581
(-1.360) (-0.209) (-1.283)
𝑎2 0.742*** 0.719*** 0.669***
(17.162) (12.300) (5.874)
Observations 7,560 2,520 2,520
Relative spread and MID

Should we be afraid of the dark?
Dark pools seem to be used mainly by
uninformed traders and not to have a
negative effect on price efficiency
No evidence that SPT harms liquidity: QJ
seems to improve market quality at least for
liquid stocks and MID shows no significant
effect, both in US and Canada
But too early to draw final conclusions… we
still need better data!