franchise business ownership by minority and gender groups
TRANSCRIPT
7/29/2019 Franchise Business Ownership By Minority and Gender Groups
http://slidepdf.com/reader/full/franchise-business-ownership-by-minority-and-gender-groups 1/44
Published by Sponsored by
FRANCHISEDBUSINESS OWNERSHIP:
By Minority and Gender Groups

7/29/2019 Franchise Business Ownership By Minority and Gender Groups
http://slidepdf.com/reader/full/franchise-business-ownership-by-minority-and-gender-groups 2/44
© 2011 The IFA Educational Foundation. All Rights Reserved. No part of this book may be reproduced or transmitted in any form, by any means (electronic, photocopying, recording or otherwise) without the written permission of the publisher.IFA Educational Foundation, 1501 K Street NW, Suite 350, Washington, DC 20005, (202) 662-0764, www.franchise.org.

7/29/2019 Franchise Business Ownership By Minority and Gender Groups
http://slidepdf.com/reader/full/franchise-business-ownership-by-minority-and-gender-groups 3/44
FRANCHISEDBUSINESS OWNERSHIP:
By Minority and Gender Groups
Sponsored by
A Report for the IFA Educational Foundation by theNational Economics and Statistics Practice of
PricewaterhouseCoopers LLP
I

7/29/2019 Franchise Business Ownership By Minority and Gender Groups
http://slidepdf.com/reader/full/franchise-business-ownership-by-minority-and-gender-groups 4/44

7/29/2019 Franchise Business Ownership By Minority and Gender Groups
http://slidepdf.com/reader/full/franchise-business-ownership-by-minority-and-gender-groups 5/44
PREFAC
III
In 2007, the IFA EducationalFoundationpublished therst report onthe prevalence
of minority and female ownershipin franchised businesses. Thereport, prepared by PwC for theFoundation, was based on 2002
Census data, and was the rst comprehensive look at
franchise ownership rates among minority and gender groups. One of the chief reasons for conducting the study was to establish a baseline against which future progresscould be measured.
The Foundation’s new report, Franchised BusinessOwnership, 2007: Minority and Gender Groups, providesdetailed information about minority and female ownership,including the percent of franchised businesses owned by minorities and women, comparisons of ownership ratesbetween franchised and non-franchised businesses, andcomparisons with results for 2002. The report answerstwo key questions – What percent of franchised businesses
are owned by a minority group member, by females, andequally-owned (male/female)? What percent of minority-owned, female-owned, and equally-owned businesses arefranchised? In addition, the report provides informationabout minority and female ownership rates in the foodservices and drinking places industry, which includes alarge concentration of franchised businesses. The report also provides information about ownership rates by sizeof business. The new report, prepared by PwC for theFoundation, is based on the U.S. Census Bureau’s 2007 Survey of Business Owners (“SBO”).
One of the major goals in IFA’s strategic plan is to increasethe participation of minorities and women in all facetsof the franchising industry. While the report shows that progress has been made in some areas, much more work needs to be done to reap the full potential of expandingopportunities for women and minorities. The rapid paceof demographic change and population growth combine tocreate some unique opportunities for franchise businesses.More than half of the population growth in the past decadecame from Hispanics. The Hispanic population grew by 43 percent during this time period, from 35.3 million in2000 to 50.5 million in 2010. The Asian population also
grew by 43 percent, from 10.2 million to 14.7 million.Franchising can tap this expanding talent pool of futurebusiness owners and employees.
The new report shows that the minority ownership rate for franchised businesses increased by 1.2 percentage pointsfrom 19.3 percent in 2002 to 20.5 percent in 2007, anincrease of 6.2 percent. In 2007, 20.5% of franchisedbusinesses were owned by minorities, compared to 14.2%of non-franchised businesses. Female ownership amongfranchised businesses declined from 25% in 2002 to 20.5%
in 2007, a decrease of 18%. However, during this sametime period, the share of franchise businesses that wereequally male/female owned increased from 17.1% in 200to 24.4% in 2007, or an increase of 42.7%.
The Foundation, through the IFA Diversity Institute, iscommitted to working with IFA members and with partner organizations to expand opportunities for women andminorities in the world of franchising. Franchising not only provides economic empowerment for the individualbusiness owner – it leverages their contributions for the whole franchise system. New franchise owners, fromdiverse backgrounds, cultures, gender, race, and ethnicity,
bring new energy and ideas to the world of franchising. Inthe words of Ron Harrison, CFE, IFA past chairman andfounding chairman of the IFA Diversity Institute, “embracindiversity is a business growth strategy”.
This research project, which began in 2005 under theleadership of then Foundation Chairman Mike Roman, CFEhas continued with the generous support of the ExxonMobCorporation. On behalf of the Foundation Board of Trustees, I want to give special thanks to ExxonMobil for sponsoring the report and for their great support of the IFADiversity Institute.
I would also like to give thanks to the PwC research teamfor their excellent work analyzing the Census data andpreparing this report.
John Reynolds, CFEPresident IFA Educational Foundation

7/29/2019 Franchise Business Ownership By Minority and Gender Groups
http://slidepdf.com/reader/full/franchise-business-ownership-by-minority-and-gender-groups 6/44
FOREWORD
IV
Minority-owned businesses continue to shine as the engines of job growthin the United States economy. These businesses provide nearly six millionjobs, and annually generate $1 trillion in economic output. Supporting thisoutput is the Minority Business Development Agency (MBDA), a bureauin the U.S. Department of Commerce. MBDA is the only federal agency tasked to promote the growth and global competitiveness of minority-owned rms. MBDA assists minority-owned rms in gaining access tocapital, contracts and new domestic and international markets.
One important sector of the minority business community is the franchise sector. The followingreport, commissioned by the International Franchise Association, offers a benecial analysis anda unique insight into the trends of minority-owned franchised businesses. Since 2007, the last year the report on Franchised Business Ownership was published, more minority entrepreneurshave utilized the substantial benets of franchising as a vehicle to expand their wealth base. According to data from the Census Bureau, minority ownership of franchised businesses increasedby 1.2 percentage points, and joint ownership (male/female) increased by 7.3 percentage points.Minority entrepreneurs also own franchise businesses at a higher percentage than non-franchisedbusinesses—a difference of 6.3 percentage points between minorities who owned franchisedbusinesses and minorities who owned non-franchised businesses.
Today, we operate in a global economy and whether you own a franchise business or not, youhave to think in terms of partnering arrangements, acquisitions and the global expansion of your services if you want to grow. We encourage you to read this report and take advantage of itsndings. We also encourage you to consider a franchise business as a vehicle to achieve nancial
independence. There are thousands of excellent franchise business structures in the marketplace,but it’s important that you nd one that best leverages your skills, interests, vision and nancialcapacity so that you can grow your business and create new jobs—our nation depends on you.
I also encourage you to join the growing number of minority-owned rms that are takingadvantage of the premium business consulting services offered through MBDA’s nationwidenetwork of nearly 50 MBDA Business Centers and ofces. Visit our website at www.mbda.gov/main/ofces and nd an MBDA Business Center near you. Our business centers are designed tohelp you grow your business so take advantage of the services that they offer. Let the MBDA teamassist you in taking your business to the next level through capital and contracting opportunities,and access to new markets.
On behalf of the Minority Business Development Agency, I extend a special thanks to the
International Franchise Association for their continued effort to increase the number of franchisesowned and operated by minority entrepreneurs and expand economic opportunity for all Americans.
David A. HinsonNational Director

7/29/2019 Franchise Business Ownership By Minority and Gender Groups
http://slidepdf.com/reader/full/franchise-business-ownership-by-minority-and-gender-groups 7/44
EXECUTIVE SUMMARY
TheFoundation’s new report, Franchised BusinessOwnership, 2007: Minority and Gender Groups, provides detailed information about minority and female ownership, includingthe percent of franchised businesses owned
by minorities and women, comparisons of ownership rates betweenfranchised and non-franchised businesses, and comparisons with resultsfor 2002. The report answers two key questions – What percent of franchised businesses are owned by a minority group member, by females,and equally-owned (male/female)? What percent of minority-owned,female-owned, and equally-owned businesses are franchised? In addition,the report provides information about minority and female ownershiprates in the food services and drinking places industry, which includes alarge concentration of franchised businesses. The report also providesinformation about ownership rates by size of business. The new report,prepared by PwC for the Foundation, is based on the U.S. Census Bureau’s2007 Survey of Business Owners (“SBO”).
New Report Shows Changein Franchise BusinessOwnership Among Women
and Minorities
V
7/29/2019 Franchise Business Ownership By Minority and Gender Groups
http://slidepdf.com/reader/full/franchise-business-ownership-by-minority-and-gender-groups 8/44
Following are some highlights of the report –
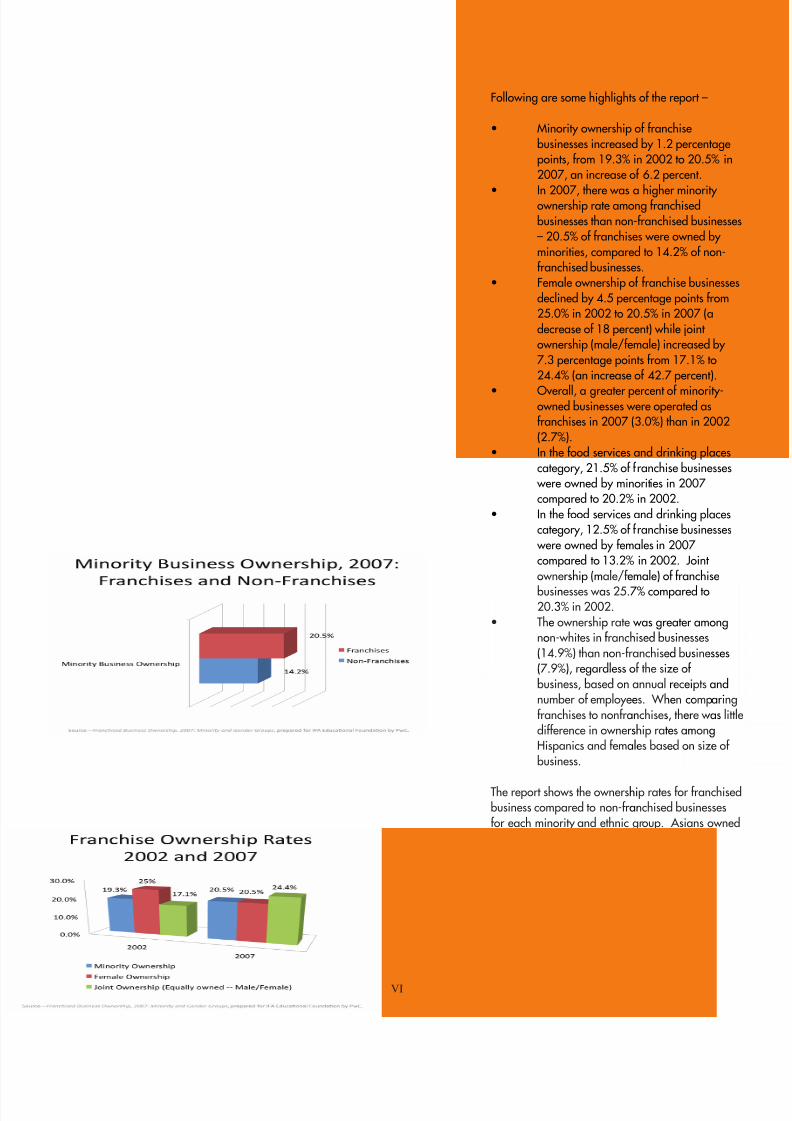
• Minority ownership of franchisebusinesses increased by 1.2 percentagepoints, from 19.3% in 2002 to 20.5% in2007, an increase of 6.2 percent.
• In 2007, there was a higher minority ownership rate among franchisedbusinesses than non-franchised businesses– 20.5% of franchises were owned by minorities, compared to 14.2% of non-franchised businesses.
• Female ownership of franchise businessesdeclined by 4.5 percentage points from25.0% in 2002 to 20.5% in 2007 (adecrease of 18 percent) while joint ownership (male/female) increased by 7.3 percentage points from 17.1% to24.4% (an increase of 42.7 percent).
• Overall, a greater percent of minority-owned businesses were operated asfranchises in 2007 (3.0%) than in 2002(2.7%).
• In the food services and drinking placescategory, 21.5% of franchise businesses were owned by minorities in 2007 compared to 20.2% in 2002.
• In the food services and drinking placescategory, 12.5% of franchise businesses were owned by females in 2007 compared to 13.2% in 2002. Joint ownership (male/female) of franchise
businesses was 25.7% compared to20.3% in 2002.
• The ownership rate was greater amongnon-whites in franchised businesses(14.9%) than non-franchised businesses(7.9%), regardless of the size of business, based on annual receipts andnumber of employees. When comparingfranchises to nonfranchises, there was littledifference in ownership rates amongHispanics and females based on size of business.
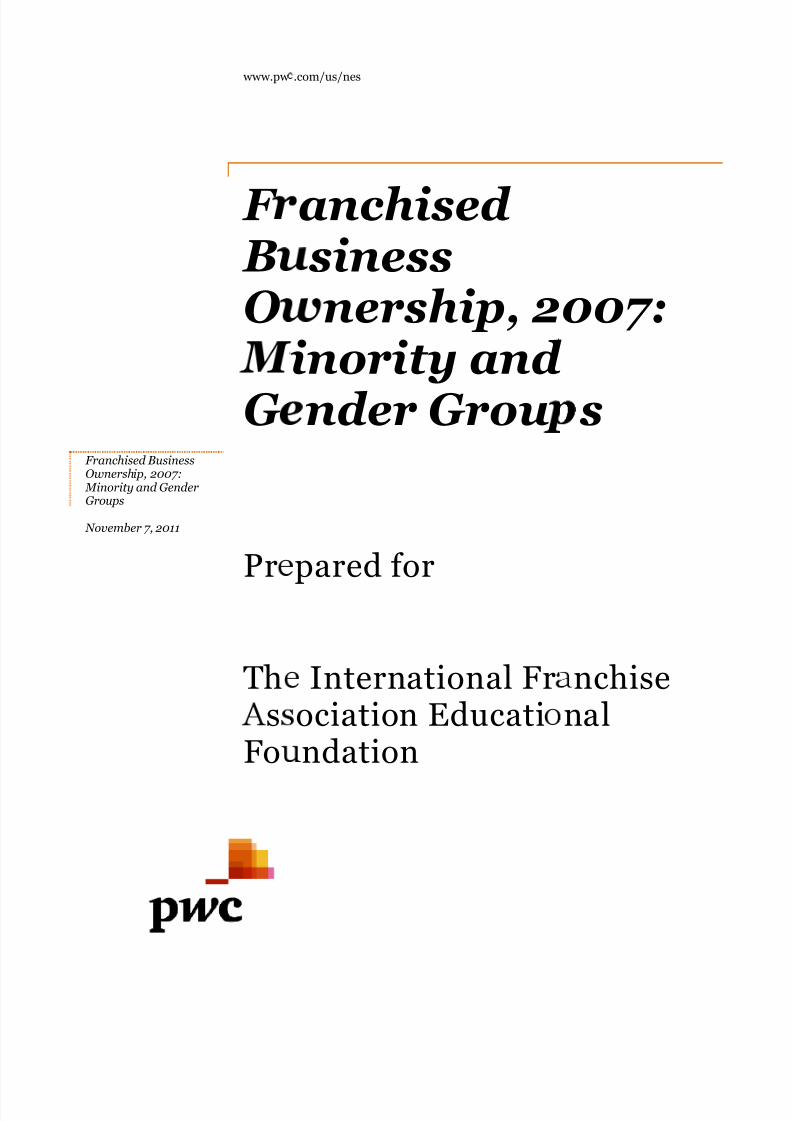
The report shows the ownership rates for franchisedbusiness compared to non-franchised businessesfor each minority and ethnic group. Asians owned10.4% of all franchises compared to 4.9% of non-franchises. Blacks owned 4.9% of all franchisescompared to 3.6% of non-franchised businesses.Hispanics owned 5.2% of franchised businessescompared to 5.4% of non-franchised businesses.
VI
7/29/2019 Franchise Business Ownership By Minority and Gender Groups
http://slidepdf.com/reader/full/franchise-business-ownership-by-minority-and-gender-groups 9/44
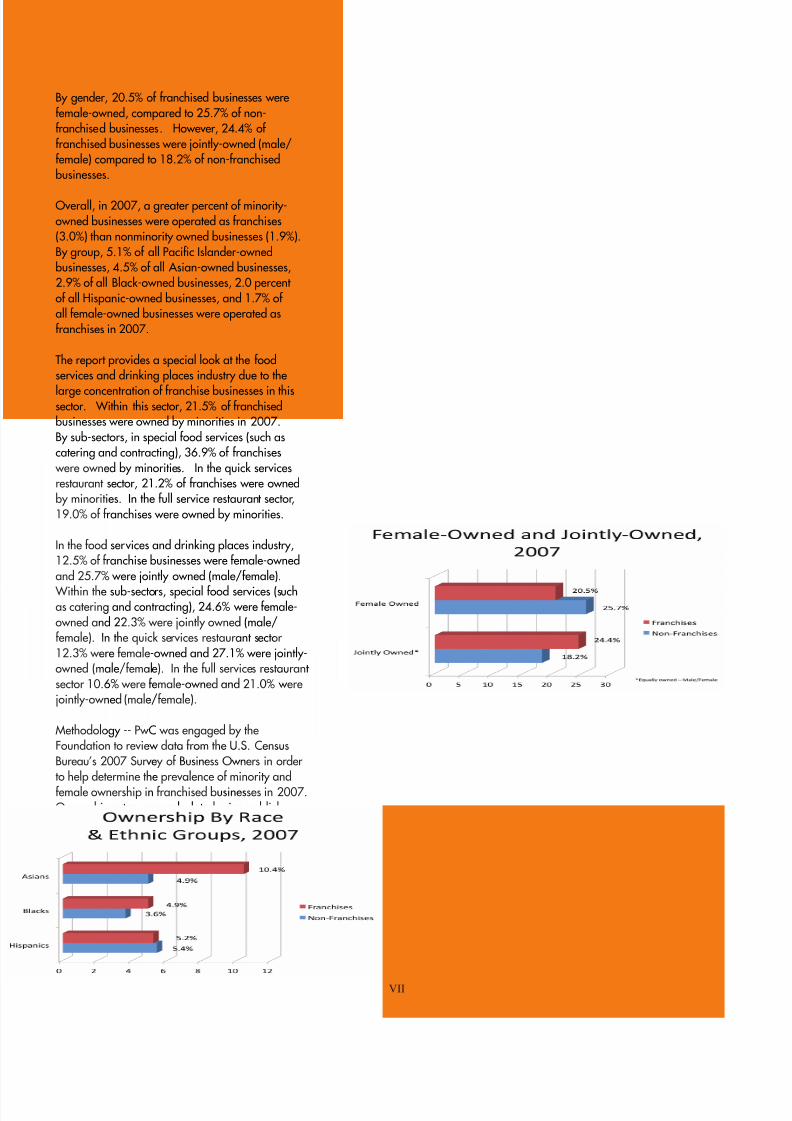
By gender, 20.5% of franchised businesses werefemale-owned, compared to 25.7% of non-franchised businesses. However, 24.4% of franchised businesses were jointly-owned (male/female) compared to 18.2% of non-franchisedbusinesses.
Overall, in 2007, a greater percent of minority-owned businesses were operated as franchises(3.0%) than nonminority owned businesses (1.9%).By group, 5.1% of all Pacic Islander-ownedbusinesses, 4.5% of all Asian-owned businesses,2.9% of all Black-owned businesses, 2.0 percent of all Hispanic-owned businesses, and 1.7% of all female-owned businesses were operated asfranchises in 2007.
The report provides a special look at the foodservices and drinking places industry due to the
large concentration of franchise businesses in thissector. Within this sector, 21.5% of franchisedbusinesses were owned by minorities in 2007.By sub-sectors, in special food services (such ascatering and contracting), 36.9% of franchises were owned by minorities. In the quick servicesrestaurant sector, 21.2% of franchises were ownedby minorities. In the full service restaurant sector,19.0% of franchises were owned by minorities.
In the food services and drinking places industry,12.5% of franchise businesses were female-ownedand 25.7% were jointly owned (male/female).
Within the sub-sectors, special food services (suchas catering and contracting), 24.6% were female-owned and 22.3% were jointly owned (male/female). In the quick services restaurant sector 12.3% were female-owned and 27.1% were jointly-owned (male/female). In the full services restaurant sector 10.6% were female-owned and 21.0% werejointly-owned (male/female).
Methodology -- PwC was engaged by theFoundation to review data from the U.S. CensusBureau’s 2007 Survey of Business Owners in order to help determine the prevalence of minority andfemale ownership in franchised businesses in 2007.Ownership rates were calculated using publicly released data and special tabulations obtainedfrom the Census Bureau and were dened to bethe number of rms that were at least 51 percent owned by individuals in a particular racial, ethnic,or gender group divided by the total number of respondent rms that operated as a franchise in2007.
VII

7/29/2019 Franchise Business Ownership By Minority and Gender Groups
http://slidepdf.com/reader/full/franchise-business-ownership-by-minority-and-gender-groups 10/44
7/29/2019 Franchise Business Ownership By Minority and Gender Groups
http://slidepdf.com/reader/full/franchise-business-ownership-by-minority-and-gender-groups 11/44
www.pw
F BO
G
Pr
Ths
Fo
Franchised BusinessOwnership, 2007: Minority and GenderGroups
November 7, 2011
.com/us/nes
anchised sinessnership, 2
inority and nder Grou
pared for
International Frociation Educatindation
007:
s
nchisenal

7/29/2019 Franchise Business Ownership By Minority and Gender Groups
http://slidepdf.com/reader/full/franchise-business-ownership-by-minority-and-gender-groups 12/44
Franchised Business Ownership, 2007: Minority and Gender Groups
This document has been prepared pursuant to an engagement between PricewaterhouseCoopers LLP and itsClient. As to all other parties, it is for general information purposes only, and should not be used as a substitutefor consultation with professional advisors.
Table of Contents
EXECUTIVE SUMMARY E-1
I. INTRODUCTION 1
II. MINORITY AND GENDER OWNERSHIP WITHIN FRANCHISED ANDNONFRANCHISED BUSINESSES 3
III. FRANCHISED BUSINESSES AMONG MINORITY AND GENDER GROUPS 7
IV. FOOD SERVICES AND DRINKING PLACES 10
APPENDIX - SIZE OF BUSINESS COMPARISONS 18

7/29/2019 Franchise Business Ownership By Minority and Gender Groups
http://slidepdf.com/reader/full/franchise-business-ownership-by-minority-and-gender-groups 13/44
Franchised Business Ownership, 2007: Minority and Gender Groups
E-1
Franchised Business Ownership, 2007: Minority and Gender Groups
EXECUTIVE SUMMARY
PwC was engaged by the International Franchise Association Educational Foundation (IFA-EF)to review data from the U.S. Census Bureau's 2007 Survey of Business Owners ("SBO") todetermine the prevalence of minority and female ownership in franchised businesses in 2007.Statistics of interest include the percent of franchised businesses owned by minorities and
women, comparisons of minority and female ownership rates between franchised andnonfranchised businesses, and comparisons within business lines where franchises are mostprevalent. This report summarizes our findings and makes comparisons with results for 2002.1
The primary purpose of this report is to answer two related questions: First, "What percent of
franchised businesses are owned by a minority group member?" Second, "What percent of minority-owned businesses are franchised?"
This report answers these two questions by presenting information on (1) the percent of franchised businesses that are owned by each minority and gender group; and (2) the percent of
businesses owned by each minority and gender group that are franchised.
In addition to an overview across all business sectors, the report examines minority and femaleownership rates for the food services and drinking places industry sector (NAICS 722), whichaccounts for a significant number of franchises. This sector accounted for 17.3 percent of allfranchised businesses in 2007. An appendix to the report presents ownership information
based on the size of a business.
Minority and Gender Ownership Rates
"What percent of franchised businesses are owned by a minority group member?" "What percent of franchised businesses are owned by women?"
In 2007, there was a higher minority ownership rate among franchised businesses than innonfranchised businesses, 20.5 percent of franchises were owned by minorities, compared to14.2 percent of nonfranchised businesses (see Table 1).
Asians, Blacks, Pacific Islanders, and "other" minorities had a higher rate of ownership of franchises than nonfranchised businesses in 2007, while Hispanics and American Indians hadslightly higher ownership rates among nonfranchised businesses. Asians owned 10.4 percent of all franchises, compared to 4.9 percent of nonfranchised businesses. Blacks owned 4.9 percentof all franchised businesses compared to 3.6 percent of nonfranchised businesses. In contrast,5.2 percent of franchised businesses were owned by Hispanics, compared to 5.4 percent of nonfranchised businesses (see Table 2).
By gender, 20.5 percent of franchised businesses were female-owned compared to 25.7 percentof nonfranchised businesses in 2007. Franchised businesses were much more likely to be
1 2002 results were reported in PwC, Franchised Business Ownership: Minority and Gender Groups,September 5, 2007.
7/29/2019 Franchise Business Ownership By Minority and Gender Groups
http://slidepdf.com/reader/full/franchise-business-ownership-by-minority-and-gender-groups 14/44
Franchised Business Ownership, 2007: Minority and Gender Groups
E-2
equally male/female-owned than nonfranchised businesses – 24.4 percent compared to 18.2percent (see Table 3).
Overall, the minority ownership rate for franchised businesses increased by 1.2 percentage
points from 19.3 percent in 2002 to 20.5 percent in 2007, an increase in the ownership rate of 6.2 percent (see Table 4). Over the same period, the minority ownership rate amongnonfranchised businesses increased by one percentage point from 13.2 percent in 2002 to 14.2percent in 2007, an increase in the ownership rate of 7.6 percent.
Among franchised businesses, Asians and Blacks experienced the largest increase in ownershipshares among minority groups – 1.6 percentage points and 0.5 percentage points, respectively.Hispanics experienced the greatest decline in ownership share among franchises – 0.6percentage points (or 10.3 percent), from 5.8 percent in 2002 to 5.2 percent in 2007.
Female ownership among franchises declined by 4.5 percentage points from 25.0 percent in2002 to 20.5 percent in 2007, a decrease of 18.0 percent. However, over this same period, theshare of businesses that were equally male/female-owned increased by 7.3 percentage points
from 17.1 percent to 24.4 percent, an increase of 42.7 percent.
Franchised Business Operation Rates
"What percent of minority-owned and female-owned businesses are franchised?"
Overall, in 2007 a greater percent of minority-owned businesses were operated as franchises(3.0 percent) than nonminority-owned businesses (1.9 percent). By race, 5.1 percent of allPacific Islander-owned businesses, 4.5 percent of all Asian-owned businesses, and 2.9 percent of all Black-owned businesses were operated as franchises. In 2007, 2.0 percent of all Hispanic-owned businesses and 1.7 percent of female-owned businesses operated as franchises (seeTable 5).
The share of minority-owned businesses that operated as a franchise increased by 0.3percentage points from 2.7 percent in 2002 to 3.0 percent in 2007, an increase of 11.1 percent.By race, Pacific-Islander-owned businesses experienced the largest growth in franchisedownership over this period, from 3.0 percent to 5.1 percent (see Table 6).
Food Services and Drinking Places
Because the food services and drinking places industry (NAICS sector 722) accounts for asignificant number of franchised businesses, the analysis relating to minority and femaleownership and franchised business operation rates was also carried out for this sector.
Minority and Gender Ownership Rates in Food Services and Drinking Places
"What percent of franchised businesses in this sector are owned by a minority groupmember?" "What percent of franchised businesses in this sector are owned by women?"
Within the food services and drinking places industry, 21.5 percent of franchised businesses were owned by minorities in 2007, compared to 20.2 percent in 2002. By subsector, the percentof franchised businesses owned by minorities ranged from 19.0 percent in full-servicerestaurants (NAICS sector 7221) to 36.9 percent in special food services (NAICS sector 7223),
which includes catering and food service contractors (see Table 7). In limited-service

7/29/2019 Franchise Business Ownership By Minority and Gender Groups
http://slidepdf.com/reader/full/franchise-business-ownership-by-minority-and-gender-groups 15/44
Franchised Business Ownership, 2007: Minority and Gender Groups
E-3
restaurants (NAICS sector 7222) 21.2 percent of franchised businesses were owned by membersof a minority group in 2007.
By gender, females owned 12.5 percent of franchised businesses in the food services and
drinking places industry compared to 23.8 percent of nonfranchised businesses in this industry in 2007. By comparison, 13.2 percent of franchised businesses and 25.8 percent of nonfranchised businesses were owned by females in 2002.
By subsector female ownership of franchised businesses ranged from 10.6 percent in full-servicerestaurants to 24.6 percent in special food services (see Table 9) in 2007. In the limited-servicerestaurants subsector, 12.3 percent of franchised businesses were owned by females and 27.1percent were equally male/female-owned.
Franchise Business Operation Rates in Food Services and Drinking Places
"What percent of minority-owned and female-owned businesses in this sector are franchised?"
In 2007, within the food services and drinking places industry, 12.3 percent of minority-owned businesses were franchised, compared to a franchising rate of 15.2 percent for nonminority group owners (see Table 11). Within the limited-service restaurant subsector, which had thehighest percentage of businesses operated as a franchise in 2007, 24.0 percent of minority-owned businesses were operated as a franchise compared to a franchising rate of 36.1 percentfor businesses owned by a nonminority group member (see Table 12).
Overall, the share of minority-owned businesses that were operated as franchises increased by 2.5 percentage points from 9.8 percent in 2002 to 12.3 percent in 2007, an increase of 25.5percent (see Table 13).

7/29/2019 Franchise Business Ownership By Minority and Gender Groups
http://slidepdf.com/reader/full/franchise-business-ownership-by-minority-and-gender-groups 16/44
Franchised Business Ownership, 2007: Minority and Gender Groups
1
Franchised Business Ownership, 2007: Minority and Gender Groups
I. INTRODUCTION
The Survey of Business Owners ("SBO"), conducted every five years by the U.S. Census Bureau,provides comprehensive data on the economic and demographic characteristics of more than 27million U.S. businesses and their owners. Included are all businesses that filed 2007 tax formsas sole proprietorships, partnerships, or corporations and had annual business receipts greaterthan $1,000. In addition to information about the business, responding firms were asked toprovide information on the characteristics of up to four individuals with the largest ownershipshares, including the owners' gender, race, and ethnicity.
Beginning with the 2002 SBO, the survey questionnaire asked respondents to indicate whether
or not their business was operated as a franchise. A definition of a "franchise" was not providedon the questionnaire, so a respondent used his/her own understanding of franchises to answerthe question. The 2007 SBO provides information on the prevalence of franchising by kind of
business (all responding firms, firms with paid employees, and firms without paid employees)and by the owners’ gender, race, and ethnicity. The SBO data are also categorized by industry and by business size.
Section II of this report provides summary data from the 2007 SBO on the prevalence of minority and gender ownership among franchised businesses, and compares ownership rates forthese groups between franchised and nonfranchised businesses. The tabulations presented inthis section shed light on the question – "What percent of franchised businesses are owned by aminority group member?" Minority and gender ownership rates in 2002 and 2007 arecompared.
Section III examines businesses classified by minority and gender ownership and considers theprevalence of franchised businesses among these ownership groups. The tabulations presentedin this section shed light on the question -- "What percent of minority-owned businesses arefranchised?" The prevalence of franchised businesses by minority status, race, ethnicity, andgender in 2002 and 2007 are compared.
Section IV examines minority and female ownership and franchised business operation rates forthe food services and drinking places industry (NAICS Sector 722), which accounts for asignificant number of franchised businesses. This sector accounted for 17.3 percent of allfranchised businesses in 2007.
An appendix to the report presents ownership information based on business size.
Business Ownership
As stated in the SBO methodology report, business ownership is defined as having 51 percent ormore of the stock or equity in the business and is categorized by:
Gender: male; female; or equally male/female-owned Ethnicity: Hispanic or Latino Origin; or Not Hispanic or Latino Origin

7/29/2019 Franchise Business Ownership By Minority and Gender Groups
http://slidepdf.com/reader/full/franchise-business-ownership-by-minority-and-gender-groups 17/44
Franchised Business Ownership, 2007: Minority and Gender Groups
2
Race: White; Black or African American; American Indian or Alaska Native; Asian; orNative Hawaiian or Other Pacific Islander
Businesses could be tabulated in more than one racial group. This can result because:
a. the sole owner reported more than one race; b. the majority owner reported more than one race;c. a majority combination of owners reported more than one race.
To overcome the potential double counting that can occur, SBO defines a "minority-owned" business as one that is at least 51 percent owned by individuals who are either (1) from a racialgroup other than White or (2) are of Hispanic ethnicity. Conversely, a "nonminority-owned"
business is a business that is less than 50 percent owned by individuals who are White and arenot of Hispanic ethnicity. For the first time in 2007, SBO separately reported "equally minority-/nonminority-owned" businesses, those for which 50 percent of the equity or stock in the
business was owned by members of a racial group other than White or are of Hispanic ethnicity.For comparability with previous results, "equally minority-/nonminority-owned" businesses and
"nonminority-owned" businesses are combined in the tabulations reported below.2
2 Similarly, "equally Hispanic-/non-Hispanic-owned" firms are combined with "non-Hispanic-owned."

7/29/2019 Franchise Business Ownership By Minority and Gender Groups
http://slidepdf.com/reader/full/franchise-business-ownership-by-minority-and-gender-groups 18/44
Franchised Business Ownership, 2007: Minority and Gender Groups
3
II. Minority and Gender Ownership within Franchised and Non-Franchised Businesses
As described in the introduction, this section is designed to answer the question – "Whatpercent of franchised businesses are owned by a minority group member?"
Table 1 presents the percent of franchised businesses owned by minority and nonminority group members and provides a comparison of the ownership percentages between franchisedand nonfranchised businesses. In 2007, 20.5 percent of all franchises were minority-owned,
while 14.2 percent of nonfranchised businesses were minority-owned. Minority ownership washigher in franchises than nonfranchises for companies with and without paid employees.
Table 1. ─ Minority OwnershipFranchised and Nonfranchised Businesses, 2007
Business GroupMinority-
OwnedNot Minority
Owned
Firms with
Owners WhoseCharacteristics
areIndeterminate
All Responding Firms:
Franchised 20.5% 73.3% 6.2%
Nonfranchised 14.2% 80.6% 5.2%
Firms with Paid Employees:
Franchised 17.0% 73.4% 9.6%
Nonfranchised 11.3% 76.5% 12.2%
Firms without Paid Employees:
Franchised 24.7% 73.3% 2.0%
Nonfranchised 15.4% 82.3% 2.4%
Source: PwC calculations based on data from the 2007 Survey of Business Owners.Note: Rows may not sum to 100 percent due to rounding.
Table 2 presents the percent of franchised businesses owned by members of various minority groups. The franchised business ownership rates for non-White racial groups in 2007 rangedfrom three-tenths of one percent for Native Hawaiians and Other Pacific Islanders up to 10.4percent for Asians. With respect to ethnicity, 5.2 percent of all franchised businesses wereowned by Hispanics or Latinos.
Among minority groups, Asians have the largest difference in the ownership percentages between franchised and nonfranchised businesses – Asians owned 10.4 percent of franchised businesses compared to 4.9 percent of nonfranchised businesses in 2007.

7/29/2019 Franchise Business Ownership By Minority and Gender Groups
http://slidepdf.com/reader/full/franchise-business-ownership-by-minority-and-gender-groups 19/44
Franchised Business Ownership, 2007: Minority and Gender Groups
4
Table 2. ─ Ownership by Minority GroupFranchised and Nonfranchised Businesses, 2007
Business GroupHispanic-Owned
Asian-Owned
Black-Owned
AmericanIndian-
Owned(1)
PacificIslander-
Owned(2)
OtherMinority-
Owned
All Responding Firms:
Franchised 5.2% 10.4% 4.9% 0.5% 0.3% 0.5%
Nonfranchised 5.4% 4.9% 3.6% 0.6% 0.1% 0.3%
Firms with PaidEmployees:
Franchised 3.2% 11.5% 2.0% 0.3% 0.1% 0.5%
Nonfranchised 3.9% 5.7% 1.5% 0.4% 0.1% 0.2%
Firms without Paid
Employees:Franchised 7.6% 9.1% 8.5% 0.8% 0.5% 0.5%
Nonfranchised 6.1% 4.5% 4.5% 0.7% 0.1% 0.3%
Source: PwC calculations based on data from the 2007 Survey of Business Owners.Note: Numbers do not add to Minority-owned totals in Table 1 because a business can be counted inmore than one racial group.(1) Includes Alaskan Natives; (2) Includes Native Hawaiians.
Table 3 is similar to the Table 1, but it provides information on ownership by gender infranchised and nonfranchised businesses. In 2007, 20.5 percent of franchised businesses werefemale-owned compared to 25.7 percent of nonfranchised businesses. Franchised businesses
were much more likely to be equally male/female-owned than nonfranchised businesses (24.4
percent compared to 18.2 percent).

7/29/2019 Franchise Business Ownership By Minority and Gender Groups
http://slidepdf.com/reader/full/franchise-business-ownership-by-minority-and-gender-groups 20/44
Franchised Business Ownership, 2007: Minority and Gender Groups
5
Table 3. ─ Ownership by GenderFranchised and Nonfranchised Businesses, 2007
Business Group Male-Owned Female-OwnedEqually Male /Female-Owned
All Responding Firms:
Franchised 48.9% 20.5% 24.4%
Nonfranchised 51.0% 25.7% 18.2%
Firms with Paid Employees:
Franchised 50.3% 15.1% 24.9%
Nonfranchised 54.7% 15.2% 17.9%
Firms without Paid Employees:
Franchised 47.2% 27.1% 23.8%
Nonfranchised 49.5% 29.8% 18.3%Source: PwC calculations based on data from the 2007 Survey of Business Owners.Note: Gender group percentages do not add to 100 percent within a franchised or nonfranchised group
because businesses whose owners' characteristics are indeterminate are not shown.
Table 4 compares ownership percentages for franchised businesses in 2002 and 2007. Overall,the minority ownership rate for franchised businesses increased by 1.2 percentage points from19.3 percent in 2002 to 20.5 percent in 2007, an increase of 6.2 percent. By race, Asiansexperienced the largest increase in ownership share among franchises − from 8.9 percent in2002 to 10.4 percent in 2007, an increase of 1.5 percentage points or 16.9 percent. The share of franchised businesses owned by Hispanics declined by 0.6 percentage points from 5.8 percent in2002 to 5.2 percent in 2007, a decrease of 10.3 percent. The share of non-Hispanic owned
franchises also declined over the period, from 91.9 percent to 88.6 percent. The finding that both shares decreased is the result of an increase in the share of businesses whose owners'characteristics cannot be determined between 2002 and 2007.

7/29/2019 Franchise Business Ownership By Minority and Gender Groups
http://slidepdf.com/reader/full/franchise-business-ownership-by-minority-and-gender-groups 21/44
Franchised Business Ownership, 2007: Minority and Gender Groups
6
Table 4. ─ Minority, Ethnic, and Gender Ownership in Franchised Businesses, AllResponding Firms, 2002 and 2007
Business Group 2002 2007 Change
Minority Status:
Minority-Owned 19.3% 20.5% 1.2%
Not Minority-Owned 79.2% 73.3% -5.8%
Race:
Asian-Owned 8.9% 10.4% 1.5%
Black-Owned 4.4% 4.9% 0.5%
American Indian-Owned(1) 0.8% 0.5% -0.3%
Pacific Islander-Owned(2) 0.2% 0.3% 0.1%
Other Minority-Owned n.a. 0.5% n.a.
Ethnicity:
Hispanic-Owned 5.8% 5.2% -0.6%
Not Hispanic-Owned 91.9% 88.6% -3.3%
Gender:
Male-Owned 57.2% 48.9% -8.3%Female-Owned 25.0% 20.5% -4.5%Equally Male-/Female-Owned 17.1% 24.4% 7.3%
Firms with Owners whose Characteristics areIndeterminate
2.9% 6.2% 3.3%
Memo:
50% or More Female-Owned 42.1% 44.9% 2.8%
Source: PwC calculations based on data from the 2002 and 2007 Survey of Business Owners.Note: Ownership percentages with minority, ethnic, and gender groups do not add to 100 percent.(1) Includes Alaskan Natives; (2) Includes Native Hawaiians.
The share of franchises that were female-owned declined by 4.5 percentage points from 25.0percent in 2002 to 20.5 percent in 2007, a decrease of 18.0 percent. However, over the sameperiod, the share of franchised businesses that were equally male-/female-owned increased by 7.3 percentage points from 17.1 percent to 24.4 percent, an increase of 42.7 percent. Overall, thepercent of franchises that were at least 50 percent female-owned increased from 42.1 percent in2002 to 44.9 percent in 2007.
There was a 3.3 percentage point increase in the share of franchises whose owners'characteristics were indeterminate between 2002 and 2007.

7/29/2019 Franchise Business Ownership By Minority and Gender Groups
http://slidepdf.com/reader/full/franchise-business-ownership-by-minority-and-gender-groups 22/44
Franchised Business Ownership, 2007: Minority and Gender Groups
7
III. Franchised Businesses Among Minority and Gender Groups
The previous section examined the percent of franchised businesses that are owned by minority and gender group. This section alternatively asks the question "What percent of minority-owned businesses are franchised?"
In 2007, 3.0 percent of all minority-owned businesses were franchised, compared to 1.9 percentof businesses that were not minority-owned (see Table 5).
Table 5. ─ Percentage of Businesses in Franchised Form by Type of Owner, 2007
Business Group All FirmsFirms with
PaidEmployees
Firms without
PaidEmployees
All Responding Firms: 2.1% 4.0% 1.3%
Minority Status:
Minority-Owned 3.0% 6.0% 2.2%
Not Minority-Owned 1.9% 3.9% 1.2%
Race:
White-Owned 1.9% 3.8% 1.2%
Asian-Owned 4.5% 7.9% 2.7%
Black-Owned 2.9% 5.3% 2.5%
American Indian-Owned(1) 1.8% 3.7% 1.4%Pacific Islander-Owned(2) 5.1% 5.4% 5.0%
Other Minority-Owned 3.7% 8.5% 2.3%
Ethnicity:
Hispanic-Owned 2.0% 3.4% 1.7%
Not Hispanic-Owned 2.1% 4.2% 1.3%
Gender:
Male-Owned 2.0% 3.7% 1.3%
Female-Owned 1.7% 4.0% 1.2%
Equally Male-/Female-Owned 2.8% 5.6% 1.7%
Firms with Owners whose Characteristicsare Indeterminate
2.5% 3.2% 1.1%
Memo:
50% or More Female-Owned 2.2% 5.1% 1.4%
Source: PwC calculations based on data from the 2007 Survey of Business Owners.(1) Includes Alaskan Natives; (2) Includes Native Hawaiians.

7/29/2019 Franchise Business Ownership By Minority and Gender Groups
http://slidepdf.com/reader/full/franchise-business-ownership-by-minority-and-gender-groups 23/44
Franchised Business Ownership, 2007: Minority and Gender Groups
8
By race, franchising was most prevalent among Hawaiian- and Pacific Islander-owned businesses: 5.1 percent of all Hawaiian- and Pacific Islander-owned businesses were operated asfranchises in 2007, compared to 4.5 percent of Asian-owned businesses, 2.9 percent of Black-owned businesses, and 1.9 percent of White-owned businesses. In terms of ethnicity, there is
little difference in the prevalence of franchising among Hispanic-owned and Non-Hispanic-owned businesses (about 2.0 percent of businesses were operated as a franchise in each ethnicgroup).
There is also little difference in the rate of franchising between female-owned firms and male-owned firms, although a slightly higher percent of male-owned firms operated as franchises in2007 (2.0 percent of male-owned businesses versus 1.7 percent of female-owned businessesoperated as franchises). However, franchising was more prevalent in firms that were equally male/female-owned (2.8 percent of these businesses operated as franchises in 2007).
Results are also separately reported for businesses with paid employees and for businesses without paid employees.
Table 6 compares franchise ratios within minority, ethnic, and gender groups in 2002 and2007. Overall, the share of minority-owned firms that operated as a franchise increased by 0.3percentage points from 2.7 percent in 2002 to 3.0 percent in 2007, an increase of 12.6 percent.By race, Hawaiian- and Pacific Islander-owned firms experienced the greatest increase in thepercent operated as a franchise, from 3.0 percent in 2002 to 5.1 percent in 2007. The franchiseratio for both Asian-owned and Black-owned firms increased by 0.6 percentage points over thisperiod. By gender group, there was little change in the franchise ratio between 2002 and 2007.

7/29/2019 Franchise Business Ownership By Minority and Gender Groups
http://slidepdf.com/reader/full/franchise-business-ownership-by-minority-and-gender-groups 24/44
Franchised Business Ownership, 2007: Minority and Gender Groups
9
Table 6. ─ Percentage of Franchised Businesses within Minority, Ethnic, andGender Groups, All Firms, 2002 and 2007
Business Group 2002 2007 Change
All Responding Firms: 1.9% 2.1% 0.2%
Minority Status:
Minority-Owned 2.7% 3.0% 0.3%
Not Minority-Owned 1.8% 1.9% 0.1%
Race:
White-Owned 1.8% 1.9% 0.1%
Asian-Owned 3.9% 4.5% 0.6%
Black-Owned 2.3% 2.9% 0.6%
American Indian-Owned(1)
1.9% 1.8% -0.1%Pacific Islander-Owned(2) 3.0% 5.1% 2.1%
Other Minority-Owned n.a. 3.7% n.a.
Ethnicity:
Hispanic-Owned 2.1% 2.0% -0.1%
Not Hispanic-Owned 1.9% 2.1% 0.2%
Gender:
Male-Owned 1.9% 2.0% 0.1%
Female-Owned 1.7% 1.7% 0.0%
Equally Male-/Female-Owned 2.7% 2.8% 0.1%
Firms with Owners whose Characteristicsare Indeterminate
1.9% 2.5% 0.6%
Memo:
50% or More Female-Owned 2.0% 2.2% 0.2%
Source: PwC calculations based on data from the 2002 and 2007 Survey of Business Owners.(1) Includes Alaskan Natives; (2) Includes Native Hawaiians.

7/29/2019 Franchise Business Ownership By Minority and Gender Groups
http://slidepdf.com/reader/full/franchise-business-ownership-by-minority-and-gender-groups 25/44
Franchised Business Ownership, 2007: Minority and Gender Groups
10
IV. Food Services and Drinking Places
The previous sections of this report provided information on minority ownership in franchisedand nonfranchised businesses as well as the prevalence of franchising for minority and gendergroups for the economy as a whole. This section focuses on a particular industry sector – foodservices and drinking places, which accounts for a significant number of franchised businesses. 3
This sector accounted for 17.3 percent of all franchised businesses in 2007.
Minority and Gender Ownership within Franchised and Nonfranchised Businesses
To answer the question "What percent of franchised businesses in the food services and drinkingplaces industry are owned by a minority group member?", Table 7 presents the percent of franchised businesses in the food services and drinking places industry owned by minorities. In2007, 21.5 percent of franchised businesses in this sector were owned by minorities. By comparison, minorities owned 26.5 percent of the nonfranchised businesses in this industry.
The minority ownership rates for franchised businesses in the industry subsectors ranged from19.0 percent in full-service restaurants to 36.9 percent in special food services in 2007. In thelimited-service restaurants subsector, which has one of the highest concentrations of franchisesamong all businesses, the minority ownership rate for franchised businesses was 21.2 percent,compared to 32.8 percent for nonfranchised businesses.
In 2007, the minority ownership rate was higher among franchised businesses in the specialfood services (which includes catering and food service contractors, as well as mobile foodservices) and drinking places subsectors than that in the nonfranchised businesses of thesubsectors. The minority ownership rate was lower among franchised businesses in the full-service and limited-service restaurant sectors than that in the nonfranchised businesses of thesubsectors.
3 Industry code 722 in the 2002 North American Industry Classification System (NAICS). It includes (1)full-service restaurants, (2) limited-service eating places, (3) special food services, such as food servicecontractors, caterers, and mobile food services, and (4) drinking places, such as bars, taverns, nightclubs,and other places primarily engaged in preparing and serving alcoholic beverages for immediateconsumption.

7/29/2019 Franchise Business Ownership By Minority and Gender Groups
http://slidepdf.com/reader/full/franchise-business-ownership-by-minority-and-gender-groups 26/44
Franchised Business Ownership, 2007: Minority and Gender Groups
11
Table 7. ─ Minority Ownership in Food Services:Franchised and Nonfranchised Businesses, 2007
Business Group Minority-Owned Not Minority-Owned
Firms withOwners Whose
Characteristicsare
Indeterminate
Food Service and Drinking Places:
Franchised 21.5% 68.7% 9.8%
Nonfranchised 26.5% 66.5% 6.9%
Subsectors:
Full-Service Restaurants:
Franchised 19.0% 69.2% 11.8%
Nonfranchised 29.7% 62.0% 8.3%
Limited-Service Restaurants:
Franchised 21.2% 69.3% 9.5%
Nonfranchised 32.8% 59.8% 7.4%
Special Food Services:
Franchised 36.9% 61.1% 2.0%
Nonfranchised 22.1% 75.4% 2.5%
Drinking Places:
Franchised 24.8% 36.1% 39.2%Nonfranchised 9.9% 81.1% 9.0%
Source: PwC calculations based on special tabulations of data from the 2007 Survey of Business Owners.Note: Rows may not add to 100 percent due to rounding.
Table 8 presents the percent of franchised businesses in the food services and drinking placesindustry owned by members of various minority groups. For the industry as a whole, thepercentage of nonfranchised businesses owned by members of each minority group, with theexception of the "other minority" group, was higher than the percentage of franchised
businesses owned by members of a minority group. Within the subsectors, however, someexceptions occur. For example, among full-service restaurants Blacks owned a greater share of franchised businesses than nonfranchised businesses. Similarly, Blacks and Asians owned agreater share of franchised drinking places than nonfranchised drinking places.
Overall, in the food services and drinking places industry, 15.6 percent of franchised businesses were owned by Asians, 3.5 percent were owned by Hispanics, and 2.0 percent were owned by Blacks.

7/29/2019 Franchise Business Ownership By Minority and Gender Groups
http://slidepdf.com/reader/full/franchise-business-ownership-by-minority-and-gender-groups 27/44
Franchised Business Ownership, 2007: Minority and Gender Groups
12
Table 8. ─ Ownership by Minority Groups in Food Services:Franchised and Nonfranchised Businesses, 2007
Business GroupHispanic-Owned
Asian-Owned
Black-Owned
AmericanIndian-
Owned(1)
PacificIslander-
Owned(2)
OtherMinority-
Owned
Food Service andDrinking Places:
Franchised 3.5% 15.6% 2.0% 0.4% w 0.8%
Nonfranchised 7.9% 15.7% 3.1% 0.5% w 0.4%
Subsectors:
Full-ServiceRestaurants:
Franchised 4.6% 12.2% 2.2% 0.3% w 0.1%
Nonfranchised 9.8% 19.0% 1.4% 0.4% w 0.4%
Limited-ServiceRestaurants:
Franchised 3.1% 15.8% 1.8% 0.4% w 0.9%
Nonfranchised 7.1% 23.9% 2.0% 0.5% w 0.3%
Special Food Services:
Franchised w 28.9% 2.7% w w w
Nonfranchised w w 7.8% w w w
Drinking Places:
Franchised 12.4% 5.6% 7.0% 0.0% w w Nonfranchised 4.6% 2.2% 3.1% w w w
Source: PwC calculations based on special tabulations of data from the 2007 Survey of Business Owners.Note: Numbers do not add to Minority-owned totals in Table 1 because a business can be counted inmore than one racial group. "w" indicates data withheld by the Census Bureau to avoid disclosing privateinformation.(1) Includes Alaskan Natives; (2) Includes Native Hawaiians.
Table 9 provides information on ownership by gender in franchised and nonfranchised foodservices and drinking places. As with other business sectors (see Table 3), female ownership of franchised businesses was lower than that of nonfranchised businesses in the food services anddrinking places sector. However, a great percentage of the franchised food services and drinkingplaces were equally male/female-owned than that of nonfranchised businesses in the sector.
Overall, in 2007, 12.5 percent of franchised businesses in the food service and drinking placessector were owned by females. Another 25.7 percent of the franchised businesses in the sector
were equally male/female-owned.

7/29/2019 Franchise Business Ownership By Minority and Gender Groups
http://slidepdf.com/reader/full/franchise-business-ownership-by-minority-and-gender-groups 28/44
Franchised Business Ownership, 2007: Minority and Gender Groups
13
Table 9. ─ Ownership by Gender in Food Services:Franchised and Nonfranchised Businesses, 2007
Business Group Male-Owned Female-OwnedEqually Male /Female-Owned
Food Service and Drinking Places:
Franchised 51.9% 12.5% 25.7%
Nonfranchised 44.5% 23.8% 24.8%
Subsectors:
Full-Service Restaurants:
Franchised 56.6% 10.6% 21.0%
Nonfranchised 46.9% 20.0% 24.8%
Limited-Service Restaurants:
Franchised 51.1% 12.3% 27.1%
Nonfranchised 44.1% 20.7% 27.9%
Special Food Services:
Franchised 51.1% 24.6% 22.3%
Nonfranchised 37.3% 36.4% 23.7%
Drinking Places:
Franchised 43.7% 14.1% 3.1%
Nonfranchised 49.5% 22.1% 19.4%
Source: PwC calculations based on special tabulations of data from the 2007 Survey of Business Owners.
Note: Gender group percentages do not add to 100 percent within a franchised or nonfranchised group because businesses whose owners' characteristics are indeterminate are not shown.
As shown in Table 10, the share of franchised food services and drinking places owned by members of a minority group increased by 1.3 percentage points from 20.2 percent in 2002 to21.5 percent in 2007, an increase of 6.4 percent. By racial group, the largest increase inownership share was among Asian-owned businesses. The share of franchised businesses in thefood services industry that were owned by Asians increased by 2.1 percentage points from 13.5percent in 2002 to 15.6 percent in 2007, an increase of 15.6 percent. The share of franchisedfood services businesses that were female-owned fell from 13.2 percent in 2002 to 12.5 percentin 2007, a decline of 0.7 percentage points or 5.3 percent. The share of franchised food services
businesses that were equally male-/female-owned increased from 20.3 percent in 2002 to 25.7
percent in 2007, an increase of 5.4 percentage points or 26.6 percent.

7/29/2019 Franchise Business Ownership By Minority and Gender Groups
http://slidepdf.com/reader/full/franchise-business-ownership-by-minority-and-gender-groups 29/44
Franchised Business Ownership, 2007: Minority and Gender Groups
14
Table 10. ─ Minority, Ethnic, and Female Ownership in Food Services:Franchised and Nonfranchised Businesses, 2002 and 2007
Business Group 2002 2007 Change
All Minority-Owned:Franchised 20.2% 21.5% 1.3%
Nonfranchised 24.6% 26.5% 1.9%
Hispanic-Owned:
Franchised 3.8% 3.5% -0.3%
Nonfranchised 7.2% 7.9% 0.7%
Asian-Owned:
Franchised 13.5% 15.6% 2.1%
Nonfranchised 14.3% 15.7% 1.3%
Black-Owned:
Franchised 2.5% 2.0% -0.5%
Nonfranchised 3.1% 3.1% -0.1%
Other Minority-Owned1:
Franchised 0.6% w n.a.
Nonfranchised 0.5% w n.a.
Female-Owned:
Franchised 13.2% 12.5% -0.7%
Nonfranchised 25.8% 23.8% -2.1%
Equally Male-/Female-Owned:
Franchised 20.3% 25.7% 5.4%
Nonfranchised 19.8% 24.8% 5.0%
Source: PwC calculations based on special tabulations of data from the 2002 and 2007 Survey of Business Owners.Note: "n.a." indicates data not available or cannot be calculated. "w" indicates data withheld by theCensus Bureau to avoid disclosing private information.(1) Includes Alaskan Natives; (2) Includes Native Hawaiians.
Franchised Businesses amongMinority and Gender Groups
To answer the question "What percent of minority-owned businesses in the food services anddrinking places industry are franchised?", Table 11 presents the percent of franchised
businesses within various minority and gender groups for the food services and drinking placesindustry for all responding firms. In 2007, 12.3 percent of all minority-owned businesses in theindustry were franchised, compared to 15.2 percent of businesses in the industry that were notminority-owned. By gender, 8.4 percent of female-owned businesses in this sector werefranchised, compared to 16.8 percent of male-owned businesses and 15.2 percent of equally

7/29/2019 Franchise Business Ownership By Minority and Gender Groups
http://slidepdf.com/reader/full/franchise-business-ownership-by-minority-and-gender-groups 30/44
Franchised Business Ownership, 2007: Minority and Gender Groups
15
male/female-owned businesses. In 2007, 7.1 percent of Hispanic-owned businesses wereoperated as a franchise.
Table 11. ─ Percentage of Businesses in Franchised Form by Type of Owner:Food Services and Drinking Places Industry, 2007
Business GroupFood Servicesand Drinking
Places
All Responding Firms: 14.8%
Minority Status:
Minority-Owned 12.3%
Not Minority-Owned 15.2%
Race: White-Owned 14.3%
Asian-Owned 14.7%
Black-Owned 10.1%
American Indian-Owned(1) 11.2%
Pacific Islander-Owned(2) w
Other Minority-Owned 27.1%
Ethnicity:
Hispanic-Owned 7.1%
Not Hispanic-Owned 15.0%
Gender:
Male-Owned 16.8%
Female-Owned 8.4%
Equally Male-/Female-Owned 15.2%
Firms with Owners whose Characteristicsare Indeterminate
19.7%
Source: PwC calculations based on special tabulations of data from the2007 Survey of Business Owners.Note: "w" indicates data withheld by the Census Bureau to avoid disclosingprivate information.
(1)
Includes Alaskan Natives;(2)
Includes Native Hawaiians.
Table 12 provides additional detail by subsector for the food services and drinking placesindustry. Among the subsectors, the limited-service restaurant subsector has the highestpercentage of franchised businesses. In this subsector, 24.0 percent of minority-owned
businesses are franchised, compared to 36.1 percent of nonminority-owned businesses in 2007.17.9 percent of Hispanic-owned limited-service restaurants were franchised. By gender, 22.5percent of female-owned businesses in this subsector were franchised, compared to 36.2 percentof male-owned businesses and 32.2 percent of equally male/female-owned businesses.

7/29/2019 Franchise Business Ownership By Minority and Gender Groups
http://slidepdf.com/reader/full/franchise-business-ownership-by-minority-and-gender-groups 31/44
Franchised Business Ownership, 2007: Minority and Gender Groups
16
Table 12. ─ Percentage of Businesses in Franchised Form by Type of Owner:Food Services and Drinking Places Subsectors, 2007
Business GroupFull-Service
Restaurants
Limited-Service
Restaurants
SpecialFood
Services
Drinking
Places
All Responding Firms: 6.8% 32.8% 3.2% 0.9%
Minority Status:
Minority-Owned 4.4% 24.0% 5.3% 2.2%
Not Minority-Owned 7.5% 36.1% 2.6% 0.4%
Race:
White-Owned 7.0% 34.4% 2.6% 0.5%
Asian-Owned 4.5% 24.4% w 2.2%
Black-Owned 10.4% 30.7% 1.1% 2.0% American Indian-Owned(1) 5.5% 26.8% w w
Pacific Islander-Owned(2) w w w w
Other Minority-Owned 1.4% 62.3% w w
Ethnicity:
Hispanic-Owned 3.3% 17.9% w 2.3%
Not Hispanic-Owned 6.9% 33.3% w 0.5%
Gender:
Male-Owned 8.1% 36.2% 4.4% 0.8%
Female-Owned 3.7% 22.5% 2.2% 0.6%Equally Male-/Female-Owned 5.8% 32.2% 3.1% 0.1%
Firms with Owners whoseCharacteristics areIndeterminate
9.4% 38.7% 2.6% 3.7%
Source: PwC calculations based on special tabulations of data from the 2007 Survey of Business Owners.Note: "w" indicates data withheld by the Census Bureau to avoid disclosing private information.(1) Includes Alaskan Natives; (2) Includes Native Hawaiians.
Table 13 shows the change in the percent of franchised businesses within various minority andgender groups for the food services and drinking places industry for all responding firms
between 2002 and 2007. Overall, the percentage of minority-owned businesses operated asfranchises in the food service industry increased by 2.5 percentage points from 9.8 percent in2002 to 12.3 percent in 2007, an increase of 25.5 percent. The greatest increase occurredamong Asian-owned businesses. The share of Asian-owned food service businesses operated asfranchises increased from 11.2 percent in 2002 to 14.7 percent in 2007, an increase of 3.5percentage points or 31.3 percent.
The share of female-owned businesses in the sector which were operated as franchises increasedfrom 6.4 percent in 2002 to 8.4 percent in 2007, while the share of equally male/female-owned

7/29/2019 Franchise Business Ownership By Minority and Gender Groups
http://slidepdf.com/reader/full/franchise-business-ownership-by-minority-and-gender-groups 32/44
Franchised Business Ownership, 2007: Minority and Gender Groups
17
businesses operated as franchises increased by 3.0 percentage points, from 12.2 percent to 15.2percent.
Table 13. ─ Percentage of Businesses in Franchised Form by Type of Owner:
Food Services and Drinking Places Industry, 2002 and 2007
Business Group 2002 2007 Change
All Responding Firms: 11.8% 14.8% 3.0%
Minority Status:
Minority-Owned 9.8% 12.3% 2.5%
Not Minority-Owned 12.4% 15.2% 2.8%
Race:
White-Owned 11.8% 14.3% 2.5% Asian-Owned 11.2% 14.7% 3.5%
Black-Owned 9.5% 10.1% 0.6%
American Indian-Owned(1) 15.1% 11.2% -3.9%
Pacific Islander-Owned(2) 8.3% w n.a.
Other Minority-Owned n.a. 27.1% n.a.
Ethnicity:
Hispanic-Owned 6.4% 7.1% 0.7%
Not Hispanic-Owned 12.1% 15.0% 2.9%
Gender:Male-Owned 14.0% 16.8% 2.8%
Female-Owned 6.4% 8.4% 2.0%
Equally Male-/Female-Owned 12.2% 15.2% 3.0%
Firms with Owners whoseCharacteristics are Indeterminate
13.3% 19.7% 6.4%
Source: PwC calculations based on special tabulations of data from the 2002 and 2007 Survey of Business Owners.Note: "n.a." indicates data not available or cannot be calculated. "w" indicates data withheld by theCensus Bureau to avoid disclosing private information.(1) Includes Alaskan Natives; (2) Includes Native Hawaiians.

7/29/2019 Franchise Business Ownership By Minority and Gender Groups
http://slidepdf.com/reader/full/franchise-business-ownership-by-minority-and-gender-groups 33/44
Franchised Business Ownership, 2007: Minority and Gender Groups
18
APPENDIX – Size of Business Comparisons
This appendix provides detail on racial, ethnic, and gender group ownership rates andfranchised business operation rates by the size of business. Business size is measured in two
ways: (1) by the size of annual receipts reported, and (2) by the number of employees.
A. Race, Ethnicity, and Gender Ownership within Franchised and Nonfranchised Businesses: By Size of Business Receipts
Table 14 provides comparisons of racial, ethnic, and gender ownership rates for franchised andnonfranchised businesses by receipt size. This table answers questions such as "What percent of franchised businesses of a given receipt size are owned by a minority group member?"
To simplify the amount of information presented, the table does not show all possible racial,
ethnic, and gender groups. Instead, the table reports the percent of Nonwhite-owned firms,Hispanic-owned firms and female-owned firms in each receipt size class for franchised andnonfranchised firms.4 The table is also limited to businesses with paid employees.
As shown in Table 14, the percentage of Nonwhite-owned businesses was greater in franchisedthan in nonfranchised businesses across all receipt size classes in 2007. To some extent, thehigher Nonwhite ownership percentages of franchised businesses are driven by the higherownership rates of franchises by Asians identified in Table 2. There is no apparent trend in thedifferences between franchised and nonfranchised businesses for Hispanic or female ownersacross receipt size.
Graphical representations of the data in Table 14 are provided in Figure 1, Figure 2, andFigure 3 for Nonwhite owners, Hispanic owners, and female owners, respectively. As shown in
Figure 1, Nonwhite ownership declines for both franchised and nonfranchised businesses as thereceipt size of the business exceeds $500,000. As shown in Figure 2 and Figure 3, there is amore pronounced downward trend in Hispanic ownership and female ownership beginning atabout $50,000 in receipts for both franchised and nonfranchised businesses.
4 To calculate the percent of Nonwhite-owned businesses, the White-owned and the indeterminate-group-owned percentages were subtracted from 100 percent. This may understate the percentage of Nonwhite-owned firms because a business could be counted within the White group and any of the other racialgroups.

7/29/2019 Franchise Business Ownership By Minority and Gender Groups
http://slidepdf.com/reader/full/franchise-business-ownership-by-minority-and-gender-groups 34/44
Franchised Business Ownership, 2007: Minority and Gender Groups
19
Table 14. ─ Racial, Ethnic, and Gender Ownership by Receipt Size,Businesses with Paid Employees, 2007
Business Group by Receipt Size
Nonwhite-Owned(1)Hispanic or
Latino-OwnedFemale-Owned
Less than $5,000
Franchised 9.4% 5.4% 19.1%
Nonfranchised 5.3% 2.1% 11.8%
$5,000 to $9,999
Franchised 12.5% 6.9% 27.0%
Nonfranchised 9.3% 5.4% 25.5%
$10,000 to $24,999
Franchised 12.0% 4.6% 21.2%
Nonfranchised 8.6% 5.0% 24.0%
$25,000 to $49,999
Franchised 17.2% 4.1% 24.0%
Nonfranchised 8.9% 4.4% 23.7%
$50,000 to $99,999
Franchised 13.4% 5.0% 24.9%
Nonfranchised 8.9% 4.6% 22.1%
$100,000 to $249,999
Franchised 17.1% 3.9% 22.7%Nonfranchised 9.2% 4.4% 18.2%
$250,000 to $499,999
Franchised 17.5% 3.4% 16.9%
Nonfranchised 8.9% 4.1% 14.9%
$500,000 to $999,999
Franchised 16.6% 3.2% 12.4%
Nonfranchised 7.9% 3.8% 12.3%
$1,000,000 or more
Franchised 11.9% 2.1% 8.9%Nonfranchised 5.8% 2.9% 9.3%
All Firms
Franchised 14.9% 3.2% 15.1%
Nonfranchised 7.9% 3.9% 15.2%
Source: PwC calculations based on data from the 2007 Survey of Business Owners.(1) Counts of nonwhite-owned businesses derived by subtracting white-owned businesses from all
businesses which were classifiable by race, ethnicity, and gender.

7/29/2019 Franchise Business Ownership By Minority and Gender Groups
http://slidepdf.com/reader/full/franchise-business-ownership-by-minority-and-gender-groups 35/44
Franchised Business Ownership, 2007: Minority and Gender Groups
20
Figure 1. ─ Nonwhite Ownership Percentage by Receipt Size,Businesses with Paid Employees, 2007
Figure 2. ─ Hispanic Ownership Percentage by Receipt Size,Businesses with Paid Employees, 2007
Franchised
Nonfranchised
0.0%
5.0%
10.0%
15.0%
20.0%
N o n w h i t e O w n e d
Receipt Size
Franchised
Nonfranchised
1.0%
2.0%
3.0%
4.0%
5.0%
6.0%
7.0%
8.0%
H i s p a n i c O w n e d
Receipt Size

7/29/2019 Franchise Business Ownership By Minority and Gender Groups
http://slidepdf.com/reader/full/franchise-business-ownership-by-minority-and-gender-groups 36/44
Franchised Business Ownership, 2007: Minority and Gender Groups
21
Figure 3. ─ Female Ownership Percentage by Receipt Size,Businesses with Paid Employees, 2007
Table 15 is similar to Table 14 except that it uses employment size to compare the ownershiprates of franchised and nonfranchised businesses with paid employees. As was the case withreceipt size classes, the percent of Nonwhite-owned businesses was greater in franchised than innonfranchised businesses across all employment size classes in 2007. In general, the Nonwhite,Hispanic, and female ownership percentages decrease as the employment size of a businessincreases. This holds true for both franchised and nonfranchised businesses.
Franchised
Nonfranchised
5.0%
10.0%
15.0%
20.0%
25.0%
30.0%
F e m a l e O w n e d
Receipt Size

7/29/2019 Franchise Business Ownership By Minority and Gender Groups
http://slidepdf.com/reader/full/franchise-business-ownership-by-minority-and-gender-groups 37/44
Franchised Business Ownership, 2007: Minority and Gender Groups
22
Table 15. ─ Racial, Ethnic, and Gender Ownership by Employment Size,Businesses with Paid Employees, 2007
Business Group by Employment Size
Nonwhite-Owned(1)
Hispanic orLatino-Owned
Female-Owned
Firms with noemployees
Franchised 16.2% 3.6% 16.2%Nonfranchised 9.2% 4.6% 17.7%
1 t o 4
Franchised 15.8% 4.8% 19.4%Nonfranchised 8.8% 4.1% 16.8%
5 to 9
Franchised 18.4% 3.2% 16.6%Nonfranchised 7.9% 3.7% 14.2%
10 to 19
Franchised 16.9% 2.4% 14.1%Nonfranchised 6.2% 3.6% 12.8%
20 to 49
Franchised 10.7% 2.0% 10.9%
Nonfranchised 5.2% 2.9% 10.7%
50 to 99Franchised 7.4% 1.7% 8.5%Nonfranchised 4.2% 1.9% 8.5%
100 to 499
Franchised 7.3% 1.8% 8.3%Nonfranchised 2.6% 1.7% 7.1%
500 or more
Franchised 5.1% 2.2% 5.3%Nonfranchised 1.1% 0.9% 3.8%
All Firms
Franchised 14.9% 3.2% 15.1%Nonfranchised 7.9% 3.9% 15.2%
Source: PwC calculations based on data from the 2007 Survey of Business Owners.(1) Counts of nonwhite-owned businesses derived by subtracting white-owned businesses from all
businesses which were classifiable by race, ethnicity, and gender.

7/29/2019 Franchise Business Ownership By Minority and Gender Groups
http://slidepdf.com/reader/full/franchise-business-ownership-by-minority-and-gender-groups 38/44
Franchised Business Ownership, 2007: Minority and Gender Groups
23
B. Franchised Businesses Among Minority and Gender Groups: By Size of Business Receipts
Table 16 shows the percent of businesses with paid employees that operated as franchises
within racial, ethnic, and gender groups by receipt size classes. This table answers questionssuch as "What percent of Nonwhite-owned businesses of a given receipt size are franchised?"Figure 4 is a graphical representation of these data.
In general, the percent of franchised business grows as the receipt size of the business grows.This trend is most pronounced for the Nonwhite racial group – of Nonwhite-owned businesses
with annual receipts between $5,000 and $250,000 and with paid employees, 3.1 percent to 5.5percent were operated as a franchise in 2007, while approximately 10.3 percent of Nonwhite-owned businesses with paid employees and annual receipts of $1,000,000 or more operated as afranchise.
Table 16. ─ Percentage of Businesses in Franchised Form by Receipt Size,
Businesses with Paid Employees, 2007
Receipt SizeNonwhite-
Owned(1)
Hispanic orLatino-Owned
Female-Owned
All Owners
Less than $5,000 6.3% 8.9% 5.8% 3.6%
$5,000 to $9,999 3.1% 3.0% 2.5% 2.3%
$10,000 to $24,999 3.6% 2.4% 2.3% 2.6%
$25,000 to $49,999 4.7% 2.4% 2.5% 2.5%
$50,000 to $99,999 3.9% 2.8% 2.9% 2.6%
$100,000 to $249,999 5.5% 2.7% 3.7% 3.0%
$250,000 to $499,999 8.0% 3.6% 4.8% 4.3%
$500,000 to $999,999 9.7% 4.2% 4.9% 4.8%
$1,000,000 or more 10.3% 4.0% 5.1% 5.3%
Source: PwC calculations based on data from the 2007 Survey of Business Owners.(1) Counts of nonwhite-owned businesses derived by subtracting white-owned businesses from all
businesses which were classifiable by race, ethnicity, and gender.
Table 17 reports the percent of businesses that operates as a franchise for different racialgroups by receipt size class, providing some additional detail on the Nonwhite franchised
business ownership rates reported in Table 16. Similar to Table 16, this table answers questionssuch as "What percent of businesses owned by a specific racial group and of a given receipt sizeare franchised?"

7/29/2019 Franchise Business Ownership By Minority and Gender Groups
http://slidepdf.com/reader/full/franchise-business-ownership-by-minority-and-gender-groups 39/44
Franchised Business Ownership, 2007: Minority and Gender Groups
24
Figure 4. ─ Percentage of Businesses in Franchised Form by Receipt Size,Businesses with Paid Employees, 2007
Table 17. ─ Percentage of Businesses in Franchised Form by Receipt Size,Nonwhite-Owned Businesses with Paid Employees, 2007
Receipt SizeAsian-Owned
Black-Owned
AmericanIndian-
Owned(1)
PacificIslander-Owned(2)
OtherRacial
Groups
Less than $5,000 6.5% 6.7% 12.4% 3.1% 11.5%
$5,000 to $9,999 3.6% 2.5% 1.0% 0.0% 0.0%
$10,000 to $24,999 3.6% 4.2% 0.0% 0.0% 12.4%
$25,000 to $49,999 4.3% 5.6% 3.5% 2.5% 1.2%
$50,000 to $99,999 3.8% 3.1% 1.6% 9.6% 6.1%
$100,000 to $249,999 5.5% 4.6% 4.1% 4.6% 8.7%
$250,000 to $499,999 8.5% 6.0% 3.0% 8.4% 8.4%
$500,000 to $999,999 10.8% 4.9% 5.9% 3.8% 7.5%
$1,000,000 or more 11.1% 8.6% 4.2% 4.9% 12.3%
Source: PwC calculations based on data from the 2007 Survey of Business Owners.(1) Includes Alaskan Natives; (2) Includes Native Hawaiians.
0.0%
2.0%
4.0%
6.0%
8.0%
10.0%
12.0%
P e r c e n t a g e o f F r a n c h i s e d
B u e s i n e s s e s
Receipt Size
Nonwhite-Owned
All Owners
Female-Owned
Hispanic-Owned

7/29/2019 Franchise Business Ownership By Minority and Gender Groups
http://slidepdf.com/reader/full/franchise-business-ownership-by-minority-and-gender-groups 40/44
Franchised Business Ownership, 2007: Minority and Gender Groups
25
Comparisons of the racial group ownership percentages in Table 17 with the consolidatedNonwhite ownership group percentages from Table 16 show that the franchise percentages forthe Asian-owned group are close to the Nonwhite-owned percentages, while the Black-ownedgroup has generally smaller franchise percentages for receipt size classes of $50,000 and above.
For the receipts size class of $1 million or more, the "Other" racial group has the largestfranchise operation percentage. Overall, the franchise percentages for the Nonwhite-ownedgroup appear to be influenced by the number of Asian owners who operate franchised
businesses.
Table 18 shows the percent of businesses operated as a franchise within racial, ethnic, andgender groups by employment size classes. This table answers questions such as "What percentof Nonwhite-owned businesses of a given employment size are franchised?" Figure 5 is agraphical representation of these data.
In 2007, there was a generally increasing trend in the percent of franchised business as theemployment size increases up to the "100 to 499" employee class and then it generally decreasesfor the "500 or more" employee class. The highest percentage of franchised businesses occurred
for Nonwhite-owned businesses with 100 to 499 employees (20.6 percent). Female-owned businesses with 100 to 499 employees had 9.6 percent of businesses operated as a franchise. Incontrast, for Hispanic-owned businesses, the highest percentage of franchised businessesoccurred in firms with 500 or more employees (10.6 percent).
Table 18. ─ Percentage of Businesses in Franchised Form by Employment Size,Businesses with Paid Employees, 2007
Employment SizeNonwhite-
Owned(1)
Hispanic orLatino-Owned
Female-Owned
All Owners
Firms with no employees 6.1% 2.8% 3.3% 3.5%
1 to 4 3.9% 2.6% 2.6% 2.2%
5 to 9 9.5% 3.8% 5.0% 4.3%
10 to 19 16.4% 4.6% 7.3% 6.7%
20 to 49 17.8% 6.6% 9.6% 9.5%
50 to 99 16.2% 8.8% 9.7% 9.7%
100 to 499 20.6% 8.5% 9.6% 8.4%
500 or more 17.9% 10.6% 6.3% 4.6%
Source: PwC calculations based on data from the 2007 Survey of Business Owners.(1) Counts of nonwhite-owned businesses derived by subtracting white-owned businesses from all
businesses which were classifiable by race, ethnicity, and gender.

7/29/2019 Franchise Business Ownership By Minority and Gender Groups
http://slidepdf.com/reader/full/franchise-business-ownership-by-minority-and-gender-groups 41/44
Franchised Business Ownership, 2007: Minority and Gender Groups
26
Figure 5. ─ Percentage of Businesses in Franchised Form by Employment Size,Businesses with Paid Employees, 2007
Table 19 shows the percent of businesses operated as franchises within Nonwhite racial groups by employment size classes. Similar to Table 18, this table answers questions such as "Whatpercent of Asian-owned businesses of a given employment size are franchised?"
In general, the franchise percentages for the Asian-owned group are slightly higher than theNonwhite percentages shown in Table 18 for all but the highest employment size class. For thelargest employment size class, the Nonwhite franchise percentages appear to be influenced by arelatively large franchise operation percentage among Black owners.
0.0%
5.0%
10.0%
15.0%
20.0%
25.0%
P e r c e n t a g e o f F r a n c h i s e d
B u s i n e s s e s
Employment Size
Nonwhite-Owned
All Owners
Female-Owned
Hispanic-Owned

7/29/2019 Franchise Business Ownership By Minority and Gender Groups
http://slidepdf.com/reader/full/franchise-business-ownership-by-minority-and-gender-groups 42/44
Franchised Business Ownership, 2007: Minority and Gender Groups
27
Table 19. ─ Percentage of Businesses in Franchised Form by Employment Size,Nonwhite-Owned Businesses with Paid Employees, 2007
Employment SizeAsian-
Owned
Black-
Owned
AmericanIndian-
Owned(1)
PacificIslander-
Owned(2)
OtherRacial
Groups
Firms with noemployees
6.5% 5.1% 3.7% 0.3% 6.9%
1 to 4 3.9% 3.6% 2.4% 3.8% 4.0%
5 to 9 10.7% 5.8% 2.5% 9.4% 15.6%
10 to 19 19.0% 7.1% 8.0% 8.3% 22.1%
20 to 49 19.7% 13.1% 11.2% 4.5% 12.1%
50 to 99 17.1% 16.7% 8.9% 25.0% 38.0%
100 to 499 20.8% 19.8% 4.1% 3.8% 5.5%
500 or more 14.0% 25.4% 16.7% 0.0% 0.0%
Source: PwC calculations based on data from the 2007 Survey of Business Owners.(1) Includes Alaskan Natives; (2) Includes Native Hawaiians.

7/29/2019 Franchise Business Ownership By Minority and Gender Groups
http://slidepdf.com/reader/full/franchise-business-ownership-by-minority-and-gender-groups 43/44

7/29/2019 Franchise Business Ownership By Minority and Gender Groups
http://slidepdf.com/reader/full/franchise-business-ownership-by-minority-and-gender-groups 44/44
International Franchise Association1501 K Street, NW, Suite 350Washington, DC 20005(202) 662-8000www.franchise.org