franklin park, illinois comprehensive annual financial report
TRANSCRIPT

Franklin Park, Illinois
Comprehensive Annual Financial ReportFOR THE FISCAL YEAR ENDED APRIL 30, 2012

Franklin Park, IL
Prepared by
Christi JacobsonSuperintendent of Finance and Technology
Compiled Under the Direction of
Joseph D. ModrichDirector of Parks and Recreation
Board of CommissionersMark K. Cwik
Susan E. O’ConnellMichael A. Vonesh
Mark K. WhiteJoseph E. Zinga
Comprehensive Annual Financial Report FOR THE FISCAL YEAR ENDED APRIL 30,2012

PARK DISTRICT OF FRANKLIN PARK
FRANKLIN PARK, ILLINOIS
TABLE OF CONTENTS
Page(s)
INTRODUCTORY SECTION
Officers and Officials .................................................................................................. i
Organization Chart ...................................................................................................... ii
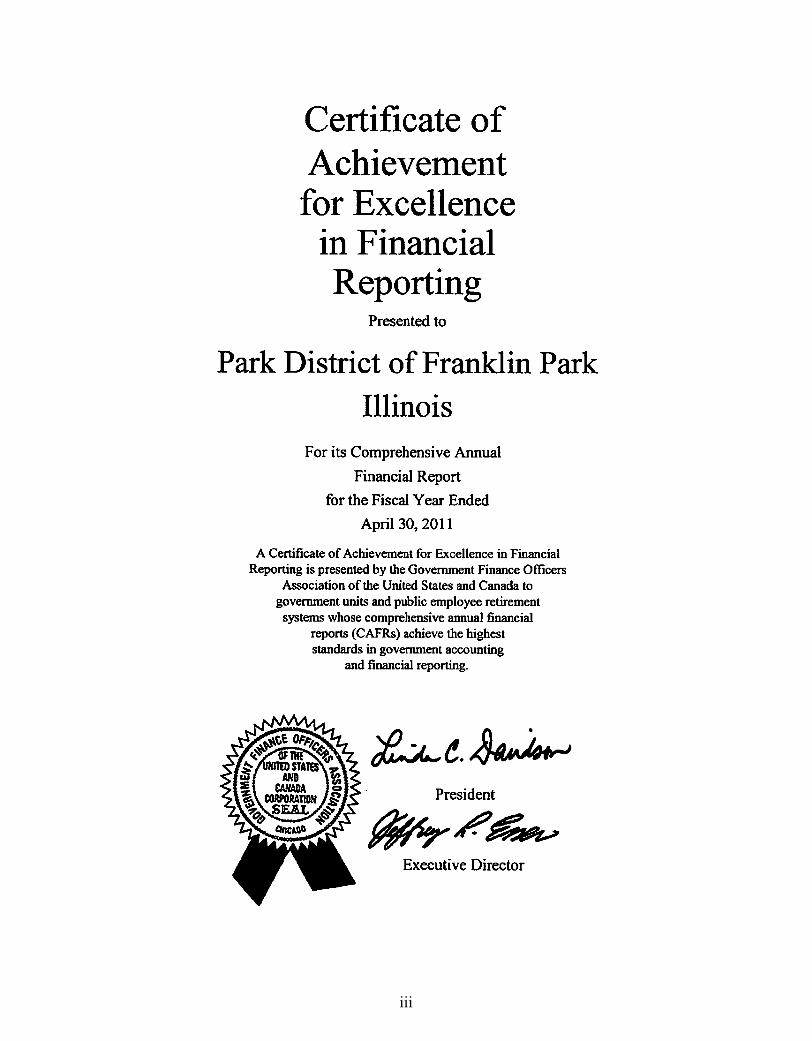
Certificate of Achievement ......................................................................................... iii
Letter of Transmittal ................................................................................................... iv-vi
FINANCIAL SECTION
INDEPENDENT AUDITOR’S REPORT .................................................................. 1-2
GENERAL PURPOSE EXTERNAL FINANCIAL STATEMENTS
Management’s Discussion and Analysis ................................................................ MD&A 1-6
Basic Financial Statements
Government-Wide Financial Statements
Statement of Net Assets ................................................................................ 3
Statement of Activities ................................................................................. 4-5
Fund Financial Statements
Governmental Funds
Balance Sheet ........................................................................................... 6-7
Reconciliation of Fund Balances of Governmental Funds to
the Governmental Activities in the Statement of Net Assets................. 8
Statement of Revenues, Expenditures and Changes in Fund Balances ... 9-10
Reconciliation of the Governmental Funds Statement of Revenues,
Expenditures and Changes in Fund Balances to the Governmental
Activities in the Statement of Activities ................................................ 11

PARK DISTRICT OF FRANKLIN PARK
FRANKLIN PARK, ILLINOIS
TABLE OF CONTENTS (Continued)
Page(s)
FINANCIAL SECTION (Continued)
GENERAL PURPOSE EXTERNAL FINANCIAL STATEMENTS (Continued) Basic Financial Statements (Continued) Fund Financial Statements (Continued) Proprietary Fund Statement of Net Assets ........................................................................... 12 Statement of Revenues, Expenses and Changes in Net Assets ................ 13 Statement of Cash Flows ......................................................................... 14 Notes to Financial Statements ........................................................................... 15-32 Required Supplementary Information Schedule of Revenues, Expenditures and Changes in Fund Balances - Budget and Actual General (Corporate) Fund ............................................................................. 33 Recreation Fund ............................................................................................ 34 Illinois Municipal Retirement Fund Schedule of Employer Contributions ........................................................... 35 Schedule of Funding Progress ...................................................................... 36 Notes to Required Supplementary Information ................................................. 37-38 COMBINING AND INDIVIDUAL FUND FINANCIAL STATEMENTS AND SCHEDULES MAJOR GOVERNMENTAL FUNDS GENERAL FUND Combining Balance Sheet - General (Corporate) Fund by Subfund ............ 39 Combining Schedule of Revenues, Expenditures and Changes in Fund Balances - Budget and Actual - General (Corporate) Fund by Subfund .... 40-43 Schedule of Detailed Expenditures - Budget and Actual - General (Corporate) Fund General (Corporate) Subfund .................................................................. 44-45 North Park Subfund ................................................................................. 46-47 Corporate Parks Subfund ......................................................................... 48-49 Public Liability Insurance Subfund ......................................................... 50

PARK DISTRICT OF FRANKLIN PARK
FRANKLIN PARK, ILLINOIS
TABLE OF CONTENTS (Continued)
Page(s)
FINANCIAL SECTION (Continued)
COMBINING AND INDIVIDUAL FUND
FINANCIAL STATEMENTS AND SCHEDULES (Continued)
MAJOR GOVERNMENTAL FUNDS (Continued)
RECREATION FUND
Schedule of Revenues, Expenditures and
Changes in Fund Balance - Budget and Actual .......................................... 51-52
Schedule of Detailed Expenditures - Budget and Actual ............................. 53-57
GENERAL DEBT SERVICE FUND
Schedule of Revenues, Expenditures and
Changes in Fund Balance - Budget and Actual .......................................... 58
2011 CAPITAL PROJECTS FUND
Schedule of Revenues, Expenditures and
Changes in Fund Balance - Budget and Actual .......................................... 59
NONMAJOR GOVERNMENTAL FUNDS
Combining Balance Sheet ................................................................................. 60
Combining Statement of Revenues, Expenditures
and Changes in Fund Balances ....................................................................... 61
Schedule of Revenues, Expenditures and
Changes in Fund Balance - Budget and Actual
Municipal Retirement Fund .......................................................................... 62
Social Security Fund ..................................................................................... 63
Audit Fund .................................................................................................... 64
Special Recreation Fund ............................................................................... 65
2010 Capital Projects Fund .......................................................................... 66
ENTERPRISE FUND
Ice Arena Fund
Schedule of Revenues, Expenses and
Changes in Net Assets - Budget and Actual ............................................... 67-68
Schedule of Detailed Expenses - Budget and Actual ................................... 69-72

PARK DISTRICT OF FRANKLIN PARK
FRANKLIN PARK, ILLINOIS
TABLE OF CONTENTS (Continued)
Page(s)
FINANCIAL SECTION (Continued)
SUPPLEMENTAL SCHEDULES
Schedule of General Capital Assets ....................................................................... 73
Schedule of General Obligation Bonds and Interest Payable Series 2011 ............. 74
STATISTICAL SECTION
Financial Trends
Net Assets by Component ...................................................................................... 75
Change in Net Assets ............................................................................................. 76-79
Fund Balances of Governmental Funds ................................................................. 80
Changes in Fund Balances of Governmental Funds .............................................. 81-82
Revenue Capacity
Assessed Value and Estimated Actual Value of Taxable Property ........................ 83
Property Tax Rates - Direct and Overlapping Governments ................................. 84
Principal Property Taxpayers ................................................................................. 85
Property Tax Levies and Collections ..................................................................... 86
Debt Capacity
Ratios of Outstanding Debt by Type ...................................................................... 87
Ratios of General Bonded Debt Outstanding ......................................................... 88
Direct and Overlapping Governmental Activities Debt ......................................... 89
Legal Debt Margin Information ............................................................................. 90
Demographic and Economic Information
Demographic and Economic Information .............................................................. 91
Principal Employers ............................................................................................... 92
Operating Information
Employees by Function .......................................................................................... 93-94
Operating Indicators ............................................................................................... 95
Capital Asset Statistics ........................................................................................... 96

INTRODUCTORY SECTION
i
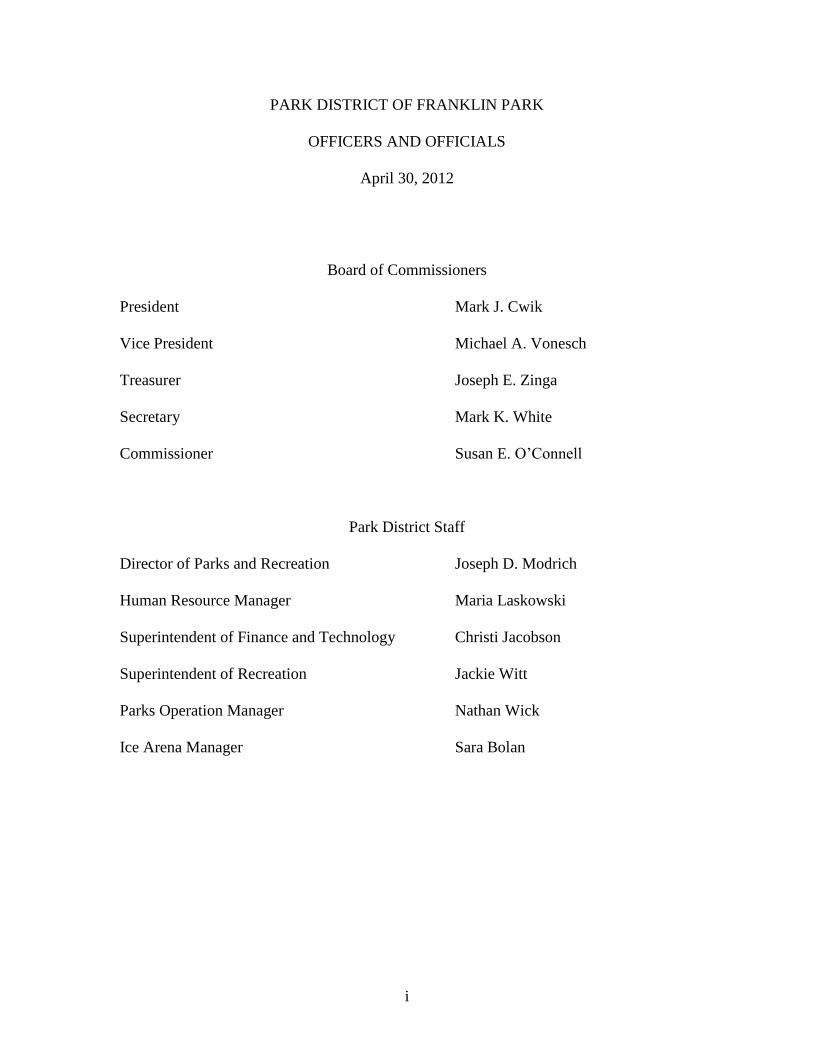
PARK DISTRICT OF FRANKLIN PARK
OFFICERS AND OFFICIALS
April 30, 2012
Board of Commissioners
President Mark J. Cwik
Vice President Michael A. Vonesch
Treasurer Joseph E. Zinga
Secretary Mark K. White
Commissioner Susan E. O’Connell
Park District Staff
Director of Parks and Recreation Joseph D. Modrich
Human Resource Manager Maria Laskowski
Superintendent of Finance and Technology Christi Jacobson
Superintendent of Recreation Jackie Witt
Parks Operation Manager Nathan Wick
Ice Arena Manager Sara Bolan

Park District
of Franklin Park
2012 Organizational Chart
Residents
Board of
Commissioners
Attorney Auditor Consultants
Marketing Human Resources Director of Grants
Manager Manager Parks & Recreation Financial
Board Committees Advisory Groups
Safety Superintendent of Superintendent of Superintendent Ice Arena North Park Partnership
Committee Recreation Finance/Technology of Parks & Planning Manager Manager Advisory Group
Finance/Legislation/Policy Manager Finance Parks Services Assistant Facility Teens
Committee Programs / Events Coordinator Staff Full-time Manager Secretary Advisory Group
Marketing Manager Payroll/Corporate Parks Parks Services Manager Service Staff Sports Affiliates
Committee Programs/ Facility Assistant Annual PT Staff Program / Marketing Advisory Group
Recreation Recreation Program Front Desk Parks Services Office Manager Banquet Staff Seniors/Trips/Excursions
Committee Staff Assistants Seasonal PT Staff Advisory Group
Facilities/Parks Recreation Aquatics Facility Supervisors Sports Arena
Committee Staff FT Staff
Employee HR Recreation Event Part Time Staff
Committee Staff
50th Anniversary
Committee
ii
iii

9560 Franklin Avenue Franklin Park, Illinois 60131
Administrative Offices
847-455-2852 Fax: 847-455-9053
Ice Arena
847-671-4268
North Park 847-678-4021
Service Center
847-451-1507
Park District Board of Commissioners
Mark K. White
President
Susan E. O’Connell Vice President
Michael A. Vonesch
Treasurer
Mark J. Cwik Secretary
Joseph E. Zinga Commissioner
Joseph D. Modrich
Director of Parks and Recreation
October 10, 2012 Board of Park Commissioners and Citizens of the Park District of Park District 9560 Franklin Avenue Franklin Park, Illinois 60131 State law requires that all general-purpose local governments publish within six months of the close of each fiscal year a complete set of financial statements presented in conformity with generally accepted accounting principles (GAAP) and audited in accordance with generally accepted auditing standards by a firm of licensed certified public accountants. This Comprehensive Annual Financial Report (CAFR) of the Park District of Franklin Park (Park District) for the fiscal year ending April 30, 2012 is hereby submitted as mandated by state statutes. Sikich LLP, the licensed accounting firm, issued an unqualified (“clean”) opinion on the District’s financial statements for the fiscal year ending April 30, 2012. Management assumes full responsibility for the completeness and reliability of the information in this report. To provide a reasonable basis for making these representations, the management of the Park District established a comprehensive internal control framework designed to protect the government’s assets from loss, theft, or misuse. Because the cost of internal controls should not exceed anticipated benefits, the objective is to provide reasonable, rather than absolute, assurance that the financial statements are free of any material misstatements. Management’s discussion and analysis (MD&A) immediately follows the independent auditor’s report and provides a narrative introduction, overview and analysis of the basic financial statements. MD&A complements this letter of transmittal and should be read in conjunction with it.
Profile of the Government
Concerned citizens, led by the Franklin Park Women’s Club and local Kiwanis Club, incorporated the Park District of Franklin Park on July 17, 1964 after a grass roots effort. From its beginning to the present, the Park District acquired 24 acres of parks, built four recreation facilities, and acquired a maintenance Service Center. Serving approximately 14,034 residents residing north of Grand Avenue, the Park District offers more than 250 programs each year for all age groups. We participate in a special recreation cooperative, the West Suburban Special Recreation Association (WSSRA). Supported by eleven park districts and two villages, the association provides special leisure services for people with disabilities.
Twenty-seven citizen volunteers have served as Park Commissioners by election appointment. The Park District has 20 full-time employees, augmented seasonally by more than 175 part-time employees. Six Directors have served in the past 47 years.
iv

v
The Park District operates with a limited number of acres — well below national standards. There are seventeen parks and three lighted baseball fields. Special facilities include a year-round indoor ice arena featuring a 200 x 85 main arena and a smaller practice arena, and a newly renovated outdoor swimming pool including a full-size Olympic pool, a wading pool, two waterslides and drop slide, a diving board, basketball hoop and zero-depth spray-ground. The Park District offices are housed in a 30,000 square foot Community Center which includes a full gymnasium, locker and shower facilities, eight meeting rooms, a pre-school, dance studio, fitness center and administrative offices. A smaller Community Center at North Park was renovated and expanded in 1995, from 6,000 to 20,000 square feet and remodeled in 2009. This Community Center includes senior citizen accommodations and a banquet hall, dance/aerobics studio, and sports/activity arena. The Sunflower Nature Center, located in the northwest corner of North Park, was also added in the park renovation in 2001. A 10,000 square foot maintenance facility accommodates a fleet of eight trucks; three tractors, and a full range of property care equipment. The Park District participates in the Illinois Municipal Retirement Fund (IMRF), and is a member of the Park District Risk Management Agency (PDRMA). These organizations are separate entities from the District. The District does not exercise financial accountability over these agencies, and their financial statements are not included in this report. However, audited financial statements for these organizations are available upon request from their business offices.
Local Economy The Park District has a population of approximately 14,034 in 5,045 households in Franklin Park. Franklin Park is in Cook County, about 14 miles west of downtown Chicago and covering approximately 4.15 square miles. The tax base of the Park District is supported by 75% business and industry and 25% residential property. Approximately 36% of the households have children under the age of 18 and the median age is 34. The median family income is $56,255 and per capital income is $19,434. The community benefits greatly from the large business and industry presence in the area. Franklin Park is the fourth largest industrial area in Illinois. Major employers within the District boundaries include Hill Mechanical Group, Sloan Valve Company, Canadian Pacific Railway, Fresh Express, Nestle Chocolate & Confection, and Bretford Manufacturing Inc.
Long-term Financial Planning The Park District works closely with a financial advisor to monitor current and future debt payments within the framework of estimated funding constraints. For the bond issue in 2008, the Park District’s bond rating was upgraded to AA Stable with Standard and Poor’s. The Park District also utilizes a ten-year Capital Improvement Plan detailing long-range infrastructure and equipment improvement needs.


FINANCIAL SECTION


GENERAL PURPOSE EXTERNAL FINANCIAL STATEMENTS

MD&A 1
Park District of Franklin Park
Franklin Park, Illinois
Management’s Discussion and Analysis
The Management Discussion and Analysis (MD&A) provides an introduction to the financial performance and
statements of the Park District of Franklin Park (Park District) for the fiscal year ending April 30, 2012. The
MD&A is designed to assist the reader on significant issues and provide an overview of the District’s financial
activity. This overview should be considered along with the financial information presented in the remainder
of the audit report.
Financial Highlights
The total assets of the District exceeded its liabilities at the close of the fiscal year by $19,935,004.
The District’s net assets increased by $1,058,075 or 6% during the fiscal year ending April 30, 2012.
The District’s combined Governmental Funds ending fund balance increased $1,051,736 as of April 30,
2012.
At the end of the fiscal year, the unassigned fund balance for the General Fund was $2,515,086.
Using the Annual Report Financial Section
The Park District presents two kinds of financial statements, each with a different view of the Park District.
The first presentation summarizes information by fund type on a current financial resource basis. The focus of
the second set of financial statements is on the Park District as a whole (government-wide) and on the major
individual funds. Both perspectives allow the users of the financial statements to address relevant questions.
Additionally, this reporting broadens the basis for comparison (i.e. comparing different years, governments,
etc.), and enhances the Park District’s accountability.
Government-Wide Financial Statements
The government-wide financial statements are designed to provide readers with a broad overview of the Park
District’s finances, in a manner similar to private-sector business. The government-wide financial statements
include the Statement of Net Assets and the Statement of Activities.
The Statement of Net Assets presents information on the assets and liabilities, with the difference between the
two reported as net assets. Over time, increases or decreases in net assets may serve as a useful indicator of
whether the financial position of the Park District is improving or deteriorating.
The Statement of Activities presents information showing how the Park District’s net assets changed during
the most recent fiscal year. It is focused on the gross and net cost of various programs and activities that are
supported by the Park District’s general taxes and other sources. This is intended to simplify and summarize
the cost of the Park District’s governmental activities.
The government-wide financial statements can be found on pages 3-5 of the audit report.
Fund Financial Statements
A fund is a grouping of related accounts that is used to maintain control over resources that have been
segregated for specific objectives. Like other local governments, the Park District uses fund accounting to
ensure and demonstrate compliance with finance-related legal requirements. All of the funds can be divided
into two categories: government funds and proprietary funds.

MD&A 2
Governmental Funds The Governmental Funds presentation shows the sources and uses of liquid resources. This is how the budget
is typically developed. Governmental funds provide a current resources (short-term) view that helps determine
whether there are more or fewer current financial resources available to spend for Park District operations.
Because the focus of governmental funds is narrower than that of the government-wide financial statements, it
is useful to compare the information presented for governmental funds with similar information presented for
governmental activities in the government-wide financial statements. By doing so, readers may better
understand the long-term impact of the Park District’s near-term financing decisions. Both the governmental
funds Balance Sheet and the governmental funds Statement of Revenues, Expenditures, and Changes in Fund
Balances provide a reconciliation to facilitate this comparison between governmental funds and governmental
activities.
The District maintains individual government funds to control resources for individual activities. Information
is presented separately in the governmental fund balance sheet and in the governmental fund statement of
revenues, expenditures and changes in fund balances for activities considered to be major funds. Major funds
are those whose revenues, expenditures, assets or liabilities are at least ten percent of the total for their fund
category and at least five percent of the aggregate amount for all governmental and enterprise funds. Data from
other governmental funds are combined into a singe aggregate presentation.
For the fiscal year ending April 30, 2012, the following funds were considered to be major funds:
• General • General Debt Service
• Recreation • 2011 Capital Projects
The following funds were considered to be non-major funds:
• Illinois Municipal Retirement • Public Audit
• Social Security • Special Recreation
• 2010 Capital Projects
The basic governmental fund financial statements can be found on pages 6-11 of the audit report.
Proprietary Fund
Proprietary funds account for services that are generally fully supported by user fees. Proprietary funds are
presented on a total economic resources basis. Proprietary fund statements, like government-wide statements,
provide short- and long-term financial information.
The Park District maintains one proprietary fund, the Ice Arena fund. Operating expenses for the Ice Arena
are funded with program and ice rental fees. The basic proprietary fund financial statements can be found on
pages 12-14 of the audit report.
Notes to the Financial Statements
The notes to the financial statements provide additional information that is essential to a full understanding of
the data provided in the government-wide and fund financial statements. The notes to the financial statements
can be found on pages 15-32 of the audit report.
Other Information
In addition to the basic financial statements and accompanying notes, this report also presents certain required
supplementary information concerning the Park District’s progress in funding its obligation to provide benefits
to its employees. Required supplementary information can be found on pages 33-38 of the audit report.
The combining and individual fund financial statements and schedules are presented on pages 39-74 of the
audit report.

MD&A 3
Government-Wide Financial Analysis
Over time, net assets serve as a useful indicator of a government’s financial position. The following schedule
indicates that the Park District’s assets as of April 30, 2012 exceeded liabilities by $19,935,004. This is an
increase of $1,058,075 from the prior year and $1,966,372 from 2010. The second chart illustrates the change
of ending net assets from 2006 to 2012.
Park District of Franklin Park Statement
Statement of Net Assets
Governmental Activities Business-Type Activities Total
2012 2011 2012 2011 2012 2011
Assets
Current Assets $7,630,994 $6,728,322 $1,379,816 $1,174,468 $9,010,810 $7,902,790
Capital Assets 12,527,484 12,608,435 1,189,634 1,206,293 13,717,118 13,814,728
Total Assets 20,158,478 19,336,757 2,569,450 2,380,761 22,727,928 21,717,518
Liabilities
Current Liabilities 2,630,171 2,736,133 105,584 52,957 2,735,755 2,789,090
Long-Term Liabilities 32,586 27,416 24,583 24,083 57,169 51,499
Total Liabilities 2,662,757 2,763,549 130,167 77,040 2,792,924 2,840,589
Net Assets
Invested in Capital
Assets,
net of related debt 12,622,181 12,134,638 1,189,634 1,206,293 13,811,815 13,340,931
Restricted 1,590,507 1,767,492 1,590,507 1,767,492
Unrestricted 3,283,033 2,671,078 1,249,649 1,097,428 4,532,682 3,768,506
Total Net Assets $17,495,721 $16,573,208 $2,439,283 $2,303,721 $19,935,004 $18,876,929
Park District of Franklin Park
Fiscal-Year Ending Net Assets
$0
$5,000,000
$10,000,000
$15,000,000
$20,000,000
$25,000,000
2006 2007 2008 2009 2010 2011 2012

MD&A 4
The largest part of the District’s net assets (72% of total net assets) reflects its investment in capital assets
which includes all of the land, buildings, parks, and equipment. These capital assets are used to provide
services to its citizens.
The two largest components of Current Assets are Cash and Investments and Property Taxes Receivable. The
Cash and Investment total of $7,416,118 is primarily attributable to reserve investments in the General Fund,
the Ice Arena Fund, the Recreation Fund, and the 2010 and 2011 Capital Project Funds. Property Taxes
Receivable amounted to $1,534,764 which represents the amount of taxes that were levied during the year but
were not due before the end of the fiscal year. The entire receivable is offset by deferred revenue, which is
reported in current liabilities.
The Park District’s Restricted Net Assets are restricted for debt service, construction, insurance payments,
special recreation expenses, and employee benefits. The Park District’s Unrestricted Net Assets, the portion of
net assets that can be used to finance daily operations, were $4,532,682 at the end of the year. The following
chart details total fiscal-year ending net assets for the Park District. For more detailed information see the
Statement of Net Assets on page 3.
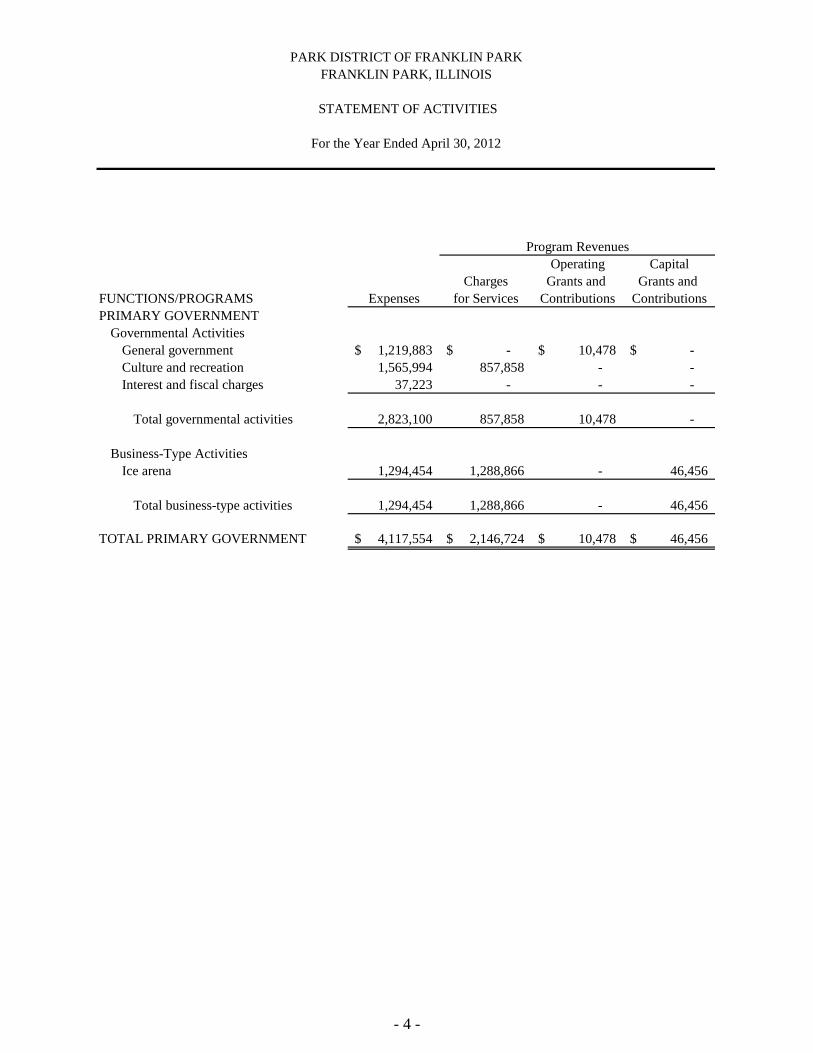
Statement of Activities: The following schedule presents a summary of revenues, expenses and change in net
assets for the year ended April 30, 2012:
Park District of Franklin Park
Statement of Activities
For The Fiscal Year Ended April 30, 2012
Governmental Activities Business-Type Activities Total
2012 2011 2012 2011 2012 2011
Revenues
Program Revenues
Charges for Services $ 857,858 $ 800,032 $ 1,288,866 $ 1,247,384 $ 2,146,724 $ 2,047,416
Capital Grants and
Contributions 10,478 - 46,456 43,858 56,934 43,858
General Revenues - -
Property and
Replacement Taxes 2,953,371 2,838,542 2,953,371 2,838,542
Investment Income 2,291 5,784 938 2,522 3,229 8,306
Other Revenues 15,371 2,267 - - 15,371 2,267
Total Revenues 3,839,369 3,643,625 1,336,260 1,293,764 5,175,629 4,940,389
Expenses
General Government 1,219,883 1,117,160 1,219,883 1,117,160
Culture and Recreation 1,565,994 1,610,006 1,565,994 1,610,006
Business – Type Activities 1,294,454 1,267,982 1,294,454 1,267,982
Interest 37,223 36,944 37,223 36,944
Total Expenses 2,823,100 2,764,110 1,294,454 1,267,982 4,117,554 4,032,092
Change in Net Assets before
Prior Period Adjustment 1,016,269 882,515 41,806 25,782 1,058,075 908,297
Prior Period Adjustment (456,538) 456,538 -
Transfers (93,756) (88,379) 93,756 88,379 -
Changes in Net Assets 922,513 337,598 135,562 114,161 1,058,075 908,297
Ending Net Assets 17,495,721 16,573,208 2,439,283 2,303,721 19,935,004 18,876,929

MD&A 5
Governmental Activities
For the fiscal year ending April 30, 2012 governmental revenues totaled $3,839,369 which is 5% higher than
the prior fiscal year. The Park District’s largest source of revenue came from Property Taxes and Personal
Property Replacement Taxes, which accounted for $3.0 million or 79% of the Park District’s total revenue
from governmental activities. Property and Personal Replacement Taxes increased from the prior fiscal year by
4%. Charges for services in government revenue totaled $857,858 which is 7% higher than the prior fiscal year
due to increased recreation program and pool revenue. Compared to the prior fiscal year, there was a 39%
increase in pool pass sales, a 33% increase in adult fitness registration, and a 16% increase in day camp
enrollment.
Total expenses in governmental activities increased by 2%. Culture and recreation expenses, which represent
costs associated with providing recreational programs and services totaled $1,565,994 which is a 2%
decrease from the prior year. General government expenses increased by 9%.
The following chart shows the major sources of operating revenue for governmental activities for the year
ended April 30, 2012: spaghetti
2011-2012 Revenue by Source - General Government
Charges for Services
22.0%
Other
0.2%
Property and
Replacement Taxes
77.1%
Business-Type Activities
Charges for services of the District’s business-type activities increased by $41,482 from the prior year or 3%
and operating expenses increased by $26,427 or 2%. Key factors behind the results include the following:
An 11% increase in Youth Hockey League revenue totaling $28,968.
A 10% increase in Skate lesson revenue totaling $12,083.
Decreased daily admission and skate rental revenue by $4,434.
Decreased concession and vending revenue by $8,226.
General Fund Budgetary Highlights
As of April 30, 2012, the Governmental Funds had a combined fund balance of $5,909,444, an increase of
$1,051,736 from the prior year. The increase was primarily from the 2011 Capital Projects reserves that had
not yet been spent on park renovation projects. The General Fund balance increased 10% from $2,315,915 to
$2,550,386 primarily due to lower than budgeted capital and operating transfers for the year. The following
schedule shows the actual revenues and expenditures of the General Fund in comparison to the original/final
budget:

MD&A 6
General Fund Budgetary Highlights
For The Fiscal Year Ended April 30, 2012
Original/Final
Budget
Actual
Revenues $ 1,378,920 $ 1,416,733
Expenditures 1,302,203 1,1182,262
Net Changes in Fund Balance $ 76,717 $ 234,471
The General Fund Balance increased during the year by $234,471 which was $157,754 higher than the budget.
Compared to the budget, property tax revenue was higher by $119,617 and replacement tax revenue was
higher by $7,409. Charges for services were lower than budget by $101,897 due to fewer facility rentals.
General Government expenses were less than budget by $119,941 partially due to decreased salary and benefit
expenses in the Corporate Parks department and decreased expenses associated with facility rentals
Capital Assets
Increases to governmental capital assets totaled $314,165 and was offset by disposals totaling $16,038 and net
depreciation of $379,078. The total capital asset balance as of April 30, 2012 was $12,527,484 for
governmental activities and $1,189,634 for business-type activities. Major capital projects completed during
the year included the renovation of Ruby Addison Park and the purchase of a new Park Services truck.
For more detail information on Capital Assets, see Note 4 on pages 24-25 in the Notes to the Financial
Statements.
Long-Term Debt
As of April 30, 2012, the Park District had a total of $905,000 for principal on outstanding debt. Total long-
term debt also includes $36,207 related to Compensated Absences for governmental activities and $27,314 for
business-type activities. For more detail information on the Park District’s long-term debt, see Note 5 on page
25 in the Notes to the Financial Statements.
Requests for Information
This financial report provides our residents, investors, creditors and other interested parties with an overview
of the finances of the Park District of Franklin Park and demonstrates the Park District’s accountability for the
financial resources it receives. Please direct questions concerning any information contained in this report to
the Finance Department at 9560 Franklin Avenue, Franklin Park, Illinois 60131.

Governmental Business-Type
Activities Activities Total
ASSETS
Cash and investments 6,058,208$ 1,357,910$ 7,416,118$
Cash with paying agent 8,648 - 8,648
Receivables (net, where applicable, of
allowances for uncollectibles)
Property taxes 1,534,764 - 1,534,764
Accounts - 10,986 10,986
Other 13,235 - 13,235
Inventory 7,404 6,655 14,059
Prepaid expenses 8,735 4,265 13,000
Capital assets not being depreciated 5,158,251 242,794 5,401,045
Capital assets being depreciated
net of accumulated depreciation 7,369,233 946,840 8,316,073
Total assets 20,158,478 2,569,450 22,727,928
LIABILITIES
Accounts payable 72,779 28,669 101,448
Accrued interest payable 8,648 - 8,648
Accrued payroll 32,463 22,343 54,806
Deposits payable 33,471 - 33,471
Deferred property tax revenue 1,534,764 - 1,534,764
Deferred revenue 39,425 51,841 91,266
Noncurrent liabilities
Due within one year 908,621 2,731 911,352
Due in more than one year 32,586 24,583 57,169
Total liabilities 2,662,757 130,167 2,792,924
NET ASSETS
Invested in capital assets, net of related debt 12,622,181 1,189,634 13,811,815
Restricted for
Liability insurance 21,310 - 21,310
Debt service 657,405 - 657,405
Employee retirement 84,042 - 84,042
Special purposes 38,105 - 38,105
Special recreation 266,631 - 266,631
Construction and development 523,014 - 523,014
Unrestricted 3,283,033 1,249,649 4,532,682
TOTAL NET ASSETS 17,495,721$ 2,439,283$ 19,935,004$
Primary Government
PARK DISTRICT OF FRANKLIN PARK
FRANKLIN PARK, ILLINOIS
STATEMENT OF NET ASSETS
April 30, 2012
See accompanying notes to financial statements.- 3 -
Operating Capital
Charges Grants and Grants and
FUNCTIONS/PROGRAMS Expenses for Services Contributions Contributions
PRIMARY GOVERNMENT
Governmental Activities
General government 1,219,883$ -$ 10,478$ -$
Culture and recreation 1,565,994 857,858 - -
Interest and fiscal charges 37,223 - - -
Total governmental activities 2,823,100 857,858 10,478 -
Business-Type Activities
Ice arena 1,294,454 1,288,866 - 46,456
Total business-type activities 1,294,454 1,288,866 - 46,456
TOTAL PRIMARY GOVERNMENT 4,117,554$ 2,146,724$ 10,478$ 46,456$
Program Revenues
PARK DISTRICT OF FRANKLIN PARK
FRANKLIN PARK, ILLINOIS
STATEMENT OF ACTIVITIES
For the Year Ended April 30, 2012
- 4 -

Net (Expense) Revenue and
Governmental Business-Type
Activities Activities Total
(1,209,405)$ -$ (1,209,405)$
(708,136) - (708,136)
(37,223) - (37,223)
(1,954,764) - (1,954,764)
- 40,868 40,868
- 40,868 40,868
(1,954,764) 40,868 (1,913,896)
General Revenues
Taxes
Property 2,640,962 - 2,640,962
Replacement 312,409 - 312,409
Investment income 2,291 938 3,229
Miscellaneous 15,371 - 15,371
Transfers in (out) (93,756) 93,756 -
Total 2,877,277 94,694 2,971,971
CHANGE IN NET ASSETS 922,513 135,562 1,058,075
NET ASSETS, MAY 1 16,573,208 2,303,721 18,876,929
NET ASSETS, APRIL 30 17,495,721$ 2,439,283$ 19,935,004$
Change in Net Assets
Primary Government
See accompanying notes to financial statements.- 5 -

General
Debt
General Recreation Service
ASSETS
Cash and investments 2,628,121$ 850,988$ 657,405$
Cash with paying agent - - 8,648
Receivables (net, where applicable, of
allowances for uncollectibles)
Property taxes 519,141 285,705 529,759
Other 10,256 2,979 -
Inventory 7,404 - -
Prepaid items 6,586 2,149 -
TOTAL ASSETS 3,171,508$ 1,141,821$ 1,195,812$
LIABILITIES AND FUND BALANCES
LIABILITIES
Accounts payable 49,423$ 13,151$ -$
Accrued payroll 19,412 13,051 -
Accrued interest payable - - 8,648
Deposits payable 33,146 325 -
Deferred property tax revenue 519,141 285,705 529,759
Deferred revenue - 39,425 -
Total liabilities 621,122 351,657 538,407
FUND BALANCES
Nonspendable
Prepaid items 6,586 2,149 -
Inventory 7,404 - -
Restricted
Liability insurance 21,310 - -
Debt service - - 657,405
Employee retirement - - -
Special purposes - - -
Special recreation - - -
Construction and development - - -
Unrestricted
Assigned for recreation - 788,015 -
Unassigned 2,515,086 - -
Total fund balances 2,550,386 790,164 657,405
TOTAL LIABILITIES AND
FUND BALANCES 3,171,508$ 1,141,821$ 1,195,812$
April 30, 2012
PARK DISTRICT OF FRANKLIN PARK
FRANKLIN PARK, ILLINOIS
BALANCE SHEET
GOVERNMENTAL FUNDS
- 6 -

Nonmajor Total
2011 Capital Governmental Governmental
Projects Funds Funds
841,356$ 1,080,338$ 6,058,208$
- - 8,648
- 200,159 1,534,764
- - 13,235
- - 7,404
- - 8,735
841,356$ 1,280,497$ 7,630,994$
775$ 9,430$ 72,779$
- - 32,463
- - 8,648
- - 33,471
- 200,159 1,534,764
- - 39,425
775 209,589 1,721,550
- - 8,735
- - 7,404
- - 21,310
- - 657,405
- 84,042 84,042
- 38,105 38,105
- 266,631 266,631
840,581 682,130 1,522,711
- - 788,015
- - 2,515,086
840,581 1,070,908 5,909,444
841,356$ 1,280,497$ 7,630,994$
See accompanying notes to financial statements.- 7 -

FUND BALANCES OF GOVERNMENTAL FUNDS 5,909,444$
Amounts reported for governmental activities in the
statement of net assets are different because:
Capital assets used in governmental activities are not financial
resources and, therefore, are not reported in the governmental funds 12,527,484
Long-term liabilities, including bonds payable, are not due and
payable in the current period and, therefore, are not reported
in the governmental funds (905,000)
Compensated absences payable is not due and payable in the current
period and, therefore, is not reported in governmental funds (36,207)
NET ASSETS OF GOVERNMENTAL ACTIVITIES 17,495,721$
PARK DISTRICT OF FRANKLIN PARK
RECONCILIATION OF FUND BALANCES OF GOVERNMENTAL FUNDS TO THE
GOVERNMENTAL ACTIVITIES IN THE STATEMENT OF NET ASSETS
April 30, 2012
FRANKLIN PARK, ILLINOIS
See accompanying notes to financial statements.- 8 -

General
Debt
General Recreation Service
REVENUES
Taxes 1,128,026$ 495,014$ 944,945$
Charges for services 273,523 584,342 -
Intergovernmental 10,478 - -
Investment income 1,898 85 122
Miscellaneous 2,808 57 -
Total revenues 1,416,733 1,079,498 945,067
EXPENDITURES
Current
General government 895,324 - -
Culture and recreation 284,181 839,405 -
Capital outlay 2,757 - -
Debt service
Principal retirement - - 885,000
Interest and fiscal charges - - 17,963
Total expenditures 1,182,262 839,405 902,963
EXCESS (DEFICIENCY) OF REVENUES
OVER EXPENDITURES 234,471 240,093 42,104
OTHER FINANCING SOURCES (USES)
Bond proceeds, at par - - -
Premium on bonds issued - - -
Transfers (out) - - -
Total other financing sources (uses) - - -
NET CHANGE IN FUND BALANCES 234,471 240,093 42,104
FUND BALANCES, MAY 1 2,315,915 550,071 615,301
FUND BALANCES, APRIL 30 2,550,386$ 790,164$ 657,405$
For the Year Ended April 30, 2012
PARK DISTRICT OF FRANKLIN PARK
FRANKLIN PARK, ILLINOIS
STATEMENT OF REVENUES, EXPENDITURES AND
CHANGES IN FUND BALANCES
GOVERNMENTAL FUNDS
- 9 -

Nonmajor Total
2011 Capital Governmental Governmental
Projects Funds Funds
-$ 385,385$ 2,953,370$
- - 857,865
- - 10,478
- 186 2,291
- 12,500 15,365
- 398,071 3,839,369
- 90,973 986,297
- 265,893 1,389,479
67,686 252,962 323,405
- - 885,000
- - 17,963
67,686 609,828 3,602,144
(67,686) (211,757) 237,225
905,000 - 905,000
3,267 - 3,267
- (93,756) (93,756)
908,267 (93,756) 814,511
840,581 (305,513) 1,051,736
- 1,376,421 4,857,708
840,581$ 1,070,908$ 5,909,444$
See accompanying notes to financial statements.- 10 -
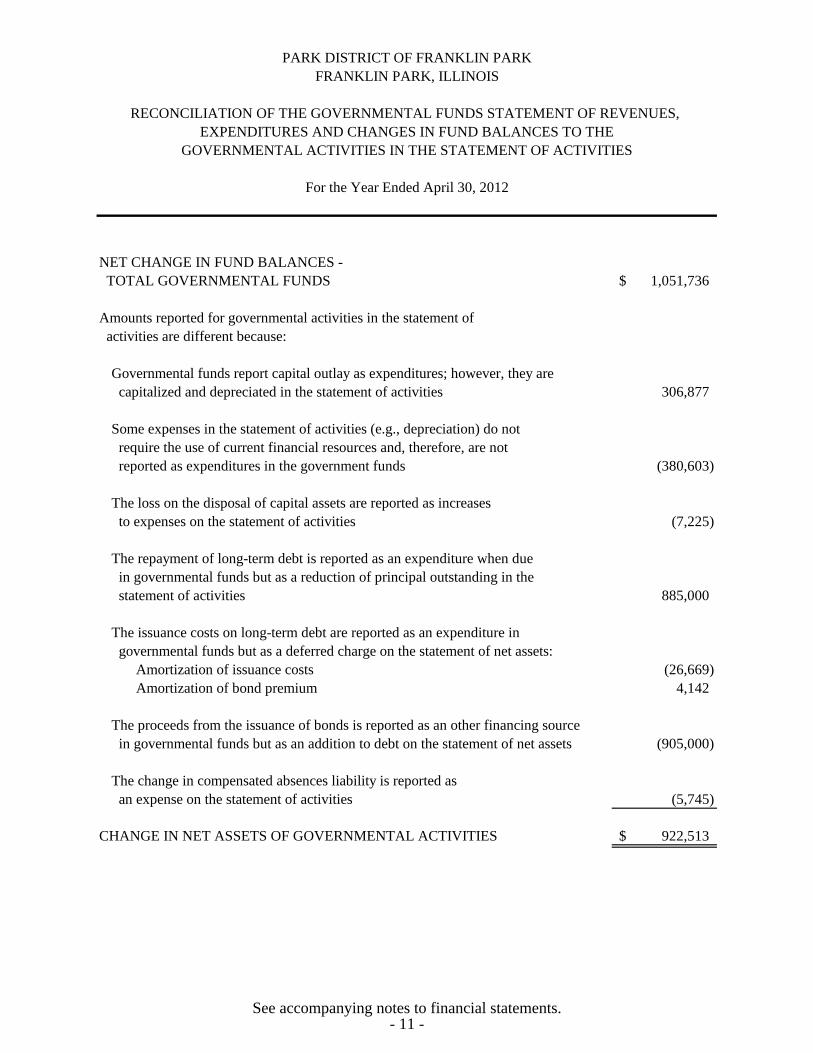
NET CHANGE IN FUND BALANCES -
TOTAL GOVERNMENTAL FUNDS 1,051,736$
Amounts reported for governmental activities in the statement of
activities are different because:
Governmental funds report capital outlay as expenditures; however, they are
capitalized and depreciated in the statement of activities 306,877
Some expenses in the statement of activities (e.g., depreciation) do not
require the use of current financial resources and, therefore, are not
reported as expenditures in the government funds (380,603)
The loss on the disposal of capital assets are reported as increases
to expenses on the statement of activities (7,225)
The repayment of long-term debt is reported as an expenditure when due
in governmental funds but as a reduction of principal outstanding in the
statement of activities 885,000
The issuance costs on long-term debt are reported as an expenditure in
governmental funds but as a deferred charge on the statement of net assets:
Amortization of issuance costs (26,669)
Amortization of bond premium 4,142
The proceeds from the issuance of bonds is reported as an other financing source
in governmental funds but as an addition to debt on the statement of net assets (905,000)
The change in compensated absences liability is reported as
an expense on the statement of activities (5,745)
CHANGE IN NET ASSETS OF GOVERNMENTAL ACTIVITIES 922,513$
GOVERNMENTAL ACTIVITIES IN THE STATEMENT OF ACTIVITIES
For the Year Ended April 30, 2012
PARK DISTRICT OF FRANKLIN PARK
FRANKLIN PARK, ILLINOIS
RECONCILIATION OF THE GOVERNMENTAL FUNDS STATEMENT OF REVENUES,
EXPENDITURES AND CHANGES IN FUND BALANCES TO THE
See accompanying notes to financial statements.- 11 -

PARK DISTRICT OF FRANKLIN PARK
FRANKLIN PARK, ILLINOIS
STATEMENT OF NET ASSETS
PROPRIETARY FUND
April 30, 2012
Ice Arena
CURRENT ASSETS
Cash and investments 1,357,910$
Accounts receivable, net of allowance 10,986
Inventory 6,655
Prepaid expenses 4,265
Total current assets 1,379,816
CAPITAL ASSETS
Capital assets not being depreciated 242,794
Capital assets being depreciated 2,191,223
Accumulated depreciation (1,244,383)
Total capital assets 1,189,634
Total assets 2,569,450
CURRENT LIABILITIES
Accounts payable 28,669
Accrued payroll 22,343
Deferred revenue 51,841
Compensated absences 2,731
Total current liabilities 105,584
NONCURRENT LIABILITIES
Compensated absences 24,583
Total noncurrent liabilities 24,583
Total liabilities 130,167
NET ASSETS
Invested in capital assets 1,189,634
Unrestricted 1,249,649
TOTAL NET ASSETS 2,439,283$
See accompanying notes to financial statements.- 12 -

PARK DISTRICT OF FRANKLIN PARK
FRANKLIN PARK, ILLINOIS
STATEMENT OF REVENUES, EXPENSES AND
CHANGES IN NET ASSETS
PROPRIETARY FUND
For the Year Ended April 30, 2012
Ice Arena
OPERATING REVENUE
Program revenue $ 793,416
Rentals 359,824
Other 135,626
Total operating revenue 1,288,866
OPERATING EXPENSE
Operating 1,231,339
Depreciation 56,932
Total operating expense 1,288,271
OPERATING INCOME (LOSS) 595
NONOPERATING REVENUES (EXPENSES)
Gain (loss) on disposal of capital assets (6,183)
Investment income 938
Total nonoperating revenues (expenses) (5,245)
CHANGE IN NET ASSETS BEFORE
TRANSFERS AND CONTRIBUTIONS (4,650)
TRANSFERS IN 93,756
CONTRIBUTIONS
Contributions of capital assets 46,456
CHANGE IN NET ASSETS 135,562
NET ASSETS, MAY 1 2,303,721
NET ASSETS, APRIL 30 $ 2,439,283
See accompanying notes to financial statements.- 13 -

PARK DISTRICT OF FRANKLIN PARK
FRANKLIN PARK, ILLINOIS
STATEMENT OF CASH FLOWS
PROPRIETARY FUND
For the Year Ended April 30, 2012
Ice Arena
CASH FLOWS FROM OPERATING ACTIVITIES
Receipts from customers and users 1,342,239$
Payments to suppliers (556,392)
Payments to employees (660,937)
Net cash from operating activities 124,910
CASH FLOWS FROM NONCAPITAL
FINANCING ACTIVITIES
Transfers in from other funds 93,756
CASH FLOWS FROM CAPITAL AND
RELATED FINANCING ACTIVITIES
None -
CASH FLOWS FROM INVESTING ACTIVITIES
Interest on investments 938
NET INCREASE IN CASH AND CASH EQUIVALENTS 219,604
CASH AND CASH EQUIVALENTS, MAY 1 1,138,306
CASH AND CASH EQUIVALENTS, APRIL 30 1,357,910$
RECONCILIATION OF OPERATING INCOME (LOSS) TO NET
CASH FLOWS FROM OPERATING ACTIVITIES
Operating income (loss) 595$
Adjustments to reconcile operating income (loss)
to net cash from operating activities
Depreciation 56,932
Changes in assets and liabilities
Accounts receivable 12,486
Inventory 1,023
Prepaid expenses 747
Accounts payable 5,599
Accrued payroll 3,410
Deferred revenue 40,887
Compensated absences payable 3,231
NET CASH FROM OPERATING ACTIVITIES 124,910$
NONCASH TRANSACTIONS
Contributions of capital assets 46,456$
See accompanying notes to financial statements.- 14 -

NOTES TO FINANCIAL STATEMENTS

- 15 -
PARK DISTRICT OF FRANKLIN PARK
FRANKLIN PARK, ILLINOIS
NOTES TO FINANCIAL STATEMENTS
April 30, 2012
1. SUMMARY OF SIGNIFICANT ACCOUNTING POLICIES The financial statements of the Park District of Franklin Park (the District) have been
prepared in conformity with accounting principles generally accepted in the United States of America, as applied to government units (hereinafter referred to as generally accepted accounting principles (GAAP)). The Governmental Accounting Standards Board (GASB) is the accepted standard-setting body for establishing governmental accounting and financial reporting principles. The more significant of the District’s accounting policies are described below.
a. Reporting Entity The District is a body corporate and politic established under Illinois Compiled
Statutes (ILCS). The District is considered to be a primary government as defined by GASB Statement No. 14, since it is legally separate and fiscally independent.
The District participates with other park districts in the organization known as West
Suburban Special Recreation Association (WSSRA). WSSRA is governed by a board appointed equally by the member districts. The District levies property taxes in the Special Recreation Fund to provide for its share of the cost of the operations of WSSRA. WSSRA is considered to be a jointly governed organization of the member districts. During the fiscal year ended April 30, 2012, the District contributed $137,031 to WSSRA.
b. Fund Accounting The District uses funds to report on its financial position and the changes in its
financial position. Fund accounting is designed to demonstrate legal compliance and to aid financial management by segregating transactions related to certain governmental functions or activities.
A fund is a separate accounting entity with a self-balancing set of accounts. Funds
are classified into the following categories: governmental, proprietary and fiduciary. Governmental funds are used to account for all or most of a government’s general
activities, including the collection and disbursement of restricted or committed monies (special revenue funds), the funds committed, restricted or assigned for the acquisition or construction of capital assets (capital projects funds) and the funds committed, restricted or assigned for the servicing of governmental long-term debt (debt service funds). The general (corporate) fund is used to account for all activities of the general government not accounted for in some other fund.
- 15 -

PARK DISTRICT OF FRANKLIN PARK
FRANKLIN PARK, ILLINOIS
NOTES TO FINANCIAL STATEMENTS (Continued)
- 16 -
1. SUMMARY OF SIGNIFICANT ACCOUNTING POLICIES (Continued)
b. Fund Accounting (Continued)
Proprietary funds are used to account for activities similar to those found in the
private sector, where the determination of net income is necessary or useful to sound
financial administration. Goods or services from such activities can be provided
either to outside parties (enterprise funds) or to other departments or agencies
primarily within the District (internal service funds). Pursuant to GASB Statement
No. 20, Accounting and Financial Reporting for Proprietary Funds, the District has
chosen to apply all FASB pronouncements issued on or before November 30, 1989 to
account for its enterprise funds as well as private-sector standards to the extent that
those standards do not conflict or contradict guidance of GASB. Governments also
have the option of following subsequent private-sector guidance for their business-
type activities and enterprise funds, subject to this same limitation. The District has
elected not to follow subsequent private-sector guidance.
The District has no fiduciary funds.
c. Government-Wide and Fund Financial Statements
The government-wide financial statements (i.e., the statement of net assets and the
statement of activities) report information on all of the activities of the District. The
effect of material interfund activity has been eliminated from these statements.
Governmental activities, which normally are supported by taxes and
intergovernmental revenues, are reported separately from business-type activities,
which rely to a significant extent on user fees and charges for support.
The statement of activities demonstrates the degree to which the direct expenses of a
given function, segment or program are offset by program revenues. Direct expenses
are those that are clearly identifiable with a specific function or segment. Program
revenues include (1) charges to customers or applicants who purchase, use or directly
benefit from goods, services or privileges provided by a given function or segment
and (2) grants and contributions that are restricted to meeting the operational or
capital requirements of a particular function or segment. Taxes and other items not
properly included among program revenues are reported instead as general revenues.
Contributions of land by developers under land/cash ordinances, if any, are reported
as capital grants and contributions on the statement of activities.
Separate financial statements are provided for governmental funds and proprietary
funds. Major individual governmental funds are reported as separate columns in the
fund financial statements.
- 16 -

PARK DISTRICT OF FRANKLIN PARK
FRANKLIN PARK, ILLINOIS
NOTES TO FINANCIAL STATEMENTS (Continued)
- 17 -
1. SUMMARY OF SIGNIFICANT ACCOUNTING POLICIES (Continued)
c. Government-Wide and Fund Financial Statements (Continued)
The District reports the following major governmental funds:
The General Fund is the general operating fund of the District. It is used to
account for all financial resources except those required to be accounted for in
another fund. It is comprised of four subfunds, the general (corporate), North
Park, corporate parks and the public liability insurance subfund.
The Recreation Fund is used to account for revenue and expenditures related to
recreation programs funded by a tax levy and user fees.
The General Debt Service Fund is used to account for the accumulation of
resources for and the payment of principal and interest on governmental
activities long-term debt.
The 2011 Capital Projects Fund was established to track bond proceeds related
to the 2011 $905,000 bond issue. This bond is being used for park and facility
improvements.
The District reports the following major proprietary fund:
The Ice Arena Fund accounts for the operation of the indoor ice arena.
Operations include program revenues, rentals and food and beverage sales.
The cost of operations is recovered through user charges.
d. Measurement Focus, Basis of Accounting and Financial Statement Presentation
The government-wide financial statements are reported using the economic resources
measurement focus and the accrual basis of accounting, as are the proprietary fund
financial statements. With this measurement focus, all assets and all liabilities
associated with the operation of these activities/funds are included on the statement
of net assets. Revenues are recorded when earned and expenses are recorded when a
liability is incurred. Property taxes are recognized as revenues in the year for which
they are levied (i.e., intended to finance). Grants and similar items are recognized as
revenue as soon as all eligibility requirements imposed by the provider have been met.
Operating revenues and expenses are directly attributable to the operation of the
proprietary funds. Nonoperating revenue/expenses are incidental to the operations of
these funds.
- 17 -

PARK DISTRICT OF FRANKLIN PARK
FRANKLIN PARK, ILLINOIS
NOTES TO FINANCIAL STATEMENTS (Continued)
- 18 -
1. SUMMARY OF SIGNIFICANT ACCOUNTING POLICIES (Continued)
d. Measurement Focus, Basis of Accounting and Financial Statement Presentation
(Continued)
Governmental fund financial statements are reported using the current financial
resources measurement focus and the modified accrual basis of accounting. With this
measurement focus, only current assets and current liabilities generally are included
on the balance sheet. Operating statements of these funds present increases (i.e.,
revenues and other financing sources) and decreases (i.e., expenditures and other
financing uses) in net current assets.
Under the modified accrual basis of accounting, revenues are recognized when
susceptible to accrual (i.e., when they become both measurable and available).
Measurable means the amount of the transaction can be determined and available
means collectible within the current period or soon enough thereafter to be used to pay
liabilities of the current period (60 days). The District recognizes property taxes when
they become both measurable and available in the year intended to finance.
Expenditures are recorded when the related liability is incurred. Principal and interest
on general long-term debt are recorded as expenditures become due.
Those revenues susceptible to accrual are property taxes, interest revenue and
charges for services.
The District reports deferred revenue on its financial statements. Deferred revenues
arise when potential revenue does not meet both the measurable and available criteria
for recognition in the current period for governmental funds or earned at the
government-wide level. Deferred revenues also arise when resources are received by
the District before it has legal claim to them as when grant monies are received prior
to the incurrence of qualifying expenditures. In subsequent periods, when revenue
recognition criteria are met, or when the District has a legal claim to the resources by
meeting all eligibility requirements, the liability for deferred revenue is removed
from the financial statements and revenue is recognized.
e. Cash Equivalents
For purposes of the statement of cash flows, the Enterprise Fund considers all highly
liquid investments with a maturity of three months or less when purchased to be cash
equivalents.
- 18 -

PARK DISTRICT OF FRANKLIN PARK
FRANKLIN PARK, ILLINOIS
NOTES TO FINANCIAL STATEMENTS (Continued)
- 19 -
1. SUMMARY OF SIGNIFICANT ACCOUNTING POLICIES (Continued)
f. Investments The District’s investments are recorded at fair value, except for nonnegotiable
certificates of deposits, if any, which are reported at cost. Fair value is based on published market prices as of April 30, 2012.
g. Inventories Inventories consist of amounts available for resale and are accounted for using the
consumption method. Inventories are valued at cost on the first-in/first-out (FIFO) method.
h. Prepaid Expenses/Items Certain payments to vendors reflect costs applicable to future accounting periods,
and are recorded as prepaid expenses/items. Such amounts are offset by fund balance nonspendable for prepaid items in the governmental fund financial statements.
i. Capital Assets Capital assets, which include property, plant, equipment and infrastructure assets
(e.g., bike trails, paths and similar items) are reported in the applicable governmental activities column in the government-wide financial statements. Capital assets are defined by the District as assets with an initial, individual cost of more than $2,500 and an estimated useful life in excess of one year. Such assets are reported at historical cost or estimated historical cost if purchased or constructed. Donated capital assets are recorded at estimated fair market value at the date of donation.
The costs of normal maintenance and repairs that do not add to the value of the asset or
materially extend asset lives are not capitalized. Major outlays for capital assets and improvements are capitalized as projects are
constructed. Interest incurred during the construction phase of capital assets is not included as part of the capitalized value of the assets constructed. Property, plant and equipment is depreciated using the straight-line method over the following estimated useful lives:
Assets Years
Equipment 3-10 Land improvements 10-20 Buildings 10-30 Motor vehicles 3-10
- 19 -

PARK DISTRICT OF FRANKLIN PARK
FRANKLIN PARK, ILLINOIS
NOTES TO FINANCIAL STATEMENTS (Continued)
- 20 -
1. SUMMARY OF SIGNIFICANT ACCOUNTING POLICIES (Continued)
j. Long-Term Obligations
In the government-wide financial statements and the proprietary fund in the fund
financial statements, long-term debt and other long-term obligations are reported as
liabilities in the applicable governmental activities or proprietary fund financial
statements. Bond premiums and discounts, as well as issuance costs, are deferred
and amortized over the life of the bonds. Bonds payable are reported net of the
applicable bond premium or discount. Bond issuance costs are reported as deferred
charges and amortized over the term of the related debt.
In the fund financial statements, governmental funds recognize bond premiums and
discounts, as well as bond issuance costs, during the current period. The face amount
of debt issued is reported as other financing sources. Premiums received on debt
issuances are reported as other financing sources while discounts on debt issuances
are reported as other financing uses. Issuance costs, whether or not withheld from
the actual debt proceeds received, are reported as expenditures.
k. Accrued Compensated Absences
Accumulated unpaid vacation pay is accrued by the District on the statement of net
assets and the proprietary fund financial statements. Employees who work a 12-
month year are entitled to compensated vacation time. Vacations are usually taken
within the anniversary year of each employee. The liability for accumulated unpaid
vacation pay is based upon accumulated days at April 30, 2012, times the current pay
rate (including certain benefits) for each employee.
All full-time employees receive one sick day per month. Unused sick leave days
accumulate to a maximum of 240 days for full-time personnel. The District does not
reimburse employees for unused sick days remaining upon termination of
employment. Therefore, no accrual has been made for sick leave as sick leave does
not vest or accumulate.
l. Property Taxes
Property tax revenues are recognized in the year intended to finance. The second
installment of the 2011 tax levy is intended to finance the 2013 fiscal year and is not
considered available for current operations and is, therefore, shown as receivable and
deferred revenue at year end. The District assumes 1% of the levy is uncollectible.
- 20 -

PARK DISTRICT OF FRANKLIN PARK
FRANKLIN PARK, ILLINOIS
NOTES TO FINANCIAL STATEMENTS (Continued)
- 21 -
1. SUMMARY OF SIGNIFICANT ACCOUNTING POLICIES (Continued)
m. Net Assets/Fund Balance
In the fund financial statements, governmental funds report nonspendable fund
balance for amounts that are either not in spendable form or legally or contractually
required to be maintained intact. Restrictions of fund balance are reported for
amounts constrained by legal restrictions from outside parties for use for a specific
purpose, or externally imposed by outside entities or from enabling legislation
adopted by the District. Committed fund balance, if any, is constrained by formal
actions of the District’s Board of Commissioners, which is considered the District’s
highest level of decision making authority. Formal actions include resolutions and
ordinances approved by the Board. Assigned fund balance represents amounts
constrained by the District’s intent to use them for a specific purpose. The authority
to assign fund balance has been delegated to the Executive Director. Any residual
fund balance in the General Fund, including fund balance targets and any deficit fund
balance of any other governmental fund is reported as unassigned.
The District has established a fund balance reserve policy for its general fund. The
policy requires fund balance to be maintained in the general fund at a target base of a
minimum of three to four months of the annual budgeted expenditures. Balances in
excess of four months may be transferred to the Capital Projects Fund to support
future capital projects.
The District’s flow of funds assumption prescribes that the funds with the highest
level of constraint are expended first. If restricted or unrestricted funds are available
for spending, the restricted funds are spent first. Additionally, if different levels of
unrestricted funds are available for spending the District considers committed funds
to be expended first followed by assigned funds and then unassigned funds.
In the government-wide financial statements, restricted net assets are legally
restricted by outside parties for a specific purpose. None of the restricted net assets
result from enabling legislation adopted by the District. Invested in capital assets, net
of related debt, represents the District’s investment in the book value of capital assets,
less any outstanding debt that was issued to construct or acquire the capital asset.
n. Interfund Transactions
Internal services transactions are accounted for as revenues, expenditures or
expenses. Transactions that constitute reimbursements to a fund for
expenditures/expenses initially made from it that are properly applicable to another
fund, are recorded as expenditures/expenses in the reimbursing fund and as
reductions of expenditures/expenses in the fund that is reimbursed.
- 21 -

PARK DISTRICT OF FRANKLIN PARK
FRANKLIN PARK, ILLINOIS
NOTES TO FINANCIAL STATEMENTS (Continued)
- 22 -
1. SUMMARY OF SIGNIFICANT ACCOUNTING POLICIES (Continued)
n. Interfund Transactions (Continued)
All other interfund transactions, except internal services transactions and
reimbursements, are reported as transfers.
o. Interfund Receivables/Payables
Activity between funds that are representative of lending/borrowing arrangements
outstanding at the end of the fiscal year are referred to as either “due to/from other
funds” (i.e., the current portion of interfund loans) or “advances to/from other funds”
(i.e., the noncurrent portion of interfund loans). All other outstanding balances
between funds are reported as “due to/from other funds.”
2. DEPOSITS AND INVESTMENTS
ILCS and the District’s investment policy authorizes the District to make deposits/invest in
insured commercial banks, savings and loan institutions, obligations of the U.S. Treasury
and U.S. agencies, insured credit union shares, money market mutual funds with portfolios
of securities issued or guaranteed by the United States or agreements to repurchase these
same obligations, repurchase agreements, short-term commercial paper rated within the
three highest classifications by at least two standard rating services and Illinois Funds.
Illinois Funds is an investment pool managed by the State of Illinois, Office of the
Treasurer, which allows governments within the state to pool their funds for investment
purposes. Illinois Funds is not registered with the SEC as an investment company, but
does operate in a manner consistent with Rule 2a7 of the Investment Company Act of
1940. Investments in Illinois Funds are valued at Illinois Funds’ share price, which is the
price for which the investment could be sold.
It is the policy of the District to invest its funds in a manner which will provide the highest
investment return with the maximum security while meeting the daily cash flow demands
of the District and conforming to all state and local statutes governing the investment of
public funds, using the “prudent person” standard for managing the overall portfolio. The
primary objective of the policy is safety (preservation of capital and protection of
investment principal), liquidity and yield.
- 22 -

PARK DISTRICT OF FRANKLIN PARK
FRANKLIN PARK, ILLINOIS
NOTES TO FINANCIAL STATEMENTS (Continued)
- 23 -
2. DEPOSITS AND INVESTMENTS (Continued)
Deposits
Custodial credit risk for deposits with financial institutions is the risk that in the event of a
bank’s failure, the District’s deposits may not be returned to it. The District’s investment
policy requires pledging of collateral with a fair value of 110% of all bank balances in
excess of federal depository insurance with the collateral held by an agent of the District in
the District’s name.
Investments
In accordance with its investment policy, the District limits its exposure to interest rate risk
by structuring the portfolio to provide liquidity for operating funds and maximizing yields
for funds not needed within a three-year period. The investment policy limits the
maximum maturity length of investments for nonreserve funds to three years from date of
purchase. Investments in reserve funds may be purchased with maturities to match future
projects or liability requirements; however, any maturities greater than four years must be
approved in advance by the Board of Commissioners. In addition, the policy requires the
District to structure the investment portfolio so that securities mature to meet cash
requirements for ongoing operations, prohibiting selling securities on the open market prior
to maturity.
The District limits its exposure to credit risk, the risk that the issuer of a debt security will
not pay its par value upon maturity, by primarily investing in obligations guaranteed by the
U.S. Government or securities issued by agencies of the U.S. Government that are
explicitly or implicitly guaranteed by the U.S. Government. The money market mutual
fund is not rated.
Custodial credit risk for investments is the risk that, in the event of the failure of the
counterparty to the investment, the District will not be able to recover the value of its
investments that are in possession of an outside party. To limit its exposure, the District’s
investment policy requires all security transactions that are exposed to custodial credit risk
to be processed on a delivery versus payment (DVP) basis with the underlying investments
held by a third party acting as the District’s agent separate from where the investment was
purchased or by the trust department of the bank where purchased, in the District’s name.
Concentration of credit risk - The District’s investment policy requires diversification but
does not contain specific diversification targets or limits.
The District’s investment policy specifically prohibits the use of or the investment in
derivatives.
- 23 -

PARK DISTRICT OF FRANKLIN PARK
FRANKLIN PARK, ILLINOIS
NOTES TO FINANCIAL STATEMENTS (Continued)
- 24 -
3. PROPERTY TAX CALENDAR The following information gives significant dates on the property tax calendar of the
District. - The property tax lien date is January 1. - The annual tax levy ordinance for 2011 was passed December 20, 2011. - Property taxes are due to the County Collector in two installments, March 1 and
September 1. - Property taxes for 2011 are normally received monthly beginning in March and
generally ending by November 2012. The 2012 tax levy, which attached as an enforceable lien on property as of January 1, 2012,
has not been recorded as a receivable as of April 30, 2012 as the tax has not yet been levied by the District and will not be levied until December 2012 and, therefore, the levy is not measurable at April 30, 2012.
4. CAPITAL ASSETS Capital asset activity for the year ended April 30, 2012 was as follows:
Beginning Balances
Increases
Decreases
Ending Balances
GOVERNMENTAL ACTIVITIES Capital assets not being depreciated Land $ 5,127,806 $ - $ - $ 5,127,806 Construction in progress 7,288 30,445 (7,288) 30,445
Total capital assets not being depreciated 5,135,094 30,445 (7,288) 5,158,251
Capital assets being depreciated Land improvements 5,160,930 239,402 (5,750) 5,394,582 Buildings 5,492,289 - - 5,492,289 Motor vehicles 218,071 30,334 - 248,405 Equipment 1,438,410 13,984 (3,000) 1,449,394
Total capital assets being depreciated 12,309,700 283,720 (8,750) 12,584,670
Less accumulated depreciation for Land improvements 649,549 104,123 - 753,672 Buildings 2,898,936 213,507 - 3,112,443 Motor vehicles 203,712 2,282 - 205,994 Equipment 1,084,162 60,691 (1,525) 1,143,328
Total accumulated depreciation 4,836,359 380,603 (1,525) 5,215,437
Total capital assets being depreciated, net 7,473,341 (96,883) (7,225) 7,369,233
GOVERNMENTAL ACTIVITIES CAPITAL ASSETS, NET $ 12,608,435 $ (66,438) $ (14,513) $ 12,527,484
- 24 -

PARK DISTRICT OF FRANKLIN PARK
FRANKLIN PARK, ILLINOIS
NOTES TO FINANCIAL STATEMENTS (Continued)
- 25 -
4. CAPITAL ASSETS (Continued)
Beginning
Balances
Increases
Decreases
Ending
Balances
BUSINESS-TYPE ACTIVITIES
Capital assets not being depreciated
Land $ 222,559 $ - $ - $ 222,559
Construction in progress 28,990 - (8,755) 20,235
Total capital assets not being depreciated 251,549 - (8,755) 242,794
Capital assets being depreciated
Land improvements 550,670 - - 550,670
Buildings 1,413,232 24,000 - 1,437,231
Maintenance equipment 180,175 31,211 (8,065) 203,322
Total capital assets being depreciated 2,144,077 55,211 (8,065) 2,191,223
Less accumulated depreciation for
Land improvements 85,839 18,161 - 104,000
Buildings 978,158 30,521 - 1,008,679
Maintenance equipment 125,336 8,250 (1,882) 131,704
Total accumulated depreciation 1,189,333 56,932 (1,882) 1,244,383
Total capital assets being depreciated, net 954,744 (1,721) (6,183) 946,840
BUSINESS-TYPE ACTIVITIES
CAPITAL ASSETS, NET $ 1,206,293 $ (1,721) $ (14,938) $ 1,189,634
Depreciation expense was charged to functions/programs of the primary government as
follows:
GOVERNMENTAL ACTIVITIES
General government $ 180,949
Culture and recreation 199,654
TOTAL DEPRECIATION EXPENSE - GOVERNMENTAL ACTIVITIES $ 380,603
- 25 -

PARK DISTRICT OF FRANKLIN PARK
FRANKLIN PARK, ILLINOIS
NOTES TO FINANCIAL STATEMENTS (Continued)
- 26 -
5. LONG-TERM DEBT
The following is a summary of changes in long-term debt of the District for the year ended
April 30, 2012:
Beginning
Balances
Additions
Reductions
Ending
Balances
Current
Portion
Long-term
Portion
GOVERNMENTAL
ACTIVITIES
General obligation bonds $ 885,000 $ 905,000 $ 885,000 $ 905,000 $ 905,000 $ -
Bond premium 4,142 - 4,142 - - -
Compensated absences 30,462 5,745 - 36,207 3,621 32,586
TOTAL
GOVERNMENTAL
ACTIVITIES
$ 919,604
$ 910,745
$ 889,142
$ 941,207
$ 908,621
$ 32,586
BUSINESS-TYPE
ACTIVITIES
Compensated absences $ 24,083 $ 3,231 $ - $ 27,314 $ 2,731 $ 24,583
Compensated absences are typically liquidated by the General and Recreation Funds.
Long-term debt at April 30, 2012 is comprised of the following individual bond issues:
General Obligations Bonds
$905,000 General Obligation Limited Tax Park Bonds, Series 2011
dated November 9, 2011 due in one principal installment of
$905,000 on November 1, 2012 with interest at 2.00%. $ 905,000
TOTAL GENERAL OBLIGATION BONDS $ 905,000
The annual requirements to amortize to maturity serial debt outstanding as of April 30,
2012 are as follows:
Year
Ending
General Obligation Series Bonds
April 30, Principal Interest
2013 $ 905,000 $ 17,698
TOTAL $ 905,000 $ 17,698
- 26 -

PARK DISTRICT OF FRANKLIN PARK
FRANKLIN PARK, ILLINOIS
NOTES TO FINANCIAL STATEMENTS (Continued)
- 27 -
6. INSURANCE
The District is exposed to various risks related to torts; theft of, damage to and destruction
of assets; errors and omissions; employee health; injuries to employees; and net income
losses. Employee health is covered by commercial insurance purchased from independent
third parties. For all insured programs, settlement amounts have not exceeded insurance
coverage for the current or two prior years. Since June 5, 2001, the District has been a
member of the Park District Risk Management Agency (PDRMA) Property/Casualty
Program, a joint risk management pool of park and forest preserve districts and special
recreation associations through which property, general liability, automobile liability,
crime, boiler and machinery, public officials’, employment practices liability and workers’
compensation coverage is provided in excess of specified limits for the members, acting as
a single insurable unit. The following table is a summary of the property/casualty coverage
in effect for the period January 1, 2012 through January 1, 2013.
Coverage
Member
Deductible
PDRMA
Self-
Insured
Retention
Limits
Insurance
Company
Policy
Number
1. Property
Property/bldg contents
Per occurrence $ 1,000 $ 1,000,000 $1,000,000,000/all members PDRMA P070110
Annual aggregate $ 3,000,000 Declaration 11 Reinsurers:
Flood/except zones A,V $ 1,000 $ 100,000 $250,000,000/occurrence/
annual aggregate
Various
Reinsurers
Flood, zones A,V $ 1,000 $ 250,000 $200,000,000/occurrence/
annual aggregate
Through the
Public Entity
Earthquake shock $ 1,000 $ 100,000 $100,000,000/occurrence/
annual aggregate
Property
Reinsurance
Program (PEPIP)
Multiple
Auto physical damage
Comprehensive and
collision $ 1,000 $ 1,000,000 Included
Course of construction/
builders risk
$ 1,000 Included $25,000,000
Business interruption,
rental income, tax
income combined
$ 1,000 N/A $100,000,000/reported values
$500,000/$2,500,000/non-
reported values
Service interruption 24 hours N/A $10,000,000
other sub-limits apply, refer
to coverage document
Boiler and machinery
Property damage $ 1,000 $ 9,000 $100,000,000 equip.
breakdown property damage -
included
Travelers
Indemnity Co. of
Illinois
BME10525L478
Business income 48 hours N/A Included
other sub-limits apply, refer
to coverage document
Fidelity/crime $ 1,000 $ 24,000 $2,000,000 National Union 01-423-88-11
Seasonal employees $ 1,000 $ 9,000 $1,000,000 Fire Insurance
Blanket bond $ 1,000 $ 24,000 $2,000,000 Co.
- 27 -

PARK DISTRICT OF FRANKLIN PARK
FRANKLIN PARK, ILLINOIS
NOTES TO FINANCIAL STATEMENTS (Continued)
- 28 -
6. INSURANCE (Continued)
Coverage
Member Deductible
PDRMA Self-
Insured Retention
Limits
Insurance Company
Policy Number
2. Workers’ compensation N/A $ 500,000 Statutory PDRMA WC01012 Employer’s liability $ 500,000 $3,500,000 employers Government GEM-0003- Liability Entities Mutual, A11001 Safety National SP-4043456 Casualty Corp. 3. Liability General liability None $ 500,000 $21,500,000/occurrence/
annual aggregate PDRMA L010111
Auto liability None Included Included Reinsurers: GEM-0003- Employment practices None Included $21,500,000/occurrence/
annual aggregate Government Entities Mutual,
A11001
None Included Markel, Public officials’ liability Law enforcement
liability None
Included
Included
Star Indemnity and Liability Co.
8090010
Uninsured/underinsured motorists
None Included $1,000,000/occurrence
4. Pollution liability Liability - third party None $ 25,000 $5,000,000/occurrence XL Environmental PEC 2535804 Property - first party $ 1,000 $ 24,000 $10,000,000 general
aggregate Insurance
5. Outbreak Expense 24 hours N/A $15,000 per day
$450,000 per location $1 million aggregate policy limit
Markel
6. Volunteer Medical
Accident None $ 5,000 $5,000 medical expense and
AD&D excess of any other collectible insurance
Self-insured
7. Underground Storage
Tank Liability None N/A $10,000, follows Illinois
Leaking Underground Tank Fund
Self-insured
8. Unemployment
Compensation N/A N/A Statutory Self-insured
Losses exceeding the per-occurrence self-insured and reinsurance limit would be the
responsibility of the District. The District is not aware of any additional amounts owed to PDRMA at April 30, 2012.
As a member of PDRMA’s Property/Casualty Program, the District is represented on the
Property/Casualty Program Council and the Membership Assembly and is entitled to one vote on each. The relationship between the District and PDRMA is governed by a contract and bylaws that have been adopted by resolution of the District’s governing body. The District is contractually obligated to make all annual and supplementary contributions to PDRMA, to report claims on a timely basis, cooperate with PDRMA, its claims administrator and attorneys in claims investigation and settlement, and to follow risk management procedures as outlined by PDRMA.
- 28 -

PARK DISTRICT OF FRANKLIN PARK
FRANKLIN PARK, ILLINOIS
NOTES TO FINANCIAL STATEMENTS (Continued)
- 29 -
6. INSURANCE (Continued) Members have a contractual obligation to fund any deficit of PDRMA attributable to a
membership year during which they were a member. PDRMA is responsible for administering the self-insurance program and purchasing excess insurance according to the direction of the Program Council. PDRMA also provides its members with risk management services, including the defense of and settlement of claims, and establishes reasonable and necessary loss reduction and prevention procedures to be followed by the members.
7. RETIREMENT FUND COMMITMENTS Illinois Municipal Retirement Fund The District’s defined benefit pension plan, Illinois Municipal Retirement Fund (IMRF),
provides retirement, disability, annual cost of living adjustments and death benefits to plan members and beneficiaries. IMRF is an agent multiple-employer pension plan that acts as a common investment and administrative agent for local governments and school districts in Illinois. The Illinois Pension Code establishes the benefit provisions of the plan that can only be amended by the Illinois General Assembly. IMRF issues a publicly available financial report that includes financial statements and required supplementary information for the plan as a whole but not by individual employer. That report may be obtained by writing to the Illinois Municipal Retirement Fund, 2211 York Road, Suite 500, Oak Brook, Illinois 60523.
All employees hired in positions that meet or exceed the prescribed annual hourly standard
must be enrolled in IMRF as participating members. Pension benefits vest after eight years of service. Participating members who retire at or after age 60 with eight years of credited service are entitled to an annual retirement benefit, payable monthly for life, in an amount equal to 1 2/3% of their final rate of earnings, for each year of credited service up to 15 years, and 2% for each year thereafter. IMRF also provides death and disability benefits. These benefit provisions and all other requirements are established by state statute.
Employees hired on or after January 1, 2011, are eligible for Tier 2 benefits. For Tier 2
employees, pension benefits vest after ten years of service. Participating members who retire at age 62 (reduced benefits) or after age 67 (full benefits) with ten years of credited service are entitled to an annual retirement benefit, payable monthly for life, in an amount equal to 1 2/3% of their final rate of earnings, for each year of credited service up to 15 years, and 2% for each year thereafter.
Employees participating in the IMRF are required to contribute 4.5% of their annual
covered salary. The member rate is established by state statute. The District is required to contribute at an actuarially determined rate. The employer rate for calendar year 2011 and 2012 was 10.60% and 10.14% of payroll, respectively. The employer contribution requirements are established and may be amended by the IMRF Board of Trustees.
- 29 -

PARK DISTRICT OF FRANKLIN PARK
FRANKLIN PARK, ILLINOIS
NOTES TO FINANCIAL STATEMENTS (Continued)
- 30 -
7. RETIREMENT FUND COMMITMENTS (Continued)
Illinois Municipal Retirement Fund (Continued)
For the fiscal year April 30, 2012, the District’s annual pension cost of $118,173 was equal
to the District’s required and actual contributions. The required contribution was
determined as part of the December 31, 2009 actuarial valuation using the entry-age
actuarial cost method. The actuarial assumptions at December 31, 2008 included (a) 7.50
percent investment rate of return (net of administrative and direct investment expenses), (b)
projected salary increases of 4.00% a year, attributable to inflation, (c) additional projected
salary increases ranging from 0.4% to 10% per year annually and (d) post retirement
benefit increases of 3.00% annually. The actuarial value of the employer regular plan
assets was determined using techniques that spread the effects of short term volatility in the
market value of investments over a five year period with a 20% corridor between the
actuarial and market value of assets. The employer regular plan’s unfunded actuarial
accrued liability is being amortized as a level percentage of projected payroll on an open
basis. The remaining amortization period at December 31, 2011 was 30 years.
Employer annual pension cost (APC), actual contributions and the net pension obligation
(NPO) are as follows. The NPO is the cumulative difference between the APC and the
contributions actually made.
For
Fiscal
Year
Annual
Pension
Cost
(APC)
Percentage
of APC
Contributed
Net
Pension
Obligation
2010 $ 74,805 100.00% $ -
2011 115,852 100.00% -
2012 118,173 100.00% -
The funded status of the plan as of December 31, 2011, based on the actuarial valuation, is
the same actuarial assumptions used to determine the employer annual pension costs of the
plan as disclosed above.
Actuarial accrued liability (AAL) $ 3,590,409
Actuarial value of plan assets 2,983,147
Unfunded actuarial accrued liability (UAAL) 607,262
Funded ratio (actuarial value of plan assets/AAL) 83.09%
Covered payroll (active plan members) $ 1,165,416
UAAL as a percentage of covered payroll 52.11%
- 30 -

PARK DISTRICT OF FRANKLIN PARK
FRANKLIN PARK, ILLINOIS
NOTES TO FINANCIAL STATEMENTS (Continued)
- 31 -
7. RETIREMENT FUND COMMITMENTS (Continued) Illinois Municipal Retirement Fund (Continued) See the schedule of funding progress in the required supplementary information
immediately following the notes to financial statements for additional information related to the funded status of the plan.
8. INDIVIDUAL FUND DISCLOSURES Interfund Transfers Individual fund interfund transfers are as follows:
Transfers
In Transfers
Out
Ice Arena Fund $ 93,756 $ - Nonmajor Governmental Funds - 93,756
TOTAL $ 93,756 $ 93,756
The purpose of significant transfers is as follows:
$93,756 transferred to the Ice Arena Fund from the Municipal Retirement Fund $(44,187) and the Social Security Fund $(49,569) is to pay the IMRF and FICA expenses incurred by the Ice Arena Fund. The transfer will not be repaid.
9. CONTINGENT LIABILITIES a. Litigation The District is a defendant in various lawsuits. Although the outcome of these
lawsuits is not presently determinable, in the opinion of the District’s attorney, the resolution of these matters will not have a material adverse effect on the financial condition of the District.
b. Grants Amounts received or receivable from grantor agencies are subject to audit and
adjustment by grantor agencies, principally the federal government. Any disallowed claims, including amounts already collected, may constitute a liability of the applicable funds. The amount, if any, of expenditures that may be disallowed by the grantor cannot be determined at this time although the District expects such amounts, if any, to be immaterial.
- 31 -

PARK DISTRICT OF FRANKLIN PARK
FRANKLIN PARK, ILLINOIS
NOTES TO FINANCIAL STATEMENTS (Continued)
- 32 -
10. OTHER POSTEMPLOYMENT BENEFITS
The District has evaluated its potential other postemployment benefits liability. The
District provides continued health insurance coverage at the active employer rate to all
eligible employees in accordance with Illinois statues, which creates an implicit subsidy of
retiree health insurance. Former employees who choose to retain their rights to health
insurance through the District are required to pay 100% of the current premium. However,
no former employees have chosen to stay in the District’s health insurance plan. Therefore,
there has been 0% utilization and, therefore, no implicit subsidy to calculate in accordance
with GASB Statement No. 45, Accounting and Financial Reporting by Employers for
Postemployment Benefits Other Than Pensions. Additionally, the District had no former
employees for which the District was providing an explicit subsidy and no current
employees with agreements for future explicit subsidies upon retirement. Therefore, the
District has not recorded any postemployment benefit liability as of April 30, 2012.
- 32 -

REQUIRED SUPPLEMENTARY INFORMATION

Variance
Original Final Over
Budget Budget Actual (Under)
REVENUES
Taxes 1,001,000$ 1,001,000$ 1,128,026$ 127,026$
Charges for services 375,420 375,420 273,523 (101,897)
Intergovernmental - - 10,478 10,478
Investment income 750 750 1,898 1,148
Miscellaneous 1,750 1,750 2,808 1,058
Total revenues 1,378,920 1,378,920 1,416,733 37,813
EXPENDITURES
Current
General government
Administration 532,953 532,953 509,135 (23,818)
Corporate parks 466,330 466,330 386,189 (80,141)
Culture and recreation
Centre at North Park 299,920 299,920 284,181 (15,739)
Capital outlay 3,000 3,000 2,757 (243)
Total expenditures 1,302,203 1,302,203 1,182,262 (119,941)
EXCESS (DEFICIENCY) OF REVENUES
OVER EXPENDITURES 76,717 76,717 234,471 157,754
OTHER FINANCING SOURCES (USES)
Transfers in 466,330 466,330 - (466,330)
Transfers (out) (655,115) (655,115) - 655,115
Total other financing sources (uses) (188,785) (188,785) - 188,785
NET CHANGE IN FUND BALANCE (112,068)$ (112,068)$ 234,471 346,539$
FUND BALANCE, MAY 1 2,315,915
FUND BALANCE, APRIL 30 2,550,386$
GENERAL (CORPORATE) FUND
For the Year Ended April 30, 2012
PARK DISTRICT OF FRANKLIN PARK
FRANKLIN PARK, ILLINOIS
SCHEDULE OF REVENUES, EXPENDITURES AND
CHANGES IN FUND BALANCES - BUDGET AND ACTUAL
(See independent auditor's report.)- 33 -

PARK DISTRICT OF FRANKLIN PARK
FRANKLIN PARK, ILLINOIS
Variance
Original Final Over
Budget Budget Actual (Under)
REVENUES
Taxes 460,000$ 460,000$ 495,014$ 35,014$
Charges for services
Program revenue 343,385 343,385 395,164 51,779
Pool revenue 141,095 141,095 155,776 14,681
Rentals 35,000 35,000 32,368 (2,632)
Concession/vending 1,000 1,000 1,034 34
Investment income 100 100 85 (15)
Miscellaneous 500 500 57 (443)
Total revenues 981,080 981,080 1,079,498 98,418
EXPENDITURES
Current
Culture and recreation
Recreation department 651,870 651,870 667,150 15,280
Pool 155,295 155,295 172,255 16,960
Total expenditures 807,165 807,165 839,405 32,240
EXCESS (DEFICIENCY) OF REVENUES
OVER EXPENDITURES 173,915 173,915 240,093 66,178
OTHER FINANCING SOURCES (USES)
Transfers (out) (14,200) (14,200) - 14,200
Total other financing sources (uses) (14,200) (14,200) - 14,200
NET CHANGE IN FUND BALANCE 159,715$ 159,715$ 240,093 80,378$
FUND BALANCE, MAY 1 550,071
FUND BALANCE, APRIL 30 790,164$
SCHEDULE OF REVENUES, EXPENDITURES AND
CHANGES IN FUND BALANCE - BUDGET AND ACTUAL
RECREATION FUND
For the Year Ended April 30, 2012
(See independent auditor's report.)- 34 -

PARK DISTRICT OF FRANKLIN PARK
FRANKLIN PARK, ILLINOIS
Annual
Required
Fiscal Employer Contribution Percentage
Year Contributions (ARC) Contributed
2007 60,835$ 60,835$ 100.00%
2008 67,140 67,140 100.00%
2009 60,075 60,075 100.00%
2010 74,805 74,805 100.00%
2011 115,852 115,852 100.00%
2012 118,173 118,173 100.00%
April 30, 2012
SCHEDULE OF EMPLOYER CONTRIBUTIONS
ILLINOIS MUNICIPAL RETIREMENT FUND
(See independent auditor's report.)- 35 -
PARK DISTRICT OF FRANKLIN PARK
FRANKLIN PARK, ILLINOIS
(4) UAAL
(2) Unfunded (OAAL)
Actuarial (Overfunded) as a
Actuarial (1) Accrued (3) AAL Percentage
Valuation Actuarial Liability Funded (UAAL) (5) of Covered
Date Value of (AAL) Ratio (OAAL) Covered Payroll
December 31, Assets Entry-Age (1) / (2) (2) - (1) Payroll (4) / (5)
2006 2,810,140$ 2,458,862$ 114.29% (351,278)$ 1,024,733$ (34.28%)
2007 2,992,872 2,529,430 118.32% (463,442) 1,065,411 (43.50%)
2008 2,357,443 2,750,964 85.70% 393,521 1,050,700 37.45%
2009 2,527,108 2,894,203 87.32% 367,095 1,074,680 34.16%
2010 2,785,755 3,225,839 86.36% 440,084 1,085,094 40.56%
2011 2,983,147 3,590,409 83.09% 607,262 1,165,416 52.11%
April 30, 2012
SCHEDULE OF FUNDING PROGRESS
ILLINOIS MUNICIPAL RETIREMENT FUND
(See independent auditor's report.)- 36 -

- 37 -
PARK DISTRICT OF FRANKLIN PARK
FRANKLIN PARK, ILLINOIS
NOTES TO REQUIRED SUPPLEMENTARY INFORMATION
April 30, 2012
BUDGETS AND BUDGETARY ACCOUNTING
a. The District follows these procedures in establishing the budgetary data reflected in the
financial statements.
1. In June 2011, the Director submitted to the Board of Commissioners a proposed
operating budget and appropriation for the fiscal year covering the period May 1,
2011 through April 30, 2012. The operating budget included proposed expenditures
and the means of financing them.
2. A public budget work session was conducted at a public meeting to obtain taxpayer
comments.
3. On June 14, 2011, the operating budget was adopted through passage of a resolution
by the Board of Commissioners. On July 26, 2011, the appropriation was adopted
via ordinance by the Board of Commissioners.
4. Once adopted, the Board of Commissioners can make transfers between objects
within any fund up to 10% of the total budget of that fund. However, any revisions
that alter the total disbursements of any fund must be approved by the Board of
Commissioners after a public hearing. Management can make transfers between line
items within a fund, if the fund total is not altered.
5. Formal budgetary integration is employed as a management control device during
the year for the General, Special Revenue, Debt Service and Capital Projects Funds.
The Ice Arena is appropriated as part of the Recreation Fund. The legal level of
budgetary control is the fund level.
6. Budgets are adopted on a basis consistent with generally accepted accounting
principles. The financial statements present the operating budget of the District.
7. All budget authority lapses at the end of the year. Supplemental appropriations were
adopted during the current fiscal year.
- 37 -

PARK DISTRICT OF FRANKLIN PARK
FRANKLIN PARK, ILLINOIS
NOTES TO REQUIRED SUPPLEMENTARY INFORMATION (Continued)
- 38 -
BUDGETS AND BUDGETARY ACCOUNTING (Continued)
b. Excesses of Expenditures/Expenses over Operating Budget
The following individual fund expenditures/expenses exceeded the operating budget and/or
the appropriation in the following amounts, exclusive of depreciation:
Expenditures/
Expenses
Operating
Budget
Appropriation
Municipal Retirement $ 76,539 $ 75,000 $ 140,000
Social Security 86,692 84,500 147,840
Audit 19,493 19,373 21,698
Special Recreation 174,142 168,000 187,163
Recreation 839,405 807,165 901,308
General Debt Service 902,963 903,620 903,620
2011 Capital Projects 67,686 - 1,840,875
*Amount appropriated for both capital project funds combined
- 38 -

COMBINING AND INDIVIDUAL FUND
FINANCIAL STATEMENTS

MAJOR GOVERNMENTAL FUNDS

PARK DISTRICT OF FRANKLIN PARK
FRANKLIN PARK, ILLINOIS
COMBINING BALANCE SHEET
GENERAL (CORPORATE) FUND BY SUBFUND
April 30, 2012
Public
General Corporate Liability
(Corporate) North Park Parks Insurance Total
Cash and investments 2,287,717$ 284,252$ 32,019$ 24,133$ 2,628,121$
Receivables (net, where applicable, of
allowances for uncollectibles)
Property taxes 518,587 - - 554 519,141
Other 4,591 5,815 (150) - 10,256
Inventory - 5,583 1,821 - 7,404
Prepaid items 2,028 2,153 2,405 - 6,586
TOTAL ASSETS 2,812,923$ 297,803$ 36,095$ 24,687$ 3,171,508$
LIABILITIES
Accounts payable 32,076$ 6,525$ 9,523$ 1,299$ 49,423$
Accrued payroll 5,042 4,254 8,592 1,524 19,412
Deposits payable - 33,146 - - 33,146
Deferred property tax revenue 518,587 - - 554 519,141
Total liabilities 555,705 43,925 18,115 3,377 621,122
FUND BALANCES
Nonspendable
Prepaid items 2,028 2,153 2,405 - 6,586
Inventory - 5,583 1,821 - 7,404
Restricted for liability insurance - - - 21,310 21,310
Unrestricted
Unassigned 2,255,190 246,142 13,754 - 2,515,086
Total fund balances 2,257,218 253,878 17,980 21,310 2,550,386
TOTAL LIABILITIES AND
FUND BALANCES 2,812,923$ 297,803$ 36,095$ 24,687$ 3,171,508$
ASSETS
LIABILITIES AND
FUND BALANCES
(See independent auditor's report.)- 39 -

Variance Variance
Final Over Final Over
Budget Actual (Under) Budget Actual (Under)
REVENUES
Property taxes
Current 750,000$ 878,342$ 128,342$ -$ -$ -$
Prior years - (5,582) (5,582) - - -
Replacement taxes 250,000 257,409 7,409 - - -
Total taxes 1,000,000 1,130,169 130,169 - - -
Charges for services
Centre at North Park
Program revenue - aerobics - - - 22,000 34 (21,966)
Program revenue - fitness - - - - 5,782 5,782
Program revenue - facility rentals - - - - 10,225 10,225
Vending - - - 4,000 1,661 (2,339)
Rentals - - - 346,920 254,308 (92,612)
Snack shack food resale - - - 500 466 (34)
Miscellaneous - - - 2,000 1,047 (953)
Total charges for services - - - 375,420 273,523 (101,897)
Intergovernmental - - - - - -
Investment income 250 1,884 1,634 - - -
Miscellaneous 1,750 2,808 - - - -
Total revenues 1,002,000 1,134,861 131,803 375,420 273,523 (101,897)
EXPENDITURES
Current
General government
Administration
Salaries 194,104 204,129 10,025 - - -
Benefits 45,500 41,057 (4,443) - - -
Contractual services 53,500 46,955 (6,545) - - -
Communications 17,000 14,059 (2,941) - - -
Professional development 16,500 24,374 7,874 - - -
General supplies 5,000 5,921 921 - - -
Other expenditures 3,500 4,964 1,464 - - -
Total administration 335,104 341,459 6,355 - - -
Corporate parks
Salaries - - - - - -
Benefits - - - - - -
Contractual services - - - - - -
Communications - - - - - -
Professional development - - - - - -
Service charges - - - - - -
Maintenance supplies - - - - - -
General supplies - - - - - -
Total corporate parks - - - - - -
Total general government 335,104 341,459 6,355 - - -
For the Year Ended April 30, 2012
General (Corporate) North Park
PARK DISTRICT OF FRANKLIN PARK
FRANKLIN PARK, ILLINOIS
COMBINING SCHEDULE OF REVENUES, EXPENDITURES AND
CHANGES IN FUND BALANCES - BUDGET AND ACTUAL
GENERAL (CORPORATE) FUND BY SUBFUND
(This schedule is continued on the following pages.)- 40 -
Variance Variance Variance
Final Over Final Over Final Over
Budget Actual (Under) Budget Actual (Under) Eliminations Budget Actual (Under)
-$ -$ -$ 1,000$ 1,212$ 212$ -$ 751,000$ 879,554$ 128,554$
- - - - (3,355) (3,355) - - (8,937) (8,937)
- - - - - - - 250,000 257,409 7,409
- - - 1,000 (2,143) (3,143) - 1,001,000 1,128,026 127,026
- - - - - - - 22,000 34 (21,966)
- - - - - - - - 5,782 5,782
- - - - - - - - 10,225 10,225
- - - - - - - 4,000 1,661 (2,339)
- - - - - - - 346,920 254,308 (92,612)
- - - - - - - 500 466 (34)
- - - - - - - 2,000 1,047 (953)
- - - - - - - 375,420 273,523 (101,897)
- 10,478 10,478 - - - - - 10,478 10,478
- - - 500 14 (486) - 750 1,898 1,148
- - - - - - - 1,750 2,808 1,058
- 10,478 10,478 1,500 (2,129) (3,629) - 1,378,920 1,416,733 37,813
- - - 70,699 66,320 (4,379) - 264,803 270,449 5,646
- - - 47,650 34,908 (12,742) - 93,150 75,965 (17,185)
- - - 66,500 57,315 (9,185) - 120,000 104,270 (15,730)
- - - - - - - 17,000 14,059 (2,941)
- - - 12,000 8,363 (3,637) - 28,500 32,737 4,237
- - - - - - - 5,000 5,921 921
- - - 1,000 770 (230) - 4,500 5,734 1,234
- - - 197,849 167,676 (30,173) - 532,953 509,135 (23,818)
242,659 216,265 (26,394) - - - - 242,659 216,265 (26,394)
43,931 21,993 (21,938) - - - - 43,931 21,993 (21,938)
59,450 50,478 (8,972) - - - - 59,450 50,478 (8,972)
4,500 4,540 40 - - - - 4,500 4,540 40
2,770 975 (1,795) - - - - 2,770 975 (1,795)
29,950 19,783 (10,167) - - - - 29,950 19,783 (10,167)
50,520 38,799 (11,721) - - - - 50,520 38,799 (11,721)
32,550 33,356 806 - - - - 32,550 33,356 806
466,330 386,189 (80,141) - - - - 466,330 386,189 (80,141)
466,330 386,189 (80,141) 197,849 167,676 (30,173) - 999,283 895,324 (103,959)
Public Liability InsuranceCorporate Parks Total
(This schedule is continued on the following pages.)- 41 -

Variance Variance
Final Over Final Over
Budget Actual (Under) Budget Actual (Under)
EXPENDITURES (Continued)
Current (Continued)
Culture and recreation
Centre at North Park
Salaries -$ -$ -$ 140,020$ 141,773$ 1,753$
Benefits - - - 7,000 5,753 (1,247)
Contractual services - - - 14,250 12,496 (1,754)
Communications - - - 8,400 10,131 1,731
Professional development - - - 750 178 (572)
Service charges - - - 45,800 40,997 (4,803)
Maintenance supplies - - - 3,000 1,268 (1,732)
General supplies - - - 68,700 60,730 (7,970)
Other expenditures - - - 12,000 10,855 (1,145)
Total Centre at North Park - - - 299,920 284,181 (15,739)
Total culture and recreation - - - 299,920 284,181 (15,739)
Capital outlay 3,000 2,757 (243) - - -
Total expenditures 338,104 344,216 6,112 299,920 284,181 (15,739)
EXCESS (DEFICIENCY) OF REVENUES
OVER EXPENDITURES 663,896 790,645 125,691 75,500 (10,658) (86,158)
OTHER FINANCING SOURCES (USES)
Transfers in - - - - - -
Transfers (out) (655,115) (375,672) 279,443 - - -
Total other financing sources (uses) (655,115) (375,672) 279,443 - - -
NET CHANGE IN FUND BALANCES 8,781$ 414,973 405,134$ 75,500$ (10,658) (86,158)$
FUND BALANCES, MAY 1 1,842,245 264,536
FUND BALANCES, APRIL 30 2,257,218$ 253,878$
PARK DISTRICT OF FRANKLIN PARK
General (Corporate) North Park
FRANKLIN PARK, ILLINOIS
COMBINING SCHEDULE OF REVENUES, EXPENDITURES AND
CHANGES IN FUND BALANCES - BUDGET AND ACTUAL (Continued)
GENERAL (CORPORATE) FUND BY SUBFUND
For the Year Ended April 30, 2012
(This schedule is continued on the following page.)- 42 -

Variance Variance Variance
Final Over Final Over Final Over
Budget Actual (Under) Budget Actual (Under) Eliminations Budget Actual (Under)
-$ -$ -$ -$ -$ -$ -$ 140,020$ 141,773$ 1,753$
- - - - - - - 7,000 5,753 (1,247)
- - - - - - - 14,250 12,496 (1,754)
- - - - - - - 8,400 10,131 1,731
- - - - - - - 750 178 (572)
- - - - - - - 45,800 40,997 (4,803)
- - - - - - - 3,000 1,268 (1,732)
- - - - - - - 68,700 60,730 (7,970)
- - - - - - - 12,000 10,855 (1,145)
- - - - - - - 299,920 284,181 (15,739)
- - - - - - - 299,920 284,181 (15,739)
- - - - - - - 3,000 2,757 (243)
466,330 386,189 (80,141) 197,849 167,676 (30,173) - 1,302,203 1,182,262 (119,941)
(466,330) (375,711) 90,619 (196,349) (169,805) 26,544 - 76,717 234,471 157,754
466,330 375,672 (90,658) - - - (375,672) 466,330 - (466,330)
- - - - - - 375,672 (655,115) - 655,115
466,330 375,672 (90,658) - - - - (188,785) - 188,785
-$ (39) (39)$ (196,349)$ (169,805) 26,544$ -$ (112,068)$ 234,471 346,539$
18,019 191,115 2,315,915
17,980$ 21,310$ 2,550,386$
Corporate Parks Public Liability Insurance Total
(See independent auditor's report.)- 43 -

Variance
Final Over
Budget Actual (Under)
EXPENDITURES
Current
General government
Administration
Salaries
Director of Parks and Recreation 70,968$ 71,597$ 629$
Superintendent of Finance and Technology 27,147 28,026 879
Human Resource Manager 34,329 36,215 1,886
Finance Coordinators 49,660 56,672 7,012
Marketing Coordinator 12,000 11,619 (381)
Total salaries 194,104 204,129 10,025
Benefits
Health insurance 43,000 39,406 (3,594)
Life/dental insurance 1,000 915 (85)
Employee benefit program 1,500 736 (764)
Total benefits 45,500 41,057 (4,443)
Contractual services
Maintenance service equipment 2,000 3,355 1,355
IT - network services 15,000 5,319 (9,681)
Legal 23,000 28,273 5,273
Recruitment 500 500 -
Maintenance agreement 3,000 2,008 (992)
Professional consulting 10,000 7,500 (2,500)
Total contractual services 53,500 46,955 (6,545)
Communications
Postage 2,500 2,676 176
Telephone 8,500 5,955 (2,545)
Printing and brochures 3,000 2,632 (368)
Preprint design and promotion 2,000 2,405 405
Publications and legal notices 1,000 391 (609)
Total communications 17,000 14,059 (2,941)
PARK DISTRICT OF FRANKLIN PARK
FRANKLIN PARK, ILLINOIS
SCHEDULE OF DETAILED EXPENDITURES - BUDGET AND ACTUAL
GENERAL (CORPORATE) FUND
For the Year Ended April 30, 2012
GENERAL (CORPORATE) SUBFUND
(This schedule is continued on the following page.)- 44 -

Variance
Final Over
Budget Actual (Under)
EXPENDITURES (Continued)
Current (Continued)
General government (Continued)
Administration (Continued)
Professional development
Travel 500$ 1,473$ 973$
Employee training 2,500 1,531 (969)
Tuition reimbursement 500 130 (370)
Memberships/subscriptions 10,000 13,256 3,256
Conference/seminar 3,000 7,984 4,984
Total professional development 16,500 24,374 7,874
General supplies
Office supplies 3,500 4,402 902
Application software 1,500 1,519 19
Total general supplies 5,000 5,921 921
Other expenditures
Public relations 1,500 3,473 1,973
Miscellaneous 2,000 1,491 (509)
Total other expenditures 3,500 4,964 1,464
Total administration 335,104 341,459 6,355
Capital outlay 3,000 2,757 (243)
TOTAL EXPENDITURES 338,104$ 344,216$ 6,112$
PARK DISTRICT OF FRANKLIN PARK
FRANKLIN PARK, ILLINOIS
SCHEDULE OF DETAILED EXPENDITURES - BUDGET AND ACTUAL (Continued)
GENERAL (CORPORATE) FUND
GENERAL (CORPORATE) SUBFUND
For the Year Ended April 30, 2012
(See independent auditor's report.)- 45 -

Variance
Final Over
Budget Actual (Under)
EXPENDITURES
Current
Culture and recreation
Centre at North Park
Salaries
Centre Manager 51,300$ 52,761$ 1,461$
Superintendent of Finance 27,120 27,499 379
Centre staff - building 6,000 7,711 1,711
Registrars/secretarial 30,000 30,288 288
Aerobics 8,800 8,948 148
Bar staff 7,500 6,058 (1,442)
Wait staff 9,300 8,508 (792)
Total salaries 140,020 141,773 1,753
Benefits
Health insurance 6,000 4,910 (1,090)
Life/dental insurance 200 165 (35)
Employee benefit program 800 678 (122)
Total benefits 7,000 5,753 (1,247)
Contractual services
Building repairs 6,500 4,851 (1,649)
Maintenance service - equipment 3,000 3,085 85
Equipment repairs 500 - (500)
Carpet cleaning 2,000 2,310 310
Operating licenses 2,250 2,250 -
Total contractual services 14,250 12,496 (1,754)
Communications
Postage 100 - (100)
Telephone 4,800 6,194 1,394
Printing and brochures 2,100 1,966 (134)
Preprint design and production 1,400 1,971 571
Total communications 8,400 10,131 1,731
Professional development
Employee training 450 40 (410)
Tuition Reimbursement - 90 90
Membership/subscriptions 50 48 (2)
Conference/seminar 250 - (250)
Total professional development 750 178 (572)
PARK DISTRICT OF FRANKLIN PARK
FRANKLIN PARK, ILLINOIS
SCHEDULE OF DETAILED EXPENDITURES - BUDGET AND ACTUAL
GENERAL (CORPORATE) FUND
For the Year Ended April 30, 2012
NORTH PARK SUBFUND
(This schedule is continued on the following page.)- 46 -

Variance
Final Over
Budget Actual (Under)
EXPENDITURES (Continued)
Current (Continued)
Culture and recreation (Continued)
Centre at North Park (Continued)
Service charges
Utilities - electric 25,000$ 24,914$ (86)$
Utilities - gas 12,000 8,170 (3,830)
Utilities - water 4,500 2,140 (2,360)
Garbage disposal 3,800 4,787 987
Bank charges 500 986 486
Total service charges 45,800 40,997 (4,803)
Maintenance supplies
Supplies - building 3,000 731 (2,269)
Supplies - banquet/bar - 537 537
Total maintenance supplies 3,000 1,268 (1,732)
General supplies
Supplies - office 200 164 (36)
Supplies - computer 200 - (200)
Supplies - linens 6,000 5,185 (815)
Supplies - food/banquet - 44,737 44,737
Supplies - bar/banquet 62,000 10,450 (51,550)
Supplies - concession 250 194 (56)
Program supplies 50 - (50)
Total general supplies 68,700 60,730 (7,970)
Other expenditures
Sales tax - vending 12,000 10,855 (1,145)
Total other expenditures 12,000 10,855 (1,145)
TOTAL EXPENDITURES 299,920$ 284,181$ (15,739)$
PARK DISTRICT OF FRANKLIN PARK
FRANKLIN PARK, ILLINOIS
SCHEDULE OF DETAILED EXPENDITURES - BUDGET AND ACTUAL (Continued)
GENERAL (CORPORATE) FUND
NORTH PARK SUBFUND
For the Year Ended April 30, 2012
(See independent auditor's report.)- 47 -

Variance
Final Over
Budget Actual (Under)
EXPENDITURES
Current
General government
Corporate parks
Salaries
Superintendent of Parks and Planning 24,299$ 21,830$ (2,469)$
Park services staff 139,045 98,181 (40,864)
Corporate services assistant 16,900 - (16,900)
Salaries - regular 40,000 68,742 28,742
Salaries - part-time/temporary 15,415 11,822 (3,593)
Salaries - seasonal labor - 10,487 10,487
Overtime 7,000 5,203 (1,797)
Total salaries 242,659 216,265 (26,394)
Benefits
Uniforms - 1,426 1,426
Health insurance 40,000 19,289 (20,711)
Life/dental insurance 800 542 (258)
Uniforms 2,131 - (2,131)
Employee benefit program 1,000 736 (264)
Total benefits 43,931 21,993 (21,938)
Contractual services
Building repairs 5,750 3,927 (1,823)
Maintenance service - equipment - 360 360
Equipment repairs 9,540 10,726 1,186
HVAC equipment repairs 400 465 65
Vehicle (fleet) maintenance 14,480 14,430 (50)
Parks improvement repairs 6,250 3,202 (3,048)
Park lighting repairs 7,600 4,544 (3,056)
Horticulture services 9,730 10,450 720
Vandalism repairs 3,000 1,276 (1,724)
Equipment rental 2,500 1,098 (1,402)
Operating licenses 200 - (200)
Total contractual services 59,450 50,478 (8,972)
Communications
Telephone 4,500 4,540 40
Total communications 4,500 4,540 40
CORPORATE PARKS SUBFUND
PARK DISTRICT OF FRANKLIN PARK
FRANKLIN PARK, ILLINOIS
SCHEDULE OF DETAILED EXPENDITURES - BUDGET AND ACTUAL
GENERAL (CORPORATE) FUND
For the Year Ended April 30, 2012
(This schedule is continued on the following page.)- 48 -

Variance
Final Over
Budget Actual (Under)
EXPENDITURES (Continued)
Current (Continued)
General government (Continued)
Corporate parks (Continued)
Professional development
Travel 550$ 35$ (515)$
Employee training 1,850 690 (1,160)
Memberships/subscriptions 220 161 (59)
Conference/seminar 150 89 (61)
Total professional development 2,770 975 (1,795)
Service charges
Utilities - electric 3,500 3,178 (322)
Utilities - gas 15,000 8,926 (6,074)
Utilities - water 700 550 (150)
Garbage disposal 10,750 7,129 (3,621)
Total service charges 29,950 19,783 (10,167)
Maintenance supplies
Supplies - building 2,300 3,105 805
Supplies - janitorial 1,775 736 (1,039)
Supplies - athletic field 10,650 7,016 (3,634)
Supplies - parks maintenance 10,500 7,220 (3,280)
Supplies- liability 14,590 12,677 (1,913)
Supplies - special events 700 460 (240)
Parts - equipment 3,405 2,904 (501)
Parts - automotive 1,500 817 (683)
Parts - playground equipment 5,100 3,864 (1,236)
Total maintenance supplies 50,520 38,799 (11,721)
General supplies
Supplies - office 1,000 721 (279)
Supplies - computer 1,000 - (1,000)
Supplies - operating 400 11 (389)
Tools 2,800 3,716 916
Automotive and fuel 15,000 18,705 3,705
Horticultural 9,600 9,479 (121)
Flowers 1,750 57 (1,693)
Fertilizer 1,000 667 (333)
Total general supplies 32,550 33,356 806
TOTAL EXPENDITURES 466,330$ 386,189$ (80,141)$
For the Year Ended April 30, 2012
FRANKLIN PARK, ILLINOIS
SCHEDULE OF DETAILED EXPENDITURES - BUDGET AND ACTUAL (Continued)
GENERAL (CORPORATE) FUND
CORPORATE PARKS SUBFUND
PARK DISTRICT OF FRANKLIN PARK
(See independent auditor's report.)- 49 -

Variance
Final Over
Budget Actual (Under)
EXPENDITURES
Current
General government
Administration
Salaries
Superintendent of Parks and Planning 48,534$ 43,647$ (4,887)$
Superintendent of Recreation 22,165 22,673 508
Total salaries 70,699 66,320 (4,379)
Benefits
Health insurance 12,650 6,623 (6,027)
Unemployment insurance 5,000 - (5,000)
Workers' compensation 25,000 24,812 (188)
Safety gear 5,000 3,473 (1,527)
Total benefits 47,650 34,908 (12,742)
Contractual services
Maintenance service equipment 20,000 15,671 (4,329)
Employee background checks 500 500 -
Public liability insurance 24,000 18,733 (5,267)
Property insurance 22,000 22,411 411
Total contractual services 66,500 57,315 (9,185)
Professional development
Employee training 12,000 8,363 (3,637)
Total professional development 12,000 8,363 (3,637)
Other expenditures
Pollution liability 1,000 770 (230)
Total other expenditures 1,000 770 (230)
TOTAL EXPENDITURES 197,849$ 167,676$ (30,173)$
For the Year Ended April 30, 2012
PUBLIC LIABILITY INSURANCE SUBFUND
PARK DISTRICT OF FRANKLIN PARK
FRANKLIN PARK, ILLINOIS
SCHEDULE OF DETAILED EXPENDITURES - BUDGET AND ACTUAL
GENERAL (CORPORATE) FUND
(See independent auditor's report.)- 50 -

PARK DISTRICT OF FRANKLIN PARK
FRANKLIN PARK, ILLINOIS
Variance
Final Over
Budget Actual (Under)
REVENUES
Taxes
Property taxes
Current 460,000$ 497,950$ 37,950$
Prior years - (2,936) (2,936)
Total taxes 460,000 495,014 35,014
Charges for services
Program revenue
Swim lessons 17,910 16,199 (1,711)
Classes 90,810 157,571 66,761
Daycamp 123,245 117,884 (5,361)
Athletics 54,320 52,011 (2,309)
Passes 31,000 27,418 (3,582)
Teens 1,905 3,318 1,413
Intergovernmental events 200 875 675
Trips 10,560 2,765 (7,795)
Special events 13,435 17,123 3,688
Total program revenue 343,385 395,164 51,779
Pool revenue
Swim lessons 16,145 16,417 272
New programs 1,500 1,639 139
Swim team 1,700 - (1,700)
Admissions 56,000 62,486 6,486
Pool pass 30,000 37,340 7,340
Rentals 9,750 7,228 (2,522)
Locker 1,000 291 (709)
Food resale 25,000 30,375 5,375
Total pool revenue 141,095 155,776 14,681
Rentals
Equipment - 212 212
Building 35,000 32,156 (2,844)
Total rentals 35,000 32,368 (2,632)
Concession/vending 1,000 1,034 34
Total charges for services 520,480 584,342 63,862
Investment income 100 85 (15)
Miscellaneous 500 57 (443)
Total revenues 981,080 1,079,498 98,418
For the Year Ended April 30, 2012
SCHEDULE OF REVENUES, EXPENDITURES AND
CHANGES IN FUND BALANCES - BUDGET AND ACTUAL
RECREATION FUND
(This schedule is continued on the following page.)- 51 -

PARK DISTRICT OF FRANKLIN PARK
FRANKLIN PARK, ILLINOIS
Variance
Final Over
Budget Actual (Under)
EXPENDITURES
Current
Culture and recreation
Recreation department
Salaries 368,093$ 399,133$ 31,040$
Benefits 22,723 19,824 (2,899)
Skilled labor 63,403 50,395 (13,008)
Contractual services 15,800 18,154 2,354
Communications 45,500 41,012 (4,488)
Professional development 7,500 6,053 (1,447)
Service charges 69,000 64,597 (4,403)
Maintenance supplies 9,000 8,263 (737)
General supplies 44,851 52,441 7,590
Capital 2,000 2,182 182
Other expenditures 4,000 5,096 1,096
Total recreation department 651,870 667,150 15,280
Pool
Salaries 100,280 101,260 980
Benefits 3,365 3,629 264
Contractual services 4,500 7,354 2,854
Communications 1,700 1,206 (494)
Service charges 17,700 25,522 7,822
Maintenance supplies 1,000 1,136 136
General supplies 23,750 30,729 6,979
Other expenditures 3,000 1,419 (1,581)
Total pool 155,295 172,255 16,960
Total expenditures 807,165 839,405 32,240
EXCESS (DEFICIENCY) OF REVENUES
OVER EXPENDITURES 173,915 240,093 66,178
OTHER FINANCING SOURCES (USES)
Transfers (out) (14,200) - 14,200
Total other financing sources (uses) (14,200) - 14,200
NET CHANGE IN FUND BALANCE 159,715$ 240,093 80,378$
FUND BALANCE, MAY 1 550,071
FUND BALANCE, APRIL 30 790,164$
SCHEDULE OF REVENUES, EXPENDITURES AND
CHANGES IN FUND BALANCE - BUDGET AND ACTUAL (Continued)
RECREATION FUND
For the Year Ended April 30, 2012
(See independent auditor's report.)- 52 -

PARK DISTRICT OF FRANKLIN PARK
FRANKLIN PARK, ILLINOIS
Variance
Final Over
Budget Actual (Under)
EXPENDITURES
Current
Culture and recreation
Recreation department
Salaries
Superintendent of Recreation 44,330$ 45,347$ 1,017$
Athletic Supervisor 43,603 45,039 1,436
Recreation Supervisors 43,603 45,039 1,436
Marketing Coordinator 12,000 11,281 (719)
Registrars/secretarial 25,000 16,161 (8,839)
Salaries - part-time 6,000 5,952 (48)
Center staff - Community Center 33,189 33,920 731
Maintenance - Community Center 15,000 19,013 4,013
Fitness center 2,025 2,251 226
Kindergarten enrichment 5,000 16,905 11,905
Micro football - 193 193
Intergovernmental events 660 1,456 796
Classes 46,520 61,200 14,680
Athletics 16,767 14,513 (2,254)
Special events 2,610 3,922 1,312
Trips 792 - (792)
Day camp 59,950 65,865 5,915
Tot camp 1,520 555 (965)
Teens 524 936 412
Lifeguards 9,000 9,585 585
Total salaries 368,093 399,133 31,040
Benefits
Health insurance 17,623 16,839 (784)
Life/dental insurance 1,000 524 (476)
Uniforms 2,500 1,463 (1,037)
Automobile allowance 100 262 162
Employee benefit program 1,500 736 (764)
Total benefits 22,723 19,824 (2,899)
Skilled labor
Skilled labor - programs 63,403 50,395 (13,008)
Total skilled labor 63,403 50,395 (13,008)
SCHEDULE OF DETAILED EXPENDITURES - BUDGET AND ACTUAL
RECREATION FUND
For the Year Ended April 30, 2012
(This schedule is continued on the following pages.)- 53 -

PARK DISTRICT OF FRANKLIN PARK
FRANKLIN PARK, ILLINOIS
Variance
Final Over
Budget Actual (Under)
EXPENDITURES (Continued)
Current (Continued)
Culture and recreation (Continued)
Recreation department (Continued)
Contractual services
Building repairs 5,500$ 9,428$ 3,928$
Maintenance service - equipment 7,000 6,914 (86)
Equipment repairs - 12 12
Horticulture services 1,800 1,800 -
Equipment rental 1,500 - (1,500)
Total contractual services 15,800 18,154 2,354
Communications
Postage 8,000 10,359 2,359
Telephone 4,500 4,815 315
Printing and brochures 19,000 16,900 (2,100)
Preprint design/production 9,000 7,770 (1,230)
Marketing and website consultant 5,000 1,168 (3,832)
Total communications 45,500 41,012 (4,488)
Professional development
Travel (air, auto) 500 - (500)
Tuition reimbursement 2,000 - (2,000)
Employee training 1,500 705 (795)
Membership/subscriptions 2,000 2,766 766
Conference/seminar 1,500 2,582 1,082
Total professional development 7,500 6,053 (1,447)
Service charges
Utilities - electric 38,000 36,886 (1,114)
Utilities - gas 12,000 6,939 (5,061)
Utilities - water 12,500 13,699 1,199
Garbage disposal 2,500 2,553 53
Bank charges 4,000 4,520 520
Total service charges 69,000 64,597 (4,403)
RECREATION FUND
For the Year Ended April 30, 2012
SCHEDULE OF DETAILED EXPENDITURES - BUDGET AND ACTUAL (Continued)
(This schedule is continued on the following pages.)- 54 -

PARK DISTRICT OF FRANKLIN PARK
FRANKLIN PARK, ILLINOIS
Variance
Final Over
Budget Actual (Under)
RECREATION FUND
For the Year Ended April 30, 2012
SCHEDULE OF DETAILED EXPENDITURES - BUDGET AND ACTUAL (Continued)
EXPENDITURES (Continued)
Current (Continued)
Culture and recreation (Continued)
Recreation department (Continued)
Maintenance supplies
Supplies - building 3,000$ 2,873$ (127)$
Supplies - janitorial 6,000 5,390 (610)
Total maintenance supplies 9,000 8,263 (737)
General supplies
Supplies - office 3,000 5,495 2,495
Automotive - fuel and oil 500 563 63
Program supplies 41,351 46,383 5,032
Total general supplies 44,851 52,441 7,590
Capital
Computer equipment 2,000 2,182 182
Total capital 2,000 2,182 182
Other expenditures
Public relations 4,000 5,096 1,096
Total other expenditures 4,000 5,096 1,096
Total recreation department 651,870 667,150 15,280
Pool
Salaries
Manager 14,480 12,978 (1,502)
Attendant 9,743 14,873 5,130
Program staff instructors 7,000 6,309 (691)
Cashier - part-time 6,394 4,394 (2,000)
Concession 5,981 2,972 (3,009)
Pool rental salaries 3,113 2,964 (149)
Lifeguards 52,569 56,280 3,711
Swim team 1,000 490 (510)
Total salaries 100,280 101,260 980
(This schedule is continued on the following pages.)- 55 -
PARK DISTRICT OF FRANKLIN PARK
FRANKLIN PARK, ILLINOIS
Variance
Final Over
Budget Actual (Under)
RECREATION FUND
For the Year Ended April 30, 2012
SCHEDULE OF DETAILED EXPENDITURES - BUDGET AND ACTUAL (Continued)
EXPENDITURES (Continued)
Current (Continued)
Culture and recreation (Continued)
Pool (Continued)
Benefits
Uniforms 3,365$ 3,629$ 264$
Total benefits 3,365 3,629 264
Contractual services
Building repairs 3,500 6,439 2,939
Equipment repairs 1,000 915 (85)
Total contractual services 4,500 7,354 2,854
Communications
Telephone 1,700 1,206 (494)
Total communications 1,700 1,206 (494)
Service charges
Utilities - electric 5,000 12,514 7,514
Utilities - gas 8,000 7,722 (278)
Utilities - water 4,200 4,633 433
Garbage disposal 500 653 153
Total service charges 17,700 25,522 7,822
Maintenance supplies
Maintenance supplies 1,000 1,136 136
Total maintenance supplies 1,000 1,136 136
General supplies
Supplies - office 500 712 212
Supplies - operating 1,000 980 (20)
Supplies - pool chemicals 10,000 14,662 4,662
Supplies - concessions 10,000 13,413 3,413
Program supplies 2,250 962 (1,288)
Total general supplies 23,750 30,729 6,979
(This schedule is continued on the following page.)- 56 -

PARK DISTRICT OF FRANKLIN PARK
FRANKLIN PARK, ILLINOIS
Variance
Final Over
Budget Actual (Under)
RECREATION FUND
For the Year Ended April 30, 2012
SCHEDULE OF DETAILED EXPENDITURES - BUDGET AND ACTUAL (Continued)
EXPENDITURES (Continued)
Current (Continued)
Culture and recreation (Continued)
Pool (Continued)
Other expenditures
Public relations 1,000$ 44$ (956)$
Sales tax - vending 2,000 1,375 (625)
Total other expenditures 3,000 1,419 (1,581)
Total pool 155,295 172,255 16,960
TOTAL EXPENDITURES 807,165$ 839,405$ 32,240$
(See independent auditor's report.)- 57 -

PARK DISTRICT OF FRANKLIN PARK
FRANKLIN PARK, ILLINOIS
Variance
Final Over
Budget Actual (Under)
REVENUES
Property taxes
Current 903,620$ 954,660$ 51,040$
Prior years - (9,715) (9,715)
Investment income 1,000 122 (878)
Total revenues 904,620 945,067 40,447
EXPENDITURES
Debt service
Principal repayment 885,000 885,000 -
Interest expense 18,620 17,963 (657)
Total expenditures 903,620 902,963 (657)
NET CHANGE IN FUND BALANCE 1,000$ 42,104 41,104$
FUND BALANCE, MAY 1 615,301
FUND BALANCE, APRIL 30 657,405$
For the Year Ended April 30, 2012
SCHEDULE OF REVENUES, EXPENDITURES AND
CHANGES IN FUND BALANCE - BUDGET AND ACTUAL
GENERAL DEBT SERVICE FUND
(See independent auditor's report.)- 58 -

PARK DISTRICT OF FRANKLIN PARK
FRANKLIN PARK, ILLINOIS
SCHEDULE OF REVENUES, EXPENDITURES AND
CHANGES IN FUND BALANCE - BUDGET AND ACTUAL
2011 CAPITAL PROJECTS FUND
For the Year Ended April 30, 2012
Variance
Final Over
Budget Actual (Under)
REVENUES
None -$ -$ -$
Total revenues - - -
EXPENDITURES
Capital outlay - 67,686 67,686
Total expenditures - 67,686 67,686
EXCESS (DEFICIENCY) OF REVENUES
OVER EXPENDITURES - (67,686) (67,686)
OTHER FINANCING SOURCES (USES)
Bond proceeds, at par - 905,000 905,000
Premium on bonds issued - 3,267 3,267
Total other financing sources (uses) - 908,267 908,267
NET CHANGE IN FUND BALANCE -$ 840,581 840,581$
FUND BALANCE, MAY 1 -
FUND BALANCE, APRIL 30 840,581$
(See independent auditor's report.)- 59 -

NONMAJOR GOVERNMENTAL FUNDS

Capital
Projects
Municipal Social Special 2010 Capital
Retirement Security Audit Recreation Projects Total
Cash and investments 50,185$ 43,287$ 38,105$ 266,631$ 682,130$ 1,080,338$
Receivables (net, where applicable, of
allowances for uncollectibles)
Property taxes receivable 47,617 75,856 10,243 66,443 - 200,159
TOTAL ASSETS 97,802$ 119,143$ 48,348$ 333,074$ 682,130$ 1,280,497$
LIABILITIES
Accounts payable 9,430$ -$ -$ -$ -$ 9,430$
Deferred property tax revenue 47,617 75,856 10,243 66,443 - 200,159
Total liabilities 57,047 75,856 10,243 66,443 - 209,589
FUND BALANCES
Restricted
Employee retirement 40,755 43,287 - - - 84,042
Special purposes - - 38,105 - - 38,105
Special recreation - - - 266,631 - 266,631
Construction and development - - - - 682,130 682,130
Total fund balances 40,755 43,287 38,105 266,631 682,130 1,070,908
TOTAL LIABILITIES AND
FUND BALANCES 97,802$ 119,143$ 48,348$ 333,074$ 682,130$ 1,280,497$
LIABILITIES AND FUND BALANCES
ASSETS
April 30, 2012
Special Revenue
PARK DISTRICT OF FRANKLIN PARK
FRANKLIN PARK, ILLINOIS
COMBINING BALANCE SHEET
NONMAJOR GOVERNMENTAL FUNDS
(See independent auditor's report.)- 60 -

Capital
Projects
Municipal Social Special 2010 Capital
Retirement Security Audit Recreation Projects Total
REVENUES
Taxes 119,458$ 142,906$ 17,376$ 105,645$ -$ 385,385$
Investment income 10 15 6 52 103 186
Miscellaneous income - - - - 12,500 12,500
Total revenues 119,468 142,921 17,382 105,697 12,603 398,071
EXPENDITURES
Current
General government 33,328 38,152 19,493 - - 90,973
Culture and recreation 43,211 48,540 - 174,142 - 265,893
Capital outlay - - - - 252,962 252,962
Total expenditures 76,539 86,692 19,493 174,142 252,962 609,828
EXCESS (DEFICIENCY) OF REVENUES
OVER EXPENDITURES 42,929 56,229 (2,111) (68,445) (240,359) (211,757)
OTHER FINANCING SOURCES (USES)
Transfers (out) (44,187) (49,569) - - - (93,756)
Total other financing sources (uses) (44,187) (49,569) - - - (93,756)
NET CHANGE IN FUND BALANCES (1,258) 6,660 (2,111) (68,445) (240,359) (305,513)
FUND BALANCES, MAY 1 42,013 36,627 40,216 335,076 922,489 1,376,421
FUND BALANCES, APRIL 30 40,755$ 43,287$ 38,105$ 266,631$ 682,130$ 1,070,908$
CHANGES IN FUND BALANCES
NONMAJOR GOVERNMENTAL FUNDS
For the Year Ended April 30, 2012
Special Revenue
PARK DISTRICT OF FRANKLIN PARK
FRANKLIN PARK, ILLINOIS
COMBINING STATEMENT OF REVENUES, EXPENDITURES AND
(See independent auditor's report.)- 61 -

PARK DISTRICT OF FRANKLIN PARK
FRANKLIN PARK, ILLINOIS
Variance
Final Over
Budget Actual (Under)
REVENUES
Property taxes
Current 60,000$ 79,789$ 19,789$
Prior years - (331) (331)
Replacement taxes 40,000 40,000 -
Investment income 100 10 (90)
Total revenues 100,100 119,468 19,368
EXPENDITURES
Current
General government
Contractual services
IMRF 33,328 33,328 -
Culture and recreation
Contractual services
IMRF 41,672 43,211 1,539
Total expenditures 75,000 76,539 1,539
EXCESS (DEFICIENCY) OF REVENUES
OVER EXPENDITURES 25,100 42,929 17,829
OTHER FINANCING SOURCES (USES)
Transfers (out) (50,000) (44,187) 5,813
NET CHANGE IN FUND BALANCE (24,900)$ (1,258) 23,642$
FUND BALANCE, MAY 1 42,013
FUND BALANCE, APRIL 30 40,755$
For the Year Ended April 30, 2012
SCHEDULE OF REVENUES, EXPENDITURES AND
CHANGES IN FUND BALANCE - BUDGET AND ACTUAL
MUNICIPAL RETIREMENT FUND
(See independent auditor's report.)- 62 -

PARK DISTRICT OF FRANKLIN PARK
FRANKLIN PARK, ILLINOIS
Variance
Final Over
Budget Actual (Under)
REVENUES
Property taxes
Current 117,000$ 129,008$ 12,008$
Prior years - (1,102) (1,102)
Replacement taxes 15,000 15,000 -
Total taxes 132,000 142,906 10,906
Investment income - 15 15
Total revenues 132,000 142,921 10,921
EXPENDITURES
Current
General government
Contractual services
FICA 38,152 38,152 -
Culture and recreation
Contractual services
FICA 46,348 48,540 2,192
Total expenditures 84,500 86,692 2,192
EXCESS (DEFICIENCY) OF REVENUES
OVER EXPENDITURES 47,500 56,229 8,729
OTHER FINANCING SOURCES (USES)
Transfers (out) (47,500) (49,569) (2,069)
NET CHANGE IN FUND BALANCE -$ 6,660 6,660$
FUND BALANCE, MAY 1 36,627
FUND BALANCE, APRIL 30 43,287$
For the Year Ended April 30, 2012
SCHEDULE OF REVENUES, EXPENDITURES AND
CHANGES IN FUND BALANCE - BUDGET AND ACTUAL
SOCIAL SECURITY FUND
(See independent auditor's report.)- 63 -

PARK DISTRICT OF FRANKLIN PARK
FRANKLIN PARK, ILLINOIS
Variance
Final Over
Budget Actual (Under)
REVENUES
Property taxes
Current 17,900$ 17,517$ (383)$
Prior years - (141) (141)
Investment income 100 6 (94)
Total revenues 18,000 17,382 (618)
EXPENDITURES
Current
General government
Contractual services
Auditing services 19,373 19,493 120
Total expenditures 19,373 19,493 120
NET CHANGE IN FUND BALANCE (1,373)$ (2,111) (738)$
FUND BALANCE, MAY 1 40,216
FUND BALANCE, APRIL 30 38,105$
For the Year Ended April 30, 2012
SCHEDULE OF REVENUES, EXPENDITURES AND
CHANGES IN FUND BALANCE - BUDGET AND ACTUAL
AUDIT FUND
(See independent auditor's report.)- 64 -

PARK DISTRICT OF FRANKLIN PARK
FRANKLIN PARK, ILLINOIS
Variance
Final Over
Budget Actual (Under)
REVENUES
Property taxes
Current 120,000$ 108,054$ (11,946)$
Prior years - (2,409) (2,409)
Investment income 500 52 (448)
Total revenues 120,500 105,697 (14,803)
EXPENDITURES
Current
Culture and recreation
Contractual services
West Suburban Special
Recreation Association 168,000 174,142 6,142
Total expenditures 168,000 174,142 6,142
NET CHANGE IN FUND BALANCE (47,500)$ (68,445) (20,945)$
FUND BALANCE, MAY 1 335,076
FUND BALANCE, APRIL 30 266,631$
For the Year Ended April 30, 2012
SCHEDULE OF REVENUES, EXPENDITURES AND
CHANGES IN FUND BALANCE - BUDGET AND ACTUAL
SPECIAL RECREATION FUND
(See independent auditor's report.)- 65 -

PARK DISTRICT OF FRANKLIN PARK
FRANKLIN PARK, ILLINOIS
SCHEDULE OF REVENUES, EXPENDITURES AND
CHANGES IN FUND BALANCE - BUDGET AND ACTUAL
2010 CAPITAL PROJECTS FUND
For the Year Ended April 30, 2012
Variance
Final Over
Budget Actual (Under)
REVENUES
Investment income -$ 103$ 103$
Miscellaneous income - 12,500 12,500
Total revenues - 12,603 12,603
EXPENDITURES
Capital outlay 2,040,875 252,962 (1,787,913)
Total expenditures 2,040,875 252,962 (1,787,913)
EXCESS (DEFICIENCY) OF REVENUES
OVER EXPENDITURES (2,040,875) (240,359) 1,800,516
OTHER FINANCING SOURCES (USES)
Bond proceeds, at par 895,000 - (895,000)
Transfers in 200,000 - (200,000)
Total other financing sources (uses) 1,095,000 - (1,095,000)
NET CHANGE IN FUND BALANCE (945,875)$ (240,359) 705,516$
FUND BALANCE, MAY 1 922,489
FUND BALANCE, APRIL 30 682,130$
(See independent auditor's report.)- 66 -

ENTERPRISE FUND
The Ice Arena Fund is the enterprise fund of the District. It is used to account for the revenue
and expense associated with the operation of the Park District of Franklin Park Ice Arena.

PARK DISTRICT OF FRANKLIN PARK
FRANKLIN PARK, ILLINOIS
SCHEDULE OF REVENUES, EXPENSES AND
CHANGES IN NET ASSETS - BUDGET AND ACTUAL
ICE ARENA FUND
For the Year Ended April 30, 2012
Variance
Final Over
Budget Actual (Under)
OPERATING REVENUE
Program revenue
Lessons 163,500$ 162,661$ (839)$
Hockey 421,549 381,506 (40,043)
Freestyle 32,000 37,281 5,281
Fusion 2,000 2,026 26
Admissions 85,000 69,781 (15,219)
Ice show receipts 14,655 11,498 (3,157)
Figure skating 18,675 18,474 (201)
Hockey tournaments 8,100 2,755 (5,345)
Youth hockey camp/clinics 39,686 52,258 12,572
Open hockey 16,000 15,443 (557)
Special events 3,800 2,607 (1,193)
Precision program 31,630 37,126 5,496
Total program revenue 836,595 793,416 (43,179)
Rentals
Facility 361,500 330,524 (30,976)
Skates 30,000 29,300 (700)
Total rentals 391,500 359,824 (31,676)
Other revenue
Food resale 50,000 41,873 (8,127)
Vending 46,500 46,100 (400)
Skate sharpening 1,350 910 (440)
Pro shop 6,500 6,370 (130)
Locker - 197 197
Ice show costumes 31,350 35,574 4,224
Advertising fees 2,550 3,400 850
Miscellaneous 3,000 1,202 (1,798)
Total other revenue 141,250 135,626 (5,624)
Total operating revenue 1,369,345 1,288,866 (80,479)
(This schedule is continued on the following page.)- 67 -

PARK DISTRICT OF FRANKLIN PARK
FRANKLIN PARK, ILLINOIS
SCHEDULE OF REVENUES, EXPENSES AND
CHANGES IN NET ASSETS - BUDGET AND ACTUAL (Continued)
ICE ARENA FUND
For the Year Ended April 30, 2012
Variance
Final Over
Budget Actual (Under)
OPERATING EXPENSES
Operating
Salaries $ 672,164 $ 667,578 $ (4,586)
Benefits 166,804 150,796 (16,008)
Skilled labor 2,000 1,276 (724)
Contractual services 34,050 31,972 (2,078)
Communications 23,600 25,491 1,891
Professional development 6,200 4,219 (1,981)
Service charges 197,000 163,526 (33,474)
Maintenance supplies 36,700 20,915 (15,785)
General supplies 56,100 53,403 (2,697)
Program supplies 89,817 70,674 (19,143)
Other expenses 29,915 41,489 11,574
Total operating 1,314,350 1,231,339 (83,011)
Depreciation 40,000 56,932 16,932
Total operating expenses 1,354,350 1,288,271 (66,079)
OPERATING INCOME (LOSS) 14,995 595 (14,400)
NONOPERATING REVENUE (EXPENSE)
Gain (loss) on disposal of capital assets - (6,183) (6,183)
Investment income 500 938 438
Total nonoperating revenue (expense) 500 (5,245) (5,745)
CHANGE IN NET ASSETS BEFORE
TRANSFERS AND CONTRIBUTIONS 15,495 (4,650) (20,145)
TRANSFERS IN 97,500 93,756 (3,744)
CONTRIBUTIONS - 46,456 46,456
CHANGE IN NET ASSETS $ 112,995 135,562 $ 22,567
NET ASSETS, MAY 1 2,303,721
NET ASSETS, APRIL 30 $ 2,439,283
(See independent auditor's report.)- 68 -
PARK DISTRICT OF FRANKLIN PARK
FRANKLIN PARK, ILLINOIS
SCHEDULE OF DETAILED EXPENSES - BUDGET AND ACTUAL
ICE ARENA FUND
For the Year Ended April 30, 2012
Variance
Final Over
Budget Actual (Under)
OPERATING EXPENSES
Salaries
Director of Parks and Recreation 35,491$ 34,719$ (772)$
Superintendent of Finance 27,147 27,422 275
Human Resource Manager 17,163 18,333 1,170
Part-time/temporary 10,000 8,089 (1,911)
Salaries - overtime 4,000 2,766 (1,234)
Marketing Coordinator 12,000 11,412 (588)
Manager - Ice Arena 71,452 74,878 3,426
Assistant managers 55,894 58,028 2,134
Skating School Director 6,000 - (6,000)
Arena Services Supervisor 40,488 43,018 2,530
Arena Secretary 39,433 39,834 401
Supervisor I 37,335 40,315 2,980
Supervisor II 35,825 35,545 (280)
Night supervisor - part-time 7,000 10,129 3,129
Maintenance Full-Time II 35,825 37,588 1,763
Assistant Supervisor/Maintenance 3,000 3,234 234
Maintenance - part-time 18,000 17,819 (181)
Cashier - part-time 30,000 30,858 858
Concession 15,000 15,189 189
Ice guards 10,000 13,834 3,834
Precision coaches 6,000 - (6,000)
Precision program - 5,120 5,120
Instructors/lessons 38,000 - (38,000)
Skate camp 16,742 10,787 (5,955)
Skating lessons 1,312 38,107 36,795
Adult hockey league 3,196 1,910 (1,286)
Ice show 9,850 7,530 (2,320)
Freestyle 7,000 7,739 739
Adult hockey league referees 21,861 11,200 (10,661)
Youth hockey league 6,400 6,264 (136)
Panther Paws 11,635 7,892 (3,743)
Youth hockey camp/clinic 7,923 10,464 2,541
Youth hockey league referees 11,717 16,388 4,671
Youth hockey tournament 300 - (300)
Figure skating competition 1,300 227 (1,073)
Hockey program coordinator - part-time 3,000 2,580 (420)
Assistant Skating Supervisor 2,000 2,210 210
Figure skating coordinators 12,875 16,124 3,249
Special event staffing - 26 26
Total salaries 672,164 667,578 (4,586)
(This schedule is continued on the following pages.)- 69 -

PARK DISTRICT OF FRANKLIN PARK
FRANKLIN PARK, ILLINOIS
SCHEDULE OF DETAILED EXPENSES - BUDGET AND ACTUAL (Continued)
ICE ARENA FUND
For the Year Ended April 30, 2012
Variance
Final Over
Budget Actual (Under)
OPERATING EXPENSES (Continued)
Benefits
Health insurance 65,004$ 52,352$ (12,652)$
Life/dental insurance 1,000 1,072 72
FICA 47,500 49,569 2,069
IMRF 50,000 44,187 (5,813)
Uniforms 2,000 2,411 411
Automobile allowance 550 469 (81)
Employee benefit program 750 736 (14)
Total benefits 166,804 150,796 (16,008)
Skilled labor
Skilled labor 2,000 1,276 (724)
Total skilled labor 2,000 1,276 (724)
Contractual services
Building repairs 3,000 1,013 (1,987)
Maintenance service/equipment 4,000 4,539 539
Equipment repairs 1,000 172 (828)
Heating A/C equipment repair 18,000 19,967 1,967
Zamboni repair 1,600 1,125 (475)
Knife sharpening 1,000 1,055 55
Carpet cleaning 150 125 (25)
Maintenance service contracts 5,000 3,976 (1,024)
Recruitment - personnel 300 - (300)
Total contractual services 34,050 31,972 (2,078)
Communications
Postage 3,500 3,235 (265)
Telephone 6,300 5,402 (898)
Printing and brochures 8,500 11,714 3,214
Preprint design and production 5,200 5,140 (60)
Publications and legal notice 100 - (100)
Total communications 23,600 25,491 1,891
Professional development
Travel 1,000 281 (719)
Employee training 1,000 100 (900)
Tuition reimbursement 1,000 90 (910)
Memberships/subscriptions 1,200 718 (482)
Conference/seminar 2,000 3,030 1,030
Total professional development 6,200 4,219 (1,981)
(This schedule is continued on the following pages.)- 70 -

PARK DISTRICT OF FRANKLIN PARK
FRANKLIN PARK, ILLINOIS
SCHEDULE OF DETAILED EXPENSES - BUDGET AND ACTUAL (Continued)
ICE ARENA FUND
For the Year Ended April 30, 2012
Variance
Final Over
Budget Actual (Under)
OPERATING EXPENSES (Continued)
Service charges
Utilities - electric 135,000$ 117,227$ (17,773)$
Utilities - gas 40,000 23,675 (16,325)
Utilities - water 10,000 10,169 169
Garbage disposal 2,000 2,483 483
Bank charges 10,000 9,972 (28)
Total service charges 197,000 163,526 (33,474)
Maintenance supplies
Supplies - building 4,000 2,926 (1,074)
Supplies - heating 1,000 1,393 393
Supplies - rink proper 4,000 3,611 (389)
Supplies - wood stove 1,300 958 (342)
Materials - vandalism replacement 500 65 (435)
Maintenance supplies 3,000 2,883 (117)
Parts - electrical 600 635 35
Parts - equipment 500 544 44
Parts - compressors 18,000 6,875 (11,125)
Parts - zamboni 3,800 1,025 (2,775)
Total maintenance supplies 36,700 20,915 (15,785)
General supplies
Office supplies 3,500 3,317 (183)
Computer supplies 4,000 4,675 675
Operating supplies 2,000 848 (1,152)
Rental skates 2,000 2,255 255
Tools 600 67 (533)
Concession supplies 22,000 19,173 (2,827)
Vending supplies 9,000 9,524 524
Vending supplies - Coke products 13,000 13,544 544
Total general supplies 56,100 53,403 (2,697)
Program supplies
General - 653 653
Adult hockey league 2,300 400 (1,900)
Panther spring league 5,265 7,044 1,779
Panther fall league 37,495 37,868 373
Figure skating competitions 5,800 6,099 299
Ice show 25,150 68 (25,082)
Skate camp 2,200 1,599 (601)
Youth hockey camp/clinics 800 538 (262)
Precision program 3,368 5,095 1,727
Youth hockey tournaments 384 428 44
(This schedule is continued on the following page.)- 71 -

PARK DISTRICT OF FRANKLIN PARK
FRANKLIN PARK, ILLINOIS
SCHEDULE OF DETAILED EXPENSES - BUDGET AND ACTUAL (Continued)
ICE ARENA FUND
For the Year Ended April 30, 2012
Variance
Final Over
Budget Actual (Under)
OPERATING EXPENSES (Continued)
Program supplies (Continued)
Skating lessons 800$ 1,922$ 1,122$
Panther Paws 1,530 2,031 501
Everyone skate 500 - (500)
Skate club 1,500 3,312 1,812
Special events 400 240 (160)
Special needs competition 2,325 3,377 1,052
Total program supplies 89,817 70,674 (19,143)
Other expenses
Public relations 2,000 1,528 (472)
Hockey league - AHAI Adult/Youth 4,415 240 (4,175)
Youth hockey league NWHL tournament 17,000 13,775 (3,225)
Ice show expense - 20,796 20,796
Miscellaneous 1,000 51 (949)
Sales tax - vending 5,500 5,099 (401)
Total other expenses 29,915 41,489 11,574
TOTAL OPERATING EXPENSES $ 1,314,350 $ 1,231,339 $ (83,011)
(See independent auditor's report.)- 72 -

SUPPLEMENTAL SCHEDULES

PARK DISTRICT OF FRANKLIN PARK
FRANKLIN PARK, ILLINOIS
SCHEDULE OF GENERAL CAPITAL ASSETS
April 30, 2012
Balances Balances
May 1 Additions Deletions April 30
Land 5,127,806$ -$ -$ 5,127,806$
Construction in progress 7,288 30,445 7,288 30,445
Land improvements 5,160,930 239,402 5,750 5,394,582
Buildings 5,492,289 - - 5,492,289
Equipment 1,438,410 13,984 3,000 1,449,394
Motor vehicles 218,071 30,334 - 248,405
TOTAL 17,444,794$ 314,165$ 16,038$ 17,742,921$
(See independent auditor's report.)- 73 -
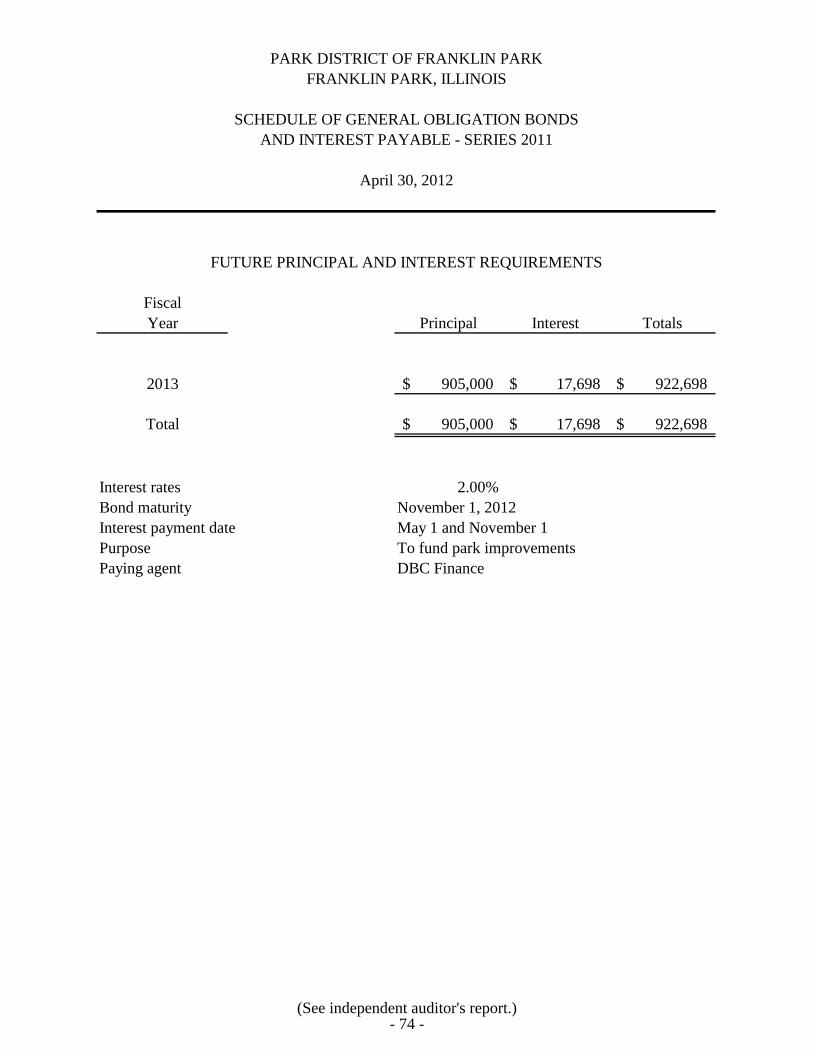
PARK DISTRICT OF FRANKLIN PARK
FRANKLIN PARK, ILLINOIS
FUTURE PRINCIPAL AND INTEREST REQUIREMENTS
Fiscal
Year Principal Interest Totals
2013 905,000$ 17,698$ 922,698$
Total 905,000$ 17,698$ 922,698$
Interest rates 2.00%
Bond maturity
Interest payment date May 1 and November 1
Purpose To fund park improvements
Paying agent DBC Finance
SCHEDULE OF GENERAL OBLIGATION BONDS
AND INTEREST PAYABLE - SERIES 2011
April 30, 2012
November 1, 2012
(See independent auditor's report.)- 74 -

STATISTICAL SECTION
This part of the District’s comprehensive annual financial report presents detailed information as
a context for understanding what the information in the financial statements, note disclosures and
required supplementary information displays about the District’s overall financial health.
Contents Page(s)
Financial Trends
These schedules contain trend information to help the reader understand
how the District’s financial performance and well-being have been
changed over time.
75-82
Revenue Capacity
These schedules contain information to help the reader assess the District’s
most significant local revenue source, the property tax.
83-86
Debt Capacity
These schedules present information to help the reader assess the
affordability of the District’s current levels of outstanding debt and the
District’s ability to issue additional debt in the future.
87-90
Demographic and Economic Information
These schedules offer demographic and economic indicators to help the
reader understand the environment within which the District’s financial
activities take place.
91-92
Operating Information
These schedules contain service and infrastructure data to help the reader
understand how the information in the District’s financial report relates to
the services the District provides and the activities it performs.
93-96
Sources: Unless otherwise noted, the information in these schedules is derived from the
comprehensive annual financial reports for the relevant year. The District implemented GASB
Statement No. 34 in 2005; schedules presenting government-wide information include
information beginning in that year.

PARK DISTRICT OF FRANKLIN PARK
FRANKLIN PARK, ILLINOIS
NET ASSETS BY COMPONENT
Last Eight Fiscal Years
Fiscal Year 2005 2006 2007 2008 2009 2010 2011 2012
GOVERNMENTAL ACTIVITIES
Invested in capital assets
net of related debt 8,233,907$ 8,895,821$ 9,298,414$ 10,358,640$ 10,734,406$ 12,042,054$ 12,134,638$ 12,622,181$
Restricted 1,528,548 1,725,471 1,929,682 2,398,263 1,566,845 1,639,297 1,767,492 1,590,507
Unrestricted 635,544 1,008,978 1,486,120 1,227,528 2,496,064 2,554,259 2,671,078 3,283,033
TOTAL GOVERNMENTAL ACTIVITIES 10,397,999$ 11,630,270$ 12,714,216$ 13,984,431$ 14,797,315$ 16,235,610$ 16,573,208$ 17,495,721$
BUSINESS-TYPE ACTIVITIES
Invested in capital assets
net of related debt 833,826$ 818,123$ 797,096$ 792,710$ 754,744$ 751,526$ 1,206,293$ 1,189,634$
Restricted - - - - - - - -
Unrestricted 465,492 604,640 735,549 859,600 898,743 981,496 1,097,428 1,249,649
TOTAL BUSINESS-TYPE ACTIVITIES 1,299,318$ 1,422,763$ 1,532,645$ 1,652,310$ 1,653,487$ 1,733,022$ 2,303,721$ 2,439,283$
PRIMARY GOVERNMENT
Invested in capital assets
net of related debt 9,067,733$ 9,713,944$ 10,095,510$ 11,151,350$ 11,489,150$ 12,793,580$ 13,340,931$ 13,811,815$
Restricted 1,528,548 1,725,471 1,929,682 2,398,263 1,566,845 1,639,297 1,767,492 1,590,507
Unrestricted 1,101,036 1,613,618 2,221,669 2,087,128 3,394,807 3,535,755 3,768,506 4,532,682
TOTAL PRIMARY GOVERNMENT 11,697,317$ 13,053,033$ 14,246,861$ 15,636,741$ 16,450,802$ 17,968,632$ 18,876,929$ 19,935,004$
Note: The District implemented GASB Statement No. 34 for the year ended April 30, 2005.
(Accrual Basis of Accounting)
- 75 -

Fiscal Year 2005 2006 2007 2008
EXPENSES
Governmental activities
General government 413,747$ 973,366$ 1,016,861$ 1,039,434$
Culture and recreation 1,803,956 1,392,817 1,475,936 1,568,730
Interest 82,432 81,601 82,791 45,691
Total governmental activities expenses 2,300,135 2,447,784 2,575,588 2,653,855
Business-type activities
Ice Arena 1,095,635 1,127,002 1,162,184 1,158,801
Total business-type activities expenses 1,095,635 1,127,002 1,162,184 1,158,801
TOTAL PRIMARY GOVERNMENT EXPENSES 3,395,770$ 3,574,786$ 3,737,772$ 3,812,656$
PROGRAM REVENUES
Governmental activities
Charges for services 664,366$ 765,657$ 757,973$ 768,475$
Operating grants and contributions - - - -
Capital grants and contributions 76,500 195,448 26,437 205,217
Total governmental activities program revenues 740,866 961,105 784,410 973,692
Business-type activities
Ice Arena 1,044,849 1,150,024 1,151,436 1,139,462
Capital grants and contributions - - 20,335 39,219
Total business-type activities program revenues 1,044,849 1,150,024 1,171,771 1,178,681
TOTAL PRIMARY GOVERNMENT
PROGRAM ACTIVITIES 1,785,715$ 2,111,129$ 1,956,181$ 2,152,373$
NET (EXPENSE) REVENUE
Governmental activities (1,559,269)$ (1,486,679)$ (1,791,178)$ (1,680,163)$
Business-type activities (50,786) 23,022 9,587 19,880
TOTAL PRIMARY GOVERNMENT
NET (EXPENSE) REVENUE (1,610,055)$ (1,463,657)$ (1,781,591)$ (1,660,283)$
PARK DISTRICT OF FRANKLIN PARK
(Accrual Basis of Accounting)
Last Eight Fiscal Years
CHANGE IN NET ASSETS
FRANKLIN PARK, ILLINOIS
- 76 -

2009 2010 2011 2012
1,100,755$ 1,127,702$ 1,117,160$ 1,219,883$
1,517,310 1,471,463 1,610,006 1,565,994
64,130 56,127 36,944 37,223
2,682,195 2,655,292 2,764,110 2,823,100
1,173,486 1,214,719 1,267,982 1,294,454
1,173,486 1,214,719 1,267,982 1,294,454
3,855,681$ 3,870,011$ 4,032,092$ 4,117,554$
695,444$ 659,974$ 800,032$ 857,858$
- - - 10,478
- 400,000 - -
695,444 1,059,974 800,032 868,336
1,097,510 1,184,605 1,247,384 1,288,866
3,950 487,729 43,858 46,456
1,101,460 1,672,334 1,291,242 1,335,322
1,796,904$ 2,732,308$ 2,091,274$ 2,203,658$
(1,986,751)$ (1,595,318)$ (1,964,078)$ (1,954,764)$
(72,026) 457,615 23,260 40,868
(2,058,777)$ (1,137,703)$ (1,940,818)$ (1,913,896)$
- 77 -

Fiscal Year 2005 2006 2007 2008
GENERAL REVENUES AND OTHER
CHANGES IN NET ASSETS
Governmental activities
Taxes 2,534,576$ 2,687,532$ 2,805,474$ 2,883,044$
Investment income 29,928 83,950 137,023 134,850
Miscellaneous 3,055 (52,532) (67,373) (67,516)
Transfers - - - -
Total governmental activities 2,567,559 2,718,950 2,875,124 2,950,378
Business-type activities
Investment income 7,210 19,793 33,328 33,722
Miscellaneous - - - -
Transfers 3,890 80,630 66,967 66,063
Total business-type activities 11,100 100,423 100,295 99,785
TOTAL PRIMARY GOVERNMENT 2,578,659$ 2,819,373$ 2,975,419$ 3,050,163$
CHANGE IN NET ASSETS
Governmental 1,008,290$ 1,232,271$ 1,083,946$ 1,270,215$
Business-type (39,686) 123,445 109,882 119,665
968,604 1,355,716 1,193,828 1,389,880
Net assets, May 1
Governmental activities 9,389,709 10,397,999 11,630,270 12,714,216
Business-type activities 1,365,887 1,299,318 1,422,763 1,532,645
Net assets, May 1 10,755,596 11,697,317 13,053,033 14,246,861
Prior period adjustment
Prior period adjustment governmental activities - - - -
Prior period adjustment business-type activities (26,883) - - -
Total prior period adjustment (26,883) - - -
Net assets, May restated
Governmental activities 9,389,709 10,397,999 11,630,270 12,714,216
Business-type activities 1,339,004 1,299,318 1,422,763 1,532,645
Net assets, May restated 10,728,713 11,697,317 13,053,033 14,246,861
TOTAL PRIMARY GOVERNMENT
NET ASSETS, APRIL 30 11,697,317$ 13,053,033$ 14,246,861$ 15,636,741$
Note: The District implemented GASB Statement No. 34 for the year ended April 30, 2005.
Data Source
Audited Financial Statements
PARK DISTRICT OF FRANKLIN PARK
FRANKLIN PARK, ILLINOIS
CHANGE IN NET ASSETS (Continued)
Last Eight Fiscal Years
(Accrual Basis of Accounting)
- 78 -

2009 2010 2011 2012
2,827,491$ 3,099,316$ 2,838,542$ 2,953,371$
56,765 5,017 5,784 2,291
(68,621) 3,695 2,267 15,371
- (74,415) (88,379) (93,756)
2,815,635 3,033,613 2,758,214 2,877,277
10,964 1,043 2,522 938
- - - -
65,239 74,415 88,379 93,756
76,203 75,458 90,901 94,694
2,891,838$ 3,109,071$ 2,849,115$ 2,971,971$
828,884$ 1,438,295$ 794,136$ 922,513$
4,177 533,073 114,161 135,562
833,061 1,971,368 908,297 1,058,075
13,984,431 14,797,315 16,235,610 16,573,208
1,652,310 1,656,487 1,733,022 2,303,721
15,636,741 16,453,802 17,968,632 18,876,929
(16,000) - (456,538) -
- - 456,538 -
(16,000) - - -
13,968,431 14,797,315 15,779,072 16,573,208
1,652,310 1,656,487 2,189,560 2,303,721
15,620,741 16,453,802 17,968,632 18,876,929
16,453,802$ 18,425,170$ 18,876,929$ 19,935,004$
- 79 -

PARK DISTRICT OF FRANKLIN PARK
FUND BALANCES OF GOVERNMENTAL FUNDS
Last Ten Fiscal Years
Fiscal Year 2003 2004 2005 2006 2007 2008 2009 2010 2011 2012
GENERAL FUND
Nonspendable
Prepaid items 184$ 11,426$ 7,977$ 5,225$ 6,161$ 6,117$ 7,264$ 6,527$ 7,274$ 6,586$
Inventory - - - - - 3,076 6,923 6,937 6,655 7,404
Restricted for tort 324,614 333,840 393,206 480,379 535,955 506,065 474,605 366,703 191,115 21,310
Unrestricted
Committed - - - - - - - - - -
Assigned - - - - - - - - - -
Unassigned 165,819 484,954 697,578 994,106 1,392,479 1,888,067 2,307,714 2,182,577 2,110,871 2,515,086
TOTAL GENERAL FUND 490,617$ 830,220$ 1,098,761$ 1,479,710$ 1,934,595$ 2,403,325$ 2,796,506$ 2,562,744$ 2,315,915$ 2,550,386$
ALL OTHER GOVERNMENTAL FUNDS
Nonspendable
Prepaid items 3,996$ 2,586$ 2,247$ 2,807$ 1,916$ 2,306$ 2,710$ 1,581$ 870$ 2,149$
Restricted
Special recreation (18,548) (13,783) 33,883 90,646 152,614 212,516 269,292 329,195 335,076 266,631
Employee retirement 146,165 147,831 216,287 212,479 204,508 199,021 165,715 144,433 78,640 84,042
Specific purposes 24,713 28,229 33,734 40,155 42,434 43,866 42,194 42,528 40,216 38,105
Debt service 556,702 543,844 541,487 566,269 598,909 631,006 595,433 632,193 615,301 657,405
Park development\improvements 851,362 307,825 309,951 335,543 395,262 805,789 1,463,038 124,245 922,489 1,522,711
Unrestricted
Assigned (Unassigned) 279,573 (52,180) (9,987) 49,930 131,180 157,866 209,472 374,649 549,201 788,015
TOTAL ALL OTHER
GOVERNMENTAL FUNDS 1,843,963$ 964,352$ 1,127,602$ 1,297,829$ 1,526,823$ 2,052,370$ 2,747,854$ 1,648,824$ 2,541,793$ 3,359,058$
Data Source
Audited Financial Statements
FRANKLIN PARK, ILLINOIS
(Modified Accrual Basis of Accounting)
- 80 -

Fiscal Year 2003 2004 2005 2006 2007 2008 2009 2010 2011 2012
REVENUES
Property taxes 2,040,733$ 2,044,713$ 2,294,181$ 2,377,345$ 2,468,422$ 2,498,628$ 2,475,510$ 2,787,758$ 2,492,233$ 2,640,961$
Personal property replacement taxes 189,774 210,918 240,395 310,187 337,052 384,416 351,981 311,557 346,310 312,409
Charges for services 625,255 599,121 664,366 757,707 757,973 768,475 686,946 659,974 800,123 857,865
Intergovernmental 400,000 192,800 76,500 195,448 26,437 205,217 - 400,000 - 10,478
Investment income 38,957 15,048 29,928 83,950 137,023 134,850 56,765 5,017 5,784 2,291
Miscellaneous 33,715 1,481 3,055 13,392 1,773 2,039 11,507 3,696 2,175 15,365
Total revenues 3,328,434 3,064,081 3,308,425 3,738,029 3,728,680 3,993,625 3,582,709 4,168,002 3,646,625 3,839,369
EXPENDITURES
General government 899,370 843,395 735,686 789,317 885,600 905,694 907,891 942,755 964,526 986,297
Culture and recreation 1,240,378 1,056,042 1,158,092 1,232,751 1,234,961 1,318,729 1,274,749 1,243,675 1,321,527 1,389,479
Pension fund contributions (1) 13,271 27,450 32,071 37,488 - - - - - -
Capital outlay 1,486,385 801,328 676,729 631,410 174,522 672,796 1,412,837 2,340,640 247,790 323,405
Debt service
Principal retirement 1,007,000 890,670 1,048,000 1,118,000 1,106,000 852,000 850,000 820,000 845,000 885,000
Interest and fiscal charges 56,861 182,087 79,276 75,914 60,072 33,096 29,219 79,309 28,263 17,963
Total expenditures 4,703,265 3,800,972 3,729,854 3,884,880 3,461,155 3,782,315 4,474,696 5,426,379 3,407,106 3,602,144
EXCESS (DEFICIENCY) OF REVENUES
OVER EXPENDITURES (1,374,831) (736,891) (421,429) (146,851) 267,525 211,310 (891,987) (1,258,377) 239,519 237,225
OTHER FINANCING SOURCES (USES)
Transfers in - - - - 5,366 309,125 - 600,000 550,000 -
Transfers (out) - - - (57,973) (74,512) (378,680) (71,630) (674,415) (638,379) (93,756)
Proceeds from the sale of capital assets - 30,600 - - 3,500 2,522 858 - - -
Bonds issued 1,678,000 188,081 845,000 756,000 482,000 850,000 2,055,000 - 495,000 905,000
Premium on bonds issued 14,773 - - - - - 12,424 - - 3,267
Total other financing sources (uses) 1,692,773 218,681 845,000 698,027 416,354 782,967 1,996,652 (74,415) 406,621 814,511
PARK DISTRICT OF FRANKLIN PARK
FRANKLIN PARK, ILLINOIS
CHANGES IN FUND BALANCES OF GOVERNMENTAL FUNDS
Last Ten Fiscal Years
(Modified Accrual Basis of Accounting)
- 81 -

Fiscal Year 2003 2004 2005 2006 2007 2008 2009 2010 2011 2012
NET CHANGE IN FUND BALANCES 317,942$ (518,210)$ 423,571$ 551,176$ 683,879$ 994,277$ 1,104,665$ (1,332,792)$ 646,140$ 1,051,736$
FUND BALANCES, MAY 1 2,016,640 2,334,582 1,794,572 2,226,363 2,777,539 3,461,418 4,455,695 5,544,360 4,211,568 4,857,708
Prior period adjustment - (21,800) 8,220 - - - (16,000) - - -
FUND BALANCES, MAY 1, RESTATED 2,016,640 2,312,782 1,802,792 2,226,363 2,777,539 3,461,418 4,439,695 5,544,360 4,211,568 4,857,708
FUND BALANCES, APRIL 30 2,334,582$ 1,794,572$ 2,226,363$ 2,777,539$ 3,461,418$ 4,455,695$ 5,544,360$ 4,211,568$ 4,857,708$ 5,909,444$
DEBT SERVICE AS A PERCENTAGE OF
NONCAPITAL EXPENDITURES 33% 36% 37% 37% 35% 28% 29% 28% 27% 27%
Data Source
Audited Financial Statements
(1) Beginning in 2007, pension fund contributions were allocated to the general government and recreation functions.
- 82 -

PARK DISTRICT OF FRANKLIN PARK
Total Direct
Levy Residential Farm Commercial Industrial Railroad Assessed Estimated Tax
Year Property Property Property Property Property Value Value (1) Rate
2002 128,921,888$ -$ 27,842,154$ 358,583,522$ 4,661,960$ 520,009,524$ 1,575,786,436$ 0.4169
2003 127,213,680 - 25,049,196 357,993,200 4,850,397 515,106,473 1,560,928,706 0.4510
2004 149,375,592 - 26,538,618 393,865,844 5,830,370 575,610,424 1,744,274,012 0.4180
2005 159,583,112 - 22,480,822 421,188,147 5,262,418 608,514,499 1,843,983,330 0.4070
2006 168,372,155 - 22,995,376 406,859,266 5,260,676 603,487,473 1,828,749,918 0.4230
2007 198,374,606 - 23,941,111 466,739,919 5,324,277 694,379,913 2,104,181,555 0.3777
2008 221,422,688 - 21,506,774 480,591,612 6,428,607 729,949,681 2,211,968,730 0.3730
2009 226,625,838 - 24,906,158 409,002,992 7,359,191 667,894,179 2,023,921,755 0.4030
2010 209,483,394 - 23,844,436 368,807,816 9,813,811 611,949,457 1,854,392,294 0.4380
2011 N/A N/A N/A N/A N/A 546,157,943 1,655,024,070 0.4990
(1) Estimated value is based upon an estimate that assessed valuation is approximately 33% of the value.
N/A - 2011 tax levy year data not available at time of the report.
Data Source
Cook County Department of Tax Extension
FRANKLIN PARK, ILLINOIS
ASSESSED VALUE AND ESTIMATED ACTUAL VALUE OF TAXABLE PROPERTY
Last Ten Levy Years
- 83 -

PROPERTY TAX RATES - DIRECT AND OVERLAPPING GOVERNMENTS
Last Ten Levy Years
Tax Levy Year 2002 2003 2004 2005 2006 2007 2008 2009 2010 2011
PARK DISTRICT DIRECT RATES (1)
Corporate 0.0886 0.0967 0.0898 0.0882 0.1185 0.1087 0.1101 0.1344 0.1449 0.1650
Recreation 0.0664 0.0725 0.0673 0.0662 0.0662 0.0597 0.0611 0.0810 0.0799 0.0909
Bonds and interest - - - - - - - - - -
IMRF 0.0078 0.0085 0.0082 0.0081 0.0065 0.0059 0.0060 0.0079 0.0131 0.0151
Liability insurance 0.0353 0.0385 0.0373 0.0367 0.0218 0.0177 0.0151 - 0.0002 0.0002
Auditing 0.0031 0.0034 0.0033 0.0033 0.0024 0.0022 0.0022 0.0027 0.0029 0.0033
Handicapped Fund 0.0235 0.0352 0.0341 0.0348 0.0346 0.0326 0.0335 0.0308 0.0202 0.0226
Social Security 0.0173 0.0189 0.0183 0.0180 0.0185 0.0167 0.0175 0.0199 0.0213 0.0241
Limited Bonds 0.1749 0.1773 0.1592 0.1512 0.1540 0.1330 0.1271 0.1388 0.1550 0.1774
TOTAL PARK DISTRICT DIRECT RATES 0.4169 0.4510 0.4175 0.4065 0.4225 0.3765 0.3726 0.4155 0.4375 0.4986
FINAL TAX RATE 0.4169 0.4510 0.4180 0.4070 0.4230 0.3770 0.3730 0.4030 0.4380 0.4986
OVERLAPPING RATES
Village of Franklin Park 1.225 1.301 1.170 1.160 1.228 1.103 1.095 1.582 1.702 1.929
School District 84 3.048 3.154 2.933 2.922 3.424 3.389 3.374 3.383 3.932 4.343
High School District 212 1.654 2.199 2.030 2.004 2.093 1.868 1.869 1.989 2.223 2.509
Community College 504 0.257 0.269 0.259 0.233 0.240 0.224 0.212 0.214 0.225 0.267
Franklin Park Library 0.172 0.179 0.166 0.165 0.175 0.152 0.152 0.167 0.187 0.213
Cook County 0.534 0.630 0.593 0.533 0.500 0.446 0.415 0.394 0.423 0.462
Forest Preserve 0.061 0.059 0.060 0.060 0.057 0.053 0.051 0.049 0.051 0.058
Other (2) 0.724 0.566 0.534 0.519 0.481 0.444 0.419 0.458 0.474 0.572
TOTAL OVERLAPPING RATES 8.092 8.808 8.163 8.003 8.621 8.056 7.960 8.639 9.655 10.852
(1) Tax rates per $100 of assessed valuation
(2) Suburban Sanitarium, Water Reclamation, Leyden Township, Road and Bridge, General Assistance and Consolidated Elections
Data Source
Office of the County Clerk
2012 Data not available for report
PARK DISTRICT OF FRANKLIN PARK
FRANKLIN PARK, ILLINOIS
- 84 -

Taxable Percentage of Taxable Percentage of
Assessed Total Taxable Assessed Total Taxable
Taxpayer Type of Business Value Rank Assessed Value Taxpayer Type of Business Value Rank Assessed Value
Center Point Properties Warehouse and outlet store 16,331,233$ 1 2.99% Center Point Properties Warehouse and outlet store 13,573,076$ 1 2.61%
GRE Belmont LLC Industrial property 10,755,518 2 1.97% GRE Belmont LLC Industrial property 8,939,035 2 1.72%
AM Castle Wholsesale steel 7,145,570 3 1.31% AM Castle Wholsesale steel 5,938,766 3 1.14%
Sloan Valve Co. Freight car electrical equipment 6,508,534 4 1.19% Sloan Valve Co. Freight car electrical equipment 5,409,318 4 1.04%
KTR Capital Partners Industrial property 5,817,344 5 1.07% KTR Capital Partners Industrial property 4,834,862 5 0.93%
Life Fitness Exercise equipment 5,792,982 6 1.06% Hamilton Partners Industrial property 4,444,926 6 0.85%
Hamilton Partners Industrial property 5,348,170 7 0.98% James Campbell Industrial property 4,124,665 7 0.79%
The Legacy Group Industrial property 4,820,262 8 0.88% The Legacy Group Industrial property 4,006,175 8 0.77%
Entropy Consortium II Industrial property 4,497,488 9 0.82% Magellan Pipeline Industrial property 3,605,031 9 0.69%
Magellan Pipeline Industrial property 4,337,602 10 0.79% Entrophy Consortium II Grocery, frozen goods coop 3,563,731 10 0.69%
TOTAL 71,354,703$ 13.06% TOTAL 58,439,585$ 11.23%
Data Source
Cook County Department of Tax Extension
PARK DISTRICT OF FRANKLIN PARK
FRANKLIN PARK, ILLINOIS
PRINCIPAL PROPERTY TAXPAYERS
Current Year and Nine Years Ago
Tax Levy 2011 Tax Levy 2002
- 85 -

PROPERTY TAX LEVIES AND COLLECTIONS
Last Ten Levy Years
Collected within the
Fiscal Year of the Levy Collections Total Collections to Date
Levy Percentage in Subsequent Percentage
Year Tax Extended Tax Levied Amount of Levy Years Amount of Levy
2002 2,168,440$ 2,167,665$ 2,040,733$ 94.14% 76,846$ 2,117,579$ 97.69%
2003 2,323,130 2,323,363 2,044,713 88.01% 237,649 2,282,362 98.24%
2004 2,405,702 2,402,484 2,294,181 95.49% 14,350 2,308,531 96.09%
2005 2,476,547 2,473,581 2,377,345 96.11% 20,986 2,398,331 96.96%
2006 2,552,584 2,549,995 2,468,422 96.80% (6,955) 2,461,467 96.53%
2007 2,617,679 2,613,730 2,498,628 95.60% 14,271 2,512,899 96.14%
2008 2,698,502 2,719,934 2,475,510 91.01% 159,321 2,634,831 96.87%
2009 2,691,418 2,688,564 1,359,651 50.57% 1,283,518 2,643,169 98.31%
2010 2,680,219 2,677,552 1,233,318 46.06% 1,400,811 2,634,129 98.38%
2011 2,725,202 2,725,328 1,332,433 48.89% 1,150,264 2,482,697 91.10%
Note:
Data Source
Office of the County Clerk
FRANKLIN PARK, ILLINOIS
PARK DISTRICT OF FRANKLIN PARK
Property in the District is reassessed every three years. Property is assessed and then equalized to be approximately 33 1/3% of
actual value.
- 86 -

Governmental Business-Type
Equalized Activities Activities Percent of
Fiscal Tax Assessed General Alternate Total Equalized
Year Levy Value Obligation Installment Revenue Primary Assessed Per
Ended Year Population (1) (in thousands) Bonds Contract Bonds Government Value Capita
2003 2002 15,158 520,009,524$ 1,858,000$ 935,000$ -$ 2,793,000$ 0.54% 184.26$
2004 2003 15,158 515,106,468 1,261,000 780,000 - 2,041,000 0.40% 134.65
2005 2004 15,158 575,550,424 1,273,000 565,000 - 1,838,000 0.32% 121.26
2006 2005 15,158 608,514,499 1,201,000 275,000 - 1,476,000 0.24% 97.37
2007 2006 15,158 603,487,473 852,000 - - 852,000 0.14% 56.21
2008 2007 15,158 694,379,913 850,000 - - 850,000 0.12% 56.08
2009 2008 15,158 729,949,681 2,055,000 - - 2,055,000 0.28% 135.57
2010 2009 14,034 667,884,179 1,235,000 - - 1,235,000 0.18% 88.00
2011 2010 14,034 611,949,457 885,000 - - 885,000 0.14% 63.06
2012 2011 14,034 546,157,943 905,000 - - 905,000 0.17% 64.49
Note: Details of the District's outstanding debt can be found in the notes to financial statements.
Data Source
(1) U.S. Census Info
PARK DISTRICT OF FRANKLIN PARK
FRANKLIN PARK, ILLINOIS
RATIOS OF OUTSTANDING DEBT BY TYPE
Last Ten Fiscal Years
- 87 -

PARK DISTRICT OF FRANKLIN PARK
FRANKLIN PARK, ILLINOIS
RATIOS OF GENERAL BONDED DEBT OUTSTANDING
Last Ten Fiscal Years
Less: Amounts Percentage of
General Available Equalized Percentage of
Fiscal Obligation In Debt Assessed Personal Per
Year Bonds Service Fund Total Value* Income Capita
2003 1,858,000$ 556,702$ 1,301,298$ 0.25% 0.49% 85.85$
2004 1,261,000 543,844 717,156 0.12% 0.27% 47.31
2005 1,273,000 541,487 731,513 0.13% 0.27% 48.26
2006 1,201,000 566,269 634,731 0.10% 0.24% 41.87
2007 852,000 598,909 253,091 0.04% 0.10% 16.70
2008 850,000 631,006 218,994 0.03% 0.08% 14.45
2009 2,055,000 595,433 1,459,567 0.20% 0.50% 96.29
2010 1,235,000 632,193 602,807 0.09% 0.22% 42.95
2011 885,000 615,301 269,699 0.04% 0.10% 19.22
2012 905,000 657,405 247,595 0.05% 0.09% 17.64
Note: Details of the District's outstanding debt can be found in the notes to financial statements.
* See the schedule of Assessed Value and Estimated Actual Value of Taxable Property on
page 83 for property value data.
Data Source
Audited Financial Statements
- 88 -

April 30, 2012
Governmental Unit Gross Debt
Percentage of
Debt
Applicable to
Park District
Park District of
Franklin Park
Share
Park District of Franklin Park 905,000$ 100.00% 905,000$
Village of Franklin Park 80,000 72.35% 57,880
Cook County 3,709,080,000 0.35% 12,981,780
Cook County Forest Preserve Dist. 139,425,000 0.35% 487,988
Metropolitan Water Rec. Dist. 2,446,220,030 0.36% 8,806,392
School District 81 25,386,406 8.03% 2,038,528
School District 83 32,370,000 35.98% 11,646,726
School District 84 8,847,341 60.78% 5,377,414
School District 212 15,875,000 24.36% 3,867,150
TOTAL OVERLAPPING DEBT 6,377,283,777 45,263,858
TOTAL DIRECT AND OVERLAPPING DEBT 6,378,188,777$ 46,168,858$
Data Source
Office of the County Clerk
Note: Overlapping governments are those that coincide, at least in part, with geographic boundries of the
District. This schedule estimates the portion of the outstanding debt of those overlapping governments
that is bourne by the property taxpayers of the District. This process recognizes that, when considering
the District's ability to issue and repay long-term debt, the entire debt burden borne by the property
taxpayers should be taken into account. However, this does not imply that every taxpayer is a resident,
and therefore responsible for repaying the debt, of each overlapping government.
PARK DISTRICT OF FRANKLIN PARK
FRANKLIN PARK, ILLINOIS
DIRECT AND OVERLAPPING GOVERNMENTAL ACTIVITIES DEBT
- 89 -

PARK DISTRICT OF FRANKLIN PARK
FRANKLIN PARK, ILLINOIS
LEGAL DEBT MARGIN INFORMATION
Last Ten Fiscal Years
2003 2004 2005 2006 2007 2008 2009 2010 2011 2012
EQUALIZED ASSESSED VALUATION 520,009,524$ 515,106,473$ 608,514,499$ 608,514,499$ 603,487,473$ 694,379,913$ 729,949,681$ 667,884,179$ 611,949,457$ 546,157,943$
Bonded Debt Limit - 2.875% EAV 17,940,329$ 17,771,173$ 19,856,490$ 20,993,750$ 20,820,318$ 23,956,107$ 25,183,264$ 19,201,670$ 17,593,547$ 15,702,041$
Total net debt
applicable to limit 935,000 780,000 565,000 275,000 - - - - - -
LEGAL DEBT MARGIN 17,005,329$ 16,991,173$ 19,291,490$ 20,718,750$ 20,820,318$ 105,092,625$ 25,183,264$ 19,201,670$ 17,593,547$ 15,702,041$
PERCENTAGE OF LEGAL DEBT MARGIN TO
BONDED DEBT LIMIT 94.8% 95.6% 97.2% 98.7% 100.0% 438.7% 100.0% 100.0% 100.0% 100.0%
Non-Referendum Legal Debt Limit - .575% EAV 2,990,055$ 2,961,862$ 3,498,958$ 3,498,958$ 3,470,053$ 3,992,684$ 4,197,211$ 3,840,334$ 3,518,709$ 3,140,408$
Total net debt
applicable to limit 1,858,000 1,261,000 1,273,000 1,201,000 852,000 850,000 2,055,000 1,235,000 885,000 905,000
LEGAL DEBT MARGIN 1,132,055$ 1,700,862$ 2,225,958$ 2,297,958$ 2,618,053$ 3,142,684$ 2,142,211$ 2,605,334$ 2,633,709$ 2,235,408$
PERCENTAGE OF LEGAL DEBT MARGIN TO
BONDED DEBT LIMIT 37.9% 57.4% 63.6% 65.7% 75.4% 78.7% 51.0% 67.8% 74.8% 71.2%
Data Source
Audited Financial Statements
- 90 -

Last Ten Fiscal Years
Per
Median Median Capita Total
Fiscal Income Income Personal Personal School Unemployment
Year Population (1) Family Household Income (1) Income Enrollment (2) Rate (3)
2003 15,158 54,433$ 46,688$ 17,550$ 266,022,900$ 4,531 6.5%
2004 15,158 54,433 46,688 17,550 266,022,900 4,513 6.2%
2005 15,158 54,433 46,688 17,550 266,022,900 4,642 6.2%
2006 15,158 54,433 46,688 17,550 266,022,900 4,724 4.7%
2007 15,158 54,433 46,688 17,550 266,022,900 4,655 4.7%
2008 15,158 54,433 46,688 17,550 266,022,900 4,662 5.3%
2009 15,158 60,698 56,255 19,434 294,580,572 4,574 9.7%
2010 14,034 60,698 56,255 19,434 272,736,756 4,501 10.3%
2011 14,034 60,698 56,255 19,434 272,736,756 4,118 10.2%
2012 14,034 60,698 56,255 19,434 272,736,756 N/A 9.2%
N/A - Information not available.
Data Source
(1) 2000 and 2010 U.S. Census
(2) Data provided by Illinois State Board of Education School Report Card Data for Districts 83, 84 and 212.
(3) Bureau of Labor Statistics
PARK DISTRICT OF FRANKLIN PARK
FRANKLIN PARK, ILLINOIS
DEMOGRAPHIC AND ECONOMIC INFORMATION
- 91 -
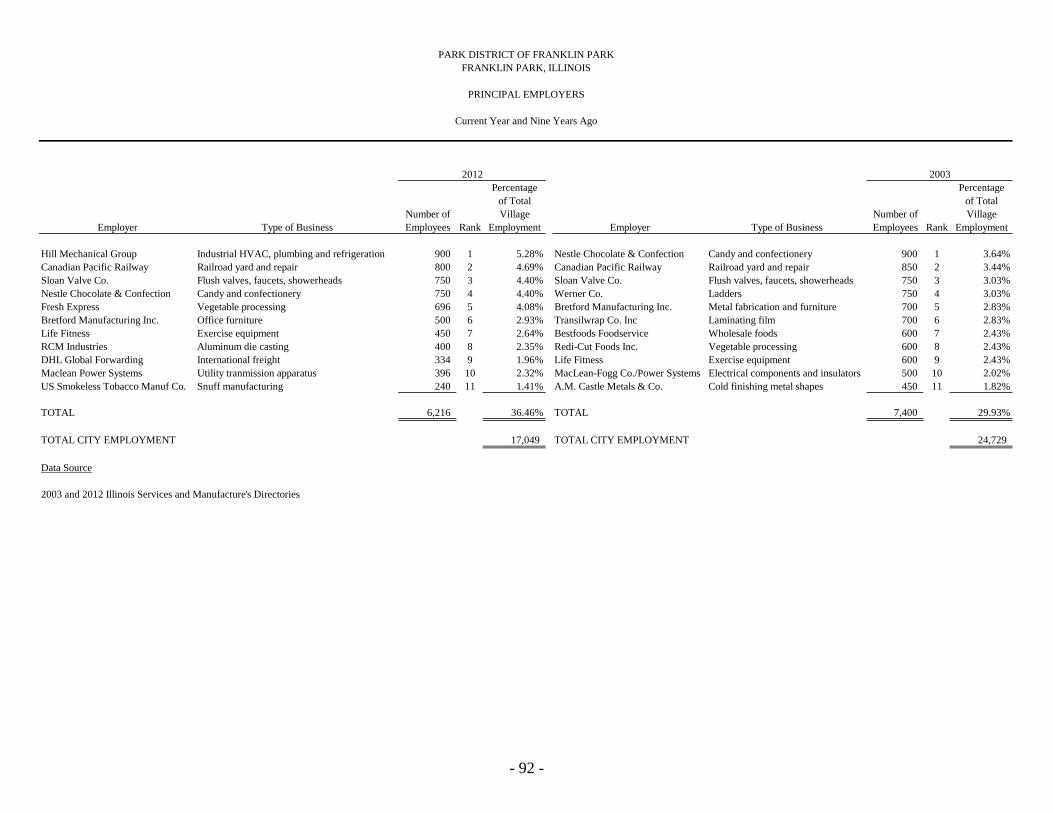
Percentage Percentage
of Total of Total
Number of Village Number of Village
Employer Type of Business Employees Rank Employment Employer Type of Business Employees Rank Employment
Hill Mechanical Group Industrial HVAC, plumbing and refrigeration 900 1 5.28% Nestle Chocolate & Confection Candy and confectionery 900 1 3.64%
Canadian Pacific Railway Railroad yard and repair 800 2 4.69% Canadian Pacific Railway Railroad yard and repair 850 2 3.44%
Sloan Valve Co. Flush valves, faucets, showerheads 750 3 4.40% Sloan Valve Co. Flush valves, faucets, showerheads 750 3 3.03%
Nestle Chocolate & Confection Candy and confectionery 750 4 4.40% Werner Co. Ladders 750 4 3.03%
Fresh Express Vegetable processing 696 5 4.08% Bretford Manufacturing Inc. Metal fabrication and furniture 700 5 2.83%
Bretford Manufacturing Inc. Office furniture 500 6 2.93% Transilwrap Co. Inc Laminating film 700 6 2.83%
Life Fitness Exercise equipment 450 7 2.64% Bestfoods Foodservice Wholesale foods 600 7 2.43%
RCM Industries Aluminum die casting 400 8 2.35% Redi-Cut Foods Inc. Vegetable processing 600 8 2.43%
DHL Global Forwarding International freight 334 9 1.96% Life Fitness Exercise equipment 600 9 2.43%
Maclean Power Systems Utility tranmission apparatus 396 10 2.32% MacLean-Fogg Co./Power Systems Electrical components and insulators 500 10 2.02%
US Smokeless Tobacco Manuf Co. Snuff manufacturing 240 11 1.41% A.M. Castle Metals & Co. Cold finishing metal shapes 450 11 1.82%
TOTAL 6,216 36.46% TOTAL 7,400 29.93%
TOTAL CITY EMPLOYMENT 17,049 TOTAL CITY EMPLOYMENT 24,729
Data Source
2003 and 2012 Illinois Services and Manufacture's Directories
2012 2003
PARK DISTRICT OF FRANKLIN PARK
FRANKLIN PARK, ILLINOIS
PRINCIPAL EMPLOYERS
Current Year and Nine Years Ago
- 92 -

EMPLOYEES BY FUNCTION
Last Ten Fiscal Years
2003 2004 2005 2006 2007 2008 2009 2010 2011 2012
GENERAL GOVERNMENT
Full-time
Executive Director 1 1 1 1 1 1 1 1 1 1
Superintendent of Finance and Technology 1 1 1 1 1 1 1 1 1 1
Superintendent of Parks 1 1 1 1 1 1 1 1 1 1
Human Resource Manager 1 1 1 1 1 1 1 1 1 1
Finance Coordinator 1 - - - - 1 1 1 1 1
Maintenance labor 8 7 6 5 5 5 4 4 3 4
Total full-time 13 11 10 9 9 10 9 9 8 9
Part-time general government 4 4 10 9 8 6 7 8 7 10
Total general government 17 15 20 18 17 16 16 17 15 19
CULTURE AND RECREATION
Full-time
Superintendent of Recreation 1 1 1 1 1 1 1 1 1 1
Recreation and Facilty Managers 3 3 3 3 3 3 2 2 2 2
Marketing and Communications Manager 1 1 1 1 1 1 1 - - -
Center and North Park Facility Manager 1 1 1 1 1 1 1 1 1 1
Clerical - - - - - - - - - -
Total full-time 6 6 6 6 6 6 5 4 4 4
Part-time culture and recreation 112 99 120 123 122 122 117 115 122 115
Total culture and recreation 118 105 126 129 128 128 122 119 126 119
PARK DISTRICT OF FRANKLIN PARK
FRANKLIN PARK, ILLINOIS
- 93 -

2003 2004 2005 2006 2007 2008 2009 2010 2011 2012
ENTERPRISE
Full-time
Ice Arena Manager 1 1 1 1 1 1 1 1 1 1
Assisitant Manager 1 1 1 1 1 1 1 1 1 1
Skate Director 1 1 1 1 1 - - - - -
Mainenance supervisors 3 3 3 3 3 3 3 3 3 3
Operations assistants 2 2 2 2 2 2 2 2 2 2
Total full-time 8 8 8 8 8 7 7 7 7 7
Part-time enterprise 70 67 69 57 56 50 50 57 60 61
Total enterprise 78 75 77 65 64 57 57 64 67 68
TOTAL PARK DISTRICT
Full-time 27 25 24 23 23 23 21 21 19 20
Part-time 186 170 199 189 186 178 174 179 189 186
TOTAL PARK DISTRICT 213 195 223 212 209 201 195 200 208 206
Data Source
Park District Records
- 94 -
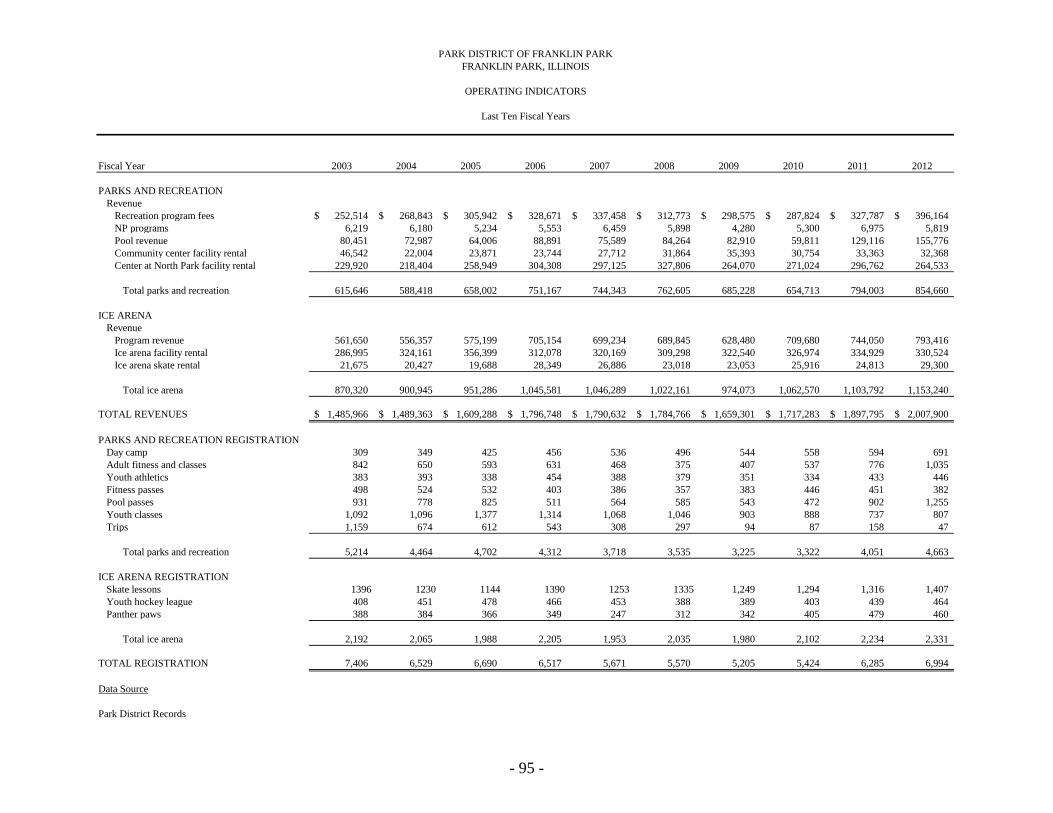
OPERATING INDICATORS
Last Ten Fiscal Years
Fiscal Year 2003 2004 2005 2006 2007 2008 2009 2010 2011 2012
PARKS AND RECREATION
Revenue
Recreation program fees 252,514$ 268,843$ 305,942$ 328,671$ 337,458$ 312,773$ 298,575$ 287,824$ 327,787$ 396,164$
NP programs 6,219 6,180 5,234 5,553 6,459 5,898 4,280 5,300 6,975 5,819
Pool revenue 80,451 72,987 64,006 88,891 75,589 84,264 82,910 59,811 129,116 155,776
Community center facility rental 46,542 22,004 23,871 23,744 27,712 31,864 35,393 30,754 33,363 32,368
Center at North Park facility rental 229,920 218,404 258,949 304,308 297,125 327,806 264,070 271,024 296,762 264,533
Total parks and recreation 615,646 588,418 658,002 751,167 744,343 762,605 685,228 654,713 794,003 854,660
ICE ARENA
Revenue
Program revenue 561,650 556,357 575,199 705,154 699,234 689,845 628,480 709,680 744,050 793,416
Ice arena facility rental 286,995 324,161 356,399 312,078 320,169 309,298 322,540 326,974 334,929 330,524
Ice arena skate rental 21,675 20,427 19,688 28,349 26,886 23,018 23,053 25,916 24,813 29,300
Total ice arena 870,320 900,945 951,286 1,045,581 1,046,289 1,022,161 974,073 1,062,570 1,103,792 1,153,240
TOTAL REVENUES 1,485,966$ 1,489,363$ 1,609,288$ 1,796,748$ 1,790,632$ 1,784,766$ 1,659,301$ 1,717,283$ 1,897,795$ 2,007,900$
PARKS AND RECREATION REGISTRATION
Day camp 309 349 425 456 536 496 544 558 594 691
Adult fitness and classes 842 650 593 631 468 375 407 537 776 1,035
Youth athletics 383 393 338 454 388 379 351 334 433 446
Fitness passes 498 524 532 403 386 357 383 446 451 382
Pool passes 931 778 825 511 564 585 543 472 902 1,255
Youth classes 1,092 1,096 1,377 1,314 1,068 1,046 903 888 737 807
Trips 1,159 674 612 543 308 297 94 87 158 47
Total parks and recreation 5,214 4,464 4,702 4,312 3,718 3,535 3,225 3,322 4,051 4,663
ICE ARENA REGISTRATION
Skate lessons 1396 1230 1144 1390 1253 1335 1,249 1,294 1,316 1,407
Youth hockey league 408 451 478 466 453 388 389 403 439 464
Panther paws 388 384 366 349 247 312 342 405 479 460
Total ice arena 2,192 2,065 1,988 2,205 1,953 2,035 1,980 2,102 2,234 2,331
TOTAL REGISTRATION 7,406 6,529 6,690 6,517 5,671 5,570 5,205 5,424 6,285 6,994
Data Source
Park District Records
PARK DISTRICT OF FRANKLIN PARK
FRANKLIN PARK, ILLINOIS
- 95 -

2003 2004 2005 2006 2007 2008 2009 2010 2011 2012
PARKS
Number of sites 22 22 22 22 22 22 22 22 22 22
Total acres 23.9 23.9 23.9 23.9 23.9 23.9 23.9 23.9 23.9 23.9
FACILITIES
Playgrounds 14 15 15 15 15 16 16 16 16 16
Swimming pool - outdoor 1 1 1 1 1 1 1 1 1 1
Recreation center 2 2 2 2 2 2 2 2 2 2
Indoor ice arena 1 1 1 1 1 1 1 1 1 1
Banquet facility 1 1 1 1 1 1 1 1 1 1
Spray ground - 1 2 2 2 2 2 2 2 2
Skate park - - - - - 1 1 1 1 1
Concession stands 3 3 3 3 3 3 3 3 3 3
Batting cages - - - - - 1 1 1 1 1
Fitness centers 1 1 1 1 1 1 1 1 1 1
Soccer - indoor 2 2 2 2 2 2 2 2 2 2
Soccer - outdoor 2 3 3 3 3 3 3 3 3 3
Badminton court 1 1 1 1 1 1 1 1 1 1
Baseball fields 4 4 4 4 4 4 4 4 4 4
Basketball - indoor 1 1 1 1 1 1 1 1 1 1
Basketball - outdoor 2 3 3 3 3 4 4 4 4 4
Tennis courts - outdoor 1 1 1 1 1 1 1 1 1 1
Picnic areas 14 15 15 15 15 15 15 15 15 15
Volleyballl court - outdoor 2 2 2 2 2 2 2 2 21 21
Jogging and bike trails 1 1 1 1 1 1 1 1 1 1
Data Source
Park District Records
PARK DISTRICT OF FRANKLIN PARK
FRANKLIN PARK, ILLINOIS
CAPITAL ASSET STATISTICS
Last Ten Fiscal Years
- 96 -