freit541
DESCRIPTION
1. Consider the e-mail campaigns discussed in the case. Why do you think these campaigns were successful? Discuss the attention processes that were at work. Do you see any potential drawbacks to this type of marketing?2. During the 2000 Super Bowl, ABC invited viewers to visit its Enhanced TV website. Fans could play trivia, see replays, participate in polls and chat rooms, and view player statistics. The site received an estimated 1 million hits. Why? Frame your answer in terms of exposure, attention, and comprehension.Think about your own Web surfing patterns. Write down the reasons you visit sites. Which of the marketing strategies discussed in the case do you find most (and least) influential?TRANSCRIPT
7/18/2019 FREIT541
http://slidepdf.com/reader/full/freit541 1/38
Technology Gap and International Knowledge Transfer: NewEvidence from the Operations of Multinational Corporations
Nune Hovhannisyany
University of Colorado
Job Market Paper
October 2012
Abstract
Multinational corporations have long been recognized as both major creators of technologyand as conduits of technology transfer. Technology transfer can happen directly, when thea¢liate licenses the technology from the parent, or indirectly, when the a¢liate imports in-termediate goods with embodied technology. This paper estimates the e¤ect of the a¢liates’productivity relative to the frontier — the technology gap — on the choice of licensing thetechnology or importing it through intermediate goods. A novel measure of multinationaltechnology transfer is employed using data on technology licensing payments versus importsfrom U.S. multinationals across many countries and industries. The main …nding of thispaper is that a large technology gap of an a¢liate favors indirect knowledge transfer throughimports. On average, a 10% increase in the technology gap decreases the share of licensingversus importing inputs embodying the technology by 5%. Considering that access to ideasand generation of new ones are crucial for long-run economic growth and convergence of acountry, this study highlights the policy implications for countries to raise their productivitylevels.
Keywords: Multinationals, technology transfer, productivity gap, intermediate inputs,royalties and license fees
JEL: F23, F1, O33, L24
I am grateful to Wolfgang Keller for continuous guidance and support. I would like to thank Murat Iyigun,James Markusen, Keith Maskus, Shushanik Hakobyan, Ben Li, William Olney, and participants of the Universityof Colorado International Trade Seminar Series for very valuable comments and suggestions. I would also like tothank the Business School of American University of Armenia for providing facilities where part of this researchwas conducted.
yDepartment of Economics, University of Colorado, Denver, CO 80217; email:[email protected] ; web: http://nunehovhannisyan.weebly.com
1

7/18/2019 FREIT541
http://slidepdf.com/reader/full/freit541 2/38
1 Introduction
There has been a signi…cant increase in the levels of global trade in goods and services. Two
components of this increase are noteworthy: currently, global trade in ideas is reaching an-
nual levels of $200 billion (World Development Indicators),1 and trade in intermediate inputs
comprises 57% of total trade in goods in OECD countries (Miroudot, Lanz and Ragoussis 2009).
The United States is a major seller of technology, accounting for around 50% of world royal-
ties and license fee receipts (World Development Indicators), and trade in intermediate inputs
in the U.S. accounts for half of total trade in goods (Miroudot et al. 2009). U.S. Multinational
Corporations (MNC) are important conduits of technology transfer, with around two-thirds of
royalties and license receipts coming from intra-…rm transactions and approximately 60% of
total trade within U.S. multinationals being trade in intermediate inputs (The U.S. Bureau of
Economic Analysis).
A MNC can transfer its technology to foreign a¢liates in disembodied form (know-how,
industrial processes, computer software) or in embodied form (intermediate inputs). Flows
of royalty and license receipts from a¢liates to parents for the use of intangible technology
is evidence of disembodied technology transfer, while exports of goods for further processing
from parents to a¢liates can indicate embodied technology transfer. It is well known that
technology transfer is an important determinant of long-term cross-country income, economic
growth and convergence of countries. However, the mode of technology transfer in embodied
versus disembodied form has a di¤erential impact not only on access to current knowledge and
economic growth, but also on innovation, economic welfare, and convergence. The history of the
1 Trade in disembodied ideas is measured by world receipts (or payments) of royalties and license fees.
1

7/18/2019 FREIT541
http://slidepdf.com/reader/full/freit541 3/38
soft drink "Fanta", which was invented by the German a¢liate of the Coca-Cola Company, o¤ers
one example. Possessing the recipe for Coca-Cola but lacking all the required ingredients due to
a shortage in World War II-era Germany, Coca-Cola Deutschland invented this new soft drink
by using the only available ingredients instead. In addition, the mode of technology transfer
might also a¤ect the degree of knowledge spillovers from multinational a¢liates to domestic
…rms, which improves the productivity of the latter.2
What determines the mode of technology transfer within a MNC? This paper provides new
evidence that the technology gap of U.S. MNC foreign a¢liates, de…ned as their productivity
compared to the productivity frontier, is associated with the decision of U.S. multinationals
to export tangible goods versus intangible technology within the MNC. The example of Intel
Corporation illustrates the hypothesis behind this paper. For 25 years, Intel Corporation has
had plants in China where chips (intermediate goods) are shipped for assembly and testing.
But in October 2010, the company announced the opening of a new wafer fabrication facility
(fab) in China capable of using the blueprint to make the actual chips. At the same time, Intel
announced the opening of a chip assembly factory in Vietnam (Takahashi 2010a; 2010b). One of
the reasons why Chinese a¢liates of Intel Corporation currently receive technology in the form
of blueprints while Vietnamese a¢liates receive technology in the for of intermediate goods is
that the former are currently closer to the productivity frontier, while the latter are farther from
the frontier.
A panel data on the activities of U.S. multinationals in 47 host countries and across 7 manu-
facturing industries is employed to analyze the relationship between the a¢liate’s technology gap
2 See Keller (2010) for a survey of evidence on technology spillovers from international trade and foreign directinvestment.
2
7/18/2019 FREIT541
http://slidepdf.com/reader/full/freit541 4/38
and the share of importing technology versus inputs. Focusing on the activities of U.S. MNCs
is attractive as there is information on both the technology and input ‡ows within …rms. These
data come from legally mandated benchmark surveys, conducted every …ve years by the Bureau
of Economic Analysis (BEA), which enable the identi…cation of U.S. parent-a¢liate tangible
and intangible technology transfers across FDI host countries and industries. The technology
gap is measured as the deviation of the a¢liate’s labor productivity from the parent productiv-
ity in the same industry and year. The main …nding of this paper is that the technology gap
is negatively related to the share of disembodied versus embodied technology transfer, with a
10 percent increase in the technology gap on average decreasing the share of licensing versus
importing inputs by 5 percent.
The signi…cance of this paper stems from the realization that, based on industry patterns,
MNCs tend to share know-how with country a¢liates that are more productive, but export
intermediate goods to the less productive ones. The fact that a¢liates which are far from the
frontier receive technology in the form of goods and not disembodied ideas, leads to policy
implications that for developing less-productive countries the reduction in the technology gap
would involve direct access to knowledge and ideas. This not only gives such countries access
to current information, but also stimulates the creation of new knowledge which in itself is
important for long-run economic growth and convergence.
The theory on multinational enterprises identi…es horizontal and vertical directions for For-
eign Direct Investment (FDI). Horizontal FDI arises when multinationals replicate their pro-
duction in host countries to gain market access (Markusen 1984), whereas vertical FDI arises
when di¤erent stages of production are fragmented to take advantage of di¤erences in factor
3
7/18/2019 FREIT541
http://slidepdf.com/reader/full/freit541 5/38
prices (Helpman 1984), intra-industry considerations (Alfaro and Charlton 2009), or interna-
tional transaction costs (Keller and Yeaple 2012).3 Country empirical studies have found that
market sizes, country similarity, factor endowments, and barriers to trade are among the most
important determinants of FDI, while country-industry studies …nd that these factors have a
di¤erential impact on FDI in various industries.4
This paper contributes to the growing body of literature on vertical production sharing
within multinationals, where part of production takes place locally in a¢liates while the other
is imported from parents (Hanson, Mataloni and Slaughter 2005; Fouquin, Nayman and Wagner
2007; Keller and Yeaple 2012). Hanson and coauthors …nd that MNC foreign a¢liate’s demand
for imported inputs is higher in a¢liate countries with lower trade costs, lower wages for less-
skilled labor, and lower corporate income tax rates (Hanson, Mataloni and Slaughter 2005).
Keller and Yeaple (2012) formalize and empirically con…rm that knowledge intensity is another
important determinant for the location of intermediate input production, where it is more dif-
…cult to transfer technology in more knowledge-intensive industries.5 This paper di¤ers from
the work of Hanson and colleagues and Keller and Yeaple by employing a direct measure which
di¤erentiates between transfer of tangible intermediate inputs versus intangible technology from
U.S. parents to a¢liates.
A second body of literature has documented the importance of productivity di¤erences in
subsidiaries of foreign companies for knowledge ‡ows within MNCs.6 Bjorn and coauthors …nd
3 Ekholm, Forslid, and Markusen (2007) formalize "export-platform" FDI with both horizontal and verticalmotivations.
4 See Carr, Markusen and Maskus (2001), Bergstrand and Egger (2007), Brainard (1997) for country studies,and Helpman, Melitz and Yeaple (2004) and Awokuse, Maskus and An (2012) for country-industry studies.
5 Keller and Yeaple (2008) provide key theoretical microeconomic foundations.6 Martin and Salomon (2003) discuss general knowledge transfer capacities in multinational corporations.
4
7/18/2019 FREIT541
http://slidepdf.com/reader/full/freit541 6/38
that the larger the technology gap, the more important the foreign parent as a source of codi…ed
knowledge, de…ned as patents, licenses and R&D (Bjorn, Johannes and Ingmar 2005). Their
study used survey data for foreign …rms in Eastern European countries, but did not include
knowledge embodied in intermediate goods.7 A related study by Dri¢eld, Love and Menghinello
(2010), …nds that Total Factor Productivity (TFP) of foreign a¢liates in Italy is important
for technology transfer from a¢liates to parents (sourcing), but not important for technology
transfer from parents to a¢liates (exploiting).8 Using data on French multinationals, Fouquin,
Nayman and Wagner (2007) …nd that labor productivity of countries is positively associated
with imported-input demand for a¢liates in developed countries, but is negatively related for
a¢liates in developing countries.
This paper adds to the …rst body of literature a relative measure of embodied and disembod-
ied technology to empirical analysis of multinationals’ vertical production networks. In relation
to the second body of literature, this paper explicitly identi…es two forms of knowledge transfer
within MNCs and highlights within-…rm productivity di¤erences of a¢liates as an important
factor in determining the mode of technology transfer. As the decision of transfer occurs within
the …rm, a¢liate productivity may be endogenously determined by MNCs. This is addressed in
the present study relying on a theory of trade, FDI, and technology transfer (Keller and Yeaple
2012). Furthermore, across country and across year variation in labor productivity of a¢liates of
U.S. MNCs within the same manufacturing industry is used to identify not only the direction of
7 See also Gupta and Govindarajan (2000). Using country-level analysis, they …nd that knowledge ‡ows withinmultinationals from home to host country are higher the lower the relative level of economic development of thehost country (measured by GDP per capita).
8 The survey used in Dri¢eld et al. (2010) is based on a binary response to whether there was transferof scienti…c and technological knowledge from parent to a¢liate, which does not distinguish between tangible(intermediate goods) and intangible (patents, licenses, software) forms.
5
7/18/2019 FREIT541
http://slidepdf.com/reader/full/freit541 7/38
the impact, but also parameter estimates. A limitation of this paper is the usage of aggregated
country-industry level data due to inaccessibility of con…dential …rm-level data from the U.S.
Bureau of Economic Analysis.
The remainder of the paper is organized as follows. The next section highlights the theoretical
foundation. Section 3 presents the empirical estimation strategy and discusses estimation issues.
Section 4 details data sources, variable construction, and descriptive statistics. The results are
presented in section 5. Section 6 concludes.
2 Theoretical Foundation
The objective of this paper is to estimate whether there is a connection between the technological
gap of MNC a¢liates and the mode of international knowledge transfer from the multinational
parents to a¢liates across countries and industries. This paper focuses on one parent country’s
(the United States) a¢liates abroad as it imposes certain homogeneity in terms of a¢liate
activities. Assume that U.S. multinationals decided where to locate their foreign a¢liates.9 The
remaining decision involves the type of knowledge transfer, which is measured by the transfer of
technology (know-how, industrial processes) versus intermediate goods from the U.S. parents to
host country a¢liates.10 Direct measures of technology licensing payments and imports of goods
for further processing are used to speci…cally pin down the share of disembodied versus embodied
technology transfer from the U.S. parents to a¢liates. The technology gap of an a¢liate is
9 Since the analysis in this paper is based on industry data, it prevents the study of questions related to the…rm-level location decisions of the U.S. MNC a¢liates abroad.
10 This paper does not include arm’s length technology transfer of U.S. multinational corporations to otheruna¢liated domestic or foreign entities. Within-…rm technology transfer in the form of intermediate inputs andideas from U.S. parents to a¢liates is the main focus of this paper. Other types of embodied technology mightinclude capital goods and people, which are beyond the scope of this paper.
6

7/18/2019 FREIT541
http://slidepdf.com/reader/full/freit541 8/38
measured by the deviation of its labor productivity from the parent’s labor productivity in the
same industry and year.
The approach for estimating the relationship between the technology gap and international
knowledge transfer is as follows. I specify that the share of technology transfer (in intangible and
tangible forms) to an a¢liate country c in industry i, T T ci is a function of the technology gap
of an a¢liate country c in industry i;T Gci and of other observed and unobserved determinants,
Z ci:
TT ci = (TGci; Z ci;); (1)
where is a vector of unknown parameters. The equation (1) can serve as a reduced-form
of a model of technology transfer within multinational corporations. The theoretical model that
motivates the empirical analysis that follows is based on Keller and Yeaple (2012). This model
of trade, FDI, and international technology transfer builds on the transaction costs of interna-
tional activities. There exist shipping costs to transfer intermediates that embody technological
information from the U.S. parents to a¢liates and communication costs to transfer disembod-
ied technology. Shipping costs of moving goods across borders increase with distance from the
parent, while communication costs of transferring disembodied technology are higher in more
knowledge-intensive industries than in less knowledge-intensive industries.
According to this theory, it is harder to transfer technology in more knowledge-intensive
industries because technology is tacit and hard to codify, which means it is best conveyed face-
to-face.11 In the absence of in-person communication, the technology transfer may be more
11 For a discussion of the importance of face-to-face communication for transfering technology, see for exampleKoskinen and Vanharanta (2002) and Hovhannisyan and Keller (2011).
7
7/18/2019 FREIT541
http://slidepdf.com/reader/full/freit541 9/38
imperfect the more knowledge-intensive the industry is. Multinational …rms face a tradeo¤
between trade costs and technology transfer costs, which explains why there is a gravity of
multinational sales, where a¢liate sales fall with distance from the home country.
Since a¢liate sales are positively related to productivity, this theory serves as a concep-
tual framework to explain what drives productivity di¤erences across a¢liate countries and
industries. Trade costs and technology transfer costs increase with distance to the U.S., which is
re‡ected in the lower productivity of a¢liates. Furthermore, for a given distance from the U.S., a
more knowledge-intensive industry, on average, receives lower a¢liate sales (lower productivity).
The theoretical framework suggests taking into account trade costs and technology transfer costs
in driving productivity di¤erences across host countries and industries. The following section
discusses the empirical methodology.
3 Empirical Methodology
Based on the theoretical framework described above, the following estimation equation is em-
ployed:
Lic_imp_sharecit = + T echGapcit + X 1cit + X 2ct + c + t + "cit; (2)
where c indexes a¢liate countries, i indexes industries, t indexes time. Licensing-import
share is de…ned as
8
7/18/2019 FREIT541
http://slidepdf.com/reader/full/freit541 10/38
Lic_import_sharecit = Royalty
_license
_ receipts
citRoyalty_licence_receiptscit + Exports_goods_manuf cit
; (3)
where royalties and license receipts of the U.S. parents from the a¢liates is a measure
of payments for the usage of disembodied technology, and U.S. exports of goods for further
manufacture from U.S. parents to a¢liates is a measure of embodied technology in the form of
intermediate goods.
Technology gap is de…ned as
TechGapcit = ParentLabprodit Labprodcit
ParentLabprodit(4)
where ParentLabprodit is parent labor productivity in an industry and year, and Labprodcit
is a¢liate labor productivity in a country, industry and year.
Based on theory described above (Keller and Yeaple 2012), the productivity of a¢liates falls
with distance from the United States due to increasing trade costs and technology transfer costs.
Furthermore, technology transfer in more knowledge-intensive industries is more costly than in
less knowledge-intensive industries. Thus, the labor productivity of a¢liates is weighted by the
relative distance of the a¢liate country from the U.S., as well as the relative knowledge-intensity
of the industry. The weighted labor productivity Labprodcit is constructed as
Labprodcit = 1
Distc KI it gLabprodcit (5)
9

7/18/2019 FREIT541
http://slidepdf.com/reader/full/freit541 11/38
where Distc is geographical distance between the U.S. and the a¢liate country, KI it is
knowledge-intensity of an industry measured by parent R&D expenditures over sales (following
Keller and Yeaple 2012), and gLabprodcit is unweighted labor productivity of a¢liates.
Turning to remaining variables of equation (2), X 1 is a vector of control variables at the
country-industry-year level such as trade costs, X 2 is a vector of control variables at the country-
year level such as population, GDP per capita, and human and physical capital per worker, c
are country …xed e¤ects, and t are time …xed e¤ects. It is expected that the coe¢cient on
will be negative, implying that the smaller the technology gap of an a¢liates is (closer to frontier
productivity), the more the a¢liate will import technology directly (paying royalties and license
fees) relative to importing goods for further processing.12
It is important to mention that licensing-import share is bounded between 0 and 1 with
clusters of values at extreme points. We can employ a two-part Tobit model which is a widely
used estimation method for censored data. Greene (2004) shows that maximum likelihood
estimates of Tobit with …xed e¤ects exhibit almost no bias, and incidental parameter problems
do not need special adjustment. An alternative to Tobit is fractional logit model, suggested by
Papke and Wooldridge (1996; 2008), where conditional mean is modeled as a logistic function.
Before turning to the empirical analysis and results, the next section gives an overview of the
data and descriptive statistics of the main variables.
12 In the robustness analysis, other measures of frontier will be employed as well.
10
7/18/2019 FREIT541
http://slidepdf.com/reader/full/freit541 12/38
4 Data
4.1 Main Variables
The primary data used in this paper are based on operations of U.S. MNCs abroad and come
from the United States Bureau of Economic Analysis (BEA). The data cover 47 countries where
U.S. multinationals have a¢liates, span 7 NAICS manufacturing industries, and include 2 bench-
mark survey years (1999 and 2004). The manufacturing industries used in the analysis are food,
chemicals, primary and fabricated metals, machinery, computers and electronic products, elec-
trical equipment, appliances and components, and transportation equipment. The list of a¢liate
countries used in the analysis is given in Appendix 1. The analysis is restricted to the benchmark
survey years because part of the data is available only in these surveys. 13 Additionally, industry
classi…cation has changed from SIC to NAICS, which prevents using earlier benchmark years.14
Licensing-Import Share is constructed using data on royalties and license fees received
by U.S. parents and on U.S. exports of goods shipped to majority-owned a¢liates for further
processing. Royalties and license receipts, net of withholding taxes, received by U.S. parents
from its a¢liates comes from the balance of payments and direct investment position data
in 1999 and 2004.15,16 Data on royalties and license receipts o¤er an appropriate measure of
13 U.S. exports of goods for further manufacture, processing and assembly is only collected in benchmark surveyyears.
14 The other benchmark survey years are 1989 and 1994. The publicly available data from BEA by country-industry are based on broadly de…ned industries. Due to a change in classi…cation from SIC to NAICS, the
Computers and Electronic Products manufacturing category was added, which would not allow direct comparisonacross industries with earlier benchmark years.
15 A more precise measure would be royalties and license receipts by U.S. parents from its majority-ownedforeign a¢liates or payments to U.S. parents by its ma jority-owned foreign a¢liates. Unfortunately, b enchmarksurveys of 1999 and 2004 do not provide that type of detailed data broken down by country-industry. Overall,around 90% of royalties and license fee receipts by U.S. parents from foreign a¢liates are from majority-ownedforeign a¢liates.
16 Using data on royalties and license fees which are net of withholding taxes, tax p olicy di¤erences across
11
7/18/2019 FREIT541
http://slidepdf.com/reader/full/freit541 13/38
direct technology as these receipts are for the use or sale of intangible property or rights such
as patents, industrial processes, trademarks, copyrights, franchises, manufacturing rights, and
other intangible assets or proprietary rights (U.S. Direct Investment Abroad: Final Results
from the 1999 Benchmark Survey, 2004).17 Overall, approximately 50% of royalties and license
fee payments from foreign a¢liates to U.S. parents are for industrial processes which are most
closely related to the payments for the usage of disembodied technology. 18
Royalty and license receipts re‡ect the value of technology transfer, which could re‡ect
changes in the volume of technology or changes in price. There are widely known di¢culties
with pricing and units of output of intangibles (Robbins 2009). Robbins notes that royalty
payments for licensing of industrial processes often consist of a lump-sum payment and a royalty
as a percentage of receipts.19 In terms of price, transfer pricing is such that under U.S. law
multinationals are required to charge the same price for intra-…rm transactions on intangible
assets as for unrelated arm’s length transactions (Feenstra et al. 2010). Another di¢culty with
royalty and license receipts lies in the value of technology transfer that …rms report, particularly
coming from di¤erent countries. Branstetter and coauthors argue that under U.S. tax codes and
the laws of foreign countries, there are restrictions on how U.S. multinationals make and value
royalty payments. Furthermore, U.S. multinationals charge the same royalties for a¢liates in
di¤erent countries in order to avoid scrutiny from tax authorities (Branstetter et al. 2006).
a¢liate countries should be mitigated.17 See Howestine (2008) who describes various innovation-related data in the BEA international economic
surveys.18 Data on royalties and license fees broken down by the type of intangible asset between a¢liated parties is
available starting from 2006. On average in the period 2006-2009, U.S. parents’ receipts of royalties and licensefees from a¢liates included 50% of receipts for industrial processes, 30% for general use computer software, 15%for trademarks, and 5% for franchise fees, with the remainder to other categories.
19 Vishwasrao (2007) explores the factors determining the type of payments (up-front fees, royalties, or a com-bination of both) for the technology transfer based on …rm and industry characteristics for subsidiaries as well asfor una¢liated …rms.
12
7/18/2019 FREIT541
http://slidepdf.com/reader/full/freit541 14/38
Data on the U.S. exports of goods comes from 1999 and 2004 benchmark surveys and is
measured by the United States (either from the U.S. parent or another party) exports of goods
shipped to majority-owned a¢liates for further processing, assembly, or manufacture.20,21 In
2004, exports for further processing from the U.S. parents to foreign a¢liates were 60% of total
exports and 90% within the manufacturing industry (BEA).
Technology gap is constructed using data on the gross product and number of employees
of U.S. MNC parents and majority-owned foreign a¢liates from the BEA. First, labor produc-
tivity of MNC parents is calculated as gross product (value added) divided by the number of
employees for a given industry and year. It is taken as the frontier for a given industry and
year. Then, labor productivity of majority-owned foreign a¢liates is calculated as gross product
(value added) divided by the number of employees for a given country, industry and year. 22 Fi-
nally, labor productivity of a¢liates is weighted according to equation (5), where distance data
is obtained from CEPII and R&D data from the BEA. The technology gap of a given a¢liate is
constructed as a relative di¤erence from the frontier labor productivity (see equation 4). In this
form, di¤erences in productivity across industries are controlled for, and the identi…cation of
technology gap comes from variation across a¢liate countries and years in a given manufacturing
industry.
20 Although the U.S. exports of goods for further manufacture includes goods shipped from the U.S. parents orother U.S. entities, overall around 85% of imports by a¢liates from the United States is from the U.S. parents.
21 Because of non-disclosure and con…dentiality, the BEA does not provide small portion of data for royalties
and license fees and for U.S. exports of goods for further manufacture broken down by country and industry.Data given in a range [-$500,000; $500,000] is coded as $500,000; data is …lled in with the same number forobservations where country-industry data is available for one year and missing for another (11% for exports, and3% for royalties).
22 Due to con…dentiality, a small portion of employment …gures is given in ranges; in those cases, the midpointof the range is taken.
13
7/18/2019 FREIT541
http://slidepdf.com/reader/full/freit541 15/38
4.2 Controls
Research & Development expenditures (R&D) are considered an important determinant of tech-
nology transfer. Overall, a¢liate R&D expenditures in manufacturing comprise around 15-17%
of parent R&D expenditures in the period of analysis (U.S. BEA). However, there are consid-
erable di¤erences of aggregate industry-level a¢liate R&D expenditures as a fraction of parent
R&D expenditures. For example, in 1999 food industry a¢liates performed around 40% of
expenditures compared to U.S. parents, while in the electronics industry in the same year the
…gure was around 5%. Therefore, to control for these di¤erences, R&D ratio of a¢liate R&D
expenditures to parent R&D expenditures is constructed from U.S. BEA data. To account for
potential endogeneity of R&D expenditures, previous year’s R&D data is used for both parents
and a¢liates. It is expected that the more R&D a¢liates perform, compared to their U.S.
parents in that industry, the larger will be the share of imported technology versus goods, as
in these industries a¢liates’ ability to use know-how directly will be increased. One possible
reason is that if an a¢liate performs R&D itself, it can understand the technology better as
technology tends to be tacit.
Although the empirical analysis controls for country and year …xed e¤ects, there may still
be di¤erences across host country a¢liates over time, and across industries. One of the most
important factors that will impact licensing-import share is trade costs, as it is costly to transfer
goods across borders. Following Hanson and colleagues (2005) and Keller and Yeaple (2012),
ad-valorem trade costs at country-industry-year level are constructed as a sum of freight costs
and tari¤s:
cit = 1 + freightcit + tariff cit; (6)
14

7/18/2019 FREIT541
http://slidepdf.com/reader/full/freit541 16/38
Both freight costs and tari¤ measures at the country-industry-year level are constructed
following the methodology of Hanson and coauthors (2005) and Keller and Yeaple (2012).23,24
Freight costs are calculated as the ratio of import charges over customs value of imports. Tari¤s
are obtained from the TRAINS database using WITS software of the World Bank.25
There are vast di¤erences across a¢liate countries in the level of development, size, factor
endowments and other economic factors that might drive di¤erences in U.S. FDI. To control
for host country’s development level and size, population and GDP per capita are obtained
from Penn World Tables (PWT 6.3). Intellectual Property Rights Protection (IPR) in a¢liate
countries might also be an important determinant for the transfer of technology from the U.S.
parent to a¢liate.26 The IPR protection index is obtained from Park (2008). Human capital per
worker is constructed using data from Barro and Lee (2010) Educational Attainment Dataset for
average years of schooling for individuals over 25 and employment …gures from Yearbook of Labor
Statistics (International Labor Organization). Physical capital per worker is constructed using
perpetual inventory method and data from Penn World Tables (PWT 6.3) and the International
Labor Organization.27
23 Using highly disaggregated data on U.S. imports in HS classi…cation from www.internationaldata.org for 1999and 2004, freight cost value is calculated as import charges (freight, insurance and other charges) over customsvalue of imports. To aggregate these …gures to BEA industry classi…cation, freight cost value is weighted by therelative importance of a given HS code in BEA code based on U.S. exports to that country.
24 I am grateful to Wolfgang Keller and Stephen Yeaple for help with trade cost data.25 Weighted tari¤s in 4-digit SIC classi…cation is extracted from WITS software of the World Bank and matched
to BEA classi…cation.26 Branstetter et al. (2006) …nd connection between stronger IPR and increased technology transfer within
multinational corporations.27 In addition, there might be location-based di¤erences and interdependencies in knowledge acquisition acrossa¢liate countries (see e.g. Leonardi 2010), which are mitigated by including country …xed e¤ects.
15
7/18/2019 FREIT541
http://slidepdf.com/reader/full/freit541 17/38
4.3 Descriptive Statistics
The …nal sample is an unbalanced panel of 47 countries, 7 manufacturing industries, and 2 years
(1999 and 2004). Summary statistics of the main variables are presented in Table 1. 28 On aver-
age, exports of goods for further manufacture is around 8 times larger than royalties and license
receipts.29 Both royalties and license fees and exports of goods for further processing are quite
dispersed with a large standard deviation. Licensing-import share, representing a technological
measure of preference between imports of goods versus technology, is bounded between 0 and 1
by construction, with the smaller values representing a preference towards importing of inter-
mediates and the larger values preference towards licensing the technology. Figure 1 presents a
histogram of licensing-import share which shows that around 30% of observations are close to
zero, with 15% of values being strictly zero and 2% of values being 1. 30
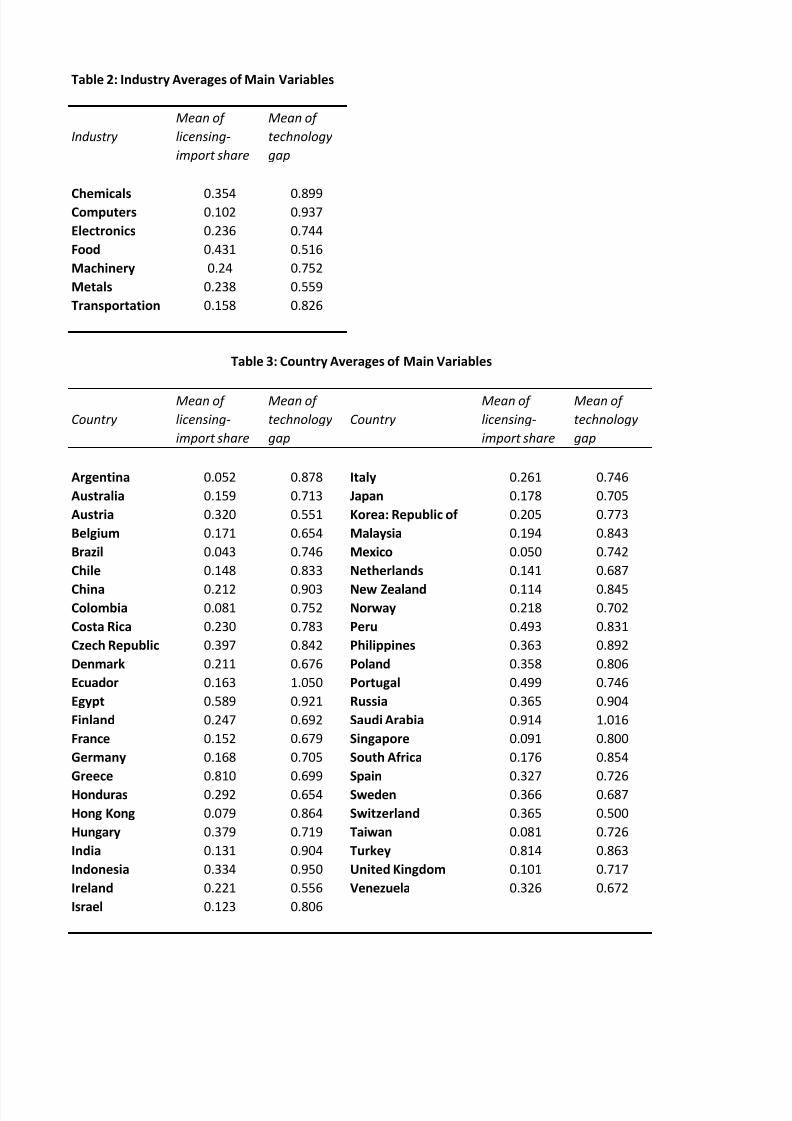
Table 2 presents industry averages of licensing-import share and technology gap variables.
On average, the highest licensing-import share is observed in the food industry (0.431), and the
lowest in computers (0.102). The technology gap varies on average from 0.516 in food to 0.937
in computers. Country averages of licensing-import share and technology gap are presented
in Table 3. On average, the lowest licensing-import share is in Brazil (0.043) and the highest
licensing-import share across countries is in Saudi Arabia (0.914). The variation in technology
gap ranges from 0.5 in Switzerland to 1.050 in Ecuador on average.31
28 In this analysis, I focus on positive numbers of technology gap, as my analysis does not apply to the case whenweighted labor productivity of a¢liates is larger than parent labor productivity. Since weighted labor productivityis based on distance, Canada is a large outlier which is dropped from the analysis.
29 Feenstra et al. (2010) discuss various reasons for mismeasurement of international trade in ideas. Particularly,they note that the values of receipts from sales of intangible assets are relatively small b ecause of possibleunderreporting of a¢liates and/or high threshold values for mandatory reports.
30 Around 34% of royalties and license fees are zero, and around 24% of U.S. exports of goods for manufactureare zero, which by construction results in 15% of zero values in licensing-import share variable.
31 There were industries where Ecuador had negative gross product which resulted in a technology gap higher
16

7/18/2019 FREIT541
http://slidepdf.com/reader/full/freit541 18/38
The empirical strategy controls for country and year …xed e¤ects, so general di¤erences across
a¢liate countries and across years are controlled. Additionally, since labor productivities di¤er
across industries, technology gap compares labor productivities within the same industry-year.
The next section presents the empirical results.
5 Results
The goal of the empirical analysis is to estimate a relationship between the technology gap of
U.S. multinationals foreign a¢liates and licensing-import share: import of technology versus
import of goods. Table 4 presents initial estimation results of the equation (2) using Ordinary
Least Squares (OLS). All columns include year …xed e¤ects, columns 1 to 5 include country …xed
e¤ects, while in column 6 country …xed e¤ects are omitted to analyze across host country a¢liate
di¤erences. Robust standard errors, which allow for clustering by country-year, are shown in
parentheses. Column 1 shows that there is a strong negative correlation between a¢liates’
technology gap and their licensing-import share: within an industry, foreign a¢liates with a
large technology gap from parents import relatively less technology in the form of blueprints
and designs and more in the form of intermediate goods.
The addition of trade costs in column 2 decreases the coe¢cient of technology gap only
slightly from 0:188 to 0:164 while it remains highly signi…cant at 1 percent. As expected,
trade costs are estimated to be positive and signi…cant, showing that import of goods is nega-
tively related to trade barriers, resulting in a larger licensing-import share. In column 3 the ratio
of industry-level R&D expenditures of a¢liates to parents is added. The R&D ratio results in a
than 1.
17
7/18/2019 FREIT541
http://slidepdf.com/reader/full/freit541 19/38
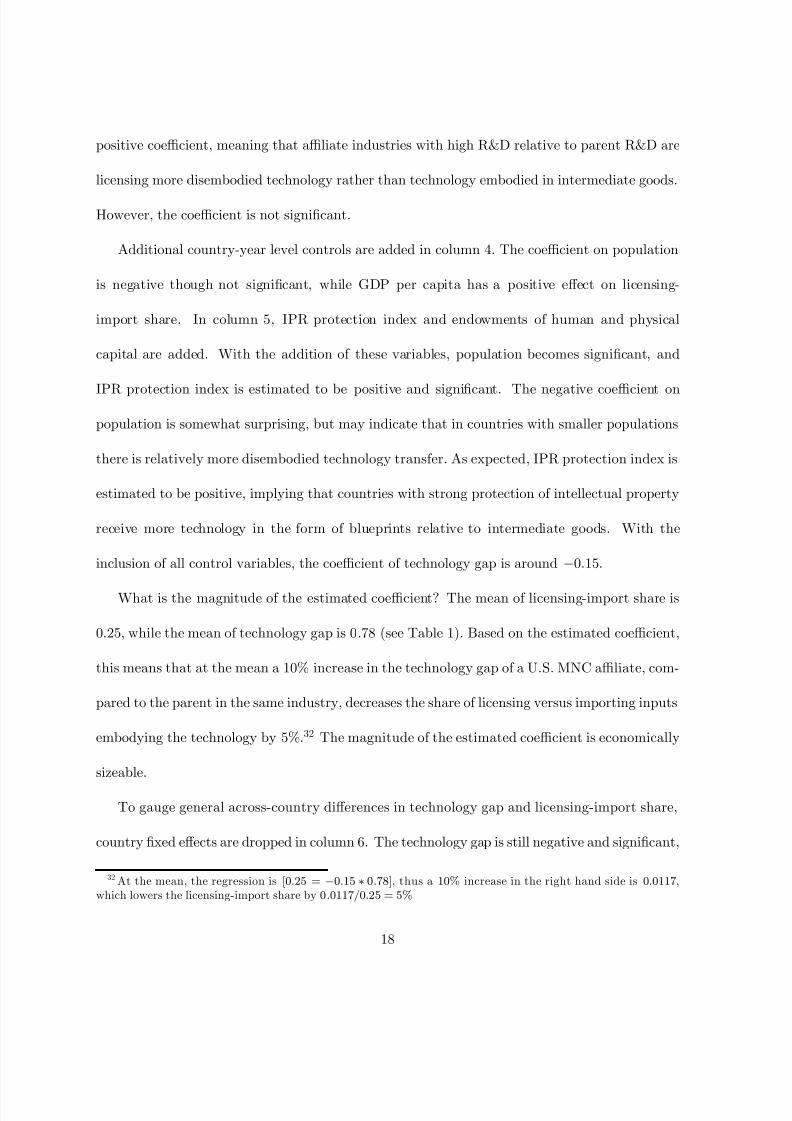
positive coe¢cient, meaning that a¢liate industries with high R&D relative to parent R&D are
licensing more disembodied technology rather than technology embodied in intermediate goods.
However, the coe¢cient is not signi…cant.
Additional country-year level controls are added in column 4. The coe¢cient on population
is negative though not signi…cant, while GDP per capita has a positive e¤ect on licensing-
import share. In column 5, IPR protection index and endowments of human and physical
capital are added. With the addition of these variables, population becomes signi…cant, and
IPR protection index is estimated to be positive and signi…cant. The negative coe¢cient on
population is somewhat surprising, but may indicate that in countries with smaller populations
there is relatively more disembodied technology transfer. As expected, IPR protection index is
estimated to be positive, implying that countries with strong protection of intellectual property
receive more technology in the form of blueprints relative to intermediate goods. With the
inclusion of all control variables, the coe¢cient of technology gap is around 0:15:
What is the magnitude of the estimated coe¢cient? The mean of licensing-import share is
0:25, while the mean of technology gap is 0:78 (see Table 1). Based on the estimated coe¢cient,
this means that at the mean a 10% increase in the technology gap of a U.S. MNC a¢liate, com-
pared to the parent in the same industry, decreases the share of licensing versus importing inputs
embodying the technology by 5%:32 The magnitude of the estimated coe¢cient is economically
sizeable.
To gauge general across-country di¤erences in technology gap and licensing-import share,
country …xed e¤ects are dropped in column 6. The technology gap is still negative and signi…cant,
32 At the mean, the regression is [0:25 = 0:15 0:78], thus a 10% increase in the right hand side is 0:0117,which lowers the licensing-import share by 0:0117=0:25 = 5%
18

7/18/2019 FREIT541
http://slidepdf.com/reader/full/freit541 20/38
although the magnitude of the coe¢cient decreases from around 0:15 to around 0:118. It is
surprising that GDP per capita becomes negative and signi…cant, while IPR protection becomes
insigni…cant. Overall, the results from table 4 indicate that there is a signi…cant e¤ect of
technology gap on licensing-import share.
Although the OLS results reported in Table 4 provide important benchmark estimates, addi-
tional econometric models are estimated in Table 5. For convenience, column 1 repeats the OLS
regression presented in Table 4 (column 5), while other econometric speci…cations are presented
in columns 2 to 5. Alternative estimation methods to OLS are median and robust regressions
which are presented in columns 2 and 3. Robust regression is using iteratively reweighted least
squares. Looking at column 2, the coe¢cient of robust regression is much smaller (0:065 com-
pared to 0:150), while it is highly signi…cant. The coe¢cients on controls are similar to OLS
results. Median regression has an advantage over OLS in the presence of outliers. It is per-
formed as a quantile regression which minimizes the sum of absolute errors. However, quantile
regression does not allow clustering of standard errors. The coe¢cient on technology gap is
negative and signi…cant, and the magnitude of the coe¢cient is somewhat smaller compared to
OLS (0:108 compared to 0:150). Overall, the signs of all variables are similar to the OLS
results.
As mentioned previously, the dependent variable is a share with values strictly between 0
and 1 and around 15 percent of zeroes. The possible reason for the existence of zeroes is that
data on both royalties and license receipts and exports of goods for further manufacture are
recorded only when a certain threshold is passed. Therefore, equation 1 is estimated as a two-
way censored Tobit model in column 4. Column 4 shows that technology gap has a negative
19

7/18/2019 FREIT541
http://slidepdf.com/reader/full/freit541 21/38
and signi…cant e¤ect on licensing-import share, however the magnitudes of the estimates are
not directly comparable with OLS. Fractional logit estimates, which model conditional mean
as a logistic function, are presented in column 5. The general direction of coe¢cient estimates
is similar in the latter model, but the magnitudes are di¤erent. On the whole, in all alterna-
tive econometric speci…cations, the technology gap variable is estimated negative and highly
signi…cant.
Licensing-import share is constructed by combining data on embodied and disembodied
technological transfer. To understand the di¤erences between these two types of technology
transfer, decomposition of the dependent variable is performed in Table 6. For convenience,
column 1 of Table 6 repeats the benchmark estimates of Table 4 (column 5) with licensing-import
share as the dependent variable. In column 2, the dependent variable is intermediate goods
import intensity, constructed as U.S. exports of goods for further manufacture divided by a¢liate
sales. As expected, the coe¢cient on technology gap is estimated to be positive and signi…cant,
implying that a¢liates with a large technology gap on average import more intermediate goods.
Additionally, the coe¢cient on trade costs is negative and signi…cant, meaning that trade costs
decrease intermediate goods import intensity. Turning to column 3, where the dependent variable
is disembodied technology transfer intensity (royalty and license fees divided by a¢liate sales),
as expected the coe¢cient is negative although not signi…cant. The sign of the coe¢cient implies
that a¢liates with large technology gap receive relatively less technology in disembodied form.
The fact that technology gap in this case is not signi…cantly estimated probably has to do with
small values of royalty and license fees. Overall, the decomposition analysis of licensing-import
share conforms to our expectations.
20

7/18/2019 FREIT541
http://slidepdf.com/reader/full/freit541 22/38
The technology gap of a¢liates is constructed using parent productivity as the frontier and
is based on weighted labor productivity of a¢liates (see equations 4 and 5). Table 7 presents
results using alternative measures of technology gap. Column 1 repeats the benchmark estimates
of Table 4 (column 5) for convenience. Recall that labor productivity is weighted by the relative
distance of a¢liate country and relative knowledge intensity of an industry (see equation 5). In
column 2, technology gap is constructed based on unweighted labor productivity. The coe¢cient
on technology gap is still negative and signi…cant, however the magnitude of the coe¢cient
decreases from 0:150 to 0:117. The weighted coe¢cient is larger, which shows that it is
important to account for di¤erences in proximity of a¢liates of U.S. parents to home, as well as
the knowledge-intensity of an industry.
Another feasible option for de…ning technology gap involves using a di¤erent frontier measure.
To test the robustness of using parent productivity as a frontier, we can de…ne the frontier as
the most productive a¢liate in the same industry and year, as it is possible that parents and
a¢liates perform di¤erent tasks. Then, the technology gap of a given a¢liate is de…ned as
a relative di¤erence from the most productive a¢liate in the same industry and year. It is
important to note that in all cases, the frontier a¢liate comes from a high-income country
a¢liate. The results of this exercise are reported in column 3 of Table 7. Using a¢liate frontier,
the coe¢cient on technology gap is estimated to be negative and signi…cant and close to the
benchmark (0:147 compared to benchmark 0:150). Additionally, the signs and estimates of
the controls are very similar to the benchmark estimates. This shows that the results are not
sensitive to the de…nition of the frontier.
As an additional robustness check, technology gap based on productivity per a¢liate versus
21

7/18/2019 FREIT541
http://slidepdf.com/reader/full/freit541 23/38
productivity per worker is constructed. Using data on the number of a¢liates separately by
country and by industry, the number of a¢liates by country-industry is calculated. Productivity
per a¢liate is constructed as gross product divided by the number of a¢liates. In a similar
fashion, productivity per parent is constructed. Then, the technology gap is calculated as a
relative deviation of productivity per a¢liate from productivity per parent. The results using
productivity per a¢liate are presented in column 4 of Table 7. The estimated coe¢cient on
technology gap using productivity per a¢liate is not signi…cantly estimated. However, the sign
of the coe¢cient is still negative. Overall, this table shows that the main results of this paper
are not sensitive to the de…nition of frontier used in the construction of technology gap. In all
four cases, technology gap is negatively associated with licensing-import share.
6 Conclusions
Multinational corporations are the main mediators of the worldwide increase in technology trade.
Intermediate inputs and know-how are the two forms of technology (tangible and intangible)
transferred within multinational corporations that this paper has examined. This paper analyzed
what determines the decision of multinationals on the form of technology transfer to its a¢liates,
using data on U.S. multinational activity in 47 countries, 7 manufacturing industries and 2 years.
Detailed data on exports of goods for further processing, as well as royalties and license payments
observed between U.S. MNC parents and their a¢liates, enables us to speci…cally identify two
types of knowledge transfer from parents to a¢liates.
The main …nding of this paper is that the technology gap, measured as the relative labor
productivity di¤erence from the frontier, is negatively related to the share of direct versus indirect
22

7/18/2019 FREIT541
http://slidepdf.com/reader/full/freit541 24/38
transfer of knowledge from U.S. parents to a¢liates. Relatively more productive a¢liates get
technology in the form of know-how, industrial processes, etc., while relatively less productive
a¢liates receive technology in the form of intermediate inputs. The magnitude of the e¤ect is
sizeable: a 10 percent increase in the technology gap of a¢liates decreases the share of licensing
versus importing inputs by 5 percent, on average. These results suggest that productivity of
a¢liates is an important determinant for knowledge transfer within multinational corporations.
The transfer of technology is central to modern economics because of its implications for long-
term cross-country income, economic growth and convergence of countries. Access to knowledge
and know-how are obtained by MNC a¢liates from their parents, as well as via spillovers from
those a¢liates to domestic …rms. Regardless of how such knowledge is gathered, it amounts to
an avenue for innovation and income growth. Based on the results mentioned above, this study
points to policy implications for countries to raise their productivity levels. Taking into account
that the presence of MNC a¢liates and the performance of those a¢liates are contributing
factors to the productivity levels of a country, policymakers should also think about creating
more appealing atmosphere for MNCs, including such factors as favorable entry criteria and tax
implications.
While this paper provides initial evidence on the relationship between the technology gap and
the mode of technology transfer in multinational corporations, there are important extensions
that should be considered in future work. First, obtaining …rm-level or more disaggregated
industry data will enable to the examination of this question without potential aggregation bias.
Second, it would be interesting to add a direct measure of technology, and explicitly model the
process of innovation in the framework of technology transfer. Third, it would be useful to
23

7/18/2019 FREIT541
http://slidepdf.com/reader/full/freit541 25/38
extend this analysis to other samples to see if the results continue to hold. A promising avenue
involves the use of data on Swedish multinationals. In addition, there are complementarities
between productivity and R&D expenditures that this paper has not addressed. Finally, there
are important questions on whether the type of FDI matters for the mode of technology transfer.
24
7/18/2019 FREIT541
http://slidepdf.com/reader/full/freit541 26/38
References
Alfaro, L., and Charlton, A. 2009, "Intra-Industry Foreign Direct Investment", American Eco-
nomic Review , vol. 99, no. 5, pp. 2096-2119.
Awokuse, T.O., Maskus, K.E. and An, Y. 2012, "Knowledge Capital, International Trade, and
Foreign Direct Investment: a Sectoral Analysis”, Economic Inquiry , vol. 50, no. 3, pp. 707-723.
Barro, R.J. and Lee, J.W. 2010, "A New Data Set of Educational Attainment in the World,
1950–2010".
Bergstrand, J.H. and Egger, P. 2007, "A Knowledge-and-Physical-Capital Model of Interna-
tional Trade Flows, Foreign Direct Investment, and Multinational Enterprises", Journal of
International Economics , vol. 73, no. 2, pp. 278-308.
Björn, J., Johannes, S. and Ingmar, K. 2005, "Industry Level Technology Gaps and Comple-
mentary Knowledge Stocks as Determinants of Intra-MNC Knowledge Flows", Journal of
Economics and Business , vol. 8, no. 1&2, pp. 137-156.
Brainard, S.L. 1997, "An Empirical Assessment of the Proximity-Concentration Tradeo¤ be-
tween Multinational Sales and Trade", American Economic Review , vol. 87, no. 4, pp. 520-
544.
Branstetter, L.G., Fisman, R. and Foley, C.F. 2006, "Do Stronger Intellectual Property Rights
Increase International Technology Transfer? Empirical Evidence from U. S. Firm-Level Panel
Data", Quarterly Journal of Economics , vol. 121, no. 1, pp. 321-349.
25

7/18/2019 FREIT541
http://slidepdf.com/reader/full/freit541 27/38
Carr, D., Markusen, J. and Maskus, K.E. 2001 "Estimating the Knowledge-Capital Model of
the Multinational Enterprise", American Economic Review , vol. 91, no. 3, pp. 693-708.
Dri¢eld, N., Love, J.H. and Menghinello, S. 2010, "The Multinational Enterprise as a Source
of International Knowledge Flows: Direct Evidence from Italy", Journal of International
Business Studies , vol. 41, no. 2, pp. 350-359.
Ekholm, K., Forslid, R. and Markusen, J.R. 2007, "Export-Platform Foreign Direct Investment",
Journal of the European Economic Association , MIT Press, vol. 5, no. 4, pp. 776-795
Feenstra, R.C., Lipsey, R.E., Branstetter, L.G., Foley, C.F., Harrigan, J., Jensen, J.B., Kletzer,
L., Mann, C., Schott, P.K. and Wright, G.C. 2010, "Report on the State of Available Data for
the Study of International Trade and Foreign Direct Investment", Working Paper No. 16254
, National Bureau of Economic Research.
Fouquin, M., Nayman, L. and Wagner, L. 2007, “Vertical Production Networks: Evidence from
France”. Economics Discussion Papers, No 2007-18.
Greene, W. 2004, "Fixed E¤ects and Bias due to the Incidental Parameters Problem in the
Tobit Model", Econometric Reviews , No. 2, pp. 125-148.
Gupta, A. and Govindarajan, V. 2000, "Knowledge Flows within MNCs", Strategic Management
Journal , vol. 21, no. 4, pp. 473–496.
Hanson, G.H., Mataloni Jr, R.J. and Slaughter, M.J. 2005, "Vertical Production Networks in
Multinational Firms", Review of Economics and Statistics , vol. 87, no. 4, pp. 664-678.
26

7/18/2019 FREIT541
http://slidepdf.com/reader/full/freit541 28/38
Helpman, E. 1984, "A Simple Theory of International Trade with Multinational Corporations",
Journal of Political Economy , pp. 451-471.
Helpman, E., Melitz, M.J. and Yeaple, S.R. 2004, "Export versus FDI with Heterogeneous
Firms", American Economic Review , vol. 94, no. 1, pp. 300-316.
Hovhannisyan, N. and Keller, W. 2011, “International Business Travel: An Engine of Innova-
tion?”, Working Paper No. 17100 , National Bureau of Economic Research.
Howenstine, N. 2008, "Innovation-Related Data in Bureau of Economic Analysis International
Economic Surveys", The Journal of Technology Transfer , vol. 33, no. 2, pp. 141-152.
Keller, W. 2010, "International Trade, Foreign Direct Investment, and Technology Spillovers",
In Hall, B. and Rosenberg, N. eds., Handbook of the Economics of Innovation , vol. 2, Elsevier,
North-Holland.
Keller, W. and Yeaple, S.R. 2008, "Global Production and Trade in the Knowledge Economy",
Working Paper No. 14626, National Bureau of Economic Research.
Keller, W. and Yeaple, S.R. 2012, "The Gravity of Knowledge", Working Paper No. 15509,
National Bureau of Economic Research.
Koskinen, K.U. and Vanharanta, H. 2002, "The Role of Tacit Knowledge in Innovation Processes
of Small Technology Companies", International Journal of Production Economics , vol. 80, no.
1, pp. 57-64.
Leonardi, P. 2010. "Information, Technology, and Knowledge Sharing in Global Organizations:
Cultural Di¤erences in Perceptions of where Knowledge Lies". In Canary H.E. and McPhee
27

7/18/2019 FREIT541
http://slidepdf.com/reader/full/freit541 29/38
R.D. eds., Communication and Organizational Knowledge: Contemporary Issues for Theory
and Practice . New York: Routledge.
Markusen, J.R. 1984, "Multinationals, Multi-Plant Economies, and the Gains from Trade",
Journal of International Economics, vol. 16, no. 3-4, pp. 205-226.
Martin, X. and Salomon, R. 2003, "Knowledge Transfer Capacity and its Implications for the
Theory of the Multinational Corporation", Journal of International Business Studies , vol. 34,
no. 4, pp. 356-373.
Miroudot, S., Lanz, R. and Ragoussis, A. 2009, "Trade in Intermediate Goods and Services",
OECD Trade Policy Working Papers.
Papke, L.E. and Wooldridge, J.M. 1996, “Econometric Methods for Fractional Response Vari-
ables with an Application to 401 (k) Plan Participation Rates", Journal of Applied Econo-
metrics , vol. 11, pp. 619–632.
Papke, L.E. and Wooldridge, J.M. 2008, "Panel Data Methods for Fractional Response Variables
with an Application to Test Pass Rates", Journal of Econometrics , vol. 145, no. 1-2, pp. 121-
133.
Park, W.G. 2008, "International Patent Protection: 1960-2005", Research Policy , vol. 37, no. 4,
pp. 761-766.
Robbins, C.A. 2009, "Measuring Payments for the Supply and Use of Intellectual Property". In
Reinsdorf, M.B. and Slaughter, M.J. eds., International Trade in Services and Intangibles in
the Era of Globalization , Chicago: University of Chicago Press.
28
7/18/2019 FREIT541
http://slidepdf.com/reader/full/freit541 30/38
Takahashi, D. 2010a, "Intel Opens $2.5B Chip Factory in China", Venture Beat , Retrieved from
http://venturebeat.com/2010/10/26/intel-opens-2-5b-chip-factory-in-china/ January 2012
Takahashi, D. 2010b, "Intel Opens $1B Chip Assembly Factory in Vietnam", Venture Beat ,
Retrieved from http://venturebeat.com/2010/10/29/intel-opens-a-1b-chip-assembly-factory-
in-vietnam/ January 2012
Vishwasrao, S. 2007, "Royalties vs. Fees: How Do Firms Pay for Foreign Technology?", Inter-
national Journal of Industrial Organization , vol. 25, no. 4, pp. 741-759.
U.S. Bureau of Economic Analysis. 2004. U.S. Direct Investment Abroad: Final Results from
the 1999 Benchmark Survey. Washington, DC: U.S. Government Printing O¢ce
29

7/18/2019 FREIT541
http://slidepdf.com/reader/full/freit541 31/38
VariableObservations Mean
Standard
DeviationMin Max
Royalties & license receipts ($mln) 612 19.603 66.554 0 904US exports of goods for manufacture($mln) 585 161.411 470.192 0 4924
Licensing-Import share 458 0.249 0.290 0 1
Technology gap 514 0.782 0.249 0.001 1.940
Trade costs 583 0.134 0.105 0.008 1.120
R&D ratio (affiliate/parent) 612 0.181 0.082 0.042 0.369
Population 612 10.185 1.425 8.025 14.077
GDP per capita 612 9.412 0.833 6.798 10.597
Intellectual property protection 599 1.201 0.309 0.207 1.541
Human capital per worker 598 -7.088 1.562 -11.592 -4.958
Physical capital per worker 579 5.841 2.211 -0.276 10.028
Table 1: Descriptive statistics
The sample includes 47 countries, 7 manufacturing industries and 2 years (1999 and 2004). Trade costs,
population, GDP per capita, IPR, human capital and physical capital per worker are in natural logarithms.

7/18/2019 FREIT541
http://slidepdf.com/reader/full/freit541 32/38
Figure 1: Distribution of Licensing-Import Share
0
1 0
2 0
3 0
P e r c e n t
0 .2 .4 .6 .8 1Licensing-Import Share
7/18/2019 FREIT541
http://slidepdf.com/reader/full/freit541 33/38
Table 2: Industry Averages of Main Variables
Industry
Mean of
licensing-
import share
Mean of
technology
gap
Chemicals 0.354 0.899Computers 0.102 0.937
Electronics 0.236 0.744
Food 0.431 0.516
Machinery 0.24 0.752
Metals 0.238 0.559
Transportation 0.158 0.826
Country
Mean of
licensing-
import share
Mean of
technology
gap
Country
Mean of
licensing-
import share
Mean of
technology
gap
Argentina 0.052 0.878 Italy 0.261 0.746
Australia 0.159 0.713 Japan 0.178 0.705
Austria 0.320 0.551 Korea: Republic of 0.205 0.773
Belgium 0.171 0.654 Malaysia 0.194 0.843
Brazil 0.043 0.746 Mexico 0.050 0.742
Chile 0.148 0.833 Netherlands 0.141 0.687
China 0.212 0.903 New Zealand 0.114 0.845Colombia 0.081 0.752 Norway 0.218 0.702
Costa Rica 0.230 0.783 Peru 0.493 0.831
Czech Republic 0.397 0.842 Philippines 0.363 0.892
Denmark 0.211 0.676 Poland 0.358 0.806
Ecuador 0.163 1.050 Portugal 0.499 0.746
Egypt 0.589 0.921 Russia 0.365 0.904
Finland 0.247 0.692 Saudi Arabia 0.914 1.016
France 0.152 0.679 Singapore 0.091 0.800
Germany 0.168 0.705 South Africa 0.176 0.854
Greece 0.810 0.699 Spain 0.327 0.726
Honduras 0.292 0.654 Sweden 0.366 0.687
Hong Kong 0.079 0.864 Switzerland 0.365 0.500
Hungary 0.379 0.719 Taiwan 0.081 0.726
India 0.131 0.904 Turkey 0.814 0.863
Indonesia 0.334 0.950 United Kingdom 0.101 0.717
Ireland 0.221 0.556 Venezuela 0.326 0.672
Israel 0.123 0.806
Table 3: Country Averages of Main Variables

7/18/2019 FREIT541
http://slidepdf.com/reader/full/freit541 34/38
(1) (2) (3) (4) (5) (6)
Dependent variable
Technology gap -0.188*** -0.164*** -0.163*** -0.156** -0.150** -0.118*(0.063) (0.058) (0.062) (0.060) (0.061) (0.062)
Trade costs 0.398** 0.396** 0.421** 0.504** 0.640***
(0.188) (0.196) (0.201) (0.233) (0.194)
R&D ratio 0.012 0.021 0.028 0.075
(0.182) (0.182) (0.187) (0.179)
Population -0.513 -1.330*** -0.016
(0.386) (0.344) (0.101)
GDP per capita 0.371*** 0.233* -0.160*
(0.135) (0.133) (0.082)
IPR protection index 0.089* 0.106
(0.053) (0.116)
Human capital per worker -0.333 -0.068
(0.204) (0.094)
Physical capital per worker -0.027 0.087
(0.057) (0.054)
Country Fixed Effects Yes Yes Yes Yes Yes No
Observations 425 408 408 408 398 398
R-squared 0.363 0.378 0.378 0.383 0.381 0.095
Notes: All specifications include year fixed effects. Robust standard errors which allow for clusteringby country-year are reported in parenthesis. *** p<0.01, ** p<0.05, * p<0.1.
Licensing-Import Share
Table 4: Benchmark Regression

7/18/2019 FREIT541
http://slidepdf.com/reader/full/freit541 35/38
OLSRobust
Regression
Median
RegressionTobit
Fractional
Logit
(1) (2) (3) (4) (5)
Dependent variable
Technology gap -0.150** -0.065** -0.108*** -0.168** -0.990***
(0.061) (0.027) (0.000) (0.068) (0.361)
Trade costs 0.504** 0.673*** 0.678*** 0.606** 3.317**
(0.233) (0.087) (0.000) (0.271) (1.448)
R&D ratio 0.028 -0.136 -0.140*** -0.051 0.202
(0.187) (0.087) (0.000) (0.215) (1.149)
Population -1.330*** -1.010** -0.931*** -1.531*** -7.282***
(0.344) (0.434) (0.000) (0.432) (2.276)
GDP per capita 0.233* 0.112 0.090*** 0.272* 1.711**
(0.133) (0.141) (0.000) (0.157) (0.686)
IPR protection index 0.089* 0.061 0.120*** 0.086 0.593
(0.053) (0.065) (0.000) (0.062) (0.373)
Human capital per worker -0.333 -0.001 -0.328*** -0.331 -2.132*
(0.204) (0.159) (0.000) (0.246) (1.225)
Physical capital per worker -0.027 0.025 0.075*** -0.012 -0.451
(0.057) (0.029) (0.000) (0.073) (0.433)
Observations 398 398 398 398 398
R-squared 0.381 0.763
Licensing-Import Share
Table 5: Various Econometric Specifications
Notes: All specifications include country and year fixed effects. Robust standard errors are reported inparenthesis. Robust standard errors which allow for clustering by country-year are reported in models (1),
(4) and (5). *** p<0.01, ** p<0.05, * p<0.1.

7/18/2019 FREIT541
http://slidepdf.com/reader/full/freit541 36/38
(1) (2) (3)
Dependent variable
Licensing-
Import Share
Intermediate
goods import
Intensity
Royalty &
license fee
intensity
Technology gap -0.150** 0.035** -0.000
(0.061) (0.016) (0.002)
Trade costs 0.504** -0.166*** 0.023***
(0.233) (0.063) (0.009)
R&D ratio 0.028 -0.107* -0.017*
(0.187) (0.060) (0.009)
Population -1.330*** 0.037 -0.041*
(0.344) (0.166) (0.021)
GDP per capita 0.233* 0.041 -0.002
(0.133) (0.061) (0.006)
IPR protection index 0.089* -0.027 0.002
(0.053) (0.019) (0.002)
Human capital per worker -0.333 -0.034 -0.011
(0.204) (0.045) (0.008)
Physical capital per worker -0.027 -0.006 -0.001
(0.057) (0.007) (0.001)
Observations 398 385 385
R-squared 0.381 0.417 0.213
Table 6: Decomposition of Licensing-Import Share
Notes: All specifications include country and year fixed effects. Robust standarderrors which allow for clustering by country-year are reported in parenthesis. ***
p<0.01, ** p<0.05, * p<0.1.

7/18/2019 FREIT541
http://slidepdf.com/reader/full/freit541 37/38
(1) (2) (3) (4)
Dependent variable
Technology gap (weighted) -0.150**(0.061)
Technology gap (unweighted) -0.117**
(0.055)
Technology gap (affiliate frontier ) -0.147**
(0.073)
Technology gap using number of affiliates -0.132
(0.081)
Trade costs 0.504** 0.583** 0.728*** 0.572**
(0.233) (0.248) (0.261) (0.265)
R&D ratio 0.028 0.338** 0.442** 0.559***
(0.187) (0.167) (0.182) (0.205)
Population -1.330*** -1.245*** -1.452*** -1.295***
(0.344) (0.426) (0.443) (0.340)
GDP per capita 0.233* 0.122 0.254* 0.347***
(0.133) (0.133) (0.146) (0.096)
IPR protection index 0.089* 0.102* 0.110* 0.080
(0.053) (0.055) (0.057) (0.049)
Human capital per worker -0.333 -0.301 -0.380* -0.381**
(0.204) (0.204) (0.196) (0.192)
Physical capital per worker -0.027 0.002 -0.023 -0.044
(0.057) (0.044) (0.058) (0.041)
Observations 398 396 486 472
R-squared 0.381 0.399 0.338 0.361
Licensing-Import Share
Notes: All specifications include year fixed effects. Robust standard errors which allow for
clustering by country-year are reported in parenthesis. *** p<0.01, ** p<0.05, * p<0.1.
Table 7: Alternative Measures of Technology Gap

7/18/2019 FREIT541
http://slidepdf.com/reader/full/freit541 38/38
Argentina Italy
Australia Japan
Austria Korea: Republic of
Belgium MalaysiaBrazil Mexico
Chile Netherlands
China New Zealand
Colombia Norway
Costa Rica Peru
Czech Republic Philippines
Denmark Poland
Ecuador Portugal
Egypt Russia
Finland Saudi Arabia
France Singapore
Germany South Africa
Greece Spain
Honduras Sweden
Hong Kong Switzerland
Hungary Taiwan
India Turkey
Indonesia United Kingdom
Ireland Venezuela
Israel
Appendix 1: Countries in the Sample