friction measurement in precision glass molding
TRANSCRIPT

Clemson UniversityTigerPrints
All Dissertations Dissertations
8-2010
FRICTION MEASUREMENT IN PRECISIONGLASS MOLDINGPeiman MosaddeghClemson University, [email protected]
Follow this and additional works at: https://tigerprints.clemson.edu/all_dissertations
Part of the Engineering Mechanics Commons
This Dissertation is brought to you for free and open access by the Dissertations at TigerPrints. It has been accepted for inclusion in All Dissertations byan authorized administrator of TigerPrints. For more information, please contact [email protected].
Recommended CitationMosaddegh, Peiman, "FRICTION MEASUREMENT IN PRECISION GLASS MOLDING" (2010). All Dissertations. 613.https://tigerprints.clemson.edu/all_dissertations/613

FRICTION MEASUREMENT IN PRECISION GLASS MOLDING
A Thesis Presented to
the Graduate School of Clemson University
In Partial Fulfillment of the Requirements for the Degree
Doctor of Philosophy Mechanical Engineering
by Peiman Mosaddegh
August 2010
Accepted by: Dr. John Ziegert, Committee Chair
Dr. Paul Joseph Dr. Michael Ellison
Dr. Lonny Thompson

ii
ABSTRACT
Extensive growth of state-of-the-art technologies has created a demand for high
quality lenses and has driven the industry toward an inexpensive process for
manufacturing of aspheric glass lenses called Precision Glass Molding (PGM). Finite
Element Analysis (FEA) has been used to predict the right mold geometry. Having a
realistic simulation to predict mold geometry depends on the correct model of material
behavior and friction coefficient at elevated temperature.
Finding the static and dynamic coefficient of friction experimentally between two
flat surfaces at elevated temperature is the subject of this research. The equipment used in
this study was originally designed for the Precision Glass Molding (PGM) process and
was modified for friction measurement by using molds designed specifically for the
friction test. The performance of this apparatus was validated using a steel-steel friction
pair at room temperature and a steel-BK7 pair at elevated temperature.
The frictional behavior of two different types of oxide glasses; BK7 and
Soda-Lime-Silica glass have been studied. During trials at which the temperature is
above the glass transition temperature, the results show the effect of glass viscoelasticity
in the friction data. This effect is in the form of exponential increase in friction force data
prior to the onset of sliding. Moreover, the effect of stick-slip phenomenon can be seen as
a jump in the position data (in the order of microns in tangential direction). Coulomb’s
Law has been used to calculate the friction coefficient. An average friction coefficient has
been defined and calculated for some trials, providing a quantitative value for dynamic
friction coefficient at different process parameters.

iii
The final part of the investigation involved using the Design of Experiment
approach to include a broader range of processing parameters and do a sensitivity
analysis to find the effect of temperature, normal force, feed rate, and surface finish on
dynamic friction coefficient.
The finding from the current investigation demonstrates reasonable changes in
dynamic friction of glass due to its viscoelastic properties close to its transition
temperature. These friction data can be used to improve the accuracy of simulations of
the PGM process.

iv
DEDICATION
I would like to dedicate this thesis and work to my dearest wife, Dr. Neda Yavari
who has been a perpetual source of love, encouragement and motivation. To my parents,
Mrs. Ashraf Rajaei and Mr. Hooshang Mosaddegh who have been my teachers in this
world. To my daughter, Mahya Mosaddegh who has brought more meaning to my life.
This thesis would not have been possible without their support.

v
ACKNOWLEDGMENTS
I would like to thank my advisor, Dr. John Ziegert for his guidance, and his
endless support throughout the course of this project. Dr. Ziegert’s constant feedback and
high expectations have driven me to keep making progress and complete this work. I
extend my sincere thanks to Dr. Kathleen Richardson for allowing me access to her lab.
My appreciation goes out to Dr. Paul Joseph, Dr. Michael Ellison and Dr. Lonny
Thompson for serving on my committee and guiding me throughout my research
experience. Each of you was very instrumental in the completion of my thesis and in
developing my overall knowledge in the field of Mechanical Engineering and Material
Science.
The successful completion of this thesis was possible due to technical support of
Dr. Yazid Tohme from Moore Nanotechnology LLC. A special thanks to my fellow
graduate students Vincent Lee, and Waqas Iqbal for their selfless help during the course
of this work. I would also like to thank Dr. David Musgraves for helping me to
understand glass behavior. Finally, I would like to thank my family and friends for all the
love and care without which this work would be incomplete.

vi
TABLE OF CONTENTS
Page
TITLE PAGE .................................................................................................................. i ABSTRACT .................................................................................................................... ii DEDICATION............................................................................................................... iv ACKNOWLEDGMENTS ............................................................................................. v LIST OF TABLES ........................................................................................................ ix LIST OF FIGURES ....................................................................................................... x CHAPTER I. INTRODUCTION........................................................................................ 1 1.1 Precision glass molding ..................................................................... 2 1.2 Determination of friction coefficient ................................................. 4 1.3 Ring compression test ........................................................................ 5
1.4 Kinetic test to measure the friction coefficient between glass as a viscous material and heated metal ........................................................... 6 1.5 A method for characterization of friction during the demolding of microstructures molded by hot embossing .............................................. 8
1.6 Outline.............................................................................................. 12 II. RESEARCH MOTIVATION AND OBJECTIVE ................................. 13 2.1 Motivation ........................................................................................ 13 2.2 Objectives ........................................................................................ 14 III. METHODOLOGY AND DESIGN OF EXPERIMENT ........................ 16 3.1 Introduction ...................................................................................... 16 3.2 PGM machine .................................................................................. 18 3.2.1 Machine functionality ............................................................. 20 3.3 Mold design for friction test ............................................................ 21 3.4 Material selection for top and bottom mold ..................................... 24 3.5 Experimental setup........................................................................... 28

vii
Table of Contents (Continued)
Page IV. MATERIAL AND METHODS ................................................................ 31 4.1 Glass material................................................................................... 31 4.1.1 Glass viscosity ........................................................................ 31 4.1.2 Characterization of glass transition temperature .................... 35 4.1.3 Glass viscoelasticity ................................................................ 37
4.1.4 Theoretical background of creep (response of system to constant stress) ................................................................................. 38 4.1.5 Theoretical background of stress relaxation (response of system to constant strain) ................................................................. 39
4.2 Mold material ................................................................................... 41 4.3 Mold coating .................................................................................... 41 4.4 Surface roughness of material .......................................................... 41 4.4.1 Mold surface condition ........................................................... 42 4.4.2 Glass surface condition ........................................................... 43 4.5 Cleaning procedure .......................................................................... 44 4.6 Oxidation.......................................................................................... 45 4.6.1 Nitrogen properties ................................................................. 45 V. EXPERIMENTAL RESULTS .................................................................. 46 5.1 Instantaneous and average friction coefficient ................................ 46
5.2 Validation of machine functionality at room temperature for a steel-steel friction pair............................................................................ 47 5.3 Validation of machine functionality at room temperature for a steel-BK7 friction pair ........................................................................... 49 5.4 Validation of machine functionality at high temperature for a pair of steel-steel & steel-BK7 at room condition environment (No nitrogen) .................................................................... 50
5.4.1 Uncertainty of normal load due to temperature ..................... 51 5.4.2 Uncertainty of friction force due to temperature ................... 52
5.4.3 The friction data for a steel-steel and steel-BK7 pairs at elevated temperature ...................................................................... 54 5.4.4 Friction coefficient at high temperature for a pair of steel-steel and steel-BK7 .................................................................................. 57
5.5 The important parameters affecting friction curves for glass molding ................................................................................................. 58
5.5.1 Temperature ........................................................................... 58 5.5.2 Feed rate ................................................................................. 60 5.5.3 Normal load ........................................................................... 61

viii
Table of Contents (Continued)
Page 5.5.4 Surface roughness .................................................................. 62
5.5.5 Glass type ............................................................................ 63 5.6 The friction force between polished and coated WC-BK7 pair at conditions similar to glass molding process ......................................... 66 5.7 Design of experiment ...................................................................... 68
VI. OBSERVATION AND DISCUSSION ..................................................... 79 6.1 Introduction ...................................................................................... 79
6.2 The effect of temperature on friction coefficient for soda-lime glass ...................................................................................... 79 6.3 The effect of normal load and surface roughness on friction coefficient for soda-lime ........................................................................ 80
6.4 The effect of feed rate on friction coefficient .................................. 81 6.5 The friction coefficient between polished and coated WC-BK7 pair at conditions similar to glass molding process ...................................... 82
VII. CONCLUSION .......................................................................................... 83 VIII. FUTURE WORK ....................................................................................... 86 REFERENCES ............................................................................................................. 87

ix
LIST OF TABLES
Table Page 3-1 Parameters used in simulation ..................................................................... 26 4-1 Reference temperature for BK7 and Soda-Lime-Silica glass reported by
supplier ......................................................................................................... 35 4-2 Physical (at 20°C) and thermal properties of BK7 and soda-lime
reported by supplier ..................................................................................... 36 4-3 Tungsten Carbide properties ........................................................................ 41 4-4 UHP and HP nitrogen different component ................................................. 45 5-1 Standard L8 Taguchi array matrix ............................................................... 70 5-2 Actual value for experimental matrix based on Table 5-1 ........................... 70

x
LIST OF FIGURES
Figure Page 1-1 Typical enthalpy-temperature graph for glass material ................................. 1 1-2 Precision glass molding process .................................................................... 3 1-3 Schematic view of Worgull’s apparatus for measuring friction .................... 9 1-4 Typical friction force measurement between molded polymer and metal ... 10 1-5 A schematic view for measuring the friction of hot glass using a PGM
process.......................................................................................................... 11 2-1 Placement of this research in the PGM process ........................................... 15 3-1 Schematic side view of the PGM machine (Moore Nanotechnology
LLC.) ............................................................................................................ 17 3-2 Mold chamber assembly (Moore Nanotechnology LLC.) ........................... 18 3-3 Mold chamber cross-section drawing (Moore Nanotechnology LLC.) ....... 19 3-4 Drive system mechanism (Moore Nanotechnology LLC.) .......................... 20 3-5 Top mold assembly ...................................................................................... 23 3-6 Bottom mold assembly ............................................................................... 23 3-7 Cross-section view of Figure 3-6 showing the assembly of bottom mold ... 24 3-8 3D view of boundary condition for simulation of heat transfer in upper
fixture ........................................................................................................... 26 3-9 Temperatures at the middle and upper thermocouples for Inconel ............. 27 3-10 Temperatures at the middle and upper thermocouples for WC .................. 27 3-11 Experimental setup for friction measurement ............................................. 29 3-12 Typical temperature and position profile for friction test ........................... 30
xi
List of Figures (Continued) Figure Page 4-1 Viscosity-temperature relation of a soda-lime-silica glass ......................... 32 4-2 Reference point viscosity as a function of temperature for a
soda-lime-silica glass melt ........................................................................... 32 4-3 Viscosity versus temperature for BK7 and soda-lime-silica glass............... 35
4-4 DSC curves for soda-lime and BK7 @ 10°C per minute ............................ 36 4-5 a) Mechanical analogue for Burger model b) Behavior of Burger model ... 38 4-6 Stress relaxation response of Burger model to a constant strain rate .......... 40 4-7.a Surface roughness data for a ground and coated mold ................................ 42 4-7.b Surface roughness data for a polished and coated mold .............................. 43 4-8 Surface roughness data for a cleaned BK7 glass ......................................... 44 5-1 Frictional and normal force generated between a pair of steel-steel at
room temperature ......................................................................................... 48 5-2 Friction coefficient curve between a pair of steel-steel at room
temperature .................................................................................................. 48 5-3 Frictional and normal force generated between a pair of steel-BK7 at
room temperature ......................................................................................... 49 5-4 Friction coefficient curve between a pair of steel-BK7 at room
temperature .................................................................................................. 49 5-5 Temperature and position profile used for friction measurement between a
pair of steel-steel and steel-BK7 at 577°C ................................................... 50 5-6 Section view of normal load path ................................................................ 52 5-7 The effect of thermal drift on friction force ................................................. 53 5-8 Frictional force generated between a pair of steel-steel at 577°C ............... 55
xii
List of Figures (Continued) Figure Page 5-9 Frictional force generated between a pair of steel-BK7 at 577°C ............... 55 5-10 Stick-slip phenomenon between a pair of steel-steel at 577°C (zoomed-in view of Figure 5-8) ................................................................... 56 5-11 Stick-slip phenomenon between a pair of steel-BK7 at 577°C (zoomed-in view of Figure 5-9) ................................................................... 56 5-12 Instantaneous friction coefficient curve between a pair of steel-steel at
577°C ......................................................................................................... 57 5-13 Instantaneous friction coefficient curve between a pair of steel-BK7 at
577°C ......................................................................................................... 57 5-14 Frictional force curve between a pair of steel-BK7 at different temperature
(feed rate 1mm/min, Normal force 100 N, and no externally applied UHP nitrogen) ....................................................................................................... 59
5-15 Stick-slip phenomenon between a pair of steel-BK7 at 400°C (zoomed-in view of Figure 5-14) ................................................................. 59 5-16 The effect of feed rate on friction force for a pair of steel-BK7 at room
temperature .................................................................................................. 61 5-17 Instantaneous friction coefficient between a pair of polished and coated WC-soda lime glass at room temperature and normal load of 120 N ........ 62 5-18 Friction coefficient curve between a pair of steel-steel with high surface
roughness at room temperature .................................................................... 63 5-19 Frictional force curve between a pair of steel-soda lime silica glass at different
temperature (feed rate 1mm/min, Normal force 100 N, and no externally applied UHP nitrogen) ................................................................................. 64
5-20 Stick-slip phenomenon between a pair of steel-soda lime at 400°C
(zoomed-in view of Figure 5-19) ................................................................. 65 5-21 Stick-slip phenomenon between a pair of steel-soda lime at 577°C
(zoomed-in view of Figure 5-19) ................................................................. 65

xiii
List of Figures (Continued) Figure Page 5-22 Friction force generated between a pair of polished and coated WC-BK7 at 20, 200, 300, 350, 400, 500, and 577˚C ................................. 66 5-23 Friction force generated between a pair of polished and coated
WC-BK7 at 560˚C for three trials with same process parameters at the same conditions ................................................................................ 67
5-24 Friction coefficient from Figure 5-23 .......................................................... 68 5-25 Temperature and position profile for experiments 1 and 7 in Table 5-2 .... 72 5-26 Temperature and position profile for experiments 2 and 8 in Table 5-2 .... 72 5-27 Temperature and position profile for experiments 3 and 5 in Table 5-2 .... 73 5-28 Temperature and position profile for experiments 4 and 6 in Table 5-2 .... 73 5-29 Friction coefficient versus position for experiment number 1 ..................... 74 5-30 Friction coefficient versus position for experiment number 2 ..................... 74 5-31 Friction coefficient versus position for experiment number 3 ..................... 75 5-32 Friction coefficient versus position for experiment number 4 ..................... 75 5-33 Friction coefficient versus position for experiment number 5 ..................... 76 5-34 Friction coefficient versus position for experiment number 6 ..................... 76 5-35 Friction coefficient versus position for experiment number 7 ..................... 77 5-36 Friction coefficient versus position for experiment number 8 ..................... 77

CHAPTER ONE
INTRODUCTION
Introduction
Glass, an amorphous solid at room temperature, cools quickly during
solidification. Since it doesn’t exhibit a distinct melting or freezing point, it is
characterized by a transition region from solid to super-cooled liquid called the glass
transformation, or glass transition region ( gT ). Figure 1-1 represents this behavior based
on either enthalpy or volume for most glasses [1]. Also, this figure shows the fictive
temperature ( )fT , which is the artificial quantitative representation of deviation from
equilibrium, and it depends on cooling rate.
Figure 1-1: Typical enthalpy-temperature graph for glass material

2
At room temperature (below Tg ), most commercial glasses are in the glassy state,
their behavior being elastic and brittle [2]. When the temperature increases in the
temperature range close to Tg, the glass softens, exhibiting viscoelastic behavior, which
is temperature dependent.
At low viscosities when glass is significantly above Tg, hot glass gobs behave as
viscous fluids, which immediately relax to relieve an applied stress, and at extremely
high viscosity when glass is significantly below Tg, they respond to rapid application of a
stress as if they were an purely elastic material. In other word, viscoelastic behavior,
where the material behaves neither purely as an elastic solid, nor a purely viscous liquid,
can be observed in glasses over a large temperature range.
The calorimetric glass transition lies within the viscoelastic temperature range,
but the overlap of the two is determined by the viscosity-temperature curve of the glass,
which is ultimately a function of composition.
1-1 Precision Glass Molding
Extensive growth of state-of-the-art technologies has created a demand for high
quality lenses and has driven the industry toward an inexpensive process for
manufacturing of aspheric glass lenses. Conventional abrasive methods such as CNC
machining, grinding and polishing are suitable for producing spherical but not aspherical
lenses. Precision Glass Molding (PGM) offers a cost-effective alternative for the mass
production of these lenses. Moreover, this method is a green technology requiring no
environmentally damaging coolant.

3
The PGM process includes three steps, heating, molding and cooling, as seen in
Figure 1-2. First, the glass gob is inserted between the top and bottom molds at room
temperature. During the heating process, its temperature increases above the transition
temperature, deforming both the glass and the molds due to thermal expansion. During
the compression (molding) step, the heated glass is pressed into the thermally deformed
mold surfaces. Finally, in the cooling step both the glass and molds cool to room
temperature and the final product is ready to be released. This entire process can be
completed in less than 25 minutes.
Figure 1-2: Precision glass molding process
Although in the cooling stage of the PGM process the molds recover their initial
shapes, the final geometry of the glass is different from that of the molds due to thermal
contraction. In addition, the cooling stage has the most significant effect on the residual
stresses, a condition that also changes the final shape of the molded glass. The problem
with the current PGM process is this final deformation of the glass, meaning the the
deviation of the molded lens is not suitable for the aspherical lenses needed by today’s
sophisticated technologies.

4
A problem of equal importance is the cost of creating molds of the proper
geometry to create lenses of the desired shape, a process accurately achieved by trial and
error. To improve mold design and avoid these multiple iterations, Finite Element
Analysis (FEA) has been used to predict the correct mold geometry; however, the use of
this method has been the subject of limited research. Most researchers have used
commercial FEA software such as DEFORM and ABAQUS in glass molding simulation.
For example, Yi et al. [3] used DEFORM-2D to simulate the compression molding of
aspherical glass lenses while Jian [4] investigated the numerical modeling of viscoelastic
stress relaxation during the glass lens forming process using the non-linear FEM
program, MARC, and Sellier et al. [5] used ABAQUS to develop an iterative algorithm
for optical mold design. Klocke et al. [6] from the Fraunhofer Institute for Production
Technology developed their own finite element code to simulate the PGM process.
Having a realistic simulation to predict mold geometry depends on the right
model of material behavior at an elevated temperature, the appropriate value of heat flux
between the surfaces the glass and the molds at a high temperature and pressure, the
appropriate value of friction coefficient between surfaces at an elevated temperature, and
the viscoelastic stress relaxation during the cooling step. Of these issues, friction has been
the focus of the least extensive research. To address this need, this study proposes the
dynamic and static friction measurement of glass at elevated temperatures.
1-2 Determination of Friction Coefficient
The ASTM document G 115, Standard Guide for Measuring and Reporting
Friction Coefficient, explains different friction test methods for most solid materials at

5
room temperature based on the material and stiffness of the friction force measuring
system.
1-3 Ring Compression Test
The ring compression test is a well-known method for measuring friction
coefficients in the engineering science of metal forming process. Male and Sofuoglu [7,
8] developed this method, which is well-accepted today, to predict the friction coefficient
in most metal forming processes. In this test, a ring with an initial defined dimension is
plastically pressed between two flat platens. The change in the inner diameter and height
of the final shape is used to determine the friction coefficient from a typical friction
calibration curve. If the friction is high, the material flows inward and the inner diameter
decreases, and if the friction is low, the material flows outward and the inner diameter
increases. A schematic view of the effect of the friction magnitude on the metal flow in a
ring compression test is shown in reference [8].
The calibration curves, which are calculated using FEA, are plotted for a wide
range of friction coefficients in the literature and can be used directly for simulations in
metal forming processes. In these types of calibration curves, the reduction in inner
diameter and height can be used to find the friction coefficient.
The ring compression test is sensitive to material properties, surface condition,
temperature, and strain rate, the latter two having the most significant impact. As
Dawelski [9] has shown, the friction coefficient increases with increasing temperature in
alloy steel. In addition, Wang et al. [10] found that the most significant parameter
affecting the interfacial friction is the strain rate.

6
Similarly, the behavior of glass is also temperature dependant as the behavior of
this material can range from elastic to viscoelastic to viscous based on its temperature. In
addition, the surface roughness, material deterioration, and surface wear of the glass are
affected by the temperature, in turn impacting the friction coefficient. As a result, the
friction test should be conducted under application conditions. The next section contains
a review of methods for friction measurement between hot glass (above gT ) and metal.
1-4 Kinetic Test to Measure the Friction Coefficient between Glass as a Viscous
Material and Heated Metal
The effect of friction between glass as a viscous material and heated metal
became important when researchers begin simulating the glass forming process 10 years
ago. Hot glass exhibits elastic, viscoelastic, and viscous behaviors in different
temperature ranges, meaning the resulting friction coefficient is across a range of
temperature. An experimental method for addressing this problem has not yet been
developed. This section reviews the current experimental methods for determining the
friction coefficient of glass above its transition temperature.
Trier [11] was one of the first researchers who investigated the sliding behavior of
hot viscous glass on metal surfaces, devising an experiment based on the kinetics of
motion of a hot glass gob falling on a U-form circular path and then sliding through it.
In further investigations [12], he modified his apparatus to a rotary circular
U-form channel made of metal. Then, he again measured the kinetics of motion of hot
glass gob to calculate the friction between hot glass and metal.

7
This method is more accurate than the previous one because it measures more
directly the friction coefficient, yet it is not sufficient because it does not consider the
deformation energy inside the hot glass gob.
Recently, Falipou [13] developed another method for measuring the friction
between hot viscous glass and metals considering the strain dissipation energy of a hot
glass gob as it passes through a cylindrical funnel. He measured the speed of the glass
gob at the exit of cylinder to determine its kinetic energy. The difference between the
initial potential energy and this kinetic energy is the strain dissipation energy and friction
loss. Using the principle of minimum energy for cylindrical funnel geometry, the
associated dissipated energy was subtracted, resulting in the value of the friction loss.
These methodologies (Sections 1-2, 1-3, 1-4) suggest that to measure friction, the
following considerations are necessary:
1- Because most PGM processes are performed close to the glass transition
temperature, measuring friction in the viscoelastic behavior regime of glass is
important.
2- Strain dissipation energy of a hot glass gob during the method used needs to be
considered in the simulation.
3- The experiment should be similar to the conditions of the molding process to
ensure similar material surface properties.
Although the ring compression test meets these conditions, it does not measure
high friction coefficient values. Moreover, it is not an in-process method as it measures
the ring dimensions only at the end of the test. As a result, another methodology is
8
necessary to obtain accurate test results, one that focuses on the dynamic rather than the
static characteristics.
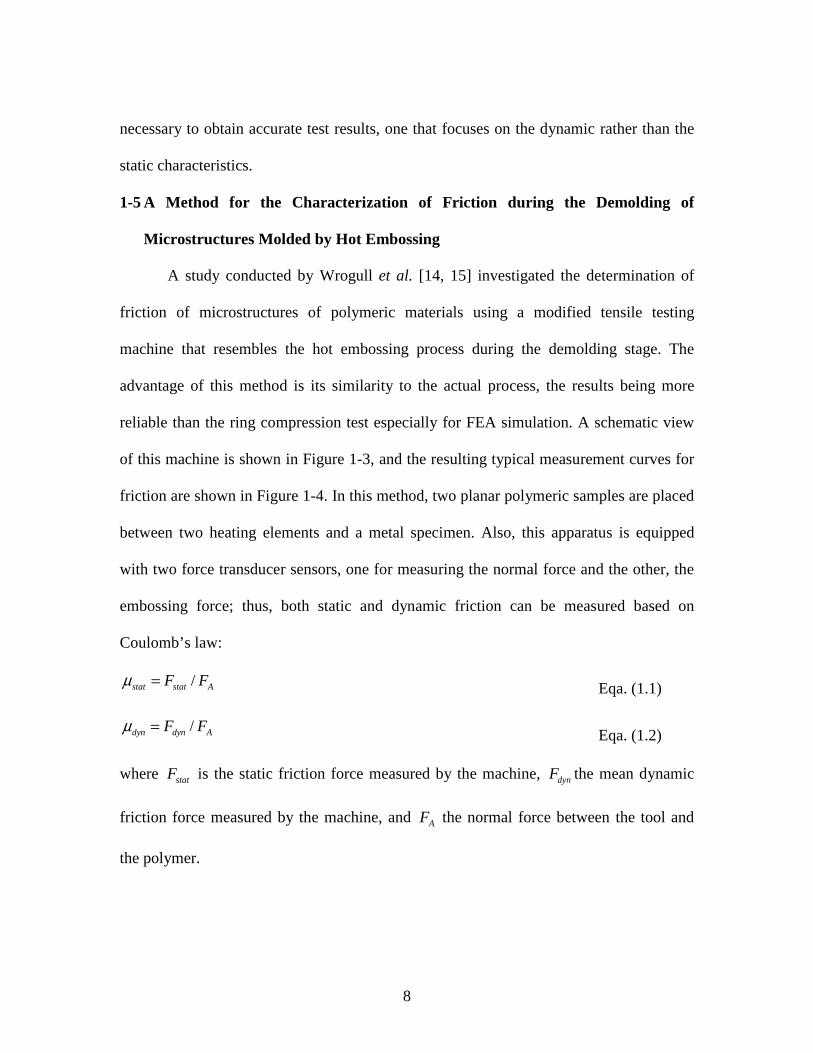
1-5 A Method for the Characterization of Friction during the Demolding of
Microstructures Molded by Hot Embossing
A study conducted by Wrogull et al. [14, 15] investigated the determination of
friction of microstructures of polymeric materials using a modified tensile testing
machine that resembles the hot embossing process during the demolding stage. The
advantage of this method is its similarity to the actual process, the results being more
reliable than the ring compression test especially for FEA simulation. A schematic view
of this machine is shown in Figure 1-3, and the resulting typical measurement curves for
friction are shown in Figure 1-4. In this method, two planar polymeric samples are placed
between two heating elements and a metal specimen. Also, this apparatus is equipped
with two force transducer sensors, one for measuring the normal force and the other, the
embossing force; thus, both static and dynamic friction can be measured based on
Coulomb’s law:
/stat stat AF Fμ = Eqa. (1.1)
/dyn dyn AF Fμ = Eqa. (1.2)
where statF is the static friction force measured by the machine, dynF the mean dynamic
friction force measured by the machine, and AF the normal force between the tool and
the polymer.

9
Figure 1-3: Schematic view of Worgull’s apparatus for measuring friction -permission to duplicate the figure was given by the corresponding author [14]
10
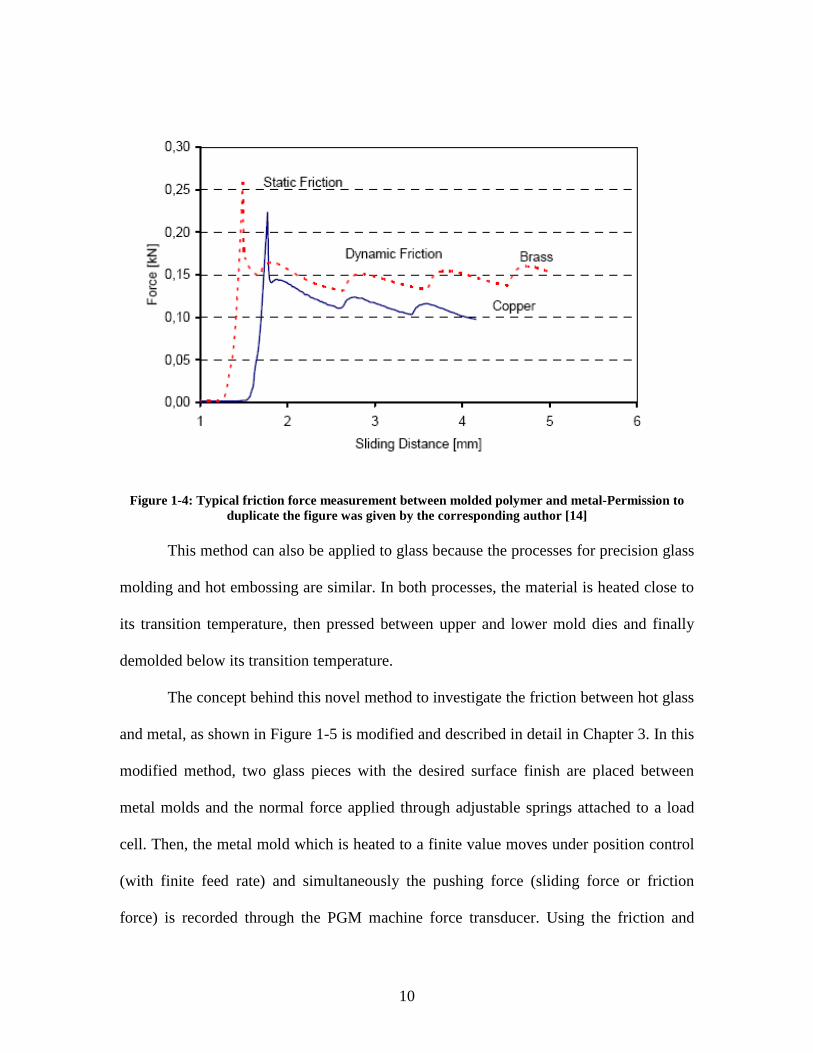
Figure 1-4: Typical friction force measurement between molded polymer and metal-Permission to duplicate the figure was given by the corresponding author [14]
This method can also be applied to glass because the processes for precision glass
molding and hot embossing are similar. In both processes, the material is heated close to
its transition temperature, then pressed between upper and lower mold dies and finally
demolded below its transition temperature.
The concept behind this novel method to investigate the friction between hot glass
and metal, as shown in Figure 1-5 is modified and described in detail in Chapter 3. In this
modified method, two glass pieces with the desired surface finish are placed between
metal molds and the normal force applied through adjustable springs attached to a load
cell. Then, the metal mold which is heated to a finite value moves under position control
(with finite feed rate) and simultaneously the pushing force (sliding force or friction
force) is recorded through the PGM machine force transducer. Using the friction and

11
normal forces, the instantaneous friction coefficient will be calculated using the equation
below:
F
Nμ = Eqa. (1.3)
where F is the friction force and N the normal force. The value of friction force versus the
displacement of the glass gives the static and dynamic friction coefficient. Since this
experimental method is similar to the molding environment, the results are more reliable
than the ring compression test. This modified friction measurement will be discussed in
further detail in Chapter 3.
Figure 1-5: A schematic view for measuring the friction of hot glass using a PGM process

12
1-6 Outline
This thesis is organized as follows: Chapter 2 explains the motivation for this
research, and the methodology and design of experiments are described in Chapter 3
while Chapter 4 discusses the material and methods. Experimental results are presented
in Chapter 5, followed by observation and discussion in Chapter 6. Finally, the
conclusions and future challenges regarding the modeling of the friction measurement are
introduced in Chapters 7 and 8, respectively.

13
CHAPTER TWO
RESEARCH MOTIVATION AND OBJECTIVE
2-1 Motivation
The PGM process for molding glasses requires contact between the mold (metal)
and the work piece (glass). As a result of this contact, sliding frictional forces are
generated at the interface between the glass/mold surfaces. These friction forces affect
the glass-forming process as they resist the relative movement of both materials. If this
friction is strong, sticking overcomes sliding, resulting in shearing inside the glass. If the
friction force is a weak, sliding occurs, and the glass deforms easily. To define these
friction forces in PGM, there is a need to accurately determine the value of the friction
coefficient between the glass and the mold under the molding condition. However, past
research in the measurement of this friction force between hot glass and hot metals in the
PGM process is limited. Even though some work has focused on the effect of glass as a
lubricant in the ring compression test [8, 16], none has utilized this material as a sample
in the test. In addition, studies considering the viscoelastic behavior of glass in the
friction measurement for PGM simulation are limited. As a result, past FEA research
used an arbitrary value for the friction coefficient.
For example, Jian and Yi [3, 17] arbitrarily used a friction coefficient of µ=0 for
the frictionless condition and µ=1 for the sticking condition in their simulation of PGM.
In another work [18], they used a friction coefficient of 0.5 to represent a true stick-slip
friction model available in MARC. Although Klocke et al. [6] reported that the friction

14
needs to be defined as an input in the FEA software, they have not reported the value they
used. Sellier et al. [5] also used an arbitrary value for the friction coefficient in their
simulation, their results indicating that interface friction is an important factor in PGM
and to model the deformation process, it is necessary to quantify this value accurately.
2-2 Objectives
To address the need for improved friction data, this research will focus on
determining the friction coefficient between the glass and the mold material at elevated
temperatures. Since glass behavior changes with temperature and load, its friction
behavior may also change. Specifically, the goal in this study is to develop a method for
experimentally measuring the dynamic and static friction between the glass and mold
materials at temperatures close to the transition regime.
In addition, sensitivity analysis of various mold materials and process parameters
(load and temperature) will be conducted to determine which has the most significant
impact on the friction coefficient. Figure 2-1 illustrates the placement of this proposed
study in relation to the PGM process.

15
Figure 2-1: Placement of this research in the PGM process

16
CHAPTER THREE
METHODOLOGY AND DESIGN OF EXPERIMENT
3.1 Introduction
Since there is no data reported on the frictional behavior of glass used for PGM, it
is necessary to measure friction experimentally under conditions similar to those used for
this process. The equipment used in this study includes the PGM machine, molds
designed specifically for this experiment, force transducers measuring normal and sliding
forces, and data acquisition equipment. In this chapter, after the functionality of PGM
machine is described, the experimental setup for the friction measurement is discussed.
3.2 PGM Machine
The machine used here, originally designed and manufactured by Moore
Nanotechnology Systems LLC [19] for use in the PGM process, enables accurate control
of the position, force, and temperature of the process. As the schematic side view in
Figure 3-1 shows, the PGM machine is comprised of three main elements:
1- The lower base which includes the lower mold chamber, the push rod attached to
a leadscrew driven by a servomotor, and a cylindrical glass tube outside the lower
mold chamber. The cylindrical glass tube is raised and lowered outside the lower
mold chamber using the two air cylinders installed on the bottom of this glass
tube. When the glass tube is raised, the molding environment is isolated from the
room conditions as the chamber is closed, and the interior can be filled with an
inert gas or other gas such as nitrogen to prevent oxidation of the mold surfaces.

2- The upper base which
the copper tubing con
unit.
3- The induction heating
sample under test.
A drawing of the mol
cross-section drawing of the e
Figure 3-1: Schematic side
As Figure 3-2 shows,
molds and glass. Using a stro
17
ich includes the upper mold chamber, the force tra
connecting the mold chamber to the induction he
ting system (IHS) which is used to heat the mo
old chamber assembly is shown in Figure 3-2 an
e entire assembly is seen in Figure 3-3.
de view of the PGM machine (Moore Nanotechnology LL
ws, the machine uses an induction coil for the he
strong AC magnetic field, this coil generates edd
transducer, and
heating system
mold and glass
and a detailed
LLC. [19])
heating of the
ddy currents in

the tungsten carbide molds. R
inside the coil. The advantag
surfaces of the molds can r
controller using two thermoco
other inside the bottom mold
soaking, and pressing cycles.
heating stops. Also, nitrogen
during the cooling stage. A re
temperature reading of the the
Figure 3-2: Mold c
18
. Resistance to these currents leads to the heating
tage of this heating system is its fast heating cyc
n reach temperatures of 500˚C in less than 10
ocouples as feedback sensors, one inside the top m
ld, controls the temperature of the system during
es. If the temperature exceeds the specified value, t
en gas is pumped inside the chamber to help co
regulator valve controls the flow rate of nitrogen
thermocouples.
d chamber assembly (Moore Nanotechnology LLC. [19])
ng of the molds
ycle: the outer
10 seconds. A
p mold and the
ing the heating,
e, the induction
cool the molds
en based on the
)

19
Figure 3-3: Mold chamber cross-section drawing (Moore Nanotechnology LLC. [19])
The drive system under the lower mold chamber includes a servomotor, gearbox,
coupling, and ball screw as shown in Figure 3-4. This system has two modes of
operation: position control and force control. A rotary encoder provides a feedback signal
to the controller, monitoring the position control mode, and an inline load cell installed
on the top of the upper chamber provides feedback during the force control mode of the
machine as shown in Figure 3-2.

Figure 3-4: Drive s 3-2-1 Machine Functionality
Although the machine
essentially the same. First, a
aligned by a cylindrical sleev
and lower mold chambers. T
then defined for the molding
being backfilled with nitrogen
gas will continuously purge
20
e system mechanism (Moore Nanotechnology LLC. [19]
ity
ine can operate using a variety of molds, the pro
t, a glass gob is seated between the top and bo
eeve, and this entire assembly is installed betwe
. The temperature, force, and position profiles ver
ing process, and the chamber closes and is evac
gen to remove the oxygen inside. A small flow rat
rge inside the closed chamber to prevent the
9])
rocess remains
bottom molds
ween the upper
versus time are
acuated before
rate of nitrogen
e heated mold

21
surfaces from oxidation during the process. An exhaust tube is attached to the chamber to
ventilate the nitrogen during the process.
The PGM process can be divided into the five steps below:
I. Heating step: The glass gob and the top and bottom molds heat to a specified
temperature.
II. Soaking step: The temperature of the molds is kept constant until the
temperature of glass reaches equilibrium.
III. Pressing: The glass is pressed after reaching the equilibrium temperature
under either force or position control.
IV. Annealing or the first cooling step: Nitrogen gas flows into the chamber,
cooling it at a specified rate. This cooling stage has a strong effect on the
residual stresses and the final shape of the molded optic.
V. Fast cooling or the second cooling step: The final step of the process cools
the entire setup to less than 200˚C to enable demolding.
3.3 Mold Design for Friction Test
To measure the friction forces versus displacement and determine the friction
coefficient, the PGM machine was modified to collect data on such material properties as
friction, gap conductivity, and the viscoelastic behavior of glass at elevated temperatures.
The focus of this research is on the friction measurement.
To conduct friction measurements at elevated temperatures required both molds
(mold setup) as shown in Figure 3-3 to be modified and then manufactured. The design
has two parts: top and bottom mold. The top mold was installed in the upper mold

22
chamber and the bottom mold in the lower mold chamber. However, unlike conventional
molding, the new upper and lower portions were designed so that the contact surface
between the samples under test are in the vertical plane and parallel to the actuation
direction of the machine’s actuator, which will be used to cause relative sliding motion
between them. Separate systems are provided to create a constant normal force between
the sliding surfaces. To insure balanced loading, the apparatus was designed to
simultaneously test two samples arranged 180˚ apart on the upper mold.
This modification process was governed by the considerations listed below:
I. The environment around the molds should be the same for both the friction test and
the PGM process.
II. Both the glass and molds are heated using the same temperature profile of the PGM
process (heating, soaking, and pressing).
III. The sliding friction force is collected by the load cell on the PGM machine while the
normal force is measured using separate load cell and data collection equipment to
ensure independent control of all applied forces.
IV. The apparatus must be designed to ensure that the maximum safe temperature of 93˚C
for the force transducer is not exceeded.
V. The design should consider all geometrical limitations of the PGM machine and
enable the friction apparatus to be installed completely inside the glass chamber.
Based on these requirements and constraints and using SOLIDWORK and
ABAQUS, the components of the friction test apparatus were designed as shown in
Figure 3-5 and Figure 3-6 for the top and bottom molds, respectively. As Figure 3-5
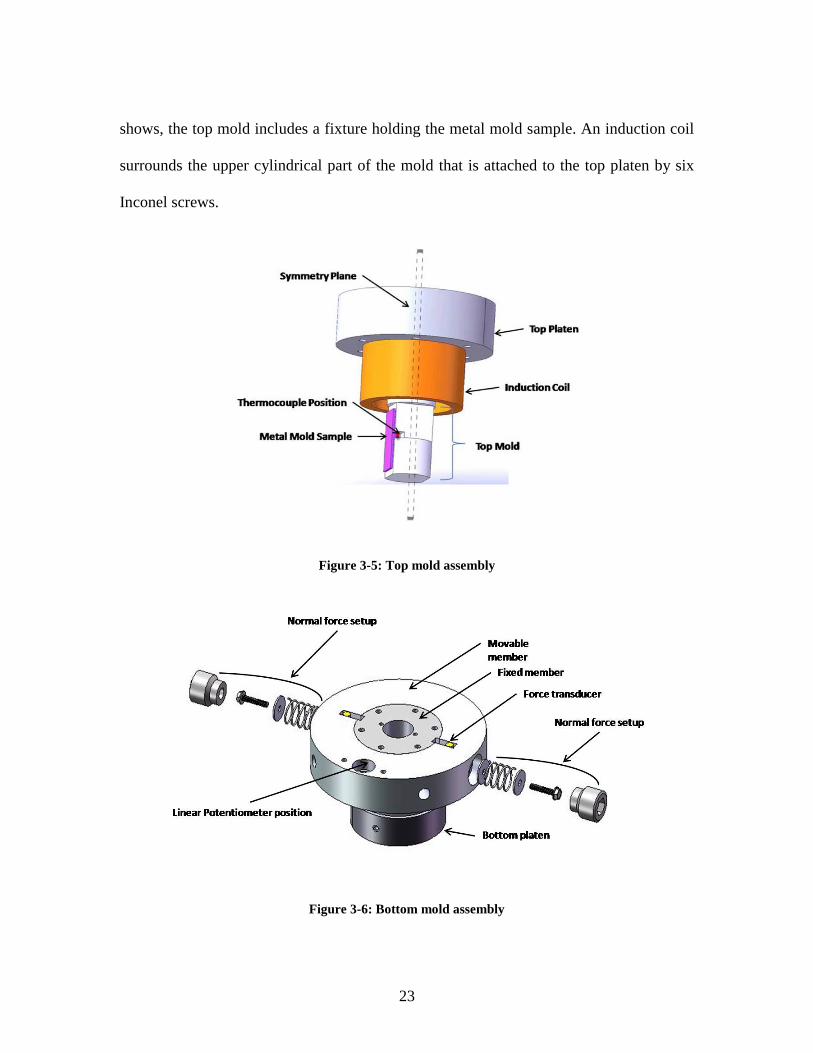
23
shows, the top mold includes a fixture holding the metal mold sample. An induction coil
surrounds the upper cylindrical part of the mold that is attached to the top platen by six
Inconel screws.
Figure 3-5: Top mold assembly
Figure 3-6: Bottom mold assembly

24
The bottom mold consists of a fixed and a movable part to guarantee easy
attachment and alignment of the sample and measurement equipment, i.e. the glass piece,
thermal insulator, and force transducer, inside the assembly. The former is attached to the
bottom platen with the movable member encircling it. The movable member is seated
after inserting the friction measurement equipment. Finally, a washer, spring and set
screw are attached to the movable fixture to guarantee the perpendicular alignment of the
entire system. Normal forces between the samples under test are measured by two
miniature load cells that are loaded through a spring and adjusting screw assembly. A
linear potentiometer (not shown in the figure) is attached to the movable fixture to
measure the displacement between the bottom mold and the top mold which is fixed. A
section drawing of this assembly is shown in Figure 3-7.
Figure 3-7: Cross-section view of Figure 3-6 showing the assembly of bottom mold 3.4 Material Selection for Top and Bottom Molds
In friction measurement at elevated temperatures, the materials were selected
based on their thermal conductivity, a material property that describes the flow of heat

25
through a material at steady-state, and their thermal diffusivity, a property indicating how
fast heat can move along the material in transient state. In addition, since this system
relies on induction heating over a short period of time Inconel and Tungsten Carbide
(WC) are good choices for the top mold. The selection of the material was defined by
simulation to avoid any unpredictable temperatures in the top mold during the friction
test.
In the real PGM operation, the temperature controller applies power to the
induction coil whenever the temperature is less than the defined value of the desired
temperature profile. When the temperature reaches the defined value, it then stops
heating, and if the temperature rises above the target value, a nitrogen flow cools the
system to maintain the temperature close to the target. As this loop continues, the error
tends to decrease over time as the entire system reaches equilibrium.
To determine the right material for the top mold, a commercial FEA software
ABAQUS was used to simulate the transient temperature behavior of the top mold. The
3D geometrical model of this simulation shown in Figure 3-8 illustrates the boundary
condition of loading. In this system, the induction coil heating was modeled as a 1 KW
surface heat flux into the cylinder of the fixture with the remaining surfaces, except the
top surface which is insulated, allowing the heat to dissipate through forced convection.
Two thermocouples detect the temperatures in the upper and middle surfaces of the part.

Figure 3-8: 3D view of boun
The material propertie
in Table 3-1. Using a targe
results of the simulation at th
illustrated in Figure 3-9 and F
Table
Material Thermal Conductivity (W/m˚C)
Specifi(J/Kg˚C
Inconel 12.6 43
WC 78.7 20
26
undary condition for simulation of heat transfer in uppe
rties and process parameters used in this simulatio
get temperature of 600˚C for the middle therm
the middle and upper thermocouples for Inconel
Figure 3-10, respectively.
ble 3-1: Parameters used in the simulation
cific heat ˚C)
Density 3( / )Kg m
Film coefficient
(W/2m ˚C)
Room temperature
(˚C)
431 8280 100 20
209 14650 100 20
per fixture
tion are shown
rmocouple, the
el and WC are
Target temperature
(˚C)
600
600

27
Figure 3-9: Temperatures at the middle and upper thermocouples for Inconel
Figure 3-10: Temperatures at the middle and upper thermocouples for WC

28
The results of the simulation reveal that the temperature in WC reaches
equilibrium (600˚C) twice as fast as for Inconel. In addition, the upper thermocouple
temperature for Inconel reaches more than 1400˚C, which is very close to its melting
temperature. Consequently, WC has been selected as the material for the top mold setup.
For the bottom mold, the only concern is that the temperature in the vicinity of the
force transducer, as its maximum safe temperature is 93˚C according to the supplier’s
manual. Using a ceramic thermal break of 18 mm between the hot glass and the force
transducer assures that the temperature around the transducer is in the range of the safe
zone. As a result, the bottom mold setup can be made from a typical stainless steel such
as SS304.
3.5 Experimental Setup
The experimental setup for the measurement of the frictional and normal forces is
shown in Figure 3-11. After installation of the upper and lower molds and the test
samples, the glass cylinder is raised into position to surround the molds and seal them
from the exterior atmosphere. The chamber is evacuated and then filled with nitrogen to
prevent the mold components from oxidation. The friction force was measured by the
load cell (SWP-5K from Transducer Techniques Inc.) in the upper frame of the PGM
machine, while the normal forces were measured by two mini-column load cells
(MLC-2K from Transducer Techniques Inc.). These strain-gage-based force transducers
can operate at temperatures up to 93˚C. To insure the safety of the load cells during high
temperature testing, a ceramic insulator is placed between the load cell and the glass
sample under test. The output from the load cells was a voltage signal conditioned and

amplified by a TMO-2 signa
and received by a NI PCI-62
recorded using National Inst
force signals and elapsed tim
Hertz.
Figure 3-11 The procedure for running the
1- After the fixed memb
was inserted into the
the top of bottom plat
through its guide in th
2- After installing the to
upward toward the top
mold.
29
gnal conditioning module purchased from the sam
6229 data acquisition card. The resulting force da
nstruments Lab View graphical programming so
ime were recorded for each run at a sampling freq
11: Experimental setup for friction measurement
the friction test is summarized below:
mber was installed on the bottom platen, the forc
e movable member through its slot guide and th
laten. Then the glass which is glued to ceramic pi
the fixed member.
top mold, the fixed member of the bottom mold
top until the sample to be tested was 20 mm insid
same company
data were then
software. Both
requency of 50
orce transducer
then placed on
piece is placed
old was moved
side the bottom

30
3- Finally the normal force is applied by the screw. The washer and spring
guarantees the perpendicular alignment of the whole setup.
4- Temperature and position profiles were created on the Graphical User Interface
(GUI) of the PGM machine; a typical machine cycle for this test is shown in
Figure 3-12. The temperature cycling seen is due to the on/off operation of the
induction coil as it attempts to maintain the commanded temperature.
5- The machine began its cycle under position control, and all force transducers
measured the force data. The linear potentiometer measures the relative
displacement between the top and bottom molds.
6- Having determined both the frictional and normal forces, the instantaneous
friction coefficient is calculated by 𝜇 =
where F and N are instantaneous friction and normal forces, respectively.
Figure 3-12: Typical temperature and position profile for friction test

31
CHAPTER FOUR
MATERIAL AND METHODS
4.1 Glass Material
Two types of oxide glasses are used in this research, N-BK7 (from SCHOTT Inc.)
which is suitable for PGM process and soda-lime-silica glass (Optifloat from
PILKINGTON Inc.) which is used in most of the literature. Both glasses are categorized
as oxide glasses as the dominant part of their structure are comprised of silicon dioxide.
The glass transition temperature (Tg) of both glasses is close, but their viscoelastic
response is different away from Tg as their viscosity curve versus temperature behaves
differently. In order to understand the glass viscoelasticity, the viscosity response of glass
with respect to temperature needs to be understood.
4.1.1 Glass Viscosity
Glass is an inorganic polymer, held together with both covalent –Si-O-Si- bonds
and ionic bonds. Its properties are temperature dependent, exhibiting non-linear behavior
at elevated temperatures. For example, under high shear stress, much glass forms melts
similar to polymers, exhibiting shear thinning behavior. A typical viscosity-temperature
curve for soda-lime-silica glass in a wide range of temperature is shown in Figure 4-1. As
this figure shows, the temperature of 550˚C is the glass transition temperature for this
material.

Figure 4-1: Viscosi
The formation of glas
during the forming process a
Shelby [1], a number of spec
selected as a reference poin
illustrated in Figure 4-2.
Figure 4-2: Reference point visc
32
osity-temperature relation of a soda-lime-silica glass [20]
lass objects from a melt requires accurate control
s as it depends on shear rate and temperature. A
ecific viscosities based on NIST standard No. 71
int for most commercial glasses in the molding
iscosity as a function of temperature for a soda-lime-sili
20]
rol of viscosity
. According to
710 have been
ing industry as
silica glass melt

33
These reference points are defined as follows:
1- Melting point is a temperature at which the fining and homogeneity can be
obtained in a reasonable time. The viscosity of melting point is <= 10 Pa.s for
commercial glass.
2- Working point is the temperature at which the viscosity is approximately 310
Pa.s. This is the viscosity of glass for initial processing.
3- Softening point is a temperature at which the viscosity is close to 6.610 Pa.s. At
this viscosity, the glass melt stabilizes and does not deform under its own weight.
The temperature range between the working and softening point is called the
working range.
4- Annealing point is a temperature at which internal stress is relieved in a few
minutes. The viscosity of a glass is between 1210 and 12.410 Pa.s in this region.
5- Strain Point is a temperature at which internal stress is relieved in several hours.
The viscosity of a glass is 13.510 Pa.s, and it behaves as an elastic material in this
region.
There are two other reference temperatures that are not used to show the viscosity
of glass melt; the glass transition and dilatometric softening temperature can be easily
used to compare the viscosity of different glass compositions during the glass forming
process. The glass transition temperature, Tg, defined as the temperature at which the
thermal expansion coefficient changes, depends upon the thermal mass (sample size), rate
of heating, and property measured (thermal expansion, specific volume, enthalpy). As a
result, different suppliers may report different values of Tg for the same glass, but an

34
average viscosity of 12.310 Pa.s is reported by Moynihan [21] for common glasses. The
dilatometric softening point, Td, is the temperature at which the sample reaches its
maximum length in a length versus temperature curve during the heating of the glass. It
also depends on the applied load and the size of the sample.
The discussion above shows that glass melt behavior ranges from elastic to
viscous depending on the temperature. In the other words, at low viscosities, hot glass
gobs behave as viscous fluids and at extremely high viscosity, the super-cooled liquids
show elasticity. There is an intermediate region in the viscosity-temperature curve where
the response of these melts to applied stress lies between a pure liquid and an elastic
solid, and is the called viscoelastic region. For common rates of stress application, these
viscosities lie in the region of the glass transformation range, particularly in the range
from 1310 to 810 Pa.s.
In this study, the viscosity value at different temperatures is given by the suppliers
and listed in Table 4-1. Based on these values and fitting (non-linear) them to the
Vogel-Fulcher-Tammann (VFT) equation given by Equation (4.1) [22], the viscosity
curves versus temperature for these two glasses are calculated and shown in Figure 4-3.
Log(𝜂) = 𝐴 + Eqa. (4.1)
where 𝜂is the viscosity at temperature T, and A, B, and 𝑇 are constants.

35
Table 4-1: Reference temperature for BK7 and Soda-Lime-Silica glass reported by supplier ( 𝑷𝒂. 𝑺)
Glass type Strain point
Transformation Temperature
Annealing Point
Softening Point
BK7 𝑙𝑜𝑔(𝜂) = 13.5 At Temp 557°C
𝑙𝑜𝑔(𝜂) = 12 At Temp 557°C
Not reported 𝑙𝑜𝑔(𝜂) = 6.6 At Temp 719°C
Soda-lime 𝑙𝑜𝑔(𝜂) = 13.5 At Temp 526°C
𝑙𝑜𝑔(𝜂) = 12.3 At Temp 552°C
𝑙𝑜𝑔(𝜂) = 10.3 At Temp 600°C
𝑙𝑜𝑔(𝜂) = 6.6 At Temp 732°C
Figure 4-3: Viscosity versus temperature for BK7 and soda-lime-silica glass
4.1.2 Characterization of Glass Transition Temperature
In order to find the glass transition temperature of the glasses, Differential
Scanning Calorimetry (DSC) measurements were performed using TA Instruments SDT
2960. The DSC measurements were taken in nitrogen atmosphere at a heating rate of
10°C per minute. The glass transition temperature (Tg) was determined from the DSC
data curves and shown in Figure 4-4. Tg is 597°C and 593°C for BK-7 and soda-lime
respectively based on the first inflection point of the endothermic peak. These data are in

36
a good agreement with the data reported by manufacturer and reported in Table 4-2
except that they are shifted. Again, the difference is the same as the difference reported
by supplier but the whole data shifted by 40°C. This table also shows the thermal and
physical properties of these glasses reported by supplier.
Figure 4-4: DSC curves for soda-lime and BK7 @ 10°C per minute
Table 4-2: Physical (at 20°C) and thermal properties of BK7 and Soda-lime reported by supplier
Glass type
Density (kg/m3)
Co. of thermal
expansion (ppm)
Young’s modulus
(Gpa)
Poisson’s Ratio
Thermal Conductivity
(W/mK)
Tg by supplier
(°C)
BK7 2510 7.1 82 0.206 1.114 557
Soda-lime 2500 9 73 0.23 1 552
37
4.1.3 Glass Viscoelasticity
Viscoelastic behavior is the time/frequency dependent response of a material to a
strain or stress while elasticity is purely a stress-strain relationship. According to Findley
et al. [23], this time dependent behavior must be expressed by a constitutive equation
which includes time as a variable and relates stress and strain. In other words, the
constitutive equation is representative of the stress history inside the material during the
cycle time of loading and unloading in the forming process. This equation can be linear
or non-linear based on the stress level. The material is said to be linearly viscoelastic if
stress is proportional to strain at a given time and vice versa. As long as stress is low, the
theory of linear viscoelasticity is valid for most oxide glasses according to Rekhson et al.
[24], Duffrene [25], and Scherer [26].
The classic description and easy way to derive the viscoelastic constitutive
equation is through the use of mechanical analogs. The simplest mechanical analog for a
linear elastic material is a spring and for a pure viscous material it is a dashpot. A
combination of these mechanical elements can be used to represent viscoelastic models.
Maxwell and Voigt-Kelvin are the simplest models while three and four elements (Burger
model) produce better models for actual materials [23].
In analytical modeling of materials, it is useful to separate shear strain and
extensional strains mathematically. Shear strain is responsible for changing the shape of
the body while extensional strain is responsible for both the shape and the volume of the
body. In viscoelastic materials, the analytical model is separated to pure shear (deviatoric
or shape change) and pure dilatation (spheric or volume change). In this study, there is an

interest in the deviatoric part
creates pure shear on glasses.
The Burger model is
viscoelastic terminology used
are briefly implemented as fo
4.1.4 Theoretical Backgroun
The Burger model is
shown in Figure 4-5.a. The co
1 2 1 1 2
1 2 1 2 2
( ) ( )tG G G G G
η η η η ησ σ+ + +&& &
where 𝐺 and 𝜂 are elastic shea
Figure 4-5: a) Mechanical
The strain response o
behavior of Maxwell and Kel
20 0 0
1 1 2
( ) (1 Gt t eG G
σ σ σεη
−= + + −
38
art of the response as the sliding between molds
es.
is a good representative of pure shear. To un
sed in this study, a creep-recovery analysis for a B
follows.
und of Creep (Response of System to Constant Stre
is a series combination of Maxwell and Kelvi
constitutive equation for this model is:
1 21
2
) ( ) ( ) ( ) ( )t t t tG
η ησ σ ε η ε+ = +&& & Eq
hear modulus and viscosity of glass, respectively.
al analogue for Burger model b) Behavior of Burger mod
of this system under constant stress is the sum
elvin models and is given by:
2 2/ )G t η
Eq
lds and glasses
understand the
a Burger model
tress)
lvin models as
Eqa. (4.2)
odel [23]
m of the creep
Eqa. (4.3)

39
The first two terms on the right hand side of Equation 4.3 represent instantaneous elastic
strain and viscous flow while the last term represents the delayed-elasticity.
Differentiating Equation 4.3 yields the creep rate as:
2 2/0 0
1 2
( ) G tt e ησ σεη η
−= +& Eqa. (4.4)
So, the creep rate at t=0+ has a finite value of 𝑡𝑔𝛼 in Figure 4-5.b and can be calculated
by:
01 2
1 1(0) ( ) tgε σ α
η η= + =& Eqa. (4.5)
And its value at infinity reaches based on Equation 4.4. Figure 4-5 also shows that:
0 1( ) / tgε σ η β∞ = =&
0 2/AA Gσ′ = Eqa.(4.6)
0 1/OA Gσ=
Thus, in theory the material constants of the Burger model can be determined by
measuring the values of 𝛼, 𝛽, 𝑂𝐴, 𝑎𝑛𝑑 𝐴𝐴 in a creep experiment.
4.1.5 Theoretical Background of Stress Relaxation (Response of System to Constant
Strain Rate)
The constitutive equation for a Burgers model can be also derived by considering
the stress response under constant strain rate (𝜀(𝑡) = 𝜀 (𝑡)) as well. In this case, the
constitutive equation has simplified to:
1 2 1 1 21 0
1 2 1 2 2
( ) ( ) ( ) ( )t t tG G G G G
η η η η ησ σ σ η ε+ + + + =&& & Eqa. (4.7)

40
where 0ε is the slope of applied strain. The relaxation response can be found by applying
the initial boundary condition of 𝜎(0) = (0)σ& = 0 . The solution to this linear ODE
depends on the value of 𝜂 , 𝜂 , 𝐺 , 𝐺 , 𝑎𝑛𝑑 𝜀 . In MATLAB, the ode45 function can be
used to numerically solve this linear second order differential equation.
For example, the response of the Burger model to 0 0.1ε = and considering 𝜂 = 100 𝑃𝑎. 𝑠, 𝜂 = 10 𝑃𝑎. 𝑠, 𝐺 = 100 𝐺𝑃𝑎, 𝐺 = 5 GPa is shown in Figure 4.6.
During friction testing, the apparatus imparts a constant shear strain rate to the
glass. If the material is behaving viscoelastically, and there is no sliding, it can be
expected that the force will vary in time in a manner similar to that shown in Figure 4-6.
Figure 4-6: Stress relaxation response of Burger model to a constant strain rate

41
4.2 Mold Material
Tungsten Carbide (WC) was selected as a mold material as it has a high thermal
conductivity, low thermal expansion, excellent wear resistance, excellent high
temperature strength, and fine surface roughness which make it suitable for glass
molding. The EMT 100NG grade (from Extramet Inc.) was used as a mold material for
this study with physical properties listed in Table 4-3
Table 4-3: Tungsten Carbide properties
Tungsten Carbide
Grain Size (µm)
Density (𝑔/𝑐𝑚 )
Hardness HV 30
Transverse Rupture Strength (𝑁/𝑚𝑚 )
Coefficient of thermal expansion
(ppm)
Thermal Conductivity
(W/mK)
EMT100
< 0.8
14.85
1,717
> 3,900
4 41.87
4.3 Mold Coating
Without coating, the WC mold has a short lifetime because of chemical
interaction between the mold surface and glass [27]. In this study, TiAlN-CrN-S4
commercially named as C2-SL + S4 (from Richter Precision Inc.) was used as a coating.
It has a maximum working temperature of 950˚C which makes it suitable for our purpose.
4.4 Surface Roughness of Material
A Zygo scanning white light interferometer (New View 6K) was used to measure
the mold and glass surface topography before each test to ensure that there was no
residual glass stuck to the mold surfaces. Also, an optical microscope (Olympus SZX12)
was used to qualitatively check the mold surfaces.

42
4.4.1 Mold Surface Condition
Two different surface conditions; ground, and polished (both coated) were used in
this study. The roughness profiles of various areas for both conditions were observed and
averaged to get the Root Mean Square (RMS) value of roughness as shown in
Figure 4-7.a and 4-7.b. These figures show the RMS value of 672 and 38 nm for ground
and polished molds, respectively. Also, Figure 4-7.a clearly shows the grinding marks left
by the grinding wheel on the surface.
Figure 4-7.a: Surface roughness data for a ground and coated mold

43
Figure 4-7.b: Surface roughness data for a polished and coated mold
The polishing procedure used in this study was selected based on Buehler’s
recommendation for refractory metals [28]. This is a four-step procedure to reach optical
level surface roughness.
4.4.2 Glass Surface Condition
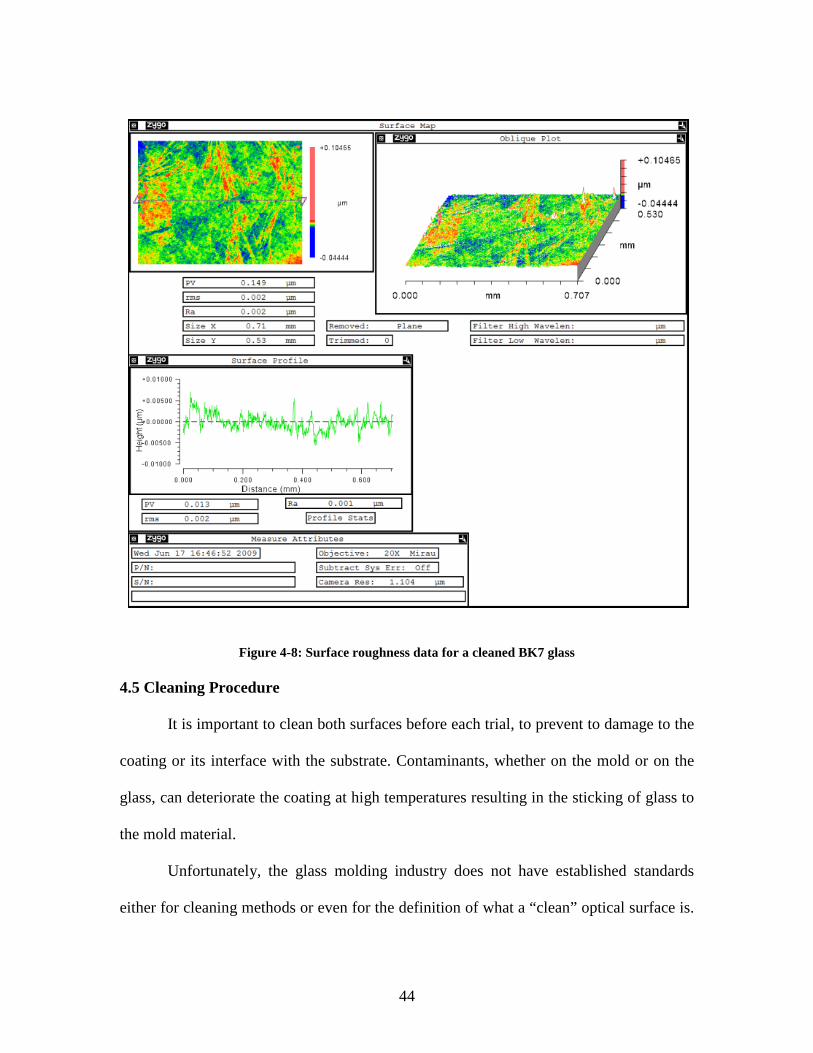
Both glasses used in this study had an RMS surface roughness value around 2 nm
on the polished surfaces. For example, Figure 4-8 shows the surface roughness data for a
BK7 sample after cleaning by inorganic solvents described in the next section.
44
Figure 4-8: Surface roughness data for a cleaned BK7 glass 4.5 Cleaning Procedure
It is important to clean both surfaces before each trial, to prevent to damage to the
coating or its interface with the substrate. Contaminants, whether on the mold or on the
glass, can deteriorate the coating at high temperatures resulting in the sticking of glass to
the mold material.
Unfortunately, the glass molding industry does not have established standards
either for cleaning methods or even for the definition of what a “clean” optical surface is.

45
The only widely accepted method is the wipe technique using different types of solvent.
In this method, a lint free tissue smoothly and continuously removes stains from surface.
In this study three different solvents; acetone, ethanol, and isopropanol are used to clean
the glass surface, respectively [Edmund Optics Inc.]. Also, after each molding trial, the
mold surfaces needed to be thoroughly cleaned by acetone. The interferometric
measurement of a piece of glass before and after cleaning has proven the effectiveness of
cleaning by improving the surface finish on the order of 100 nm. As a result, this cleaning
procedure was used for all trials in this research.
4.6 Oxidation
Oxidation is an intrinsic behavior of metal surfaces at high temperature. To
prevent this phenomenon, oxygen should be removed from experimental environment
and the cheapest way is by purging with high volumes of nitrogen.
4.6.1 Nitrogen Properties
Two grades of nitrogen (from Airgas Inc.) were used in this study; one high purity
(HP) and the other ultra high purity (UHP). Different chemical components in these two
grades are listed in Table 4-4. Both nitrogen grades have been used and prevented molds
from oxidation.
Table 4-4: UHP and HP nitrogen different component
description Grade Min. Purity
Max. H2O
(ppm)
Max. O2
(ppm)
Max. THC (ppm)
Max. Ar
(ppm)
Max. CO2
(ppm) UHP 5.0 99.999% 1 1 0.2 20 0.5
HP 4.8 99.998% 5 1 0.5 20 0.5

46
CHAPTER FIVE
EXPERIMENTAL RESULTS
5.1 Instantaneous and Average Friction Coefficient
There are two ways to quantitatively represent the friction coefficient in literature;
one, instantaneous friction coefficient, and the other averaged friction coefficient. The
former is used when there is no noise in the friction data and one can distinguish between
static and dynamic friction clearly. In this case, the friction coefficient is calculated by
dividing the frictional force by the normal force. Since friction is a nonlinear and
discontinuous property as reported by Feeny et al. [29] and due to the normally
distributed noise in the experimental data which is reported by Schmitz et al. [30], an
average friction coefficient calculation was developed as following:
First, the friction work is calculated by: W = ∑ F ∗ d , i = 1,2,3, … . n Eqa. (5.1)
Then, the average friction force at each point can be expressed as: F = ∑ ∗ , i = 1,2,3, … . n Eqa. (5.2)
Finally, the average friction coefficient can be calculated by dividing the average friction
force to the normal force by: μ = Eqa. (5.3)
where μ is the average friction coefficient. By using this method, the average friction
coefficient can be determined as a quantitative value.

47
5.2 Validation of Machine Functionality at Room Temperature for a Steel-Steel
Friction Pair
Repeatability is the variability when the same person runs the same test
repeatedly. To validate the basic functionality of the apparatus, repeatability tests were
conducted at room temperature between a ground steel-steel friction pair, and the results
compared to published data. For these tests, the normal force was adjusted to 100N and
the feed rate to 1 mm/min. Both steel surfaces were ground with surface roughness of 435
µm (RMS value) and the room temperature was 22 ±1˚C. The results of sliding force
(friction force), the data recorded by machine force transducer, versus displacement, data
recorded by linear potentiometer installed on the bottom mold, are plotted in Figure 5-1.
This figure clearly shows that the friction force increases to the onset of sliding at which
time the dynamic friction becomes dominant. Both materials behave as an elastic solid
and they slide against each other after reaching the limiting value of friction force at
around 50 microns of total displacement.
Figure 5-2 shows the result of applying average friction coefficient calculation to
the data of Figure 5-1. This figure shows that the friction coefficient increases until the
sliding begins and then levels off with an essentially constant dynamic friction
coefficient. The mean value of 0.17 achieved here as the dynamic friction coefficient
value between a steel-steel pair at room temperature is in the range reported by Grigorier
el al. [31] in their study, where they measured friction coefficient values of 0.15-0.2 for a
steel-steel pair at room temperature.

48
Figure 5-1: Frictional and normal force generated between a pair of steel- steel at room temperature
Figure 5-2: Friction coefficient curve between a pair of steel-steel at room temperature

49
5.3 Validation of Machine Functionality at Room Temperature for a Steel-BK7
Friction Pair
Again, another experiment with the same conditions as to the previous section
was conducted using a steel-BK7 pair and the result of friction and normal forces versus
displacement is shown in Figure 5-3. Also, instantaneous and average friction
coefficients versus displacement are shown in Figure 5-4. This figure shows a lower
value of friction coefficient for steel-BK7 pair since the glass has a lower surface finish
in comparison to ground steel. Its friction coefficient is close to 0.1.
Figure 5-3: Frictional and normal force generated between a pair of steel-Bk7 at room temperature
Figure 5-4: Friction coefficient curve between a pair of steel-BK7 at room temperature
50
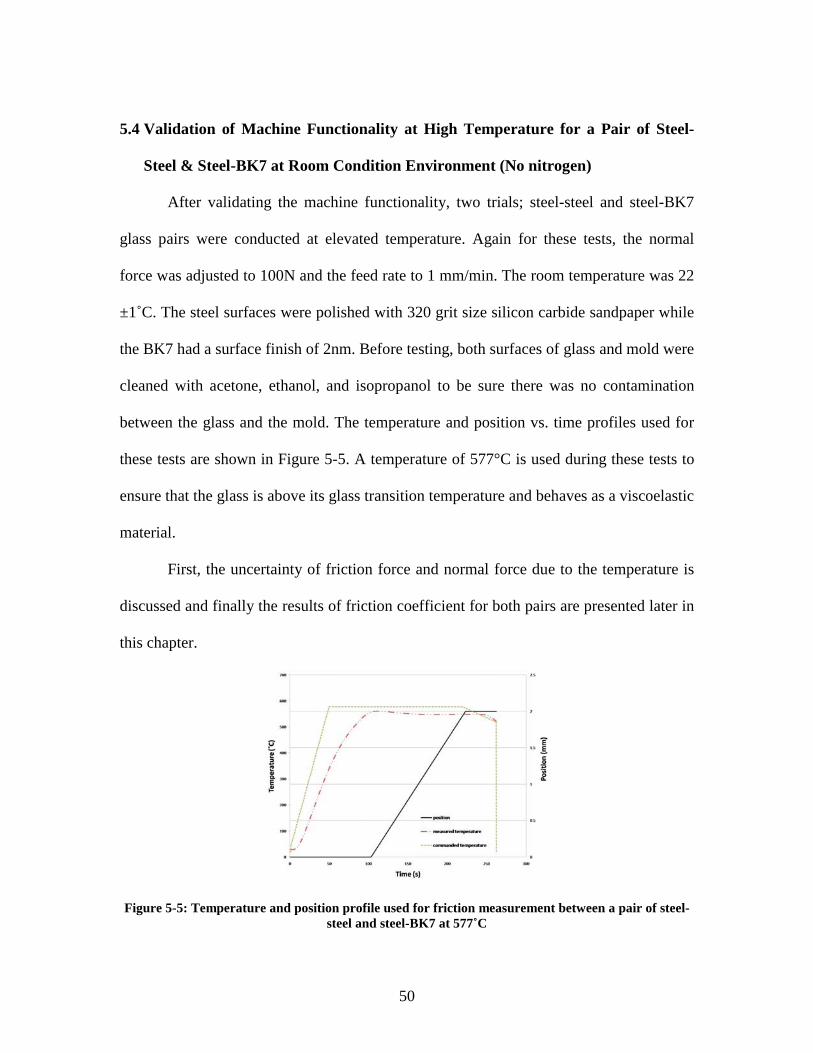
5.4 Validation of Machine Functionality at High Temperature for a Pair of Steel-
Steel & Steel-BK7 at Room Condition Environment (No nitrogen)
After validating the machine functionality, two trials; steel-steel and steel-BK7
glass pairs were conducted at elevated temperature. Again for these tests, the normal
force was adjusted to 100N and the feed rate to 1 mm/min. The room temperature was 22
±1˚C. The steel surfaces were polished with 320 grit size silicon carbide sandpaper while
the BK7 had a surface finish of 2nm. Before testing, both surfaces of glass and mold were
cleaned with acetone, ethanol, and isopropanol to be sure there was no contamination
between the glass and the mold. The temperature and position vs. time profiles used for
these tests are shown in Figure 5-5. A temperature of 577°C is used during these tests to
ensure that the glass is above its glass transition temperature and behaves as a viscoelastic
material.
First, the uncertainty of friction force and normal force due to the temperature is
discussed and finally the results of friction coefficient for both pairs are presented later in
this chapter.
Figure 5-5: Temperature and position profile used for friction measurement between a pair of steel-steel and steel-BK7 at 577˚C

51
5.4.1 Uncertainty of Normal Force Due to the Temperature
The normal force may change due to thermal expansion between one end of the
friction sample under test which is in contact with the hot mold and the other end which
is in contact with the thermal break. The load cells used to monitor normal force are
strain-gage based, and show significant sensitivity to change in temperature. Therefore,
while they can be used to adjust the normal force during setup, they do not accurately
monitor the force after heating of the system has begun. The variation in normal force
can be estimated by considering thermal expansions of the elements in the load path.
The thermal break in our experiment is made of fine ceramic which has a low
coefficient of thermal expansion. In the worst case, by assuming a thermal expansion
coefficient of 10 ppm for all materials and assuming that the initial temperature is the
room temperature, the maximum elongation in the normal load path is around 0.175 mm
on each side.
Since there is a helical spring at the back of each force transducer as shown in
Figure 5-6, this elongation may cause a change in the normal force. This force can be
calculated from the stiffness of this spring, which is approximately 20 N/mm. So, the
maximum force created by thermal expansion is on the order of 3.5 N, which is
insignificant compared to the initial value of 100 N, meaning that the initial value of
normal force can be used for the instantaneous friction coefficient calculation. Also, since
the expansion of the movable and fixed members of the bottom mold tends to decrease
the spring deflection, the worst case change in normal force is likely less than the above

described scenario. As a resu
for instantaneous friction calc
Figur
5.4.2 Uncertainty of Friction
The temperature in the
consequently there is a large
result in a large force in the
expand. Since there is a hollo
top mold can freely expand
friction path. The only force
surface which is in contact w
displacement with a constant
As a result, the thermal expan
transducer does not corrupt th
Thermal drift could b
the temperature of the strain
temperature, which in this cas
52
esult, the normal force is considered to be the ini
alculation.
gure 5-6: Section view of normal load path
ion Force Due to the Temperature
the top mold is around 600°C for most of the exp
rge thermal expansion of the top mold. This elo
he friction path if there is not free space for the
ollow cylinder inside the fixed fixture in the botto
inside the bottom mold without creating any
rce created by this elongation is a shear force
t with the mold. On the other hand, this elongat
nt strain rate on the glass, creating some shear fo
ansion created by temperature is recorded by the f
t the friction force data.
d be another source of error on friction force me
ain gage force transducer differs from the origin
case is room temperature. To find the thermal drif
initial set value
xperiments and
elongation may
he top mold to
ttom mold, the
forces in the
e on the glass
ation acts as a
force on glass.
e friction force
measurement if
iginal set point
rift of the force

53
transducer, a test using a WC-BK7 pair at high temperature (600 °C) and long time (1250
sec) was conducted. In this test, the commanded position was held constant, and the
resulting plot of measured “friction” force versus time is illustrated in Figure 5-7.
Figure 5-7: The effect of thermal drift on friction force
Since the position is constant, the build-up of the measured force is due to thermal
expansion of the WC mold carrier and the thermal drift of the force transducer. The
temperature of the WC mold carrier reaches equilibrium fairly quickly, at about 200
seconds in the plot above. The temperature of the force transducer takes much longer to
develop due to the ceramic thermal break between the mold carrier and the load cell.
Figure 5-7 shows that the measured force increases approximately linearly with time at a
rate of 0.085 N/sec. All subsequent friction force data reported in this dissertation will
have this time dependent behavior of the load cell deducted from the raw data.

54
5.4.3 The Friction Data for a Steel-Steel and Steel-BK7 Pairs at Elevated Temperature
Finally, the result of friction force versus displacement for a pair of steel-steel and
a pair of steel-BK7 is shown in Figure 5-8 and Figure 5-9, respectively. These figures
show substantially more complex friction behavior than for the room temperature
steel-steel pair. Both figures clearly show an increase in friction force with increasing
temperature which is also reported by Rangnatha et al. [32].
As Figure 5-8 shows, for the high temperature steel-steel pair, sliding behavior is
reached early after backlash between the normal (horizontal) and frictional force
(vertical) path is removed. From that time the friction force stays constant until about
1200 microns of displacement and then due to some anomaly encountered in the surface,
or perhaps even galling that can occur with self-mated materials, it rises. In Figure 5-9,
for the high temperature steel-BK7 pair the friction force increases based on the
viscoelastic response of material to constant strain rate as discussed in Section 4.1.5. The
Burger model explains clearly that the stress relaxation response of a viscoelastic material
to a constant strain rate has similar trend to that shown in Figure 4-5, and explains why
the friction force is rising over time.

55
Figure 5-8: Frictional force generated between a pair of steel- steel at 577˚C
Figure 5-9: Frictional force generated between a pair of steel-BK7 at 577˚C
Moreover, both figures include regions of stick-slip phenomenon clearly visible
when the position reaches around 1200 microns. Figure 5-10 and Figure 5-11 provide a
zoomed-in view of this portion of the graphs showing two different types of stick-slip

56
phenomena. The first one is between two elastic bodies (steel-steel) and the other
between an elastic and viscoelastic body (steel-BK7). This stick-slip phenomena is still in
good agreement with the results reported by Persson [33] except that the second one
shows the apparent effect of viscoelastic behavior of glass on the response, meaning
viscoelasticity changes the stick behavior response in dynamic friction measurement.
Figure 5-10: Stick-slip phenomenon between a pair of steel-steel at 577˚C
(zoomed-in view of Figure 5-8)
Figure 5-11: Stick-slip phenomenon between a pair of steel-BK7 at 577˚C
(zoomed-in view of Figure 5-9)

57
5.4.4 Friction Coefficient at High Temperature for a Pair of Steel-Steel and Steel-BK7
The kinematic friction coefficient cannot be directly deduced when there is stick-
slip oscillation in friction data. Instead, the instantaneous friction coefficient can be used.
The instantaneous friction coefficients for both of these tests are plotted in Figure 5-12
and Figure 5-13, respectively. Both figures again show the stick-slip phenomena on the
friction coefficient.
Figure 5-12: Instantaneous friction coefficient curve between a pair of steel-steel at 577˚C
Figure 5-13: Instantaneous friction coefficient curve between a pair of steel-BK7 at 577˚C

58
5.5 The Important Parameters Affecting Friction Curves for Glass Molding
5.5.1 Temperature
In friction measurements for glass molding, temperature has a significant role
because it changes the viscosity of glass drastically. For example for BK7, changing the
temperature from 565˚C to 588˚C changes the viscosity from 10 . Pa.s to 10 . Pa.s,
meaning that raising the temperature by 20˚C changes the viscosity by one order of
magnitude.
In order to find the effect of temperature on friction data, a group of tests using a
steel-BK7 pair have been conducted at different temperatures and the results are plotted
in Figure 5-14. For these tests, all the other process parameters are held constant at the
same values described in Section 5.4. This figure shows that the friction force begins to
rise after the temperature reaches approximately 325˚C, similar to what happens between
steel-steel at high temperature. Still, at temperatures well below Tg, such as 400˚C, BK7
behaves as an elastic material and there is no significant viscoelastic response of the
material to applied load as shown in Figure 5-15. Raising the temperature close to the
glass transition temperature of glass causes the viscoelastic response of material in the
stick-slip regime of frictional force as shown in Figure 5-11.

59
Figure 5-14: Frictional force curve between a pair of steel-BK7 at different temperature (feed rates 1 mm/min, Normal force 100 N, and no externally applied UHP nitrogen)
Figure 5-15: Stick-slip phenomenon between a pair of steel-BK7 at 400˚C (zoomed-in view of Figure 5-14)

60
5.5.2 Feed rate
For proper measurement of friction, it is necessary to minimize the thermal and
elastic structural loop of apparatus. Research conducted by B. N. J. Persson [33] and A.
D. Berman [34] using the surface force apparatus shows the effect of stiffness, velocity
and mass on friction data. They show different regimes from stick-slip to steady sliding
in their study depending on the structural loop mass and stiffness and the sliding velocity.
The machine used in this research is designed for very high PGM forces (up to
20,000 N) and temperatures up to 800˚C. Also, it has a closed structural loop which
makes it suitable for measuring stick-slip phenomena. However, the structural dynamics
of the machine can affect the friction data as the vertical axis of the machine (friction
force path) has finite stiffness and mass. Depending on the feed rate or nominal sliding
speed of the test, the dynamic structural response of the machine may affect the friction
data. To investigate this effect, two trials one at high feed rate (10 mm/min) and the other
at low feed rate (1 mm/min) using a steel-BK7 pair were conducted at room temperature
and the results are plotted in Figure 5-16. Again, the other process parameters are similar
to Section 5.4. These plots clearly explain the effect of feed rate on the friction force. As
a result, feed rate affects the friction coefficient at high temperature as well and needs to
be considered.

61
Figure 5-16: The effect of feed rate on friction force for a pair of steel-BK7 at room temperature
5.5.3 Normal Load
To investigate the effect the of normal load on friction data, a trial using a
polished and coated WC mold-soda lime silica glass pair was used when the normal force
was adjusted to 120 N and the result is presented in Figure 5-17. Again, the feed rate was
1 mm/min, and the test was conducted at room temperature. An instantaneous friction
coefficient of 0.1 was observed. This value is in good agreement with the results of
measurement in Section 5.3 and it shows that variations in the normal force don’t affect
the friction coefficient. The Coulomb’s model which is the ratio of friction force to
normal force should be a constant value for a pair of known material regardless of the
applied load. Consequently, increasing the normal force increases the friction force
proportionally for materials with constant friction coefficient.

62
But at high temperatures, increasing the normal load decreases the gap between
hot mold and glass and consequently the gap conductivity increases, meaning that there
will be a better thermal path between mold and glass. Having a higher temperature at the
interface affects the viscosity behavior of glass and consequently the friction coefficient
changes. So, the normal load at high temperature may affect the friction and need to be
considered.
Figure 5-17: Instantaneous friction coefficient between a pair of polished and coated WC-soda lime glass at room temperature and normal load of 120 N
5.5.4 Surface Roughness
Surface roughness is a critical factor (at room temperature) as reported in most
friction data handbooks. To investigate the effect of surface roughness on friction
coefficient, a test using a pair of steel-steel with mold surface roughness (RMS) value of
3.136 µm was conducted at room temperature and the result is shown in Figure 5-18.

63
Again, the other process parameters are similar to Section 5.2. As this figure shows, the
average friction coefficient of 0.28 was observed.
Comparing the friction coefficient values confirms the effect of surface roughness
on friction data at room temperature. So, it can be an important factor at high temperature
as well.
Figure 5-18: Friction coefficient curve between a pair of steel-steel with high surface roughness at room temperature
5.5.5 Glass Type
The glass behavior close to glass transition temperature depends on the thermal
history of glass during manufacturing. The cooling rate of a super-cooled liquid can
affect the fictive temperature, which is the artificial quantitative representation of
deviation from equilibrium, and consequently the properties of that particular glass can
alter.

64
Here, another series of experiments were conducted using steel-soda lime silica
glass pair with conditions similar to ones mentioned in Section 5.5.1 and the results are
shown in Figure 5-19.
Figure 5-19: Frictional force curve between a pair of steel-soda lime silica glass at different temperature (feed rates 1 mm/min, Normal force 100 N, and no externally applied UHP nitrogen)
Again, this figure shows that the friction behavior begins to rise after the
temperature reaches to 325˚C similar to what happens between steel-BK7 at high
temperature. Still, at temperatures well below Tg, such as 400˚C, soda lime behaves as an
elastic material in stick-slip regime of frictional force and there is no significant
viscoelastic response of material to applied load as shown in Figure 5-20. Raising the
temperature close to glass transition temperature of glass causes the viscoelastic response
of material in the stick-slip regime of frictional force as shown in Figure 5-21.

65
Figure 5-20: Stick-slip phenomenon between a pair of steel-soda lime at 400˚C (zoomed-in view of Figure 5-19)
Figure 5-21: Stick-slip phenomenon between a pair of steel-soda lime at 577˚C (zoomed-in view of Figure 5-19)

66
The only difference between the two friction force data (compare Figure 5-19 and
Figure 5-14) is the friction force amplitude. So, it can be seen that the use of different
glass types results in different values of friction coefficient.
5.6 The Friction Force between Polished and Coated WC-BK7 Pair at Conditions Similar
to Glass Molding Process
A set of tests at different elevated temperature using polished and coated
WC-BK7 pair were conducted and the results are shown in Figure 5-22. These curves
clearly show that the friction force is increasing with increasing temperature. This may be
related to the viscoelastic behavior of BK7 at elevated temperatures. Friction is related to
the mechanical interlock between two bodies and glass properties vary substantially with
temperature, as described in reference [1]; the friction force is strongly dependent on
temperature.
Figure 5-22: Friction force generated between a pair of polished and coated WC-BK7 at 20, 200, 300, 350, 400, 500, and 577˚C

67
Also, at temperatures close to the glass transition temperature, Tg, which is 557˚C
for BK7, the glass exhibits a viscoelastic response to applied loads while WC is in the
elastic regime. This glass viscoelasticity introduces time dependent response to the
dynamic friction data; meaning that the feed rate of the test can affect the measured
frictional load.
Stick-slip was not observed on any of these tests since the molds used have high
surface finish and are coated to prevent chemical interaction between the glass and mold
surface, and are conducted in an atmosphere of UHP nitrogen.
To evaluate the repeatability of the friction test at temperatures close to Tg,
multiple tests for coated and polished WC-BK7 pairs were conducted at 560˚C and the
results are shown in Figure 5-23. The repeatability results show that the change in friction
force is less than 30 N which is 20% of maximum friction force.
Figure 5-23: Friction force generated between a pair of polished and coated WC-BK7 at 560˚C for three trials with same process parameters at the same conditions

68
Dividing the friction force by the normal force, which is 100 N on each side,
gives the instantaneous normalized friction coefficient data. These data are plotted in
Figure 5-24 and they show that in the worst-case scenario, the normalized friction
coefficient ramps up to 0.7 and then levels off at around 0.6. There is a smooth transition
between static and dynamic friction.
Figure 5-24: Friction coefficient from Figure 5-23
5.7 Design of Experiment
Since multiple parameters may affect the measured friction coefficient, the
Design of Experiment (DOE) technique is implemented to study the effect of these
parameters systematically. DOE refers to an experimental framework used to quantify
indeterminate measurements of factors and interactions between factors statistically
through observance of forced changes made methodically as directed by mathematically

69
systematic tables. The DOE technique is based on making deliberate changes to one or
more factors in order to observe the effect these changes have on the response.
It is applicable in various scenarios such as achieving a desired target for the
process which is similar to fine tuning a process, maximizing or minimizing a response or
to find the key factors leading to a particular response, or to make the given process
robust. In this study the aim is to find the key factors affecting the friction coefficient. Its
primary purpose here is to identify significant main effects, rather than interaction effects.
Some of the common terms used when dealing with this type of DOE are:
- Factors are the parameters that can be controlled and influence the performance of the
final result.
- Levels of a parameter are the values that can show the parameter variability in its range;
low, intermediate, and high levels.
- Response of the DOE is the performance or the output achieved for the particular
combination of factors at particular level.
Since there is a mixed combination of levels and the goal is to find the main
effects of parameters on friction with a relatively few number of experiments, the
orthogonal array (Taguchi) method is a suitable approach to select the test parameters. An
important advantage of using this method is that the experimental matrix is orthogonal in
nature [35]. Orthogonality ensures that the estimate of any particular factor on the
response will not be distorted by the effects of other factors; meaning that the effect of
each factor can be mathematically calculated independent of the other factors. In this
method, the experimental matrix is defined by the number of parameters and their levels.

70
In this research, there are five main process parameters, each of them at different
levels as listed below:
1-Glass material at two levels; BK7 and soda-lime-silica glass
2- Normal load (N) at two levels; 100, 120
3- Feed rate or the relative velocity (mm/min) at two levels; 0.1, 1
4- Temperature at two levels; (Tg+20) 577˚C and (Tg+50) 600˚C
5- Mold surface condition at two levels; ground coated, and polished coated
A standard L8 Taguchi array matrix along with the actual values for the process
parameters is selected and shown in Table 5-1 and Table 5-2, respectively.
Table 5-1: Standard L8 Taguchi array matrix
Run X1 X2 X3 X4 X5 1 1 1 1 1 1 2 1 1 1 2 2 3 1 2 2 1 1 4 1 2 2 2 2 5 2 1 2 1 2 6 2 1 2 2 1 7 2 2 1 1 2 8 2 2 1 2 1
Table 5-2: Actual value for experimental matrix based on Table 5-1
Experiment Glass Material Normal load
(N) Feed
Rate(mm/min) Temperature
(˚C) Surface
Condition 1 Soda lime 100 0.1 Tg+20 Ground coated 2 Soda lime 100 0.1 Tg+50 Polished coated 3 Soda lime 120 1 Tg+20 Ground coated 4 Soda lime 120 1 Tg+50 Polished coated 5 Bk7 100 1 Tg+20 Polished coated 6 Bk7 100 1 Tg+50 Ground coated 7 Bk7 120 0.1 Tg+20 Polished coated 8 Bk7 120 0.1 Tg+50 Ground coated

71
Once the experimental design was finalized, the friction tests were carried out in
the absence of a clean room environment to assess how robust and feasible the process is.
The trial was carried out from the same piece of the molding material (WC) at different
surface conditions; ground, and polished. After each molding trial, the mold surfaces
were thoroughly cleaned by acetone. Also, the glass samples were cleaned using lint-free
optical wipes and reagent-grade acetone, ethanol, and isopropanol, respectively. These
solvents were used in order to dissolve any organic and inorganic contaminations that
might be adhering on the glass surface. Moreover, all eight experiments were conducted
using UHP nitrogen. Finally, the collected data is analyzed and the results obtained are
used to interpret the friction phenomenon of precision glass molding in next chapter.
As the experimental matrix shows, there are four combinations of feed rate and
temperature values which results in four different temperature and position profiles for
the tests. Each of these profiles is illustrated in Figures 5-25, 5-26, 5-27, and 5-28. Also,
the friction coefficient versus position curves for experiments number 1, 2, 3, 4, 5, 6, 7,
and 8 are shown in Figures 5-29, 5-30, 5-31, 5-32, 5-33, 5-34, 5-35, and 5-36,
respectively.

72
Figure 5-25: Temperature and position profile for experiments 1 and 7 in Table 5-2
Figure 5-26: Temperature and position profile for experiments 2 and 8 in Table 5-2

73
Figure 5-27: Temperature and position profile for experiments 3 and 5 in Table 5-2
Figure 5-28: Temperature and position profile for experiments 4 and 6 in Table 5-2

74
Figure 5-29: Friction coefficient versus position for experiment number 1
Figure 5-30: Friction coefficient versus position for experiment number 2

75
Figure 5-31: Friction coefficient versus position for experiment number 3
Figure 5-32: Friction coefficient versus position for experiment number 4
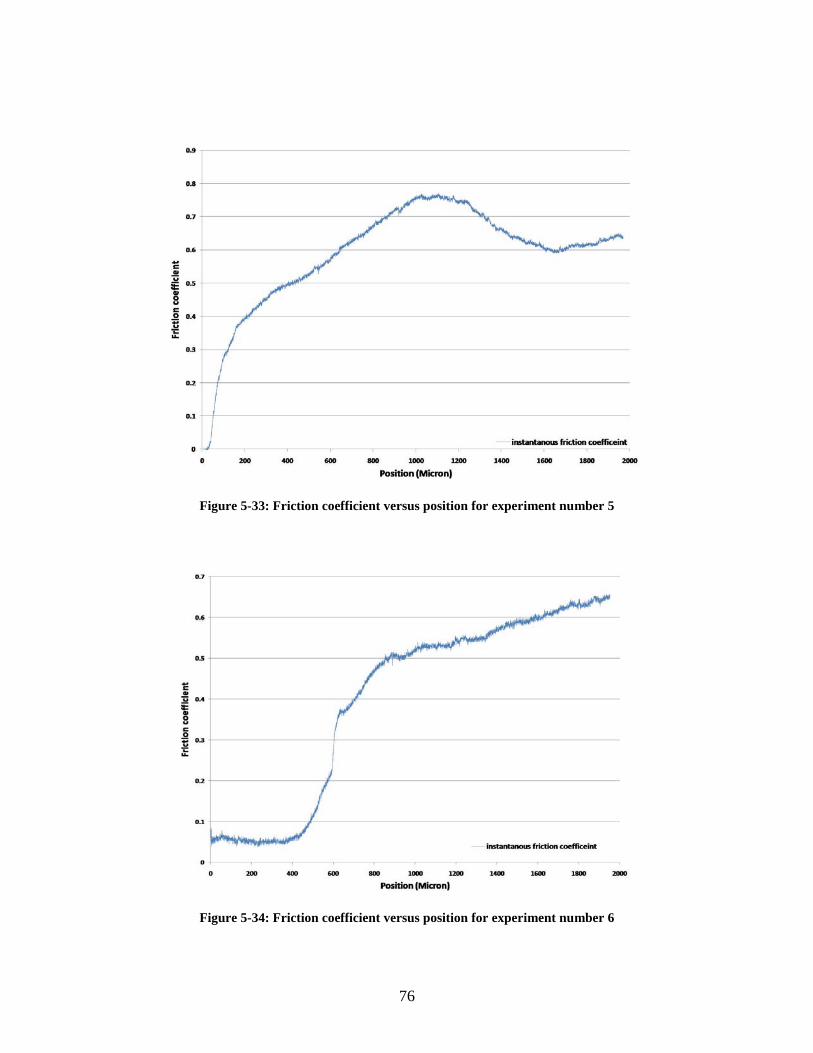
76
Figure 5-33: Friction coefficient versus position for experiment number 5
Figure 5-34: Friction coefficient versus position for experiment number 6

77
Figure 5-35: Friction coefficient versus position for experiment number 7
Figure 5-36: Friction coefficient versus position for experiment number 8

78
The experimental matrix includes four tests run at relatively slow feed rate and
therefore of relatively long duration, experiments 1, 2, 7, and 8. All of these tests show a
characteristic periodic fluctuation in the friction force data. These events are associated
with the on-off cycles of the inductive heating system as the temperature controller
attempts to regulate the temperature at the glass mold interface. When the inductive
heaters shut-off, the WC mold carrier cools rapidly and shrinks in length, causing the
force reading to drop rapidly. When the heaters turn on, the WC mold carrier rapidly
expands to its original length and the force returns to its previous level. In our analysis of
the data, we will ignore these force spikes since they are not associated with the friction
behavior of the material pair, but are caused by the operation of the temperature
controller.
For experiments 3, 4, 5, and 6, the feed rate is higher, resulting in tests of shorter
duration and no cycling of the inductive heaters. Therefore, these tests do not show any
periodic oscillation in the friction force data.
Stick-slip was not observed on any of these tests since the molds used for them
have high surface finish, mold coating to prevent chemical interaction between the glass
and mold surface, and are conducted in an atmosphere of UHP nitrogen.

79
CHAPTER SIX
OBSERVATION AND DISCUSSION 6.1 Introduction
The main objective of this research was to find the dynamic friction coefficient
between a polished and coated WC mold and two types of glasses under conditions
similar to the glass molding process. Moreover, finding the most significant factor in the
presence of the other factors on friction measurement was another goal of this study.
Two different glasses, BK7 and soda-lime silica glass, were used in this study.
These glasses have different viscosity behavior in the vicinity of their glass transition
temperature, as described in Section 4.1.1; and since the friction behavior is strongly
dependent on viscosity and consequently on temperature; the comparative methodology
can be used to discuss the effect of different parameters.
In the following sections, the effect of different process parameters on friction
coefficient for soda-lime glass is discussed. BK-7 is less suitable for understanding the
effect of process parameters as its viscosity is less sensitive to temperature change.
At the end of this chapter, friction coefficient data for BK7 under process
parameters similar to those used in glass molding are discussed, and the values are
reported that can be used for simulation of the PGM process.
6.2 The Effect of Temperature on Friction Coefficient for Soda-Lime Glass
The actual temperature profiles for the experiments show two different families of
curves. For long duration experiments the temperatures fluctuate more than short duration

80
experiments. Therefore, we will compare each family in its group, for example,
experiment number 1 with 2 and experiment number 3 with 4.
Comparing experiments 1 and 2 shows that increasing the temperature from
Tg+20 to Tg+50 has increased the friction coefficient from 0.8 to 1.2 for low feed rate
(long duration) tests. Also, when comparing experiments 3 and 4 (higher feed rate) the
friction coefficient increases from 1.4 to 1.8 with an increase in temperature. These
experiments show that increasing temperature in the vicinity of Tg causes the friction
coefficient to increase regardless of changes in other process parameters, meaning its
effect dominates the other process parameters.
Finally, comparing the friction coefficients between two different glasses (first
four experiments using soda lime and second four experiments using BK-7) reveals that
the friction coefficient for soda lime is higher than for BK-7. This rise in amplitude is in
good agreement with the results obtained in Section 5.5.5.
Any other process parameter that indirectly results in temperature change between
glass and mold at the interface also can change the local viscosity of the glass and
subsequently the frictional data. In the next section, the effect of mold surface roughness
and normal load in relation to temperature change in the interface is discussed.
6.3 The Effect of Normal Load and Surface Roughness on Friction Coefficient for
Soda-Lime
At room temperature, the friction coefficient is constant for a WC-soda lime
friction pair and doesn’t depend on applied load as described in Section 5.5.3. But at high
temperatures, increasing the normal load increases the real area of contact between the

81
hot mold and glass and consequently the gap conductivity increases, meaning that there
will be a better thermal path between mold and glass.
Comparing experiments 1 with 3 and 2 with 4 demonstrates that higher normal
load results in an increased friction coefficient because of higher thermal conductivity at
the interface. Here, the increased heat flow at the interface has decreased the viscosity of
soda lime glass and consequently raised the friction coefficient. So, any process
parameter that indirectly affects interface temperature may affect the viscosity and needs
to be considered. For example, increasing the surface roughness has the same effect,
meaning that higher surface finish can increase the interface temperature between glass
and mold and subsequently increase the friction coefficient.
6.4 The Effect of Feed Rate on Friction Coefficient
The maximum temperature on the body of the friction force transducer is not
more than 50ºC for long duration experiments since the high pressure nitrogen is
circulating during the tests. So, the structure of the machine doesn’t heat up too much and
consequently the structural stiffness of the measurement loop doesn’t change
significantly.
Comparing experiments 1 with 3, 2 with 4, 5 with 7, and 6 with 8 shows that at
high feed rates the friction coefficient rises more quickly with sliding distance than at
lower feed rates. It is believed that this is due to stress relaxation in the glass. The higher
feed rates provide less time for stress relaxation and the friction force rises rapidly.
Conversely, at lower feed rates there is more time for stress relaxation to occur in the
material and the friction force builds up more slowly. A simple calculation based on

82
𝜏 = 𝜂/𝐺 reveals that the stress relaxation time for both glasses at Tg+50 is around 1
second, and around 4 seconds for soda lime and 12 seconds for BK7 at Tg+20. In these
calculations, the shear modulus was assumed at room temperature based on data provided
by supplier (Table 4-2) which is not necessarily accurate at high temperatures. The
computation of the actual stress relaxation time is very difficult due to thermal gradients
in the glass which cause local variations in both viscosity and shear modulus.
The feed rates used in the experimental matrix (0.1 and 1 mm/min) are smaller
than the rates of typical PGM processes (2-4 mm/min). Nonetheless, we believe that a
feed rate of 1 mm/min is acceptable for friction measurement at higher temperatures. At
low temperatures, it is better to run the tests at lower feed rates to capture the effect of
stress relaxation in friction data.
6.5 The Friction Coefficient between Polished and Coated WC-BK7 Pair at
Conditions Similar to Glass Molding Process
Experiments 5 through 8 provide the friction coefficient data for BK-7 which is a
typical material used in the glass molding process. Specifically, experiments 5 and 7 use
process conditions similar to those used in the PGM process including molds that are
coated and polished.
The friction coefficient curve for experiment number 5 shows that it ramps up to
0.75 and then levels off around 0.6 while experiment number 7 also levels off at 0.6.
Comparing the results of experiment number 6 and 8 shows that the friction coefficient
between BK7 and ground coated WC mold is 0.6 and 0.7, respectively.

83
CHAPTER SEVEN
CONCLUSION
The PGM process for molding glasses requires high pressure contact between the
mold (metal) and the work piece (glass). During the molding process, the glass must
move along the mold surface, either by sliding or by shear flow. At very high
temperatures, the deformation very likely occurs primarily by sticking on the surface and
shear flow of the material. However, at temperatures nearer to Tg, sliding frictional
forces are generated at the interface between the glass/mold surfaces, and these forces
affect the final shape and internal stress distribution of the molded lens. Accurate
simulations of the PGM process require good models of the friction behavior at elevated
temperature. The lack of such data in the literature motivated the development of the
apparatus described here for experimental measurement of the friction behavior between
glasses and mold materials under conditions similar to those for the PGM process.
Validation of machine functionality was conducted at room temperature for a
steel-steel pair, where we found an average dynamic friction coefficient of 0.17. Using
process parameters similar to the PGM process (without having Ultra High Purity
nitrogen in the chamber), the experimentally reproducible static and dynamic friction
coefficient was measured for a steel-BK7 pair and steel-soda lime glass pair at 577˚C. In
both cases, stick-slip resulted in the dynamic friction coefficient fluctuating between 0.55
and 0.45 for BK7 and between 1.2 and 0.95 for soda lime glass. At temperatures above
the glass transition temperature, Tg, which is 557˚C for BK7 and 552ºC for soda lime, the

84
glass exhibits a viscoelastic response to applied loads while steel is in the elastic regime.
This glass viscoelasticity introduces a time dependent response to the dynamic friction
data; meaning that the stick-slip response depends on the viscoelastic properties of glass
at the test temperature.
Using high surface finish and coated WC molds and having Ultra High Purity
nitrogen in the chamber reduced the stick-slip phenomenon in dynamic friction
measurements.
An orthogonal array study, using an L8 array with five variables at two levels,
was conducted for WC molds and two oxide glasses (BK7 and soda-lime-silica glass) and
the important results from this study are as follows:
1- Increasing the temperature in the vicinity of Tg causes the friction coefficient to
increase regardless of changes in other process parameters, meaning its effect
dominates the other process parameters.
2- Higher normal load results in higher friction coefficient, presumably because of
higher thermal conductivity at the interface. Also, increasing the surface
roughness has the same effect, meaning that higher surface finish can increase the
interface temperature between glass and mold and subsequently increases the
friction coefficient.
3- Lower feed rate can give enough time for viscoelastic materials to respond to
shear forces, and consequently the measured friction force rises more slowly with
sliding distance.

85
4- Soda lime glass shows a higher friction coefficient in comparison to BK7 for the
same temperature profile because of its viscosity behavior.
As a result, the friction coefficient between mold and glass in the vicinity of its
transition temperature and in conditions similar to glass molding depends on temperature,
feed rate, normal force, and surface roughness. Among them, temperature has the most
significant effect since the glass viscosity is very sensitive to temperature.
The friction coefficient between a polished and coated WC mold and BK-7,
which is a typical material for glass molding, and in conditions similar to those used in
the PGM process ramps up to 0.7 and then levels off around 0.6.

86
CHAPTER EIGHT
FUTURE WORK
1- FEA can be used to simulate the friction between WC and glass at high temperature
using the viscoelastic model of a known glass (soda-lime-silica glass). The double-
sided friction test proposed in chapter 3 can be modeled by one of the friction models
developed in reference [33] and then implemented in ABAQUS. This software has
ability to model the glass viscoelastic properties at different temperatures. It is
important to consider the equivalent structural mass and stiffness of machine at
temperatures similar to real experiments and then matching the results of simulation
with experiment for a known material such as soda-lime-silica glass to find the
correct model of friction.
2- After finding the right friction model, sensitivity analysis with respect to material
properties (Maxwell elements constants) and process parameters (temperature,
normal force, strain rate) can be conducted to find the most important parameter
affecting friction.
3- Comparing Figures 5-11 and 5-21 shows that both glasses (BK7 and soda lime) have
different exponential stress relaxation response to same applied strain. These stress
relaxation data can be used to extract the shear viscoelastic properties of glass since a
thin layer of glass is under compression, meaning its bulk viscoelastic portion is
small.
4- Measuring gap conductivity between polished and coated WC mold and BK7 in
conditions similar to glass molding process.

87
REFERENCES
1. Shelby, J.E., Introduction to Glass Science and Technology. 2nd ed. 1997: The Royal Society of Chemistry.
2. Serope Kalpakjian, S.R.S., Manufacturing processes for engineering materilas. Fourth ed. 2002: Pearson Education Inc.
3. Allen Y. Yi, A.J., Compression Molding of Aspherical Glass Lenses-A Combined Experimental and Numerical Analysis. Journal of the American Ceramic Society, 2005. 88(3): p. 579-586.
4. Anurag Jain, A.Y.Y., Numerical Modeling of Viscoelastic Stress Relaxation During Glass Lens Forming Process. Journal of the American Ceramic Society, 2005. 88(3): p. 530-535.
5. Sellier, M., et al., An iterative algorithm for optimal mould design in high-precision compression moulding. Proceedings of the Institution of Mechanical Engineers, Part B: Journal of Engineering Manufacture, 2007. 221(1): p. 25-33.
6. Klocke, F., et al., Finite element analysis of glass moulding. Proceedings of the Institution of Mechanical Engineers, Part B: Journal of Engineering Manufacture, 2008. 222(1): p. 101-106.
7. AT Male, V.D., The validity of mathematical solutions for determining friction from the ring compression test. ASME J. Lubr. Technol., 1970. 96: p. 482-488.
8. Sofuoglu, H., H. Gedikli, and J. Rasty, Determination of friction coefficient by employing the ring compression test. Journal of Engineering Materials and Technology, Transactions of the ASME, 2001. 123(3): p. 338-348.
9. Pawelski, O., W. Rasp, and C. Hoerster, Ring compression test as simulation test for the investigation of friction in hot metal forming. Steel Research, 1989. 60(9): p. 395-402.
10. Wang, F. and J.G. Lenard, An Experimental Study of Interfacial Friction-Hot Ring Compression. Journal of Engineering Materials and Technology, 1992. 114(1): p. 13-18.
11. Trier W., H.F., Mechanik des Gleitens heiben, zahflussigen Glases auf Metalloberflachen. Glastechnische Berichte, 1972. 45(6): p. 271-276.
12. Trier W., Gleitverhalten von heiben, zahflussigen Glas auf Metalloberflachen. Glastechnische Berichte, 1978,. 51(9): p. 240-243.
13. Falipou, M., F. Sicloroff, and C. Donnet, New method for measuring the friction between hot viscous glass and metals. Glass Science and Technology, 1999. 72(3): p. 59-66.
14. Worgull M, H.J.F., Kabanemi K.K., Heckele M. Characterization of Friction during the Demolding of Microstructures Molded by Hot Embossing. in DTIP conference. 2006. Stresa, Italy.
15. Worgull M, K.K.K., Marcotte J.P., Hetu J.F, Heckele M. Modeling of Large Area Hot Embossing. in DTIP conference. 2007. Stresa, Italy.
16. Li, L.X., et al., Experimental study of the lubrication behavior of A5 glass lubricant by means of the ring compression test. Journal of Materials Processing Technology, 2000. 102(1-3): p. 138-142.

88
17. Anurag Jain, A.Y.Y., Experimental study and numerical analysis of compression molding process for manufacturing precision aspherical glass lenses, in School of The Ohio State University. 2006.
18. Anurag Jain, G.C.F.A.Y.Y., Viscosity Measurement by Cylindrical Compression for Numerical Modeling of Precision Lens Molding Process. Journal of the American Ceramic Society, 2005. 88(9): p. 2409-2414.
19. Http://www.nanotechsys.com/. 20. Sperling, L.H., Introduction to physical polymer science, ed. T. edition. 2001:
John Wiley & Sons Inc. 21. Moynihan, C.T., J. Am. Ceram. Soc., 1993. 76: p. 1081. 22. Fulcher, G.S., J. Am. Ceram. Soc., 1925. 8(339). 23. Willian N. Findley, J.S.L., Kasif Onaran, Creep and relaxtaion of nonlinear
viscoelastic materials with an introduction to linear viscoelasticity. 1976, Amesterdam: North-Holland publishing Company.
24. Rekhson, S.M. Linear and non-linear viscoelasticity of glass. 1980. Los Angeles, CA, USA.
25. Duffrene, L., et al., Generalized Maxwell model for the viscoelastic behavior of a soda-lime-silica glass under low frequency shear loading. Rheologica Acta, 1997. 36(2): p. 173-86.
26. Scherer, G.W., Relaxation in Glass and composites. 1992: Krieger Publishing Company.
27. F. Klocke, T.B., K. Georgiadis, H. Sarikaya, F. Wang. Coating systems for precision glass molding tools. in proceeding of the 7th "THE" coatings in manufacturing engineering. 2008. Greece.
28. The science behind material properties. 2005. 29. Feeny, B., et al., Historical review on dry friction and stick-slip phenomena.
Applied Mechanics Reviews, 1998. 51(5): p. 321-341. 30. Schmitz, T.L., et al., The difficulty of measuring low friction: uncertainty analysis
for friction coefficient measurements. Transactions of the ASME. Journal of Tribology, 2005. 127(3): p. 673-8.
31. Grigoriev, I.S., E.Z. Meilikhov, and A.A. Radzig, Handbook of Physical Quantities 1997, USA: CRC Press LLC.
32. Rangnatha, S., et al., Role of temperature on sliding response of aluminum on steel of a hot extrusion. Materials and Manufacturing Processes, 2008. 23(1-2): p. 29-36.
33. Persson, B.N.J., sliding friction: physical principles and applications. 1998: Springer.
34. T. Baumberger, F.H., B. Perrin, Crossover from creep to inertial motion in friction dynamics. NATURE, 1994. 367(10 FEBRAURY): p. 544-546.
35. G. Taguchi, S.C., Y. Wu, Taguchi's quality Engineering Handbook. 2004: John Wiley & Sons, Inc.