from agri to brand-led - asx · 3 twe’s journey from agri to brand-led key takeaways from today 1...
TRANSCRIPT
1
FROM AGRI TO BRAND-LEDTWE’s Inaugural Investor Day, 2017
For
per
sona
l use
onl
y

2
From Agricultural to Brand-ledMichael Clarke – Chief Executive Officer
For
per
sona
l use
onl
y

3
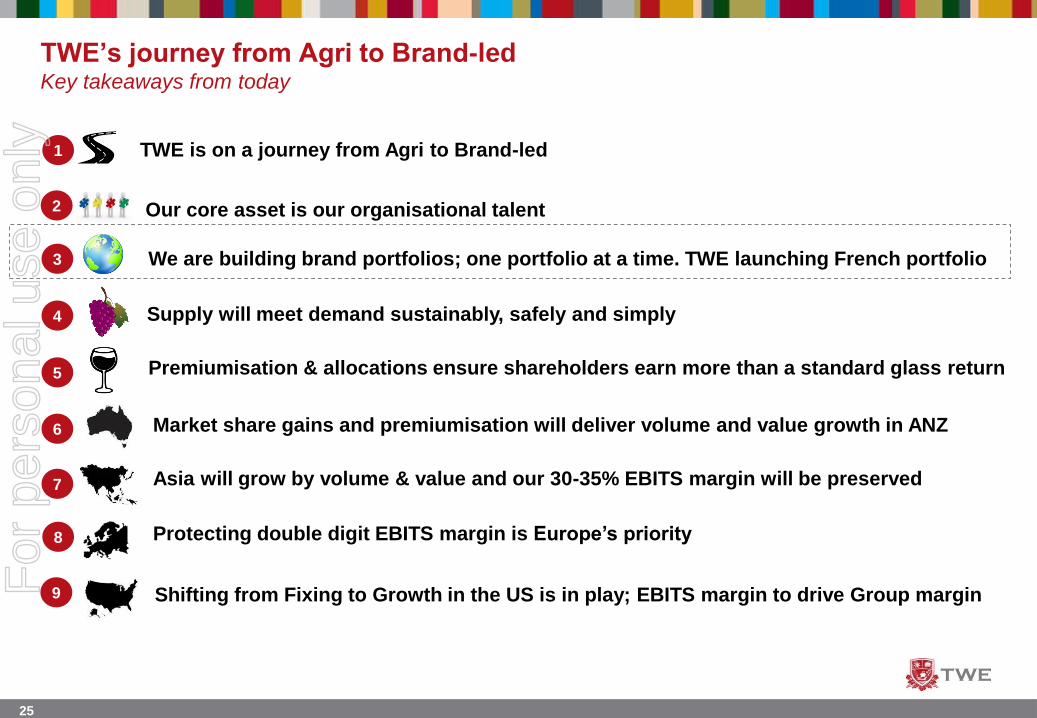
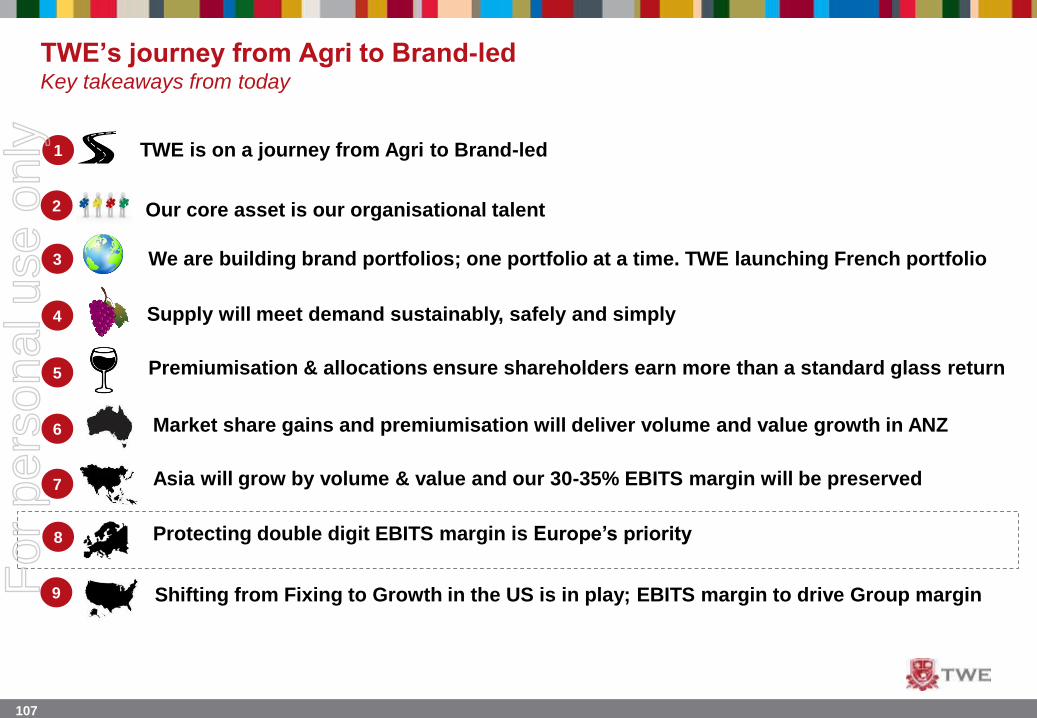
TWE’s journey from Agri to Brand-ledKey takeaways from today
1
2 Our core asset is our organisational talent
3
4
5 Premiumisation & allocations ensure shareholders earn more than a standard glass return
6 Market share gains and premiumisation will deliver volume and value growth in ANZ
7
9
8 Protecting double digit EBITS margin is Europe’s priority
TWE is on a journey from Agri to Brand-led
We are building brand portfolios; one portfolio at a time. TWE launching French portfolio
Supply will meet demand sustainably, safely and simply
Asia will grow by volume & value and our 30-35% EBITS margin will be preserved
Shifting from Fixing to Growth in the US is in play; EBITS margin to drive Group marginFor
per
sona
l use
onl
y

4
TWE’s journey from Agri to Brand-ledTWE’s strategic framework
Focus on top
priorities and deliver
against them
Instil belief in our
wines, our company
and our people
Build trust by acting
with integrity and holding
ourselves to account
Collaborate with all
stakeholders to achieve
shared goals
To move from an order-taking agricultural business to a brand-led organisation
To be the world’s most celebrated wine company
Transform our
portfolio
• Grow Priority
Brands, one portfolio
at a time
• Support our
Regional Brands
• Premiumise our
portfolio
• Invest to drive
consumer pull
• Deliver bigger,
better campaigns
Win in priority
markets
• Grow share in Asia
through RTM and
portfolio expansion
• Grow in US through
premiumisation
• Strengthen no.1
position in Australia
through category
leadership
• Protect profitability in
other key markets
• Drive an inclusive,
supportive and
collaborative culture
• Grow capability now
and for the future
• Operate an efficient
and sustainable
structure
Build a high
performing
organisation
• Connect and engage
with consumers
• Partner with key
customers to grow
wine category
• Drive performance
for all stakeholders
Develop
long-term
relationships
Optimise our
capital base
• Operate sustainably,
safely and
responsibly
• Create supply chain
cost and quality
advantage
• Address high cost
structures in mature
markets
• Simplify processes
For
per
sona
l use
onl
y

5
1H14 1H17
NSR per case $53.20 $69.10
EBITS $46m $227m
EBITS margin 5.6% 17.5%
Cash conversion 25% 104%
ROCE1 5.8% 11.7%
TSR1,2 5.6% 31.2%
LOW A&P SPEND
TWE’s journey from Agri to Brand-ledOur journey and achievements to date
FROM:
Order-taking, agricultural model
TO:
Brand-led with sustainable and balanced delivery
SHORT TERM SHIPMENT FOCUS
AGRICULTURAL
I N E F F I C I E N T
UNSUSTAINABLE H I G H - C O S T
COMPLEX SUPPLY CHAIN
INNOVATION
DEPLETIONS
QUALITY
S U S T A I N A B I L I T Y
PREMIUMISATIONOPTIMISATIONM O M E N T U M
BALANCE
STRATEGIC
PARTNERSHIPSPROFITABILITY
CAPITAL EFFICIENT
MULTI-REGION SOURCING
DISCIPLINE
FIXINGHIGH PERFORMANCE CULTURE
BRAND BUILDING
1. Expressed as annualised metric
2. Total Shareholder Return (TSR) calculated using Bloomberg. Bloomberg methodology assumes dividends are reinvested into the purchase of additional
securities on each dividend date
For
per
sona
l use
onl
y

6
TWE’s three-phased journey from Agri to Brand-ledPositioning all four regions for sustainable growth
People Brands
Partners Model
ANZ
Growing sustainable share in
a mature market
Phase 1: Fixing
Phase 2:
Growing
Phase 3:
Accelerating
Asia
#1 imported wine business in
Asia by volume and value
Europe
An optimised business delivering
double digit EBITS margin
Brands
Partners Model
People Brands
Partners Model
People
Americas
From fixing to growth
People Brands
Partners Model
For
per
sona
l use
onl
y
7
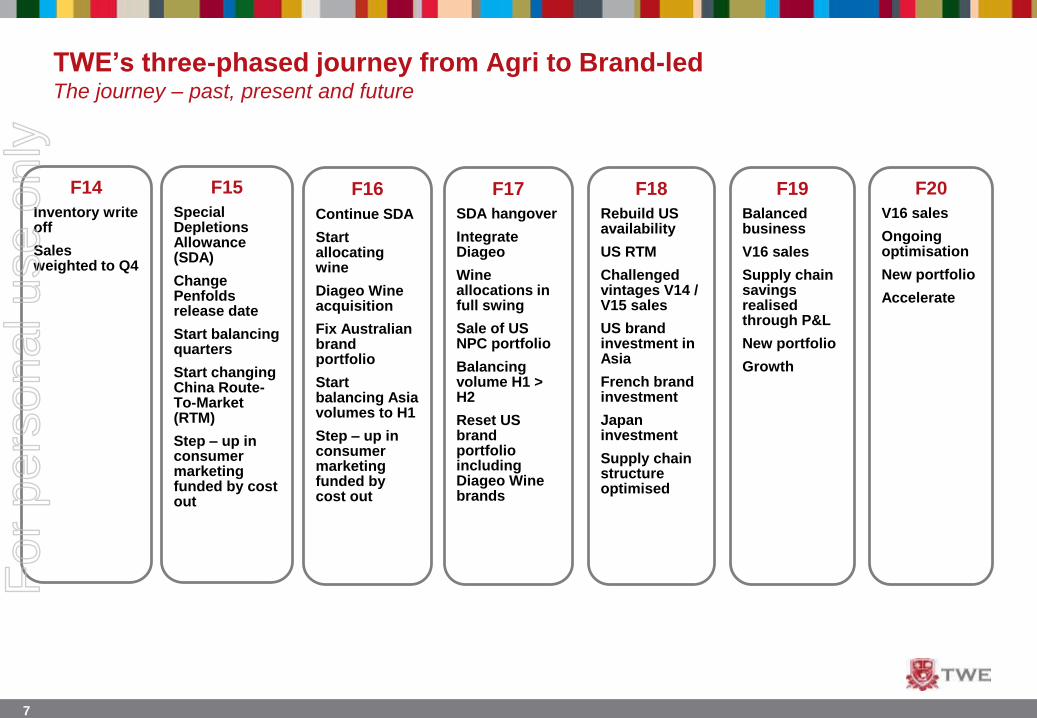
TWE’s three-phased journey from Agri to Brand-ledThe journey – past, present and future
F14
Inventory write off
Sales weighted to Q4
F15
Special Depletions Allowance (SDA)
Change Penfolds release date
Start balancing quarters
Start changing China Route-To-Market (RTM)
Step – up in consumer marketing funded by cost out
F16
Continue SDA
Start allocating wine
Diageo Wine acquisition
Fix Australian brand portfolio
Start balancing Asia volumes to H1
Step – up in consumer marketing funded by cost out
F17
SDA hangover
Integrate Diageo
Wine allocations in full swing
Sale of US NPC portfolio
Balancing volume H1 > H2
Reset US brand portfolio including Diageo Wine brands
F18
Rebuild US availability
US RTM
Challenged vintages V14 / V15 sales
US brand investment in Asia
French brand investment
Japan investment
Supply chain structure optimised
F19
Balanced business
V16 sales
Supply chain savings realised through P&L
New portfolio
Growth
F20
V16 sales
Ongoing optimisation
New portfolio
Accelerate
For
per
sona
l use
onl
y

8
TWE’s journey from Agri to Brand-ledKey takeaways from today
1
2 Our core asset is our organisational talent
3
4
5 Premiumisation & allocations ensure shareholders earn more than a standard glass return
6 Market share gains and premiumisation will deliver volume and value growth in ANZ
7
9
8 Protecting double digit EBITS margin is Europe’s priority
TWE is on a journey from Agri to Brand-led
We are building brand portfolios; one portfolio at a time. TWE launching French portfolio
Supply will meet demand sustainably, safely and simply
Asia will grow by volume & value and our 30-35% EBITS margin will be preserved
Shifting from Fixing to Growth in the US is in play; EBITS margin to drive Group marginFor
per
sona
l use
onl
y

9
From Bud to FruitMegan Collins – Chief People & Communications
Officer
For
per
sona
l use
onl
y

10
From bud to fruitSelecting the right bottle of wine
Varietal
Price
Awards & ScoresPackaging
PromotionCountry of Origin
Red Shiraz Pinot
NoirCabernet
Sauvignon R e d B l e n d
Merlot Syrah
RoseChardonnay
S
P
A
R
K
L
I
N
G
Sauvignon Blanc
Pin
ot G
ris
Riesling
PINOT
GRIGIO
Moscato
WHITE
‘World’s most
admired wine
brand’
- Drinks
International
(UK) March 16
‘Red Winemaker of
the Year’
- International Wine
Competition
‘Best New Wine 2015’
- Market Watch
New World
Old World
Buy 6
bottles @....
Price promotion
to
Price = Quality
Price reduced from…
For
per
sona
l use
onl
y

11
From bud to fruitTerroir
Soil
Terrain
Climate
For
per
sona
l use
onl
y

12
From bud to fruitTWE’s terroir in 2013
For
per
sona
l use
onl
y
13
For
per
sona
l use
onl
y
14
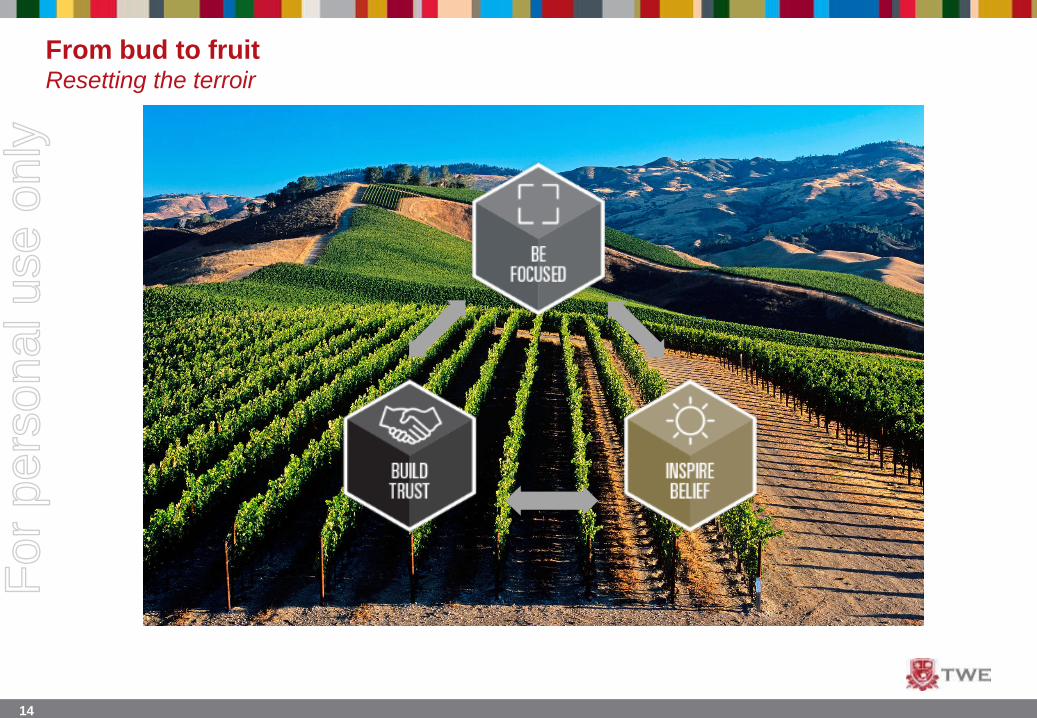
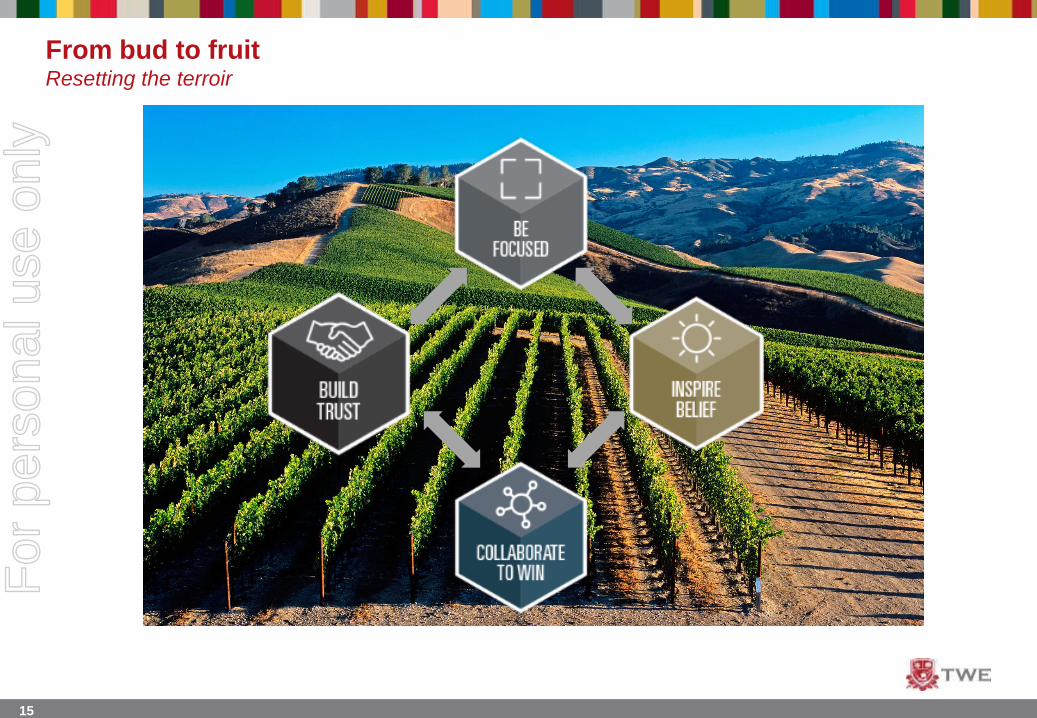
From bud to fruitResetting the terroir
For
per
sona
l use
onl
y
15
From bud to fruitResetting the terroir
For
per
sona
l use
onl
y
16
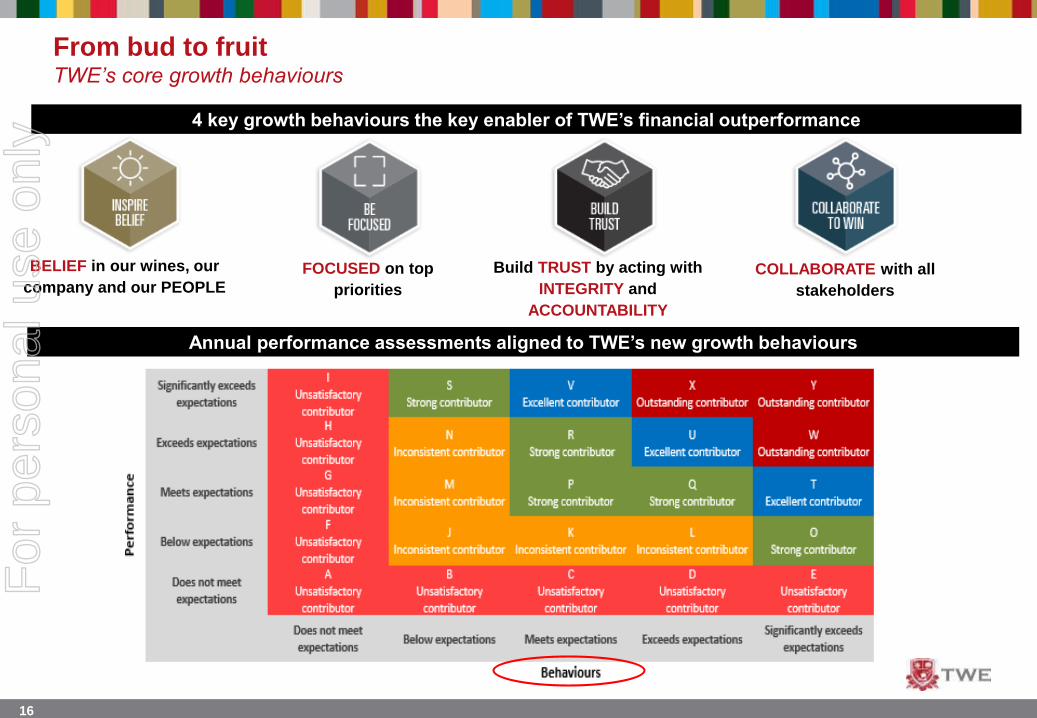
From bud to fruitTWE’s core growth behaviours
FOCUSED on top
priorities
COLLABORATE with all
stakeholders
BELIEF in our wines, our
company and our PEOPLE
Build TRUST by acting with
INTEGRITY and
ACCOUNTABILITY
4 key growth behaviours the key enabler of TWE’s financial outperformance
Annual performance assessments aligned to TWE’s new growth behaviours
For
per
sona
l use
onl
y
17
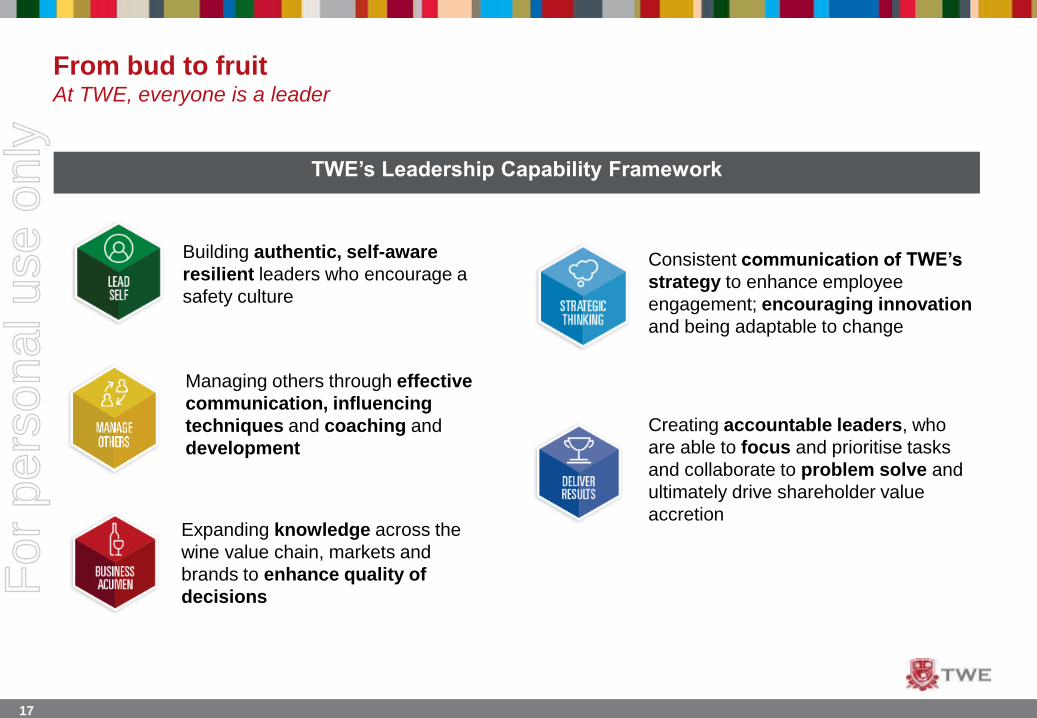
From bud to fruitAt TWE, everyone is a leader
TWE’s Leadership Capability Framework
Building authentic, self-aware
resilient leaders who encourage a
safety culture
Managing others through effective
communication, influencing
techniques and coaching and
development
Expanding knowledge across the
wine value chain, markets and
brands to enhance quality of
decisions
Consistent communication of TWE’s
strategy to enhance employee
engagement; encouraging innovation
and being adaptable to change
Creating accountable leaders, who
are able to focus and prioritise tasks
and collaborate to problem solve and
ultimately drive shareholder value
accretion
For
per
sona
l use
onl
y
18
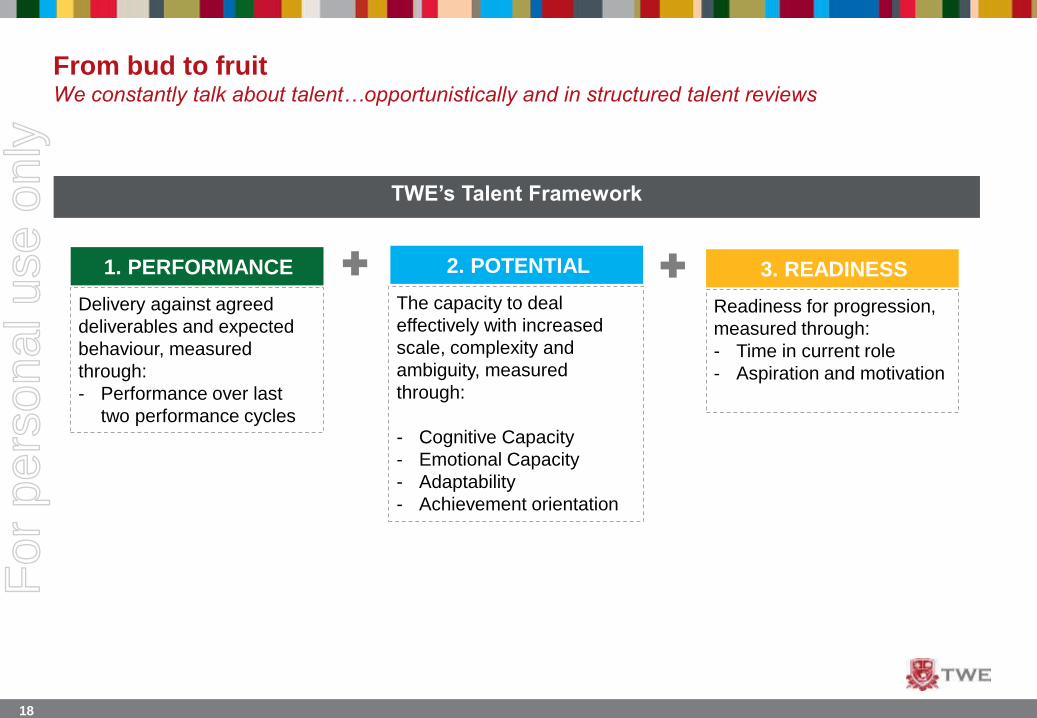
1. PERFORMANCE 2. POTENTIAL 3. READINESS
Delivery against agreed
deliverables and expected
behaviour, measured
through:
- Performance over last
two performance cycles
The capacity to deal
effectively with increased
scale, complexity and
ambiguity, measured
through:
- Cognitive Capacity
- Emotional Capacity
- Adaptability
- Achievement orientation
Readiness for progression,
measured through:
- Time in current role
- Aspiration and motivation
From bud to fruitWe constantly talk about talent…opportunistically and in structured talent reviews
TWE’s Talent Framework
For
per
sona
l use
onl
y

19
From bud to fruitBuy, develop and re-build our capability
Develop … build capability for the future
Buy … de-risk the business
Rebuild … define the new normalFor
per
sona
l use
onl
y

20
Annual business performance
aligned with employee reward…
Long term business performance
aligns employees’ financial interests
with the financial interests of
shareholders …
HIGHEST REWARDS FOR OUTPERFORMERS SHARE THE SUCCESS
Short Term Incentive Plan
(STIP)
Senior Managers
Sales Incentive Plan Salesforce
High Performance Plan (HiPP) Other high performers
Long Term Incentive Plan
(LTIP)
Executives
Restricted Equity Plan (REP) Key Talent
General Employee Share
Plan
All employees
From bud to fruitRewarding, retaining and attracting outperformers
For
per
sona
l use
onl
y

21
LEADERSHIP & PERSONAL DEVELOPMENT
Building Business
Acumen® (BBA)
FUNCTIONAL CAPABILITY
PROGRAMS
Commercial
Partnering
14
From bud to fruitActive investment in growing employee capability, now and for the future
For
per
sona
l use
onl
y

22
Focus on top
priorities and deliver
against them
Instil belief in our
wines, our company
and our people
Build trust by acting
with integrity and holding
ourselves to account
Collaborate with all
stakeholders to achieve
shared goals
To move from an order-taking agricultural business to a brand-led marketing organisation
To be the world’s most celebrated wine company
13
From bud to fruitOur focus and investment in People – an enabler of our results
• Drive an inclusive,
supportive and
collaborative culture
• Grow capability now
and for the future
• Operate an efficient
and sustainable
structure
Build a high
performing
organisation
Transform
our portfolio
• Grow Priority
Brands, one
portfolio at a time
• Support our
Regional Brands
• Premiumise our
portfolio
• Invest to drive
consumer pull
• Deliver bigger,
better campaigns
Win in priority
markets
• Grow share in Asia
through RTM and
portfolio expansion
• Grow in US through
premiumisation
• Strengthen no.1
position in Australia
through category
leadership
• Protect profitability in
other key markets
• Connect and
engage with
consumers
• Partner with key
customers to grow
wine category
• Drive performance
for all stakeholders
Develop
long-term
relationships
Optimise our
capital base
• Operate
sustainably, safely
and responsibly
• Create supply chain
cost and quality
advantage
• Address high cost
structures in mature
markets
• Simplify processes
For
per
sona
l use
onl
y
23
For
per
sona
l use
onl
y

24
QUESTIONS
For
per
sona
l use
onl
y
25
TWE’s journey from Agri to Brand-ledKey takeaways from today
1
2 Our core asset is our organisational talent
3
4
5 Premiumisation & allocations ensure shareholders earn more than a standard glass return
6 Market share gains and premiumisation will deliver volume and value growth in ANZ
7
9
8 Protecting double digit EBITS margin is Europe’s priority
TWE is on a journey from Agri to Brand-led
We are building brand portfolios; one portfolio at a time. TWE launching French portfolio
Supply will meet demand sustainably, safely and simply
Asia will grow by volume & value and our 30-35% EBITS margin will be preserved
Shifting from Fixing to Growth in the US is in play; EBITS margin to drive Group marginFor
per
sona
l use
onl
y
26
Rebuilding TWE; One Portfolio at a
TimeSimon Marton – Chief Marketing Officer
For
per
sona
l use
onl
y

27
Wine is growing share of total alcohol globally1
11.82016
26.8
2016
Litres per
capita2
Litres per
capita2 2.1
2016
Litres per
capita2
1. Trend data per Euromonitor InternationaslAlcoholic Drinks Overview by Market, September 2015, Value data per Euromonitor International, 2014
2. Euromonitor International 2016, Still Light Grape Wine, Litres per capita at legal purchasing age
For
per
sona
l use
onl
y

28
When we began our Journey 3 years ago, we were focusing on too many brands
For
per
sona
l use
onl
y

29
We have moved to a focused portfolio of 15 priority brands to maximise global growth
Luxury
Centre of
Gravity
Masstige
Centre of
Gravity
Commercial
Centre of
GravityFor
per
sona
l use
onl
y

30
BRAND GROUPS POWER BRANDS PRIORITY BRANDS LUXURY GEMS
BRANDS
INVESTMENT
TACTICS
Deliver 360° investment plans,
increasing consumer A&P
Invest in outstanding packaging,
merchandising and in-store/trade support
Take a portfolio approach. Focus on PR
and 90+ platform to leverage scores/
awards
With clear segmentation and associated investment tactics
For
per
sona
l use
onl
y
31
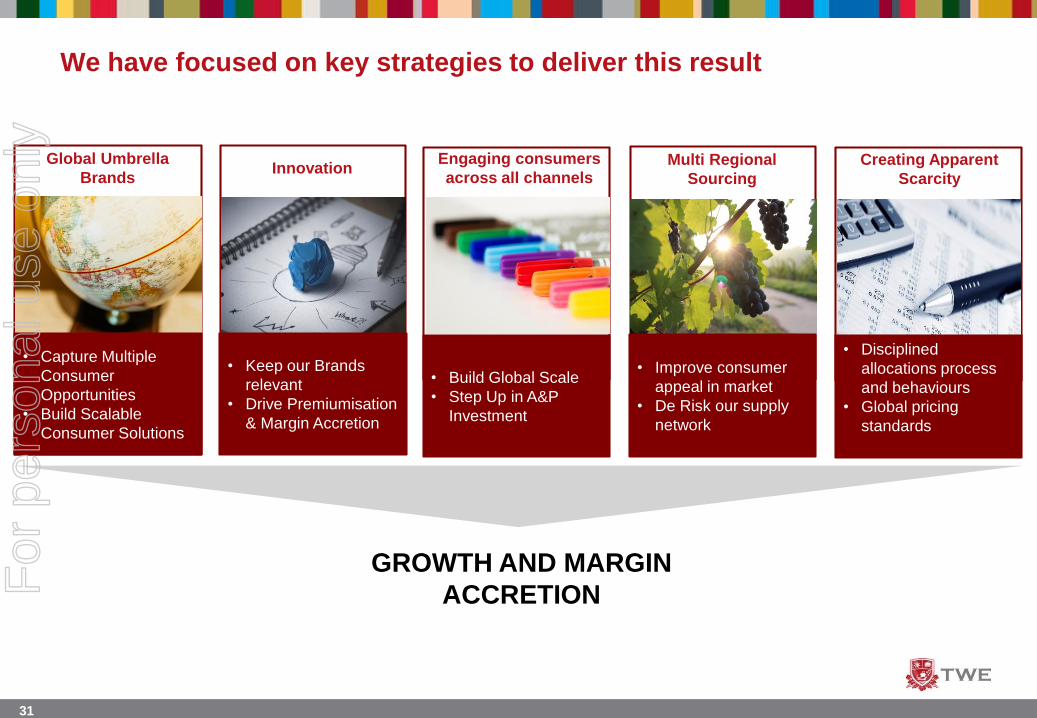
We have focused on key strategies to deliver this result
GROWTH AND MARGIN
ACCRETION
Engaging consumers
across all channels
Global Umbrella
BrandsInnovation
Creating Apparent
Scarcity
Multi Regional
Sourcing
• Capture Multiple
Consumer
Opportunities
• Build Scalable
Consumer Solutions
• Keep our Brands
relevant
• Drive Premiumisation
& Margin Accretion
• Build Global Scale
• Step Up in A&P
Investment
• Improve consumer
appeal in market
• De Risk our supply
network
• Disciplined
allocations process
and behaviours
• Global pricing
standards
For
per
sona
l use
onl
y
32
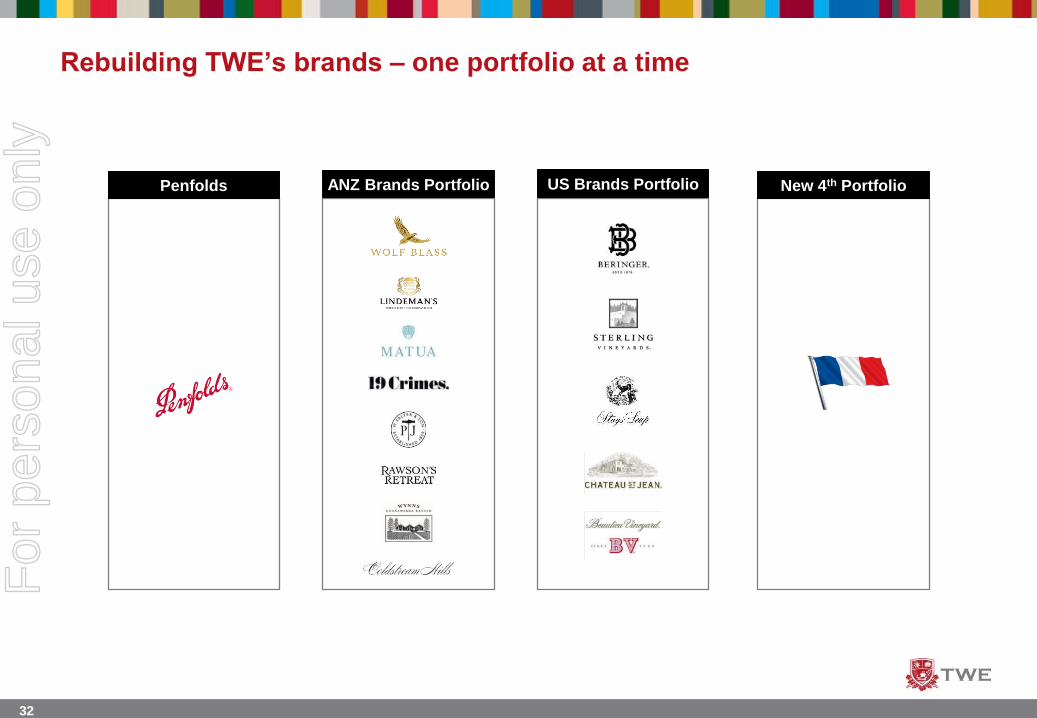
Rebuilding TWE’s brands – one portfolio at a time
Penfolds ANZ Brands Portfolio US Brands Portfolio New 4th Portfolio
For
per
sona
l use
onl
y

33
Rebuilding TWE’s brands – Penfolds
Brand potential limited
• Limited by Mar/May release
• Selling everything in Q4 every year with nothing held
back for future
• Poor pricing behaviours
• Heavy reliance on few countries
• Asia not being realised
• Under investment in recruitment of new consumers
For
per
sona
l use
onl
y
34
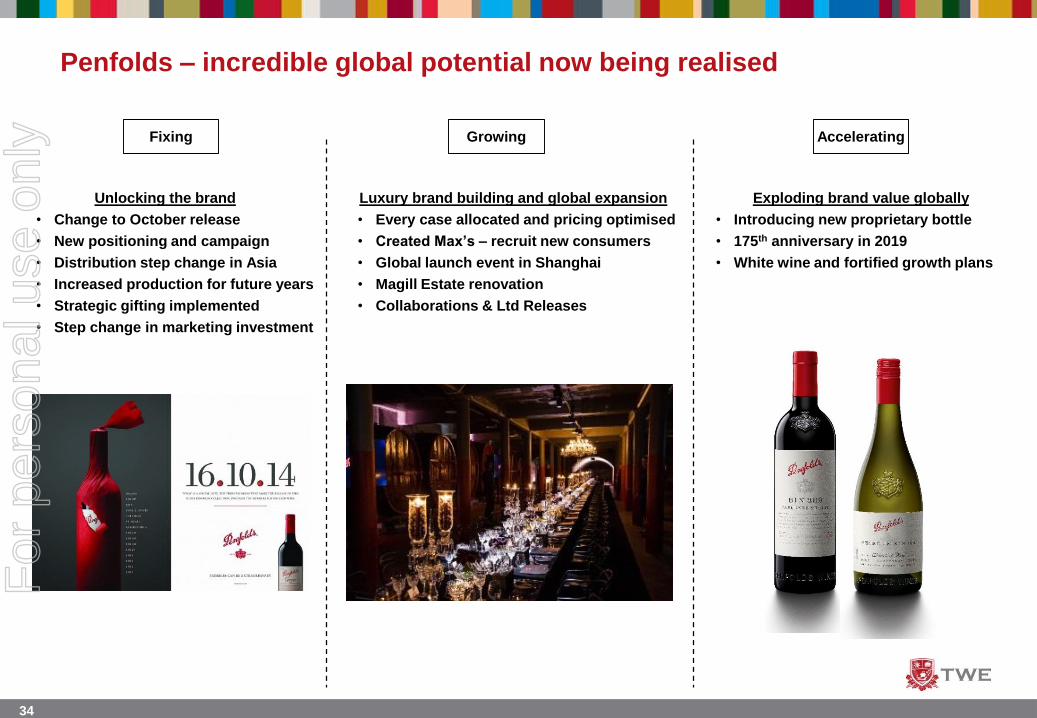
Penfolds – incredible global potential now being realised
Fixing Growing Accelerating
Unlocking the brand
• Change to October release
• New positioning and campaign
• Distribution step change in Asia
• Increased production for future years
• Strategic gifting implemented
• Step change in marketing investment
Exploding brand value globally
• Introducing new proprietary bottle
• 175th anniversary in 2019
• White wine and fortified growth plans
Luxury brand building and global expansion
• Every case allocated and pricing optimised
• Created Max’s – recruit new consumers
• Global launch event in Shanghai
• Magill Estate renovation
• Collaborations & Ltd Releases
For
per
sona
l use
onl
y
35
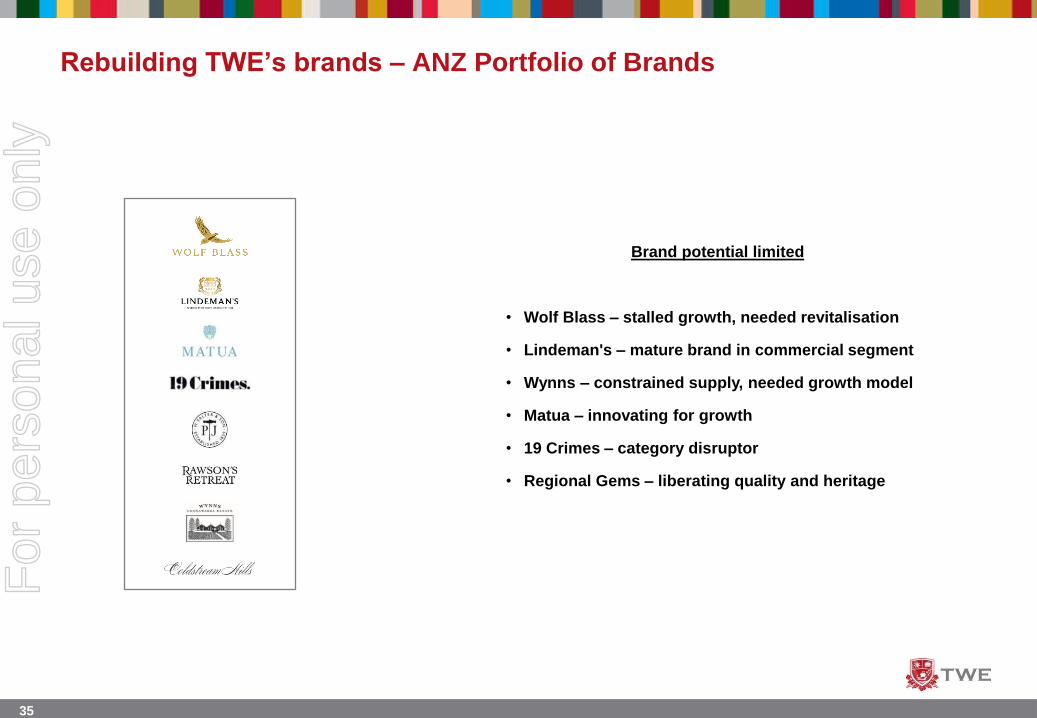
Rebuilding TWE’s brands – ANZ Portfolio of Brands
Brand potential limited
• Wolf Blass – stalled growth, needed revitalisation
• Lindeman's – mature brand in commercial segment
• Wynns – constrained supply, needed growth model
• Matua – innovating for growth
• 19 Crimes – category disruptor
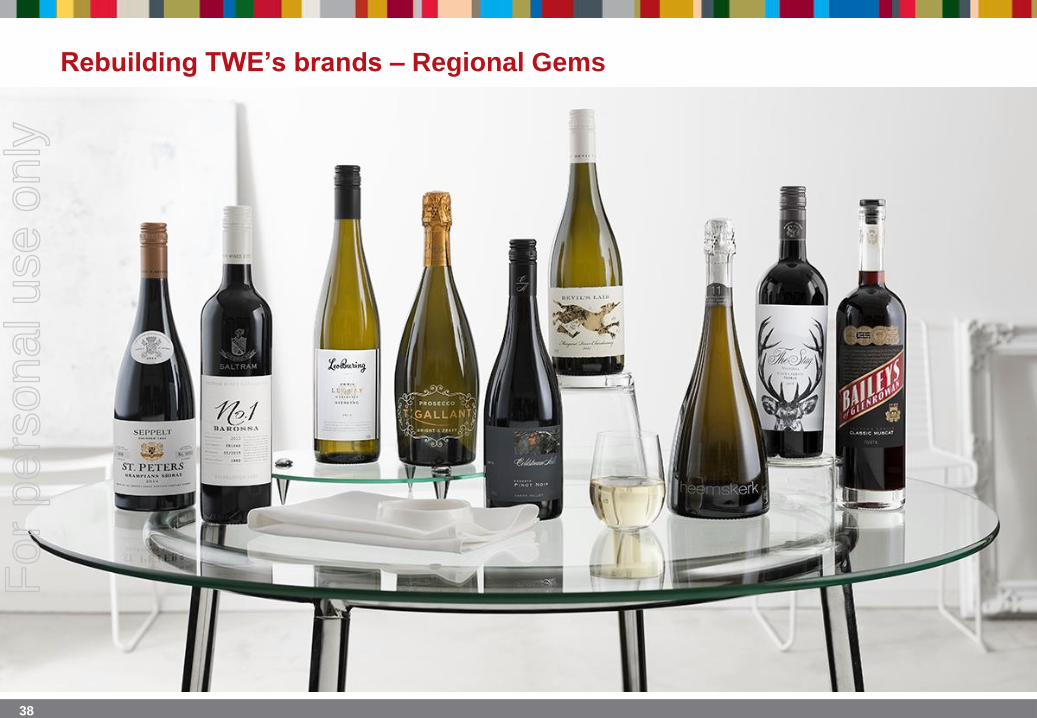
• Regional Gems – liberating quality and heritage
For
per
sona
l use
onl
y
36
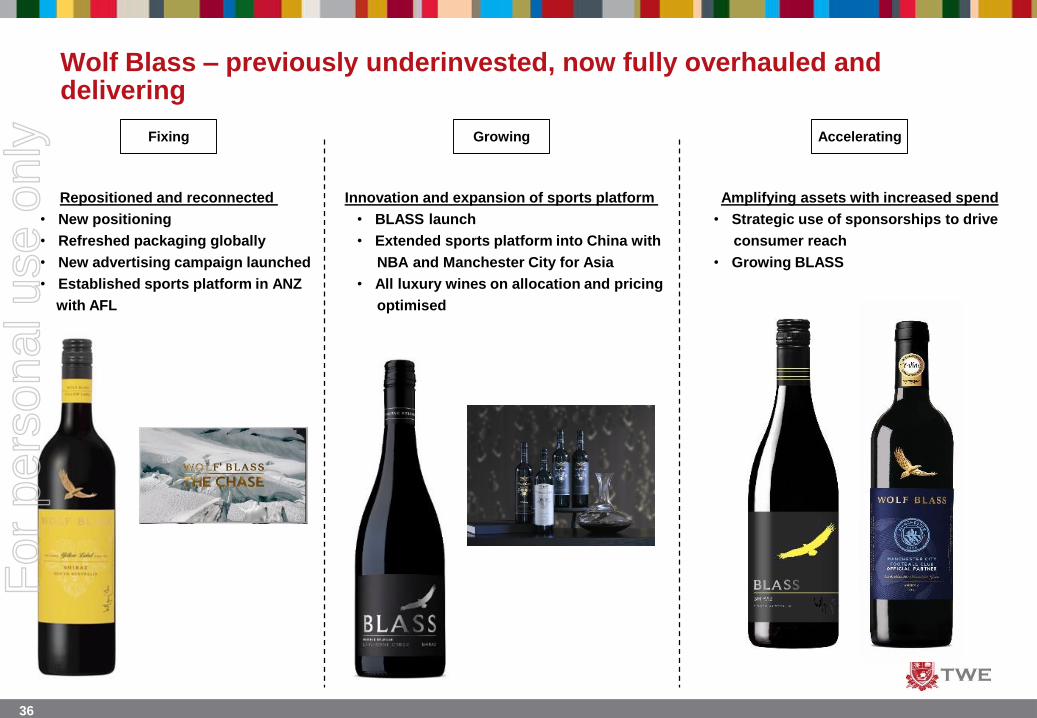
Wolf Blass – previously underinvested, now fully overhauled and delivering
Fixing Growing Accelerating
Repositioned and reconnected
• New positioning
• Refreshed packaging globally
• New advertising campaign launched
• Established sports platform in ANZ
with AFL
Amplifying assets with increased spend
• Strategic use of sponsorships to drive
consumer reach
• Growing BLASS
Innovation and expansion of sports platform
• BLASS launch
• Extended sports platform into China with
NBA and Manchester City for Asia
• All luxury wines on allocation and pricing
optimised
For
per
sona
l use
onl
y
37
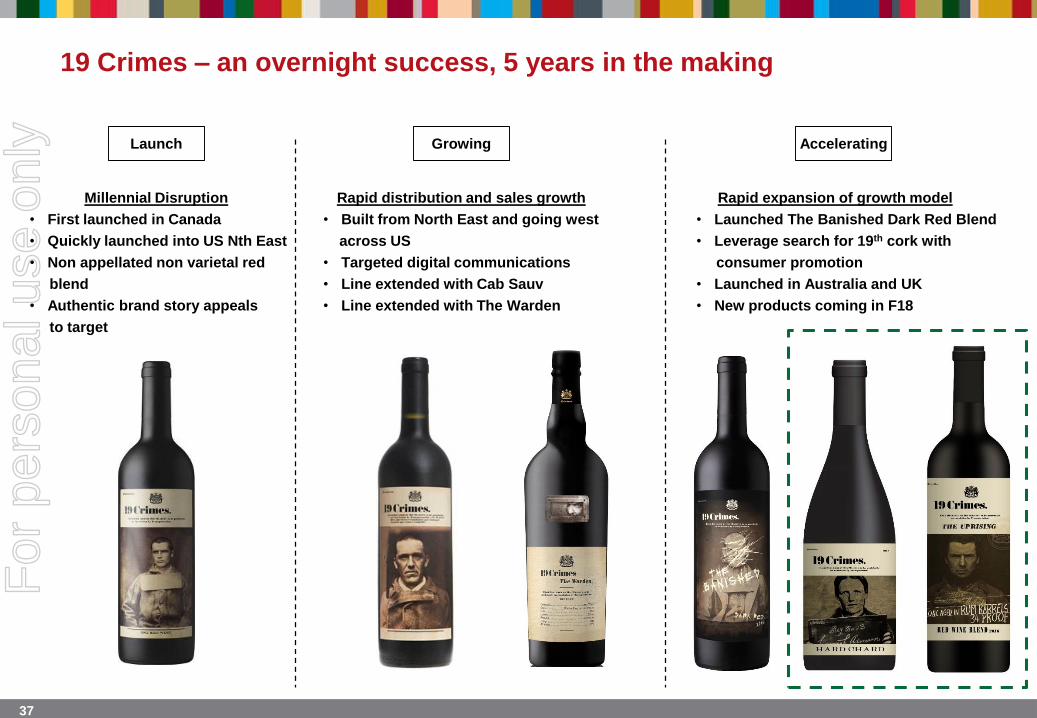
19 Crimes – an overnight success, 5 years in the making
Launch Growing Accelerating
Millennial Disruption
• First launched in Canada
• Quickly launched into US Nth East
• Non appellated non varietal red
blend
• Authentic brand story appeals
to target
Rapid expansion of growth model
• Launched The Banished Dark Red Blend
• Leverage search for 19th cork with
consumer promotion
• Launched in Australia and UK
• New products coming in F18
Rapid distribution and sales growth
• Built from North East and going west
across US
• Targeted digital communications
• Line extended with Cab Sauv
• Line extended with The Warden
For
per
sona
l use
onl
y
38
Rebuilding TWE’s brands – Regional Gems
For
per
sona
l use
onl
y
39
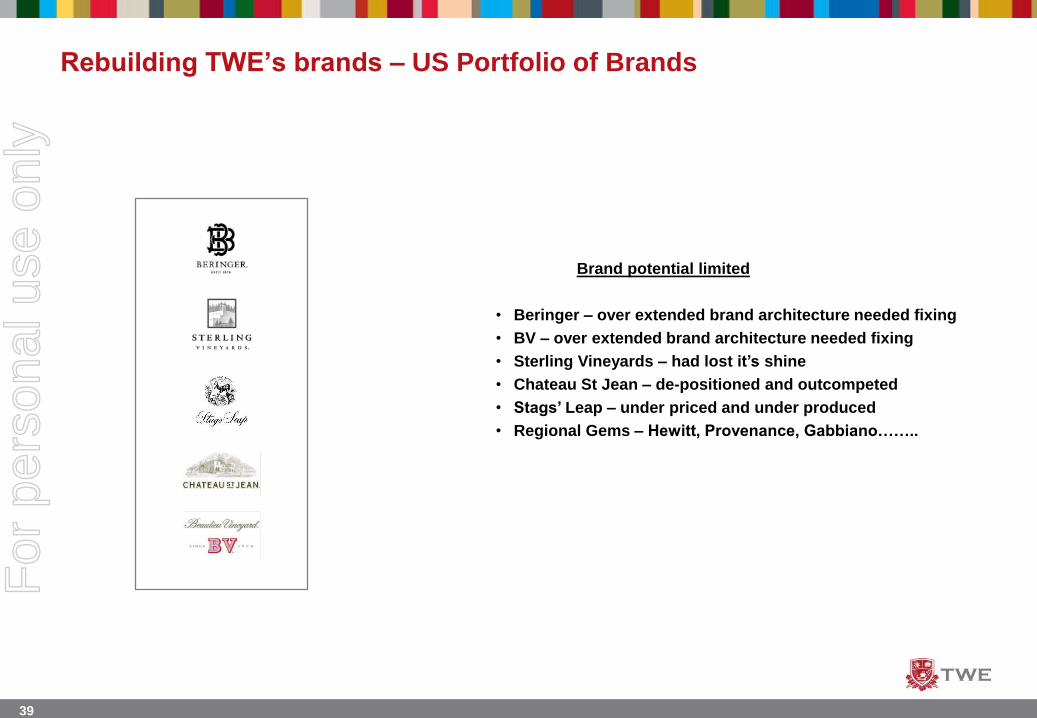
Rebuilding TWE’s brands – US Portfolio of Brands
Brand potential limited
• Beringer – over extended brand architecture needed fixing
• BV – over extended brand architecture needed fixing
• Sterling Vineyards – had lost it’s shine
• Chateau St Jean – de-positioned and outcompeted
• Stags’ Leap – under priced and under produced
• Regional Gems – Hewitt, Provenance, Gabbiano……..
For
per
sona
l use
onl
y
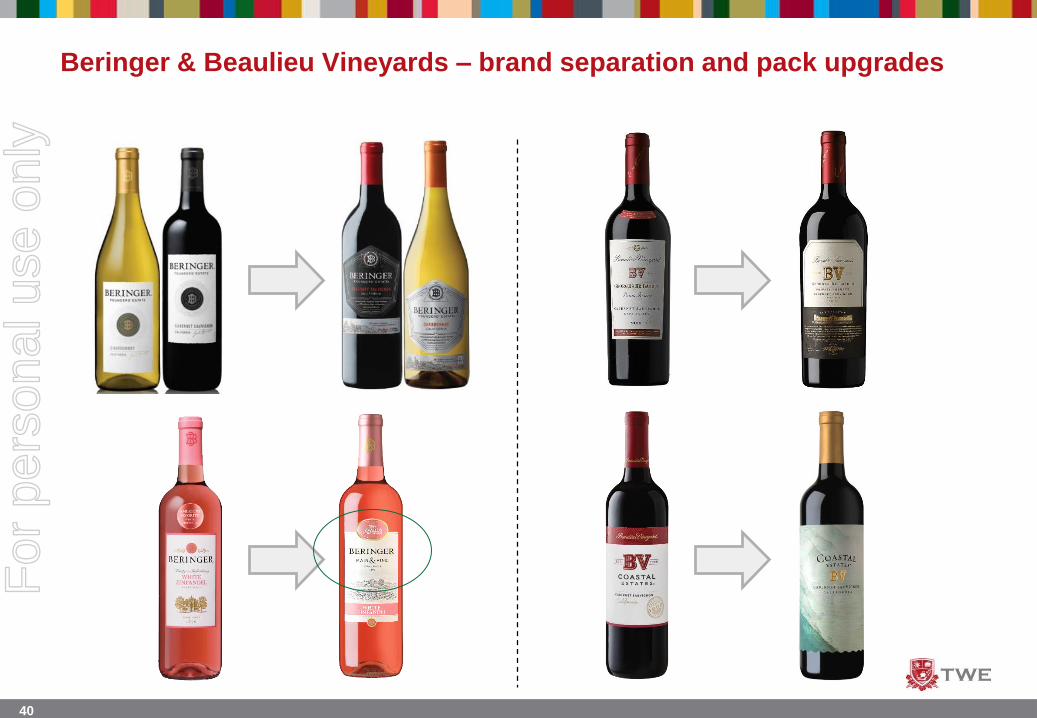
40
Beringer & Beaulieu Vineyards – brand separation and pack upgrades
For
per
sona
l use
onl
y

41
Sterling Vineyards – reinvented, now polished with premium potential
Fixing Growing
Complete brand overhaul
• Redefined brand positioning and new advertising campaign
• Incredible standout new packaging
• Pricing stabilised and reset
Set to shine
• All luxury wines now globally allocated and price optimised
• Launched in Asia and LATAM with winemaker and PR programs
• Digital communication spearhead
• Major innovation ready for launch in F18
For
per
sona
l use
onl
y
42
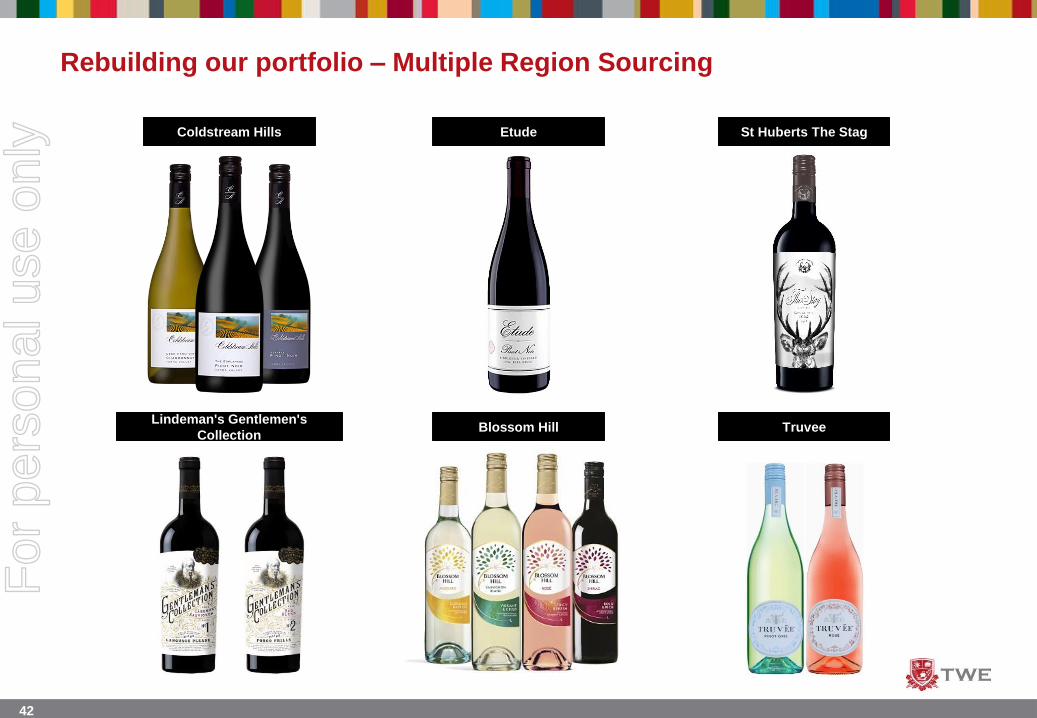
Rebuilding our portfolio – Multiple Region Sourcing
Coldstream Hills Etude St Huberts The Stag
Lindeman's Gentlemen's
CollectionBlossom Hill Truvee
For
per
sona
l use
onl
y
43
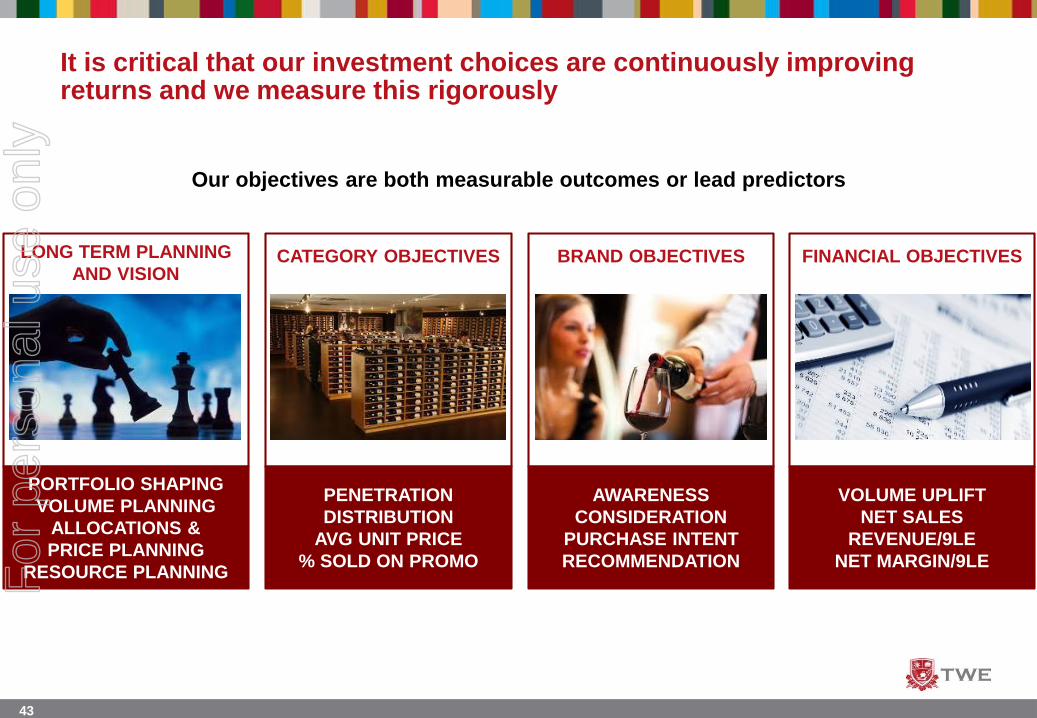
It is critical that our investment choices are continuously improving returns and we measure this rigorously
PENETRATION
DISTRIBUTION
AVG UNIT PRICE
% SOLD ON PROMO
AWARENESS
CONSIDERATION
PURCHASE INTENT
RECOMMENDATION
VOLUME UPLIFT
NET SALES
REVENUE/9LE
NET MARGIN/9LE
FINANCIAL OBJECTIVESCATEGORY OBJECTIVES BRAND OBJECTIVES
Our objectives are both measurable outcomes or lead predictors
PORTFOLIO SHAPING
VOLUME PLANNING
ALLOCATIONS &
PRICE PLANNING
RESOURCE PLANNING
LONG TERM PLANNING
AND VISION
For
per
sona
l use
onl
y

44
44
Mar Apr May June July Aug Sept Oct Nov Dec Jan Feb Mar Apr
F17
April GMBR
4th April Board presentation of
F18 Strategic Plan & F18
Budget
F18
Oct FI/GMBR
April Board presentation
of F19 Strategic Plan &
F19 Budget
S Hemi
VCN Hemi
VC
GVA 5Y Vol
Review
Development of F19-23
Strategic Plan (5Y)
F19 Regional
Brand Plan
(inc pricing)
F19 Global
Brand Plan
June
PMRSept PMR Dec PMR
N Hemi
VC
Budget
COGS F19 COGS
Placeholders
calculated
Assess budget for
material updatesDevelopment of Budget
(detailed)
Bal Sht and
Cashflow
submitted
Forecast
GVA
5YP Strat
Plan
PMR
Brand
Planning
Vintage
Commit
ELT Aug F19 Global
Brand Plan Sign Off
Jan FI/GMBR
Mar PMR
Pre-Vintage
Refresh
Detailed Regional
Activation Plan (inc pricing)
High Level Regional
Activation PlanF19 Regional
Category Plan
(inc channel)
3Y Regional Category
Growth StrategyCategory
Planning
5Y Global
Category
Growth
Strategy
Pre-
Vintage
RefreshLux All’n
Apr FI/GMBR
F18 Budget
Development
Mar PMR
5Y Global Brand
Strategy
F18 COGS
Stds calculated
A&P All’n
Check
Ins
F16 example of our long term integrated planning as the centrepiece of
rebuilding the portfolio
For
per
sona
l use
onl
y

45
Rebuilding TWE’s brands – adding a 4th portfolio to TWE
New 4th Portfolio
For
per
sona
l use
onl
y
46
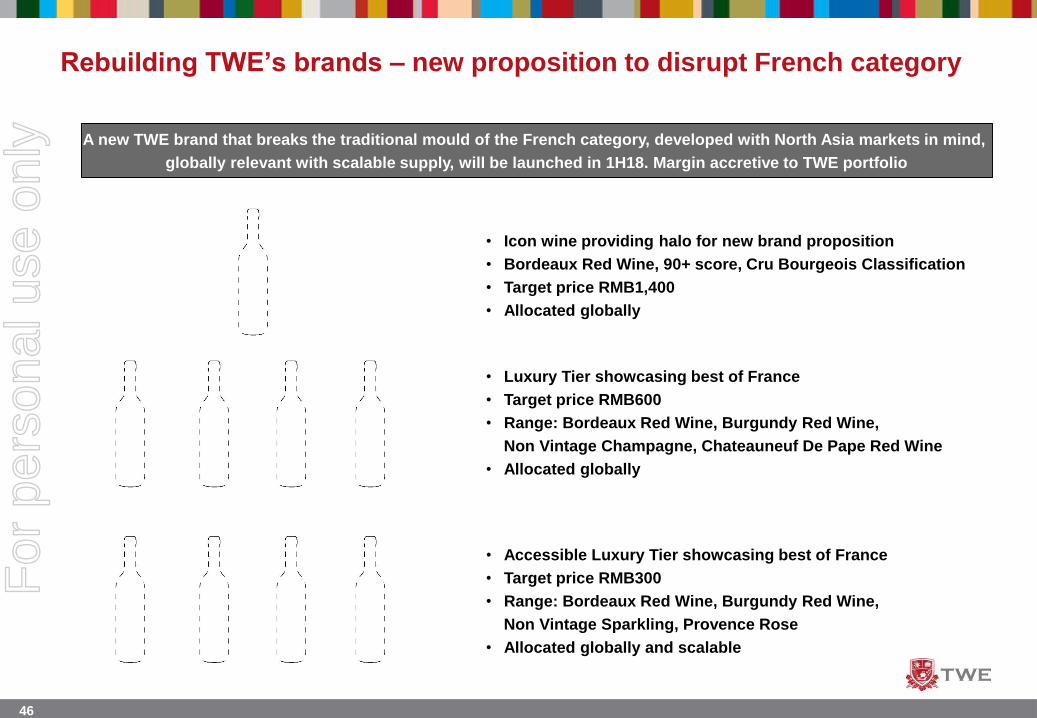
Rebuilding TWE’s brands – new proposition to disrupt French category
• Icon wine providing halo for new brand proposition
• Bordeaux Red Wine, 90+ score, Cru Bourgeois Classification
• Target price RMB1,400
• Allocated globally
• Luxury Tier showcasing best of France
• Target price RMB600
• Range: Bordeaux Red Wine, Burgundy Red Wine,
Non Vintage Champagne, Chateauneuf De Pape Red Wine
• Allocated globally
• Accessible Luxury Tier showcasing best of France
• Target price RMB300
• Range: Bordeaux Red Wine, Burgundy Red Wine,
Non Vintage Sparkling, Provence Rose
• Allocated globally and scalable
A new TWE brand that breaks the traditional mould of the French category, developed with North Asia markets in mind,
globally relevant with scalable supply, will be launched in 1H18. Margin accretive to TWE portfolio
For
per
sona
l use
onl
y
47
We have a proven and repeatable strategy that builds portfolios of brands
We have embedded discipline & rigour
We are creating long term value, by not chasing volume
We are optimising portfolio profitability globally
We have a portfolio of brands with scale backed by world class consumer & shopper insights
We are diversified and balanced on many levels;
- Brands, consumer segments, price points, sourcing and markets
We will have 4 strong brand portfolios across 4 strong regional business models
Our trust-marks are driving growth and margin accretion, for TWE and our partners, globally
So in summary, our brands are desired around the world for quality and
trust, ultimately delivering profitable growth
For
per
sona
l use
onl
y

48
QUESTIONS
For
per
sona
l use
onl
y

49
TWE’s journey from Agri to Brand-ledKey takeaways from today
1
2 Our core asset is our organisational talent
3
4
5 Premiumisation & allocations ensure shareholders earn more than a standard glass return
6 Market share gains and premiumisation will deliver volume and value growth in ANZ
7
9
8 Protecting double digit EBITS margin is Europe’s priority
TWE is on a journey from Agri to Brand-led
We are building brand portfolios; one portfolio at a time. TWE launching French portfolio
Supply will meet demand sustainably, safely and simply
Asia will grow by volume & value and our 30-35% EBITS margin will be preserved
Shifting from Fixing to Growth in the US is in play; EBITS margin to drive Group marginFor
per
sona
l use
onl
y

50
Supply Will Meet Demand;
Sustainably, Safely & SimplyTim Ford – Director of Supply Chain & Industry
Affairs
For
per
sona
l use
onl
y

51
Supply will meet demand sustainably, safely and simply TWE operates a world class supply chain model
1 Planted hectares reflect owned and leased vineyards
Sourcing profile reflects 2016 Vintage
L – Luxury, M – Masstige, C – Commercial
United States
48Vineyards
4,000 Planted
hectares1
9 Wineries
Australia New Zealand Italy
78Vineyards
8,939 Planted
hectares1
8 Wineries
8 Vineyards
339 Planted
hectares1
1 Winery
2 Vineyards
145 Planted
hectares1
1 Winery
Owned &
leased
Growers Bulk
Wine
L 67% 33% -
M 52% 47% 1%
C 5% 21% 74%
Owned &
leased
Growers Bulk
Wine
L 41% 52% 7%
M 45% 47% 8%
C 25% 59% 16%
Owned &
leased
Growers Bulk
Wine
L 86% 14% -
M 22% 77% 1%
C - - -
Owned
& leased
Growers Bulk
Wine
L 100% - -
M 54% 46% -
C - - 100%
For
per
sona
l use
onl
y
52
Supply will meet demand sustainably, safely and simply Destination Zero Harm
Every employee goes home safe, everyday
Safe plant and equipment Safe peopleSafe systems
For
per
sona
l use
onl
y
53
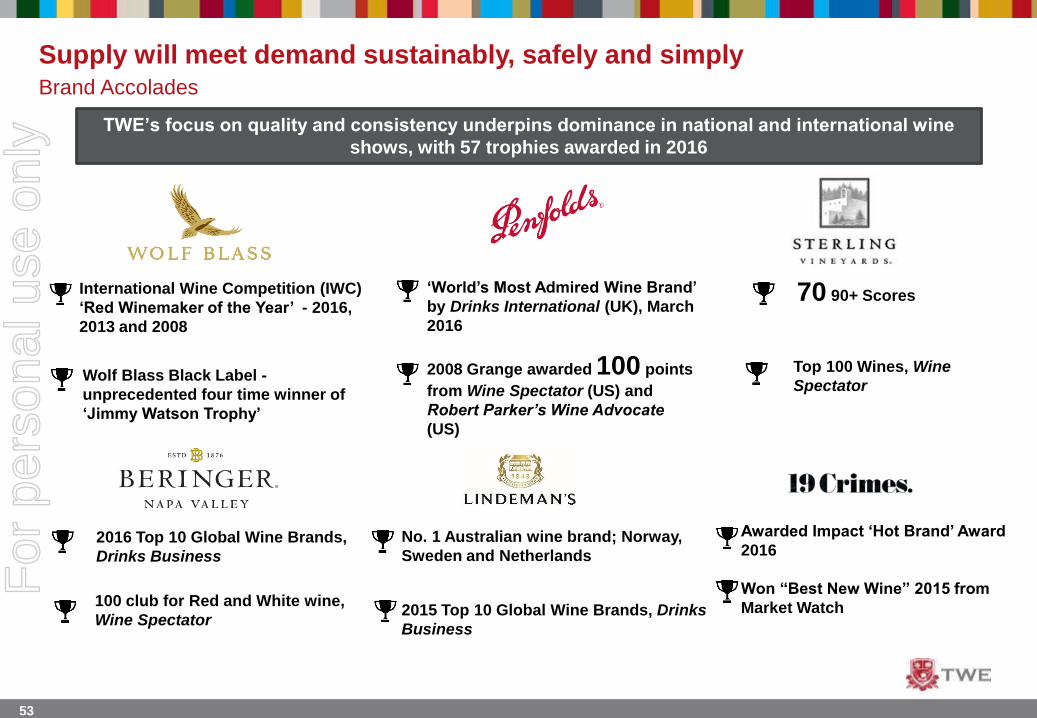
Supply will meet demand sustainably, safely and simply Brand Accolades
Top 100 Wines, Wine
Spectator
Awarded Impact ‘Hot Brand’ Award
2016
Won “Best New Wine” 2015 from
Market Watch
‘World’s Most Admired Wine Brand’
by Drinks International (UK), March
2016
No. 1 Australian wine brand; Norway,
Sweden and Netherlands
2015 Top 10 Global Wine Brands, Drinks
Business
Wolf Blass Black Label -
unprecedented four time winner of
‘Jimmy Watson Trophy’
TWE’s focus on quality and consistency underpins dominance in national and international wine
shows, with 57 trophies awarded in 2016
International Wine Competition (IWC)
‘Red Winemaker of the Year’ - 2016,
2013 and 2008
2008 Grange awarded 100 points
from Wine Spectator (US) and
Robert Parker’s Wine Advocate
(US)
70 90+ Scores
2016 Top 10 Global Wine Brands,
Drinks Business
100 club for Red and White wine,
Wine Spectator
For
per
sona
l use
onl
y
54
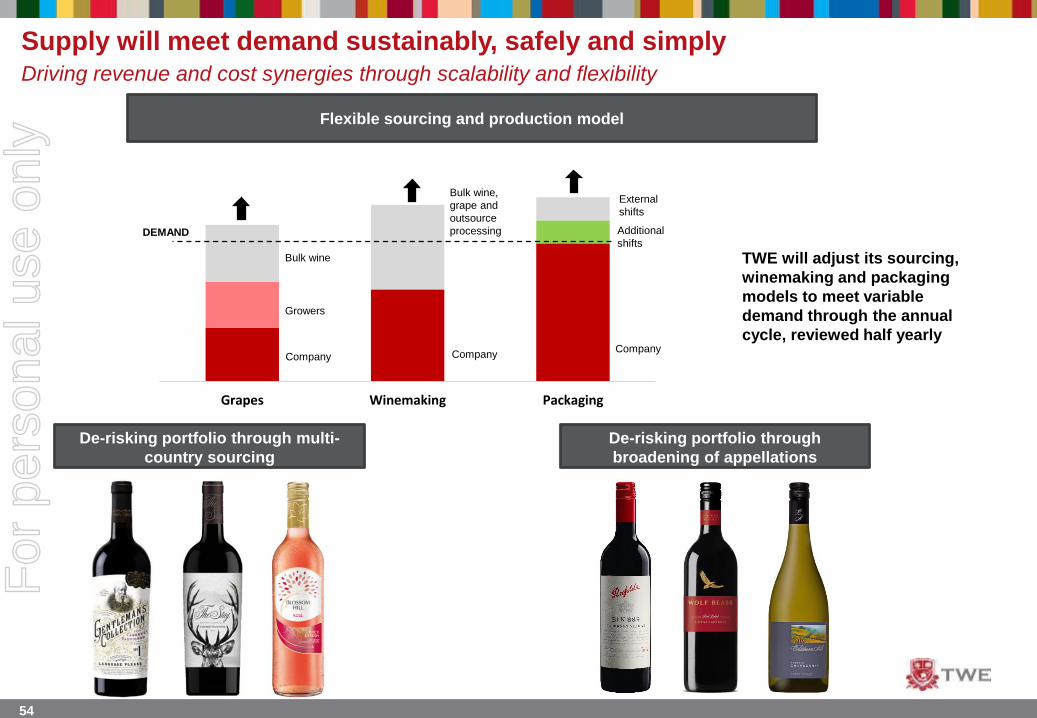
Flexible sourcing and production model
Supply will meet demand sustainably, safely and simplyDriving revenue and cost synergies through scalability and flexibility
Grapes Winemaking Packaging
TWE will adjust its sourcing,
winemaking and packaging
models to meet variable
demand through the annual
cycle, reviewed half yearly
DEMAND
Bulk wine
Growers
CompanyCompany
Bulk wine,
grape and
outsource
processing
External
shifts
Additional
shifts
Company
De-risking portfolio through multi-
country sourcing
De-risking portfolio through
broadening of appellations
For
per
sona
l use
onl
y

55
Supply will meet demand sustainably, safely and simply Supply Chain Optimisation; delivering margin accretion and optimised capital employed
Vineyards and sourcing
Production footprint Packaging, warehousing and logistics
Supply chain optimisation review
A$100mRun-rate COGS
savings by F20
Divestment
of non-core
vineyards
Reinvestment into
Luxury and
Masstige
vineyards
Shift sourcing for
Commercial fruit to
Grower and Bulk Wine
market
Consolidation
of packaging
facilities
In-market
bottling
Exit unprofitable
third party contract
packaging
Realign
warehousing
network
Optimise existing
RTM and realign
distribution network
Centres of
Excellence/Hubs
Consolidation
and closure of
excess wineries
Divestment of 12
Non-Priority
Commercial
Brands
35%Excess network
capacity removed
At least
US$35mRun-rate cash
synergies by F20 F18 Penfolds
allocation is in
line with F17;
with adverse
mix
For
per
sona
l use
onl
y

56
Supply will meet demand sustainably, safely and simply Project Uplift II
Owned vineyard yield optimisation Incremental access to Luxury and Masstige
supply
Viticultural excellence is improving TWE’s yield and access
to Luxury and Masstige supply, globally
Grade 2009 2016
Icon & A 1% 12%
B 17% 56%
C 24% 32%
D 58% Outsourced
This active investment has seen TWE’s vineyards transition
from Commercial to high-end Masstige and Luxury
Organic options include:
Expanding long term bulk wine partnerships
Building long term grower partnerships
Continued investment in shifting varietal mix
Inorganic options include:
Greenfield vineyard acquisition / leases
Established vineyard acquisition / leases
Block by block approach to vineyard management
Maximising yield vs quality trade-off across
portfolio of vineyards
Ensuring highest and best use by grade and
varietal of fruit off every block
For
per
sona
l use
onl
y
57
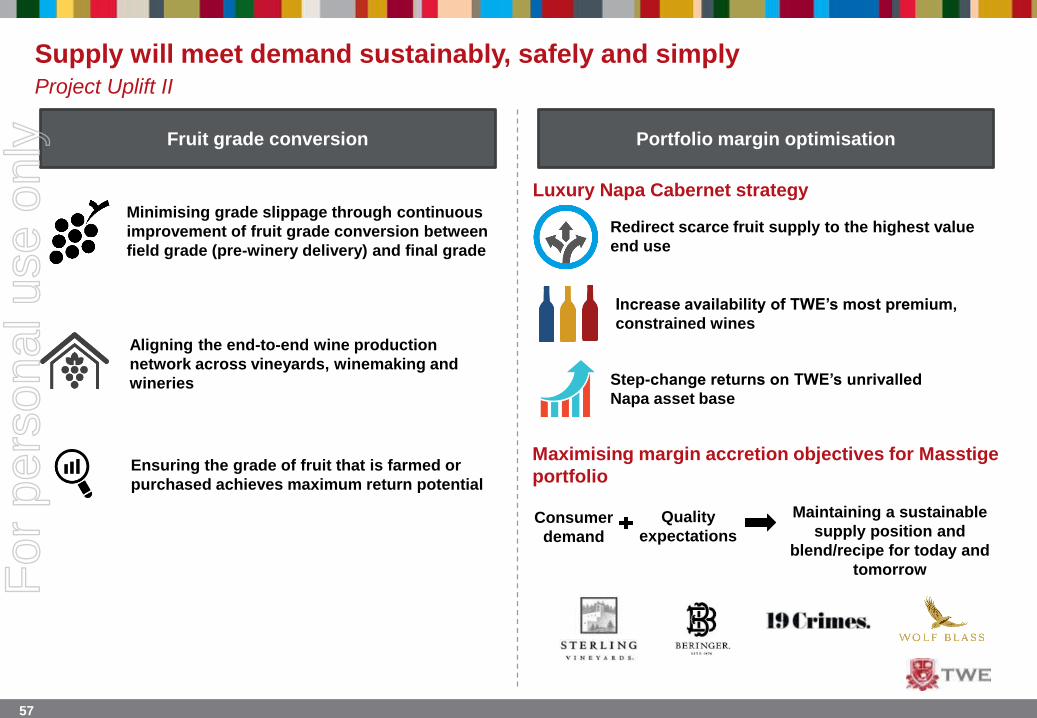
Supply will meet demand sustainably, safely and simply Project Uplift II
Fruit grade conversion Portfolio margin optimisation
Minimising grade slippage through continuous
improvement of fruit grade conversion between
field grade (pre-winery delivery) and final grade
Luxury Napa Cabernet strategy
Redirect scarce fruit supply to the highest value
end use
Increase availability of TWE’s most premium,
constrained wines
Step-change returns on TWE’s unrivalled
Napa asset base
Maximising margin accretion objectives for Masstige
portfolio
Aligning the end-to-end wine production
network across vineyards, winemaking and
wineries
Ensuring the grade of fruit that is farmed or
purchased achieves maximum return potential
Consumer
demand
Quality
expectations
Maintaining a sustainable
supply position and
blend/recipe for today and
tomorrowFor
per
sona
l use
onl
y
58
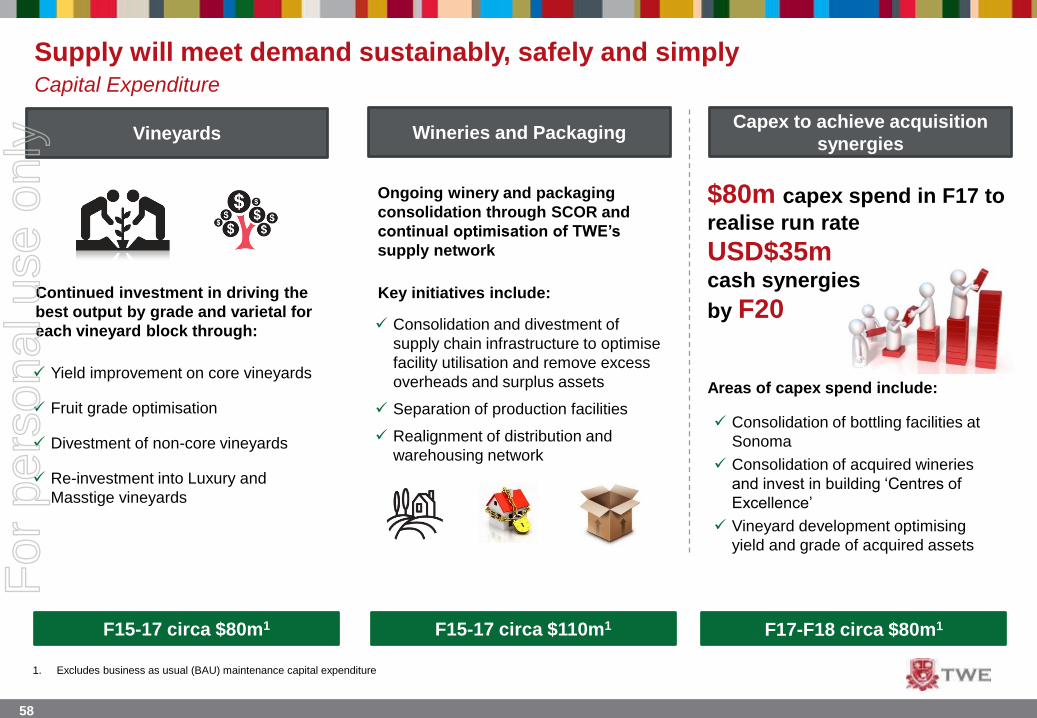
$80m capex spend in F17 to
realise run rate
USD$35mcash synergies
by F20
Vineyards Wineries and PackagingCapex to achieve acquisition
synergies
Yield improvement on core vineyards
Fruit grade optimisation
Divestment of non-core vineyards
Re-investment into Luxury and
Masstige vineyards
Continued investment in driving the
best output by grade and varietal for
each vineyard block through:
Key initiatives include:
Consolidation and divestment of
supply chain infrastructure to optimise
facility utilisation and remove excess
overheads and surplus assets
Separation of production facilities
Realignment of distribution and
warehousing network
Areas of capex spend include:
Consolidation of bottling facilities at
Sonoma
Consolidation of acquired wineries
and invest in building ‘Centres of
Excellence’
Vineyard development optimising
yield and grade of acquired assets
F17-F18 circa $80m1
Supply will meet demand sustainably, safely and simply Capital Expenditure
Ongoing winery and packaging
consolidation through SCOR and
continual optimisation of TWE’s
supply network
F15-17 circa $110m1F15-17 circa $80m1
1. Excludes business as usual (BAU) maintenance capital expenditure
For
per
sona
l use
onl
y
59
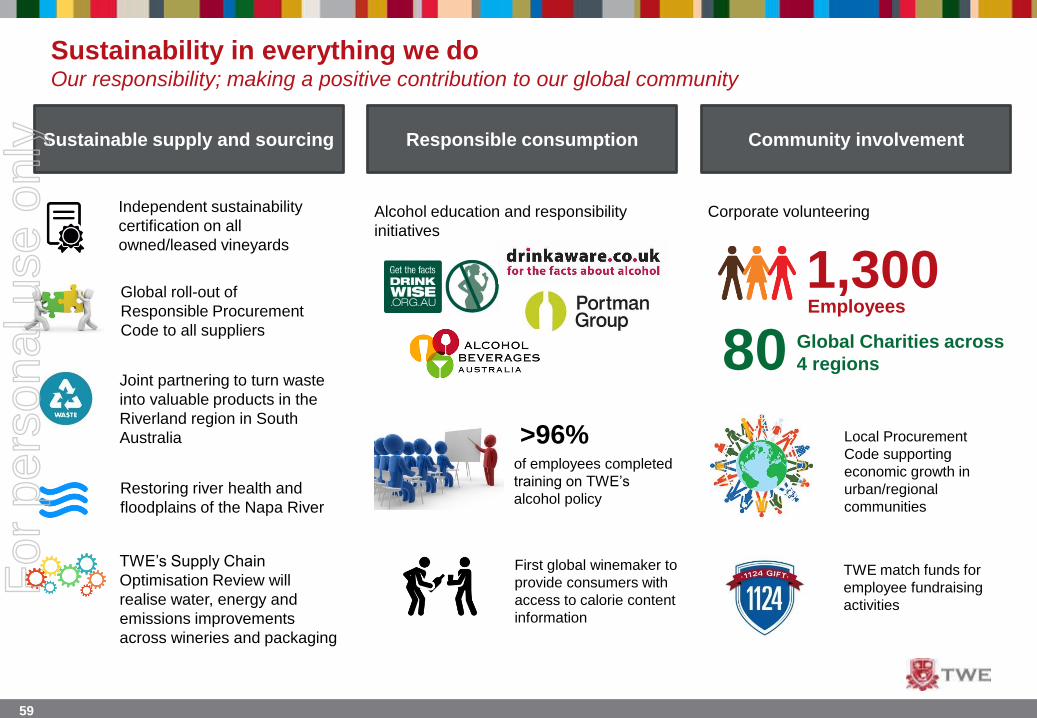
Sustainability in everything we doOur responsibility; making a positive contribution to our global community
Sustainable supply and sourcing
Independent sustainability
certification on all
owned/leased vineyards
Global roll-out of
Responsible Procurement
Code to all suppliers
Joint partnering to turn waste
into valuable products in the
Riverland region in South
Australia
Restoring river health and
floodplains of the Napa River
TWE’s Supply Chain
Optimisation Review will
realise water, energy and
emissions improvements
across wineries and packaging
Responsible consumption
>96%of employees completed
training on TWE’s
alcohol policy
Alcohol education and responsibility
initiatives
First global winemaker to
provide consumers with
access to calorie content
information
Community involvement
Corporate volunteering
Employees
80 Global Charities across
4 regions
Local Procurement
Code supporting
economic growth in
urban/regional
communities
TWE match funds for
employee fundraising
activities
1,300
For
per
sona
l use
onl
y

60
Supply will meet demand sustainably, safely and simply Summary of key takeaways
TWE produces world class wines of quality that delight consumers – and TWE will
continue to have quality at the heart of what is done in every region
Destination Zero Harm, a people-focused, behaviour-led safety culture program is in
place - at TWE we care about safety because everybody’s life is important
Aggressive implementation of initiatives will optimise and streamline the supply chain
cost base to deliver margin accretion and return on capital employed improvement
Strategic capital expenditure will support TWE’s continued investment in
premiumisation and deliver sustainable supply and benefits over the long term
Developing scalability and flexibility is now a key platform for TWE’s supply chain
strategy and execution plan to drive availability to meet future growth ambitions
For
per
sona
l use
onl
y

61
QUESTIONS
For
per
sona
l use
onl
y

62
TWE’s journey from Agri to Brand-ledKey takeaways from today
1
2 Our core asset is our organisational talent
3
4
5 Premiumisation & allocations ensure shareholders earn more than a standard glass return
6 Market share gains and premiumisation will deliver volume and value growth in ANZ
7
9
8 Protecting double digit EBITS margin is Europe’s priority
TWE is on a journey from Agri to Brand-led
We are building brand portfolios; one portfolio at a time. TWE launching French portfolio
Supply will meet demand sustainably, safely and simply
Asia will grow by volume & value and our 30-35% EBITS margin will be preserved
Shifting from Fixing to Growth in the US is in play; EBITS margin to drive Group marginFor
per
sona
l use
onl
y

63
Driving Value Creation and EBITS
Margin accretion; with a bedrock of
strong controls and disciplined capital
structureGunther Burghardt – Chief Financial Officer
For
per
sona
l use
onl
y

64
Driving value creation and EBITS margin accretionTWE’s relentless focus on continuing EBITS margin expansion
TWE is targeting long-term sustainable EBITS margin expansion
Levers to continual EBITS margin expansion include;
Revenue Management
• Re-allocation of Luxury & Masstige fruits and products across geographies, channels and customers
• Advanced pricing and promotional program analytics
• Allocation of fruit to highest margin products
1
2 Balancing our business and value streams to ensure sustainable growth
3 Optimising our capital structure to reduce cost of funds and minimize risk
4 Supply Optimisation
• Run-rate COGS savings of at least $100m from Supply Chain Optimisation initiative by F20
• Run-rate cash synergies recognised from the acquisition of Diageo Wine of US$35m by F20
• Allocation of fruit to highest margin products
5 Leveraging scale and efficiencies / savings to optimise our Cost Of Doing Business
Supported by global systems and enhanced internal controls
For
per
sona
l use
onl
y

65
Driving value creation and EBITS margin accretionTWE’s cycle of optimising value
Long Term Margin Accretion Roadmap
5 year roadmap of brand tiers pricing and margin across
key markets
Long Term Demand
5 year demand planning process allocating products
across retailers and distributors
Allocate Supply to Products
Allocation of owned/leased, grower and bulk wine across
products
Allocation of
products across markets and channels
In market pricing evolution and execution
Long Term Supply
5 year planned allocation of owned/leased, grower and bulk wine across products
5 Year Strategy
For
per
sona
l use
onl
y
66
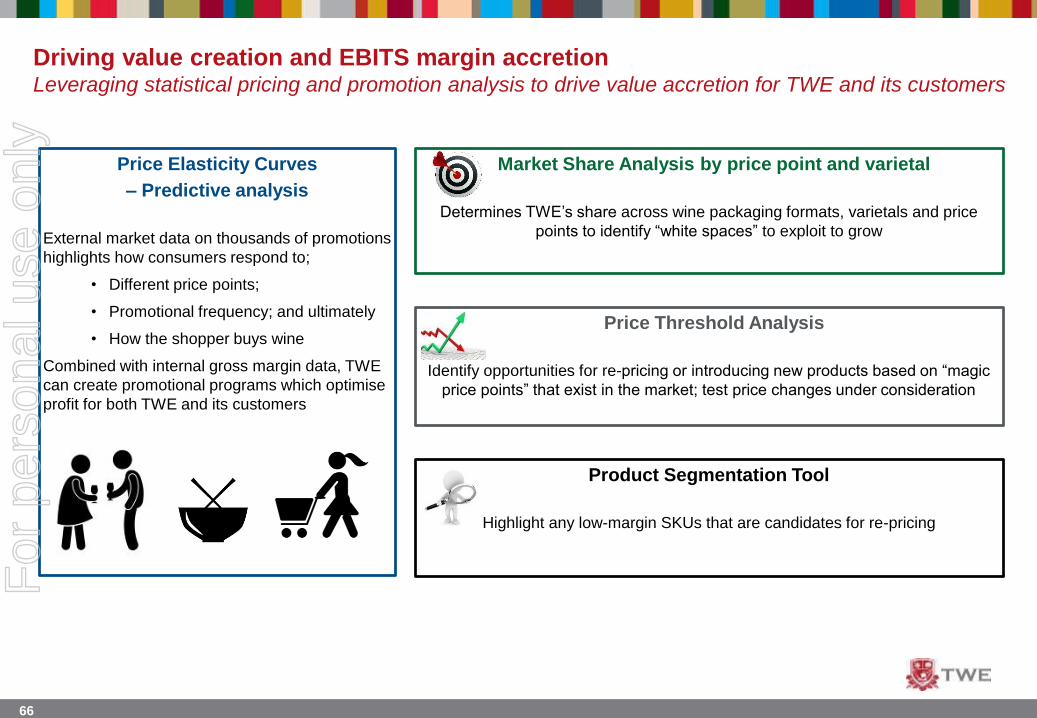
Driving value creation and EBITS margin accretionLeveraging statistical pricing and promotion analysis to drive value accretion for TWE and its customers
Price Elasticity Curves
– Predictive analysis
External market data on thousands of promotions
highlights how consumers respond to;
• Different price points;
• Promotional frequency; and ultimately
• How the shopper buys wine
Combined with internal gross margin data, TWE
can create promotional programs which optimise
profit for both TWE and its customers
Market Share Analysis by price point and varietal
Determines TWE’s share across wine packaging formats, varietals and price
points to identify “white spaces” to exploit to grow
Price Threshold Analysis
Identify opportunities for re-pricing or introducing new products based on “magic
price points” that exist in the market; test price changes under consideration
Product Segmentation Tool
Highlight any low-margin SKUs that are candidates for re-pricing
For
per
sona
l use
onl
y
67
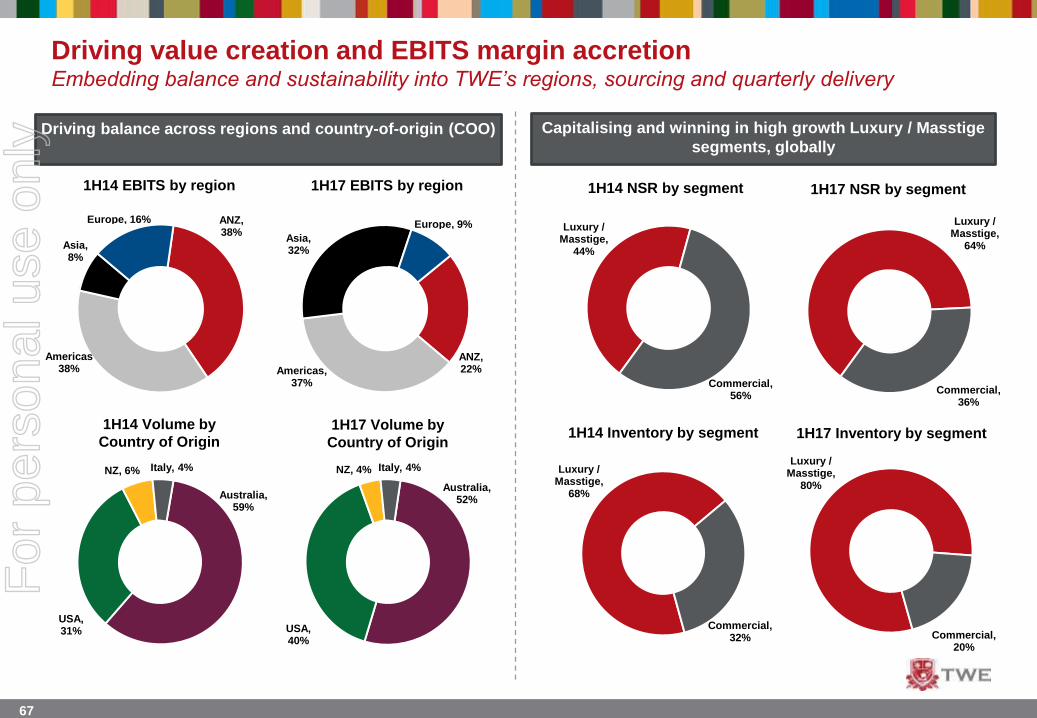
Driving value creation and EBITS margin accretion Embedding balance and sustainability into TWE’s regions, sourcing and quarterly delivery
Driving balance across regions and country-of-origin (COO) Capitalising and winning in high growth Luxury / Masstige
segments, globally
ANZ, 38%
Americas38%
Asia, 8%
Europe, 16%
1H14 EBITS by region 1H17 EBITS by region
ANZ, 22%Americas,
37%
Asia, 32%
Europe, 9%
Australia, 52%
USA, 40%
NZ, 4% Italy, 4%
Australia, 59%
USA, 31%
NZ, 6% Italy, 4%
1H14 Volume by
Country of Origin 1H17 Volume by
Country of Origin
Luxury / Masstige,
44%
Commercial, 56%
1H14 NSR by segment 1H17 NSR by segment
Luxury / Masstige,
64%
Commercial, 36%
1H14 Inventory by segment
Luxury / Masstige,
68%
Commercial, 32%
1H17 Inventory by segment
Luxury / Masstige,
80%
Commercial, 20%
For
per
sona
l use
onl
y
68
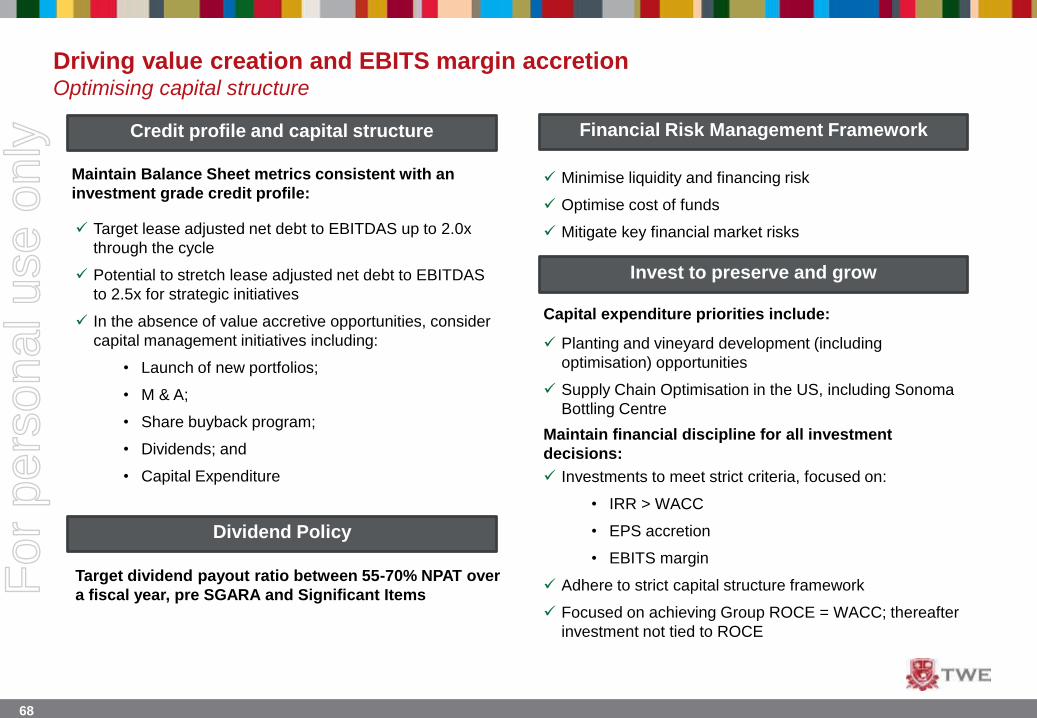
Driving value creation and EBITS margin accretionOptimising capital structure
Credit profile and capital structure Financial Risk Management Framework
Dividend Policy
Invest to preserve and grow
Maintain Balance Sheet metrics consistent with an
investment grade credit profile:
Target lease adjusted net debt to EBITDAS up to 2.0x
through the cycle
Potential to stretch lease adjusted net debt to EBITDAS
to 2.5x for strategic initiatives
In the absence of value accretive opportunities, consider
capital management initiatives including:
• Launch of new portfolios;
• M & A;
• Share buyback program;
• Dividends; and
• Capital Expenditure
Target dividend payout ratio between 55-70% NPAT over
a fiscal year, pre SGARA and Significant Items
Minimise liquidity and financing risk
Optimise cost of funds
Mitigate key financial market risks
Planting and vineyard development (including
optimisation) opportunities
Supply Chain Optimisation in the US, including Sonoma
Bottling Centre
Capital expenditure priorities include:
Maintain financial discipline for all investment
decisions:
Investments to meet strict criteria, focused on:
• IRR > WACC
• EPS accretion
• EBITS margin
Adhere to strict capital structure framework
Focused on achieving Group ROCE = WACC; thereafter
investment not tied to ROCE
For
per
sona
l use
onl
y

69
Driving value creation and EBITS margin accretionTWE’s journey to ROCE > Short term/ Long term WACC
FY 1H FY 1H FY 1H FY 1H FY 1H FY
Short Term WACC Long Term WACC ROCE
Pre Tax Long
Term WACC
Pre Tax Short
Term WACC
ROCE
Balance Sheet strategy to optimise WACC while ensuring efficient access to capital through
the cycle
For
per
sona
l use
onl
y
70
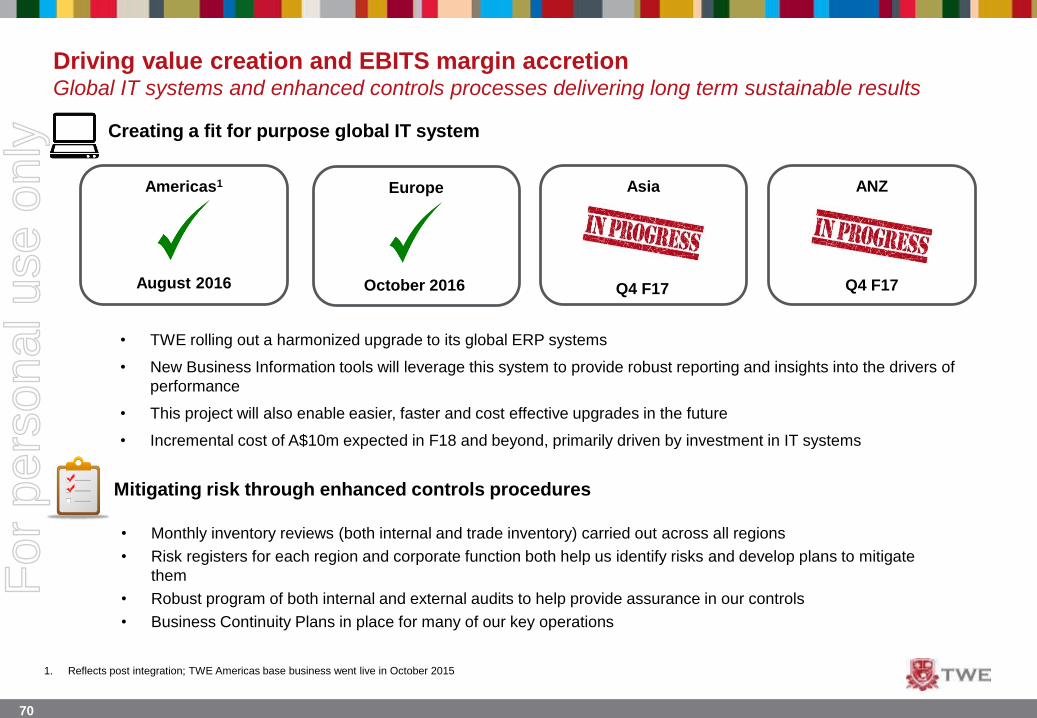
Driving value creation and EBITS margin accretionGlobal IT systems and enhanced controls processes delivering long term sustainable results
Creating a fit for purpose global IT system
Americas1 ANZAsiaEurope
August 2016 October 2016 Q4 F17
• TWE rolling out a harmonized upgrade to its global ERP systems
• New Business Information tools will leverage this system to provide robust reporting and insights into the drivers of
performance
• This project will also enable easier, faster and cost effective upgrades in the future
• Incremental cost of A$10m expected in F18 and beyond, primarily driven by investment in IT systems
Mitigating risk through enhanced controls procedures
• Monthly inventory reviews (both internal and trade inventory) carried out across all regions
• Risk registers for each region and corporate function both help us identify risks and develop plans to mitigate
them
• Robust program of both internal and external audits to help provide assurance in our controls
• Business Continuity Plans in place for many of our key operations
1. Reflects post integration; TWE Americas base business went live in October 2015
Q4 F17
For
per
sona
l use
onl
y

71
SummaryTop 5 takeaways for on how TWE will drive value while managing capital and risk effectively
TWE has a very disciplined approach to managing capital and risk, focused on maintaining
credit metrics that are consistent with an investment grade credit profile
Allocation of fruit and wines in our portfolio to “highest value use” and across geographies,
channels, customers and financial periods to drive substantial value creation for the business
When it comes to acquisitions, TWE is and will be extremely patient and we have a strong
appetite to invest for current and future value growth
We know the “levers” in our business and P&L which will drive sustainable long term EBITS
margins
Advanced pricing and promotional analytics are creating value for TWE and its customers
For
per
sona
l use
onl
y

72
QUESTIONS
For
per
sona
l use
onl
y
73
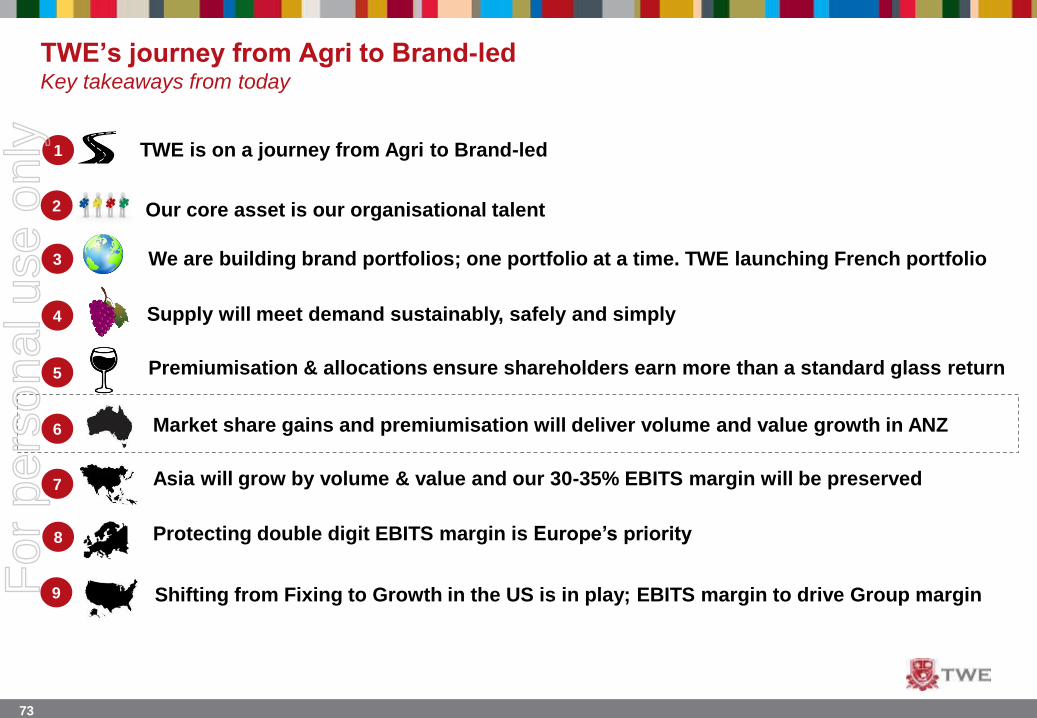
TWE’s journey from Agri to Brand-ledKey takeaways from today
1
2 Our core asset is our organisational talent
3
4
5 Premiumisation & allocations ensure shareholders earn more than a standard glass return
6 Market share gains and premiumisation will deliver volume and value growth in ANZ
7
9
8 Protecting double digit EBITS margin is Europe’s priority
TWE is on a journey from Agri to Brand-led
We are building brand portfolios; one portfolio at a time. TWE launching French portfolio
Supply will meet demand sustainably, safely and simply
Asia will grow by volume & value and our 30-35% EBITS margin will be preserved
Shifting from Fixing to Growth in the US is in play; EBITS margin to drive Group marginFor
per
sona
l use
onl
y

74
Growing Sustainable Share in a
Mature MarketAngus McPherson – Managing Director, ANZ
For
per
sona
l use
onl
y
75
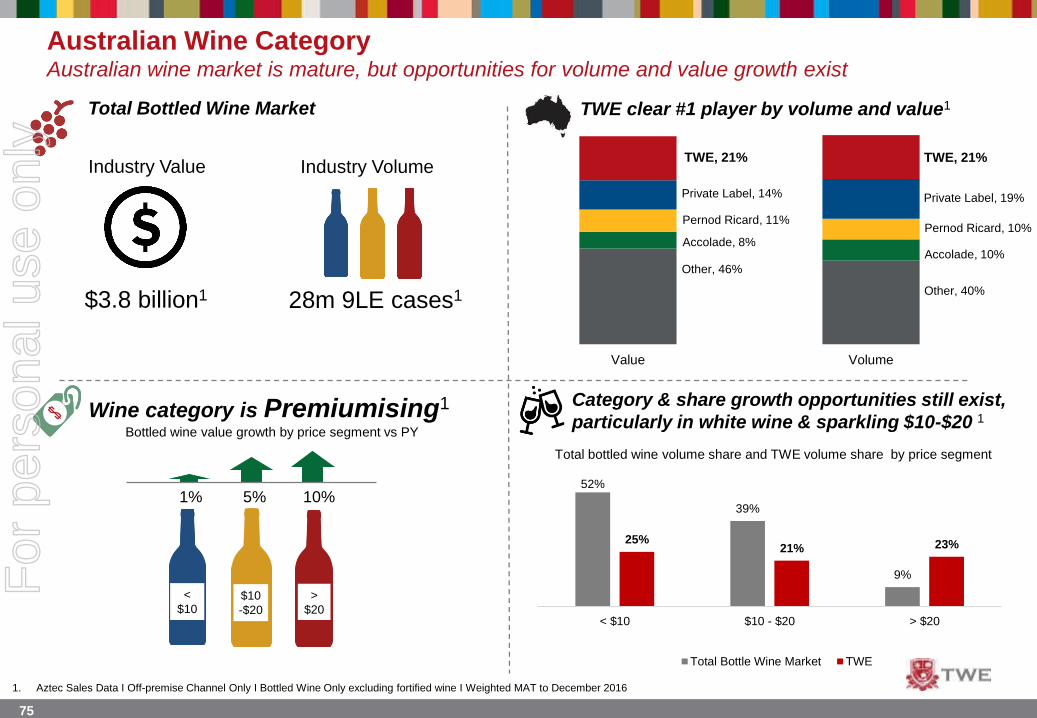
Other, 46%
Other, 40%
Accolade, 8%Accolade, 10%
Pernod Ricard, 11%Pernod Ricard, 10%
Private Label, 14% Private Label, 19%
TWE, 21% TWE, 21%
Value Volume
Australian Wine CategoryAustralian wine market is mature, but opportunities for volume and value growth exist
Total Bottled Wine Market
$3.8 billion1 28m 9LE cases1
Wine category is Premiumising1
<
$10$10
-$20
>
$20
1% 10%5%
TWE clear #1 player by volume and value1
Category & share growth opportunities still exist,
particularly in white wine & sparkling $10-$20 1
52%
39%
9%
25%21% 23%
< $10 $10 - $20 > $20
Total Bottle Wine Market TWE
Industry VolumeIndustry Value
1. Aztec Sales Data I Off-premise Channel Only I Bottled Wine Only excluding fortified wine I Weighted MAT to December 2016
Bottled wine value growth by price segment vs PY
Total bottled wine volume share and TWE volume share by price segment
For
per
sona
l use
onl
y

76
Australian Wine ConsumerAustralians tend to drink Australian wine and relatively frequently
Australia; large wine consuming
population
13.9 MillionAustralians drink wine¹
81%Of the adult population¹
26.82016
65% of wine consumers
drink wine at least
once a week1
2016
Still red and white wine have
greatest share of the category²
40% 22%38%
Australian Country of Origin
dominates the category4
New Zealand - 12%
6% 3YR CAGR
Australian – 83%
(1)% 3YR CAGR
Rest of world – 5%
Value share of bottled wine
26.5 Litres per
capita3
2011
Litres per
capita3
Per capita consumption is relatively high;
increasing population is driving growth
1.Shiraz 2. Champagne
4. Pinot Noir
3. Sauvignon Blanc
Value growth: +21%
Value share: 3%
Value growth: +4%
Value share: 17%
Value growth: +11%
Value share: 6%
Value growth: +10%
Value share: 14%
Value growth: +17%
Value share: 3%
Top 5 varietal contributors to wine
value growth2
1. Wine Intelligence Brand Tracker 2016
2. Aztec Sales Data I Off-premise Channel Only I Bottled Wine Only excluding fortified wine I Weighted MAT to December 2016
3. Euromonitor International 2016, Still Light Grape Wine, Litres per capita at legal purchasing age
4. IWSR 2016
5. Pinot Gris / Grigio
Volume share of bottled wine
For
per
sona
l use
onl
y

77
EDG, 54%
CLG, 25%
Independents, 21%
1.6%
Bricks and Mortar Retail
Channel
60%
E-Commerce
Channel
On premise
Channel
Ch
an
nel
sp
lit
Cu
sto
me
r s
ha
re o
f c
ha
nn
el
Top 10 banners = ~90% of sales
Australian Market Landscape1
Retail wine market continues to consolidate, while the E-commerce channel continues to evolve
26% 11%
Direct-To-Consumer
Channel
3%
Consolidation Highly Fragmented
Top 10 customer
= ~5% of sales
~ 44,000 On-Premise customers
Growth & New Entrants^
EDG = ~50% sales^
EDG
Gray’s
Cellar Doors
TWE = 11 of 1,6002
Cellar Doors
1. Wine Intelligence Brand Tracker 2016, Aztec MAT to January 2017, Company estimates
2. The ANZ Wine Industry Directory, 2016
^ On-line sales overlap with bricks and mortar sales
For
per
sona
l use
onl
y
78
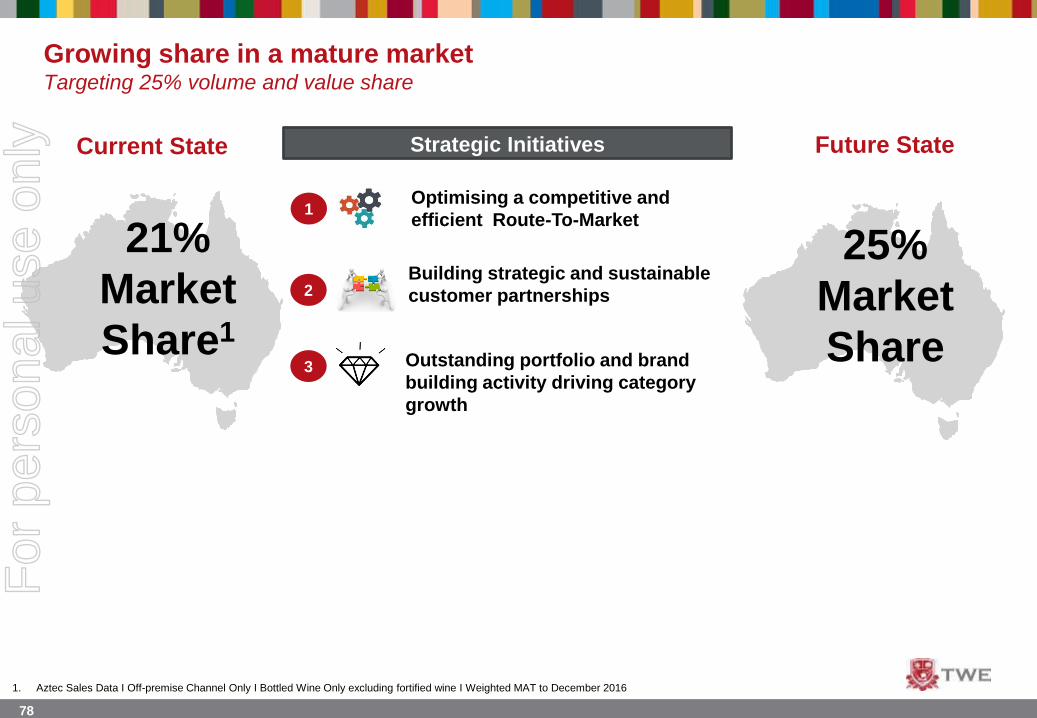
Growing share in a mature marketTargeting 25% volume and value share
25%
Market
Share
21%
Market
Share1
Future StateStrategic Initiatives Current State
Optimising a competitive and
efficient Route-To-Market
Outstanding portfolio and brand
building activity driving category
growth
2Building strategic and sustainable
customer partnerships
1
3
1. Aztec Sales Data I Off-premise Channel Only I Bottled Wine Only excluding fortified wine I Weighted MAT to December 2016
For
per
sona
l use
onl
y
79
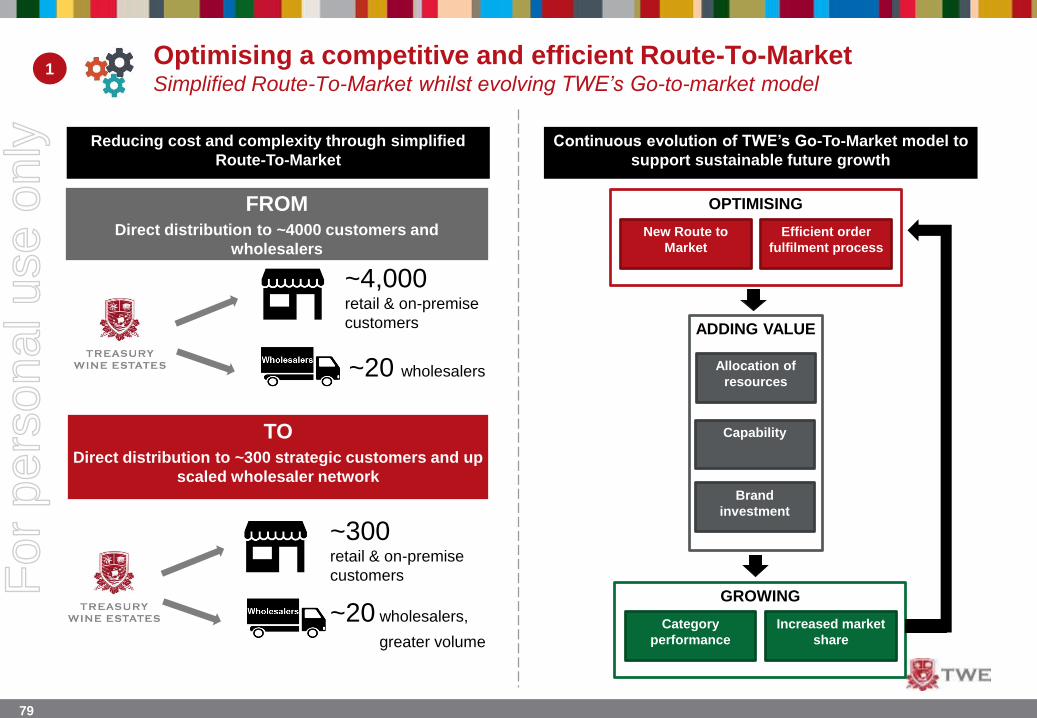
Optimising a competitive and efficient Route-To-MarketSimplified Route-To-Market whilst evolving TWE’s Go-to-market model
Reducing cost and complexity through simplified
Route-To-Market
Continuous evolution of TWE’s Go-To-Market model to
support sustainable future growth
FROMDirect distribution to ~4000 customers and
wholesalers
TODirect distribution to ~300 strategic customers and up
scaled wholesaler network
~4,000 retail & on-premise
customers
~20 wholesalers
~300 retail & on-premise
customers
~20 wholesalers,
greater volume
1
ADDING VALUE
Allocation of
resources
Capability
Brand
investment
OPTIMISING
Efficient order
fulfilment process
New Route to
Market
GROWING
Increased market
share
Category
performance
For
per
sona
l use
onl
y
80
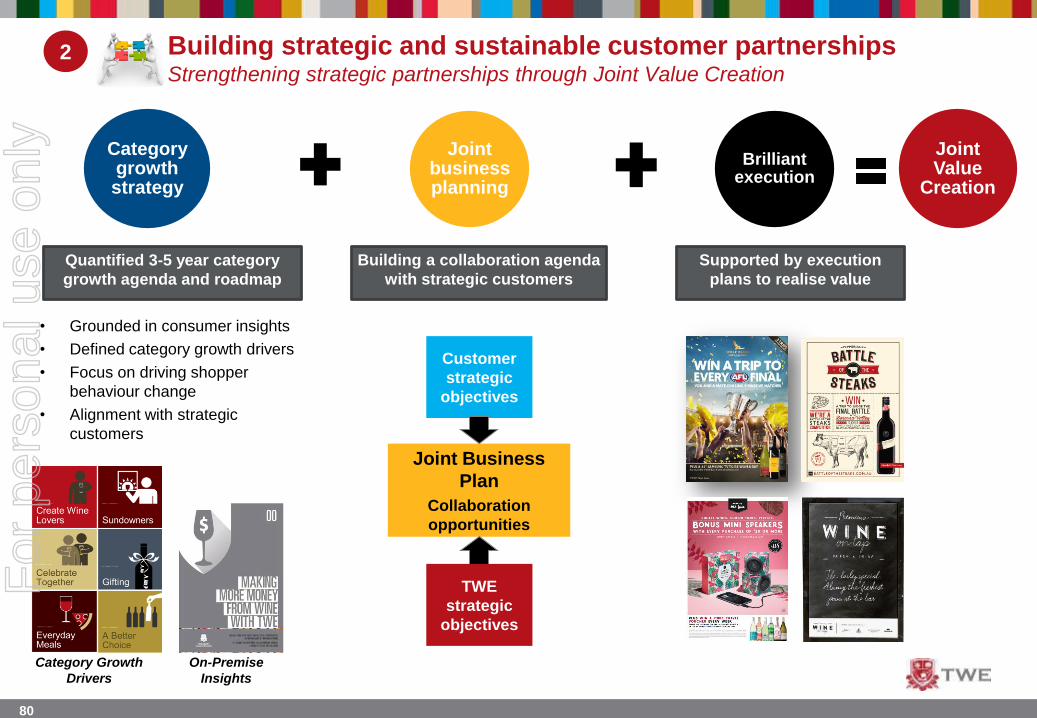
2
Category growth strategy
Joint business planning
Brilliant execution
Joint Value
Creation
• Grounded in consumer insights
• Defined category growth drivers
• Focus on driving shopper
behaviour change
• Alignment with strategic
customers
Building a collaboration agenda
with strategic customers
Category Growth
Drivers
Building strategic and sustainable customer partnershipsStrengthening strategic partnerships through Joint Value Creation
Customer
strategic
objectives
Joint Business
Plan
Collaboration
opportunities
TWE
strategic
objectives
Supported by execution
plans to realise value
On-Premise
Insights
Quantified 3-5 year category
growth agenda and roadmap
For
per
sona
l use
onl
y
81
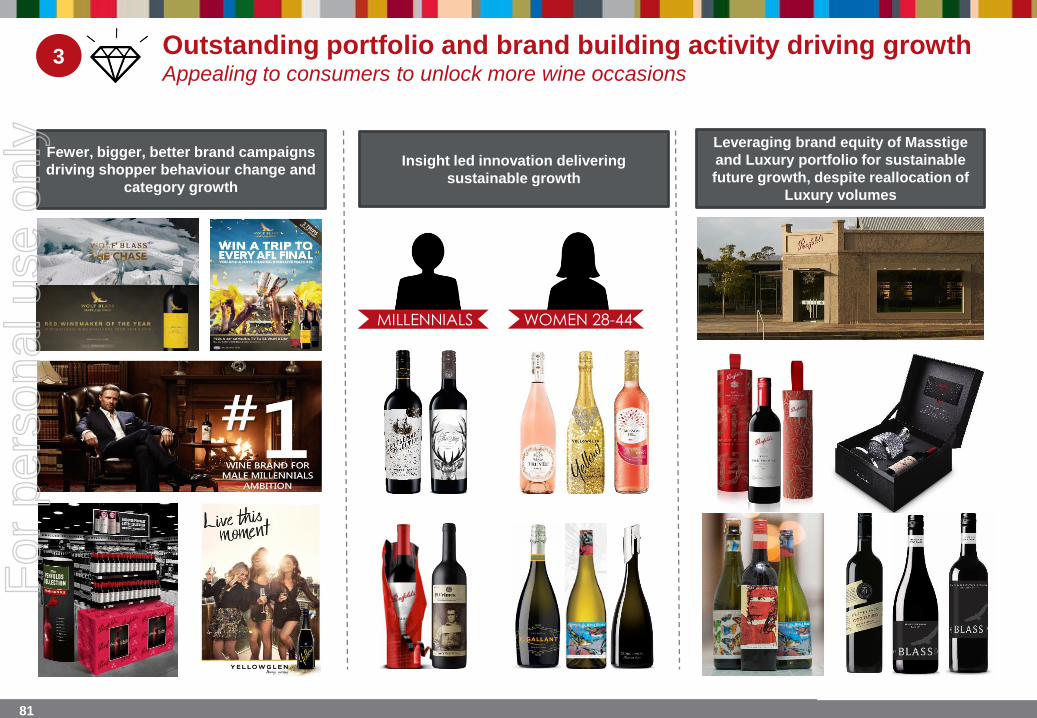
3
Fewer, bigger, better brand campaigns
driving shopper behaviour change and
category growth
Insight led innovation delivering
sustainable growth
MILLENNIALS WOMEN 28-44
Leveraging brand equity of Masstige
and Luxury portfolio for sustainable
future growth, despite reallocation of
Luxury volumes
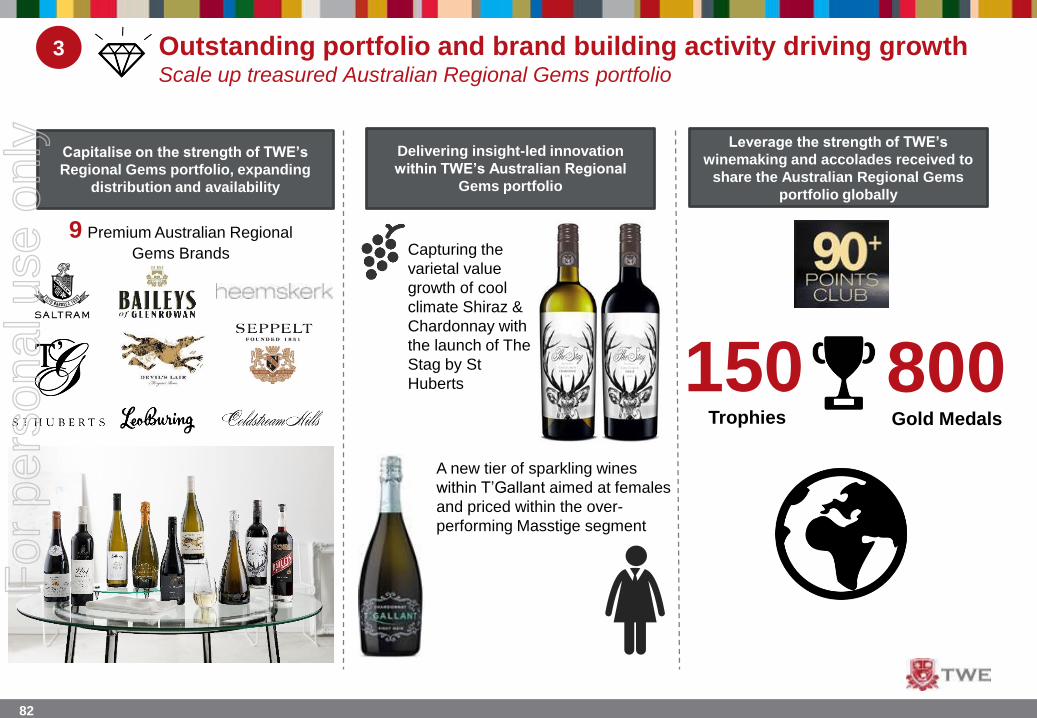
Outstanding portfolio and brand building activity driving growthAppealing to consumers to unlock more wine occasions
For
per
sona
l use
onl
y
82
Capitalise on the strength of TWE’s
Regional Gems portfolio, expanding
distribution and availability
Delivering insight-led innovation
within TWE’s Australian Regional
Gems portfolio
Leverage the strength of TWE’s
winemaking and accolades received to
share the Australian Regional Gems
portfolio globally
Capturing the
varietal value
growth of cool
climate Shiraz &
Chardonnay with
the launch of The
Stag by St
Huberts
A new tier of sparkling wines
within T’Gallant aimed at females
and priced within the over-
performing Masstige segment
150 800Trophies Gold Medals
9 Premium Australian Regional
Gems Brands
Outstanding portfolio and brand building activity driving growthScale up treasured Australian Regional Gems portfolio
3F
or p
erso
nal u
se o
nly

83
Extraordinary Stories
for Experienced
Seekers looking for
Authenticity and
Exploration
3Outstanding portfolio and brand building activity driving growthIntroducing - SAMUEL WYNN & CO.
For
per
sona
l use
onl
y

84
Above The Line Support
Digital Support
In Store Retail Activations
Media Partnerships
3Outstanding portfolio and brand building activity driving growthSignificant market support, targeted towards Millennials
For
per
sona
l use
onl
y

85
3 Outstanding portfolio and brand building activity driving growthDrive growth and scale of an iconic Australian wine brand with enviable wine credentials
Icon & Luxury Premium Masstige Still Wine Masstige Sparkling Wine
• Leverage strong quality
credentials of existing Icon
and Luxury range
• Global allocation
• Varietals;
Iconic Show
Sparkling Shiraz
St Peters
Drumborg Single
Vineyard Range
• New tier leveraging
Seppelt winemaking
expertise to recruit new
consumers
• Regionally appellated
• RRP A$25
• Driving breadth and
scale
• Attract new customers
• Large and high growth
segment – accounts for
close to 1/3 of the wine
category1
• Range; Shiraz,
Chardonnay, Pinot Gris
and Rose
• Leveraging Seppelt’s
extensive Sparkling
heritage to launch an
accessible Masstige
proposition
• Focused on high
growth segments
• Range; Sparkling White,
Sparkling Shiraz and
Prosecco
1. Aztec Weighted Scan data MAT January 2017
For
per
sona
l use
onl
y
86
SummaryTop 5 takeaways for TWE’s ANZ region
Australian wine market is mature, but opportunities for volume and value growth exist
With world class viticultural and brand assets, TWE is best positioned to capture Luxury and
Masstige growth
Portfolio strategy is critical; investing in brands and insight-led innovation will unlock more
wine occasions and deliver sustainable growth, despite reallocation of Luxury volumes to
other regions
Winning with strategic customer partners is key to strengthening TWE’s category leadership
position; developing an aligned category growth agenda, with joint value creation
opportunities and execution plans will create value for TWE and its partners
Evolving TWE’s model to adapt to changing market dynamics is key to sustainable success
For
per
sona
l use
onl
y

87
QUESTIONS
For
per
sona
l use
onl
y

88
TWE’s journey from Agri to Brand-ledKey takeaways from today
1
2 Our core asset is our organisational talent
3
4
5 Premiumisation & allocations ensure shareholders earn more than a standard glass return
6 Market share gains and premiumisation will deliver volume and value growth in ANZ
7
9
8 Protecting double digit EBITS margin is Europe’s priority
TWE is on a journey from Agri to Brand-led
We are building brand portfolios; one portfolio at a time. TWE launching French portfolio
Supply will meet demand sustainably, safely and simply
Asia will grow by volume & value and our 30-35% EBITS margin will be preserved
Shifting from Fixing to Growth in the US is in play; EBITS margin to drive Group marginFor
per
sona
l use
onl
y

89
#1 Imported Wine Business in Asia by
Volume & Value; Preserving 30-35%
EBITS MarginRobert Foye – President & MD, Asia & Europe
For
per
sona
l use
onl
y
90
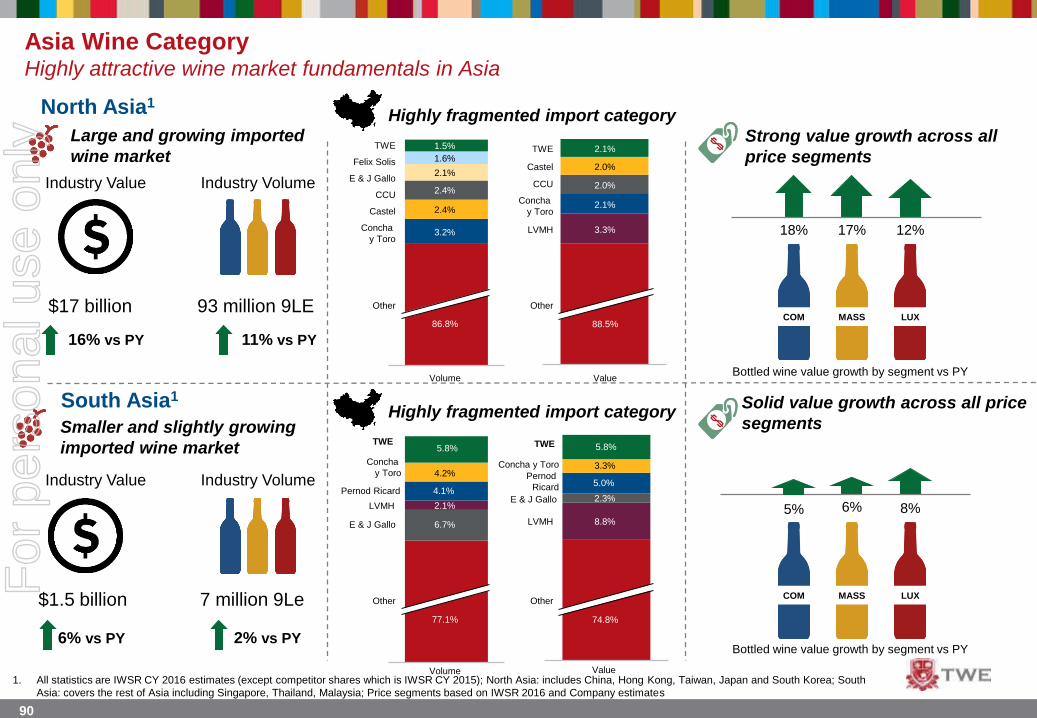
Asia Wine CategoryHighly attractive wine market fundamentals in Asia
1. All statistics are IWSR CY 2016 estimates (except competitor shares which is IWSR CY 2015); North Asia: includes China, Hong Kong, Taiwan, Japan and South Korea; South
Asia: covers the rest of Asia including Singapore, Thailand, Malaysia; Price segments based on IWSR 2016 and Company estimates
North Asia1
South Asia1
Large and growing imported
wine market
Smaller and slightly growing
imported wine market
$17 billion
16% vs PY
Industry Value
$1.5 billion
6% vs PY
Industry Volume
11% vs PY
7 million 9Le
2% vs PY
Highly fragmented import category
Strong value growth across all
price segments
COM MASS LUX
18% 12%17%
5% 8%6%
93 million 9LE
Highly fragmented import categorySolid value growth across all price
segments
3.2%Concha
y Toro
2.4%
1.5%
Volume
CCU
TWE
2.1%
Other
1.6%
86.8%
Felix Solis
E & J Gallo
Castel 2.4%
2.0%CCU
Other
2.1%
2.1%
Concha
y Toro
LVMH
Castel
88.5%
2.0%
3.3%
TWE
Value
2.1%LVMH
Concha
y Toro 4.2%
E & J Gallo
77.1%
6.7%
5.8%
Volume
Other
4.1%
TWE
Pernod Ricard
Value
Other
LVMH
2.3%E & J Gallo
Pernod
Ricard
74.8%
TWE
Concha y Toro
5.0%
5.8%
3.3%
8.8%
Bottled wine value growth by segment vs PY
Industry Value Industry Volume
COM MASS LUX
Bottled wine value growth by segment vs PY
For
per
sona
l use
onl
y
91
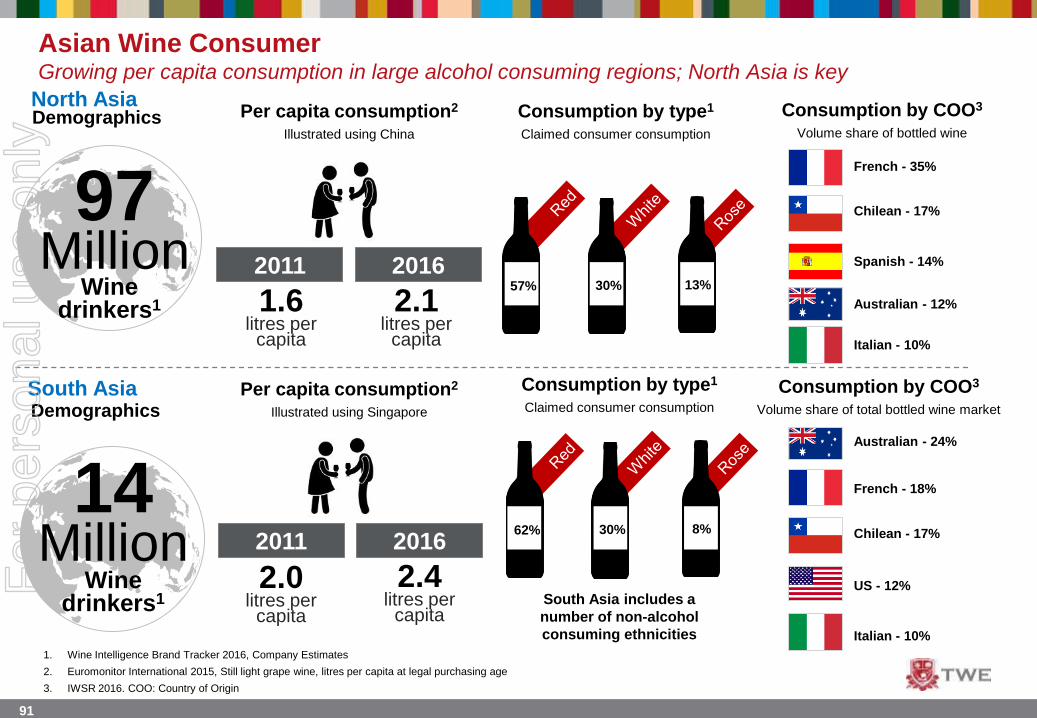
Asian Wine Consumer Growing per capita consumption in large alcohol consuming regions; North Asia is key
North Asia
South Asia
97Million
Wine drinkers1
Per capita consumption2
Illustrated using ChinaDemographics
2.1litres per
capita
Consumption by type1
Claimed consumer consumption
Consumption by COO3
Volume share of bottled wine
30% 13%57%
Demographics Per capita consumption2
Illustrated using Singapore
14Million
Wine drinkers1
2.4litres per
capitaSouth Asia includes a
number of non-alcohol
consuming ethnicities
30% 8%62%
French - 35%
Chilean - 17%
Spanish - 14%
Italian - 10%
Australian - 12%
Australian - 24%
Chilean - 17%
French - 18%
Italian - 10%
US - 12%
1.6litres per
capita
2.0litres per
capita
2011 2016
2011 2016
1. Wine Intelligence Brand Tracker 2016, Company Estimates
2. Euromonitor International 2015, Still light grape wine, litres per capita at legal purchasing age
3. IWSR 2016. COO: Country of Origin
Consumption by COO3
Volume share of total bottled wine market
Consumption by type1
Claimed consumer consumption
For
per
sona
l use
onl
y

92
Asian Wine Market Traditional retail format remains dominant channel; on-premise continues to be important
North Asia – Illustrated using China
South Asia – Illustrated using Singapore
Wine industry sales by channel1
Wine industry sales by channel1
~50%Bricks & Mortar Retail
~30%On-premise
~10%E - Commerce
~10%Direct to
Consumer
~65%Bricks & Mortar Retail
~30%On-premise
~5%E - Commerce
>1%Direct to
Consumer
1. IWSR 2015; Global U&A (TLE 2016); Company estimates
For
per
sona
l use
onl
y
93
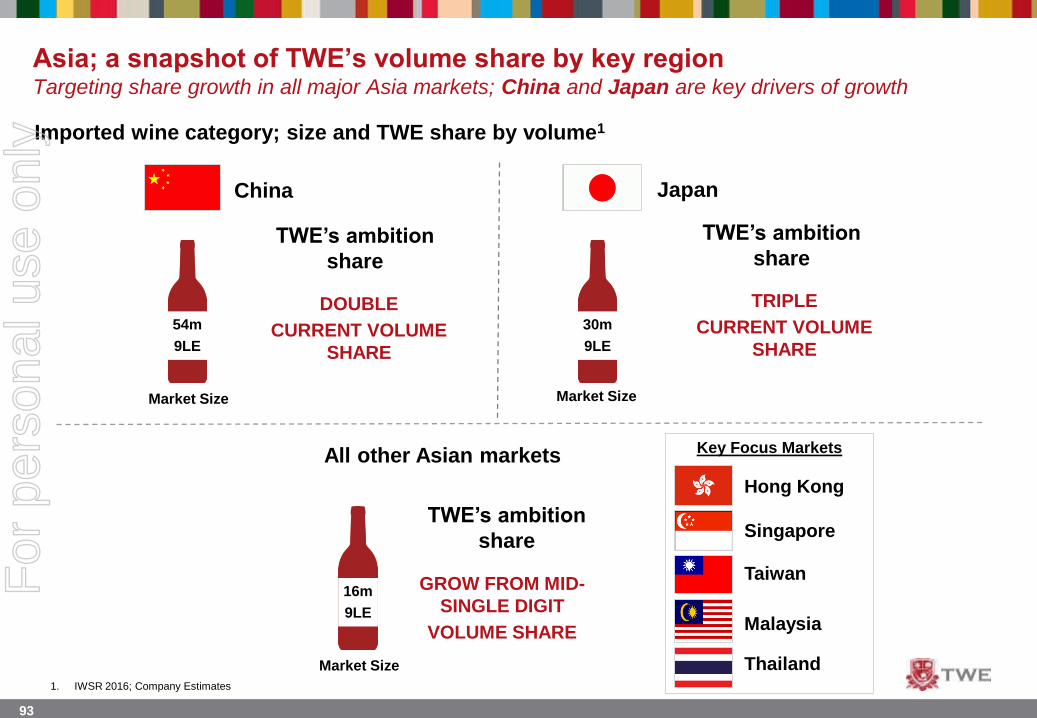
Key Focus Markets
1. IWSR 2016; Company Estimates
Asia; a snapshot of TWE’s volume share by key regionTargeting share growth in all major Asia markets; China and Japan are key drivers of growth
China
Market Size
54m
9LE
1.6% 3%
TWE’s ambition
share
Japan
Market Size
30m
9LE
0.4% 3%
Market Size
16m
9LE
5% 6%Taiwan
Singapore
Hong Kong
Thailand
Malaysia
All other Asian markets
Imported wine category; size and TWE share by volume1
DOUBLE
CURRENT VOLUME
SHARE
TWE’s ambition
share
TRIPLE
CURRENT VOLUME
SHARE
TWE’s ambition
share
GROW FROM MID-
SINGLE DIGIT
VOLUME SHARE
For
per
sona
l use
onl
y
94
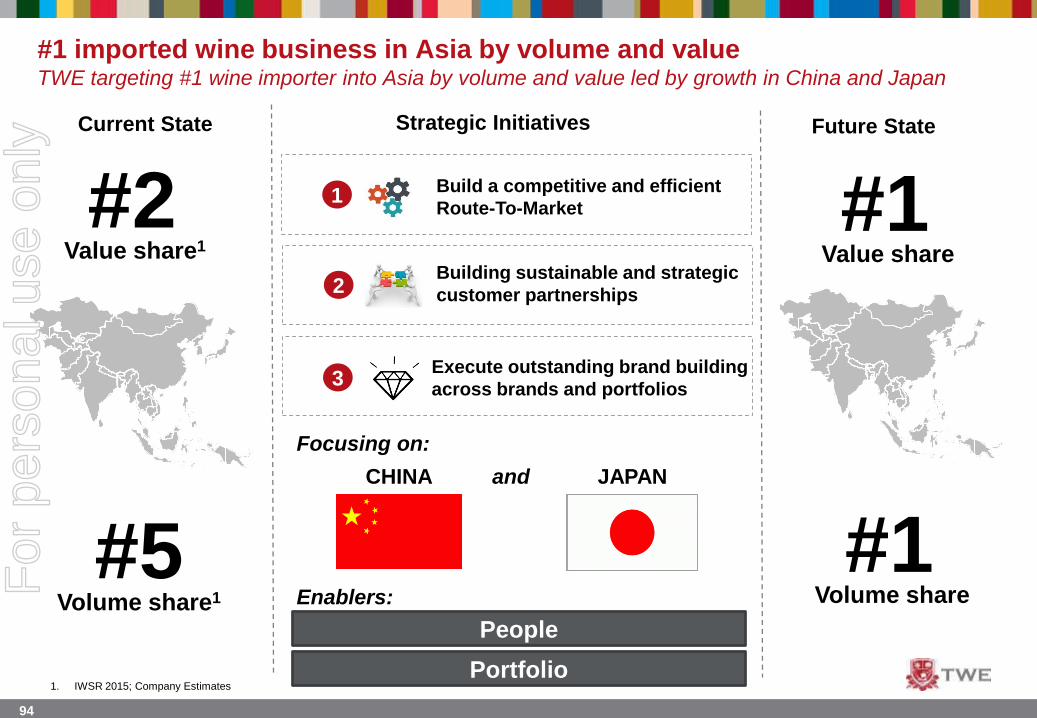
#1 imported wine business in Asia by volume and valueTWE targeting #1 wine importer into Asia by volume and value led by growth in China and Japan
Current State Future StateStrategic Initiatives
#22
Building sustainable and strategic
customer partnerships
1Build a competitive and efficient
Route-To-Market
Value share1
#5Volume share1
#1Value share
#1Volume share
3Execute outstanding brand building
across brands and portfolios
Focusing on:
Enablers:
People
Portfolio
CHINA and JAPAN
1. IWSR 2015; Company Estimates
For
per
sona
l use
onl
y

95
Leverage distribution
infrastructure to diversify brand
portfolio
Expand into strategically
important cities to drive sustainable
growth and deeper partnerships
Establish relationships with a growing customer
base
1Build a competitive and efficient Route-To-Market in ChinaTWE’s “concentric-circle” approach to expansion in China
Concentric circle model driving volume growth TWE’s current and future distribution footprint
TWE’s current geographic footprint
TWE’s targeted geographic footprint
High
Med
Low
Distribution coverage
Tier 1 and 2 Cities
100
Tier 1,2 and 3 Cities
150
The goal is to be as close to customers and consumers as possible
For
per
sona
l use
onl
y

96
1 Build a competitive and efficient Route-To-Market in ChinaGrowing TWE’s distribution footprint across Retail, E-Commerce and On-premise
Bricks and Mortar Retail
Channel
80%F16 NSR Contribution
E-Commerce
Channel
On premise
Channel
10%F16 NSR Contribution
10%F16 NSR Contribution
Ch
an
nel
sp
lit
RMB 120Average price per bottle
Cu
sto
me
rs
600
Number of Strategic & Retail
account customers
F14
50,000+F16
Servicing # indirect accounts
15F14
30F16 1
Number of E-Commerce customers
F14
7
F16
2 Exclusive On-premise distributors
Servicing:
1,600F14
1,600F16
Accounts Accounts
RMB 180Average price per bottle
Number of direct customers
RMB < 100Average price per bottle
For
per
sona
l use
onl
y
97
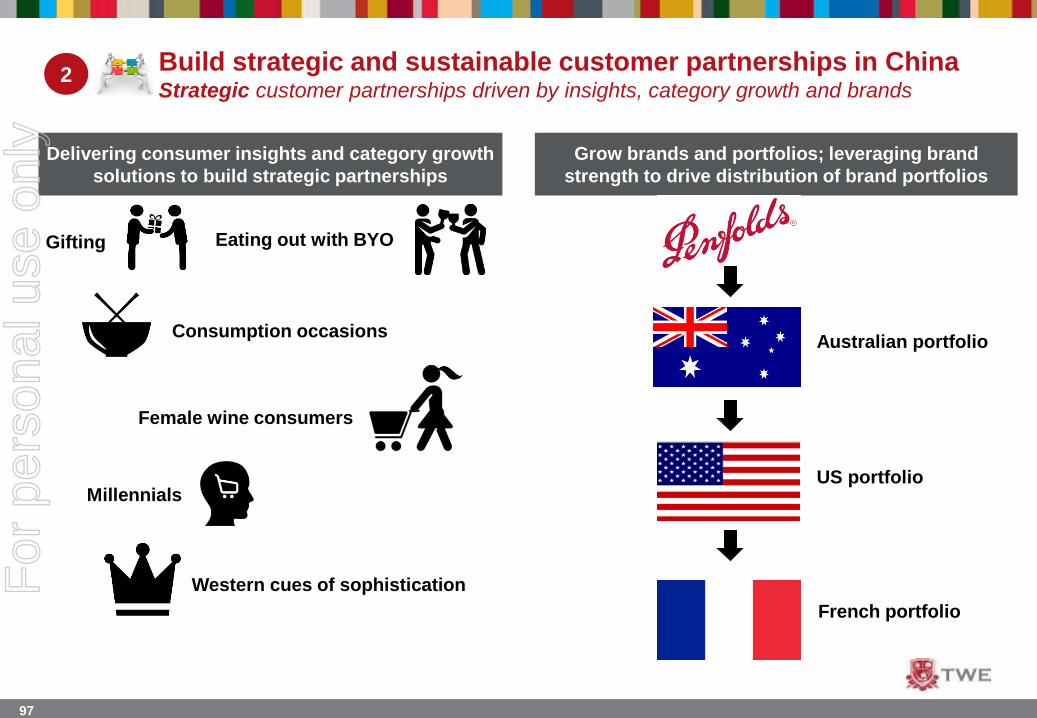
2Build strategic and sustainable customer partnerships in ChinaStrategic customer partnerships driven by insights, category growth and brands
Grow brands and portfolios; leveraging brand
strength to drive distribution of brand portfolios
Delivering consumer insights and category growth
solutions to build strategic partnerships
Gifting
Consumption occasions
Eating out with BYO
Female wine consumers
Millennials
Western cues of sophistication
Australian portfolio
US portfolio
French portfolio
For
per
sona
l use
onl
y
98
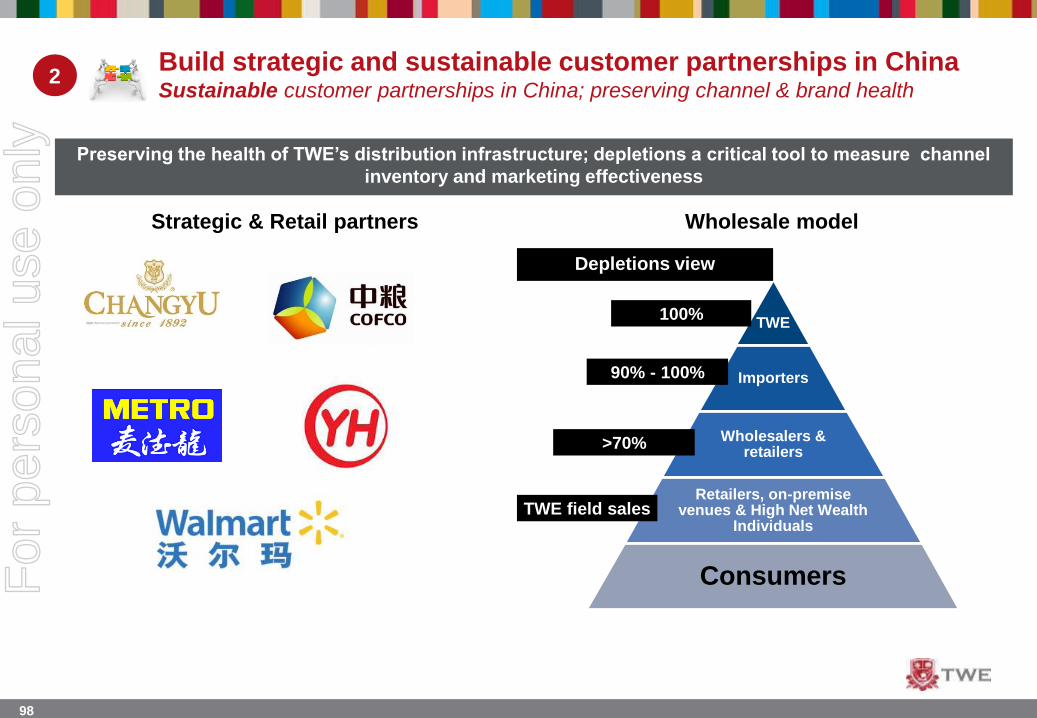
TWE
Importers
Wholesalers & retailers
Retailers, on-premisevenues & High Net Wealth
Individuals
Consumers
100%
90% - 100%
>70%
TWE field sales
2Build strategic and sustainable customer partnerships in ChinaSustainable customer partnerships in China; preserving channel & brand health
Preserving the health of TWE’s distribution infrastructure; depletions a critical tool to measure channel
inventory and marketing effectiveness
Depletions view
Wholesale modelStrategic & Retail partners
For
per
sona
l use
onl
y
99
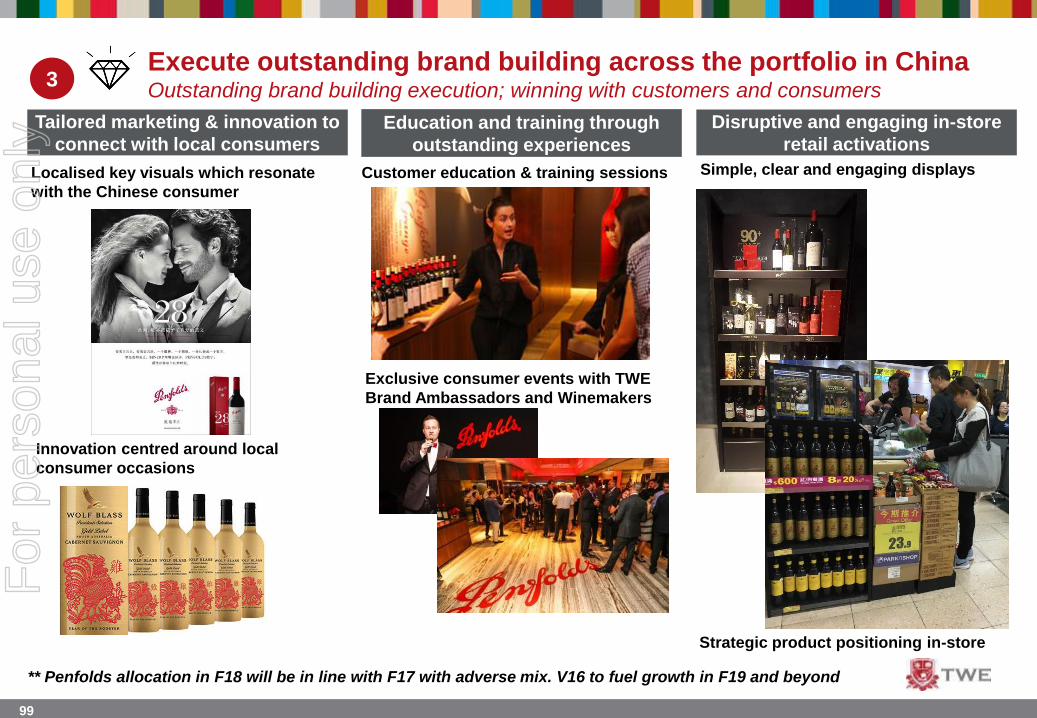
3Execute outstanding brand building across the portfolio in ChinaOutstanding brand building execution; winning with customers and consumers
1.6%
45m
9LE
Disruptive and engaging in-store
retail activations Education and training through
outstanding experiences
Localised key visuals which resonate
with the Chinese consumer
Simple, clear and engaging displaysCustomer education & training sessions
Exclusive consumer events with TWE
Brand Ambassadors and Winemakers
Tailored marketing & innovation to
connect with local consumers
Strategic product positioning in-store
Innovation centred around local
consumer occasions
** Penfolds allocation in F18 will be in line with F17 with adverse mix. V16 to fuel growth in F19 and beyond
For
per
sona
l use
onl
y
100
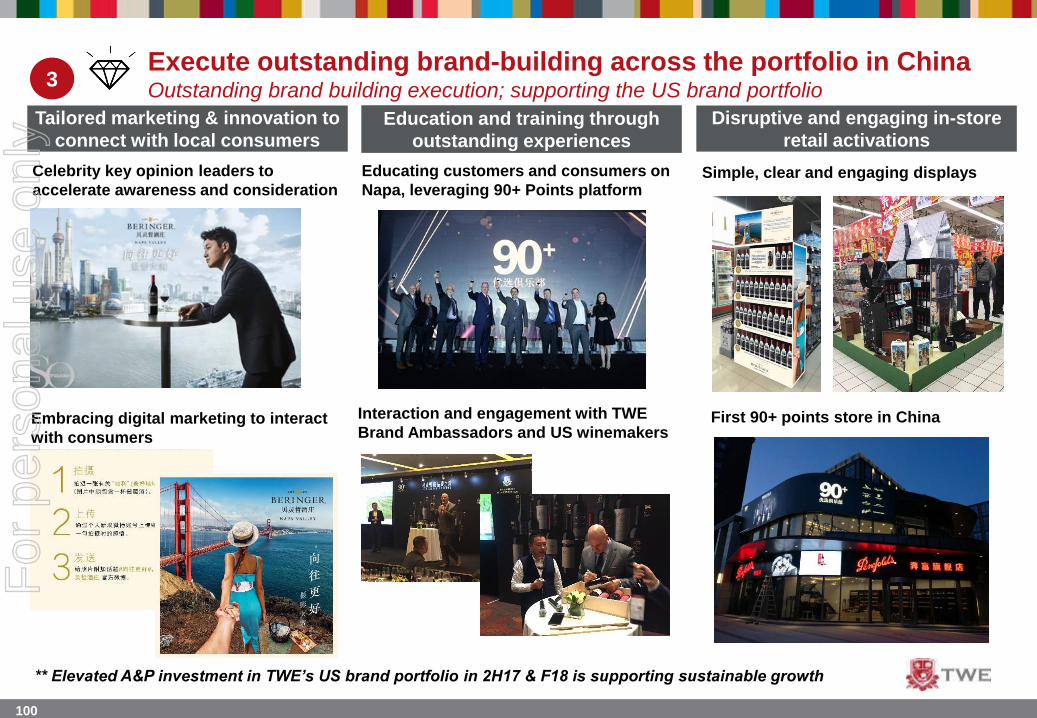
3Execute outstanding brand-building across the portfolio in ChinaOutstanding brand building execution; supporting the US brand portfolio
Educating customers and consumers on
Napa, leveraging 90+ Points platform
Interaction and engagement with TWE
Brand Ambassadors and US winemakersFirst 90+ points store in China
Disruptive and engaging in-store
retail activations Education and training through
outstanding experiences
Tailored marketing & innovation to
connect with local consumers
Celebrity key opinion leaders to
accelerate awareness and consideration
Embracing digital marketing to interact
with consumers
Simple, clear and engaging displays
** Elevated A&P investment in TWE’s US brand portfolio in 2H17 & F18 is supporting sustainable growth
For
per
sona
l use
onl
y
101
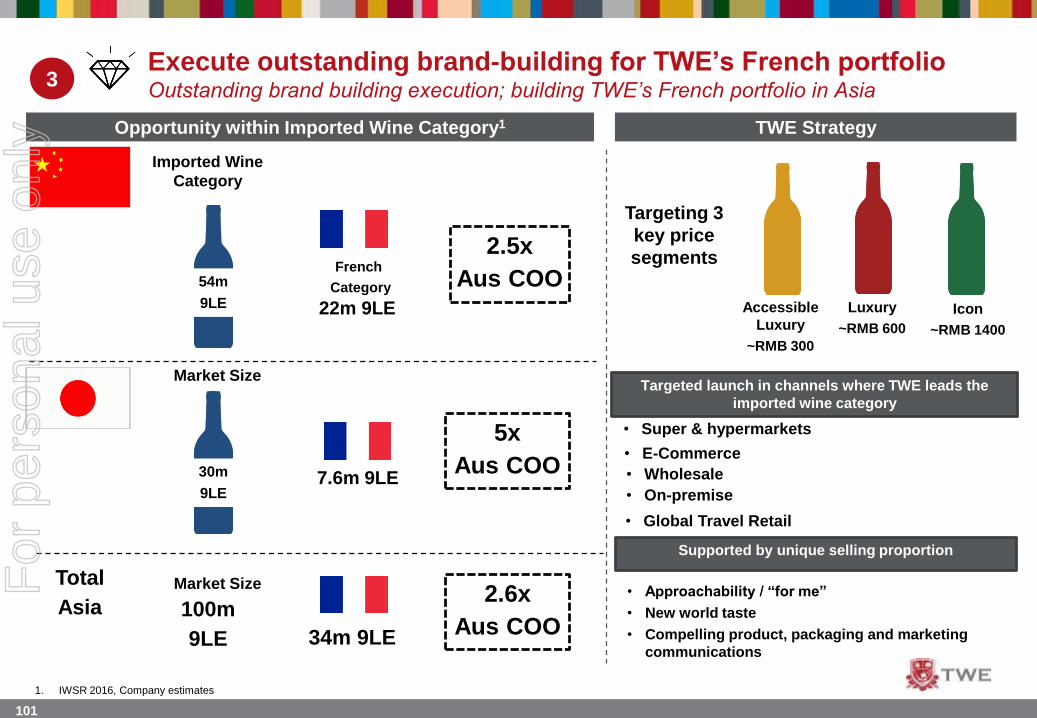
3Execute outstanding brand-building for TWE’s French portfolioOutstanding brand building execution; building TWE’s French portfolio in Asia
Opportunity within Imported Wine Category1
54m
9LE
Market Size
Imported Wine
Category
French
Category
22m 9LE
2.5x
Aus COO
30m
9LE
Market Size
7.6m 9LE
5x
Aus COO
Total
Asia 100m
9LE 34m 9LE
TWE Strategy
Targeting 3
key price
segments
Accessible
Luxury
~RMB 300
Luxury
~RMB 600
Icon
~RMB 1400
Targeted launch in channels where TWE leads the
imported wine category
Supported by unique selling proportion
• Super & hypermarkets
• E-Commerce
• On-premise
• Wholesale
• Global Travel Retail
• Approachability / “for me”
• New world taste
• Compelling product, packaging and marketing
communications
1. IWSR 2016, Company estimates
2.6x
Aus COO
For
per
sona
l use
onl
y
102
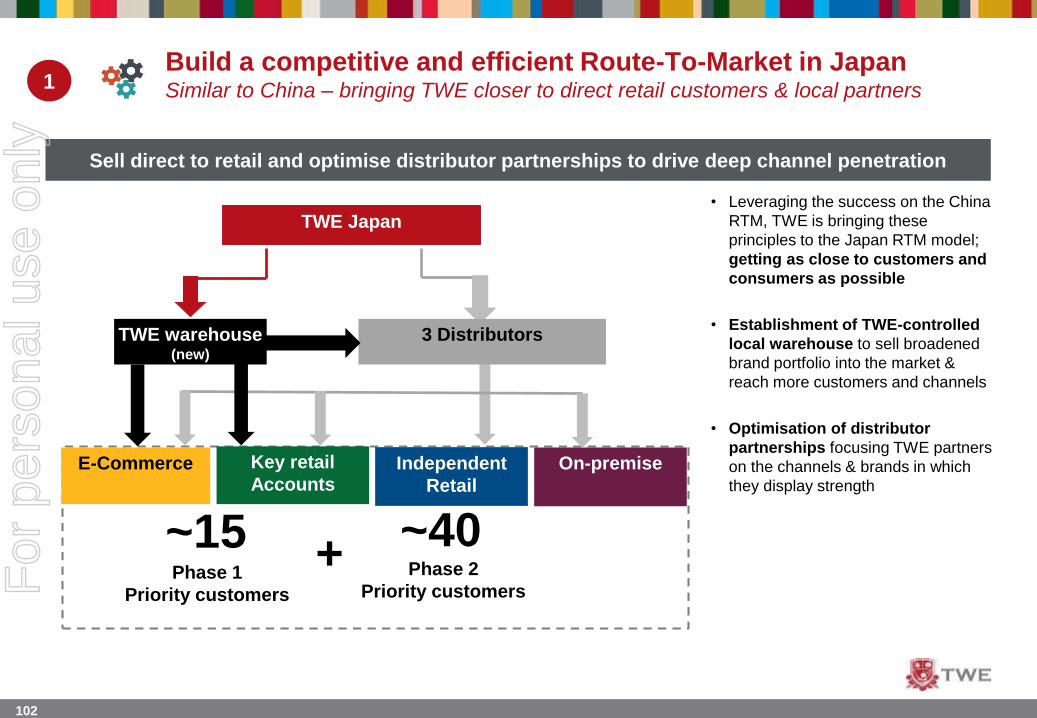
1Build a competitive and efficient Route-To-Market in JapanSimilar to China – bringing TWE closer to direct retail customers & local partners
Sell direct to retail and optimise distributor partnerships to drive deep channel penetration
Phase 1
Priority customers
~15 ~40Phase 2
Priority customers
+
• New Route-To-Market;
establishment of direct model
with key account salesforce
• Build TWE Japan
warehouse model to sell
direct to retail and wholesale
network
• Leveraging the success on the China
RTM, TWE is bringing these
principles to the Japan RTM model;
getting as close to customers and
consumers as possible
• Establishment of TWE-controlled
local warehouse to sell broadened
brand portfolio into the market &
reach more customers and channels
• Optimisation of distributor
partnerships focusing TWE partners
on the channels & brands in which
they display strength
TWE Japan
TWE warehouse(new)
3 Distributors
E-Commerce Key retail
AccountsIndependent
Retail
On-premise
For
per
sona
l use
onl
y

103
2Build strategic and sustainable customer partnerships in JapanStrategic customer partnerships supported by insights and portfolio breadth
Diversify brand portfolio in Japan to deliver growth
for TWE and its customers
MARKETING FOCUSED MORE ON BRANDS
RATHER THAN COUNTRIES OF ORIGIN
Delivering consumer insights to build strategic
partnerships – 4 common category growth insights
Relax & Unwind
Wine Lovers
GiftingMeals
For
per
sona
l use
onl
y
104
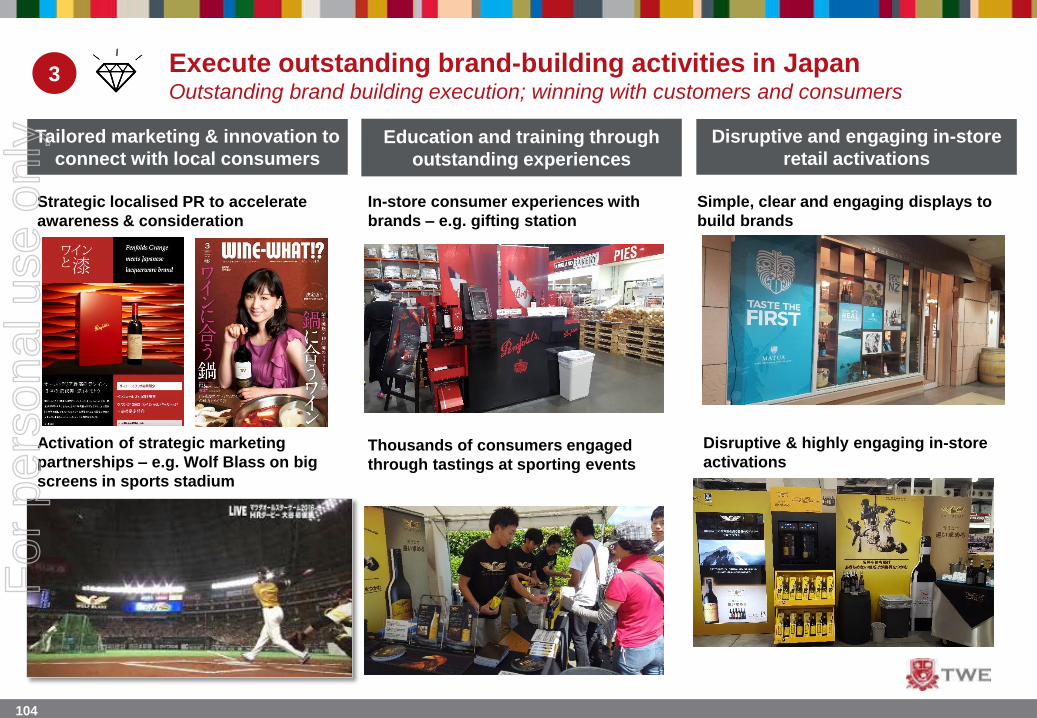
3 Execute outstanding brand-building activities in JapanOutstanding brand building execution; winning with customers and consumers
Disruptive and engaging in-store
retail activations Education and training through
outstanding experiences
Tailored marketing & innovation to
connect with local consumers
Activation of strategic marketing
partnerships – e.g. Wolf Blass on big
screens in sports stadium
Disruptive & highly engaging in-store
activations
Simple, clear and engaging displays to
build brands
In-store consumer experiences with
brands – e.g. gifting station
Thousands of consumers engaged
through tastings at sporting events
Strategic localised PR to accelerate
awareness & consideration
For
per
sona
l use
onl
y
105
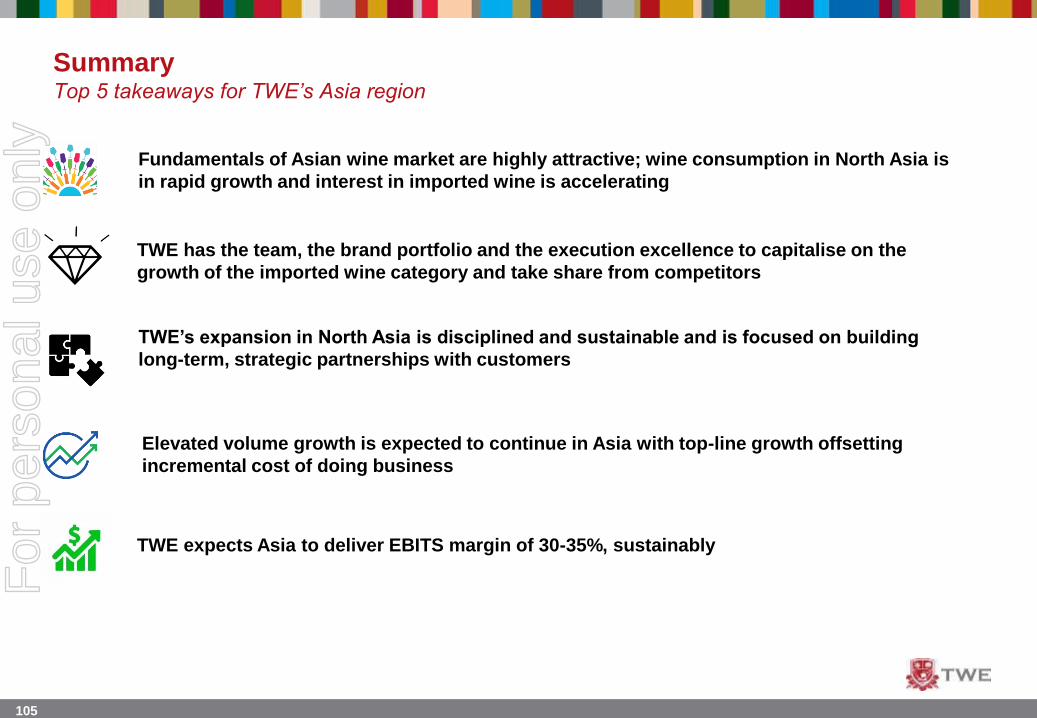
Fundamentals of Asian wine market are highly attractive; wine consumption in North Asia is
in rapid growth and interest in imported wine is accelerating
TWE has the team, the brand portfolio and the execution excellence to capitalise on the
growth of the imported wine category and take share from competitors
SummaryTop 5 takeaways for TWE’s Asia region
TWE expects Asia to deliver EBITS margin of 30-35%, sustainably
TWE’s expansion in North Asia is disciplined and sustainable and is focused on building
long-term, strategic partnerships with customers
Elevated volume growth is expected to continue in Asia with top-line growth offsetting
incremental cost of doing business
For
per
sona
l use
onl
y

106
QUESTIONS
For
per
sona
l use
onl
y
107
TWE’s journey from Agri to Brand-ledKey takeaways from today
1
2 Our core asset is our organisational talent
3
4
5 Premiumisation & allocations ensure shareholders earn more than a standard glass return
6 Market share gains and premiumisation will deliver volume and value growth in ANZ
7
9
8 Protecting double digit EBITS margin is Europe’s priority
TWE is on a journey from Agri to Brand-led
We are building brand portfolios; one portfolio at a time. TWE launching French portfolio
Supply will meet demand sustainably, safely and simply
Asia will grow by volume & value and our 30-35% EBITS margin will be preserved
Shifting from Fixing to Growth in the US is in play; EBITS margin to drive Group marginFor
per
sona
l use
onl
y

108
An Optimised Business Delivering
Double Digit EBITS MarginRobert Foye – President & MD, Asia & Europe
For
per
sona
l use
onl
y
109
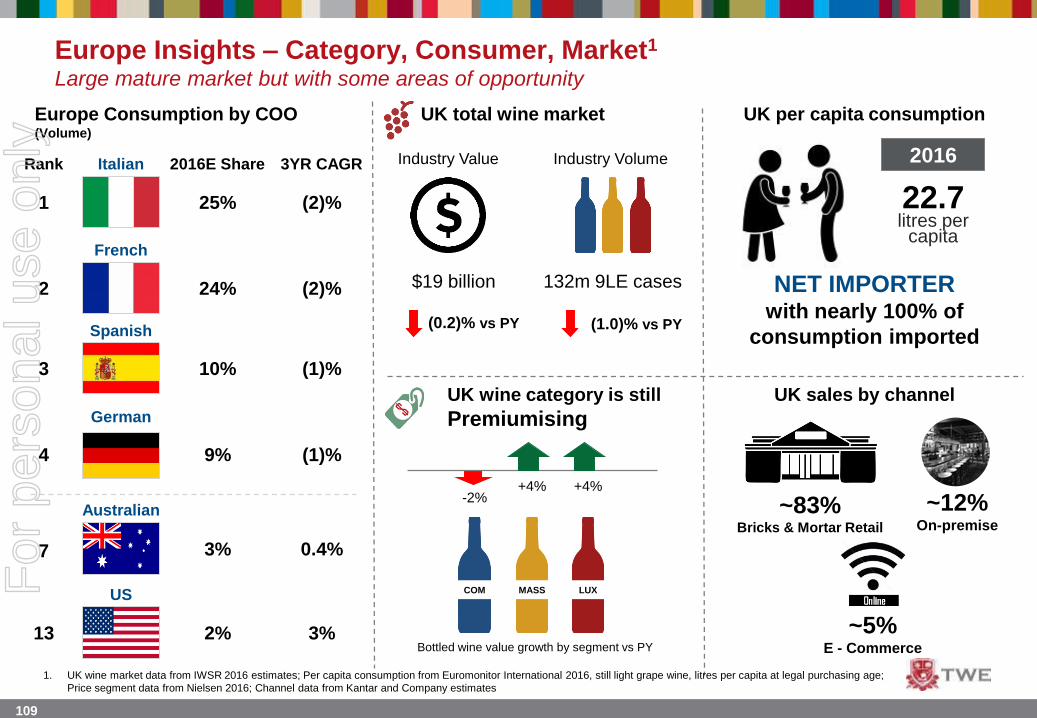
Europe Insights – Category, Consumer, Market1
Large mature market but with some areas of opportunity
UK total wine market
$19 billion
(0.2)% vs PY
Industry Value Industry Volume
132m 9LE cases
(1.0)% vs PY
UK wine category is still
Premiumising
-2%+4%+4%
UK per capita consumption
22.7litres per
capita
UK sales by channel
NET IMPORTERwith nearly 100% of
consumption imported
~83%Bricks & Mortar Retail
~12%On-premise
~5%E - Commerce
1. UK wine market data from IWSR 2016 estimates; Per capita consumption from Euromonitor International 2016, still light grape wine, litres per capita at legal purchasing age;
Price segment data from Nielsen 2016; Channel data from Kantar and Company estimates
Europe Consumption by COO (Volume)
0.4%3%
Australian
Italian
25%
24% (2)%
French
3%
US
2%
Spanish
10%
(2)%
(1)%
COM MASS LUX
2016E Share 3YR CAGR
Bottled wine value growth by segment vs PY
7
1
2
13
3
Rank
German
9% (1)%4
2016
For
per
sona
l use
onl
y
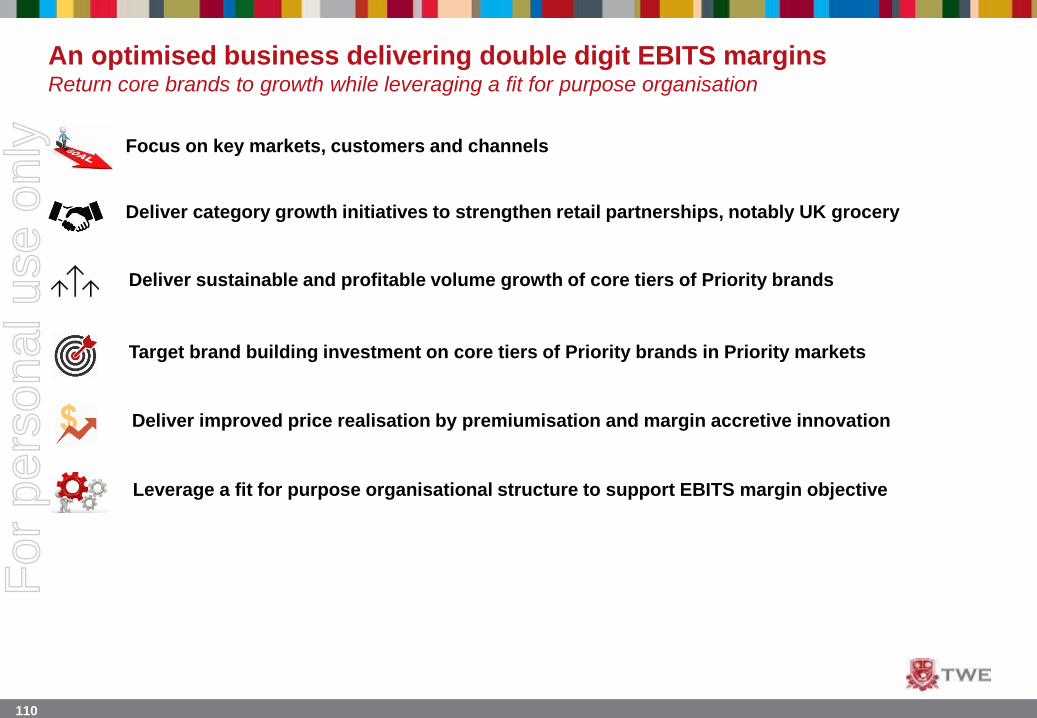
110
An optimised business delivering double digit EBITS marginsReturn core brands to growth while leveraging a fit for purpose organisation
Deliver sustainable and profitable volume growth of core tiers of Priority brands
Target brand building investment on core tiers of Priority brands in Priority markets
Deliver improved price realisation by premiumisation and margin accretive innovation
Deliver category growth initiatives to strengthen retail partnerships, notably UK grocery
Leverage a fit for purpose organisational structure to support EBITS margin objective
Focus on key markets, customers and channels
For
per
sona
l use
onl
y

111
QUESTIONS
For
per
sona
l use
onl
y

112
TWE’s journey from Agri to Brand-ledKey takeaways from today
1
2 Our core asset is our organisational talent
3
4
5 Premiumisation & allocations ensure shareholders earn more than a standard glass return
6 Market share gains and premiumisation will deliver volume and value growth in ANZ
7
9
8 Protecting double digit EBITS margin is Europe’s priority
TWE is on a journey from Agri to Brand-led
We are building brand portfolios; one portfolio at a time. TWE launching French portfolio
Supply will meet demand sustainably, safely and simply
Asia will grow by volume & value and our 30-35% EBITS margin will be preserved
Shifting from Fixing to Growth in the US is in play; EBITS margin to drive Group marginFor
per
sona
l use
onl
y
113
From Fixing To Growth; Americas to
help drive Group EBITS marginBob Spooner – President, Americas
For
per
sona
l use
onl
y

114
$11.6b
Other, 55% Other, 48%
STE Michelle, 4%STE Michelle, 3%
E&J Gallo, 15%E&J Gallo, 19%
Trinchero, 6% Trinchero, 7%
Constellation, 15% Constellation, 17%
TWE, 5% TWE, 6%
Value Volume
Americas wine categoryHighly attractive market fundamentals; large wine market, growing and premiumising
Buoyant wine market in volume and value
growth
Industry Value
$5.8b
Industry Volume
108m 9LE cases
+3 %1 +1% 1+3%2 +3%2
Fragmented bottled wine market (US market)3
$10 -
$20> $20
(1)% 8%7%
US Wine category is Premiumising
44m 9LE cases
$4-
$8
Value share by Luxury / Masstige and
Commercial1Bottled wine value growth by price segment vs PY3
1. IRI Market Advantage, Table $4+ excluding Box and Aseptic Wine Size Package, 52 weeks ending January 2017, Total Multi Outlet + Liquor and Company estimates
2. Aztec Sales Data I Off-premise Channel I Bottled Wine Only I Weighted MAT 52 weeks ending December 2016
3. IRI Market Advantage, Table $4+, Still table wine only, 52 weeks ending January 2017
Luxury, 10%
Masstige, 42%
Commercial, 48%
For
per
sona
l use
onl
y

115
US wine consumer Large wine market with growing per capita consumption and frequency
Comparatively low per capita consumption;
high frequency
Large and growing wine market
11.8
Red wine remains most popular
wine by value3
US wines remain dominant Country of Origin,
supplemented by Italian and Australian3
52% 6%42%
93MillionAmericans drink wine1
40%Of the adult population1
2016
54% of wine consumers
drink wine at least
twice a week1
2016
Litres per capita2
Australian
21%
2011
11.3Litres per capita2
1. Wine Intelligence Brand Tracker 2016
2. Euromonitor International 2016, Still Light Grape Wine
litres per capita at legal purchasing age
3. Nielsen Beverage Alcohol Review 2015, xAOC + Liq
Plus + Conv + Military; 52 weeks ending January
2017
Sauvignon Blanc is the fastest growing
varietal by value vs PY3
Sauvignon
Blanc
Value growth: +13%
Value share: 6%
Red Blends Pinot Noir
Cabernet Sauvignon Pinot Gris
Value growth: +10%
Value share: 13%
Value growth: +9%
Value share: 7%
Value growth: +8%
Value share: 16%
Value growth: +8%
Value share: 9%
New Zealand
10%
Value share of imported wine category
Italian
31%
Argentinian
12%
Value share of Total Wine Category
US
74%
Imported Wine
26%
For
per
sona
l use
onl
y
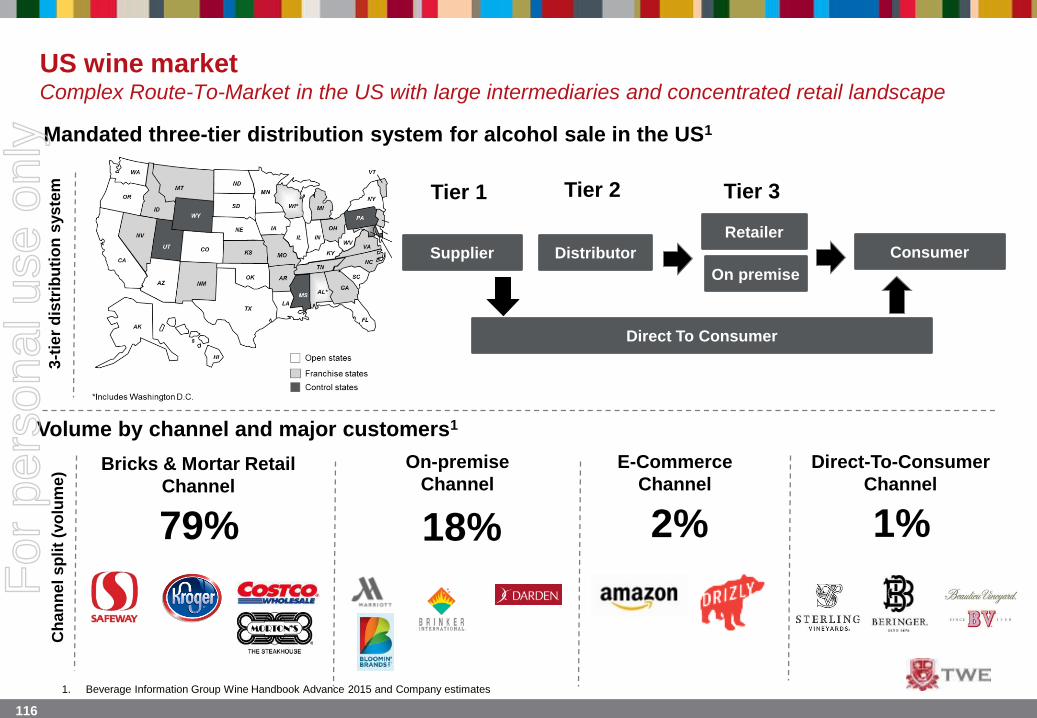
116
US wine market Complex Route-To-Market in the US with large intermediaries and concentrated retail landscape
Mandated three-tier distribution system for alcohol sale in the US1
Volume by channel and major customers1
E-Commerce
Channel
On-premise
Channel
Direct-To-Consumer
Channel
79% 18% 2% 1%
Ch
an
nel
sp
lit
(vo
lum
e)
3-t
ier
dis
trib
uti
on
sys
tem Tier 1 Tier 2 Tier 3
Supplier Distributor
Retailer
On premise
Consumer
Direct To Consumer
1. Beverage Information Group Wine Handbook Advance 2015 and Company estimates
Bricks & Mortar Retail
Channel
For
per
sona
l use
onl
y
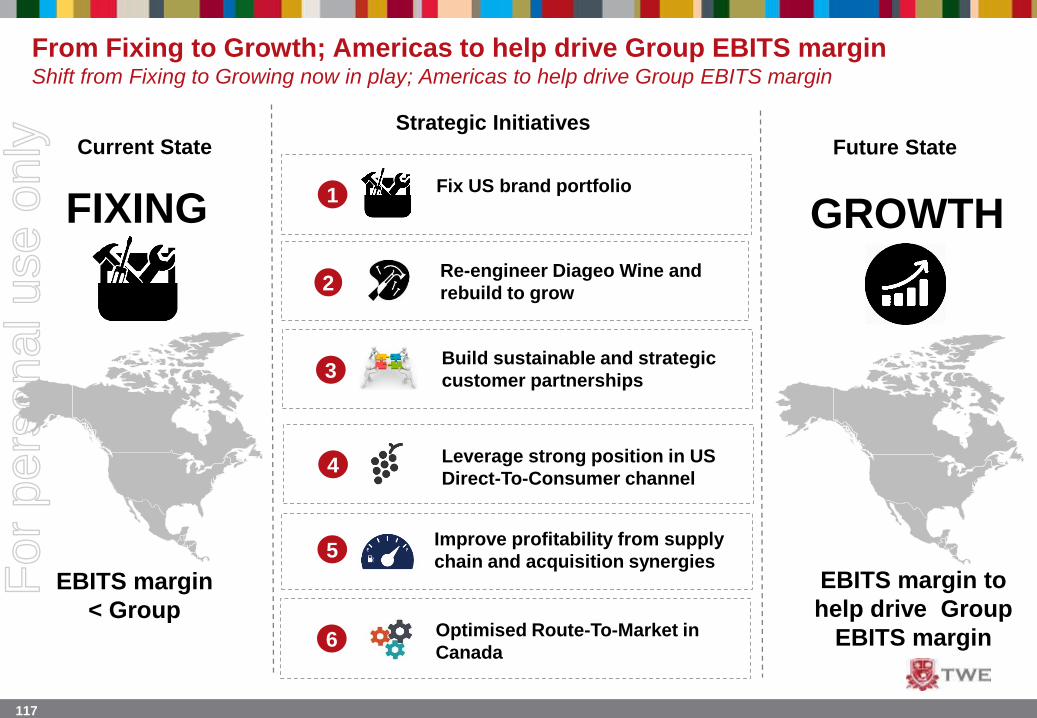
117
Strategic Initiatives
3Build sustainable and strategic
customer partnerships
1Fix US brand portfolio
From Fixing to Growth; Americas to help drive Group EBITS marginShift from Fixing to Growing now in play; Americas to help drive Group EBITS margin
Current State
FIXING
Future State
GROWTH
4
5Improve profitability from supply
chain and acquisition synergies
2Re-engineer Diageo Wine and
rebuild to grow
Leverage strong position in US
Direct-To-Consumer channel
EBITS margin
< Group
EBITS margin to
help drive Group
EBITS margin6Optimised Route-To-Market in
Canada
For
per
sona
l use
onl
y

118
1 Fix US brand portfolioReposition TWE’s mix and brand portfolio to enhance focus and influence with gatekeepers
Realigned portfolio mixRefreshed and repositioned
Luxury & Masstige brands
Greater focus on fewer, bigger
Commercial brands
Divestment of Non-Priority
Commercial portfolio
FromDeliberate inventory mix shift1
1H14 1H17
Acquisition of Diageo Wine
SKU rationalisation
Outsourced model for
Commercial wine
Main
& Vine
BV
Coastal
Beringer
Classics Coastal
Estates
To From To
Sterling Vineyards Chateau St Jean
19 Crimes
The Stag by St. Huberts
L / M, 60%
C, 40%
L / M, 80%
C, 20%
1. Represents Americas total inventory position. L / M: Luxury / Masstige C: Commercial
For
per
sona
l use
onl
y

119
2 Re-engineer Diageo Wine and rebuild to growThe practical aspects of re-setting and rebuilding brands
PHASE 1 PHASE 2 PHASE 3
Exited unsustainable
customer agreements
Exited and eliminated
unprofitable volume
Culled unwanted brands
Integrated people and
systems
Scaled up marketing
resources and focus
Invested in depletions at
distributor and retail to
ready channel for brand
refresh
FIXING
2H16 1H17
Showcased new packaging
and graphics with
customer partners
Commenced consumer
communication around
new promotions
Commenced customer
and consumer
communication in Asia
Commenced wine
optimisation by
allocating uplifted V16
juice to scale “growth”
brands
REBUILD TO GROW
Re-build availability at distributor and
retail customers with improved pricing
and margin structure
Scale up exports to Asia, supported by
uplifted customer and consumer brand
awareness
2H17 and BEYOND
For
per
sona
l use
onl
y
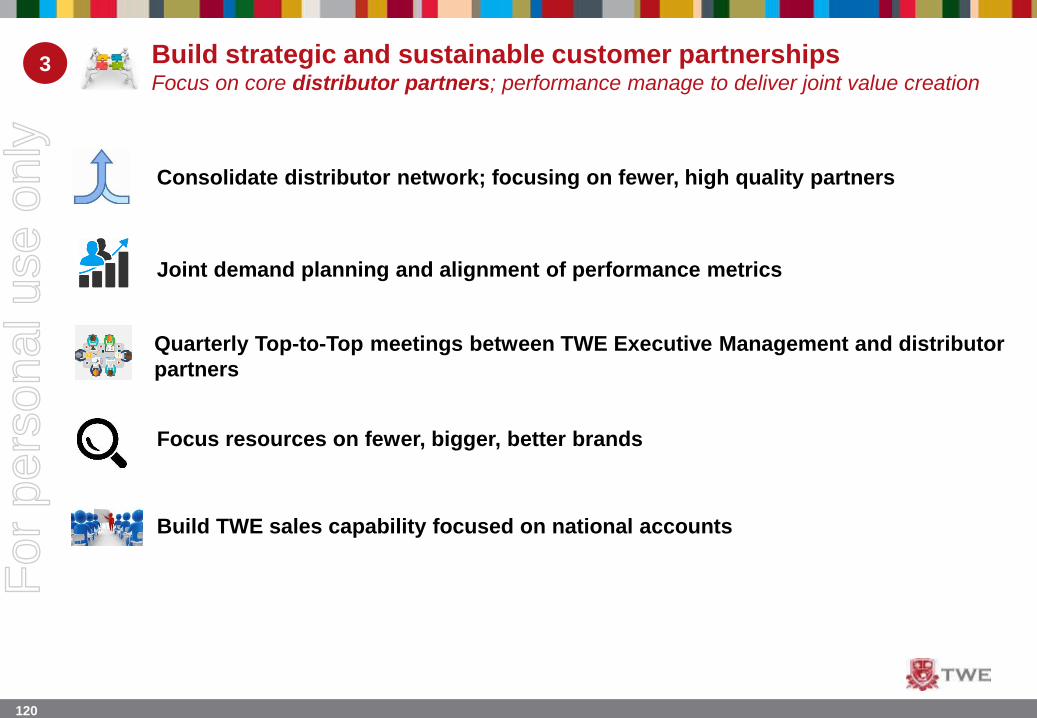
120
3 Build strategic and sustainable customer partnershipsFocus on core distributor partners; performance manage to deliver joint value creation
Consolidate distributor network; focusing on fewer, high quality partners
Joint demand planning and alignment of performance metrics
Quarterly Top-to-Top meetings between TWE Executive Management and distributor
partners
Focus resources on fewer, bigger, better brands
Build TWE sales capability focused on national accounts
For
per
sona
l use
onl
y
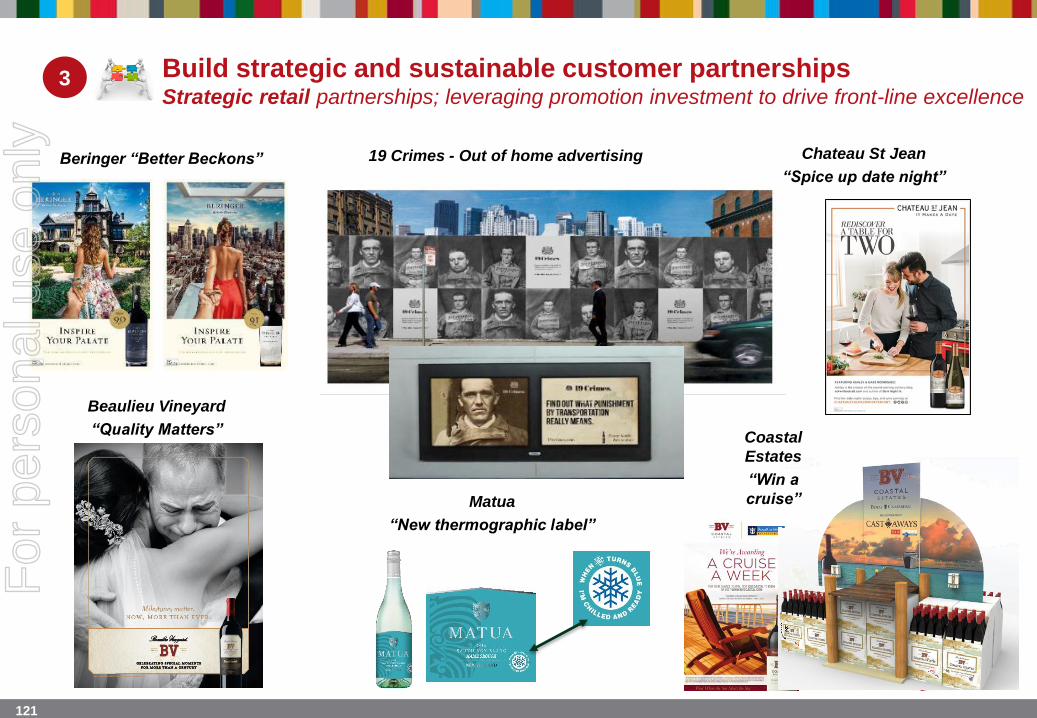
121
3 Build strategic and sustainable customer partnershipsStrategic retail partnerships; leveraging promotion investment to drive front-line excellence
Beringer “Better Beckons”
Beaulieu Vineyard
“Quality Matters”
Chateau St Jean
“Spice up date night”
19 Crimes - Out of home advertising
Matua
“New thermographic label”
Coastal
Estates
“Win a
cruise”
For
per
sona
l use
onl
y

122
4 Leverage strong position in US Direct-To-Consumer channelTWE has the assets and strategies to win in growing Direct-To-Consumer channel
TWE’s Direct-To-Consumer
footprint
Leveraging assets and strategy to
capture growth and margin DTC is in growth and is
premiumising1
1. Direct-To-Consumer Wine Shipping Report, 2016
>5m 9LE cases $2.3b
+19% v 2015
bottle price was the
fastest growing price
category in 2016$200+
Average bottle price: 2010 - 2016
Highly customised offers
with loyalty options for club
members
Leverage digital capabilities
to maximise relationships
Targeted marketing to
increase visitation
Brilliant experiences;
creating brand adorers
Invest in TWE sites; cellar
doors are the most effective
point of loyalty customer
recruitment
Visitor Demographic:
Average order value:
~370k paid tastings
$83.40
Diageo Wine acquisition
pivotal to TWE’s
industry leading DTC
footprint in the US
6 sites in Napa
1 site in Sonoma
Value Volume
+17% v 2015
For
per
sona
l use
onl
y
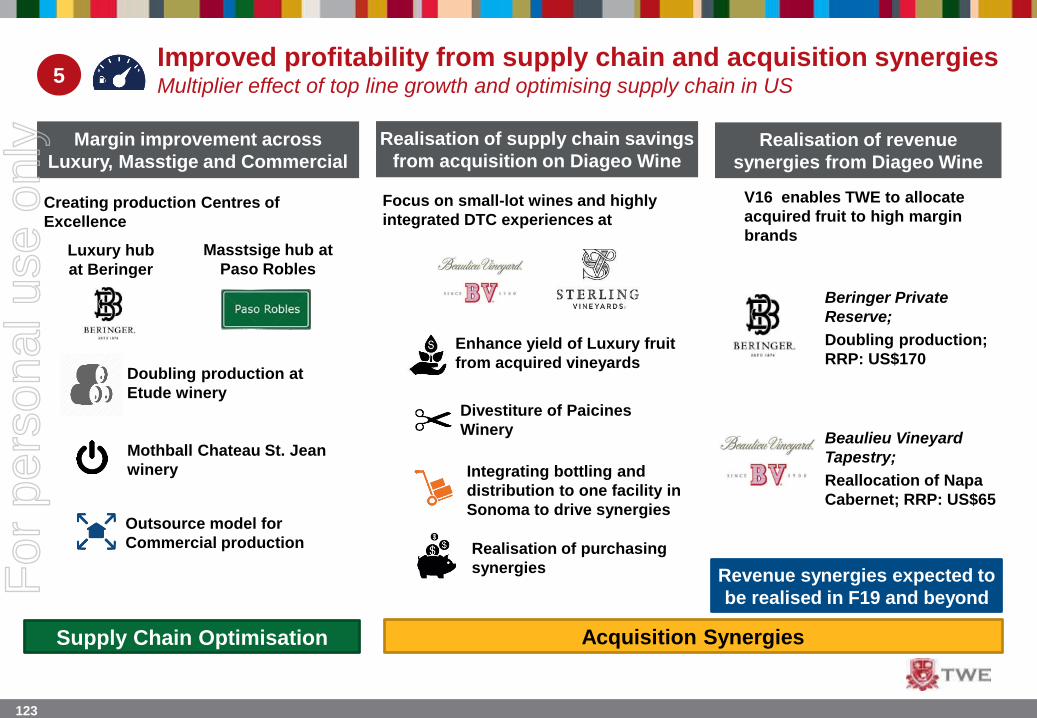
123
5Improved profitability from supply chain and acquisition synergies Multiplier effect of top line growth and optimising supply chain in US
Margin improvement across
Luxury, Masstige and Commercial
Creating production Centres of
Excellence
Luxury hub
at Beringer
Masstsige hub at
Paso Robles
Doubling production at
Etude winery
Mothball Chateau St. Jean
winery
Outsource model for
Commercial production
Realisation of supply chain savings
from acquisition on Diageo Wine
Acquisition Synergies
Realisation of revenue
synergies from Diageo Wine
Supply Chain Optimisation
Focus on small-lot wines and highly
integrated DTC experiences at
Enhance yield of Luxury fruit
from acquired vineyards
Divestiture of Paicines
Winery
Integrating bottling and
distribution to one facility in
Sonoma to drive synergies
Realisation of purchasing
synergies
V16 enables TWE to allocate
acquired fruit to high margin
brands
Beringer Private
Reserve;
Doubling production;
RRP: US$170
Beaulieu Vineyard
Tapestry;
Reallocation of Napa
Cabernet; RRP: US$65
Revenue synergies expected to
be realised in F19 and beyondFor
per
sona
l use
onl
y
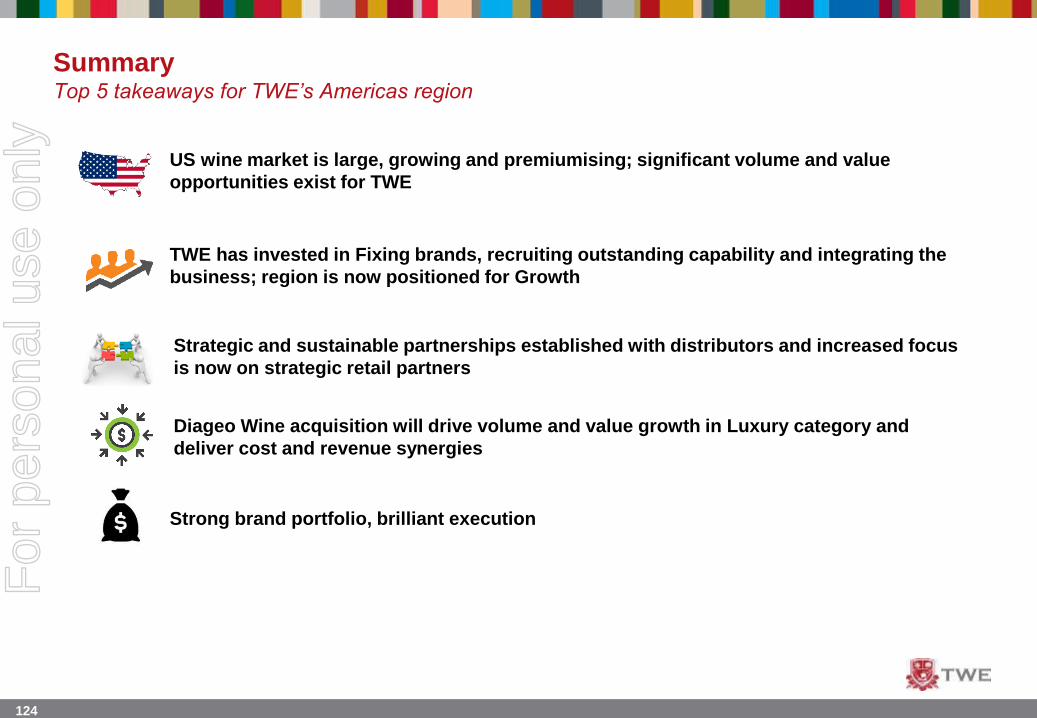
124
US wine market is large, growing and premiumising; significant volume and value
opportunities exist for TWE
TWE has invested in Fixing brands, recruiting outstanding capability and integrating the
business; region is now positioned for Growth
Diageo Wine acquisition will drive volume and value growth in Luxury category and
deliver cost and revenue synergies
SummaryTop 5 takeaways for TWE’s Americas region
Strong brand portfolio, brilliant execution
Strategic and sustainable partnerships established with distributors and increased focus
is now on strategic retail partners
For
per
sona
l use
onl
y

125
QUESTIONS
For
per
sona
l use
onl
y

126
THANK YOUMichael Clarke – Chief Executive Officer
For
per
sona
l use
onl
y
127
Disclaimer
Treasury Wine Estates (TWE) advises that this presentation contains forward looking statements which may be subject to significant
uncertainties outside of TWE’s control.
No representation is made as to the accuracy or reliability of forecasts or the assumptions on which they are based.
Actual future events may vary from these forecasts and you are cautioned not to place undue reliance on any forward looking statement.
For
per
sona
l use
onl
y