(from april 1, to september 30, 2008 ) · (from april 1, to september 30, 2008 ) forward-looking...
TRANSCRIPT

Earnings of 1H FY 2009/3(From April 1, to September 30, 2008))
FORWARD-LOOKING STATEMENTSThis document contains projections of performance and other projections, which are made based on judgments regarding currently available information and which encompass potential risks and uncertainties. Accordingly, please be aware that diverse factors may cause actual results to differ materially from projected results.
FORWARD-LOOKING STATEMENTSThis document contains projections of performance and other projections, which are made based on judgments regarding currently available information and which encompass potential risks and uncertainties. Accordingly, please be aware that diverse factors may cause actual results to differ materially from projected results.
October 30, 2008
11
-¥36.51¥89.97¥126.48Earnings per Share
-25.2-27.481.26.1%108.67.7%Operating Income*
-4.9-69.61,338.4100.0%1,408.0100.0%Revenue
%
Change
45.3
81.7
¥106¥163
3.4%
6.1%
1H FY2009/3(Apr. - Sep. 2008)
-29.8
-28.8
-¥13+¥1
-19.3
-33.0
Amount
64.6
114.7
4.6%Net Income
¥119¥162
Exchange RatesUS$
Euro€
8.2%Income Before Income Taxes
1H FY2008/3(Apr. - Sep. 2007)
Billions of yen
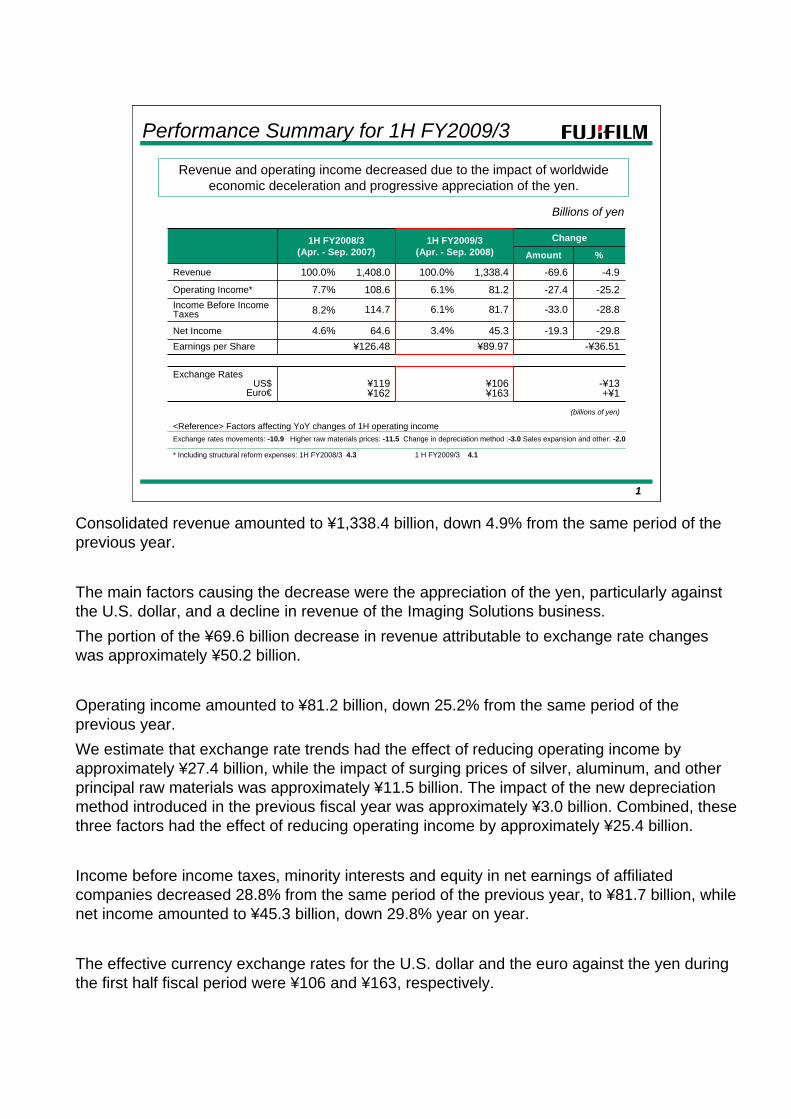
Revenue and operating income decreased due to the impact of worldwide economic deceleration and progressive appreciation of the yen.
<Reference> Factors affecting YoY changes of 1H operating incomeExchange rates movements: -10.9 Higher raw materials prices: -11.5 Change in depreciation method :-3.0 Sales expansion and other: -2.0
(billions of yen)
Performance Summary for 1H FY2009/3
* Including structural reform expenses: 1H FY2008/3 4.3 1 H FY2009/3 4.1
Consolidated revenue amounted to ¥1,338.4 billion, down 4.9% from the same period of the previous year.
The main factors causing the decrease were the appreciation of the yen, particularly against the U.S. dollar, and a decline in revenue of the Imaging Solutions business.The portion of the ¥69.6 billion decrease in revenue attributable to exchange rate changes was approximately ¥50.2 billion.
Operating income amounted to ¥81.2 billion, down 25.2% from the same period of the previous year.We estimate that exchange rate trends had the effect of reducing operating income by approximately ¥27.4 billion, while the impact of surging prices of silver, aluminum, and other principal raw materials was approximately ¥11.5 billion. The impact of the new depreciation method introduced in the previous fiscal year was approximately ¥3.0 billion. Combined, these three factors had the effect of reducing operating income by approximately ¥25.4 billion.
Income before income taxes, minority interests and equity in net earnings of affiliated companies decreased 28.8% from the same period of the previous year, to ¥81.7 billion, while net income amounted to ¥45.3 billion, down 29.8% year on year.
The effective currency exchange rates for the U.S. dollar and the euro against the yen during the first half fiscal period were ¥106 and ¥163, respectively.

22
291.7231.1
-5.910.0
Imaging Solutions
In addition to the shrinking of the color film market, sales of digital cameras declined due to drop in unit prices.Impact of yen appreciation: -¥13.5 billion
¥231.1 billion (YoY: -20.8%)
Operating income decreased owing to the impact of decline in the unit prices of digital cameras and other factors. Stubbornly high silver prices and impact of yen appreciation pressuring profitability
RevenueRevenue
Operating IncomeOperating Income
Operating Segments
Billions of yen
*Note: After elimination of intersegment transaction
1H FY’08/3(Apr.-Sept., ‘07)
Revenue* /Operating IncomeRevenue* /Operating Income
[ ]: Operating Margin( ): YoY Comparison
-¥5.9 billion (fell into the red)[3.4%]
[-2.6%]
(-20.8%)
1H FY’09/3(Apr.-Sept.,’08)
RevenueOperating Income
Next, I will explain the situation regarding the Imaging Solutions segment.
The segment was negatively affected by such factors as decliningdemand for color films and digital minilabs, intensifying competition in digital camera markets, and the appreciation of the yen. As a result, consolidated revenue in the segment amounted to ¥231.1 billion, down 20.8% from the same period of the previous fiscal year.
Amid a harsh operating environment, the segment recorded an operating loss of ¥5.9 billion, reflecting such factors as the surging prices of silver and other raw materials, the impact of yen appreciation, and a downtrend in digital camera prices.
33
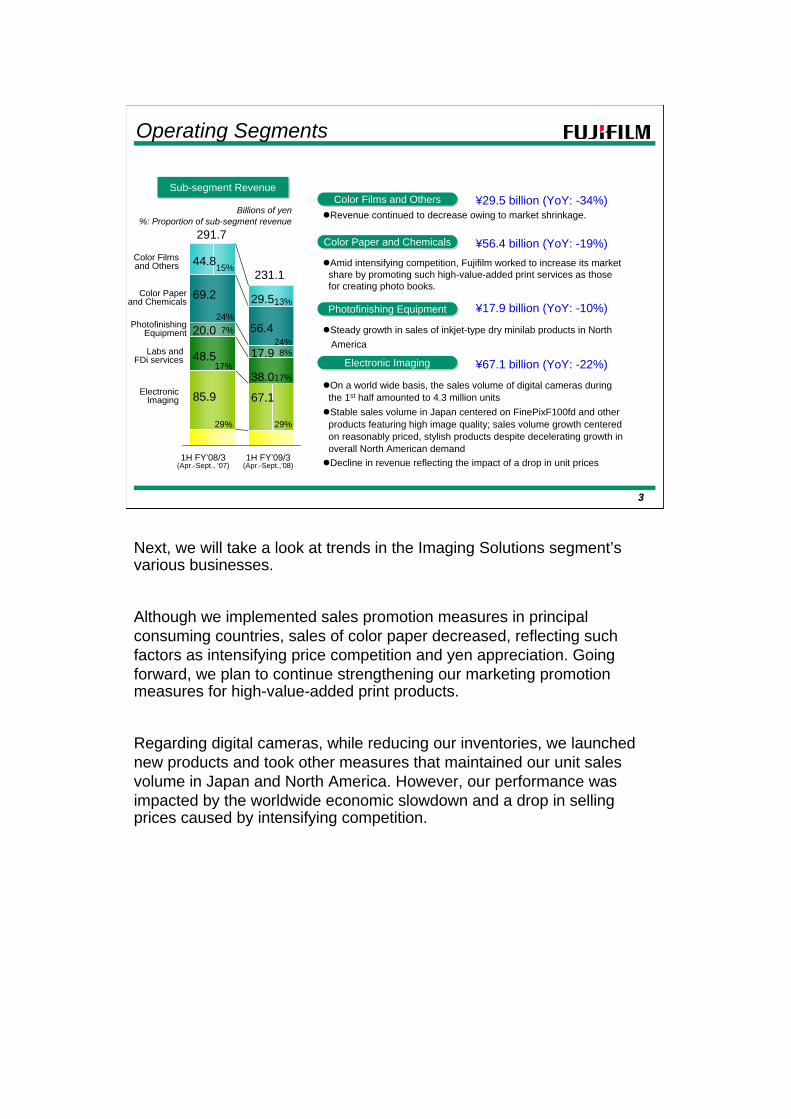
Revenue continued to decrease owing to market shrinkage.
On a world wide basis, the sales volume of digital cameras during the 1st half amounted to 4.3 million unitsStable sales volume in Japan centered on FinePixF100fd and otherproducts featuring high image quality; sales volume growth centered on reasonably priced, stylish products despite decelerating growth in overall North American demand Decline in revenue reflecting the impact of a drop in unit prices
Amid intensifying competition, Fujifilm worked to increase its market share by promoting such high-value-added print services as those for creating photo books.
Steady growth in sales of inkjet-type dry minilab products in North America
Color Films and OthersColor Films and Others
Electronic ImagingElectronic Imaging
Color Paper and ChemicalsColor Paper and Chemicals
Photofinishing EquipmentPhotofinishing Equipment
291.7
Sub-segment RevenueSub-segment Revenue
Color Filmsand Others
ElectronicImaging
Color Paperand Chemicals
PhotofinishingEquipment
Labs andFDi services
Operating Segments
Billions of yen
231.144.8
85.9
69.2
20.0
48.5
29.5
17.9
38.0
67.1
¥29.5 billion (YoY: -34%)
15%
29%
24%7%
17%
13%
29%
8%24%
17%¥67.1 billion (YoY: -22%)
¥56.4 billion (YoY: -19%)
¥17.9 billion (YoY: -10%)
%: Proportion of sub-segment revenue
56.4
1H FY’08/3(Apr.-Sept., ‘07)
1H FY’09/3(Apr.-Sept.,’08)
Next, we will take a look at trends in the Imaging Solutions segment’s various businesses.
Although we implemented sales promotion measures in principal consuming countries, sales of color paper decreased, reflecting such factors as intensifying price competition and yen appreciation. Going forward, we plan to continue strengthening our marketing promotion measures for high-value-added print products.
Regarding digital cameras, while reducing our inventories, we launched new products and took other measures that maintained our unit sales volume in Japan and North America. However, our performance was impacted by the worldwide economic slowdown and a drop in selling prices caused by intensifying competition.

44
542.6541.5
47.266.0
Information Solutions
Segment sales kept flat overall despite growth in sales of such products as flat panel display materials and lens units for camera phonesImpact of yen appreciation: -¥20.5 billion
Billions of yen
Operating Segments
¥541.5 billion (YoY: -0.2%)
*Note:After elimination of intersegment transaction
RevenueRevenue
Operating IncomeOperating Income
Revenue* /Operating IncomeRevenue* /Operating Income
Operating income decreased owing to the impact of such factors as yen appreciation and the surge in raw materials prices.
[ ]: Operating Margin( ): YoY Comparison
[12.1%]
[8.7%](-28.5%)
¥47.2 billion (YoY: -28.5% )
(-0.2%)
RevenueOperating Income
1H FY’08/3(Apr.-Sept., ‘07)
1H FY’09/3(Apr.-Sept.,’08)
The Information Solutions segment was able to increase its sales of Flat Panel Display (FPD) materials and such strong-selling optical device products as lens units for camera phones, but the segment’s consolidated revenue was approximately unchanged from the same period of the previous year, amounting to ¥541.5 billion.
Operating income for the segment was ¥47.2 billion, down 28.5% from the same period of the previous fiscal year. If we exclude the negative impact of such factors as yen appreciation, introduction of the new depreciation method, and the surging prices of aluminum, silver, and other raw materials, however, profitability was roughly the same as in the previous year.

55
Although the revisions to Japan’s national health care reimbursement system depressed demand for medical use films, sales of FCRs and picture archiving and communications systems (PACS) have expanded.Recorded robust sales overseas of newly launched Hi Resolution endoscope system products in Europe and North America; launched Justiaelectronic endoscope product amid intensified competition in Japan
Medical Systems / Life SciencesMedical Systems / Life Sciences
Graphic ArtsGraphic Arts
Operating Segments
Sub-segment RevenueSub-segment Revenue
Medical Systems/ Life Sciences
GraphicArts
FPD Materials
RecordingMedia
Office& Industry
Billions of yen
541.5
136.3
155.8
103.1
45.7
97.4
133.7
150.3
115.2
38.9
98.6
Despite impact of weakening economic conditions in North America and Europe, CTP sales volume continued to increase due to robust demand in Japan and expanding demand in NICs.Sales of wide-format ink-jet products increased owing to strength of orders received at the drupa trade fair and other factors.
Despite the impact of temporary production adjustments by panel manufacturers, growth was sustained in sales of FUJITAC, and such high-value-added films as WV film.
FPD MaterialsFPD Materials
In the field of optical devices, sales of Fujifilm’s lens units for camera phones grew.Rising demand from principal customers supported an increase in sales of industrial ink-jet printer heads.
The sales volume of high-end enterprise-use data storage media grew smoothly, although exchange rates movements and other factors weakened the revenue of this business.
Recording MediaRecording Media
Office & IndustryOffice & Industry
542.6
25%
29%
19%
8%
18%
25%
28%
21%
7%
18%
¥133.7 billion (YoY: -2%)
¥150.3 billion (YoY: -4%)
¥115.2 billion (YoY: +12%)
¥38.9 billion (YoY: -15%)
¥98.6 billion (YoY: +1%)
%: Proportion of sub-segment revenue
1H FY’08/3(Apr.-Sept., ‘07)
1H FY’09/3(Apr.-Sept.,’08)
Next, we will take a look at trends in the Information Solutions segment’s various businesses.
Regarding the medical systems/life science business, national health care reimbursement system revisions decreased demand for films, but robust sales were recorded of compact FCR products for doctors in private practice and of PACS. Endoscope product sales were strong overseas, but the competition was intensifying in domestic market. We were able to greatly broaden our marketing of functional cosmetic products, reflecting the effectiveness of our television commercials, expansion of marketing channels, and other measures.
Our graphic arts business was impacted by exchange rate trends and the economic slowdown in North America and Europe, but we recorded strong sales of wide-format ink-jet systems and CTP plates.
FPD materials operations were negatively affected by the manufacturing adjustments that LCD panel makers began making from around August, but we were able to continue expanding our sales of FUJITAC and WV film products.
In office and industrial operations, we increased our sales of lens units for camera phones.

66
573.7 565.8
42.0
34.6
Document Solutions
Exports to Europe and North America grew considerably, particularly of color models, but the negative impact of exchange rates movements caused a decline in revenue. Impact of yen appreciation: -¥16.2billion
Operating income grew greatly, reflecting the benefits of improvement of cost of sales and a reduction in SG&A expenses.
Operating Segments
Billions of yen
[6.0%](+21.3%)[7.4%]
¥565.8 billion (YoY: -1.4% )
*Note:After elimination of intersegment transaction
RevenueRevenue
Operating IncomeOperating Income
Revenue* /Operating IncomeRevenue* /Operating Income[ ]: Operating Margin
( ): YoY Comparison
¥42.0 billion (YoY: +21.3% )
(-1.4%)
RevenueOperating Income
1H FY’08/3(Apr.-Sept., ‘07)
1H FY’09/3(Apr.-Sept.,’08)
Our Document Solutions segment maintained robust exports to U.S.-based Xerox Corporation, particularly of color devices. However, the negative impact of exchange rate trends regarding the U.S. dollar as well as Asian and Oceanian currencies caused consolidated revenue to decrease 1.4% below the level in the same period of the previous fiscal year, to ¥565.8 billion.
The segment’s operating income surged considerably, rising 21.3%, to ¥42.0 billion. This increase reflects our Slim and Strong drive’s benefits in improving the cost of sales as well as our reduction of SG&A expenses and other factors.
77
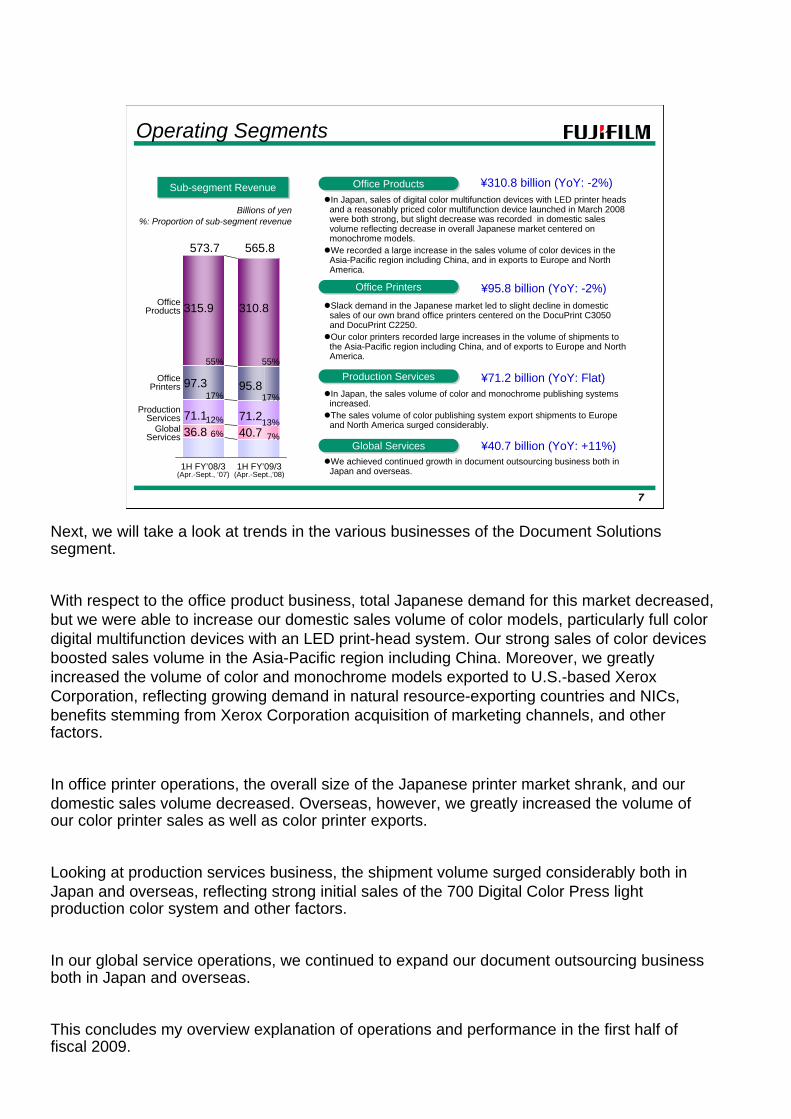
In Japan, sales of digital color multifunction devices with LED printer heads and a reasonably priced color multifunction device launched in March 2008 were both strong, but slight decrease was recorded in domestic sales volume reflecting decrease in overall Japanese market centered on monochrome models.We recorded a large increase in the sales volume of color devices in the Asia-Pacific region including China, and in exports to Europe and North America.
Operating Segments
573.7
Sub-segment RevenueSub-segment Revenue
OfficeProducts
OfficePrinters
ProductionServices
GlobalServices
Billions of yen
565.8
Office ProductsOffice Products
Office PrintersOffice Printers
Production ServicesProduction Services
Global ServicesGlobal Services
315.9
97.3
71.136.8
310.8
95.8
71.240.7
Slack demand in the Japanese market led to slight decline in domestic sales of our own brand office printers centered on the DocuPrint C3050 and DocuPrint C2250.Our color printers recorded large increases in the volume of shipments to the Asia-Pacific region including China, and of exports to Europe and North America.
In Japan, the sales volume of color and monochrome publishing systems increased.The sales volume of color publishing system export shipments to Europe and North America surged considerably.
We achieved continued growth in document outsourcing business both in Japan and overseas.
¥95.8 billion (YoY: -2%)
¥71.2 billion (YoY: Flat)
¥40.7 billion (YoY: +11%)
55%
17%
12%6%
55%
17%
13%7%
¥310.8 billion (YoY: -2%)
%: Proportion of sub-segment revenue
1H FY’08/3(Apr.-Sept., ‘07)
1H FY’09/3(Apr.-Sept.,’08)
Next, we will take a look at trends in the various businesses of the Document Solutions segment.
With respect to the office product business, total Japanese demand for this market decreased, but we were able to increase our domestic sales volume of color models, particularly full color digital multifunction devices with an LED print-head system. Our strong sales of color devices boosted sales volume in the Asia-Pacific region including China. Moreover, we greatly increased the volume of color and monochrome models exported to U.S.-based Xerox Corporation, reflecting growing demand in natural resource-exporting countries and NICs, benefits stemming from Xerox Corporation acquisition of marketing channels, and other factors.
In office printer operations, the overall size of the Japanese printer market shrank, and our domestic sales volume decreased. Overseas, however, we greatly increased the volume of our color printer sales as well as color printer exports.
Looking at production services business, the shipment volume surged considerably both in Japan and overseas, reflecting strong initial sales of the 700 Digital Color Press light production color system and other factors.
In our global service operations, we continued to expand our document outsourcing business both in Japan and overseas.
This concludes my overview explanation of operations and performance in the first half of fiscal 2009.

88
-¥19.67¥26.66¥46.33Earnings per Share
-27.6-13.535.35.2%48.86.8%Operating Income*
-4.9-35.0684.7100.0%719.7100.0%Revenue
%
Change
13.4
26.7
¥108¥162
2.0%
3.9%
2Q FY2009/3(Jul. - Sep. 2008)
-43.2
-40.2
-¥10-
-10.2
-18.0
Amount
23.6
44.7
3.3%Net Income
¥118¥162
Exchange RatesUS$Euro
6.2%Income Before Income Taxes
2Q FY2008/3(Jul. - Sep. 2007)
Billions of yen
(billions of yen)
Performance Summary for 2Q FY2009/3
Appendix
<Reference> Factors affecting YoY changes of 2Q operating incomeExchange rates movements: -4.8 Higher raw materials prices: -7.7 Sales expansion and other: -1.0
* Including structural reform expenses: 2Q FY2008/3 3.3 2Q FY2009/3 2.4

99
Imaging Solutions
Billions of yen
*Note: After elimination of intersegment transaction
Revenue* /Operating IncomeRevenue* /Operating Income
[ ]: Operating Margin( ): YoY Comparison
(-19.2%)
[-0.1%]
Color Filmsand Others
ElectronicImaging
Color Paperand Chemicals
PhotofinishingEquipment
Labs andFDi services
Billions of yen
147.520.3
YoY
-31%
-16%
-11%-23%
147.514%
34.9
24%10.6 7%
25.517%
44.030%
Appendix
RevenueOperating Income
Sub-segment RevenueSub-segment Revenue
119.0
-6.3-0.2[-5.3%]
119.014.1
12%
29.525%
9.4 8%
19.717%
35.330%
-20%
2Q FY’08/3(Jun.-Sept., ‘07)
2Q FY’09/3(Jun.-Sept., ’08)
2Q FY’08/3(Jun.-Sept., ‘07)
2Q FY’09/3(Jun.-Sept., ’08)

1010
280.4276.3
20.9
32.3
Information Solutions
Billions of yen
*Note:After elimination of intersegment transaction
Revenue* /Operating IncomeRevenue* /Operating Income[ ]: Operating Margin( ): YoY Comparison
[11.5%]
(-1.5%)Medical Systems
/ Life Sciences
GraphicArts
FPD Materials
RecordingMedia
Office& Industry
Billions of yen
280.4
74.1
79.8
YoY
-2%
-4%
+9%
-15%
-1%
Appendix
RevenueOperating Income
26%
29%
50.918%
23.18%
50.318%
Sub-segment RevenueSub-segment Revenue
[7.6%](-35.2%)
276.3
72.7
76.4
55.3
19.7
49.9
26%
28%
20%
7%
18%
2Q FY’08/3(Jun.-Sept., ‘07)
2Q FY’09/3(Jun.-Sept., ’08)
2Q FY’08/3(Jun.-Sept., ‘07)
2Q FY’09/3(Jun.-Sept., ’08)

1111
291.8289.4
21.8
18.1
Document Solutions
Billions of yen
[6.1%]
(-0.8%)
(+20.6%)[7.5%]
*Note:After elimination of intersegment transaction
Revenue* /Operating IncomeRevenue* /Operating Income[ ]: Operating Margin( ): YoY Comparison
OfficeProducts
OfficePrinters
ProductionServices
GlobalServices
Billions of yen
291.8
160.0
YoY
-2%
-3%
-1%
+10%
Appendix
RevenueOperating Income
55%
50.817%
37.713%
20.57%
Sub-segment RevenueSub-segment Revenue
289.4
156.5
54%
49.217%
37.213%
22.48%
2Q FY’08/3(Jun.-Sept., ‘07)
2Q FY’09/3(Jun.-Sept., ’08)
2Q FY’08/3(Jun.-Sept., ‘07)
2Q FY’09/3(Jun.-Sept., ’08)

1212
Capital Expenditure*
11.9 10.4 9.7
26.7 31.1
14.5
5.3
4.0
2.828.343.9 44.3
Imaging SolutionsInformation SolutionsDocument Solutions
■ Corporate
Appendix
Billions of yen2Q
(July - September) 2Q
(July - September) Fiscal Year
(April – March)Fiscal Year
(April – March)
2Q FY’07/3
*Note: Figures do not include amounts for rental equipment handled by the Document Solutions segment.
14.9 16.4 14.6
43.250.5
34.7
9.0
9.7
7.2
56.767.1
76.6
1H(April – September)
1H(April – September)
48.1 50.7 53.0
96.0 101.5 94.0
19.8 17.9 23.0
1.3 0.1
165.2 170.2 170.0
2Q FY’08/3
2Q FY’09/3
1H FY’07/3
1H FY’08/3
1H FY’09/3
170.0
FY’09/3(Plan)
FY’10/3(Plan)
FY’08/3FY’07/3
0.1 0.2

1313*Note: Figures do not include amounts for rental equipment handled by the Document Solutions segment.
Depreciation & Amortization
18.1 20.0 19.2
18.827.5 27.9
14.2
11.9 6.8
0.1
51.159.5
Imaging SolutionsInformation SolutionsDocument Solutions
■ Corporate
226.8
Billions of yen
35.8 38.8 38.0
41.549.8 55.0
32.620.2 12.3
0.30.2
109.9 109.0
215.4
38.040.128.2 73.872.875.7 160.0160.0159.6146.4Depreciation*
74.3 81.0
88.2107.4
52.837.8
0.1 0.6
2Q FY’07/3
2Q FY’08/3
2Q FY’09/3
1H FY’07/3
1H FY’08/3
1H FY’09/3 FY’07/3 FY’08/3 FY’09/3
(Plan)FY’10/3(Plan)
0.1
54.0
105.6
2Q(July - September)
2Q(July - September)
1H(April – September)
1H(April – September)
Fiscal Year(April – March)
Fiscal Year(April – March)
230.0 220.0
Appendix

1414
Billions of yenR&D Expenses
Ratio of R&D expenses to revenue
7.3
6.5
6.8
47.1
7.1
6.4
6.7
90.6 90.8
47.2
177.0187.6
200.0 210.0
6.97.0
6.66.4
2Q FY’07/3
2Q FY’08/3
2Q FY’09/3
1H FY’07/3
1H FY’08/3
1H FY’09/3
FY’07/3 FY’08/3 FY’09/3FY’09/3(Plan)
FY’10/3(Plan)
49.3
95.7
2Q(July - September)
2Q(July - September)
1H(April – September)
1H(April – September)
Fiscal Year(April – March)
Fiscal Year(April – March)
Appendix

1515
SG&A Expenses Billions of yen
Ratio of SG&A expenses to revenue
26.126.427.1 26.626.6
27.7
375.6
26.727.3
760.1374.1
189.9
2Q FY’07/3
2Q FY’08/3
2Q FY’09/3
1H FY’07/3
1H FY’08/3
1H FY’09/3
FY’07/3 FY’08/3
188.5
759.1
179.2
356.1
2Q(July - September)
2Q(July - September)
1H(April – September)
1H(April – September)
Fiscal Year(April – March)
Fiscal Year(April – March)
Appendix

1616
173.9
133.1151.0
115.7
86.9
113.6
46.237.4
-58.2
Cash flow from operating activitiesCash flow from investing activitiesFree cash flow
Appendix
Billions of yen
Free Cash Flow
1H FY’07/3 1H FY’08/3 1H FY’09/3
Cash Flow1H FY'08/3 1H FY'09/3
Net income 64.6 45.3
Depreciation & amortization 109.0 105.6
Change in working capital (20.1) (0.4)
Change in deffered income taxesand other liabilities (14.3) (38.7)
Others 11.8 21.3
C/F from operating activities 151.0 133.1
Capital expenditure (78.5) (82.9)
M & A - -
Others (35.1) (4.0)C/F from investing activities (113.6) (86.9)Free cash flow 37.4 46.2

1717
Appendix
384.7
330.9 318.8
Mar. '07 Mar. '08 Sep. '08
Billions of yen
Cash and Cash Equivalents
106.0 113.870.4
255.5
256.2268.0
0.20.20.2
Mar. '07 Mar. '08 Sep. '08
374.0 370.0
Long term debtShort term debt
D/E ratio
Interest Bearing Debt
325.9

1818
428.8393.6 416.8
Mar. '07 Mar. '08 Sep. '08
1.7 1.8
2.6 2.5
Appendix
563.2605.6 596.9
Mar. '07 Mar. '08 Sep. '08
299.2333.9 342.8
Mar. '07 Mar. '08 Sep. '08
Inventories Notes and Accounts Receivable
Notes and Accounts Payable
Billions of yenTurnover period, months
1.9
2.5

1919
AppendixCurrent State of New Drug Development
Development
code Non-clinical P I P II P III Filed Formulation
T-614 Rheumatoid arthritis Japan Oral
T-326210% finegranules(OZEX finegranules forchildren)
Quinolone synthetic antibacterial Japan Oral
T-3811 New-type quinolone synthetic antibacterial Japan Injection*
U.S.A. Oral/Injection
Europe
T-3762 Quinolone synthetic antibacterial Japan Injection**
T-817MA Alzheimer’s disease U.S.A. Oral
T-5224 Rheumatoid arthritis Japan Oral
(R7277) Overseas
T-705 Antiviral Japan Oral
U.S.A.
T-1106 Antiviral Japan Oral
T-2307 Antifungal Japan Injection
*Note: Received an approval in 2007 as a oral quinolone antibacterial agent under the brand name of GENINAX
**Note: Additional dosage of PASIL intravenous drip, which received an approval in 2002
Therapeutic category RegionDevelopment stage
2008.10 Apply for approval of manufacturing and marketing

2020
Exchange Rates
Number of Employees
Yen
Appendix
Impact of exchange rates movement on operating income (full year, ¥1 change)US$: ¥1.2 billion Euro: ¥1.1 billion
78,32178,321
Mar.2008Mar.2008
78,76578,765
Jun.2008Jun.2008
78,22878,228
Sep.2008Sep.2008
78,00878,008
Dec.2007Dec.2007
77,55577,555
Sep.2007Sep.2007
Distribution of Shareholders
38.5%
37.8%
46.5%
46.6%
1.7%
1.6%
4.3%
4.1%
7.0%
7.9%
Mar.'08
Sept.'08Financial InstitutionsSecurities CompaniesOther CorporationsIndividuals & OthersForeighn CorporationsTreasury stocks
2.0%
2.0%
162162162162163162163EURO €115119118121106108104US$
Year1H2Q1Q1H2Q1QFY2008/3 FY2009/3

IR Office, Corporate Planning Div.
We will use leading-edge, proprietary technologies to provide top-quality products and services that contribute to the advancement of culture, science, technology and industry, as well as improved health and environmental protection in society. Our overarching aim is to help enhance the quality of life of people worldwide.