from cleantech to cleanweb – the finnish cleantech space ... · this report publishes findings of...
TRANSCRIPT

Raportit Reports
25 March 2015
No 43
* ETLA – The Research Institute of the Finnish Economy, [email protected]** ETLA – The Research Institute of the Finnish Economy, [email protected]*** University of Michigan, [email protected]**** Demos Helsinki, [email protected]
Annu Kotiranta* – Antti-Jussi Tahvanainen** – Peter Adriaens*** – Maria Ritola****
ETLA ETLA
From Cleantech to Cleanweb – The Finnish Cleantech Space in Transition
Suggested citation: Kotiranta, Annu, Tahvanainen, Antti-Jussi, Adriaens, Peter & Ritola, Maria (25.3.2015). “From Cleantech to Cleanweb – The Finnish Cleantech Space in Transition”. ETLA Reports No 43. http://pub.etla.fi/ETLA-Raportit-Reports-43.pdf

This report publishes findings of ETLA’s project “Towards Sustainable Positioning and Value Capture – A Roadmap for Finnish Cleantech” funded by Tekes’ FiDiPro-program, Sitra, Ladec, Cleen Ltd., RYM Ltd. and Center for Energy and the Environ-ment. The authors would like to express their gratitude for valuable comments and support to the project’s steering committee and external advisers: Ari Ahonen (Rym), Kaisu Annala (Ministry for Employment and the Economy), Henri Grunds-tén (Industry Investment), Nina Harjula (Ladec), Urpo Hautala (Ministry of Finance), Markku Ihonen (The Federation of Finnish Technology Industries), Tommy Jacob-son (Cleen), Martti Kulvik (ETLA), Tuuli Mäkelä (Confederation of Finnish Industries), Pekka Pesonen (Tekes), Antti Savilaakso (Nordea), Tarja Teppo (Cleantech Invest), Pekka Tervonen (CEE), and Sami Tuhkanen (Sitra).
ISSN-L 2323-2447 ISSN 2323-2447 (print) ISSN 2323-2455 (online)

Table of Contents
Abstract 2 Tiivistelmä 2
1 From policy fad to respectable economic activity 3 1.1 Threats are effective drivers for the greening of economies 3 1.2 What is cleantech? 5 1.3 The Finnish cleantech industry – A de facto definition 8
2 Finnish cleantech in numbers 9 2.1 On data and their categorization 9 2.2 Industry classification – Manufacturing companies dominate Finnish cleantech 11 2.3 Size – Finnish cleantech companies are comparatively large 13 2.4 Ownership – Foreign-owned firms make more money 14 2.5 Thematic sectors – Renewable energy, water treatment, and biofuels largest in Finland 15 2.6 Value added – Smart grid, biofuels and energy efficiency sectors contribute most to the economy 16 2.7 Performance – Overall returns are decent but SMEs, in particular, struggle with profitability 18 2.8 Intellectual property rights – Do patents uncover a deficiency in consumer-oriented solutions? 20
3 The bottomline – Are the engineering focus and financial distress of SMEs a drag on the long-term viability of the Finnish cleantech space? 24
4 A path forward – Redefining the Finnish cleantech opportunity in the age of digitalization 26
References 28 Appendix 1: Finnish cleantech in numbers 30 Appendix 2: Dedicated cleantech companies in Finland 34

From Cleantech to Cleanweb – The Finnish Cleantech Space in Transition
AbstractNow that the worst of the growing pains have been subdued, cleantech has made a respectable comeback onto the global agenda of firms, investors and eco-nomic developers alike. One might say it is bigger than ever, with a constantly proliferating range of cleantech companies and business models. In the midst of the resurgence, Finnish CleanTech has been recognized globally. Recent rankings by the WWF (WWF & Cleantech Group (2014): The Global Cleantech Innova-tion Index 2014) placed Finland in the top-3 of global leaders in cleantech, along with Israel and the US.
Against this backdrop, this report takes a closer look at the Finnish commercial cleantech space and scrutinizes it in light of select indicators such as degree of specialization into cleantech, type of industrial activity, generation of value added, financial performance as well as type and volume of intellectual prop-erty generated.
The results are thought-provoking. Of the many discoveries made in the report, three strike as critical: First, the Finnish cleantech space is dominated by manufacturing-driven businesses. Second, consumer-oriented technical innovations seem to be rare. And third, the engine of industrial renewal – the layer of small and medium –sized firms – seems to struggle with financial sustainability.
The ability to shift gears from manufacturing- to service-driven businesses may be compromised if the low financial viability of small and medium -sized companies turns out to be more than a statistical fluke. These firms have been known to possess the rare capability to mock conventional industry bounda-ries to develop novel business models and open new markets. Poor commercial performance would indeed be bad news for the long-term development of the cleantech space in Finland. To solidify these results, uncover the reasons behind them, and identify opportunities going forward, however, more in-depth inquiries need to be made.
In the gold rush era of digitalization, our findings beg the question whether the seemingly dominant focus on manufacturing, engineering and technology could become the ball-and-chain to the growth of Finnish cleantech. Digitalization is currently revolutionizing service businesses and providing opportuni-ties to harness vast consumer markets for rapid, scalable growth – particularly in the area of resource efficiency – via new, often disruptive business models. In recent years these opportunities have been widely discussed in several contexts including cleanweb, smart cities, internet of things, and consumer cleantech.
Should the Finnish cleantech industry do what the Finns have always done best and stick to the development of cutting-edge technological solutions? Or should Finnish companies adopt service-based business models that have allowed other countries (notably the US) to transition to the digital age of clean-tech?
Given the central role of information technology in cleantech 2.0 businesses, there is a clear opportunity to leverage the innovative capacity of the Finnish ICT industry to: (a) accelerate the adoption of green solutions, (b) drive economic growth, and (c) render cleantech companies not only profitable, but also attrac-tive investments.
Key words: Cleantech, cleanweb, industrial renewal, digitalization, statistics, Finnish economy
JEL: L16, O12, O14, O52
Cleantechin paluu – onko todellisuus edelleenkään tarua ihmeellisempää?
TiivistelmäCleantechin kasvukivut näyttävät selätetyiltä. Ala on noussut otsikoihin suurempana kuin koskaan. Se kiinnostaa jälleen sekä kansainvälisiä yrityksiä, sijoittajia että kehitysorganisaatioita. Innostuneiden eturintamassa kulkee myös yhdeksi edelläkävijöistä julistautunut Suomi.
Tämän raportin tavoitteena on tarkastella julistuksen perusteita; millaisena näyttäytyy kaupallinen cleantech Suomessa, kun tarkastelun kohteena ovat muun muassa cleantechin eri sektorit, arvonlisäys, taloudellinen menestys sekä aineettoman pääoma muodostus?
Tulokset haastavat lukijan ja herättelevät tarkastelemaan povattua talouden pelastajaa kriittisesti. Kolme löydöstä nostettakoon erityisesti esille: Ensinnä, suomalaisen cleantechin kivijalka on valmistavassa teollisuudessa. Toiseksi, kuluttajille suunnatut innovaatiot ovat harvassa. Kolmanneksi, teollisuuden uudis-tumisen ytimen – pienten ja keskisuurten cleantech-yritysten – taloudellinen tilanne on vähintäänkin hälyttävä.
Jos pienten ja keskisuurten yritysten heikko taloudellinen tilanne on enemmän kuin tilastollinen harha, saattaa edessä siintävän kehityksen tie olla kuop-painen. Jos nämä talouden ketterimmät liikkujat todella taistelevat kannattavuusongelmien kanssa, pienenee uudistajien ydin; innovatiivisten kehittäjien ja toimialarajat yrittävien radikaalien joukko. Tällöin suomalaisen cleantech alan pitkäjänteinen kestävyys saattaa aidosti olla vaakalaudalla.
Asia on polttava. Digitalisaatio on mullistamassa palveluita ja tarjoamassa mahdollisuuksia valjastaa myös valtavat kuluttajamarkkinat nopeaan ja skaalau-tuvaan kasvuun uusien, ja usein disruptiivisten liiketoimintamallien avulla. Cleanweb, älykkäät kaupungit, teollinen internet, ja kuluttaja-cleantech ovat vain joitain kasvualueita, joilla palvelumallit tulevat esittämään merkittävää roolia. Mallien kehittämiseen tarvitaan puolestaan ennakkoluulottomia, rohkeita ja tietenkin kannattavia kasvuyrityksiä.
Samaan aikaan kun digitalisaatio mullistaa palveluita, näyttää suomalainen cleantech kuitenkin uivan vastavirtaan takertumalla valmistavaan teollisuuteen. Onko mahdollista, että tuotannon ja teknologian korostunut osuus suomalaisesta cleantechistä muodostuu alan kasvun kiviriipaksi?
Yksi palvelupohjaisen cleantechin tukirangoista ovat erilaiset tieto- ja viestintäteknologiat. Molemmilla osa-alueilla suomalainen teollisuus- ja palvelutuotan-to on vahvoilla. Nyt vaaditaan erityisesti uusia liiketoimintamalleja, joilla nämä vahvuudet voidaan valjastaa vihreiden ratkaisujen kehittämiseen, sijoituksien houkuttelemiseen ja taloudellisen kasvun kiihdyttämiseen.
Rohkeita uranuurtajia on jo olemassa. Ne eivät kuitenkaan vielä tässä vaiheessa yksinään väräytä talouden tilastomittareita. Aitoa kasvua saadaan aikaiseksi kun nämä kasvavat, digitalisaation aallonharjalla ratsastavat palveluyritykset kytketään osaksi teollista ekosysteemiä. Tarvitaan rohkeutta avata perinteiset arvoket-jut uudenkaltaisille toimijoille ja toiminnoille. Se parantaisi kuitenkin muutosta ajavien kasvuyritysten kannattavuutta ja mahdollistaisi uusien kasvumarkkinoi-den valtaamisen talouden perinteisemmille vetureille.
Asiasanat: Cleantech, cleanweb, teollinen uudistuminen, digitalisaatio, tilastot, Suomen kansantalous
JEL: L16, O12, O14, O52

3From Cleantech to Cleanweb – The Finnish Cleantech Space in Transition
1 From policy fad to respectable economic activity In the past decade, cleantech seems to have graduated from a glorified, policy-driven fad and the scourge of over-zealous venture capitalists to a perceptible, economic megatrend with con-siderable industrial and financial momentum.
Only as recently as 2008 did the Economist1 proclaim the “downturn of clean technology” under the “gathering clouds” of the global economic slowdown. Today, Chrysalix EVC2, one of the longest standing venture capital firms in the cleantech space, estimates that the total addressable market in cleantech will grow to a size anywhere between three and four trillion USD by 2020; an eight-fold increase since 2005. In 2013, global investments into green en-ergy alone exceeded $200Bn, a figure that is expected to triple until 20303. To put the num-bers into perspective, current investments into fossil-fuel-based power generation top out at $270Bn.
The market performance of select vanguard names in cleantech provides further support for the sector’s long-awaited success story that many are still rather cautious to buy into. Accord-ing to CapitalIQ and Bloomberg, the present-market-capitalization-over-IPO-value multipli-ers of companies such as Cree, Tesla and Solar City are on par with those of ebay, Google, Linkedin and Facebook. Certainly, one cannot ignore the growing body of economic and fi-nancial evidence speaking in favor of Case Cleantech. Nonetheless, the agnostic will still want to know what is driving this surge in cleantech. What are the incentives? Where are the growth opportunities? How have business models shifted? Why is cleantech back on the agenda?
1.1 Threats are effective drivers for the greening of economies As an incentive, the stick is often mightier than the carrot, they say. In the context of cleantech, the stick comes in the form of increasing resource scarcity and global warming (WEF, 20144; PWC, 20145; KPMG, 20146). Already, decision makers in business and politics alike are start-ing to feel the pain brought on by the foreseeable negative impacts of environmental and so-cial sustainability trends, if neglected:
1. Rapid growth in the planet’s population and the gentrification of developing econo-mies exacerbates the competition for resources as pressures to increase the production of food, energy and minerals rise. According to the UN, the demand for food will in-crease by 30 percent until 2030; and by a staggering 50 percent until 2050. In parallel, crop yield in agriculture grows at an ever slowing rate of only 1 percent annually. Four decades ago the rate still was twice as high. With demand outpacing production, prices are bound to soar and weaken the purchasing power of consumers.
1 The Economist (2010).2 Wal van Lierop (2014).3 Bloomberg New Energy Finance.4 WEF (2014).5 PWC (2014).6 KPMG (2014).

ETLA Raportit – ETLA Reports No 43 4
2. In the wakes of Fukushima’s nuclear tragedy and Ukraine’s political conflict, businesses and governments are redirecting emphasis on energy security. Strategies in the energy space focus on diversifying risk by increasing the number of producers and suppliers as well as by accelerating the integration of renewables in the energy mix. The uncertain-ties in this space are reflected in increasing energy prices that, depending on the sector, already make out 5–20 percent of businesses’ total costs.
3. According to the newest findings by the International Energy Agency (IEA), the cost impact of global warming will exceed 3.2 percent of global GDP by 2030, if attempts at curbing emissions-related increases in the global temperature should fail. Current esti-mates value present costs at $1200Bn (DARA, 20107). To de-risk potential consequenc-es of climate change on society and the economy, governments are setting in place regu-latory measures that drive sustainable production and consumption. These regulations set new strategic and operative boundaries for businesses, challenge incumbent busi-ness models, and provide ample opportunities for new, innovative businesses and in-cumbents that seek to renew their business practices. Even behemoths such as Exxon-mobile, Microsoft and General Electric already forge strategies that are compatible with business environments subject to carbon tax – like regulatory innovations (New York Times, 20138).
4. Regulatory schemes – the governmental armory of sticks – are complemented by more direct measures such as the withdrawal of current subsidies. The International Institute for Sustainable Development (IISD) estimates that governments around the world sub-sidize the production and use of fossil fuels with a compound $600Bn annually. About $100Bn thereof are said to go to the oil producers directly. As outlined by the Glob-al Subsidies Initiative in 20109, decision makers at the G-20 Pittsburgh Summit pro-claimed that “inefficient fossil-fuel subsidies encourage wasteful consumption, distort markets, impede investment in clean energy sources and undermine efforts to deal with climate change.” The Summit’s yield was a joint decision to phase out inefficient fossil-fuel subsidies that encourage dissipative consumption. When and how a phase-out will hit producers, investors, industry, business and other central stakeholders such as con-sumers is not known, but the impact will be felt widely with great certainty.
5. In many countries, governments and NGOs take on more aggressive roles in the promo-tion of cleantech related sectors. In Finland, for instance, the Ministry for Employment and the Economy has launched a “Government Strategy to Promote Cleantech Business in Finland”10. By 2020 the strategy aims (i) to raise the compound turnover of Finn-ish cleantech companies to €50Bn, of which exports would account for over 75%, (ii) to double the Finnish cleantech home market to about €20Bn, (iii) to raise the number of cleantech companies from 2000 to about 3000, and (iv) to create at least 40,000 jobs in clean technology in Finland. To name a few action points of the strategy, the “Minis-try of Finance is to annually provide €30M in investment subsidies for cleantech dem-onstration and reference projects, which are to catalyze €150M in investments into Fin-
7 DARA Group and Climate Vulnerability Monitor (2010)8 New York Times (2013)9 GSI (2010)10 TEM (2014)

5From Cleantech to Cleanweb – The Finnish Cleantech Space in Transition
land.” Prize money for companies winning in international cleantech -related business plan competitions is set to €1M. Furthermore, the “Ministry for Foreign Affairs is to name shared cleantech envoys to more than 100 countries by 2015.” In the NGO space, the Global Cleantech Cluster Association (GCCA), a meta-cluster with the vision “to drive sustainable regional economic development on a global scale”, has grown in only four years of its existence to encompass 50 clusters from across the world, representing 10,000 cleantech companies. The GCCA is collaborating with the P80 Group Founda-tion and Club de Madrid to support the Global Technology Deployment Initiative.
6. In parallel with the corporations and governments, the financial markets are bracing for the impact that regulations and changes in consumption will have on the valuation of companies that produce and refine fossil fuels (Carbon Tracker Initiative, 201111). The rise of ESG (Environmental-Social-Governance) -indexed funds, impact investing, and responsible investing reflect growing concerns about a shift in the valuation of business models and practices. Pension funds that are by far the largest investors in fossils-based businesses are especially exposed to carbon risk, because of the annual dividends paid out by oil and gas companies. The question is when do pension funds start reposition-ing their vast resources towards a green (or better, carbon-free) economy? And where are those funds to be placed? A recent Environmental Finance workshop in London in-dicated that part of the problem is the dearth of green assets for allocation. The chal-lenge is, pension funds do not like thematic investments. To them themes are policy-driven fads subject to political volatility12.
In summary, commitment to and opportunities in cleantech seem to finally materialize in tan-gible form. Hype is being replaced by a growing concern about the sustainability of not only the environment but that of societies. Food, housing and transportation costs are on the rise as resource scarcity is becoming more imminent in a world with a fast growing population but fi-nite assets. Fortunately, driven by this concern, governments, businesses and consumers alike seem to share a common view of the necessity to green the world’s economies.
That being said, governments can do only so much. While setting the incentives, they do not produce the solutions. Consumers, on the other hand, are many times told by businesses what they need and what options they can choose from. Hence, companies play a crucial role. The question then is how well is the corporate space positioned to take advantage of cleantech and drive change? What is the state of cleantech as a business today? How do cleantech companies need to restructure their business models to enable scale of adoption and profitability?
1.2 What is cleantech? To provide some empirical answers to the questions, this report takes a close-up look at the commercial cleantech space in Finland. The picture is drawn using numeric, categorized dis-tributions of central economic indicators such as turnover, number of employees, profit mar-gin, and return on investments.
11 Carbon Tracker Initiative (2011)12 The Atlantic (2013)

ETLA Raportit – ETLA Reports No 43 6
Before diving into the numbers, however, we should first agree on what it is the numbers are depicting. Given the strong sentiments different stakeholder groups have developed towards cleantech in the past two decades, one is inclined to think that by now it is a well-defined, manifest concept.
The truth is somewhat disappointing. Anyone randomly searching for a definition among lit-erature or on-line sources soon finds that it is everything but well-defined. Existing defini-tions are extremely vague and ambiguous. They are either too narrow or describe technolog-ical, industrial and strategic spaces so vast they lose all functionality as a definition. It is a researcher’s nightmare: one cannot measure what one cannot define. For the reader’s conveni-ence and to provide her with the possibility to assess the gravity of the issue independently, a small sample of existing definitions for cleantech is given below:
“Clean technology (cleantech) is the installation or a part of an installation that has been adapted in or-der to generate less or no pollution. In clean as opposed to end-of-pipe technology, the environmental equipment is integrated into the production process.” – OECD/UN13.
“Cleantech refers to products, services and processes, which promote the sustainable use of natural re-sources while reducing emissions. Cleantech is not an industrial sector of its own but the markets for the products and services are found in all industrial sectors, especially from technology, energy and construc-tion sectors.” – Ministry for Employment and the Economy, Finland.
“In brief, Cleantech refers to technology, products and services which generate superior commercial ben-efits to customers while addressing significant environmental concerns such as global warming, sustain-ability of natural resources and energy security.” – ecoConnect, UK.
“A broad base of processes, practices and tools, in any industry that supports a sustainable business ap-proach, including but not limited to: pollution control, resource reduction and management, end of life strategy, waste reduction, energy efficiency, carbon mitigation and profitability.” – Clean Technology Trade Alliance.
“Cleantech, also referred to as clean technology, and often used interchangeably with the term greentech, has emerged as an umbrella term encompassing the investment asset class, technology, and business sec-tors which include clean energy, environmental, and sustainable or green, products and services.” – Neal Dikeman, Jane Capital Partners LLC.
“A shortened form of “clean technologies”, a term used to describe an investment philosophy used by in-vestors seeking to profit from environmentally friendly companies. Cleantech firms seek to increase per-formance, productivity and efficiency by minimizing negative effects on the environment.” – Investope-dia.
“Cleantech is any product or service that improves operational performance, productivity, or efficiency while reducing costs, inputs, energy consumption, waste, or environmental pollution. Its origin is the in-creased consumer, regulatory, and industry interest in clean forms of energy generation – specifically, per-haps, the rise in awareness of global warming, climate change, and the impact on the natural environment from the burning of fossil fuels.” – Wikipedia.
Despite their ambiguity, the above definitions converge on a number of issues: First, cleantech is not an industry in its own right. It is technologies, products, services, processes, practic-es and investment classes that promote the sustainable development and greening of incum-
13 UN (1997)

7From Cleantech to Cleanweb – The Finnish Cleantech Space in Transition
bent and emerging industries as well as societies. Second, through efficiency gains or entirely novel alternatives it reduces the unsustainable exploitation of natural and societal resources in industry, business and consumption. Third, it provides industries, businesses and consumers with superior value propositions when compared to conventional solutions.
So far so good. The definitions do not contradict each other and provide three loose criteria that cleantech should match to be recognized as such. Again, one might be inclined to think that, in the absence of more definite parameters, one would at least be able to spot a cleantech company on sight. After all, we know that entire US Supreme Court cases have been decided based on the famous “I know it when I see it”-heuristic14. Before succumbing to the lures of false self-confidence, however, let us first review a few real-world examples.
Example 1: Renewable energy generation. The use of fossil fuels for energy production and transportation has been viewed as the number one driver of global warming and climate change. If using wind, solar, wave or hydro power helps to curtail the threats and costs of nat-ural disasters, food shortage, disease, environmental degradation, loss of property and social turmoil then the average person will agree that renewable power generation indeed meets the above criteria of cleantech. And so agrees the researcher. Other equally unchallenging exam-ples can be found in the areas of waste water treatment, electric vehicles, recycling of materi-als and many others. This was somewhat trivial.
Example 2: Resource sharing services. Here the problem becomes more complex already. Take a car sharing service provider such as Zipcar or car-pooling service companies the likes of kyyti.net. Sharing the right to use a vehicle or offering redundant seat space to travelers headed towards the same destination can very well be argued to fulfill the three criteria:
(i) the activity is clearly not a traditional industry of its own, but a service that provides information for the coordination of the efficient exploitation of existing, redundant assets and is built on top of existing industrial infrastructure such as telecom and IT networks, cars, etc.,
(ii) it generates both natural and societal resource efficiencies as it substitutes for new car manufacturing and related resource consumption up the value chain, decreases traf-fic congestions and pollution, and reduces overall fossil fuel consumption, and
(iii) it provides new value added to users in the form of (a) foregone insurance, parking and maintenance payments, (b) access to a car for low-income or low-use individuals who could not otherwise afford it, and (c) the convenience of on-demand transporta-tion without the burdens of ownership such as the daily search for a parking, which has been argued to make up a forth of the total time spent in a car in metropolitan ar-eas.
Apparently, calling car sharing services cleantech seems not to be too farfetched. But then again, transportation and its connection to cleantech are still fairly easy to grasp for most of us; the links between their use and its detrimental impacts to the environment and (personal) economy are very direct.
14 Gewirtz (1996)

ETLA Raportit – ETLA Reports No 43 8
What about more indirect links, then? Who, for instance, would say that Airbnb is a cleantech company; a company that defies the hotel business by facilitating the temporary renting of pri-vate homes on-line? We could run the company through the three criteria and show with ease that both the environment and users gain from the use of the service. For example, according to Pure Energy Partners, a room booked via Airbnb boasts a 66% reduction in carbon emis-sions per night over a hotel room15. Many would still argue that “clean” is just a serendipitous by-product that the providers of the service have skillfully harnessed for marketing purposes.
Example 3: Data analytics services. Let us go even further and claim that Google is a clean-tech company. Before dismissing the notion as ridiculous consider the following: In many cleantech sectors, especially those that are considered “smart” (e.g., smart grid, smart mobil-ity, smart cities), the entire business model and technology is built on and around increasing-ly growing masses of user data. In smart grid, for instance, power utilities want to anticipate peaks in electricity consumption well in advance to avoid the very unprofitable use of emer-gency generation capacity. A growing installed base of smart meters in homes and industri-al facilities enables utilities to tap into the power consumption patterns of their customers in real time. The hook is that utilities are not very efficient at interpreting Big Data. Patterns are challenging to identify if you do not know how and what to look for.
Enter data analytics companies. Specialized analytics companies such as Enernoc can provide utilities and other industries with pre-digested, customized data analyses that turn dumb and messy masses of data into smart action points. Specialized companies are in no way the only ones hungry for a sizable chunk of these fairly virgin, fast growing analytics markets. Google is one of the most aggressive contestants in the field. So is Amazon. If former search engines and on-line retail outlets are soon-to-be core players in cleantech, where do you draw the line? Enter the cleanweb opportunity: The emergence of new kinds of companies that take advan-tage of advancements in information technology.
1.3 The Finnish cleantech industry – A de facto definition The difficulties to provide an explicit definition for cleantech are inherent in its own cross-industrial and cross-technological nature that transcends existing demarcations of tradition-al industries and technologies. In the case of dedicated pure-players, the task is easier but the more diverse and numerous a company’s portfolio of business lines is, the harder it is to iden-tify it as a representative of the cleantech space.
To add to the difficulty, dedicated and specialized cleantech companies – designated “pure players” in this report – lean heavily on an entire ecosystem of stakeholders that would not ex-plicitly identify themselves as cleantech organizations. Google, as a big data generalist, would probably not admit to being a cleantech company; nor would a sub-component producer for smart meters do so. And yet, they are indispensable players in the cleantech ecosystem due to their central roles in the value chains of pure players.
We concede that an airtight definition eliminating all room for interpretation is next to unat-tainable. Hence, the issue of definition has been addressed in this report by reverting to a de
15 Bunting (2014).

9From Cleantech to Cleanweb – The Finnish Cleantech Space in Transition
facto approach: We merged lists of Finnish cleantech companies compiled for internal devel-opment purposes and in use by central governmental and non-governmental economic devel-opment organizations such as Cleantech Finland, Confederation of Finnish Industries, Min-istry for Employment and the Economy, the Finnish Funding Agency for Innovation, Centre for Environment and Energy, and Lahti Region Development. While not necessarily a highly academic solution, it is an empirical, practice-proven approximation of the Finnish corporate cleantech space as established by some of the most influential economic development organ-izations in the country. In the remainder of the report, we refer to the list of companies and the pool of their respective data points collected from a number of public and private data-bases as ‘the data’.
2 Finnish cleantech in numbers
2.1 On data and their categorization The original, unedited data consist of financial and other descriptive information on more than 1800 Finnish companies active in the cleantech space. After the elimination of recently deactivated ones, the remaining 1600 companies were manually examined by the authors to be then (i) categorized into thematic cleantech sectors such as smart grid, recycling and waste management, or biofuels and biochemicals, and (ii) classified according to their degree of spe-cialization to cleantech – or their cleantech intensity, as it is referred to in the remainder of the report (see Box 2.1).
One of the key objectives of the report is to highlight those features of the cleantech space that sets it apart from other industrial spaces. To drive the objective, the intensity measure was ap-plied to the data as a filter: companies that operate on the fringes of the dedicated cleantech space in a supporting role to the cleantech ecosystem – i.e. obtained intensity scores of 1 or 2 – were excluded from the analyses. The exclusion resulted in a final dataset of 762 companies representing 21 different thematic sectors. For simplicity’s sake, these companies are referred to as cleantech companies in the remainder of the report.
Box 2.1 Cleantech intensity
To bring companies with a strong focus on cleantech into the spotlight, all companies in the data were classified according to their cleantech intensity. The classification was based on publicly avail-able information, mostly companies’ websites.
The Cleantech intensity scale:
1 = Peripheral role in the cleantech ecosystem2 = Support role in the cleantech ecosystem3 = Potential dedicated activity in cleantech4 = Clear dedicated activity, but not core business5 = Dedicated pure player in cleantech

ETLA Raportit – ETLA Reports No 43 10
Box 2.2 Company examples for different cleantech intensities
Example 1
Case: A gardening store that sells new fertilizers for home-farmers, developed from the leftovers of the food industry.
Intensity: 1
Argument: Selling a cleantech product does not make the retailer a cleantech company. It has a supporting role in the ecosystem, however.
Example 2
Case: A developer of embedded software, hardware and device solutions for wireless products and services in different industries.
Intensity: 3
Argument: While the company’s main markets are conventional industries such as automotive and telecommunication, its expertise in wireless solutions has great potential in the indus- trial internet space that drives many cleantech sectors such as smart grid or e-mobility.
Example 3
Case: A company that designs, develops and manufactures automated material handling systems. Consumers dispose of recyclable waste such as empty beverage tins, empty batteries and broken light bulbs at these machines.
Intensity: 5
Argument: The company is an active driver in the recycling sector, the sole objective of which is to reduce waste in the environment. It manufactures and develops essential solutions to the glass, aluminum and plastic recycling system. It has no other lines of business; it is a pure player.
Figure 1 breaks down the original, unedited and unfiltered data by the cleantech intensity of companies. Almost a third of the company population failed to provide tangible evidence of specialized cleantech activity, and another 20 percent sent only weak or ambiguous signals thereof. As said, the important supporting role of infrastructure construction companies, tech-nology- and business consultancies, financiers, generic component manufacturers, retailers and other stakeholders with very low intensity scores must be acknowledged from an ecosystem-wide perspective, but were discarded from further analyses in this report. The remaining 48 percent of the company population split fairly evenly across intensity values 3 to 5. Pure play-ers, obtaining an intensity value of 5, accounted for 13 percent of the population.

11From Cleantech to Cleanweb – The Finnish Cleantech Space in Transition
2.2 Industry classification – Manufacturing companies dominate Finnish cleantech As said, the cleantech space intrinsically defies any single industrial or technological defini-tion. One constructive approach to bring structure to the depiction of the space is to break it down by conventional industry classifications such as the European industrial activity classifi-cation (NACE) used by European statistics authorities.
As Figure 2 reveals, the Finnish cleantech space does not mirror the structure of the Finnish economy as a whole; it is a lot more manufacturing-centric. According to the data, more than a third of all cleantech companies in Finland operate in the manufacturing sector. The equiv-alent figure for the general economy is a mere seven percent. The importance of manufactur-ing in the cleantech space is even more dramatic when looking at the breakdown by turnover or number of employees. Over 60 percent of the turnover generated in the cleantech sector is generated in manufacturing. Similarly, more than half of the jobs in the cleantech space are of-fered by companies active in the manufacturing sector.
The dominance of manufacturing in the cleantech space can be the result of several comple-mentary issues:
1. The Finnish cleantech space simply is manufacturing driven. A focus on the develop-ment of physical technology rather than software and services can result in the relative dominance of engineering companies in the population.
2. Cleantech in Finland is largely understood and defined as an engineering-related activ-ity. Hence, the dominance of manufacturing in the population is a function of a rather narrow definition of cleantech itself (see the definition put forth by the OECD, for in-
Figure 1 Share of companies by cleantech intensity
No. Of comPercent Cum.Peripheral 509 31.65 31.65 1 = Peripheral role in the cSupport rol 335 20.83 52.49 2 = Support role in the cleaPotential d 292 18.16 70.65 3 = Potential dedicated actClear dedic 268 16.67 87.31 4 = Clear dedicated activityDedicated p 204 12.69 100 5 = Dedicated pure player
1 = No identified association
2 = A weak signal or unclear situation
3 = Some potential activity
4 = Clear activity, but not the sole/main business
5 = Full-on cleantech
31 %
21 %18 %
17 %
13 %
Cleantech intensity
Peripheral role in the cleantechecosystem
Support role in the cleantechecosystem
Potential dedicated activity incleantech
Clear dedicated activity, but notcore business
Dedicated pure player in cleantech

ETLA Raportit – ETLA Reports No 43 12
stance). A manufacturing-based approach to the definition is understandable from the economic developers’ perspective, given their focus on job creation.
3. The data only encompass companies with high cleantech intensity scores. By nature, software developers and service providers are more frequently generalists than manu-facturing companies and, therefore, might have obtained lower intensity scores. Hence, a relatively large share of non-manufacturing companies may have been excluded from the data.
4. On average, manufacturing companies are larger than companies in other sectors. Therefore, the importance of the manufacturing sector tends to be over-emphasized when looking at the data by volume-based indices such as turnover and number of em-ployees.
Moving on to other sectors, the share of companies in the sector pursuing professional, scien-tific and technical activities – e.g. legal and accounting activities, scientific research and devel-opment, technical testing and analysis, engineering activities or advertising and market research – is equally higher in the cleantech space (27%) than in the overall economy (11%). Turnover and employment –based comparisons yield less drastic differences as the average size of clean-tech companies active in this sector is relatively small.
The commerce as well as information and communication sectors obtain shares comparable to the Finnish industry in general, while the agriculture and forestry as well as construction sec-tors seem to be clearly underrepresented in the cleantech space.
2) Cleantech in Finland is largely understood and defined as an engineering-related activity. Hence, the dominance of manufacturing in the population is a function of a rather narrow definition of cleantech itself (see the definition put forth by the OECD, for instance). A manufacturing -based approach to the definition is understandable from the economic developers’ perspective, given their focus on job creation.
3) The data only encompass companies with high cleantech intensity scores. By nature, software developers and service providers are more frequently generalists than manufacturing companies and, therefore, might have obtained lower intensity scores. Hence, a relatively large share of non-manufacturing companies may have been excluded from the data.
4) On average, manufacturing companies are larger than companies in other sectors. Therefore, the importance of the manufacturing sector tends to be over-emphasized when looking at the data by volume-based indices such as turnover and number of employees.
Moving on to other sectors, the share of companies in the sector pursuing professional, scientific and technical activities – e.g. legal and accounting activities, scientific research and development, technical testing and analysis, engineering activities or advertising and market research – is equally higher in the cleantech space (27%) than in the overall economy (11%). Turnover and employment –based comparisons yield less drastic differences as the average size of cleantech companies active in this sector is relatively small.
Figure 2 Breakdown of data by NACE industry classification
36% 7%
62%
34%
53%
22%
5%
13%
5%
7%
10%
11%
27% 11%
1%3%
5%6%
0 %
10 %
20 %
30 %
40 %
50 %
60 %
70 %
80 %
90 %
100 %
Clea
ntec
h
All c
ompa
nies
Clea
ntec
h
All c
ompa
nies
Clea
ntec
h
All c
ompa
nies
No. of companies Turnover Employees
Other
Administrative and support serviceactivitiesProfessional, scientific and technicalactivitiesReal estate activities
Financial and insurance activities
Information and communication
Accommodation and food serviceactivitiesTransportation and storage
Wholesale and retail trade
Construction
Manufacturing
Agriculture, forestry and fishing
Figure 2 Breakdown of data by NACE industry classification

13From Cleantech to Cleanweb – The Finnish Cleantech Space in Transition
2.3 Size – Finnish cleantech companies are comparatively large The population of Finnish cleantech companies – as specified in this report – employs a total of 83,360 individuals. As Figure 3 shows, the majority of Finnish cleantech companies, nearly 70 %, are either micro enterprises or small and medium -sized enterprises (SMEs), employing less than 250 employees. Constituting more than a third of the population, micro enterprises that employ less than 10 individuals are particularly frequent. SMEs comprise 30% of the com-panies, while large enterprises that employ more than 250 individuals make up another 20%. Companies designated giants occupy a separate category. The reasoning behind this somewhat unconventional classification is a very practical one: a giant, employing more than 1000 indi-viduals and generating annual revenue in excess of 1 billion euros, can significantly distort the descriptive statistics in a small population – especially when subsections of the data are to be examined. For instance, out of the 13 000 patents held by the cleantech companies, more than 9 700 are owned by Nokia. For this reason, the giants were treated as a separate sample and ex-cluded from the reports analyses and averages presented hereafter.
We identified six giants in the data, all of which operate in the manufacturing sector: Wärtsilä Oyj, Neste Oil Oyj, Nokia Oyj, UPM-Kymmene Oyj, Stora Enso Oyj and non-listed ABB Oy. These six companies account for roughly 80 % of the turnover of all cleantech companies in the manufacturing sector and more than 65 % of the entire Finnish cleantech space.
Interestingly, the proportion of large and giant companies is notably larger in the cleantech space than in the Finnish industry as a whole. In 2012 Finland’s total company population mainly consisted of micro -sized companies: more than 90 % of the population were micro en-
The commerce as well as information and communication sectors obtain shares comparable to the Finnish industry in general, while the agriculture and forestry as well as construction sectors seem to be clearly underrepresented in the cleantech space.
Size – Finnish cleantech companies are comparatively large
The population of Finnish cleantech companies – as specified in this report – employs a total of 83,360 individuals. As Figure 3 shows, the majority of Finnish cleantech companies, nearly 70 %, are either micro enterprises or small and medium -sized enterprises (SMEs), employing less than 250 employees. Constituting more than a third of the population, micro enterprises that employ less than 10 individuals are particularly frequent. SMEs comprise 30% of the companies, while large enterprises that employ more than 250 individuals make up another 20%. Companies designated giants occupy a separate category. The reasoning behind this somewhat unconventional classification is a very practical one: a giant, employing more than 1000 individuals and generating annual revenue in excess of 1 billion euros, can significantly distort the descriptive statistics in a small population – especially when subsections of the data are to be examined. For instance, out of the 13 000 patents held by the cleantech companies, more than 9 700 are owned by Nokia. For this reason, the giants were treated as a separate sample and excluded from the reports analyses and averages presented hereafter.
Figure 3 Cleantech company population by size
We identified six giants in the data, all of which operate in the manufacturing sector: Wärtsilä Oyj, Neste Oil Oyj, Nokia Oyj, UPM-Kymmene Oyj, Stora Enso Oyj and non-listed ABB Oy. These six companies account for roughly 80 % of the turnover of all cleantech companies in the manufacturing sector and more than 65 % of the entire Finnish cleantech space.
Interestingly, the proportion of large and giant companies is notably larger in the cleantech space than in the Finnish industry as a whole. In 2012 Finland’s total company population mainly consisted of micro -sized
0%
5%
10%
15%
20%
25%
30%
35%
40%
Micro(0-9 employees)
SME (10-249) Large (250-1000) Giant (>1000)
Shar
e of
com
pani
es
Figure 3 Cleantech company population by size

ETLA Raportit – ETLA Reports No 43 14
terprises, of which more than 60 % employed only one person16. These one-person companies often operate in the services sector, such as education, personnel services, as well as beauty-, so-cial- and healthcare services. Comparatively, the 35 % of cleantech companies that employed less than 10 individuals seems a rather small share.
2.4 Ownership – Foreign-owned firms make more money The Finnish cleantech sector consists mainly of privately owned, domestic companies: Rough-ly 83 % of the cleantech companies are private and in domestic ownership. Finnish municipal-ities own three percent and the government one percent of the companies. 12% are in foreign ownership.
To add depth to the examination, we can break down the revenue volumes by ownership type, for instance, and ask how domestic companies fare in comparison to their foreign-owned counterparts. Figure 4 reveals interesting results: On average, a foreign-owned company seems to generate higher revenues than a private, domestically owned cleantech company. This is true for both un-weighted and weighted results17.
There are multiple factors that can play into the finding, ranging from a stronger market posi-tion and superior business models to more direct access to global markets through the foreign parent organizations’ established channels. Regrettably, the data do not provide enough evi-dence to validate these reasons empirically. One explanation that can be grounded in the data, however, is size differential. The average size of foreign-owned companies is significantly larger (284 employees) than that of private domestic companies (95 employees). Government-owned companies are the largest. They employ 493 individuals on average.
16 Source: Statistics Finland.17 To correct the presented averages for distorting size effects of a very uneven size distribution of companies, the results have been weighted based on each company’s number of employees.
companies: more than 90 % of the population were micro enterprises, of which more than 60 % employed only one person17. These one-person companies often operate in the services sector, such as education, personnel services, as well as beauty-, social- and healthcare services. Comparatively, the 35 % of cleantech companies that employed less than 10 individuals seems a rather small share.
Ownership – Foreign-owned firms make more money
The Finnish cleantech sector consists mainly of privately owned, domestic companies: Roughly 83 % of the cleantech companies are private and in domestic ownership. Finnish municipalities own three percent and the government one percent of the companies. 12% are in foreign ownership.
To add depth to the examination, we can break down the revenue volumes by ownership type, for instance, and ask how domestic companies fare in comparison to their foreign-owned counterparts. Figure 4 reveals interesting results: On average, a foreign-owned company seems to generate higher revenues than a private, domestically owned cleantech company. This is true for both un-weighted and weighted results18.
There are multiple factors that can play into the finding, ranging from a stronger market position and superior business models to more direct access to global markets through the foreign parent organizations’ established channels. Regrettably, the data do not provide enough evidence to validate these reasons empirically. One explanation that can be grounded in the data, however, is size differential. The average size of foreign-owned companies is significantly larger (284 employees) than that of private domestic companies (95 employees). Government-owned companies are the largest. They employ 493 individuals on average.
Figure 4 Average turnover by ownership type (giants excluded)
17 Source: Statistics Finland 18 To correct the presented averages for distorting size effects of a very uneven size distribution of companies, the results have been weighted based on each company’s number of employees.
0 €
50 000 000 €
100 000 000 €
150 000 000 €
200 000 000 €
250 000 000 €
300 000 000 €
Not weighted
Weighted based on the no. ofpersonnel
Figure 4 Average turnover by ownership type (giants excluded)
15From Cleantech to Cleanweb – The Finnish Cleantech Space in Transition
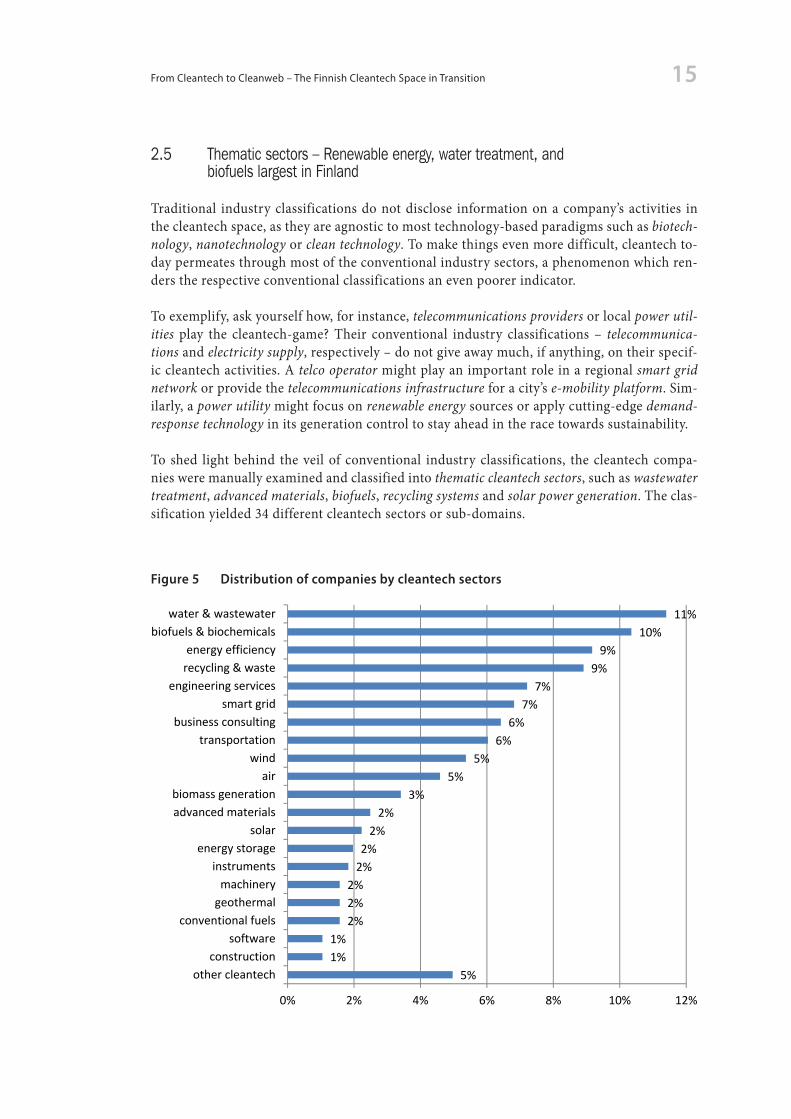
2.5 Thematic sectors – Renewable energy, water treatment, and biofuels largest in Finland Traditional industry classifications do not disclose information on a company’s activities in the cleantech space, as they are agnostic to most technology-based paradigms such as biotech-nology, nanotechnology or clean technology. To make things even more difficult, cleantech to-day permeates through most of the conventional industry sectors, a phenomenon which ren-ders the respective conventional classifications an even poorer indicator.
To exemplify, ask yourself how, for instance, telecommunications providers or local power util-ities play the cleantech-game? Their conventional industry classifications – telecommunica-tions and electricity supply, respectively – do not give away much, if anything, on their specif-ic cleantech activities. A telco operator might play an important role in a regional smart grid network or provide the telecommunications infrastructure for a city’s e-mobility platform. Sim-ilarly, a power utility might focus on renewable energy sources or apply cutting-edge demand-response technology in its generation control to stay ahead in the race towards sustainability.
To shed light behind the veil of conventional industry classifications, the cleantech compa-nies were manually examined and classified into thematic cleantech sectors, such as wastewater treatment, advanced materials, biofuels, recycling systems and solar power generation. The clas-sification yielded 34 different cleantech sectors or sub-domains.
Figure 5 Distribution of companies by cleantech sectors
Value added – Smart grid, biofuels and energy efficiency sectors contribute most to the economy
To gauge the real impact that industrial activities have on a country’s economy one has to look beyond mere company frequencies. The foremost indicator economists pay attention to is the value added. “The value added measures the total value added produced by the various factors of production in an establishment's [here the companies’] actual operating activities.”20 In more operational terms, the value added is calculated as the sum of labor costs, depreciation and amortization, rents, and profits. Alternatively, one can subtract the cost of all factors of production that have been produced outside the company – i.e. procurements – from a company’s revenue.
The value added can be calculated for entire sectors by adding together the value added of companies that comprise it. The value added is an important measure for the purposes of economic development because, by definition, it quantifies the net volume of local, regional, or national production. Typically, the value added positively correlates with employment, one of the key metrics keenly monitored by economic developers.
20 Source: Statistics Finland
5%1%1%
2%2%2%
2%2%
2%2%
3%5%
5%6%
6%7%
7%9%
9%10%
11%
0% 2% 4% 6% 8% 10% 12%
other cleantechconstruction
softwareconventional fuels
geothermalmachinery
instrumentsenergy storage
solaradvanced materialsbiomass generation
airwind
transportationbusiness consulting
smart gridengineering services
recycling & wasteenergy efficiency
biofuels & biochemicalswater & wastewater
Figure 5 Distribution of companies by cleantech sectors

ETLA Raportit – ETLA Reports No 43 16
The results presented in Figure 5 show that the sectors water and wastewater treatment (11%), biofuels and bio-chemicals (10%), energy efficiency (9%), as well as recycling and waste treat-ment (9%) are the most abundant in Finland.18 It is important to highlight that renewable en-ergy generation – combining solar, wind, biomass, hydro and geothermal power generation – would account for 12% of the cleantech companies and therefore represent the largest single cleantech sector. To avoid compromising the level of detail in this report, however, we keep the sectors separate. The sector Other cleantech includes sectors such as mining, hydro and marine power, fuel cells and hydrogen, metals, electronics and environmental services. The complete list of sectors and the respective company frequencies is available in Table A1 in the Appendix 1.
2.6 Value added – Smart grid, biofuels and energy efficiency sectors contribute most to the economy To gauge the real impact that industrial activities have on a country’s economy one has to look beyond mere company frequencies. The foremost indicator economists pay attention to is the value added. “The value added measures the total value added produced by the various fac-tors of production in an establishment’s [here the companies’] actual operating activities.”19 In more operational terms, the value added is calculated as the sum of labor costs, deprecia-tion and amortization, rents, and profits. Alternatively, one can subtract the cost of all factors of production that have been produced outside the company – i.e. procurements – from a com-pany’s revenue.
18 The classification is based on the authors’ views and is therefore subjective. In the case that a company operates in more than one cleantech sector, the most focal sector was chosen.19 Source: Statistics Finland.
Figure 6 Value added by cleantech sector
Figure 6 reveals that, in absolute volumes, the smart grid (€431M), biofuels and biochemicals (€396M) as well as energy efficiency (€380M) -sectors generate the most value added in the Finnish cleantech space. The eight sectors depicted in the figure produce nearly 75% of the value added of the whole cleantech space captured by the data. The giants, as defined earlier, have been excluded from the analysis. Note that renewable energy generation would rank second with a total value added of €429M if it were treated as an integrated sector in the report. For a more detailed breakdown of value added by sector, please consult the appendix section.
It is interesting to see that populous sectors such as water and wastewater treatment as well as recycling and waste do not generate value added in proportion to the sectors company frequencies. This can be a function of many factors such as comparatively lower revenues, smaller average company size or a higher share of factors of production procured from outside the sectors.
The value added can be also harnessed to determine the productivity of employment – i.e. the value added per employee21 – within sectors. Figure 6 demonstrates that absolute value added does not necessarily always coincide with the average value added per employee. Productivity seems to be especially high in the conventional fuels -sector, which as a sector produces comparatively little value added. The average value added per person in the sector is over €180,000, more than twice as much as in the recycling and waste as well as the water and wastewater treatment -sectors. Biomass generation is another highly productive sector when compared to its absolute value added. For a breakdown of the average value added per employee by company size, please consult Figure 7.
21 As already noted earlier, the productivity index for the different sectors used here is weighted by the companies’ number of employees.
- €50 000 000 €100 000 000 €150 000 000 €200 000 000 €250 000 000 €300 000 000 €350 000 000 €400 000 000 €450 000 000 €500 000 000 €
- €20 000 €40 000 €60 000 €80 000 €
100 000 €120 000 €140 000 €160 000 €180 000 €200 000 €
Sum
of v
alue
add
ed in
the
sect
or
Valu
e ad
ded
per e
mpl
oyee
Sum of value added of the sector Value added per person
Figure 6 Value added by cleantech sector

17From Cleantech to Cleanweb – The Finnish Cleantech Space in Transition
The value added can be calculated for entire sectors by adding together the value added of companies that comprise it. The value added is an important measure for the purposes of eco-nomic development because, by definition, it quantifies the net volume of local, regional, or na-tional production. Typically, the value added positively correlates with employment, one of the key metrics keenly monitored by economic developers.
Figure 6 reveals that, in absolute volumes, the smart grid (€431M), biofuels and biochemicals (€396M) as well as energy efficiency (€380M) -sectors generate the most value added in the Finnish cleantech space. The eight sectors depicted in the figure produce nearly 75% of the val-ue added of the whole cleantech space captured by the data. The giants, as defined earlier, have been excluded from the analysis. Note that renewable energy generation would rank second with a total value added of €429M if it were treated as an integrated sector in the report. For a more detailed breakdown of value added by sector, please consult the Appendix 1 section.
It is interesting to see that populous sectors such as water and wastewater treatment as well as recycling and waste do not generate value added in proportion to the sectors company fre-quencies. This can be a function of many factors such as comparatively lower revenues, small-er average company size or a higher share of factors of production procured from outside the sectors.
The value added can be also harnessed to determine the productivity of employment – i.e. the value added per employee20 – within sectors. Figure 6 demonstrates that absolute value add-ed does not necessarily always coincide with the average value added per employee. Produc-tivity seems to be especially high in the conventional fuels -sector, which as a sector produc-es comparatively little value added. The average value added per person in the sector is over €180,000, more than twice as much as in the recycling and waste as well as the water and waste-water treatment -sectors. Biomass generation is another highly productive sector when com-pared to its absolute value added. For a breakdown of the average value added per employee by company size, please consult Figure 7.
20 As already noted earlier, the productivity index for the different sectors used here is weighted by the companies’ number of em-ployees.
Figure 7 Average value added per employee by company size
While value added is a convenient indicator for illustrating the ability of sectors to create value and assessing their importance to the overall economy, it is important to keep in mind that it is also volatile and susceptible to manipulation. For instance, multinational companies are able to undertake international transactions to register profits and costs in countries other than their origin. These transactions, typically executed for the purposes of tax minimization, can influence the total value added in sectors with large numbers of multinational companies.
Performance - Overall returns are decent but SMEs, in particular, struggle with profitability
The financial performance22 of companies can be measured with a number of indicators. Here, we employ four: return on assets (ROA), return on equity (ROE), earnings before interests and taxes (EBIT), and the profit margin.
Breaking down the data by company size, Figure 8 clearly shows that, on average, small companies in particular struggle with profitability. While the strongly negative results for micro-sized businesses can still be argued to reflect expected patterns for businesses in the pre-revenue phase23, the figures for SMEs are somewhat alarming.
Given that SMEs in general are considered the backbone of economic stability as well as the engine for economic renewal and job creation24, the long-term financial health of SMEs is essential for the buildup of a viable and thriving cleantech ecosystem in Finland. While investors, in theory, still have been able to appropriate decent average returns (12% ROE), the financial sustainability of SMEs in the cleantech space needs attendance. An average operating margin of -7% is a clear signal of financial distress unless it is not
22 The outliers have been treated by using a winsoring method; 2,5% of the extreme values are set to the value of the 97,5th percentile. The averages are weighted using the number of personnel. 23 In the data, there is significant positive correlation (95% significance level) between company age and size. 24 66,5% of European jobs were provided by SMEs in 2012 (European Commission, 2013).
- €
20 000 €
40 000 €
60 000 €
80 000 €
100 000 €
120 000 €
140 000 €
160 000 €
Micro SME Large Giant All
Figure 7 Average value added per employee by company size

ETLA Raportit – ETLA Reports No 43 18
While value added is a convenient indicator for illustrating the ability of sectors to create val-ue and assessing their importance to the overall economy, it is important to keep in mind that it is also volatile and susceptible to manipulation. For instance, multinational companies are able to undertake international transactions to register profits and costs in countries other than their origin. These transactions, typically executed for the purposes of tax minimization, can influence the total value added in sectors with large numbers of multinational companies.
2.7 Performance – Overall returns are decent but SMEs, in particular, struggle with profitability The financial performance21 of companies can be measured with a number of indicators. Here, we employ four: return on assets (ROA), return on equity (ROE), earnings before interests and taxes (EBIT), and the profit margin.
Breaking down the data by company size, Figure 8 clearly shows that, on average, small com-panies in particular struggle with profitability. While the strongly negative results for micro-sized businesses can still be argued to reflect expected patterns for businesses in the pre-reve-nue phase22, the figures for SMEs are somewhat alarming.
Given that SMEs in general are considered the backbone of economic stability as well as the engine for economic renewal and job creation23, the long-term financial health of SMEs is es-sential for the buildup of a viable and thriving cleantech ecosystem in Finland. While inves-tors, in theory, still have been able to appropriate decent average returns (12% ROE), the fi-nancial sustainability of SMEs in the cleantech space needs attendance. An average operating margin of -7% is a clear signal of financial distress unless it is not the random result of nor-mal temporal variation that can occur in cross-sectional, single-year (2012) data such as those used in this report.
The fact that the indicator has been constructed as a weighted average value of all SMEs in the sample, however, clearly argues against this possible explanation. Averages are much less prone to suffer from variation-related effects as the aggregate results tend to converge towards
21 The outliers have been treated by using a winsoring method; 2,5% of the extreme values are set to the value of the 97,5th percen-tile. The averages are weighted using the number of personnel. 22 In the data, there is significant positive correlation (95% significance level) between company age and size.23 66,5% of European jobs were provided by SMEs in 2012 (European Commission, 2013).
Figure 8 Financial performance by company size
Micro SME Large Giant All cleantech
Operating margin -42 % -7 % 4 % 2 % 0 %
Profit margin -46 % -10 % 5 % 6 % 1 %
ROI 0 % 12 % 16 % 16 % 14 %
ROA 1 % 7 % 9 % 9 % 8 %
Asset turnover ratio 2 % 2 % 2 % 1 % 2 %
To complement the discussion, we can also look at the financial performance of cleantech companies by sector. Figure 9 shows the results for the six largest sectors as measured by value added. A closer look reveals that the companies in these sectors financially outperform the rest of the cleantech population on average25 (population averages shown in dashed lines). With a six and five percent profit margin, respectively, the engineering services and water and wastewater -sectors generate the highest profits. Both are still below the average general industry benchmark of seven percent. The smart grid and energy efficiency -sectors trail in third and fourth places with four and three percent margins, respectively. The lowest profit margins are found in the agriculture and forestry (-151%), hydro and marine power (-88%), solar power (-47%) and nuclear power (-34%) -sectors (see Table A3 in the Appendix). Note that some of the latter sectors have very low company frequencies such as agriculture and forestry (6 companies) and hydro and marine power (6 companies).
Figure 9 financial performances by cleantech sector
25 Outliers have been subjected to 90% Winsorization: indicator values below the 5th percentile have been set to the 5th percentile, and values above the 95th percentile have been set to the 95th percentile. In addition, the averages are weighted using the number of personnel. Giants are excluded from the analysis.
Figure 8 Financial performance by company size

19From Cleantech to Cleanweb – The Finnish Cleantech Space in Transition
the mean. Also, when benchmarked against the excluded cohort of companies with low inten-sity scores (1 and 2), cleantech-intensive companies indeed fare far worse. This is another ar-gument in support of the robustness of the overall finding. On a more optimistic note, large companies fare much better which, on the other hand, is quite intuitive given the universal survivor bias that grows with the average age of businesses in statistical datasets: only profita-ble companies survive in the long-term.
While profitability is seemingly low in the cleantech space, the story is not necessarily as gloomy from an investor’s point of view. According to Statistics Finland, the average Return on Assets (ROA) percentage of the Finnish industry in 2012 was 5.4 %; for SMEs the figure was 4.4 %. The corresponding figures for the cleantech space are 6.9 % and 8.3 %. The figures for ROE are even higher. While the returns have been smaller, they have been generated with low-er assets and capital inputs.
The result can be interpreted in many ways. One is to say that the cleantech space is under-capitalized but has capital-efficient companies. The intrinsically efficient companies gener-ate smaller profits simply because they have been unable to tap into large enough pools of re-sources or unwilling to invest into growth. Reasons can be manifold, ranging from the ina-
The investment-related performance indicators show a lot more potential, as shown in Figure 9. Some of the cleantech sectors clearly outperform the general Finnish industry, which on average returns 14 percent on investments. Smart grid (41% ROI), engineering services (26% ROI and 16% ROA) and water and wastewater treatment (20% ROI) are the most notable examples. Again, the agriculture and forestry (-35%) as well as solar power (-12%) are the poorest performing sectors.
Intellectual property rights – Do patents uncover a deficiency in consumer-oriented solutions?
Intellectual property rights are used for a plethora of purposes in research. Ranging from a measure of innovativeness to a tangible support in tracking technological evolution, patent data in particular are a widely used resource to probe the inherently fuzzy and ambiguous dimension of innovation. Patent data surely have their flaws. Patents are only one form of intellectual property protection, and many times companies revert to other methods such as secrecy or lead-time. Hence, patents are in no way an exhaustive, all-encompassing measure. Patenting practices also differ from industrial sector to the other, making comparisons challenging. Here, patents are used to describe the technological space of Finnish
4% 3%
7%
3%
5%4%
1%
6%4%
5%
13%
9%
26%
11%
41%
20%
8%7%
16%
9%
13% 13%
2% 2% 2%3%
2%0%
5%
10%
15%
20%
25%
30%
35%
40%
45%
biofuels &biochemicals
energy efficiency engineeringservices
recycling & waste smart grid water &wastewater
Operating margin
Profit margin
ROI
ROA
Asset turnover -ratio
Figure 9 financial performances by cleantech sector

ETLA Raportit – ETLA Reports No 43 20
bility to raise financing and the smallness of targeted markets to a reluctance to grow. Be it as it may, given the fairly good efficiency and large enough growth opportunities, larger cap-ital inputs should result in higher profits. This doesn’t hold true for loss-making companies, of course.
A less flamboyant interpretation is of statistical nature. As shown earlier, the companies in the cleantech space are significantly larger in terms of revenue and personnel when compared to Finnish companies in general. These, and the differences in other dimensions such as indus-try distribution, might play a significant role in the statistical differences in the observed prof-itability indicators. In order to pin down the causalities behind the differences more profound statistical analysis is needed.
To complement the discussion, we can also look at the financial performance of cleantech companies by sector. Figure 9 shows the results for the six largest sectors as measured by val-ue added. A closer look reveals that the companies in these sectors financially outperform the rest of the cleantech population on average24 (population averages shown in dashed lines). With a six and five percent profit margin, respectively, the engineering services and water and wastewater -sectors generate the highest profits. Both are still below the average general in-dustry benchmark of seven percent. The smart grid and energy efficiency -sectors trail in third and fourth places with four and three percent margins, respectively. The lowest profit margins are found in the agriculture and forestry (-151%), hydro and marine power (-88%), solar power (-47%) and nuclear power (-34%) -sectors (see Table A3 in the Appendix 1). Note that some of the latter sectors have very low company frequencies such as agriculture and forestry (6 com-panies) and hydro and marine power (6 companies).
The investment-related performance indicators show a lot more potential, as shown in Fig-ure 9. Some of the cleantech sectors clearly outperform the general Finnish industry, which on average returns 14 percent on investments. Smart grid (41% ROI), engineering services (26% ROI and 16% ROA) and water and wastewater treatment (20% ROI) are the most notable ex-amples. Again, the agriculture and forestry (-35%) as well as solar power (-12%) are the poor-est performing sectors.
2.8 Intellectual property rights – Do patents uncover a deficiency in consumer-oriented solutions? Intellectual property rights are used for a plethora of purposes in research. Ranging from a measure of innovativeness to a tangible support in tracking technological evolution, patent da-ta in particular are a widely used resource to probe the inherently fuzzy and ambiguous dimen-sion of innovation. Patent data surely have their flaws. Patents are only one form of intellec-tual property protection, and many times companies revert to other methods such as secrecy or lead-time. Hence, patents are in no way an exhaustive, all-encompassing measure. Patent-ing practices also differ from industrial sector to the other, making comparisons challenging. Here, patents are used to describe the technological space of Finnish cleantech. What specif-ic technological fields does Finnish cleantech comprise of? As a word of caution, we need to
24 Outliers have been subjected to 90% Winsorization: indicator values below the 5th percentile have been set to the 5th percentile, and values above the 95th percentile have been set to the 95th percentile. In addition, the averages are weighted using the number of personnel. Giants are excluded from the analysis.

21From Cleantech to Cleanweb – The Finnish Cleantech Space in Transition
point out that especially software, data and service-based businesses are strongly underrepre-sented in the following analyses for the sheer fact that they are not patentable in the European context; another flaw of patent data as a statistical proxy for innovation and technology.
That being said, 192 out of the 760 cleantech companies in the data – one quarter of the pop-ulation – hold at least one patent. For an allegedly technology-driven industry it is not an ex-ceptionally high share. It seems that many of the businesses in the cleantech space are not nec-essarily built around proprietary technology. In total, the companies hold roughly 13 000 pat-ents, of which more than 9700 are owned by Nokia. The majority of other patent holders in the data hold only a few patents: less than 20 % boast more than 10. In the following analyses the giants, including Nokia, are excluded.
To help in a structured analysis, the patents are categorized according to a patent classifica-tion. The classification used in this report is developed by Mancusi25 and encompasses six broad technological fields: electronics, instruments, chemicals and pharmaceuticals, processes, machinery as well as consumer goods and civil engineering technologies. These six categories are further divided into 30 technologies.
As Figure 10 reveals, the majority of the patents26 reside in the categories mechanical, process, or electrical engineering. To no surprise, actively patenting companies operate most frequent-ly in the manufacturing industry: out of the 174 companies that have at least one patent, more than 100 are in the manufacturing industry.
25 Mancusi (2003).26 The patents of the ”giants” are excluded from the analysis.
patents, such as methods that are merely computer- or cloud-based applications of familiar ideas, such as financial transactions or price-based models28.
Figure 10 Breakdown of cleantech patents by technological field
A closer look at the three engineering patent categories reveals that electronic devices and electrical engineering (electrical engineering), as well as handling and printing (mechanical engineering) are clearly the two single most important technology categories that Finnish cleantech companies patent in (see Figure 11). To clarify, the category handling includes patents on packing, storing, lifting, and hauling technologies. Surface technologies and thermal processes (process engineering) are the next most frequent categories.
28 [http://www.supremecourt.gov/opinions/13pdf/13-298_7lh8.pdf; Alice Corporation PTY. LTD. v. CLS Bank International et al.; October 2013]
9366
0 200 400 600 800 1000 1200 1400 1600 1800 2000
Other/no match
Consumer goods and civil engineering
Chemicals and pharmaceuticals
Instruments
Electrical engineering
Process engineering
Mechanical engineering
Nokia Other cleantech
Figure 10 Breakdown of cleantech patents by technological field

ETLA Raportit – ETLA Reports No 43 22
Consumer-oriented technologies are clearly underrepresented; a result, which gives rise to a very interesting discussion on the dangers of Finnish cleantech companies missing out on the massive growth opportunities that consumer markets currently offer.
Three sectors, in particular, put major strain on the sustainability of consumption of planetary resources today: Transportation, food and feeds, and housing. In all three sectors it is consum-ers that drive the overall consumption. Hence, many companies around the globe that could be branded cleantech are developing solutions geared towards motivating consumers to adopt more resource-efficient practices (Uber, Airbnb, Revolv, SmartThings). According to a rule of thumb, one unit saved in consumption translates into three units saved in production. The combined effect on resource consumption can be exponential.
Sure, a large share of these solutions is service and software -based and will not show up in patent statistics for the simple reason of not being patentable in Europe. Hence, a lack of pat-ents in consumer-related technology is not necessarily alarming, but many of these services encompass a technological component in the form of sensors, transmitters, receivers, termi-nals etc. that might involve opportunities for developing proprietary technological solutions. These should show up as patenting activity. In the US, the types of patents addressing the con-sumer markets through ”cleanweb” products encompass mobile device applications, place-based (e.g. GPS) tracking and decision support systems, logistics, and driver or product rating strategies. However, the US Supreme Court narrowed the type of inventions that are eligible for patents, such as methods that are merely computer- or cloud-based applications of famil-iar ideas, such as financial transactions or price-based models27.
27 [http://www.supremecourt.gov/opinions/13pdf/13-298_7lh8.pdf; Alice Corporation PTY. LTD. v. CLS Bank International et al.; Octo-ber 2013]
Figure 11 Breakdown of engineering patents by subcategory
Breaking down patenting frequencies by cleantech sector, in turn, shows that sectors with large numbers of companies also tend to have the most patents (see Figure 12 below). More than one third of all patents are held by companies that operate in the sector energy efficiency.
The result is intuitive. First, energy efficiency is a very loosely demarcated sector that covers manufacturers and developers of products and services that are exploited across other cleantech sectors. The interpretation finds support in the division of the energy efficiency companies across conventional industry classes: while companies in the cleantech sectors cables, metals, and electronics all operate in the manufacturing industry, energy efficiency is a lot more diverse. It comprises companies that operate in the manufacturing, construction, wholesale and trade, ICT and R&D industries.
Second, many argue that the purpose of cleantech, first and foremost, is to facilitate an efficient exploitation of resources. Hence, energy efficiency, by way of definition, can be expected to encompass a fairly large share of companies. This reflects on the sheer volume of immaterial property generated in the sector. Not only is the total number of patents high, but the number of patents per company clearly outshines the equivalent figure in any other sector. To avoid misleading interpretations of the result, we should emphasize that the finding is partly explained by the bigger size of the companies in the energy efficiency sector. Please note that the giants are not included in the analysis.
0100200300400500600
Audi
o vi
sual
tech
nolo
gy
Info
rmat
ion
tech
nolo
gy
Sem
icon
duct
ors
Tele
com
mun
icat
ions
Elec
tron
ic d
evic
es a
nd…
Nuc
lear
eng
inee
ring
Spac
e te
chno
logy
Food
pro
cess
ing
Mac
hine
s and
tool
s
Engi
nes a
nd p
umps
Tran
spor
t
Mec
hani
cal e
lem
ents
Hand
ling
Envi
ronm
enta
l tec
hnol
ogy
Mat
eria
ls pr
oces
sing
Chem
ical
eng
inee
ring
Oila
nd b
asic
mat
eria
l…
Ther
mal
pro
cess
es
Surf
aces
Electrical engineering Mechanical engineering Process engineering
Figure 11 Breakdown of engineering patents by subcategory

23From Cleantech to Cleanweb – The Finnish Cleantech Space in Transition
A closer look at the three engineering patent categories reveals that electronic devices and elec-trical engineering (electrical engineering), as well as handling and printing (mechanical engi-neering) are clearly the two single most important technology categories that Finnish clean-tech companies patent in (see Figure 11). To clarify, the category handling includes patents on packing, storing, lifting, and hauling technologies. Surface technologies and thermal processes (process engineering) are the next most frequent categories.
Breaking down patenting frequencies by cleantech sector, in turn, shows that sectors with large numbers of companies also tend to have the most patents (see Figure 12). More than one third of all patents are held by companies that operate in the sector energy efficiency.
The result is intuitive. First, energy efficiency is a very loosely demarcated sector that covers manufacturers and developers of products and services that are exploited across other clean-tech sectors. The interpretation finds support in the division of the energy efficiency compa-nies across conventional industry classes: while companies in the cleantech sectors cables, met-als, and electronics all operate in the manufacturing industry, energy efficiency is a lot more di-verse. It comprises companies that operate in the manufacturing, construction, wholesale and trade, ICT and R&D industries.
Second, many argue that the purpose of cleantech, first and foremost, is to facilitate an effi-cient exploitation of resources. Hence, energy efficiency, by way of definition, can be expect-ed to encompass a fairly large share of companies. This reflects on the sheer volume of imma-terial property generated in the sector. Not only is the total number of patents high, but the number of patents per company clearly outshines the equivalent figure in any other sector. To avoid misleading interpretations of the result, we should emphasize that the finding is partly explained by the bigger size of the companies in the energy efficiency sector. Please note that the giants are not included in the analysis.
Figure 12 Total number of patents and patents per company by cleantech sector
0
5
10
15
20
25
30
35
40
0100200300400500600700800900
Pate
nts p
er c
ompa
ny
No.
of p
aten
ts
Total no. of patents Patents per company
Figure 12 Total number of patents and patents per company by cleantech sector

ETLA Raportit – ETLA Reports No 43 24
3 The bottomline – Are the engineering focus and financial distress of SMEs a drag on the long-term viability of the Finnish cleantech space? Ever since its break with an agrarian base, the growth of the Finnish economy has been spear-headed by high-profile, engineering- and manufacturing-driven companies such as Outokum-pu, Wärtsilä, Metso, Kone, Nokia, Rautaruukki, and UPM. Hand in hand, the reverence of en-gineering skills and education has shaped the perceptions of the professional hierarchy in the country. Only the rare brain surgeon bests the engineer in public respect, and only for the rea-son that Finnish rocket scientists are close to non-existent. It is quite descriptive that, in the aftermath of the latest economic crisis in Europe, the Finnish public started discussing the threats of mass unemployment really only after the unemployment rate of engineers, thought untouchable, soared to an all-time high beyond 4.5% in 201428. Finland has a legacy in engi-neering; there is no denying the fact.
Our results strongly reflect this legacy. The data provided by the central stakeholders in the economic development of the country show that manufacturing businesses are the clear cent-er of gravity in the cleantech space, even more so than in the Finnish industry in general. It is fairly irrelevant whether this is because of a perspective economic developers in Finland have adopted or because the majority of Finnish cleantech companies are engineering-driven. What matters is that, in the gold rush era of digitalization, a heavily manufacturing- and engineering focused company base can quickly become the ball and chain to the mid-to-long-term growth of the industry.
Let us exemplify. Ford Motor Company, one of the world’s best known car manufacturers, is looking ahead with soft and jittery knees: In the light of recent developments in digitaliza-tion, big and open data, and the diminishing interest in owning vehicles amongst the young-er generations, the company has estimated that in ten years 80 percent of the value of the car will reside outside the car. The vehicle is expected to turn into a commoditized sensor plat-form, vacuuming data on the vehicle’s environment and the behavior of its passengers, only to be fed to third parties for business development. While the car is turning into a moving hard-ware platform for the mobile office, entertainment center and shopping mall, it is the data an-alytics businesses, on-line retail brands, insurance companies and other service providers who will reap the profits generated by business models built on top of the commoditized, low-mar-gin car as a hardware platform. Hence, Ford is asking itself the strategic question whether it should actually move up the vertical and horizontal value chains to position itself as a technol-ogy company, as its CEO recently did at the Consumer Electronics Show in Las Vegas. Hang-ing on to the legacy seems to come with the risk of being pushed to the proverbial periphery of the new, emerging e-mobility ecosystem29.
Similar stories could be told about the emerging smart grid ecosystem, where telcos and data analytics companies currently fight for dominance of the demand-response space, an area in which power utilities should reign superior.
28 TEK (2015).29 Crothers (2015).

25From Cleantech to Cleanweb – The Finnish Cleantech Space in Transition
That being said, where are all the service businesses in the Finnish cleantech space? Where are the Finnish equivalents to Lyft, EnerNOC, Stem, Uber, Airbnb, etc.? Not on the lists of Finn-ish economic developers, it seems. And we cannot blame them. Even for a scholar of indus-trial renewal, these businesses are extremely hard to find. Many of the companies are still in the start-up phase. Peloton Club, an accelerator focusing on consumer cleantech solutions for Finnish efficiency companies and run by DEMOS Helsinki, caters to the needs of young com-panies that develop new consumer solutions for more sustainable energy usage: Peer-to-peer courier service provider PiggyBaggy; Fourdeg, an intelligent thermostat company; Weegos, a service that turns city-owned vehicles into a car fleet in joint use; Sharetribe, a sharing-econ-omy platform enabling peer-to-peer exchanges; Moralguard, an application to help consumers shop according to their values; and Re-Pack, packaging system for online retailers and shop-pers whereby delivery packages can be returned. These companies are heralds of growing ser-vice-based activity in the Finnish cleantech space, which clearly needs urgent redefinition to accommodate more businesses outside the engineering domain.
These companies have earned the honorary title of pioneer for yet another reason: their of-fering is mainly geared towards consumer markets. As demonstrated earlier, preliminary evi-dence shows a deficiency in Finnish innovations in the consumer domain – a finding that is in support of a disproportionately engineering-driven take on cleantech in the country. Con-sumer markets should not be neglected in the development of Finnish cleantech. Among the four fastest growing businesses30 in the world, three consumer brands have wedged themselves a position: Apple, Google and Microsoft. With the proliferation and mass adoption of smart consumer technologies as well as global trends such as the quantified self -movement, open data, smart city and the rise of the internet of things, we have barely witnessed the kindling of the po-tential wildfire that will sweep over our way of living and hopefully will see to wide-reaching improvements to overall economic, social and ecological sustainability in the very near future.
To ride the cleantech wave as a global forerunner necessitates catching and harnessing the rip-tide of change in the consumer domain. In a best possible scenario, it will be an integral part of a Finnish cleantech ecosystem that complements the already existing skeleton of manufac-turing- and engineering-driven company base. What the sector needs now is open-minded-ness on part of economic developers for a broader view of cleantech, adventurous courage on part of the existing industry and the government for opening its current technology platforms as well as databases for new service-based business models, and more growth-oriented busi-nesses which pioneer consumer markets with service-based smart solutions.
To do so means that the industry needs to learn to closely test prototypes with their custom-ers throughout the entire product or service development process in continuous and iterative validation cycles. Nothing drives concept development forward more effectively than time spent with actual customers. The best founders, CEOs and senior managers spend significant amounts of time with the clients. It is not an activity they delegate. Most importantly, however, what is dearly needed, is the creation of new types of cross-industry partnerships that form a solid base for green innovation ecosystems. The state, municipalities and companies, big and small, with a wide range of backgrounds from manufacturing to digital services, need to learn ways and practices to collaborate. This is an absolute prerequisite for the industry’s mid‐ and long‐term development.
30 PriceWaterhouseCoopers (2014).

ETLA Raportit – ETLA Reports No 43 26
That being said, a more hands-on and urgent challenge that needs to be tended to immediate-ly is the poor financial viability of small and medium sized businesses in the cleantech space. Our results are merely descriptive and do not provide information on the reasons behind the lackluster performance of the most crucial drivers of industrial renewal. In-depth research is needed to unveil whether the result is a purely statistical fluke related to sampling, for in-stance, or whether there should be real concern about the long-term survival of Finnish clean-tech SMEs. Is the problem traceable to the current European-wide economic downturn, per-haps? Are investors overly cautious because of it? Or are cleantech SMEs in Finland either too young to or still in the process of defining their business models to become profitable? We cannot tell. One thing is certain: a cleantech ecosystem is unfathomable without a healthy base of SMEs which, many times, are the only trailblazing force across incumbent, locked-in industry structures.
4 A path forward – Redefining the Finnish cleantech opportunity in the age of digitalization Since 2003, when the term CleanTech first came in vogue, it was defined along verticals that relate to physical infrastructure systems and legacy industries, such as energy utilities (e.g. wind power, solar power), water utilities (e.g. water treatment, membranes), and specialty electronics companies (e.g. solar lighting, LED). The make-and-sell business model, the stal-wart of the traditional CleanTech economy is slowly being eroded by service models with recur-ring revenue streams and low capital intensity.
To exemplify, consider how Bloom Energy, a company that makes utility-scale fuel cell energy storage systems, replaced its revenue and business model from sales transactions, to lease and power purchase agreements, which allowed it to scale its turnover and profit margins. Com-pare First Energy, a solar panel manufacturer, and Solar City, a solar energy provider through brokerage and long term power purchase agreements. In terms of all financial metrics, Solar City comes out on top: capital efficiency, revenue growth, margins.
CleanTech 2.0 has been defined by business models that have been built on top of legacy infra-structure, and has given rise to the cleanweb. The cleanweb reflects the convergence of several technology megatrends, including: The explosive growth of data from sensors and networked devices; Increasing connectivity and automation among devices; The falling price of computing power and rise of “big data” analytical capabilities; The growth of smartphone ownership; The emergence of new consumer behavior on social networks and other platforms.
Cleanweb is to be understood very broadly. It is a paradigm shift, not a buzzword referring to the development of nifty smart apps only. Cleanweb companies sit at the nexus of traditional-ly disparate industries and functions, and have resulted in the collapse and cross-integration of value chains. They by-pass traditional market channels and no longer depend on govern-ments for subsidies or tax breaks. If anything, government and patenting policies are playing a catch up game in terms of regulation and customer privacy protection. Their business mod-els are wide and varied, and tend to be tailored to the end-customer, which allow for speed to market and scale.

27From Cleantech to Cleanweb – The Finnish Cleantech Space in Transition
Cleanweb is driving different consumer behaviors. It’s making people think differently about how they interact with devices and legacy industries that are 100 or 150 years old. In the pro-cess, they drive adoption of cleantech products. The consumer drives the adoption of the tech-nology through a service model.
As stated earlier, Finland has service businesses, but they are all startups and not much on the radar of economic developers. The economic driver needs to come from the established Clean-Tech companies – they clearly have a financial pain point as amply shown in this report. The redefinition that needs to happen is the transition from make-and-sell to digitalized service business models – shifting the cost structure of doing business. ICT and network-based tech-nologies are at the core of the transition from cleantech to cleanweb.
A decade after cleantech was launched as an innovation space, the convergence between ICT and cleantech holds the key to scale and profitability. Given the pre-eminence of Finnish com-panies in this area, and a rich industry value system in this space, there is clearly an opportuni-ty to be tapped and assets to be leveraged. Fortunately, the sentiment in the Finnish cleantech space itself is upbeat. In fact, a lot more upbeat than in other sectors of the Finnish economy, as a survey administered to Finnish SMEs in early 2015 reveals31. Motivation and optimism carries a long way.
31 The Federation of Finnish Enterprises (2015).

ETLA Raportit – ETLA Reports No 43 28
References Bloomberg New Energy Finance.
Brooke Crothers (2015). “Apple Car Is Sign Of Mapping Push By Tech Companies.” FEB 2015, Forbes Magazine.
Bunting, J. (2014). “The Rise of Cleanweb and the Opportunity for Corporates”, Cleanweb White Paper, CleanTech Group, San Francisco, CA.
Carbon Tracker Initiative (2011). Unburnable Carbon – Are the world’s financial markets carrying a carbon bubble? http://www.car- bontracker.org/site/wp-content/uploads/2014/05/Unburnable-Car- bon-Full-rev2-1.pdf. (Last access SEP 2, 2014).
DARA Group and Climate Vulnerability Monitor (2010). A Guide to the Cold Calculus of a Hot Planet. www.daraint.org.
European Commission (2013). Annual Report on European SMEs 2012/2013.
Gewirtz, P. (1996). “On ‘I Know It When I See It’”, Yale Law Journal, Vol. 105, pp. 1023–1047.
GSI (2010). Delivering on G-20 commitments: The path to fossil-fuel subsidy reform. Policy Brief. IISD, Canada.
KPMG (2014). What are the global megatrends. http://www.kpmg.com/global/en/issuesandinsights/articlespublications/fu- ture-state-government/pages/what-are-the-global-megatrends. aspx. (Last access NOV 7, 2014). PWC (2014).
Mancusi (2003): Geographical Concentration and the Dynamics of Countries’ specialization in technologies. Economics of Innovation & New Technology, Vol. 12, No. 3, pp. 269–291.
Megatrends (2014). http://www.pwc.co.uk/issues/megatrends/ index.jhtml. (Last access NOV 2, 2014).
New York Times (2013). Large Companies Prepared to Pay Price on Carbon. http://www.nytimes.com/2013/12/05/business/energy-en- vironment/large-companies-prepared-to-pay-price-on-carbon.html?pagewanted=all&_r=1&. (Last access NOV 11, 2014).
PriceWaterhouseCoopers (2014). Global Top 100 Companies by market capitalization. 31 March 2014 update. IPO Centre, UK.
TEK (2015). http://www.tek.fi/tutkimus/tyollisyystilastot (last accessed on JAN 19, 2015).
The Atlantic (2013). http://m.theatlantic.com/technology/archive/2013/12/the-carbon-time-bomb-in-your-retirement-account/282139/. (Last access NOV 12, 2014).
The Economist (2010). Clean technology in the downturn – Gathering clouds. NOV 6 issue.
The Federation of Finnish Enterprises (2015). SME-Barometer, Sector -report, Cleantech, Spring 2015; Helsinki, Finland.
TEM (2014). Strategic Programme for the Cleantech Business. https://www.tem.fi/en/current_issues/pending_projects/strategic_programmes_and_flagship_projects/ strategic_programme_for_the_cleantech_business (Last access NOV 17, 2014).

29From Cleantech to Cleanweb – The Finnish Cleantech Space in Transition
UN (1997). Glossary of Environment Statistics, Studies in Methods, Series F, No. 67, United Nations, New York, 1997.
Wal van Lierop, Chrusalix EVC (2014). Is cleantech the key to industrial structural change? Presentation at Cleantech Venture Day 2014, Lahti, Finland; OCT 28, 2014.
WEF (2014). Global risks 2014. Ninth edition. http://www3.weforum.org/docs/WEF_GlobalRisks_Report_2014.pdf. (Last access NOV 7, 2014).
WWF & Cleantech Group (2014). The Global Cleantech Innovation Index 2014.

ETLA Raportit – ETLA Reports No 43 30
Appendix 1: Finnish cleantech in numbersAppendix
Table A1
Number of companies
Company size Ownership
Cleantech category SME Micro Large Giant Municipality Foreign Government Private
domestic
advanced materials 19 50 % 22 % 28 % 0 % 0 % 18 % 0 % 82 %
agriculture & forestry 6 0 % 83 % 17 % 0 % 0 % 17 % 0 % 83 %
air 35 44 % 47 % 9 % 0 % 0 % 6 % 0 % 94 %
biofuels & biochemicals 79 36 % 39 % 24 % 4 % 3 % 15 % 0 % 82 %
biomass generation 26 27 % 46 % 27 % 0 % 8 % 8 % 4 % 79 %
business consulting 49 16 % 67 % 16 % 0 % 5 % 0 % 0 % 95 %
cables 2 0 % 0 % 100 % 0 % 0 % 50 % 0 % 50 %
chemicals 2 100 % 0 % 0 % 0 % 0 % 0 % 0 % 100 %
construction 8 25 % 63 % 13 % 0 % 0 % 0 % 0 % 100 %
conventional fuels 12 33 % 25 % 42 % 0 % 8 % 0 % 8 % 83 %
electronics 2 0 % 0 % 100 % 0 % 0 % 0 % 0 % 100 %
energy efficiency 70 44 % 28 % 28 % 2 % 2 % 14 % 0 % 84 %
energy storage 15 43 % 50 % 7 % 0 % 0 % 0 % 0 % 100 %
engineering services 55 25 % 56 % 19 % 0 % 4 % 13 % 2 % 81 %
environmental services 2 0 % 100 % 0 % 0 % 0 % 0 % 0 % 100 %
finance 2 0 % 100 % 0 % 0 % 0 % 0 % 0 % 100 %
fuel cells & hydrogen 2 0 % 0 % 100 % 0 % . . . .
furniture 1 0 % 100 % 0 % 0 % 0 % 0 % 0 % 100 %
geothermal 12 60 % 20 % 20 % 0 % 0 % 30 % 0 % 70 %
hydro & marine power 6 33 % 33 % 33 % 0 % 17 % 0 % 0 % 83 %
instruments 14 58 % 25 % 17 % 0 % 0 % 17 % 0 % 83 %
machinery 12 73 % 9 % 18 % 0 % 0 % 18 % 0 % 82 %
metals 2 50 % 0 % 50 % 0 % 0 % 0 % 0 % 100 %
mining 1 0 % 0 % 100 % 0 % 0 % 0 % 0 % 100 %
nuclear 4 50 % 0 % 50 % 0 % 0 % 0 % 0 % 100 %
recycling & waste 68 32 % 46 % 22 % 0 % 5 % 3 % 2 % 90 %
smart grid 52 43 % 35 % 22 % 2 % 2 % 22 % 2 % 73 %
software 8 13 % 50 % 38 % 0 % 0 % 14 % 0 % 86 %
solar 17 38 % 38 % 23 % 0 % 0 % 0 % 0 % 100 %
transportation 46 43 % 40 % 17 % 2 % 0 % 17 % 0 % 83 %
water & wastewater 87 41 % 37 % 22 % 0 % 3 % 20 % 1 % 76 %
wholesale 5 20 % 40 % 40 % 0 % 0 % 40 % 0 % 60 %
wind 41 31 % 42 % 28 % 0 % 12 % 12 % 3 % 74 %
Total 762 36 % 41 % 23 % 3 % 12 % 1 % 83 %

31From Cleantech to Cleanweb – The Finnish Cleantech Space in Transition
Table A2
Importer/exporter Share of ltd. companies
Company age (yrs)
Number of employees Cleantech
category Importer Import and export Exporter
advanced materials 15 % 85 % 0 % 94 % 9,6 65,6
agriculture & forestry 50 % 50 % 0 % 100 % 12,2 10,3
air 9 % 83 % 9 % 94 % 14,8 25,0
biofuels & biochemicals 39 % 52 % 9 % 91 % 14,8 67,5
biomass generation 9 % 73 % 18 % 92 % 16,4 67,2
business consulting 100 % 0 % 0 % 88 % 8,9 7,1
cables 0 % 100 % 0 % 100 % 10,5 254,0
chemicals 0 % 100 % 0 % 100 % 47,5 88,0
construction 0 % 100 % 0 % 75 % 4,0 11,0
conventional fuels 50 % 50 % 0 % 100 % 20,1 63,8
electronics 0 % 100 % 0 % 100 % 34,0 200,4
energy efficiency 24 % 74 % 2 % 98 % 11,5 141,7
energy storage 11 % 67 % 22 % 93 % 17,1 18,2
engineering services 56 % 44 % 0 % 88 % 15,4 58,3
environmental services . . . 100 % 6,5 2,9
finance . . . 100 % 6,5 2,2
fuel cells & hydrogen . . . . .
furniture 100 % 0 % 0 % 100 % 5,0 1,0
geothermal 43 % 57 % 0 % 100 % 13,6 107,5
hydro & marine power 75 % 25 % 0 % 100 % 14,7 9,6
instruments 0 % 100 % 0 % 100 % 17,8 82,0
machinery 10 % 90 % 0 % 100 % 17,2 78,4
metals 0 % 100 % 0 % 100 % 12,5 161,0
mining 0 % 100 % 0 % 100 % 10,0 486,0
nuclear 100 % 0 % 0 % 100 % 16,5 242,0
recycling & waste 30 % 53 % 18 % 97 % 14,9 147,7
smart grid 21 % 75 % 4 % 96 % 13,2 93,3
software 50 % 0 % 50 % 88 % 10,7 468,7
solar 25 % 75 % 0 % 69 % 14,0 11,1
transportation 30 % 60 % 10 % 93 % 12,8 43,1
water & wastewater 26 % 74 % 0 % 92 % 18,4 59,6
wholesale 33 % 67 % 0 % 60 % 8,0 4,5
wind 55 % 32 % 14 % 94 % 13,8 54,9
Total 29 % 65 % 7 % 93 % 14,3 77,6

ETLA Raportit – ETLA Reports No 43 32
Table A3
Return on assets (%)*
Net profit (%)*
Profit margin (%)*
Return on investment (%) *
Asset turnover ratio**
Tangible assets (1000 €)*
Value added per person* Cleantech
category
advanced materials 6,1 -2,3 -4,6 7,4 1,4 108 000 € 95 002 €
agriculture & forestry -31,3 -144,1 -151,0 -34,7 0,7 738 € - 7 188 €
air 4,4 -16,4 -13,2 12,3 1,5 21 800 € 53 856 €
biofuels & biochemicals 8,1 3,6 1,0 13,3 1,3 356 000 € 126 397 €
biomass generation 8,5 2,3 0,4 23,7 1,3 350 000 € 130 220 €
business consulting 16,9 -4,5 -6,7 25,6 2,8 2 282 € 68 843 €
cables 6,6 3,4 2,1 10,1 2,0 75 300 € 72 991 €
chemicals 5,4 8,9 7,7 7,0 0,6 70 100 € 97 163 €
construction 38,1 11,7 11,6 61,0 4,6 2 696 € 100 805 €
conventional fuels 6,9 2,1 -0,7 10,8 2,0 173 000 € 183 354 €
electronics 11,9 12,0 9,2 14,4 0,9 82 000 € .
energy efficiency 7,0 3,3 2,7 9,3 1,6 558 000 € 100 151 €
energy storage 2,5 -9,8 -12,5 2,2 1,6 4 552 € 51 568 €
engineering services 16,5 7,3 5,8 25,8 2,0 32 400 € 69 418 €
environmental services 10,1 1,1 -0,1 19,6 2,7 200 € 65 345 €
finance 31,5 14,3 13,4 42,0 2,1 170 € 103 035 €
fuel cells & hydrogen
furniture -34,3 -76,0 -80,8 -37,6 1,0 125 € -17 000 €
geothermal 10,6 3,7 3,1 21,9 2,7 39 000 € 55 872 €
hydro & marine power 0,4 -79,2 -88,3 1,8 1,4 7 951 € 53 926 €
instruments 13,2 9,9 9,6 17,3 1,1 171 000 € 82 202 €
machinery 0,9 1,4 -0,4 0,2 1,5 20 400 € 63 658 €
metals 1,7 1,0 0,4 2,3 1,5 25 100 € 42 018 €
mining 5,1 -6,9 3,9 6,5 0,6 236 000 € .
nuclear -0,4 -28,4 -33,6 - 1,0 0,1 4 820 000 € 129 752 €
recycling & waste 9,3 2,9 1,9 11,1 1,5 283 000 € 81 302 €
smart grid 13,0 5,2 3,8 41,2 2,7 163 000 € 102 235 €
software 0,7 -0,1 -0,1 1,3 1,3 304 000 € 53 623 €
solar -9,3 -34,7 -46,6 -12,3 1,1 21 300 € 33 955 €
transportation 2,1 -5,5 -5,9 6,0 1,6 40 500 € 69 337 €
water & wastewater 13,3 4,3 5,1 20,1 1,5 402 000 € 77 975 €
wholesale 31,8 6,6 5,2 50,3 4,7 1 013 € 88 808 €
wind 6,2 -31,1 2,0 9,3 1,1 3 480 000 € 91 120 €
Total 8,4 0,4 0,8 14,6 1,6 89 900 € 91 211 € *) Weighted by the no. of personnel and winsored by 2,5% **) Tangible assets, weighted by the no. of personnel and winsored by 2,5%
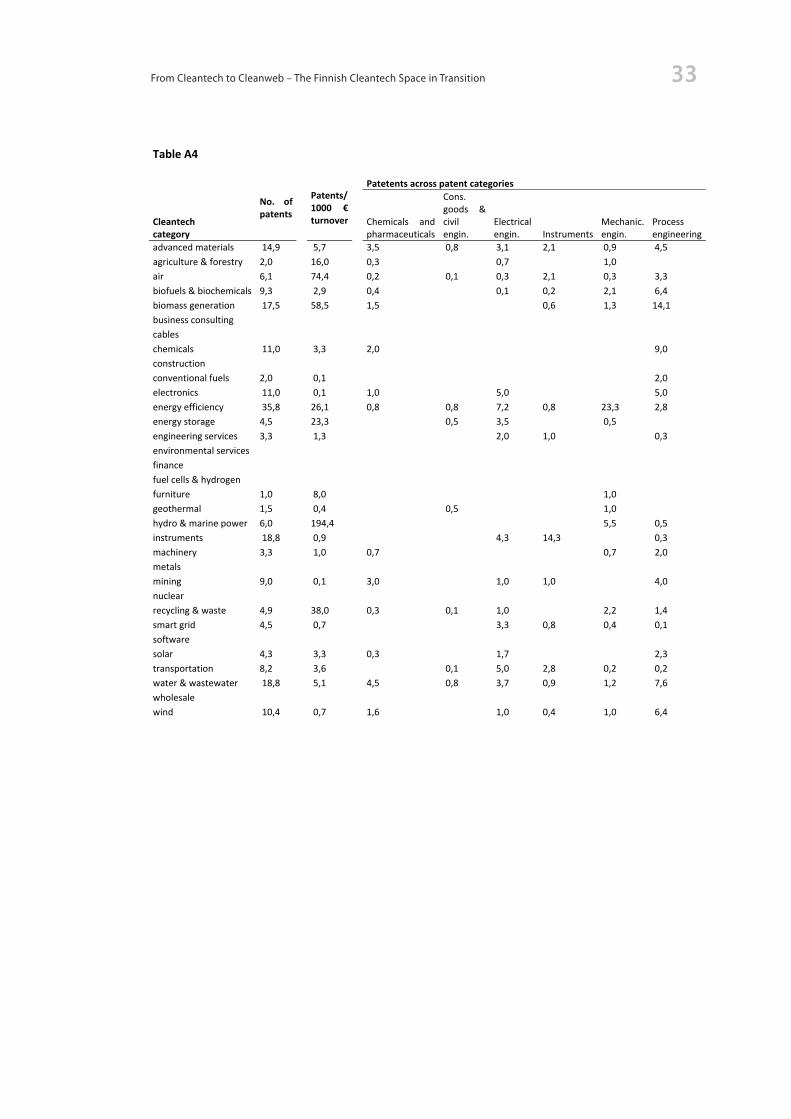
33From Cleantech to Cleanweb – The Finnish Cleantech Space in Transition
Table A4
No. of patents
Patents/ 1000 € turnover
Patetents across patent categories
Cleantech category
Chemicals and pharmaceuticals
Cons. goods & civil engin.
Electrical engin. Instruments
Mechanic. engin.
Process engineering
advanced materials 14,9 5,7 3,5 0,8 3,1 2,1 0,9 4,5 agriculture & forestry 2,0 16,0 0,3 0,7 1,0 air 6,1 74,4 0,2 0,1 0,3 2,1 0,3 3,3 biofuels & biochemicals 9,3 2,9 0,4 0,1 0,2 2,1 6,4 biomass generation 17,5 58,5 1,5 0,6 1,3 14,1 business consulting cables chemicals 11,0 3,3 2,0 9,0 construction conventional fuels 2,0 0,1 2,0 electronics 11,0 0,1 1,0 5,0 5,0 energy efficiency 35,8 26,1 0,8 0,8 7,2 0,8 23,3 2,8 energy storage 4,5 23,3 0,5 3,5 0,5 engineering services 3,3 1,3 2,0 1,0 0,3 environmental services finance fuel cells & hydrogen furniture 1,0 8,0 1,0 geothermal 1,5 0,4 0,5 1,0 hydro & marine power 6,0 194,4 5,5 0,5 instruments 18,8 0,9 4,3 14,3 0,3 machinery 3,3 1,0 0,7 0,7 2,0 metals mining 9,0 0,1 3,0 1,0 1,0 4,0 nuclear recycling & waste 4,9 38,0 0,3 0,1 1,0 2,2 1,4 smart grid 4,5 0,7 3,3 0,8 0,4 0,1 software solar 4,3 3,3 0,3 1,7 2,3 transportation 8,2 3,6 0,1 5,0 2,8 0,2 0,2 water & wastewater 18,8 5,1 4,5 0,8 3,7 0,9 1,2 7,6 wholesale wind 10,4 0,7 1,6 1,0 0,4 1,0 6,4
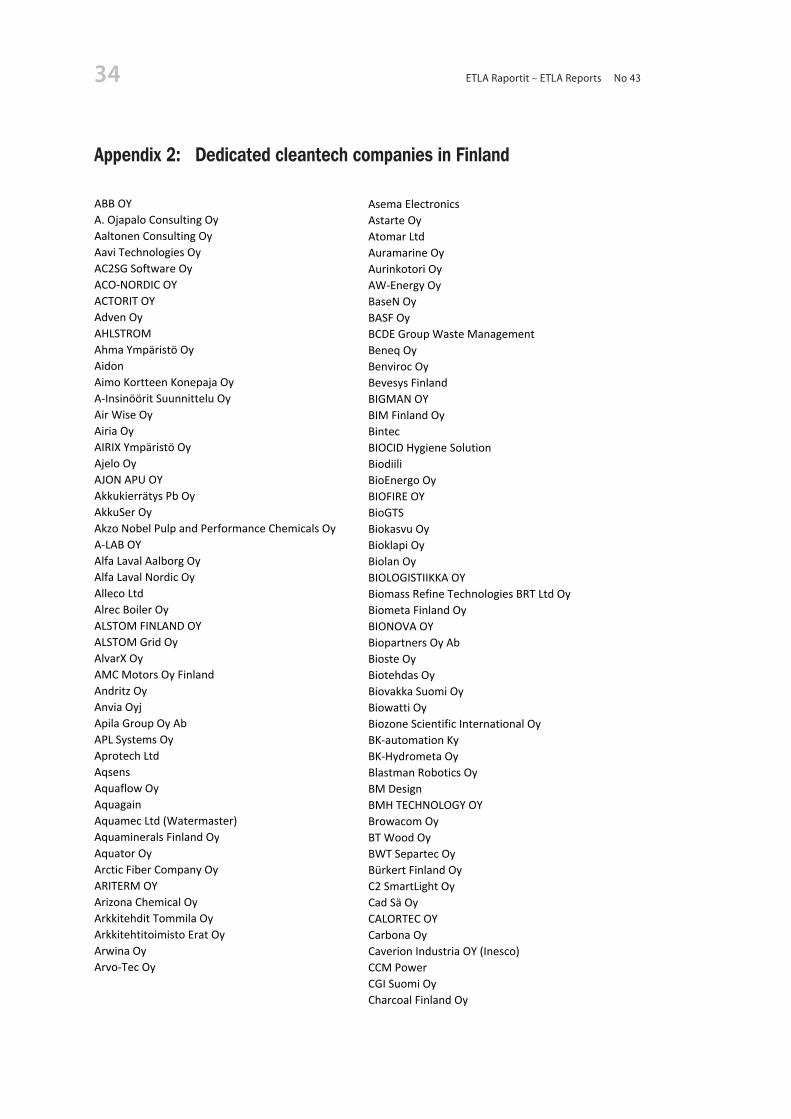
ETLA Raportit – ETLA Reports No 43 34
Appendix 2: Dedicated cleantech companies in FinlandDedicated Cleantech Companies in Finland
ABB OYA. Ojapalo Consulting OyAaltonen Consulting OyAavi Technologies OyAC2SG Software OyACO-NORDIC OYACTORIT OYAdven OyAHLSTROMAhma Ympäristö OyAidonAimo Kortteen Konepaja OyA-Insinöörit Suunnittelu OyAir Wise OyAiria OyAIRIX Ympäristö OyAjelo OyAJON APU OYAkkukierrätys Pb OyAkkuSer OyAkzo Nobel Pulp and Performance Chemicals OyA-LAB OYAlfa Laval Aalborg OyAlfa Laval Nordic OyAlleco LtdAlrec Boiler OyALSTOM FINLAND OYALSTOM Grid OyAlvarX OyAMC Motors Oy FinlandAndritz OyAnvia OyjApila Group Oy AbAPL Systems OyAprotech LtdAqsensAquaflow OyAquagainAquamec Ltd (Watermaster)Aquaminerals Finland OyAquator OyArctic Fiber Company OyARITERM OYArizona Chemical OyArkkitehdit Tommila OyArkkitehtitoimisto Erat OyArwina OyArvo-Tec Oy
Asema ElectronicsAstarte OyAtomar LtdAuramarine OyAurinkotori OyAW-Energy OyBaseN OyBASF OyBCDE Group Waste ManagementBeneq OyBenviroc OyBevesys FinlandBIGMAN OYBIM Finland OyBintecBIOCID Hygiene SolutionBiodiiliBioEnergo OyBIOFIRE OYBioGTSBiokasvu OyBioklapi OyBiolan OyBIOLOGISTIIKKA OYBiomass Refine Technologies BRT Ltd OyBiometa Finland OyBIONOVA OYBiopartners Oy AbBioste OyBiotehdas OyBiovakka Suomi OyBiowatti OyBiozone Scientific International OyBK-automation KyBK-Hydrometa OyBlastman Robotics OyBM DesignBMH TECHNOLOGY OYBrowacom OyBT Wood OyBWT Separtec OyBürkert Finland OyC2 SmartLight OyCad Sä OyCALORTEC OYCarbona OyCaverion Industria OY (Inesco)CCM PowerCGI Suomi OyCharcoal Finland Oy

35From Cleantech to Cleanweb – The Finnish Cleantech Space in Transition
Chemec OyChemigate OyChempolis OyChiller OyCleantech Invest OyCleanTeki FinlandClewerClimate Wedge Ltd OyClimecon OyComponentalityCondens Heat Recovery OyConfidexConsair OyControlmatic Oy Ltd.Convion OyCoreorient OyCozify OyCreowave OyCrisolteQ OyCross Wrap LtdCTS Engtec OyCuycha InnovationCYBERSOFT OY ABDekati OyDesinfinatorDigiEcoCity OyDORANOVA OYDosfil OyDuctorEAGLE Tuulienergia OYEarth House OyEarthRate OyEasy Led OyECCUA OYEco Brahe OyEcobio OyEcolator Finland OyEcolution OyEcomation OyEcomonitor OyEcompter OyEconet OyEC-Tools OyEero Paloheimo EcoCity Ltd.EffMagEFIREC OYEFORE OYJeGenEHP-Tekniikka OyEko Harden Technologies Oy
EkogenEkokem Oy AbEkoleima AyEkolite OyEkonor OyEkopine OyEkovilla OyEKP-PEKKARINEN KY, ENERGIA JA KIINTEISTÖPALVELUTElastopoli OyElcogen OYElcon Solutions OyElektrobit Wireless Communications OyELKAMO OY ABELLEGO POWERTEC OYElmatec OyELOMATIC OYElozoEltel Networks OyEltete TPM LtdEmteleEncore Partners OyEndat OyENDEAS OYEndev OyENEMI OYEnercotek OyEnergiakolmio OyENERGON OYENERGYWAVE OYEneron OyEnerpoint OyEnersize OyEnervent OyEnespaOyEnevo OyEnfucell OyEniram OyEnitec Engineering Oy AbEnmacEnoroEnsto Finland OyENW Management OyEnvimetria OyEnwin OyEnviroburners OyEnvironics OyEnvitecpolis OyEnvitop OyEnvor Group OyEPV ENERGIA OY

ETLA Raportit – ETLA Reports No 43 36
Etelä-Savon Energia OyEtha OyEuran Hydrauliikka ja Metallirakenne OyEuropress Group OyEV Group OyEvac OyEvimet-Group OyExel CompositesExigo OyExtorFara OyFastrax OyFenno Water OyFENNOVOIMA OYFerroplan OyFincumetFinelmo OyFiness Energy OyFinex OyFingridFinMeas OyFinnchain OyFINNENCO OYFinnoflag OyFINNSONIC OYFinnwind OyFioterFIXTERI OY / Biotukki OyFleetlogis OyFlootechFlowrox LtdForchem OyForest BtL OyFortum OyjFOSTER WHEELER ENERGIA OYFourdeg OyFractivatorFRISNET OYGaia Group OyGALVATEK OYGASEK OyGASERA OYGasmet OyGebwell OyGenano OyGeobotniaGEO-HYDRO oyGeomachine LtdGeorg Fischer AbGeosto Oy
Geotrim OyGEO-WORK OYGEOYKKÖNEN OYGETADEAL OYGevoc OyGlastonGlobal EcoSolutions OyGlobe Hope OyGoogleGranlund OyGreen Electronics OyGREEN ENERGY LIFE OYGREEN FORTUNE OY ABGreen Fuel NordicGreen Net Finland ryGreenfield Consulting OyGreenled OyGreenlux Finland OyGreenpower Finland OyGreenStream Network OyjGrexelGrundfos EnvironmentGWM-Engineering OyHAFMEX WIND OYHakaniemen Metalli OyHalton OyHannu Salonen Ympäristöpalvelut OyHANSA-MAGNETS OYHantor-Mittaus OyHavatorHeadPower OyHeikki Laiho OyHelio ThermHelsingin EnergiaHelsingin seudun liikenne -kuntayhtymäHELVAR OY ABHF-Autohuolto OyHitech ChemicalsHL-HEAT OYHNU NordionHOLLMING WORKS OYHomeControl Finland OyHoneywell OyHoxville OyHS Tekniikka OyHSY YmpäristöpalvelutHT Enerco OyHuurre Group OyHybria OyHydrocell

37From Cleantech to Cleanweb – The Finnish Cleantech Space in Transition
Hydropress Huber AbHyxo OyHyötypaperi OyHyötytuuliHÄMEEN LOKA JA KULJETUS J. SUVIMÄKI OYHÖGFORS OYIC2 Feeniks OyIdeapoiju OyIin Micropolis OyIlmatar WindpowerIndmeas OyInfotripla OyInnoAqua LtdInnohome OyInnopower OyInsinööritoimisto Ecobio OyINSINÖÖRITOIMISTO GRADIENTTI OYInsinööritoimisto Valcon OyIntopii OyIntStreamOyItä-Suomen Murskauskeskus OyJAPROTEK OY ABJetitek OyJODATJosbit OyJS-Enviro OyJTV-ENERGIA KYJVS-Polymers OyJyväskylän Energia OyKaiko OyKamstrup A/SKanteleen Voima OyKapasity OyKari-Finn LtdKart OyKarves Energia & Valvonta OyKat-Metal Ltd.KaukomarkkinatKAUKORA OYKemian tutkimuspalvelut Oy/CRS-ResearchKemijoki Aquatic Technology OyKemira OyjKeypro OyKiL-Yhtiöt OyKlas 1-Yhtiöt OyKMJ-ENGINEERING OYKMT GROUP OYKO TULOSTEKNIIKKA OYKOKO KANSAN TAVARAKONTTORI OYKONE Oyj
Konecranes OyjKonepaja Eneka OyKONEPLANEETTA OYKonsulttitoimisto Enersys OyKoskienergia OyKotka EnergyKotkan Konepaja OyKSB FinlandKuava OyKuopion Energia OyKuusakoski OyKymenlaakson Jäte OyKymppivoimaLaanilan voima OyLaatuinsinöörit OyLAATUKATTILA OYLABIO OyLabkotec OyLabtium OyLAHDEN MAA- JA VESIRAKENNUS OYLahti Development Company LADEC OyLahti Energia OyLaitex OyLakeuden Etappi OyLakeuden Keskuspuhdistamo OyLamit.fiLamor CorporationLAMPROTEK OYLandis + GyrOyLassila & Tikanoja OyjLatvaenergia OyLemcon OyLevator OyLHM HAKKURI OYLining Oy AbLinnunmaa OyLiqum OyLIVITE OYLonix OyLounais-Suomen vesi- ja ympäristötutkimus OyLUKOIL LUBRICANTS EUROPE OyLumi Group OyLuminer OyLumituuli OyLuvata OyLVI-Suunnittelu Oy Juha TourunenLänsimetro OyMANACTION OY ABMASA-TUOTE KYMasinotek Oy

ETLA Raportit – ETLA Reports No 43 38
MATTI KUITUNEN OYMegatrexMegatuuliMekitec OyMEPU OYMeritaitoMerus PowerMervento OyMeshWorks Wireless OyMetaEnergia OyMETENER OYMetGen OyMetropoliLab OyMetso OyjMetsä Fibre OyMHG Systems OyMicropulva Ltd OyMILJÖÖNÄÄRI OYMILLIDYNE OYMilstonMipro LtdMIRION TECHNOLOGIES (RADOS) OYMitoxMK Protech OyM-Motion Ltd OyMobinet OyMobisoft OyMolok OyMovekoTech OyMOVENTAS OYMSC ELECTRONICS OYMULTIHEAT OY ABMuovityö Hiltunen OyMW Power OyMX Electrix OyMäkelä-Plast OyNab Labs OyNAKKILAN KONEPAJA OYNANOCOMP OY LTDNaps Systems OyNaps Sytems OyNatural Interest OyNavico OyNCC Rakennus OyNeorem Magnets OyNeste Oil OyjNetcontrol OyNetcyclerNetled OyNidecon Technologies Oy
NIRAFON OYNo Emission Monday OyNocartNORD MILLS OY LTDNordic EnviconNordic Offset OyNordic Set GreenNordkalk Oyj AbpNORELCO OYNorrhydro OyNorthern Nature EnergyNotta Systems OyNovatron OyNovoro OyNovosanNoxon SuomiNumerola OyNuuka SolutionsNärpes Trä & MetallOceanvolt OyOdorOff OyOilon OyOilon Scancool OyOilwhale OyOjala-Yhtymä OyOKMETIC OYJOliotalo - Object House AbOMG Kokkola Chemicals OyOMP-KONEPAJA OYOne1Optitune Oy (Braggone Oy)OptoGaN FinlandOrasOrfer OyORIMATTILAN VESI OYOSITUM OYOulu EnergyOulu Water AllianceOulun Energia konserniOuman OyOvako Wire Oy AbOxford Instruments AnalyticalOy DigiSewer Productions LtdOZOclean OyPaetronics OyPallaskylmä OyPalo- ja vesitekniikka PA-VE OyPaperinkeräys OyPARKER HANNIFIN OYParma

39From Cleantech to Cleanweb – The Finnish Cleantech Space in Transition
Paroc Group Oy ABParoc Oy AbPegasor OyPEMCO OYpH-VetikkoPicodeon Ltd OyPicosun OyPIEneering OyPikku Vihreä OyPiniferPlaNomaPlantui OyPlasthill OyPlastiroll OyPLASTVO OYPLATOM OYPohjolan Design-Talo OyPohjolan Maalämpö OyPohjolan Voima OyPolarheat Oy/InfraheatPolarmit OyPolartek OyPOLARTEST OYPosiraPowan OyPower Instruments OyPOWERFINN OYPowernet OyPowerQ OyProcess Flow Ltd OyProfimill OyPRO-lämpö OyPromethor OyProMinent Finland OyProtacon OyProventia Emission Control OyPRYSMIAN CABLES AND SYSTEMS OYPurmoPuwimex OyPythagoras OyPÄIJÄT-HÄMEEN PORAKAIVO OYPääkaupunkiseudun KierrätyskeskusPÖYRY OYJQonsalt OyRaita Environment OyRajakiiri OyRakeistus OyRAMBOLL FINLAND OYRamse Consulting OyRAUMASTER OY
Rautasoini OyREACHlawRec Alkaline OyRecser OyRefecor OyRehau Oy AbREIKÄLEVY OYREKA KAAPELI OYRenesas Mobile CorporationRenewa OyRenos OyRetermia OyRETTIG OY ABRiihimäen Metallikaluste OyRoadscanners Holding OyRocsole OyRomukeskus OyRuntech Systems OySAALASTI OYSaarijärvi Infra OySABIK OY ABSahala Works OySaint-Gobain Glass Finland OySaint-Gobain Pipe Systems OySampoTech OySarlin Oy AbSATEL OySATMATIC OYSavaterra OySAWCENTER OY ABSavcor GroupSavetheC OySavo-Karjalan Vesi- ja Ympäristösuunnittelu OySavo-Karjalan Ympäristötutkimus OySavon Energiapalvelut OySAVON VOIMA OYJSavo-SolarSAVOX COMMUNICATIONS OY AB (LTD)Savumax OyScanSun OySchneider Electric FinlandSE Mäkinen Logistics OySecto Automotive OySEIGOL OYSelmic OySenfit OySensinodeSEW-EURODRIVE OYSiemens OySIEVIN KONEPALVELU OY

ETLA Raportit – ETLA Reports No 43 40
Siirtoruuvi OySILECS OYSimosol OySirius Engineers OySkaala Ikkunat ja Ovet OySK-KOJEISTOT OYSKK-Sähkö OySlamex Oy AbSlatekSlo OySofi FiltrationSOLAR SIMULATOR FINLAND OYSOLECO ABSolibri OySolved - The Cleantech Company OySPACE SYSTEMS FINLAND OYSpecim Spectral Imaging OySpectral EnginesSpinverse OySPU Systems OySt1STEEL PRODUCTION MAANSELKÄ OYStellac Ltd.Stena Recycling OyStora Enso OyjSukelluspalvelu Stella MariaSULZER PUMPS FINLAND OYSunit OySuntrica OySunWatt OySuomen Akkukeräys OySuomen Autokierrätys OySuomen Bioetanoli OySuomen Erityisjäte OySuomen Hyötymurskaus OySuomen Keräystuote OySuomen Kuitukierrätys OySuomen Lämpöpumpputekniikka OySUOMEN MEGAWATTI OYSuomen Merituuli OySuomen NP-kierrätys OySUOMENSELÄN ALCU-TUOTE OYSustainable Energy Asset Management OySuunnittelutoimisto Peruste OySwegon ILTO OySybimar OySYKÄKE OYSymlink Technologies OySÄÄTÖTULI OYT & A Mämmelä Oy
Taelek OyTaipale Telematics OyTampereen Teollisuussähkö OyTamturboTana OyTapojärvi OyTassu ESPTecalemit Flow OyTechnoSmart OyTeconer oyTekla OyjTELATEK OYTeollisuuden Voima OyjTermorakTerramareThe Switch OyThere CorporationTietokoura OyTM System Finland OyTofuture OyToivalan Konepaja OyTomra SystemsTonesTP-STOKERI OYTrafotek OyTramel OyTrineco OyTT-Group OyTulikivi OyjTulipiippu AyTULITUOTE OYTurku Energia Oy -Åbo Energi AbTurun Seudun Energiantuotanto (TSE)Turveruukki OyTuulienergiala.com Finland OyTuuliSaimaaTuulisampo OyTuuliwattiU-CONT OY LTDUFFUK-Muovi OyUltranatUPM-Kymmene OyjUponor OyjUTU ELEC OYUusiomuoviVaakaporauspalvelu VPP OyVAASAN KULJETUSKANAVAT OYVacon OyVaisala Oyj

41From Cleantech to Cleanweb – The Finnish Cleantech Space in Transition
Valmet OyValopaa OyValoyaValtavalo OyVAMP OYVantaan EnergiaWapice OyVapo OyWARMA-UUNIT OYVaro Teollisuuspalvelut OyVaskiluodon Voima OyWater GroupWaterix OyWatmanWatrec OyVattenfallWavin-Labko OyWayStep Consulting KyWE Tech SolutionsWEG - Wise Engineering Group LtdVELJEKSET ALA-TALKKARI OYWello OyVEM motors Finland OyVeolia Transport Finland OyVeolia Vesi OyVerlatek OyVesi-Eko OyVESIHAKA OYWetend Technologies OyVexve OyViafin Terästorni OyVianova Systems Finland OyViessmann OyViherasema OyWihuri OyWiiste OyWilo Finland OyVimelco OyWindside Production LtdViola Systems OyVirebit OyWirepas OyVisedo OyWiser OyVisko TeepakWitrafi OyVMH Kalibro OyWoikoskiVoimarakenne OyVolter Oy
WPD Finland OyVRJ Pohjois-Suomi OyWSP OyVTI Technologies OyWärtsilä OyjXO Group OyXylem Water Solutions Suomi OyYmpäristöalan asiantuntijapalvelut Teemu RäsänenYmpäristökonsultointi EcoChange OyYolda kyYRJTECHNOLOGY OYYY-Optima OyZenRobotics Ltd.ZwerverÅF-Consult Oy


Elinkeinoelämän tutkimuslaitosThe Research Institute of the Finnish EconomyLönnrotinkatu 4 B00120 Helsinki
ISSN-L 2323-2447, ISSN 2323-2447, ISSN 2323-2455 (Pdf )
Puh. 09-609 900Fax 09-601 753
Sarjan julkaisut ovat raportteja tutkimustuloksista ja väliraportteja tekeillä olevista tutkimuksista.
Julkaisut ovat ladattavissa pdf-muodossa osoitteessa: www.etla.fi » julkaisut » raportit
Papers in this series are reports on research results and on studies in progress.
Publications in pdf can be downloaded at www.etla.fi » publications » reports
Aikaisemmin ilmestynyt ETLA Raportit-sarjassa (ennen ETLA Keskusteluaiheita) Previously published in the ETLA Reports series (formerly ETLA Discussion Papers)
No 28 Timo Nikinmaa, Kone- ja metallituoteteollisuuden visio 2025. 23.5.2014. 52 s.
No 29 Antti Pelkonen – Duncan A. Thomas – Terttu Luukkonen, Project-based Funding and Novelty in University Research – Findings from Finland and the UK. 12.6.2014. 18 p.
No 30 Antti Kauhanen, Tulevaisuuden työmarkkinat. 6.8.2014. 16 s.
No 31 Joonas Tuhkuri, Big Data: Google-haut ennustavat työttömyyttä Suomessa. 14.8.2014. 31 s.
No 32 Rita Asplund – Pertti Koistinen, Nuorten työllistyminen ja työllisyys työvoimapolitiikan valossa. 18.9.2014. 37 s.
No 33 Terttu Luukkonen, Universities, Funding Systems, and the Renewal of the Industrial Knowledge Base: UNI Project Findings. 25.9.2014. 64 p.
No 34 Aleksandr Peussa, Yksityisen kulutuksen ennustemalleja. 14.10.2014. 109 s.
No 35 Mika Pajarinen – Petri Rouvinen, Tekesin rahoituksen vaikutus työn tuottavuuteen. 23.10.2014. 18 s.
No 36 Jyrki Ali-Yrkkö – Mika Pajarinen – Petri Rouvinen, Yksityiset palvelut kasvun lähteenä? 31.10.2014. 25 s.
No 37 Tuomo Virkola, Real-Time Measures of the Output Gap and Fiscal Policy Stance. 31.10.2014. 18 p.
No 38 Tuomo Virkola, Fiscal Federalism in Four Federal Countries. 31.10.2014. 40 p.
No 39 Paavo Suni, EMU-eron vaikutukset – Simulointeja NiGEM-mallilla. 14.11.2014. 30 s.
No 40 Niku Määttänen – Olli Ropponen, Listaamattomien osakeyhtiöiden verotus, voitonjako ja investoinnit. 9.12.2014. 24 s.
No 41 Tarmo Valkonen – Eija Kauppi – Paavo Suni, Simulointeja yhteisöveron alennuksen dynaamisista vaikutuksista Suomessa. 11.12.2014. 30 s.
No 42 Jari Juhanko (toim.) – Marko Jurvansuu (toim.) – Toni Ahlqvist – Heikki Ailisto – Petteri Alahuhta – Jari Collin – Marco Halen – Tapio Heikkilä – Helena Kortelainen – Martti Mäntylä – Timo Seppälä – Mikko Sallinen – Magnus Simons – Anu Tuominen, Suomalainen teollinen internet – haasteesta mahdollisuudeksi. Taustoittava kooste. 5.1.2015. 61 s.