from population viability analysis to coviability of ... · from population viability analysis to...
TRANSCRIPT

Contributed Paper
From Population Viability Analysis to Coviabilityof Farmland Biodiversity and AgricultureL. MOUYSSET,∗† L. DOYEN,‡ AND F. JIGUET‡∗Department of Land Economy, University of Cambridge, 19 Silver Street, Cambridge CB3 9EP, United Kingdom, email [email protected]†AgroParisTech, Economie publique, UMR 0210 INRA-AgroParisTech, 16 rue Claude Bernard, Paris Cedex 75005, France‡CERSP, UMR 7204 CNRS-MNHN-UPMC, 55 rue Buffon, Paris Cedex 75005, France
Abstract: Substantial declines in farmland biodiversity have been reported in Europe for several decades.Agricultural changes have been identified as a main driver of these declines. Although different agrien-vironmental schemes have been implemented, their positive effect on biodiversity is relatively unknown.This raises the question as to how to reconcile farming production and biodiversity conservation to opera-tionalize a sustainable and multifunctional agriculture. We devised a bioeconomic model and conducted ananalysis based on coviability of farmland biodiversity and agriculture. The coviability approach extendedpopulation viability analyses by including bioeconomic risk. Our model coupled stochastic dynamics of bothbiodiversity and farming land-uses selected at the microlevel with public policies at the macrolevel on thebasis of financial incentives (taxes or subsidies) for land uses. The coviability approach made it possible forus to evaluate bioeconomic risks of these public incentives through the probability of satisfying a mix ofbiodiversity and economic constraints over time. We calibrated the model and applied it to a community of34 common birds in metropolitan France at the small agricultural regions scale. We identified different publicpolicies and scenarios with tolerable (0–0%) agroecological risk and modeled their outcomes up to 2050.Budgetary, economic, and ecological (based on Farmland Bird Index) constraints were essential to under-standing the set of viable public policies. Our results suggest that some combinations of taxes on cereals andsubsidies on grasslands could be relevant to develop a multifunctional agriculture. Moreover, the flexibilityand multicriteria viewpoint underlying the coviability approach may help in the implementation of adaptivemanagement.
Keywords: bioeconomics, farming, French bird breeding survey, land-use modeling, public policies, viability
Del Analisis de Viabilidad Poblacional a la Co-Viabilidad de la Agricultura y la Biodiversidad de las Tierras de Cultivo
Resumen: Se han reportado disminuciones sustanciales en la biodiversidad de las tierras de cultivo enEuropa durante varias decadas. Los cambios agrıcolas han sido identificados como los principales conduc-tores de estas disminuciones. Aunque se han implementado diferentes esquemas agro-ambientales, su efectopositivo sobre la biodiversidad es practicamente desconocido. Esto genera la pregunta de como reconciliarla produccion agrıcola y la conservacion de la biodiversidad para operar una agricultura sostenible ymultifuncional. Disenamos un modelo bioeconomico y realizamos un analisis basado en la co-viabilidadde la biodiversidad de las tierras de cultivo y la agricultura. El acercamiento a la co-viabilidad extendiolos analisis de viabilidad de poblacion al incluir riesgos bioeconomicos. Nuestro modelo acoplo dinamicasestocasticas tanto de la biodiversidad y el uso de suelo de la agricultura en un micro-nivel, como de laspolıticas publicas en un macro-nivel con base en los incentivos financieros (impuestos o subsidios) parael uso de suelo. La aproximacion de co-viabilidad nos permitio evaluar los riesgos bioeconomicos de estosincentivos publicos a traves de la probabilidad de una mezcla satisfactoria de biodiversidad y restriccioneseconomicas a lo largo del tiempo. Calibramos el modelo y lo aplicamos a una comunidad de 34 especies deaves comunes en la Francia metropolitana con la escala de regiones agricultoras pequenas. Identificamosdiferentes polıticas publicas y escenarios con riesgo agroecologico tolerable (0-0%) y modelamos sus resultados
Paper submitted September 26, 2012; revised manuscript accepted May 31, 2013.
187Conservation Biology, Volume 28, No. 1, 187–201C© 2013 Society for Conservation BiologyDOI: 10.1111/cobi.12184

188 Coviability of Farmland Biodiversity and Agriculture
hasta el ano 2050. Las restricciones presupuestales, economicas y ecologicas (basado en Farmland Bird Index)fueron esenciales para entender el conjunto de polıticas publicas viables. Nuestros resultados sugieren quealgunas combinaciones de impuestos sobre cereales y subsidios sobre pastizales podrıan ser relevantes paradesarrollar una agricultura multifuncional. Ademas, la flexibilidad y el punto de visto de criterios multiplessubyacentes al acercamiento de co-viabilidad puede ayudar en la implementacion de un manejo adaptativo.
Palabras Clave: bioeconomıa, censo de reproduccion de aves francesas, modelado, polıticas publicas, tierrasde cultivo, uso de suelo, viabilidad
Introduction
Modern agriculture and associated intensification of agri-cultural practices have been identified as major drivers ofthe decline of farmland biodiversity (Krebs et al. 1999).In this context, the need to reconcile economic and con-servation objectives in a sustainable way for agricultureis a major issue.
The importance of the public policies to achieve thisgoal has been highlighted in Alavalapati et al. (2002),Shi and Gill (2005), Mouysset et al. (2011). Public poli-cies can potentially modify farmers’ choices in terms ofland uses and practices and thus affect both the ecosys-tem and the dynamics of biodiversity (Doherty et al.1999; Holzkamper & Seppelt 2007). Many public poli-cies, including agrienvironmental schemes (AES), havebeen proposed by decision makers in Europe as a com-plement to the historical European Common AgriculturalPolicy (CAP), which strongly supports use of arable land.AES, as developed in the “second pillar” of the CAP,are now considered to be the most important tools toreverse the decline of biodiversity in farmlands (Donald& Evans 2006). However, 15 years after the initial im-plementation of such instruments at a large scale, theirability to enhance biodiversity remains in question (Vick-ery et al. 2004; Butler et al. 2009). Indeed, they toooften focus on few species (Benton et al. 2003) or failto yield sufficient effects at a large scale (Kleijn et al.2001). Hence, conservation and sustainable managementof farmland biodiversity still constitute difficult scientificchallenges.
To deal with such agroecological issues, we propose abioeconomic model for use in analyzing public-policy sce-narios. Many of the bioeconomic modeling frameworksare problematic because they rely on optimal-controltheory. In particular, cost-benefit methods require quan-tification of biodiversity in monetary terms (Drechsler2001). Although pricing techniques such as contingentvaluation are available, their suitability for biodiversity isdisputed (Diamond & Hausman 1994). In this context,the cost-effectiveness approach which avoids the needfor monetary evaluation of environmental goods (Gatto &De Leo 2000) by considering biodiversity targets or con-straints in nonfinancial terms while optimizing economicvalues, appears to be a relevant alternative. Results ofcost-effectiveness studies usually show a negative trade-
off between ecological and economic performances ofagriculture (Polasky et al. 2005; Drechsler et al. 2007;Barraquand & Martinet 2011).
We did not focus on the optimal trade-off betweenbiodiversity and agriculture; instead, we adopted a bioe-conomic viability or coviability viewpoint for the analysisof public policies and incentives. By coviability we meanthe simultaneous satisfaction of different constraints re-lated to different points of view. Such a framework is arelevant modeling approach for sustainability (Doyen &Martinet 2012) and is especially useful for balancing ap-parently contradictory bioeconomic goals (Baumgartner& Quaas 2009). More generally the viability approach(Aubin 1990) aims at identifying desirable combinationsof states and controls that ensure proper functioningof the system. This approach does not aim to identifyoptimal paths for the codynamics of resources and ex-ploitation; instead, it provides acceptable trajectories thatsatisfy different kinds of constraints over time. The via-bility framework has been applied to natural resourcemanagement, bringing together socioeconomic and eco-logical constraints, and especially to the managementof renewable resources and fisheries (Bene et al. 2001;Eisenack et al. 2005; Pereau et al. 2012). Links betweenthe coviability approach and population viability analy-sis (PVA) used in conservation biology (Morris & Doak2002) and focused on extinction risk is emphasized byDoyen et al. (2012). Specific applications of coviabil-ity analysis of agroecological issues can be found inSabatier et al. (2012), but they do not provide economicinsight.
We applied the coviability framework in the context ofagriculture, land-use, and terrestrial biodiversity manage-ment. In particular, we examined the role of monetarypublic policies in the sustainable balance between con-servation goals and economic requirements. Our analysisof the viability of agricultural public-policy scenarios re-lied on a bioeconomic model inspired by Mouysset et al.(2011, 2012b, 2013). It articulates, in a stochastic andmultiscale context, 3 components: biodiversity commu-nity dynamics, farming land uses, selected by a groupof heterogeneous farmers (i.d. with different characteris-tics) at the micro-(landscape) level, and macrofinancial in-centives. We applied the model to a metropolitan Francecase study. The coviability approach allowed us to eval-uate the bioeconomic risk of public incentives, defined
Conservation BiologyVolume 28, No. 1, 2014

Mouysset et al. 189
by the probability of satisfying a set of ecological andeconomic constraints up to the year 2050. We defineecological constraint as guaranteed levels of differentbiodiversity indicators. We sought to expand the useof a bioeconomic coviability approach to modeling andanalysis of complex bioeconomic farming issues. We si-multaneously accounted for spatial and multiscale dimen-sions and stochasticities. We also emphasized how PVAas it is applied in conservation biology in a focuses onextinction risks can be expanded to a bioeconomic via-bility or coviability approach. We aimed to shed light onpublic-policy issues and scenarios in terms of multifunc-tional agriculture and sustainable farming land-use andecosystems.We determined to what extent a mix of taxesand subsidies on grasslands can promote a reconciliationof ecological and economic objectives.
Methods
Bioeconomic Model
Metropolitan France is split into 620 small agriculturalregions (SAR). An SAR is part of a department (a majorFrench administrative entity) that exhibits an agroecolog-ical homogeneity. This consistency from both the eco-logical and economic points of view makes the SAR scalewell suited for our bioeconomic modeling. One model(described below) was built for each SAR.
To assess ecological performance of France, we fo-cused on common bird populations (Ormerod & Watkin-son 2000; Gregory et al. 2004). The French Bird BreedingSurvey (FBBS) database (Jiguet et al. 2011) provided theinformation related to bird abundances across the entirecountry. Abundance values for each species were avail-able for 2002–2008. Among the species monitored bythis large-scale long-term survey, we selected 14 gener-alist species and 20 farmland specialist species that havebeen classified according to their habitat requirements ata European scale (European Bird Census Council 2007)(Supporting Information).
For agroeconomic data, we use the French agroeco-nomic classification Otea developed by the French FarmAccounting Data Network and the Observatory of Ru-ral Development. This organization classifies agriculturalland uses in 14 classes (Supporting Information). EachSAR is a specific combination of these 14 classes. Thesurfaces dedicated to each class and the associated grossmargins are available for 2002–2008. We calibrated thebudgetary constraint with the current French CommonAgricultural Policy budget.
As depicted in Fig. 1, the bioeconomic model had 3components articulated within a multiscale perspectiveas in Mouysset et al. (2011): the public policy at the large(national) scale interacts with the farming land uses andbiodiversity dynamics at the local (SAR) scale.
Biodiversity Model
The biodiversity model dealt with a community ofspecies. It was based on population dynamics with in-traspecific competition that depended on habitat andfarming land-use. A Beverton–Holt function captured in-traspecific competition:
Ns,r (t + 1) = Ns,r (t) ·(
1 + Rs,r
1 + Ns,r (t)Ms,r (t)
+ εs,r (t)
), (1)
where Ns,r (t) is abundance of species s in region r atyear t and Rs,r coefficient is intrinsic growth rate specificto a given species s in region r. The random variablesεs,r (t) capture the environmental stochasticity affectingthe population dynamics, and these variables are drawnfrom Gaussian distributions calibrated with the historicalgrowth rate compared with the estimated growth ratein the time series. Negative populations are consideredextinct and consequently their abundances are forced tozero. The product Ms,r (t) × Rs,r is the carrying capacityof habitat r. The habitat parameter Ms,r (t) captures theability of habitat r to host the species s and is assumed todepend on the agricultural systems k as follows:
Ms,r (t) = βs,r +∑
k
αs,r,k· Ar,k(t), (2)
where Ar,k (t) is the share of the “utilized agriculturalarea” (UAA) of the small agricultural region r dedicatedto the agricultural system k. Consequently, the αs,r,k andβs,r coefficients, specific to each species, quantify howspecies s responds to agricultural land-use k in region r .The βs,r coefficient is the mean habitat coefficient forspecies s in region r and integrates other factors, suchas the proportion of forest or urban areas. Parametersαs,r,k and βs,r were calibrated with a least-squares method(Mouysset et al. 2013). The drivers of land-uses Ar,k (t) arespecified in the Economic Model section.
Economic Model
Although our bioeconomic model departs from optimal-ity at the public-decision level to adopt a coviabilityviewpoint, as explained below, the model is still basedon optimality at the microeconomic level through maxi-mal expected utility of income of representative farmers.Each region is represented by a representative farmer orstandard agent. The aggregation of individual farmers of agiven SAR into a representative farmer is justified by theagroeconomic homogeneity of the SAR. Consequently,the farmers within an SAR face similar environments andconstraints. The income per hectare in region r at year t ,denoted by Incr (t), relies on the gross margin per unit ofscale gmr,k(t), current proportions of the UAA dedicatedto the agricultural systems Ar,k (t) and public incentives
Conservation BiologyVolume 28, No. 1, 2014

190 Coviability of Farmland Biodiversity and Agriculture
Figure 1. Structure of the bioeconomic model. The decision maker determines incentive scenarios (i.e., publicpolicy scenarios) that affect farmers’ decisions. The farmers choose their agricultural systems by maximizing theirutility function under technical constraints. These choices affect habitat and bird communities in an uncertaincontext.
τk based on expected gross margins gmr,k as follows:
Incr (t) =∑
k
Ar,k(t) · (gmr,k(t) + gmr,kτk). (3)
The public incentives are determinist and are com-puted as a percentage of expected gross margins: taxeswith τk < 0 and subsidies with τk > 0. We assumedgross margins were stochastic and captured market, pro-duction and climate uncertainties. To characterize suchrandomness an independent and identically distributedGaussian distribution parameterized with the mean andthe covariance matrix of the historical data is chosen:
gmr (t) → N (gmr ,∑
r ), (4)
where expected gross margins gmr,k are the mean of the 7historical years and the matrix
∑r of standard deviations
is computed with the covariances σr,k,k′ between grossmargins of agricultural systems k and k′ in region r .
We assumed the land-use decisions of each representa-tive farmer in region r relied on the maximization (underconstraints) of the expected utility, E [U (Incr (t))], de-rived from farming incomes per hectare. The selected util-ity function took an exponential form, U (x) = 1 − e−ax,where parameter a is risk aversion level (also called
the Arrow–Pratt index). Following Sargent (1987), weproved in the Gaussian context that
E [U (Incr (t))] = 1 − e−a(E[Incr (t)]− a2 Var[Incr (t)]). (5)
In other words, maximizing the expected utility of in-comes per hectare,
maxAr,1(t);···;Ar,14(t)
E [U (Incr (t))] , (6)
is equivalent in terms of optimal land allocation to themaximization of a difference between the expected in-come E [Incr (t)] and its risky part Var [Incr (t)]:
maxAr,1(t);...;Ar,14(t)
E[Incr (t)] − a
2Var [Incr (t)] , (7)
where
E[Incr (t)] =∑
k
gmr,k.Ar,k(t).(1 + τk) and (8)
Var[Incr (t)] =∑
k
∑k′
σr,k,k′(t).Ar,k(t).Ar,k′(t) (9)
For each year t, the regional standard agents chosetheir agricultural land uses, Ar,k (t), in order to maximizetheir expected utility according to rigidity (Eq. 10) and
Conservation BiologyVolume 28, No. 1, 2014

Mouysset et al. 191
surface constraints (Eq. 11). This approach follows theframework of maximization under constraints as in Po-lasky et al. (2005), Drechsler et al. (2007), and Mouyssetet al. (2011). When maximizing the expected utility, thestandard agent must comply with 2 constraints at everyperiod:
|Ar,k(t) − Ar,k(t − 1)| ≤ κ.Ar,k(t − 1) and (10)
∑k
Ar,k(t) = 1 (11)
The rigidity constraint (Eq. 10) restricts the area thefarmer can modify at each period for each agricultural sys-tem k. The parameter κ captures change costs or inertia.The constraint (Eq. 11) ensures that the total UAA is keptfixed. The parameters a and κ are calibrated accordingto a least-squares method (Mouysset et al. 2013).
Thus, in this economic model, land uses Ar,k (t) de-pend both on previous areas Ar,k (t − 1), the public pol-icy incentives τk, expected gross margins gmr,k, covari-ance parameters σr,k,k′ , the risk aversion level a, andthe rigidity coefficient κ . The parameters gmr,k, σr,k,k′ ,κ , and a are exogenous, whereas the public incentivesτk are endogenous and determined by a public decisionmaker according to a coviability approach explained insection 2.
Bioeconomic Indicators
We computed the indicators used to assess the ecologicalperformances through the abundances Ns,r (t) of eachspecies. As suggested in Mouysset et al. (2012b), we an-alyzed the communities through a combination of thefarmland bird index (FBI), community specialization in-dex (CSI), and the community trophic index (CTI). TheFBI, which measures the growth of the farmland special-ist community, has been adopted by the European Com-munity as the official environmental index, especially foranalysis of structural changes in biodiversity (Balmfordet al. 2003). In this aggregated index, the variation inabundances of each species is similarly taken into accountindependent of the abundance value. We first calculateda national population index for each species from theabundance values of all SAR r:
Ns,Nat(t) =∑
r
Ns,r (t). (12)
Then we calculated the aggregated indicator FBINat
FBINat (t) =∏
s∈Specialist
(Ns,Nat (t)
Ns,Nat (2008)
)1/20
(13)
The CTI quantifies average trophic level of a commu-nity (Pauly et al. 1998). The CTI integrates the speciestrophic index (STI) of both the generalist species and
the farmland specialist species (Supporting Information).The STI is built on the diets described in BWPi (2006) onthe basis of the proportion of each species diet that is veg-etable, invertebrate prey, and vertebrate prey (Mouyssetet al. 2012b). The CTI classifies communities with mainlygranivorous species (i.e., low trophic level) relative tocommunities with more insectivorous and carnivorousspecies (i.e., high trophic level) (Mouysset et al. 2012b).We computed it as the arithmetic mean of the exponen-tial of the species trophic level weighted by abundancesof each species in the community
Ntot,r (t) =∑
s
Ns,r (t) and (14)
CTIr (t) =∑
s
Ns,r (t)
Ntot,r (t). exp (STIs ) (15)
We used an exponential function to better contrastcommunities with or without bird individuals of thehigher trophic levels. The CTINat is the arithmetic meanof the 620 regional CTIr
CTINat (t) = 1
620.∑
r
CTIr (t) (16)
Finally, the CSI quantifies the response of the compo-sition of local bird communities to agricultural pressures(Barnagaud et al. 2011). Habitat specialization species in-dex (SSI) has been computed for each species, based onthe coefficient of variation of the abundance of a speciesacross 18 habitat categories (Julliard et al. 2006). TheSSI values for all the species we considered here are inMouysset et al. (2012b). This index measures the averagedegree of habitat specialization among the individuals ofthe community. It discriminates the ordinary communityof generalist species, which are more resilient to per-turbation, from the specialized communities with morespecialist species, which are especially sensitive to globalchange (Julliard et al. 2006). For each square, we calcu-lated the local CSIr as the arithmetic mean of the speciesspecialization index weighted by the abundances (Eq. 14)and
CSIr (t) =∑
s
Ns,r (t)
Ntot,r (t).SSIs (17)
We calculated the national CSINat as the arithmeticmean of the 620 regional CSIr:
CSINat (t) = 1
620.∑
r
CSIr (t) (18)
We measured the economic performance of farmersby national income:
IncNat (t) = 1
SNat
∑r
Sr .Incr (t), (19)
Conservation BiologyVolume 28, No. 1, 2014

192 Coviability of Farmland Biodiversity and Agriculture
where SNat = ∑r Sr is the total agricultural surface of
SAR over France and Sr is the agricultural area of thesmall agricultural region r.
Hereafter, the public budget played a major role inthe analysis of viability of public policies. This budget,Budg(t), was computed according to the incentives asfollows:
Budg (t) =∑
r
∑k
Sr .gmr,k.Ar,k (t) .τk (20)
Coviability Scenarios
In the coviability approach, we considered both biodi-versity and economic viability objectives through a largeset of constraints to be satisfied. The constraints had tobe satisfied in the probabilistic sense as in Doyen andDe Lara (2010) and Doyen et al. (2012). Given a confi-dence rate, the viable kernel makes it possible to identifydifferent public policies and scenarios with admissibleagroecological risk. We now describe the different con-straints taken into account hereafter. We compared theconstraint scenarios with the Statu Quo (SQ) scenario,which corresponds to the performances obtained if theland uses were fixed to the 2008 levels:
ASQr,k (t) = Ar,k (2008) , t = 2009, . . . , T (21)
Ecological Constraints
We defined ecological constraints as guaranteed levelsof biodiversity for different biodiversity indices: FBI, CSI,and CTI. The viability thresholds for the constraints werebased on the performances of these indices (FBISQ (t),CTISQ (t), CSISQ (t)) obtained with the SQ scenario as de-fined by Eq. 21. It is thus required that
FBI (t) ≥ λ · FBISQ (t) (22)
CTI (t) ≥ λ · CTISQ (t) (23)
CSI (t) ≥ λ · CSISQ (t) (24)
where λ is the strength of the constraint. We tested 3levels of strength: λ = 90%, λ = 93%, and λ = 95%.
Economic Constraints
For economic constraints, determination of the economicviability of public policies requires that the income perhectare Inc(t) derived from farming activities are notworse than the current or SQ level, IncSQ(t), derived from
(Eq. 21)
Inc (t) ≥ λ · IncSQ (t) (25)
Public-policy scenarios were also constrained to com-ply with a budgetary rule (Eq. 26)
Budg (t) ≤ Budg (2008) (26)
where Budg(t) stands for the budget dedicated to thefarming policy. The budget constraint means that, foreach year, the decision maker has a budgetary envelope.This budget can be allocated among the different landuses according to the objectives of the agency. Because ofthis annual envelope, it is possible to have many subsidiessimultaneously. In other words, a subsidy on one sidedoes not need to be compensated by a tax on the other. Ofcourse, if the decision maker wants to strongly increasethe subsidy on one side (more than the envelope), a taxwill be required on the other side to avoid violating thebudgetary constraint. This situation is consistent withreality, where the European states receive a budgetaryenvelope from the EU and from their own government.The national budget for agricultural policies does notderive only from farming taxes. In our simulation, weused the French budget, Budg (2008) (which is the finalyear of our time series), as reference for the budgetaryenvelope.
Viable Incentives
We based the public policies in this study on incentivesτ (subsidies and taxes) allocated to the different agricul-tural systems k. Bioeconomic performances in responseto these scenarios were computed from 2009 to 2050(T = 2050) according to the ecological and economicobjectives described above.
For computational reasons, the public-decision vari-ables were restricted to 2 incentives: cereal incentiveτcrop is dedicated to arable lands (Supporting Information)and the grassland incentive τgrass is applied to noninten-sive grassland systems (Supporting Information).
We dealt with uncertainty in a probabilistic sense.We therefore performed a stochastic coviability anal-ysis (CVA). For this, we considered a probabilityP on scenarios ω (.) ∈ associated with stochas-tic variables gmr,k (t) and εr,k (t). For each public-decision scenario τ , we compute the probability ofsatisfying the different bioeconomic constraints overtime:”
CVA (τ ) = P(Constraints (22) , (23) ,
(24
), (25) and(
26), holds for t = 2009, . . . , 2050
).
(27)
Conservation BiologyVolume 28, No. 1, 2014

Mouysset et al. 193
Given a confidence rate β ∈ [0, 1], we aimed to iden-tify the controls τcrop and τgrass that satisfy the followingcondition:
CVA (τ ) ≥ β. (28)
Given a level of risk 1 − β, we sought to identify vi-able incentives τ = (
τcrop, τgrass
)that satisfied viability
condition (Eq. 28). Of particular interest were the in-centives that maximized the viability probabilities, that ismaxτ CVA (τ ). Given a level of risk 1 − β, we defined theviable decision kernel τ
βVIAB as
τβVIAB = {τ, CVA (τ ) ≥ β} . (29)
Given the stochastic framework, the outcomes of everyincentive scenario, τ = (
τcrop, τgrass
), were generated 100
times to approximate its viability probability CVA (τ ).We assumed Gaussian independent and identically dis-tributed random variables gm(t) and introduced ε in Eq.3 and Eq. 1, respectively.
Results
Public Policies and Bioeconomic Constraints
We found a viable set τVIAB of public policies that bal-anced the economic and ecological objectives with lim-ited risk (Fig. 2). The set (black in Fig. 2) satisfies theconstraints with a high confidence rate β = 100%. Thisviable kernel τVIAB relied on subsidies for nonintensivegrasslands
(τgrass ≥ 0
)and taxes for crops
(τcrop ≤ 0
).
However, the incentives could vary significantly withinthis kernel (0.3 ≤ τgrass ≤ 0.6 and −0.2 ≤ τcrop ≤ −0.7 inthe case λ = 93%) and still maintain the same bioeco-nomic risk.
Economic Sensitivity
The budgetary constraint Eq. 26 offers a large set of pos-sibilities of public policies to which other constraints canbe added (Fig. 3). Because of the existence of the annualenvelope Budg (2008), which can be distributed in eachyear, it was possible to combine simultaneously subsi-dies on both grasslands and croplands. However, if thesubsidies were too high, the required budget exceededthe annual envelope and the budgetary constraint wasviolated. The budgetary constraint offers a large set ofpossibilities of public policies to which other constraintscan be added.
With the economic constraint, viable policies exist inthe upper triangle beyond a decreasing line between cropand grassland incentives (Fig. 4). Typically, to satisfy theincome constraint, it was possible to use subsidies onboth grasslands and croplands. It was also possible toreduce 1 of the 2 subsidies and transform it to taxes, butthe other incentive had to be increased to compensate
Figure 2. Coviability probabilities CVA (τ ) that thegrassland- and crop-incentive scenarios satisfy the setof constraints (budget, income, farmland bird index,community trophic index, community specializationindex). Lambda ((a) 90%, (b) 93% and (c) 95%)represent the strength of the constraints (Eqs. 22, 23,24, 25). The degree of shading represents probabilityfrom 0 (white) to 1 (black).
Conservation BiologyVolume 28, No. 1, 2014

194 Coviability of Farmland Biodiversity and Agriculture
Figure 3. Probabilities that the grassland- and crop-incentive scenarios satisfy budgetary constraint (Eq. 26). Thedegree of shading represents probability from 0 (white) to 1 (black).
the economic loss. When the economic objective wasmore demanding (i.e., λ increased in Eq. 25), the trade-off moved upward, and the size of the feasible incentivewas reduced: the reduction of one incentive required alarger increase in the other incentive.
Two of the 3 edges of the viable kernels in Fig. 2 arosefrom the economic constraints: the vertical edge on theleft resulted from the budgetary constraint, whereas thediagonal edge on the right resulted from the income re-quirement (Figs. 2–4).
Ecological Sensitivity
The FBI constraint was the most restrictive (Fig. 5). Forthe same strength of constraint λ, the set of acceptablepublic policies obtained with the FBI constraint wassmaller than the one obtained under the CTI and CSI con-straints. Furthermore, for these levels of constraint, theconstraints on the CTI and the CSI were not binding: theentire set of strategies complied with these constraintsover time.
With the FBI constraint (Eq. 22), the set of feasible pub-lic policies exits in the lower right square between the 2incentives (τgrass and τcrop). To satisfy the FBI constraintwith a high confident rate (β = 100%, dark shading inFigs. 5a–c), the public policy had to combine subsidieson grasslands and taxes on croplands. When the subsidyon grasslands was decreased, this action had to be com-pensated for by a larger tax on croplands. Alternatively,
when the subsidy on grasslands increased, the pressureon croplands decreased, and it was possible to combinethe increased subsidy on grasslands with a smaller taxon croplands by staying within the kernel. When the FBIconstraint was more stringent (i.e., λ is increased in Eq.22), the positive trade-off is moved downward. In otherwords, to stay within the kernel with a high confidencerate, the pressure on taxes on croplands has to increaseif the grassland subsidies decrease.
The horizontal boundary on the top of the viable ker-nels in Fig. 2 resulted from the ecological constraint re-lated to FBI requirements (Fig. 5).
Trajectories and Land Uses
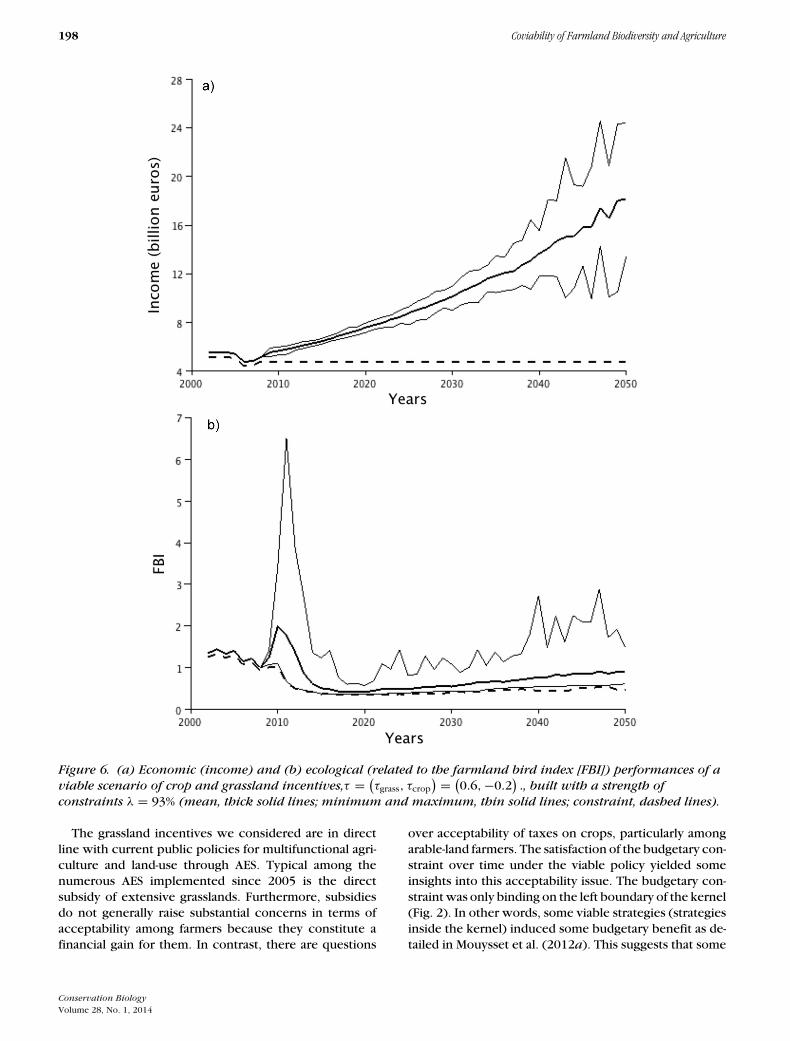
When the constraint threshold was set at λ = 93%, thescenario that combined taxes τcrop = −0.2 on croplandand subsidies τgrass = 0.6 was an example of a viable pub-lic policy (Fig. 6). Viable scenarios are associated witha substitution of cropland by nonintensive grasslands(Fig. 7).
Discussion
Coviability Approach to Address Sustainability
The use of bioeconomic models and viability assessmentsintegrating ecological and socioeconomic processes and
Conservation BiologyVolume 28, No. 1, 2014

Mouysset et al. 195
Figure 4. Probabilities that the grassland- andcrop-incentive scenarios satisfy economic constraint(Eq. 25). Sensitivity analysis is with respect to thestrength of the constraint. Lambda ((a) 90%, (b) 93%and (c) 95%) represent the strength of the constraint(Eq. 25). The degree of shading represents probabilityfrom 0 (white) to 1 (black).
goals was highlighted by Bene et al. (2001), Doyenet al. (2012), and Pereau et al. (2012). Our results confirmthat this viability method is a convenient tool to recon-cile apparently contradictory objectives. Indeed, manystudies based on optimal control approaches have iden-tified a Pareto-optimum frontier between the ecologicaland economic performance of agriculture (Polasky et al.2005; Barraquand & Martinet 2011). In other words,there is no unique scenario that maximizes ecologicaland economic criteria simultaneously. Our approach of-fers a more flexible sustainability framework that allowsone to balance different goals. In the stochastic contextdiscussed in Baumgartner and Quaas (2009), Doyen et al.(2007, 2012), by examining both ecological and socioe-conomic risks, this bioeconomic viability or coviabilityframework extends PVA used in conservation biology(Morris & Doak 2002).
Beyond the analysis of our French case study, our re-sults support an integrated and multicriteria approachthat involves many scientific disciplines in broad collab-orative efforts. A wide range of stakeholders are involvedin agroecological and farming land-use issues. Each ofthese groups has an interest in particular outcomes, andsome outcomes considered desirable by one stakeholdermay be undesirable to another group. The considerationof the multidimensional nature of farming is helpful forsustainable management of terrestrial resources and bio-diversity and brings together economic, environmental,and social viewpoints. Our study is in direct line withthese considerations.
Moreover, by focusing on sustainability and viability,our model resulted in management strategies and scenar-ios that satisfied different constraints over time. Thus,the model accounts for intergenerational equity and al-lows for conciliation between the present and the future.By identifying current public-policy decisions that avoidfuture crises without penalizing the current generation,the viability approach is consistent with the definition ofsustainability especially through its links with the maxi-mum (or Rawlsian) approach (i.e., approach focused onthe maximization of the poorest generation) as empha-sized in Doyen and Martinet (2012).
By reconciling apparently antagonistic objectives andoffering a multicriteria and intertemporal equity frame-work, the coviability strategy turns out to be a promisingapproach to address sustainability. This strongly argues infavor of the use of the coviability framework by decisionmakers to analyze public-policy scenarios as a comple-ment to the more usual cost-effectiveness or cost-benefitapproaches.
Moreover, through this work we have expanded theapplication of the approach to complex bioeconomic,land-use, and agroecological contexts. In particular, theincorporation of both spatial or multiscale dimensions isnew. The mix of ecological and economic stochasticities
Conservation BiologyVolume 28, No. 1, 2014

196 Coviability of Farmland Biodiversity and Agriculture
Figure 5. Probabilities that the grassland- and crop-incentive scenarios satisfy ecological constraints : (a)–(c)farmland bird index (FBI) (Eq. 22), (d)–(f) community trophic index (CTI) (Eq. 23), and (g)–(i) communityspecialization index (CSI) (Eq. 24). Sensitivity analysis is with respect to the strength of the constraint withλ = 90%, 93%, 95%, where λ is the strength of the constraints (Eqs. 22, 23, 24). The degree of shading representsprobability from 0 (white) to 1 (black).
Conservation BiologyVolume 28, No. 1, 2014

Mouysset et al. 197
Figure 5. Continued.
also constitutes a new stage for the development of theapproach.
Decision Support for Farming Land-Use and FarmlandBiodiversity
We developed a dynamic bioeconomic model to rep-resent and agroecosystem. Our model combines mul-tispecies and multiscale considerations. The coviabilityanalysis identified public policies for multifunctional andsustainable agriculture.
We found that viable policies were based on a com-bination of taxes on crops and subsidies on extensiveand semiextensive grasslands. The positive effect of thedevelopment of grasslands to achieve biodiversity goalshas been shown (Potter & Goodwin 1998; Laiolo 2005).Here, we argue this point within a broad context: accord-ing to a multicriteria and bioeconomic perspective that
integrates risk management and accounts for intergener-ational equity.
According to our economic data set, which implic-itly integrated current public policy, the combination ofcrop taxes and grassland subsidies can be interpretedas a reduction of the current subsidies on croplands inthe first pillar of the Common Agricultural Policy and adevelopment of the second pillar subsidizing extensivegrasslands. This highlights the importance of the 2 pil-lars in achieving sustainable agricultural public policies.In other words, it is not sufficient to increase the sec-ond pillar without changing the first. From an economicviewpoint, this result is not surprising. The underlyingprinciple is the management of externalities: negative ex-ternalities (e.g., crops, which have on average a negativeeffect on biodiversity) are taxed, whereas positive exter-nalities (e.g., grasslands which have on average a positiveeffect on biodiversity) are supported and subsidized.
Conservation BiologyVolume 28, No. 1, 2014
198 Coviability of Farmland Biodiversity and Agriculture
Figure 6. (a) Economic (income) and (b) ecological (related to the farmland bird index [FBI]) performances of aviable scenario of crop and grassland incentives,τ = (
τgrass, τcrop
) = (0.6,−0.2
)., built with a strength of
constraints λ = 93% (mean, thick solid lines; minimum and maximum, thin solid lines; constraint, dashed lines).
The grassland incentives we considered are in directline with current public policies for multifunctional agri-culture and land-use through AES. Typical among thenumerous AES implemented since 2005 is the directsubsidy of extensive grasslands. Furthermore, subsidiesdo not generally raise substantial concerns in terms ofacceptability among farmers because they constitute afinancial gain for them. In contrast, there are questions
over acceptability of taxes on crops, particularly amongarable-land farmers. The satisfaction of the budgetary con-straint over time under the viable policy yielded someinsights into this acceptability issue. The budgetary con-straint was only binding on the left boundary of the kernel(Fig. 2). In other words, some viable strategies (strategiesinside the kernel) induced some budgetary benefit as de-tailed in Mouysset et al. (2012a). This suggests that some
Conservation BiologyVolume 28, No. 1, 2014

Mouysset et al. 199
Figure 7. Ratio of grasslands to the sum of crop and grassland areas with the (a) statu quo scenario and (b–e) 4public-policy scenarios in 2050. Fig. 7d corresponds to the scenario in Fig. 6.
Conservation BiologyVolume 28, No. 1, 2014

200 Coviability of Farmland Biodiversity and Agriculture
redistribution could occur from the budget gain to thosefarmers incurring private costs and losses due to taxes oncrops. Such a financial reallocation could promote theacceptability and governance of such strategies. More-over, the size of the kernel of viable strategies offersadditional flexibility to integrate other constraints, suchas social objectives that could also be fruitful in terms ofacceptability and governance.
As suggested by Mouysset et al. (2012b), we integratedthe 3 indicators FBI, CSI, and CTI as ecological criteria ofbiodiversity. The sensitivity analysis showed that the FBIwas the most sensitive and the most restrictive criteria.In others words, by sustaining the FBI, the 3 ecologicalconstraints were satisfied. This result validates the choiceof this indicator by the European Union as an indicator ofstructural biodiversity changes in response to agriculturalevolution (Balmford et al. 2003), even if this is not themost relevant in functional terms.
New Directions and Method Improvements
First, other policies, incentives, and tools can be inte-grated to reinforce the credibility of the public-policyscenario we examined. For example, the classical AESas currently implemented in France could be modeledin more detail. Second, refinements might concern mod-eling bird population dynamics by integrating speciesdispersal and interactions and detailing the functions ofthe birds in the agroecosystem. In particular, the spa-tial scale we used (small agricultural regions) providedagroecological consistency and may be appropriate formodeling public policies and agricultural practices. How-ever, it might not be the best scale with which to modelbird population dynamics. A landscape scale seems rele-vant for analysis of the biodiversity-oriented agriculturalpublic policy (Batary et al. 2011). Third, relevant newindicators could be added to the constraints involved inour method. For instance, social requirements such asinter-regional equity or productivity constraints might betaken into account.
Acknowledgments
This work was carried out with the financial supportof both the ANR (Agence Nationale de la Recherche)and The French National Research Agency under theSysterra program—Ecosystems and Sustainable Develop-ment (project ANR-08-STRA-007, FARMBIRD-Coviabilitymodels of FARMing and BIRD biodiversity) and the FRB(Fondation pour la Recherche en Biodiversite) with theMOBILIS program Modeling for Scenarios and SustainableManagement of Biodiversity, Farming and Forestry FacingClimate Change.
Supporting Information
The list of the 10 farmland and the 14 generalist (Ap-pendix S1) and of the 14 farming land uses (Appendix S2)are available online. The authors are solely responsible forthe content and functionality of these materials. Queries(other than absence of the material) should be directedto the corresponding author.
Literature Cited
Alavalapati, J. R. R., G. A. Stainback, and D. R. Carter. 2002. Restorationof the longleaf pine ecosystem on private lands in the US South: anecological economic analysis. Ecological Economics 40:411–419.
Aubin, J-P. 1990. A survey of viability theory. The SIAM Journal onControl and Optimization 28:749–788.
Balmford, A., R. E. Green, and M. Jenkins. 2003. Measuring the changingstate of nature. Trends in Ecology and Evolution 18:326–330.
Barnagaud, J-Y., V. Devictor, F. Jiguet, and F. Archaux. 2011. Whenspecies become generalists: on-going large-scale changes in birdhabitat specialization. Global Ecology and Biogeography 20:630–640.
Barraquand, F., and V. Martinet. 2011. Biological conservation indynamic agricultural landscapes: effectiveness of public policiesand trade-offs with agricultural production. Ecological Economics70:910–920.
Batary, P., B. Andras, D. Kleijn, and T. Tscharntke. 2011. Landscape-moderated biodiversity effects of agri-environmental management: ameta-analysis. Proceedings of the Royal Society B-Biological Sciences278:1894–1902.
Baumgartner, S., and M. F. Quaas. 2009. Ecological-economic viabilityas a criterion of strong sustainability under uncertainty. EcologicalEconomics 68:2008–2020.
Bene, C., L. Doyen, and D. Gabay. 2001. A viability analysis for a bioe-conomic model. Ecological Economics 36:385–396.
Benton, T. G., J. A. Vickery, and J. D. Wilson. 2003. Farmland bio-diversity: Is habitat heterogeneity the key? Trends in Ecology andEvolution 18:182–188.
Butler, S. J., D. Brooks, R. E. Feber, J. Storkey, J. A. Vickery, and K.Norris. 2009. A cross-taxonomic index for quantifying the health offarmland biodiversity. Journal of Applied Ecology 46:1154–1162.
BWPi. 2006. Birds of the western paleartic interactive. Technical Re-port. BirdGuides Ltd., United Kingdom.
Diamond, P. A., and J. A. Hausman. 1994. Contingent valuation: Is somenumber better than no number? Journal of Economic Perspectives8:45–64.
Doherty, P. F., Jr., E. A. Marschall, and T. C. Grubb Jr. 1999. Bal-ancing conservation and economic gain: a dynamic programmingapproach. Ecological Economics 29:349–358.
Donald, P. F., and A. D. Evans. 2006. Habitat connectivity and matrixrestoration: the wider implications of agri-environment schemes.Journal of Applied Ecology 43:209–218.
Doyen, L., and M. De Lara. 2010. Stochastic viability and dynamic pro-gramming. Systems and Control Letters 59:629–634.
Doyen, L., and V. Martinet. 2012. Maximin, viability and sustainability.Journal of Economic Dynamic and Control 36:1414–1430.
Doyen, L., M. De Lara, J. Ferraris, and D. Pelletier. 2007. Sustainabilityof exploited marine ecosystems through protected areas: a viabilitymodel and a coral reef case study. Ecological Modelling 208:353–366.
Doyen, L., O. Thebaud, C. Bene, V. Martinet, S. Gourguet, M. Bertignac,S. Fifas, and F. Blanchard. 2012. A stochastic viability approach
Conservation BiologyVolume 28, No. 1, 2014

Mouysset et al. 201
to ecosystem based fisheries management. Ecological Economics75:32–42.
Drechsler, M. 2001. The importance of economic costs in the develop-ment of guidelines for spatial conservation management. BiologicalConservation 97:51–59.
Drechsler, M., F. Watzold, K. Johst, H. Bergmann, and J. Settele. 2007.A model-based approach for designing cost-effective compensationpayments for conservation of endangered species in real landscapes.Biological Conservation 140:174–186.
Eisenack, K., J. Scheffran, and J. P. Kropp. 2005. Viability analysis ofmanagement frameworks for fisheries. Environmental Modeling andAssessment 11:69–79.
European Bird Census Council. 2007. The state of Europe’s commonbirds? EBCC.
Gatto, M., and G. A. De Leo. 2000. Pricing biodiversity and ecosystemservices: the never-ending story. Bioscience 50:347–355.
Gregory, R. D., D. G. Noble, and J. Custance. 2004. The state of playof farmland birds: population trends and conservation status of low-land farmland birds in the United Kingdom. Ibis 146:1–3.
Holzkamper, A., and R. Seppelt. 2007. Evaluating cost-effectiveness ofconservation management actions in an agricultural landscape on aregional scale. Biological Conservation 136:117–127.
Jiguet, F., V. Devictor, R. Julliard, and D. Couvet. 2011. French citi-zens monitoring ordinary birds provide tools for conservation andecological sciences. Acta Oecologica 44:58–66.
Julliard, R., J. Clavel, V. Devictor, F. Jiguet, and D. Couvet. 2006. Spa-tial segregation of specialists and generalists in bird communities.Ecology Letters 9:1237–1244.
Kleijn, D., F. Berendse, R. Smit, and N. Gilissen. 2001. Agri-environmentschemes do not e_ectively protect biodiversity in Dutch agriculturallandscapes. Nature 413:723–725.
Krebs, J. R., J. D. Wilson, R. B. Bradbury, and G. M. Siriwardena. 1999.A second silent spring? Nature 400:611–612.
Laiolo, P. 2005. Spatial and seasonal patterns of bird communities onItalian agroecosystems. Conservation Biology 19:1547–1556.
Morris, W. F., and D. F. Doak. 2002. Quantitative conservation biology:theory and practice of population viability analysis. Boulder.
Mouysset, L., L. Doyen, F. Jiguet, G. Allaire, and F. Leger. 2011. Bioeconomic modeling for a sustainable management of biodiversity inagricultural lands. Ecological Economics 70:617–626.
Mouysset, L., F. Jiguet, and L. Doyen. 2012a. A double ben-efit of biodiversityin agriculture. In Bioecon Conference;http://www.bioecon-network.org/pages/14th 2012/Doyen.pdf (ac-cessed 2012).
Mouysset, L., L. Doyen, and F. Jiguet. 2012b. Different policy scenar-ios to promote various targets of biodiversity. Ecological Indicators14:209–221.
Mouysset, L., L. Doyen, and F. Jiguet. 2013. How does economic riskaversion affect biodiveristy? Ecological Applications 23:96–109.
Ormerod, S. J., and A. R. Watkinson. 2000. Editors’ introduc-tion: Birds and agriculture. Journal of Applied Ecology 37:699–705.
Pauly, D., V. Christensen, J. Dalsgaard, R. Froese, and F. TorresJr. 1998. Fishing down marine food webs. Science 279:860–863.
Pereau, J-C., L. Doyen, L. R. Little, and O. Thebaud. 2012. The triplebottom line: meeting ecological, economic and social goals withindividual transferable quotas. Journal of Environmental Economicsand Management 63:419–434.
Polasky, S., E. Nelson, E. Lonsdorf, P. Fackler, and A. Starfield. 2005.Conserving species in a working landscape: land use with bio-logical and economic-objectives. Ecological Applications 15:2209–2209.
Potter, C., and P. Goodwin. 1998. Agricultural liberalization in the Euro-pean Union: an analysis of the implications for nature conservation.Journal of Rural Studies 14:287–298.
Sabatier, R., L. Doyen, and M. Tichit. 2012. Action versus result-orientedschemes in a grassland agroecosystem: a dynamic modellingapproach. Plos One 7:e33257.
Sargent, T. J. 1987. Macroeconomic theory (economic theory, econo-metrics and mathematical economics series). 2nd edition. EmeraldGroup Publishing Limited, United Kingdom.
Shi, T., and R. Gill. 2005. Developing effective policies for the sus-tainable development of ecological agriculture in China: the casestudy of Jinshan County with a systems dynamics model. EcologicalEconomics 53:223–246.
Vickery, J. A., R. B. Bradbury, I. G. Henderson, M. A. Eaton, andP. V. Grice. 2004. The role of agri-environment schemes and farmmanagement practices in reversing the decline of farmland birds inEngland. Biological Conservation 119:19–39.
Conservation BiologyVolume 28, No. 1, 2014