frontal subduction of a cool surface water mass in ... - unam · frontal subduction of a cool...
TRANSCRIPT

Frontal subduction of a cool surface water mass in the Gulf ofTehuantepec, Mexico
A. Trasviña1, E. D. Barton2, H. S. Vélez3 and J. Brown4
1 CICESE, La Paz BCS, Mexico2 University of Wales, Menai Bridge, United Kingdom3 Universidad Autónoma Metropolitana, Iztapalapa, México, D.F., México4 Fisheries Laboratories, Suffolk, United Kingdom
Received: September 5, 2001; accepted: February 25, 2002
RESUMENLos eventos de viento del norte en el Golfo de Tehuantepec generan grandes giros cálidos e intensos chorros de corriente
hacia afuera de la costa. Estos últimos producen abordaje de aguas subsuperficiales y forman ‘parches’ de agua superficial fría(densa). En la frontera entre giros y parches se generan frentes intensos de densidad. Una fracción importante del agua fría sehunde bajo estos giros. El fenómeno se observa como lentes (giros) dentro de la picnoclina del giro cálido principal, son establese interactúan con éste. Se presenta evidencia observacional de la existencia de dos de estas lentes. La presencia de subducción seconfirma mediante argumentos cualitativos (observaciones del flujo y del campo de densidad) y mediante argumentos de vorticidad.La tasa de subducción puede alcanzar los 80 m d-1. Se presente un esquema conceptual revisado del proceso de generación degiros: a) durante un evento la corriente hacia fuera de la costa produce abordaje del agua subsuperficial y establece el gradienteinicial de densidad; b) también durante el evento, el gradiente horizontal de densidad se mantiene por advección lateral de aguacálida; c) después del evento se separa un chorro costero cálido de la costa occidental del golfo, alcanza el golfo central y adquiererotación anticiclónica; d) la subducción inicia por procesos intensos de convergencia donde el chorro cálido choca con el agua fría;e) el giro ‘maduro’ se propaga hacia afuera de la costa acarreando un lente de subducción en su frontera.
PALABRAS CLAVE: Golfo de Tehuantepec, dinámica de giros, subducción, frentes, abordaje.
ABSTRACTThe southward wind events in the Gulf of Tehuantepec generate large warm eddies and strong offshore current jets that
produce entrainment of subsurface waters into the upper ocean resulting in cool (dense) water masses. Strong frontal featuresoccur at the boundary between warm eddies and cool patches. An important fraction of the cool water is subducted beneath theseeddies as intrapycnocline ‘lenses’ (eddies) within the boundary of a larger eddy. These small eddies are stable and interact with thelarger one. Observational evidence of two such lenses is presented. Qualitative arguments based on observed flow and densityfields, as well as vorticity arguments, confirm the existence of subduction processes. The magnitude of the subduction rate isestimated as large as 80 m d-1. A revised conceptual scheme of the eddy generating process is summarized as: a) during the eventthe wind-induced offshore current entrains subsurface water in the central gulf, thus establishing the initial density gradient; b)also during the event, the horizontal density gradient is maintained by horizontal warm water advection; c) after the event a coastaljet separates from the west coast reaches the central gulf and spins up to form an anticyclone; d) subduction due to intenseconvergence occurs where the warm coastal jet meets the cool water; e) the ‘mature’ warm eddy propagates offshore carrying alens of cool subducted water within its boundary.
KEY WORDS: Gulf of Tehuantepec, eddy dynamics, subduction, fronts, entrainment.
is transferred from the mixed layer into the stratified interiorof the ocean.
A frontal region will occur where light and heavy wa-ter collide. In an idealized fluid, disregarding for the mo-ment turbulent mixing processes and rotation, a heavy sur-face water mass colliding with a lighter one would seek itsneutral buoyancy level. The balance of the pressure gradientwith gravitational and buoyancy forces determines the path.
1. INTRODUCTION
Subduction is defined as the process by which conver-gence in the mixed layer induces the formerly turbulent fluidto become part of the underlying stratus (Cushman-Roisin,1987). It is synonymous with ventilation for the continuouslystratified ocean and is the opposite of entrainment. Spall(1995) (hereinafter referred to as S95) applies the term tofrontal regions and defines it as the process by which water
Geofísica Internacional (2003), Vol. 42, Num. 1, pp. 101-114
101

A. Trasviña et al.
102
Any heavy water remaining after the collision will sink be-low the light side of the front following an isopycnal path.The impermeability theorem (Haynes and McIntyre, 1987)states that isopycnal surfaces are impermeable to changesin potential vorticity (stratification), even in the presenceof buoyancy forcing and frictional forces. Marshall andNurser (1992) apply this result to the ventilated thermoclineof a subtropical gyre. They conclude that the flux of poten-tial vorticity (or stratification) between two isopycnal sur-faces can emanate only from the free surface or from a solidboundary. This is the case of the surface frontal regions dis-cussed here, only at a smaller scale. We describe the redis-tribution and mixing of properties along approximatelyisopycnal trajectories. The process is therefore referred toas isopycnal mixing, to distinguish it from the diapycnaltype of mixing (across density surfaces) which is associ-ated with entrainment.
Subduction in mesoscale features does not always takeplace. In a rotating ocean the flow is compounded by thepresence of currents along the front. The shear in these cur-rents could mix and disintegrate the water mass before any
vertical motion takes place. Additionally, atmospheric forc-ing is also capable of mixing that could inhibit subduction.In order for subduction to occur, the flow in the frontal re-gion must have a significant ageostrophic component ca-pable of inducing downward cross-isobaric motion, or elseother processes will dominate the dynamics (see, for in-stance S95 and Hoskins, 1982).
In the Gulf of Tehuantepec (Figure 1), intense surfacecooling and dramatic changes in the near-surface coastalcirculation are produced every winter by short-lived (3 to 7days) southward wind events locally known as ‘Nortes’.The surface cooling is due to entrainment of subsurface wa-ter induced by the vertical shear within a southward currentjet produced by the wind (Trasviña et al., 1995). The sur-face temperature anomaly takes the shape of an elongatedpatch of water, significantly colder (17 to 22°C) than thesurrounding ocean (28 to 30°C). Cool patches of this kindshow in the infrared imagery surrounded by intense ther-mal fronts which extend to a distance of 450 km from shore(Strong et al., 1972; Stumpf, 1975; Stumpf and Legeckis,1977). Such a large volume could conceivably spin up to
Fig. 1. The Gulf of Tehuantepec: AVHRR image showing surface cooling.

Frontal subduction in the Gulf of Tehuantepec
103
form a cyclonic eddy. Instead, strong warm water advectionfrom both sides of the anomaly make its surface signaturedisappear in three to four days (Trasviña et al., 1995). Heatfluxes across the air-sea interface are not strong enough toaccount for the quick change in sea surface temperature(Barton et al., 1993).
Section 2 describes data obtained in two experimentalcampaigns. Section 3 presents observational evidence of sub-duction beneath the western temperature front of an eddy.The discussion in section 4 focuses on explaining the phe-nomenon in terms of vorticity variations. A final section in-cludes a conceptual scheme of the eddy generation process,as well as some remarks on the relevance of the phenom-enon.
2. OBSERVATIONAL CAMPAIGNS
2.1. January-February 1989 (Tehuano I)
This campaign was designed to study the impact ofNorte wind events in the Gulf of Tehuantepec. During thisexperiment we carried out conventional CTD (conductivity,temperature, and depth probe) casts, undulating CTD tows(Seasoar), as well as current measurements with a shipboard150 kHz narrowband ADCP (Acoustic Doppler CurrentProfiler). AVHRR (Advanced Very High-Resolution Radi-ometer) satellite imagery was available throughout the ex-periment. A variety of other instruments were deployed, bothmoored and on the coast. Barton et al. (1993) gives an over-view of the observational campaign.
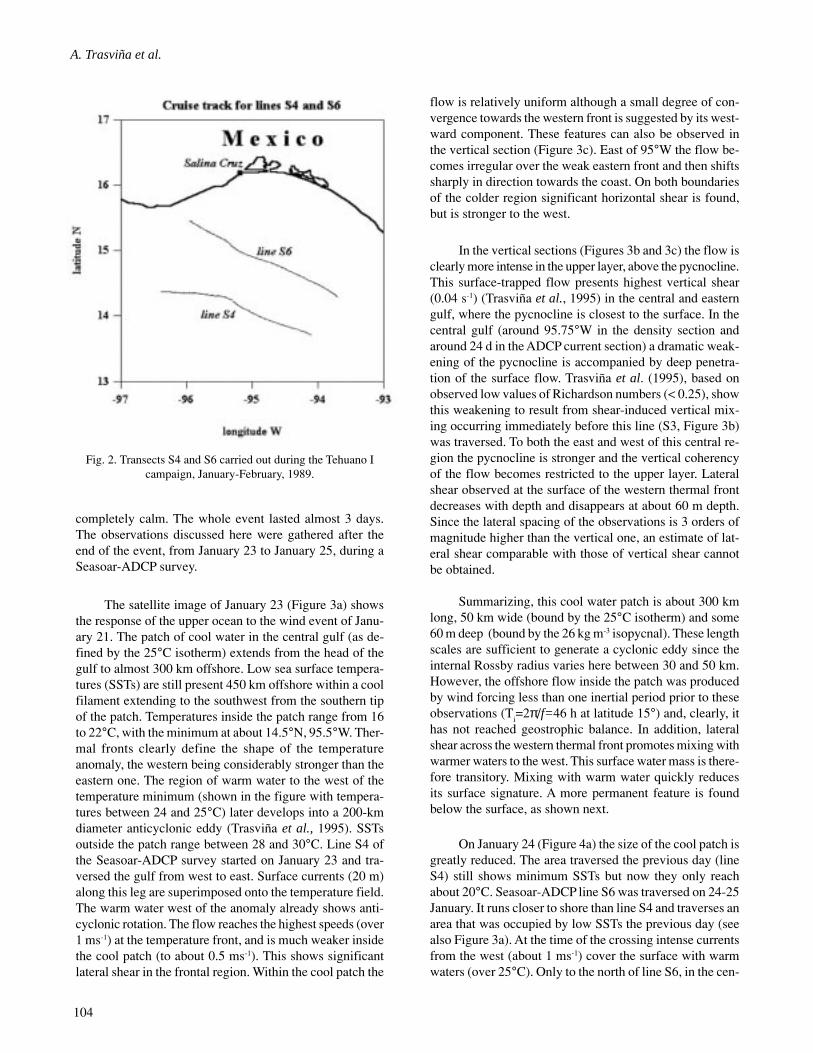
Two research vessels participated in the 40-day cam-paign but only data from the cruise of R/V Wecoma (OregonState University) are shown here. This ship gathered hydro-graphic and meteorological data along an east-west grid, be-tween January 14 and February 9, 1989. Figure 2 shows thetransects discussed here.
The Seasoar undulating vehicle for the CTD includeda faired cable, which allowed us to tow it at speeds of 8 to 10knots profiling between the surface and 300 m roughly ev-ery 10 min. The typical horizontal resolution of the hydro-graphic casts is 3 km. The shipboard ADCP was configuredto average raw pings every 10 min, in vertical bins of 8 m.The horizontal resolution of the vertical current profiles wasequal or better to that of Seasoar.
The CTD used for both conventional and Seasoar pro-files was a Neil Brown Mark III B sampling conductivity,temperature and pressure at 32 Hz. The instrument was cali-brated before the cruise and post-calibration of the salinitydata was made with bench-salinometer measurements of deep(600 m) water samples taken from the rosette.
2.2. February-March 1996 (Tehuano II)
Seven years later, a second experiment was carriedout to follow the propagation of eddies formed in the Gulfof Tehuantepec during the Norte season. Surface current datacomes from ARGOS drifting buoys deployed in mid-Feb-ruary 1996. Hydrographic data was gathered from the B.O.Fco. de Ulloa (CICESE). We used both conventional CTDcasts and undulating CTD tows (UCTDs). The map of thecruise track (see section 3.2, Figure 5b) along 13°N (theonly one shown here) includes positions from four ARGOSdrifters and the location of the transect relative to the driftertrajectories. Drifter data was gathered by the Data Assem-bly Center (DAC) at the Global Drifter Center (AtlanticOceanographic Marine Laboratory, Miami, Florida).ARGOS positions are the 6-hourly post-processed data pro-vided by the DAC.
Conventional CTD casts were made with a full-oceandepth Seabird SBE9/11 sampling temperature, conductiv-ity and pressure at 24 Hz.
UCTDs were carried out by towing a vehicle contain-ing a Seabird SBE19 CTD, following the method describedby Filonov et al. (1996). The vehicle containing the CTD isequipped with wings in order to keep it near the surfacewhile towed. Vertical profiles are made by circling a par-ticular station with the ship, or by simply stopping the ship.We used the circling method because it kept the ship fromdrifting. The CTD sinks to a depth depending on the lengthof cable and stores the measurements in its internal datalogger. The SBE19 sampled temperature, conductivity andpressure at 2 Hz. A method to obtain salinity from tempera-ture and conductivity measured at variable profiling speedsis described in Trasviña (1999). The horizontal resolutionof the vertical profiles obtained with the undulating CTD isof 3 to 5 km.
Both instruments were calibrated before the cruise anda post-calibration check of the salinity values was madeagainst bench-salinometer measurements of deep (1000 m)water samples taken from the rosette.
3. FRONTAL SUBDUCTION: OBSERVATIONALEVIDENCE
3.1. January-February 1989 (Tehuano I)
This experiment succeeded in gathering observationsduring and after a moderately strong southward wind event.The event started early on January 21, wind speeds reach-ing 17 ms-1 for about 12 hours. By the end of January 23 thewinds decreased to 9 ms-1 and by late January 24 they were
A. Trasviña et al.
104
completely calm. The whole event lasted almost 3 days.The observations discussed here were gathered after theend of the event, from January 23 to January 25, during aSeasoar-ADCP survey.
The satellite image of January 23 (Figure 3a) showsthe response of the upper ocean to the wind event of Janu-ary 21. The patch of cool water in the central gulf (as de-fined by the 25°C isotherm) extends from the head of thegulf to almost 300 km offshore. Low sea surface tempera-tures (SSTs) are still present 450 km offshore within a coolfilament extending to the southwest from the southern tipof the patch. Temperatures inside the patch range from 16to 22°C, with the minimum at about 14.5°N, 95.5°W. Ther-mal fronts clearly define the shape of the temperatureanomaly, the western being considerably stronger than theeastern one. The region of warm water to the west of thetemperature minimum (shown in the figure with tempera-tures between 24 and 25°C) later develops into a 200-kmdiameter anticyclonic eddy (Trasviña et al., 1995). SSTsoutside the patch range between 28 and 30°C. Line S4 ofthe Seasoar-ADCP survey started on January 23 and tra-versed the gulf from west to east. Surface currents (20 m)along this leg are superimposed onto the temperature field.The warm water west of the anomaly already shows anti-cyclonic rotation. The flow reaches the highest speeds (over1 ms-1) at the temperature front, and is much weaker insidethe cool patch (to about 0.5 ms-1). This shows significantlateral shear in the frontal region. Within the cool patch the
flow is relatively uniform although a small degree of con-vergence towards the western front is suggested by its west-ward component. These features can also be observed inthe vertical section (Figure 3c). East of 95°W the flow be-comes irregular over the weak eastern front and then shiftssharply in direction towards the coast. On both boundariesof the colder region significant horizontal shear is found,but is stronger to the west.
In the vertical sections (Figures 3b and 3c) the flow isclearly more intense in the upper layer, above the pycnocline.This surface-trapped flow presents highest vertical shear(0.04 s-1) (Trasviña et al., 1995) in the central and easterngulf, where the pycnocline is closest to the surface. In thecentral gulf (around 95.75°W in the density section andaround 24 d in the ADCP current section) a dramatic weak-ening of the pycnocline is accompanied by deep penetra-tion of the surface flow. Trasviña et al. (1995), based onobserved low values of Richardson numbers (< 0.25), showthis weakening to result from shear-induced vertical mix-ing occurring immediately before this line (S3, Figure 3b)was traversed. To both the east and west of this central re-gion the pycnocline is stronger and the vertical coherencyof the flow becomes restricted to the upper layer. Lateralshear observed at the surface of the western thermal frontdecreases with depth and disappears at about 60 m depth.Since the lateral spacing of the observations is 3 orders ofmagnitude higher than the vertical one, an estimate of lat-eral shear comparable with those of vertical shear cannotbe obtained.
Summarizing, this cool water patch is about 300 kmlong, 50 km wide (bound by the 25°C isotherm) and some60 m deep (bound by the 26 kg m-3 isopycnal). These lengthscales are sufficient to generate a cyclonic eddy since theinternal Rossby radius varies here between 30 and 50 km.However, the offshore flow inside the patch was producedby wind forcing less than one inertial period prior to theseobservations (T
i=2π/f=46 h at latitude 15°) and, clearly, it
has not reached geostrophic balance. In addition, lateralshear across the western thermal front promotes mixing withwarmer waters to the west. This surface water mass is there-fore transitory. Mixing with warm water quickly reducesits surface signature. A more permanent feature is foundbelow the surface, as shown next.
On January 24 (Figure 4a) the size of the cool patch isgreatly reduced. The area traversed the previous day (lineS4) still shows minimum SSTs but now they only reachabout 20°C. Seasoar-ADCP line S6 was traversed on 24-25January. It runs closer to shore than line S4 and traverses anarea that was occupied by low SSTs the previous day (seealso Figure 3a). At the time of the crossing intense currentsfrom the west (about 1 ms-1) cover the surface with warmwaters (over 25°C). Only to the north of line S6, in the cen-
Fig. 2. Transects S4 and S6 carried out during the Tehuano Icampaign, January-February, 1989.

Frontal subduction in the Gulf of Tehuantepec
105
tral gulf, a curved filament of cool water remains (starting atabout 15°N 95.2°W). Surface currents around the front re-veal intense convergence and lateral shear. The front sepa-rates two distinct current regimes. In the west the currentsrotate in anticyclonic sense in a somewhat asymmetric wayproviding the flow with a significant eastward component.
In the central gulf the offshore flow observed the previousday, even if slightly weaker, remains the dominant feature.
In the density section along S6 (Figure 4b), a steep frontappears at the region of convergence of the surface flow (be-tween 95.5 and 95°W). West of 95.2°W the pycnocline takes
Fig. 3. a) Satellite image of 23 January, 1989. Superimposed are surface velocity vectors from ADCP (line S4). Note the temperature ranges fordifferent gray values. The track for next day’s line S6 is included as reference (see text); b). Density anomaly (γ) section along
line S4; c) Stick diagram of surface flow from ADCP.
a)

A. Trasviña et al.
106
the typical concave shape associated with anticyclonic ed-dies. Within this pycnocline a ‘lens’ with density anomalies(γ) between 25 and 26.5 kg m-3 is apparent (its core is high-lighted with gray dots). This density range corresponds tothose observed the previous day at or near the surface of thecentral gulf (see also Figure 3b), about 40 km north of lineS6. Note also that on January 23 (Figure 3a) the cool patchextended to the area traversed by S6 the next day. The pres-ence of this lens is consistent with the subduction of theanomalously cold (and heavy) surface water mass producedby the wind event. The current regime (Figure 4c) supportsthis assumption. Around the density front the flow showsintense convergence reaching depths of 80 m around thearea of the lens. As observed in the previous crossing (Fig-ure 3c), the currents are more intense above the pycnoclinebut now the maximum vertical penetration occurs at thedensity front, where the pycnocline deepens dramatically.
Summarizing, the crossing of line S6 reveals a lens ofwater within the pycnocline. The density range within it (γ=24 to 25.5), as well as its temperatures and salinities (notshown), closely correspond to those found the previous dayat the surface of the cool patch. The flow field convergesaround the front, from the surface to 80 m depth. Since nomeasurements were made along line S6 the previous day,some conditions before subduction remain unknown. Forinstance, it is not known if the mixed layer was deeper orshallower than the front before subduction took place. How-
ever the observational evidence is consistent with intensesubduction taking place within the 24 hours prior to thiscrossing. The presence of a dense surface water mass on 23January and the location of a lens at an average depth pf 80m, 24 hours later, suggests a subduction rate as high as 80m d-1. This is comparable to what was reported by Flamentet al. (1985) in a similar frontal structure of an upwellingfilament. Before discussing the dynamics, the next sectiondescribes similar observations inside an eddy found offTehuantepec in 1996.
3.2. February-March 1996 (Tehuano II)
During this campaign a number of ARGOS drifterswere deployed inside a large anticyclone formed in the gulfof Tehuantepec before February 10, 1996. The anticycloneoriginated during a wind event that occurred the week priorto drifter deployment. No data from that wind event are avail-able.
Drifter deployment started on February 10 with thearrival of the first ship to the area. The initial effort wasconcentrated on an eddy that had a clear thermal signaturein the AVHRR imagery (Figure 5a). Between February 10and 11, four drifters were deployed in its interior and trackedtill March 7 (Figure 5b). Undulating CTD tows were madebetween February 23 and 26 along line about 13°N (trackshown on Figure 5b).
Fig. 3. Continued.
b) c)

Frontal subduction in the Gulf of Tehuantepec
107
In the image of February 11 (Figure 5a) surface tem-peratures at the core of the eddy are greater than 28°C. Eastof 96°W the cool surface waters are produced by a windevent that started the morning of that day. Close to the coast(15°N, 96°W) the warm feature intruding the cool waterseast of 96°W represents another eddy in formation. Thiswas later ‘seeded’ with drifters and its circulation followedfor several months (tracks not shown).
Positions from four surface drifters are shown in Fig-ure 5b. They follow the slow south-westward motion of theeddy between February 11 and March 7. The CTD sectionalong 13°N traversed the area some 12 days after drifterdeployment (also shown in Figure 5b). It crosses the south-ern half of the anticyclone, some 50 km south of the centerof motion.
The vertical density section along 13°N (Figure 5c)was obtained between February 23 and 26 and it featuresthe concave pycnocline typical of warm eddies, reachingsome 200 m depth. Its horizontal span is surprisingly large.The eddy seen in the imagery and in the drifter tracks occu-pies less than 3 degrees (some 300 km) in the zonal direc-tion but, if the shape of the pycnocline is used as reference,the eddy spans at least 4 degrees of longitude. This is attrib-uted to the reduction of its surface thermal signature by theinvasion of cool surface water produced by the wind eventof February 11. The eastern half of the eddy again shows alens in the pycnocline (highlighted with gray dots betweenγ=24 and 26.5). This is better developed than the one ob-served in 1989. It occupies a larger fraction of the volumeof the eddy and it is not, as in the previous case, slopingalong the eastern border. Instead, it is found closer to thebottom of the eddy. The lens in the 1989 eddy only spannedsome 40 to 50 m of the water column whereas this one cov-ers 80 to 100 m. The 1989 eddy was 3 days old and this oneis over 13 days old.
A second occurrence of an intrapycnocline lens in aTehuantepec eddy suggests that they are related to the eddygenerating process. It also reveals that these are stable fea-tures since this lens was observed at least 13 days after thebirth of the eddy. In this case the eddy (and the lens) has hadmore than enough time to reach geostrophic balance. Fur-thermore, the large volume of the lens in 1996 suggests itmay exert significant influence on the internal eddy dynam-ics. Such an asymmetric stratification field will produce anasymmetric tri-dimensional vorticity distribution within theeddy. Orbital speeds will vary and therefore its propagationvelocity should be altered. Drifter tracks appear to confirmthis observation. The eddy describes an unusual southwest-ward propagation (in contrast with westward self-propaga-tion, see Figure 10), conceivably produced by this featurealthough a detailed analysis of the eddy dynamics are de-ferred to another paper.
4. DISCUSSION
Data from the Tehuano I experiment captured the earlystages of both an eddy and its accompanying lens. To bet-ter understand the origin of such a lens it is helpful to ana-lyze the behavior of a conservative property. Salinity servessuch a purpose for the time scales (< 2 d) considered here.The structure of the central gulf immediately after a windevent is shown with isobaric and isopycnal sections of lineS4 (Figure 6). The isobaric section (Figure 6a) is very similarin structure to the corresponding density section (Figure3b). High salinity values reach the surface of the centralgulf (95.25°W). As previously mentioned, this results fromentrainment of subsurface water. Two fronts border this cen-tral region. The eastern one is weak and shallow, and thewestern front is stronger and deepens to 100 m with a steepslope. The latter is the eastern boundary of an eddy in itsearly stages of development. Note the curvature of theisohaline of 34.4 for future reference and the boundaries ofthe surface high-salinity region of the central gulf (34.5 to34.8).
In the isopycnal salinity section (Figure 6b) the frontsand, in general, the halocline are expanded revealing dif-ferent response patterns across the gulf. In the central andeastern side (east of 95.25°W) the isohalines follow the com-plex behavior typical of dyapicnal mixing. In the westerngulf, although the isobaric section shows deepening of thevertical structure, little mixing across density surfaces takesplace. Defining the core of the eddy as bounded by the 34.4isohaline, its alignment with the density field is consistentwith mixing processes (and water mass generation) alongdensity surfaces.
The comparison between the isobaric and isopycnalsections of line S6 (Figure 7) traversed the following day iseven more dramatic. In the isobaric section (Figure 7a) ahigh-salinity lens of the same salinity range found at thesurface of S4 (34.8 to 34.5 psu), is now found deep withinthe halocline of the eddy. An even steeper salinity frontappears at the boundary between the eddy and the offshoreflow of the central gulf. Because of intense advection fromthe west (see also Figure 4c), the front is found eastward ofits position on S4. It is now centered at about 95°W. Thecentral and eastern gulf (now east of 94.8°W) show a mostlyflat halocline. Also, as observed in the density section (Fig-ure 4b), the stratification of the upper 50 m of the easterngulf is greater than in the previous crossing.
The isopycnal section (Figure 7b) presents a situationsimilar to the one observed the previous day. To the west of94.8°W there is little dyapicnal mixing whereas in the eastmixing across density surfaces occurs even against strongstratification (not shown). The region of the intra-pycnocline

A. Trasviña et al.
108
(or, in this case, intra-halocline) lens is now found west of95°W and between γ=24 and 26.5. Compared to the com-plex patterns of the salinity field east of 95°W, in this regionit is remarkably well aligned with the density surfaces, con-sistent with the existence of isopycnal mixing. This term isused to emphasize that water masses of different origins willhave different compositions (nutrients, dissolved oxygen,
chlorophyll, etc.) at equivalent density ranges. When motionalong a density surface takes place, mixing of a number ofproperties is bound to occur (McDougall, 1984). It also helpsin differentiating from the dyapicnal processes, which domi-nate in the rest of the gulf. Dyapicnal mixing is associated tovertical shear-induced entrainment in regions of the gulf in-fluenced by intense surface currents. Isopycnal mixing is
Fig. 4. a) Satellite image of 24 January, 1989. Superimposed are surface velocity vectors from ADCP (line S6). Note the temperature ranges fordifferent gray values. The track for line S4 is included as reference (see text); b) Density anomaly (γ) section along line S6 (‘lens’
highlighted with gray dots); c) Stick diagram of surface flow from ADCP.
a)

Frontal subduction in the Gulf of Tehuantepec
109
found mainly along the frontal region where the eastwardflow converges with the southwestward (offshore) wind-induced flow. The frontal region separates two different dy-namics with contrasting stratification and, consequently,potential vorticity.
Until now flow convergence (and downwelling speed)is suggested by the observations but no quantitative proofhas been given. Given the strong time-dependency of theflow, reliable estimates of convergence by means of the massconservation equation could only be obtained in the along-track direction of this section. The offshore confluence termcannot be accurately estimated. However, it is important toshow that there is an ageostrophic downwelling speed ca-pable of producing subduction. Since frontal subduction oc-curs on a potential vorticity (stratification) gradient, wechoose vorticity as a more robust quantity to analyze thenature of the flow. Again, relative vorticity can only be esti-mated from (δ
xv*), the along-track derivative of the across-
track velocity component (x is positive towards the east,along the track, and v* is rotated perpendicular to the track,positive towards the north) but it can be checked for consis-tency with the density field. In any case the assumption ismade that (δ
yu*), the across-track derivative of the along-
track velocity component, is negligible (y is positive towardsthe north, perpendicular to the track; u* is rotated to be posi-tive to the east, along the track). This is not true in general,but for scales of the order of the internal Rossby radius (30to 50 km) an inspection of the density and current fieldssupports this assumption.
The average relative vorticity (ξ) was calculated betweenisopycnal surfaces limiting the lens (γ = 24 and 25.5 kg m-3,see also Figure 4b). Figure 8a shows relative vorticity alongline S6 as the non-dimensional parameter (ξ/f), f being thelocal Coriolis parameter. This also serves as an estimate ofthe Rossby number of the flow. Potential vorticity (Figure 8b)was calculated as Π =(ξ+f)/H, where H is the thickness be-tween density surfaces 24 and 25.5 kg m-3.
The relative vorticity (Figure 8a) is small and feature-less throughout the section except by the steep gradient foundat the density front. Large positive values at the central gulf(95°W) are comparable with those of the planetary vorticity.This indicates that advective processes are still important inthe offshore current jet. Within the lens (95.4 to 95.1°W) therelative vorticity changes sign reaching a minimum consis-tent with the induction of anticyclonic rotation by vortex com-pression. The potential vorticity (Figure 8b) also shows a steepgradient at the central gulf. Π serves to compare changes inabsolute vorticity (ξ+f) with those of layer thickness (H). Atthe central gulf the combined effect of an increase in stratifi-cation (a decrease in layer thickness) and intense advectionleads to the central maximum. To the east any changes in Πare produced mostly by changes in layer thickness since therelative vorticity is almost negligible. In the west the smallvalues of Π are due to the increased layer thickness within thelens and to the small values of the absolute vorticity.
Evidence from two independent variables, the observedflow and the density field, confirm the existence of subduc-
Fig. 4. Continued.
b) c)

A. Trasviña et al.
110
c)
Fig. 5. a) AVHRR image of Eddy 1 on February 11, 1996; b) Drifter tracks inside Eddy 1 (February 11 to 7 March, 1996) and track along13°N (solid line); c) Density anomaly (γ) section along 13°N. The line was traversed between February 23 and 26, 1996.
b)
a)

Frontal subduction in the Gulf of Tehuantepec
111
tion processes. The negative relative vorticity minimum isfound at the lens. This can only be accomplished by vortexcompression. Furthermore, the compression of vortex tubesnecessary to produce such a potential vorticity gradient hasto be accompanied by downwelling speeds (see, for instance:S95 and Pollard and Regier, 1990).
Finally, ageostrophic velocities (va) were estimated from
the observed and geostrophic velocity fields (Figure 9). TheADCP currents (observed field) were first rotated relative tothe track such that the v-component is directed across thetrack of line S6, positive towards the north (v*
obs). Then v
a
was obtained by simply subtracting the geostrophic from theobserved field (v*
obs-v
geo). Isopycnals are superimposed onto
the velocity field. Values smaller than abs (0.2 m s-1) areblanked out to eliminate badly sampled small-scale vari-ability. The ageostrophic component of the flow is negli-gible except in isolated areas. The positive near-surfacemaximum east of 95°W occurs within the offshore currentjet, in the same area where the local Rossby number reachesa maximum (ξ/f). Two areas of opposite sense inside thelens of subducted water show its anticyclonic nature: off-shore ageostrophic flow (~0.5 m s-1) east of 95.25°W andonshore to the west (~0.5 m s-1). Evidence of ageostrophicanticyclonic circulation within the lens clearly shows thatit was produced by vortex compression (S95). It also showsthat the lens formation process is recent since it hasn’t hadthe time to adjust to geostrophy. The subduction rate of 80
a)
Fig. 6. a) Isobaric salinity section along line S4, 23-24 January, 1989; b) Isopycnic salinity section along line S4.
b)
Fig. 7. a) Isobaric salinity section along line S6, 24-25 January, 1989; b) Isopycnic salinity section along line S6.
a) b)

A. Trasviña et al.
112
md-1 previously mentioned seems now more likely. The con-ditions leading to the initial subduction are unknown butthe production of an anticyclonic lens, as shown by S95,are consistent with a shallow and warm surface flow col-liding with a thicker cool surface patch.
5. CONCLUSIONS
The origin of the lens in the 1989 Tehuantepec eddyby subduction is supported by previous modeling work fromS95. Spall´s results for frontal subduction with a deep sur-face layer are characterized by the production of a lens withanomalously low potential vorticity and anticyclonic circu-lation, same as observed here. There are no observations ofthe frontal structure to confirm that the mixed layer prior to
subduction was actually thicker than the front. However,the presence of a lens of these characteristics is consistentwith subduction starting from such an initial condition.
In the Gulf of Tehuantepec, Nortes, and the wind-in-duced circulation occur regularly during the cold season(September to April). Although there is a great deal ofinterannual variability (from 0 to 27 Norte-inducing coldsurges in a 60-year record), the average is around 13 eventsper cold season (Schultz et al., 1998). Every time, this phe-nomenon produces cool surface patches and eddies that maydiffer in size but that are dynamically very similar. The find-ing of two occurrences of intrapycnocline lenses is no coin-cidence. It reveals an interesting feature probably commonto many such mesoscale features: eddies within Tehuantepec
Fig. 8. a) Average relative vorticity (x/f) within the intrathermocline lens (between g=24 and 25.5); b) Average potential vorticity (P) for thesame isopycnal range as before.

Frontal subduction in the Gulf of Tehuantepec
113
Fig. 9. Across-track ageostrophic speeds along line S6.
eddies. Although the mean ambient flow in this area is notwell known, tracks from other drifters deployed by the au-thors show extremely weak currents outside the mesoscaleeddy field. Without the influence of a strong ambient flow,the unusual southwestward propagation of these eddies (seeFigure 10) can be attributed to their internal dynamics.
From a previous article (Trasviña et al., 1995) a con-ceptual model of eddy generation in the Gulf of Tehuantepeccould be summarized in three steps:
a) The wind induces an intense offshore current. Verticalshear within the jet produces entrainment of cool sub-surface waters. The initial density gradient is established.
b) Still during the wind event, the horizontal density gradi-ent is maintained by advection of light (warm) waterfrom the west. Advection from the east is negligible atthis stage.
c) After the end of the wind event, a narrow (and warm)coastal jet separates from the west coast of the gulf.While reaching the central gulf, and the cool patch, itspins up to form the anticyclonic eddy.
Two additional steps can now be added:
d) Where the coastal jet meets the cool water patch, sub-duction starts due to intense convergence between wa-ter masses of contrasting density. Presumably, the depth
of the coastal jet is shallower than that of the cool patchand therefore an anticyclonic lens is formed.
e) The ‘mature’ eddy propagates offshore carrying awaycoastal (warm) waters and a lens of cooler water as‘memory’ of the wind event (Figure 10).
ACKNOWLEDGEMENTS
Funding for this project was provided by the NationalCouncil for Science and Technology (Mexico, grants 32500Tand 4971-T9406), the Natural Environmental Research Coun-cil (United Kingdom, grant GR3/6719), the Division ofOceanology of CICESE and CICESE’s campus at Baja Cali-fornia Sur. The Global Drifter Center (NOAA-AOML) wasa collaborator in this project within the framework of theGlobal Drifter Program, they financed the cost of trackingthe lagrangian drifters. We thank Peter Niiler for providingthe lagrangian drifters used during the 1996 field work. DaveSchultz provided important weather forecasts during the fieldexperiment in 1996. The Coastal Oceanography Laboratoryof the Costa Rica National University supplied valuable sat-ellite imagery for the 1996 experiment. Curt Collins made athorough and very helpful review of the manuscript. Wegreatly appreciate the hard work of students, technicians,researchers and crew on board the B.O. Fco. De Ulloa(CICESE), B.O. Altair (Armada de México), R/V Wecoma(OSU) and B.O. El Puma (UNAM).

A. Trasviña et al.
114
BIBLIOGRAPHY
BARTON, E. D., M. L. ARGOTE, J. BROWN, P. M.KOSRO, M. LAVIN, J. M. ROBLES, R. L. SMITH, A.TRASVIÑA and H. S. VÉLEZ, 1993. Supersquirt: Dy-namics of the Gulf of Tehuantepec, Mexico. Oceanog-raphy, 6, 1, 23-30.
BLACKBURN, M., 1962. An oceanographic study of theGulf of Tehuantepec. Spec. Sci. Rep. 404, U.S. Fish andWildlife Serv., Washington, D. C.
FILONOV, A. E., C. O. MONZÓN and I. E.TERESHCHENKO, 1996. A technique for fast conduc-tivity temperature-depth oceanographic surveys. Geofís.Int., 35, 4, 415-420.
FLAMENT, P., L. ARMY and L. WASHBURN, 1985. Theevolving structure of an upwelling filament. J. Geophys.Res., 90(C60), 11,765-778.
HAYNES, P. H. and M. E. McIINTYRE, 1987. On the evo-lution of vorticity and potential vorticity in the presenceof diabatic heating and frictional or other forces. J.Atmos. Sci., 44, 828-841.
MARSHALL, J. C. and A. J. NURSER, 1992. Fluid Dy-namics of Oceanic Thermocline Ventilation. J. Phys.Ocean., 22, 583-595.
McDOUGALL, T. J., 1984. The Relative Roles of Diapycnaland Isopycnal Mixing on Subsurface Water Mass Con-version. J. Phys. Oceanogr., 14, 1577-1589.
POLLARD, R. T. and L. REGIER, 1990. Large variations inpotential vorticity at small spatial scales in the upperocean. Nature, 348, 227-229.
SCHULTZ, D. M., E. R. BRACKEN and L. F. BOSART,1998. Planetary- and Synoptic-Scale Signatures Asso-ciated with Central American Cold Surges. MonthlyWeath. Rev., 126, 5-27.
SPALL, M. A., 1995. Frontogenesis, subduction, and cross-front exchange at upper ocean fronts. J. Geophys. Res.,100 (C2), 2, 543-2,557.
STRONG, A. E., R. J. DE RYCKE and H. G. STUMPF, 1972.Satellite detection of upwelling and cold water eddies,paper presented at 8th International Symposium on Re-mote Sensing of the Environment. Environ. Res. Inst.of Mich., Ann Arbor, 1067-1081.
STUMPF, H. G., 1975. Satellite detection of upwelling inthe Gulf of Tehuantepec, Mexico. J. Phys. Oceanogr.,5, 383-388.
STUMPF, H. G. and R. V. LEGECKIS, 1977. Satellite ob-servations of mesoscale eddy dynamics in the easterntropical Pacific Ocean. J. Phys. Oceanogr., 7, 648-658.
TRASVIÑA, A., E. D. BARTON, J. BROWN, H. S. VÉLEZ,M. KOSRO and R. L. SMITH, 1995. Offshore WindForcing in the Gulf of Tehuantepec, Mexico: the asym-metric circulation. J. Geophys. Res., 100(C10), 20, 649-20,663.
TRASVIÑA, A., 1999. Procesamiento de datos de CTDondulante. GEOS, Unión Geofísica Mexicana, 19, 1, 1-11.
__________________
A. Trasviña1, E. D. Barton2, H. S. Vélez3 andJ. Brown4
1 CICESE, Oceanografía Física, Miraflores 334 e/Mulegé yLa Paz, Fracc. Bella Vista, 23050, La Paz BCS, Mexico.
Email: [email protected] University of Wales, School of Ocean Sciences, Menai
Bridge, United Kingdom.3 Depto. de Ingeniería y Procesos Hidráulicos. División de
Ciencias Básicas e Ingeniería. Universidad AutónomaMetropolitana. Unidad Iztapalapa. México, D.F., México.
4 Fisheries Laboratories, MAFF, Suffolk, United Kingdom.
Fig. 10. Southwestward propagation of a Tehuantepec Eddy.Three months of data from ARGOS drifters. Circles indicate
deployment sites.