frontiers in sea floor mapping and visualization · bathymetric coverage of the seafloor. with this...
TRANSCRIPT
Charting the Secret World of the Ocean Floor. The GEBCO Project 1903-2003
1
Frontiers in Sea Floor Mapping and Visualization
By Larry A. Mayer Center for Coastal and Ocean Mapping, University of New Hampshire
ABSTRACT: We have seen remarkable and concomitant advances in sonar technology, positioning capabilities, and computer processing power that have revolutionized the way we map, image and explore the seafloor. Future developments must involve all aspects of the “seafloor mapping system” including, the sonars, the ancillary sensors (motion sensors, positioning systems, and sound speed sensors), the platforms upon which they are mounted, and the products that are produced. Current trends in sonar development involve the use of innovative new transducer materials, and the application of sophisticated processing techniques including focusing algorithms. Future developments will inevitably involve “hybrid”, phase-comparison/beamforming sonars, the development of broad-band “chirp” multibeam sonars and perhaps synthetic aperture multibeam sonars. Our inability to monitor the fine-scale spatial and temporal variability of the sound speed structure of the water column is a limiting factor in our ability to accurately map the seafloor; improvements in this area will involve continuous monitoring devices as well as improved models and perhaps tomography. ROV’s and particularly AUV’s will become more and more important as platforms for seafloor mapping system. We will also see great changes in the products produced from seafloor mapping and the processing necessary to create them. New processing algorithms are being developed that take advantage of the density of multibeam sonar data and use statistically robust techniques to “clean” massive data sets very rapidly. We are also exploring a range of approaches to use multibeam sonar bathymetry and imagery to extract quantitative information about seafloor properties, including those relevant to fisheries habitat. The density of these data also enable the use of interactive 3-D visualization and exploration tools specifically designed to facilitate the interpretation and analysis of very large, complex, multi-component spatial data sets. If properly georeferenced and treated, these complex data sets can be presented in a natural and intuitive manner that allows the simple integration and fusion of multiple components without compromise to the quantitative aspects of the data and opens up new worlds of interactive exploration to a multitude of users. The challenge for the future of GEBCO is to provide information in a form that is appropriate for these new approaches to analyzing and interpreting seafloor data.
Frontiers in Sea Floor Mapping and Visualization
Charting the Secret World of the Ocean Floor. The GEBCO Project 1903-2003
2
Larry A. Mayer
Center for Coastal and Ocean Mapping, University of New Hampshire
Prediction is very difficult, especially about the future. Niels Bohr
INTRODUCTION: I have been called upon to gaze into the crystal ball and look at what directions the future of seafloor mapping may take. I agree with Niels Bohr – this is a very difficult task – and one that may very well be futile. As the first GEBCO charts were being compiled, could any one have predicted today’s state of ocean mapping technology? Perhaps Dilbert said it best:
There are many methods for predicting the future. For example, you can read horoscopes, tea leaves, tarot cards, or crystal balls. Collectively, these methods are known as "nutty methods." Or you can put well-researched facts into sophisticated computer models, more commonly referred to as "a complete waste of time." Scott Adams , The Dilbert Future
Nonetheless, I will give it a try. I will save myself from looking too silly, however, by limiting the scope of my discussion. I will focus only on acoustic techniques for providing bathymetry as Walter Smith will be covering satellite-based techniques and Chris de Moustier will talk about acoustic imagery and seafloor characterization. I will also concentrate on GEBCO’s domain of the deep sea and thus not discuss the exciting new developments based on combinations of LIDAR and hyperspectral imagery for coastal zone mapping. Finally, I will limit the timeframe by looking at trends that are already in place and technical innovations that are likely to come along soon. Even with these limitations, however, I hope you will agree that many of the innovations we are seeing are revolutionary enough to fundamentally change the way that we will approach ocean mapping. We cannot look to the future without first understanding its context. As soon as man mastered the ability to travel on the water, he was concerned with the depths of the water beneath him. Indeed, a boat model found in the tomb of Meket-re, buried in Thebes in about 2000 BC, shows an ancient Egyptian hydrographer poised on the bow, ready to heave a lead-line (perhaps a “stone line” would be more accurate) so as to prevent the vessel from running aground (Figure 1; Bass, 1972). This primitive technique for measuring depth, the lead line, with slight variations, was the only method of making bathymetric measurements in depths beyond the reach of a pole for nearly 4000 years.
Figure 1. Model found in the tomb of Meket-re, buried at Thebes about 2000 BC. Note seaman with lead line at bow. From Bass, 1972
Charting the Secret World of the Ocean Floor. The GEBCO Project 1903-2003
3
With the development (in the early 1900’s) and general acceptance (after the Second World War) of the echo sounder, our ability to measure depths in the deep sea was radically changed. In the time it took to make one lead line measurement, thousands of echo-sounding measurements could be made. Just as importantly, many of the ambiguities associated with the lead line in deep water (inaccuracies caused by current drift and uncertainty about when the lead line struck the bottom) were now removed. While the echo sounder was a vast improvement over the lead line, it was still far from ideal. Early echo sounders typically had broad beams (30 – 60 degrees) ensonifying a very large area on the seafloor (an area with a diameter .5 to 1 times the water depth). Given this broad beam, the first seafloor echo could return from anywhere within the ensonified area if there was a sufficiently shoal feature ensonified. In the absence of angular discrimination within the beam, this shoal depth could only be assumed to be directly below the vessel. The result was a “defocused” and somewhat inaccurate picture of seafloor topography. Narrow beam echo-sounders were developed but these covered a very small area resulting in very sparse sampling of the seafloor. Finally, in the late 1970’s, the multibeam sonar became generally available for sea floor mapping. Multibeam sonars typically use two orthogonal arrays mounted on the hull of the survey vessel. The array that is in the along-ship direction generates a transmit pulse that is wide in the across-ship direction (typically 120 – 150 degrees) and very narrow in the along-ship direction. An array that is long in the across-ship direction is used to form many (typically 100 – 240) receive beams that are narrow in the across-ship direction and wider in the along-ship direction. The intersection of the transmit pulse and the receive beams results in many (100-240) simultaneous depth measurements across a wide swath (as much as 7.5 times the water depth) with each measurement having excellent horizontal and vertical resolution. With the sonar firing rapidly as the vessel steams along track, the many measurements over the wide swath of the multibeam sonar provided. for the first time, the opportunity for complete bathymetric coverage of the seafloor. With this full coverage came an unprecedented new perspective of seafloor morphology and seafloor processes that has been as revolutionary to those studying the seafloor as the first aerial photographs and satellite images must have been to those studying terrestrial earth processes.
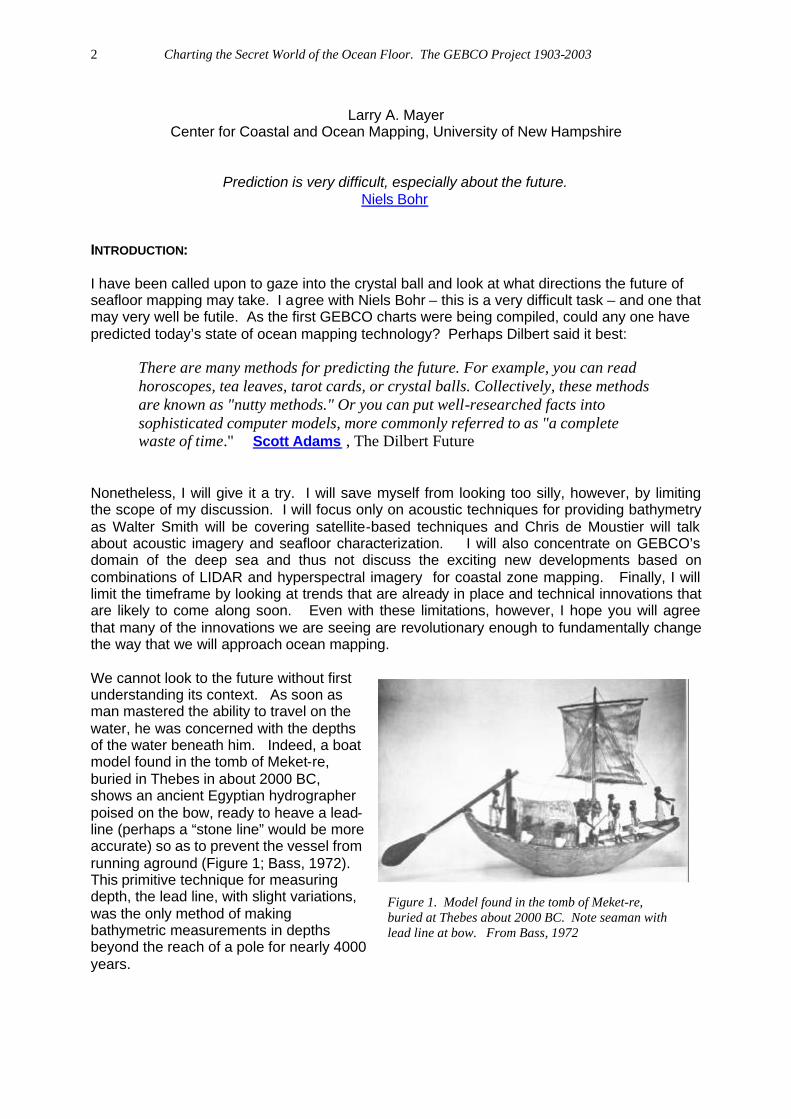
Figure 2a: Single beam sonar data allow us to construct traditional hydrographic charts which consist of selected soundings and contours interpolated from sparse soundings
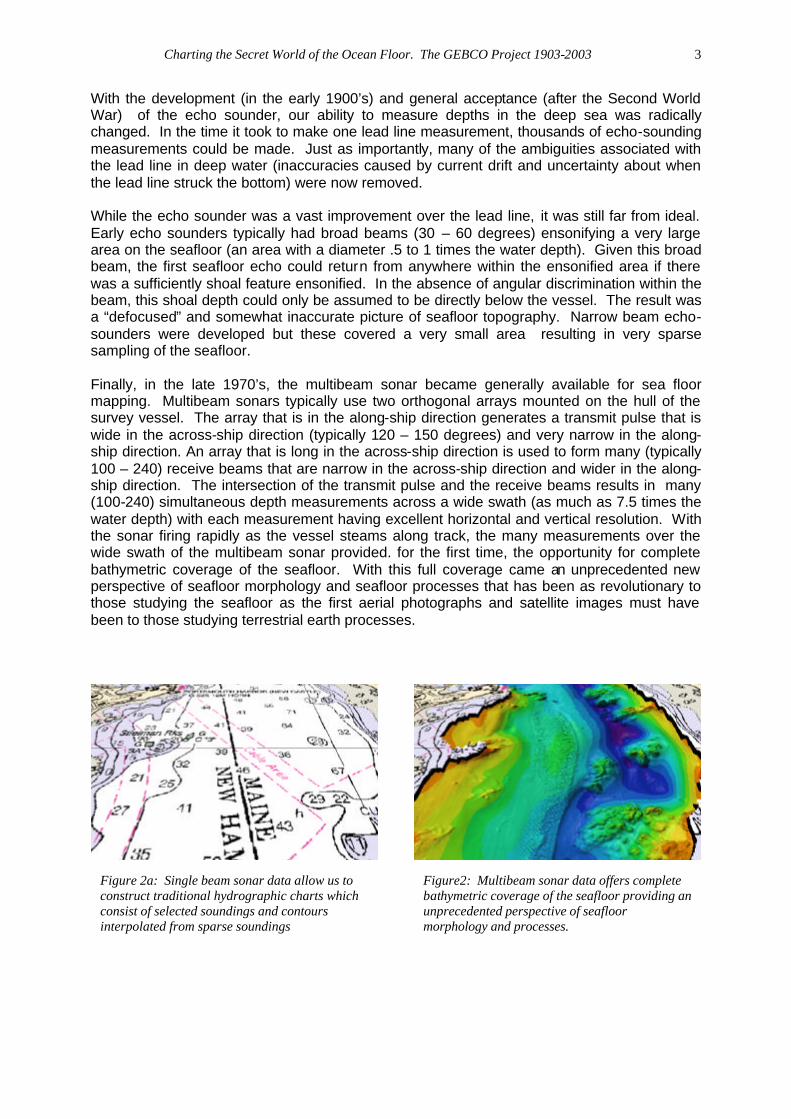
Figure2: Multibeam sonar data offers complete bathymetric coverage of the seafloor providing an unprecedented perspective of seafloor morphology and processes.

Charting the Secret World of the Ocean Floor. The GEBCO Project 1903-2003
4
THE OCEAN MAPPING SYSTEM: Advancements in sonar technology alone were not enough, however, to provide us with this revolutionary new perspective of the seafloor, for the modern mapping system is not just a sonar but rather a complex and integrated collection of positioning, motion sensing, processing, and display systems. Fortunately, in parallel with developments in sonar technology have been concomitant developments in these systems as well as the needed computer capabilities. As the spatial resolution of a multibeam sonar (the acoustic footprint on the seafloor) improves, so does the demand to know precisely where on the seafloor that depth or backscatter value is measured. The first step in the positioning of the sounding on the seafloor is to know precisely the position, in the real world, of the transducer on the vessel making the measurements. This is done through the very careful measurements of offsets between the transducer and the locus of the positioning system on the ship (today the GPS antenna). Over the past 40 years we have seen remarkable changes in our ability to determine the position of a vessel at sea – from navigation by sextant in the 1960’s with accuracy of approximately 1 n.m., to the transit satellites of the 1970’s with accuracies of approximately 100 m provided intermittently, to the GPS system of the early 1990’s with 100 m accuracy provided continuously, to the differential GPS (DGPS) systems of the late 1990’s with accuracies of 10 m provided continuously, to the Real Time Kinematic GPS systems of today which can provide continuous positions with accuracies of about 5 cm in x,y, and z. Precise knowledge of the position of the transducer is not enough however. We must also know where the sonar beam leaving the transducer strikes the seafloor. With the large moment angles associated wide-swath systems, small amounts of vessel motion (heave, pitch, or role) can radically change the transmit and receive geometry of the sounding. Without the ability to precisely monitor and correct for vessel motion, soundings collected by a multibeam sonar would be improperly scattered all over the seafloor. Fortunately there have also been tremendous advances in our ability to measure vessel motion. The early motion sensors of the 1970’s were very large devices based on damped pendulum technology. In the 1990’s these were replaced with a series of inertial motion sensors that first used a vertical gyro algorithm, then were loosely integrated with GPS systems, and today are tightly coupled with GPS systems and can provide attitude measurements with an accuracy of approximately 0.01 degrees, heading measurements with an accuracy of 0.02 degrees, ship speed measurements with an accuracy of approximately 0.01 m/sec and positional information with the accuracy of RTK GPS (0.02 – 0.10 m) – all at rates of 200 times per second. Coupled with the ability to precisely measure vessel motion, the proper prediction of the position of a sounding on the seafloor also depends on the ability to measure the changes in the path of non-vertically incident acoustic beams as they pass through a water column that has varying properties (refraction). The sound speed structure of the water column is determined from the measurement of temperature, salinity and depth (with CTD’s or XCTD’s) or from the direct measurement of sound speed (with SVP’s or XSVP’s). It has often been found that in many environments, the spatial and temporal variability of the sound speed structure of the water column is so great that it is virtually impossible to efficiently make enough measurements to capture this variability properly. Thus our ability to measure, and thus correct for, the spatial and temporal variability of the sound speed structure of the water column remains one of the largest sources of error in multibeam depth measurements. The final technology needed to bring seafloor mapping technology to its present state is associated with advancements in computing power. The price we pay for the revolution in seafloor mapping capability is data density. While an experienced hydrographer could make perhaps 10 lead line measurements in one hour in 100 m of water, a single beam echo sounder can make 20,000 measurements and a modern multibeam echosounder several

Charting the Secret World of the Ocean Floor. The GEBCO Project 1903-2003
5
million. With the addition of the backscatter data that is also collected by most multibeam sounders, data rates in 100 m of water approach 100 megabytes per hour. In very shallow water these rates can be on the order of 1 gigabyte of data per hour. Again it is the evolution of technology, in this case, computing technology that has allowed us to keep up with these rates. Over the past 30 years the speed of computer processors has doubled on the average every 50 months, with the costs of computers cut in half every 32 months and the cost of memory cut in half every 18 months. At the same time data transmission speeds have increased vastly over the last few years going from 75 hours to transmit a gigabyte of data over a 28.8 kbaud modem to 8 seconds to transmit the same gigabyte of data over a T-1000 line. It is the combination of advances in sonar technology, positioning systems, motion sensors systems and computer processing power, that has brought about a new era in seafloor mapping. And thus as we look at the future of ocean mapping, we must consider all the components of the ocean mapping system, and look at trends and new directions in sonars, platforms, ancillary sensors, data processing, and products. SONARS: Several trends are clearly on the horizon for improved sonar capability. Most multibeam sonars use orthogonally-mounted transducers (Mills-T or Mills-Cross) to achieve narrow footprints across a wide swath along the seafloor. Backscatter (sidescan sonar-like imagery) is mapped by recording the time-series of the return across each beam footprint. Another type of swath mapping system uses multiple parallel sidescan sonar-like arrays of transducers mounted on either side of the vessel and comparison of the phase of the return between pairs of these arrays to determine the depth of the seafloor (called Phase Comparison or Interferometric Sonars). These sonars usually produce higher quality backscatter imagery than traditional Mills Cross multibeams but slightly inferior bathymetry. In the coming years we will see more sonars that use complex array design to combine both of these techniques and produce multiple phase comparison depth solutions within a number of angularly resolved beams. We will also see efforts to create synthetic aperture multibeam sonars that will take advantage of improved navigational accuracy and newly developed positioning algorithms to produce greatly enhanced along-track resolution. One of the more exciting recent developments in sonar technology has been the introduction of dynamically focused multibeams. All sonars have fundamental constraints and tradeoffs with respect to frequency of operation, horizontal and vertical resolution and range. Usually, the higher the frequency of operation, the better the vertical resolution but the smaller the range. Lateral resolution is determined by the beam width which will be a function of the operating frequency and the length of the transducer array (the longer the transducer the narrower the beam). One more trade-off is the location of the near-field/far-field transition. Sonar manufacturers have, in the past, been constrained to work in the far field where the wavefront approaches a plane and interactions are linear. The distance from the transducer to the near-field/far-field transition is also a function of the operating frequency and the array length (the longer the array, the further away the transition). Thus there is also a trade-off between array length (determining beam width and near-field/far-field transition), operating frequency and range that usually limits the length of the array (and thus beam width) to ensure that the sonar will achieve a range that is greater than the near-field/far-field transition. New signal processing capabilities have recently enabled manufacturers to dynamically focus beams in the near-field and thus build sonars that have relatively long arrays and thus narrow beams and still operate in the near-field. The combination of narrow beams and high-frequency operation has resulted in unprecedented resolution of complex structures (Figures 3 and 4).

Charting the Secret World of the Ocean Floor. The GEBCO Project 1903-2003
6
Figure 3. Dynamic focusing in nearfield as implemented in Reson 8125, 455 kHz multibeam sonar
Figure 4. Color-coded bathymetry over wreck and caissons of submerged Mulberry harbor off Omaha Beach, Normandy, as imaged by 8125 dynamically focused sonar (from Mayer, et al., 2003).
Figure 5. Resolution achievable with dynamically focused sonar. Here a Sherman tank lost off Normandy beach is profiled with an 8125 (see Mayer et al., 2003) for details.

Charting the Secret World of the Ocean Floor. The GEBCO Project 1903-2003
7
Another new development looming on the horizon for multibeam sonars is the move to broad-band or swept frequency (chirp) sonars. Bandwidth is always a key to information content but limitations in transducer and processing capabilities have always kept multibeam sonars rather narrow band. New development in transducer materials (see below) as well as greatly advanced signal processing capabilities have now opened the door to the development of broad-band multibeam sonars. Increased bandwidth has several immediate benefits. First increased bandwidth will result in increased temporal resolution. Secondly, increased bandwidth will provide the opportunity for manufacturers to increase the spatial density of soundings along track by putting multiple pings into the water column at one time. At the present, multibeam sonars must wait until they receive the return from the farthest out beam until they fire again (so as not to confuse the processor). With a broad band multibeam, pings can be coded so that they can be separated out by the processor allowing multiple pings in the water column and thus increased ping rates. Finally, and perhaps most importantly, a broad band multibeam will provide the opportunity for a multispectral look at the seafloor which opens the door for powerful remote seafloor classification techniques. The tremendous bandwidth of satellite remote sensors can provide “thematic” images of the earth’s surface that allow the discrimination of vegetation and soil types. Unfortunately today’s multibeam sonars have no where near the bandwidth to do the same thing – but perhaps tomorrow’s will (Figure 6). Achieving the bandwidth necessary for full bandwidth multibeam sonars will also require new developments in transducer materials. Fortunately there is much research underway and new materials and techniques that use polyvinyldene flouride (PVDF),, 11 -3 piezocomposites and cymbals bode well for future developments. ANCILLARY SENSORS: As mentioned earlier, motion sensor technology has progressed tremendously over the past few years. With the present generation of inertial motion sensors tightly coupled to RTK GPS, we can now monitor the motion of vessels in excess of our ability to make other corrections. While these capabilities will surely improve, they are not constraining future developments in seafloor mapping. On the other hand, our ability to monitor the spatial and temporal changes in the sound speed structure of the water column is a severe limitation to the accuracy we can achieve in seafloor measurements and thus an area where new developments are critical. One recent
Figure 6. Full bandwidth Radarsat image (right) showing ability to discriminate vegetation and soil types. Image on left is same image displayed with bandwidth equivalent to typical multibeam sonar system (as percentage of central frequency).

Charting the Secret World of the Ocean Floor. The GEBCO Project 1903-2003
8
advancement in our ability to measure the spatial and temporal changes in sound speed structure is the development of “Moving Vessel Profilers” (Figure 7). These devices can be deployed while the vessel is underway and produce a profile of sound speed or temperature and salinity. While a great improvement over sparse measurements they still may not capture the true range of variability and other approaches are being investigated including the potential for acoustic tomography to capture the 3-dimensional water column structure in a given area. Perhaps the most exciting development along these lines comes from NAVSEA who have developed a towed fiber-optic cable that is capable of measuring the temperature profile of the water column nearly continuously at high speed (Figure 8).
Figure 7. The Moving Vessel Profiler from Brooke Ocean Technology. The profiler allows many vertical profiles of water column properties to be collected while the vessel is underway.
Figure 8. Temperature profiles collected every two minutes over a 12 hour period with NAVSEA instrumented cable.

Charting the Secret World of the Ocean Floor. The GEBCO Project 1903-2003
9
PLATFORMS: The fundamental rules of physics limit the resolution achievable from a surface ship-deployed sonar in deep water. The bottom line is that if we want to increase our ability to resolve seafloor bathymetry in deep water we must find ways to move the sensors closer to the seafloor. Thus ROV’s and particularly AUV’s are clearly in the future of deep sea mapping. For example, a surface ship deployed multibeam with a one degree beam width in 2000 m of water will achieve a spatial resolution on the order of 35 m while an ROV or AUV 50 m off the bottom will achieve a spatial resolution of less than 1 m. Untethered AUV’s, while in the infancy of development, have already been demonstrated to be far more efficient and cost effective than tethered ROV’s which must be towed very slowly and are very difficult to turn. One of the real challenges in collecting high-resolution acoustic data from AUV’s is data telemetry, but already we are seeing much progress made in the development of clever compression algorithms that allow data to be transmitted through acoustic modems (Figure 9) Though presently limited by endurance and available power, we are seeing rapid developments in this field and it is not inconceivable to envision a time when the entire deep sea floor will be mapped at very high resolution by fleets of AUV’s.
DATA PROCESSING: Historically, hydrographic data collected by multibeam sonars has been cleaned, edited and processed in a fashion that involves a tremendous amount of human interaction and subjective decision making. As data rates increase, it will be impossible to interactively edit and clean the massive data sets produced by multibeam sonars. Recently, however, a sophisticated new statistical technique has been developed that can automatically and very rapidly edit and clean most data sets (identifying real problem areas to the operator for closer study) and also produces a quantitative measure of the uncertainty associated the depth estimates. This technique, known as CUBE (Combined Uncertainty and Bathymetry Estimator; Calder, in press) has the potential to reduce the time it takes to process multibeam sonar data by many orders of magnitude and, in doing so, reduce one of the most serious bottlenecks in today’s bathymetric processing pipeline.
Figure 9: Left - The HUGIN AUV deploying a 200 kHz multibeam sonar (Figure courtesy of C&C Technologies). Transmission and visualization of data in real-time (above).
)

Charting the Secret World of the Ocean Floor. The GEBCO Project 1903-2003
10
VISUALIZATION AND DATA PRODUCTS: While the tremendous increase in data density brought about by modern multibeam sonars creates a series of challenges to the user community, this increase in data density also has significant benefits. In particular, the great density of multbeam data makes it appropriate for exploration with modern scientific visualization tools. The combination of quantitative, high-density geospatial data with state-of-the-art visualization tools offers an array of new ways to display and explore seafloor data and, in doing so, will help redefine the nature of seafloor charts. The ability to interactively and quantitatively explore complex data sets in an intuitive 3-D environment offers the opportunity for many new scientific and engineering insights as well as increased safety for navigation (Figure 10). Multiple data layers and multiple levels of resolution will be easily displayed in a georeferenced framework with different layers of primary data (e.g., bathymetry) and derived products (e.g., seafloor characterization data) brought in as needed depending on the mission.
CONCLUSIONS: Over the past few years we have seen remarkable changes in our ability to map and visualize the seafloor. These changes have come about through a convergence of many technologies all of which will continue to advance in the future. New developments in sonar and transducer technology will lead to the development of broad-band, dynamically focused sonars with greatly improved spatial and temporal resolution but also with the ability to provide thematic information about the nature of the seafloor. We will greatly improve our ability to monitor changes in water column structure that will also increase the accuaracy of our measurements. Improvements in remotely operated vehicle capabilities will lead to fleets of AUV’s equipped with multibeam sonar systems mapping the entire deep sea floor at very high-resolution. Most importantly, the nature of the seafloor chart will fundamentally change. Paper products will be of very limited use. Instead charts will evolve to be dynamic digital entities, tied to large data bases that can be continuously and automatically updated. Data sets will be interactively viewed in 3-dimensions with users bringing in layers and changing views, resolution etc., as necessary. These map products will be tied to postitioning systems serving as both a survey planning and real-time navigation tools (Figure 11 a and b). The challenge for the GEBCO community in the years to come is to ensure that they can provide data that is relevant and timely enough for this new mode of seafloor chart.
Figure 10 Multibeam sonar data from the southern California margin viewed in an interacive 3-D visualization environment (IVS- Fledermaus).

Charting the Secret World of the Ocean Floor. The GEBCO Project 1903-2003
11
Figure 11a – Fusion of aerial photo, hydrographic chart, and multibeam sonar data with 3-D model of frigate coming out of Sydney Harbor, Australia.
Figure 11b. Another perspective of the frigate steaming over multibeam sonar data in Sydney Harbor.

Charting the Secret World of the Ocean Floor. The GEBCO Project 1903-2003
12
References: Bass, G. F., 1972, A History of Seafaring Based on Underwater Archaeology, Walker and
Company, New York, 320 pp. Calder B. ,in press, Automatic statistical processing of multibeam echo-sounder data,
International Hydrographic Review. Mayer, L.A., Calder, B., Schmidt, J. S., and Malzone, C., 2003, Providing the Third Dimension: High-resolution Multibeam Sonar as a Tool for Archaeological Investigations -- An Example from the D-Day Beaches of Normandy, Proceedings of the U.S. Hydrographic Conference, Biloxi , MS. in press.
______