frozen warmwater shrimp from china, ecuador, india ... · u.s. international trade commission...
TRANSCRIPT
U.S. International Trade CommissionPublication 4380 February 2013
Washington, DC 20436
Frozen Warmwater Shrimp From China, Ecuador, India, Indonesia, Malaysia,
Thailand, and VietnamInvestigation Nos. 701-TA-491-497 (Preliminary)

U.S. International Trade Commission
COMMISSIONERS
Irving A. Williamson, Chairman Daniel R. Pearson Shara L. Aranoff Dean A. Pinkert
David S. Johanson Meredith M. Broadbent
Robert B. Koopman
Staff assigned
Address all communications to Secretary to the Commission
United States International Trade Commission Washington, DC 20436
Director, Office of Operations
Amy Sherman, Investigator Fred Ruggles, Investigator
Renee Berry, Industry Analyst Amelia Preece, Economist
David Boyland, Accountant Robin Turner, Attorney
Elizabeth Haines, Supervisory Investigator

U.S. International Trade CommissionWashington, DC 20436
www.usitc.gov
Publication 4380 February 2013
Frozen Warmwater Shrimp From China, Ecuador, India, Indonesia, Malaysia,
Thailand, and VietnamInvestigation Nos. 701-TA-491-497 (Preliminary)


CONTENTS
Page
Determination . . . . . . . . . . . . . . . . . . . . . . . . . . . . . . . . . . . . . . . . . . . . . . . . . . . . . . . . . . . . . . . . . . 1Views of the Commission . . . . . . . . . . . . . . . . . . . . . . . . . . . . . . . . . . . . . . . . . . . . . . . . . . . . . . . . . 3Dissenting Views of Commissioner Daniel R. Pearson . . . . . . . . . . . . . . . . . . . . . . . . . . . . . . . . . 31
Part I: Introduction . . . . . . . . . . . . . . . . . . . . . . . . . . . . . . . . . . . . . . . . . . . . . . . . . . . . . . . . . . . . I-1Background . . . . . . . . . . . . . . . . . . . . . . . . . . . . . . . . . . . . . . . . . . . . . . . . . . . . . . . . . . . . . . . . . . I-1Statutory criteria and organization of the report . . . . . . . . . . . . . . . . . . . . . . . . . . . . . . . . . . . . . . I-1
Statutory criteria . . . . . . . . . . . . . . . . . . . . . . . . . . . . . . . . . . . . . . . . . . . . . . . . . . . . . . . . . . . I-1Organization of the report . . . . . . . . . . . . . . . . . . . . . . . . . . . . . . . . . . . . . . . . . . . . . . . . . . . . I-2
U.S. Market summary . . . . . . . . . . . . . . . . . . . . . . . . . . . . . . . . . . . . . . . . . . . . . . . . . . . . . . . . . . I-2Summary data and data sources . . . . . . . . . . . . . . . . . . . . . . . . . . . . . . . . . . . . . . . . . . . . . . . . . . I-3Previous and related investigations . . . . . . . . . . . . . . . . . . . . . . . . . . . . . . . . . . . . . . . . . . . . . . . . I-3Nature and extent of alleged subsidies . . . . . . . . . . . . . . . . . . . . . . . . . . . . . . . . . . . . . . . . . . . . . I-4Alleged subsidies . . . . . . . . . . . . . . . . . . . . . . . . . . . . . . . . . . . . . . . . . . . . . . . . . . . . . . . . . . . . . I-4The subject merchandise . . . . . . . . . . . . . . . . . . . . . . . . . . . . . . . . . . . . . . . . . . . . . . . . . . . . . . . . I-9
Commerce’s scope . . . . . . . . . . . . . . . . . . . . . . . . . . . . . . . . . . . . . . . . . . . . . . . . . . . . . . . . . . I-9Tariff treatment . . . . . . . . . . . . . . . . . . . . . . . . . . . . . . . . . . . . . . . . . . . . . . . . . . . . . . . . . . . . I-10
The product . . . . . . . . . . . . . . . . . . . . . . . . . . . . . . . . . . . . . . . . . . . . . . . . . . . . . . . . . . . . . . . . . . I-10Description and applications . . . . . . . . . . . . . . . . . . . . . . . . . . . . . . . . . . . . . . . . . . . . . . . . . . I-10Production process . . . . . . . . . . . . . . . . . . . . . . . . . . . . . . . . . . . . . . . . . . . . . . . . . . . . . . . . . . I-11
Domestic like product issues . . . . . . . . . . . . . . . . . . . . . . . . . . . . . . . . . . . . . . . . . . . . . . . . . . . . I-14
Part II: Conditions of competition in the U.S. market . . . . . . . . . . . . . . . . . . . . . . . . . . . . . . . . II-1U.S. Market characteristics . . . . . . . . . . . . . . . . . . . . . . . . . . . . . . . . . . . . . . . . . . . . . . . . . . . . . . II-1Channels of distribution . . . . . . . . . . . . . . . . . . . . . . . . . . . . . . . . . . . . . . . . . . . . . . . . . . . . . . . . II-1Geographic distribution . . . . . . . . . . . . . . . . . . . . . . . . . . . . . . . . . . . . . . . . . . . . . . . . . . . . . . . . II-3Supply and demand considerations . . . . . . . . . . . . . . . . . . . . . . . . . . . . . . . . . . . . . . . . . . . . . . . . II-3
U.S. supply . . . . . . . . . . . . . . . . . . . . . . . . . . . . . . . . . . . . . . . . . . . . . . . . . . . . . . . . . . . . . . . II-3U.S. demand . . . . . . . . . . . . . . . . . . . . . . . . . . . . . . . . . . . . . . . . . . . . . . . . . . . . . . . . . . . . . . II-9
Substitutability issues . . . . . . . . . . . . . . . . . . . . . . . . . . . . . . . . . . . . . . . . . . . . . . . . . . . . . . . . . . II-11Factors affecting purchasing decisions . . . . . . . . . . . . . . . . . . . . . . . . . . . . . . . . . . . . . . . . . . II-11Comparison of domestic products, subject imports, and nonsubject imports . . . . . . . . . . . . . II-11
Part III: U.S. processors’ production, shipments, and employment . . . . . . . . . . . . . . . . . . . . . III-1U.S. processors . . . . . . . . . . . . . . . . . . . . . . . . . . . . . . . . . . . . . . . . . . . . . . . . . . . . . . . . . . . . . . . III-1U.S. capacity, production, and capacity utilization . . . . . . . . . . . . . . . . . . . . . . . . . . . . . . . . . . . III-5
Constraints on capacity . . . . . . . . . . . . . . . . . . . . . . . . . . . . . . . . . . . . . . . . . . . . . . . . . . . . . . III-5Freezing capacity . . . . . . . . . . . . . . . . . . . . . . . . . . . . . . . . . . . . . . . . . . . . . . . . . . . . . . . . . . . III-6
U.S. processors’ shipments . . . . . . . . . . . . . . . . . . . . . . . . . . . . . . . . . . . . . . . . . . . . . . . . . . . . . . III-7U.S. processors’ inventories . . . . . . . . . . . . . . . . . . . . . . . . . . . . . . . . . . . . . . . . . . . . . . . . . . . . . III-8U.S. processors’ imports and purchases . . . . . . . . . . . . . . . . . . . . . . . . . . . . . . . . . . . . . . . . . . . . III-9U.S. employment, wages, and productivity . . . . . . . . . . . . . . . . . . . . . . . . . . . . . . . . . . . . . . . . . III-9
i

CONTENTS
Page
Part IV: U.S. imports, apparent consumption, and market shares . . . . . . . . . . . . . . . . . . . . . . IV-1U.S. importers . . . . . . . . . . . . . . . . . . . . . . . . . . . . . . . . . . . . . . . . . . . . . . . . . . . . . . . . . . . . . . . . IV-1U.S. imports . . . . . . . . . . . . . . . . . . . . . . . . . . . . . . . . . . . . . . . . . . . . . . . . . . . . . . . . . . . . . . . . . IV-4Negligibility . . . . . . . . . . . . . . . . . . . . . . . . . . . . . . . . . . . . . . . . . . . . . . . . . . . . . . . . . . . . . . . . . IV-7Cumulation considerations . . . . . . . . . . . . . . . . . . . . . . . . . . . . . . . . . . . . . . . . . . . . . . . . . . . . . . IV-8Apparent U.S. consumption . . . . . . . . . . . . . . . . . . . . . . . . . . . . . . . . . . . . . . . . . . . . . . . . . . . . . IV-8U.S. market shares . . . . . . . . . . . . . . . . . . . . . . . . . . . . . . . . . . . . . . . . . . . . . . . . . . . . . . . . . . . . IV-12Ratio of imports to U.S. production . . . . . . . . . . . . . . . . . . . . . . . . . . . . . . . . . . . . . . . . . . . . . . . IV-14
Part V: Pricing data . . . . . . . . . . . . . . . . . . . . . . . . . . . . . . . . . . . . . . . . . . . . . . . . . . . . . . . . . . . . V-1Factors affecting price . . . . . . . . . . . . . . . . . . . . . . . . . . . . . . . . . . . . . . . . . . . . . . . . . . . . . . . . . V-1
Production costs . . . . . . . . . . . . . . . . . . . . . . . . . . . . . . . . . . . . . . . . . . . . . . . . . . . . . . . . . . . . V-1U.S. inland transportation costs . . . . . . . . . . . . . . . . . . . . . . . . . . . . . . . . . . . . . . . . . . . . . . . . V-1
Pricing practices . . . . . . . . . . . . . . . . . . . . . . . . . . . . . . . . . . . . . . . . . . . . . . . . . . . . . . . . . . . . . . V-2Pricing methods . . . . . . . . . . . . . . . . . . . . . . . . . . . . . . . . . . . . . . . . . . . . . . . . . . . . . . . . . . . . V-2Sales terms and discounts . . . . . . . . . . . . . . . . . . . . . . . . . . . . . . . . . . . . . . . . . . . . . . . . . . . . V-2
Price data . . . . . . . . . . . . . . . . . . . . . . . . . . . . . . . . . . . . . . . . . . . . . . . . . . . . . . . . . . . . . . . . . . . V-2Price trends . . . . . . . . . . . . . . . . . . . . . . . . . . . . . . . . . . . . . . . . . . . . . . . . . . . . . . . . . . . . . . . V-12Nonsubject prices . . . . . . . . . . . . . . . . . . . . . . . . . . . . . . . . . . . . . . . . . . . . . . . . . . . . . . . . . . V-14
Lost revenues and lost sales . . . . . . . . . . . . . . . . . . . . . . . . . . . . . . . . . . . . . . . . . . . . . . . . . . . . . V-16
Part VI: Financial experience of U.S. processors’ . . . . . . . . . . . . . . . . . . . . . . . . . . . . . . . . . . . . VI-1Background . . . . . . . . . . . . . . . . . . . . . . . . . . . . . . . . . . . . . . . . . . . . . . . . . . . . . . . . . . . . . . . . . . VI-1Processing operations on frozen warmwater shrimp . . . . . . . . . . . . . . . . . . . . . . . . . . . . . . . . . . VI-1Capital and investment . . . . . . . . . . . . . . . . . . . . . . . . . . . . . . . . . . . . . . . . . . . . . . . . . . . . . . . . . VI-6Capital expenditures . . . . . . . . . . . . . . . . . . . . . . . . . . . . . . . . . . . . . . . . . . . . . . . . . . . . . . . . . . . VI-6
Part VII: Threat considerations and information on nonsubject countries . . . . . . . . . . . . . . . VII-1The industry in China . . . . . . . . . . . . . . . . . . . . . . . . . . . . . . . . . . . . . . . . . . . . . . . . . . . . . . . . . . VII-1The industry in Ecuador . . . . . . . . . . . . . . . . . . . . . . . . . . . . . . . . . . . . . . . . . . . . . . . . . . . . . . . . VII-1The industry in India . . . . . . . . . . . . . . . . . . . . . . . . . . . . . . . . . . . . . . . . . . . . . . . . . . . . . . . . . . . VII-3The industry in Indonesia . . . . . . . . . . . . . . . . . . . . . . . . . . . . . . . . . . . . . . . . . . . . . . . . . . . . . . . VII-4The industry in Malaysia . . . . . . . . . . . . . . . . . . . . . . . . . . . . . . . . . . . . . . . . . . . . . . . . . . . . . . . VII-5The industry in Thailand . . . . . . . . . . . . . . . . . . . . . . . . . . . . . . . . . . . . . . . . . . . . . . . . . . . . . . . . VII-5The industry in Vietnam . . . . . . . . . . . . . . . . . . . . . . . . . . . . . . . . . . . . . . . . . . . . . . . . . . . . . . . . VII-5The seven subject countries . . . . . . . . . . . . . . . . . . . . . . . . . . . . . . . . . . . . . . . . . . . . . . . . . . . . . VII-7U.S. inventories of frozen warmwater shrimp from subject countries . . . . . . . . . . . . . . . . . . . . . VII-9U.S. importers’ current orders . . . . . . . . . . . . . . . . . . . . . . . . . . . . . . . . . . . . . . . . . . . . . . . . . . . VII-9Antidumping investigations in third-country markets . . . . . . . . . . . . . . . . . . . . . . . . . . . . . . . . . VII-9Information on nonsubject countries . . . . . . . . . . . . . . . . . . . . . . . . . . . . . . . . . . . . . . . . . . . . . . VII-10
Global market . . . . . . . . . . . . . . . . . . . . . . . . . . . . . . . . . . . . . . . . . . . . . . . . . . . . . . . . . . . . . VII-10
ii

CONTENTS
PageAppendixesA. Federal Register notices . . . . . . . . . . . . . . . . . . . . . . . . . . . . . . . . . . . . . . . . . . . . . . . . . . . . . . . . A-1B. Conference witnesses . . . . . . . . . . . . . . . . . . . . . . . . . . . . . . . . . . . . . . . . . . . . . . . . . . . . . . . . . . B-1C. Summary data . . . . . . . . . . . . . . . . . . . . . . . . . . . . . . . . . . . . . . . . . . . . . . . . . . . . . . . . . . . . . . . . C-1D. Tariff treatment . . . . . . . . . . . . . . . . . . . . . . . . . . . . . . . . . . . . . . . . . . . . . . . . . . . . . . . . . . . . . . D-1E. U.S. Fishermen data . . . . . . . . . . . . . . . . . . . . . . . . . . . . . . . . . . . . . . . . . . . . . . . . . . . . . . . . . . . E-1F. Alleged effects of imports on U.S. processors’ existing development and production efforts, growth,investment. and ability to raise capital . . . . . . . . . . . . . . . . . . . . . . . . . . . . . . . . . . . . . . . . . . . . . . . . F-1G. Alleged effects of imports on U.S. fishermen’s existing development and harvesting efforts, growth,
investment, and ability to raise capital . . . . . . . . . . . . . . . . . . . . . . . . . . . . . . . . . . . . . . . . . . . . . G-1
Note.--Information that would reveal confidential operations of individual concerns may not be publishedand therefore has been deleted from this report. Such deletions are indicated by asterisks.
iii


1
UNITED STATES INTERNATIONAL TRADE COMMISSION Investigation Nos. 701-TA-491-497 (Preliminary) FROZEN WARMWATER SHRIMP FROM CHINA, ECUADOR, INDIA, INDONESIA, MALAYSIA,
THAILAND, AND VIETNAM DETERMINATION
On the basis of the record1 developed in the subject investigations, the United States International Trade Commission (Commission) determines, pursuant to section 703(a) of the Tariff Act of 1930 (19 U.S.C. ' 1671b(a)) (the Act), that there is a reasonable indication that an industry in the United States is materially injured by reason of imports from China, Ecuador, India, Indonesia, Malaysia, Thailand, and Vietnam of frozen warmwater shrimp, provided for in subheadings 0306.17.00, 1605.21.10 and 1605.29.10 of the Harmonized Tariff Schedule of the United States, that are alleged to be subsidized by the Governments of China, Ecuador, India, Indonesia, Malaysia, Thailand, and Vietnam.2
Pursuant to section 207.18 of the Commission=s rules, the Commission also gives notice of the
commencement of the final phase of its investigations. The Commission will issue a final phase notice of scheduling, which will be published in the Federal Register as provided in section 207.21 of the Commission=s rules, upon notice from the Department of Commerce (Commerce) of affirmative preliminary determinations in the investigations under section 703(b) of the Act, or, if the preliminary determinations are negative, upon notice of affirmative final determinations in these investigations under section 705(a) of the Act. Parties that filed entries of appearance in the preliminary phase of the investigations need not enter a separate appearance for the final phase of the investigations. Industrial users, and, if the merchandise under investigation is sold at the retail level, representative consumer organizations have the right to appear as parties in Commission antidumping and countervailing duty investigations. The Secretary will prepare a public service list containing the names and addresses of all persons, or their representatives, who are parties to the investigations.
BACKGROUND
On December 28, 2012, a petition was filed with the Commission and Commerce by the Coalition of Gulf Shrimp Industries, Biloxi, MS, alleging that an industry in the United States is materially injured or threatened with material injury by reason of subsidized imports of frozen warmwater shrimp from China, Ecuador, India, Indonesia, Malaysia, Thailand, and Vietnam. Accordingly, effective December 28, 2012, the Commission instituted countervailing duty investigation Nos. 701-TA-491-497 (Preliminary).
Notice of the institution of the Commission=s investigations and of a public conference to be held in
connection therewith was given by posting copies of the notice in the Office of the Secretary, U.S. International Trade Commission, Washington, DC, and by publishing the notice in the Federal Register of January 4, 2013 (76 FR 764). The conference was held in Washington, DC, on January 18, 2013, and all persons who requested the opportunity were permitted to appear in person or by counsel.
1 The record is defined in sec. 207.2(f) of the Commission=s Rules of Practice and Procedure (19 CFR ' 207.2(f)).
2 Commissioner Daniel R. Pearson voted in the negative.


VIEWS OF THE COMMISSION
Based on the record in the preliminary phase of these investigations, we find that there is areasonable indication that an industry in the United States is materially injured by reason of imports offrozen warmwater shrimp (“frozen shrimp”) from China, Ecuador, India, Indonesia, Malaysia, Thailand,and Vietnam that are allegedly subsidized.1
I. THE LEGAL STANDARD FOR PRELIMINARY DETERMINATIONS
The legal standard for preliminary countervailing duty determinations requires the Commission todetermine, based upon the information available at the time of the preliminary determinations, whetherthere is a reasonable indication that a domestic industry is materially injured or threatened with materialinjury, or that the establishment of an industry is materially retarded, by reason of the allegedly unfairlytraded imports.2 In applying this standard, the Commission weighs the evidence before it and determineswhether “(1) the record as a whole contains clear and convincing evidence that there is no material injuryor threat of such injury; and (2) no likelihood exists that contrary evidence will arise in a finalinvestigation.”3
II. BACKGROUND
The petitions in these investigations were filed on December 28, 2012 by the Coalition of GulfShrimp Industries (“Coalition” or “Petitioner”), a trade association whose members are processors offrozen warmwater shrimp in the United States. Members of the Coalition appeared at the staffconference, and the Coalition submitted a postconference brief. A second domestic producer group, theAd Hoc Shrimp Industry Committee (“AHSIC”), consists of several hundred businesses operating withinthe U.S. domestic shrimp industry, the great majority of which are shrimp fishermen. AHSIC takes noposition on the petitions but filed a postconference brief.4
Five respondent groups participated in the conference and submitted postconference briefs. Respondents consist of (1) the National Chamber of Aquaculture (“Ecuador Respondent”), the tradeassociation of Ecuador’s shrimp processors; (2) the Seafood Exports Association of India, an associationof foreign manufacturers and exporters of subject merchandise and the Government of India through theMarine Products Export Development Authority of India (collectively, “Indian Respondents”); (3) theGovernment of Indonesia and the Indonesian Fishery Product Processing & Marketing Association and itsindividual members (collectively, “Indonesian Respondents”); (4) a group of five Thai producers andexporters of frozen warmwater shrimp (Marine Gold Products Ltd.; Pakfood Public Co., Ltd.; Thai RoyalFrozen Food Co., Ltd.; Thai Union Frozen Products Public Co., Ltd.; and Thai Union Seafood Co., Ltd.)and two U.S. importers of subject merchandise (Eastern Fish Co. and Tri-Union Frozen Products, Inc.)(collectively, “Thai Respondents”); and (5) a group of six Thai producers and exporters of frozenwarmwater shrimp (Andaman Seafood Co., Ltd.; Chanthaburi Frozen Food Co., Ltd.; Chanthaburi
1 Commissioner Daniel R. Pearson determines that there is not a reasonable indication that an industry in theUnited States is materially injured or threatened with material injury by reason of imports of frozen warmwatershrimp from China, Ecuador, India, Indonesia, Malaysia, Thailand, and Vietnam that are allegedly subsidized. SeeDissenting Views of Commissioner Daniel R. Pearson. He joins sections I-VI.B.2 and VI.B.4 of these Views.
2 19 U.S.C. § 1673b(a) (2000); see also American Lamb Co. v. United States, 785 F.2d 994, 1001-04 (Fed. Cir.1986); Aristech Chem. Corp. v. United States, 20 CIT 353, 354-55 (1996).
3 American Lamb Co., 785 F.2d at 1001; see also Texas Crushed Stone Co. v. United States, 35 F.3d 1535, 1543(Fed. Cir. 1994).
4 AHSIC’s Postconference Brief at 1.
3

Seafoods Co., Ltd.; Phatthana Seafood Co., Ltd.; Phatthana Frozen Food Co., Ltd.; and Sea WealthFrozen Food Co., Ltd.) and a U.S. importer, Rubicon Resources, LLC (collectively, “Rubicon Group”).5
In these investigations, U.S. industry data are based on the questionnaire responses of 38 U.S.processors of frozen shrimp accounting for 83.8 percent of U.S. production of frozen warmwater shrimpin 2011.6 U.S. import data are based on official Commerce import statistics and questionnaire responsesfrom 46 U.S. importers accounting for 55.5 percent of total subject imports.7 The Commission receivedresponses to its questionnaires from 114 foreign producers of subject merchandise.8
III. DOMESTIC LIKE PRODUCT
A. In General
In determining whether there is a reasonable indication that an industry in the United States ismaterially injured or threatened with material injury by reason of imports of the subject merchandise, theCommission first defines the “domestic like product” and the “industry.”9 Section 771(4)(A) of the TariffAct of 1930, as amended (“the Act”), defines the relevant domestic industry as the “producers as a wholeof a domestic like product, or those producers whose collective output of a domestic like productconstitutes a major proportion of the total domestic production of the product.”10 In turn, the Tariff Actdefines “domestic like product” as “a product which is like, or in the absence of like, most similar incharacteristics and uses with, the article subject to an investigation ....”11
The decision regarding the appropriate domestic like product in an investigation is a factualdetermination, and the Commission has applied the statutory standard of “like” or “most similar incharacteristics and uses” on a case-by-case basis.12 No single factor is dispositive, and the Commission
5 No respondent entities with interests in imports or exports from China, Malaysia or Vietnam appeared at theconference or submitted postconference briefs.
6 Confidential Staff Report, Memorandum INV-LL-013 (Feb. 4, 2013) as revised by Memorandum INV-LL-014(Feb. 5, 2013), (“CR”) at III-1 and Public Staff Report (“PR”) at III-1. U.S. production is based on live (head-onshell-on) weight. The Commission received responses from 58 firms but only 38 U.S. processors provided usablequantitative data.
7 CR/PR at IV-1. These U.S. importers also account for 52.9 percent of total imports from China, 48.1 percent oftotal imports from Ecuador, 51.7 percent of total imports from India, 64.7 percent of total imports from Indonesia,43.5 percent of total imports from Malaysia, 61.5 percent of total imports from Thailand, and 43.1 percent of totalimports from Vietnam in 2011. Id.
8 CR/PR at VII-1. The foreign producer questionnaires are from three producers/exporters in China accountingfor approximately *** of subject imports from China as reported in official Commerce statistics in 2011; nineproducers/exporters in Ecuador accounting for approximately 58.4 percent of subject imports from Ecuador in 2011;28 producers/exporters in India accounting for approximately 85.3 percent of subject imports from India in 2011; 15producers/exporters in Indonesia accounting for approximately 77.5 percent of subject imports from Indonesia in2011; three producers/exporters in Malaysia accounting for approximately *** of subject imports from Malaysia in2011; 28 producers/exporters in Thailand accounting for approximately 88.2 percent of subject imports fromThailand in 2011; and 28 producers/exporters in Vietnam accounting for approximately 41.0 percent of subjectimports from Vietnam in 2011. CR at VII-2 and VII-6; PR at VII-1, VII-3, VII-4 and VII-5.
9 19 U.S.C. § 1677(4)(A).
10 19 U.S.C. § 1677(4)(A).
11 19 U.S.C. § 1677(10).
12 See, e.g., Cleo Inc. v. United States, 501 F.3d 1291, 1299 (Fed. Cir. 2007); NEC Corp. v. Department ofCommerce, 36 F. Supp. 2d 380, 383 (Ct. Int’l Trade 1998); Nippon Steel Corp. v. United States, 19 CIT 450, 455
(continued...)
4

may consider other factors it deems relevant based on the facts of a particular investigation.13 TheCommission looks for clear dividing lines among possible like products and disregards minor variations.14 Although the Commission must accept Commerce’s determination as to the scope of the importedmerchandise that is subsidized or sold at less than fair value,15 the Commission determines what domesticproduct is like the imported articles Commerce has identified.16
B. Product Description
In its notice of initiation, Commerce defined the imported merchandise within the scope of theseinvestigations as follows:
The scope of these investigations is certain frozen warmwater shrimp andprawns, whether wild-caught (ocean harvested) or farm-raised (produced by aquaculture),head-on or head-off, shell-on or peeled, tail-on or tail-off, deveined or not deveined,cooked or raw, or otherwise processed in frozen form, regardless of size.
The frozen warmwater shrimp and prawn products included in the scope,regardless of definitions in the Harmonized Tariff Schedule of the United States(“HTSUS”), are products which are processed from warmwater shrimp and prawnsthrough freezing and which are sold in any count size.
The products described above may be processed from any species of warmwatershrimp and prawns. Warmwater shrimp and prawns are generally classified in, but arenot limited to, the Penaeidae family. Some examples of the farmed and wild-caughtwarmwater species include, but are not limited to, whiteleg shrimp (Penaeus vannemei),banana prawn (Penaeus merguiensis), fleshy prawn (Penaeus chinensis), giant riverprawn (Macrobrachium rosenbergii), giant tiger prawn (Penaeus monodon), redspottedshrimp (Penaeus brasiliensis), southern brown shrimp (Penaeus subtilis), southern pinkshrimp (Penaeus notialis), southern rough shrimp (Trachypenaeus curvirostris), southernwhite shrimp (Penaeus schmitti), blue shrimp (Penaeus stylirostris), western whiteshrimp (Penaeus occidentalis), and Indian white prawn (Penaeus indicus).
12 (...continued)(1995); Torrington Co. v. United States, 747 F. Supp. 744, 749 n.3 (Ct. Int’l Trade 1990), aff’d, 938 F.2d 1278 (Fed.Cir. 1991) (“every like product determination ‘must be made on the particular record at issue’ and the ‘unique factsof each case’”).
13 See, e.g., S. Rep. No. 96-249 at 90-91 (1979).
14 Nippon, 19 CIT at 455; Torrington, 747 F. Supp. at 748-49; see also S. Rep. No. 96-249 at 90-91 (1979)(Congress has indicated that the like product standard should not be interpreted in “such a narrow fashion as topermit minor differences in physical characteristics or uses to lead to the conclusion that the product and article arenot ‘like’ each other, nor should the definition of ‘like product’ be interpreted in such a fashion as to preventconsideration of an industry adversely affected by the imports under consideration.”).
15 See, e.g., USEC, Inc. v. United States, 34 Fed. Appx. 725, 730 (Fed. Cir. 2002) (“The ITC may not modify theclass or kind of imported merchandise examined by Commerce.”); Algoma Steel Corp. v. United States, 688 F.Supp. 639, 644 (Ct. Int’l Trade 1988), aff’d, 865 F.3d 240 (Fed. Cir.), cert. denied, 492 U.S. 919 (1989).
16 Hosiden Corp. v. Advanced Display Mfrs., 85 F.3d 1561, 1568 (Fed. Cir. 1996) (the Commission may find asingle like product corresponding to several different classes or kinds defined by Commerce); Cleo, 501 F.3d at 1298n.1 (“Commerce’s {scope} finding does not control the Commission’s {like product} determination.”); Torrington,747 F. Supp. at 748-52 (affirming the Commission’s determination defining six like products in investigations inwhich Commerce found five classes or kinds).
5

Frozen shrimp and prawns that are packed with marinade, spices or sauce areincluded in the scope. In addition, food preparations (including dusted shrimp), whichare not “prepared meals,” that contain more than 20 percent by weight of shrimp orprawn are also included in the scope.
Excluded from the scope are: (1) Breaded shrimp and prawns; (2) shrimp andprawns generally classified in the Pandalidae family and commonly referred to ascoldwater shrimp, in any state of processing; (3) fresh shrimp and prawns whethershell-on or peeled; (4) shrimp and prawns in prepared meals; (5) dried shrimp andprawns; (6) canned warmwater shrimp and prawns; and (7) certain “battered shrimp” (seebelow).
“Battered shrimp” is a shrimp-based product: (1) That is produced from fresh (orthawed-from-frozen) and peeled shrimp; (2) to which a “dusting” layer of rice or wheat flour of atleast 95 percent purity has been applied; (3) with the entire surface of the shrimp flesh thoroughlyand evenly coated with the flour; (4) with the nonshrimp content of the end product constitutingbetween four and 10 percent of the product's total weight after being dusted, but prior to beingfrozen; and (5) that is subjected to individually quick frozen (“IQF”) freezing immediately afterapplication of the dusting layer. When dusted in accordance with the definition of dusting above,the battered shrimp product is also coated with a wet viscous layer containing egg and/or milk,and par-fried.17
The scope of investigation is virtually identical to that in the prior investigations and reviews regardingfrozen warmwater shrimp.18
The Commission has previously conducted antidumping duty investigations and reviews offrozen shrimp. In the 2004 antidumping duty investigations on warmwater shrimp, the Commissiondetermined, as proposed by the domestic producers, that the domestic like product should be defined toinclude fresh warmwater shrimp, an item excluded from the scope. Using the “semifinished products”like product analysis, the Commission found that fresh shrimp should be included in the domestic likeproduct because fresh shrimp was overwhelmingly used as an input in the production of the frozenproduct, the shrimp was overwhelmingly sold in a processed form, and the initial stages of processing didnot significantly change the physical characteristics and uses of the product and appeared to add at mostmoderate value to the product.19 Consequently, the domestic like product on which the Commission
17 Certain Frozen Warmwater Shrimp from the People’s Republic of China, Ecuador, India, Indonesia, Malaysia,Thailand, and the Socialist Republic of Vietnam: Initiation of Countervailing Duty Investigations, 78 Fed. Reg.5416, 5420-21 (Dep’t of Commerce Jan. 25, 2013) (footnotes omitted).
18 Specifically, the scope in these investigations is substantively the same as that in the most recent five-yearreviews, with the exception that one scope exclusion in the five-year reviews (for a product called Lee Kum Keeshrimp sauce) is not repeated in the current scope definition. See Certain Frozen Warmwater Shrimp and Prawnsfrom Brazil, China, India, Thailand, and Vietnam, Inv. Nos. 731-TA-1063, 1064, 1066-1068 (Review), USITC Pub.4221 at 5 (March 2011) (“2011 Review Determinations”). “Dusted shrimp,” which is included in the scope in theseinvestigations and also was included in the scope of the five-year reviews, was not within the scope of theCommission’s original antidumping duty investigations. Further, canned shrimp was within the scope in the originalinvestigations, but the Commission defined it as a separate domestic like product and made negative or negligibleimport determinations for canned shrimp from all countries subject to the original investigations. See Certain Frozenor Canned Warmwater Shrimp and Prawns from Brazil, China, Ecuador, India, Thailand, and Vietnam, Inv. Nos.731-TA-1063-1068 (Final), USITC Pub. 3748 at 4-5 and 8-11 (Jan. 2005) (“Antidumping Duty FinalDetermination”).
19 Certain Frozen or Canned Warmwater Shrimp and Prawns from Brazil, China, Ecuador, India, Thailand, andVietnam, Inv. Nos. 731-TA-1063-1068 (Preliminary), USITC Pub. 3672 at 14-15 (Feb. 2004) (“2004 Preliminary
(continued...)
6
reached affirmative determinations in the antidumping duty investigations and subsequent five-yearreviews consisted of both fresh warmwater shrimp and the frozen warmwater shrimp products describedin the scope.20
C. Parties’ Arguments
Petitioner proposes defining the domestic like product as certain frozen warmwater shrimpproduced in the United States and not including fresh shrimp and brine-frozen shrimp in the domestic likeproduct.21 Petitioner asks the Commission not to apply the semifinished product analysis in this case,which is contrary to the position taken by petitioning domestic industry groups in prior proceedingsconcerning essentially the same scope of merchandise. Yet, Petitioner acknowledges that its request “isnot based on a change in the facts that are traditionally examined under the five factors of the analysis.”22 According to Petitioner, application of the semifinished product analysis here “would effectively requirethe U.S. shrimp processing industry to demonstrate injury both to itself and to the U.S. shrimp fishingindustry, which would contravene Congressional intent.”23 Domestic interested party AHSIC, comprisedprimarily of shrimp fishermen, contends that the Commission should define the domestic like product toencompass both fresh warmwater shrimp and those frozen articles described in the scope definition. Itmaintains that the record of these reviews does not provide any basis to adopt a different like productdefinition than was used in the prior investigations and reviews.24 Respondents also argue that thedomestic like product should include fresh warmwater shrimp as it has in the prior investigations andreviews.25
19 (...continued)Determinations”); Antidumping Duty Final Determination, USITC Pub. 3748 at 6 (Jan. 2005).
20 See generally 2011 Review Determinations, USITC Pub. 4221 at 6.
21 Petition at I-2; Petitioner’s Postconference Brief at 6 and Staff Question 3 at 1.
22 Petitioner’s Postconference Brief, Staff Question 4 at 1; Conf. Tr. at 66.
23 Petitioner’s Postconference Brief, Staff Question 4 at 1; Conf. Tr. at 66. In arguing that the expanded domesticlike product and corresponding inclusion of the shrimp fishermen in the domestic industry would contraveneCongressional intent, Petitioner refers to the legislative history regarding the statutory agricultural provision, 19U.S.C. § 1677(4)(E). The agricultural provision permits the inclusion of upstream raw agricultural growers orproducers in the domestic industry in certain investigations involving a processed agriculture product produced fromany raw agricultural product, so as not to “preclude the possibility of appropriate sectors of U.S. agriculture fromobtaining relief from unfairly traded imports of processed agricultural products.” H.R. Rep. No. 100-40, pt. 2 at 111(1987). Petitioner, however, uses the legislative intent to include upstream growers in the domestic industry tojustify what appears to be a different and contrary proposition – that it should not have “to bear the additional burdenof demonstrating injury or threat of injury to its suppliers....” Petitioner’s Postconference Brief, Staff Question 4 at1-2. We invite further arguments on this issue in any final-phase investigations. Petitioner’s argument is alsopremised on the unsupported view that the Commission should not conduct a semifinished product analysis anddefine an expanded domestic like product if Petitioner has not requested it. Petitioner’s Postconference Brief, StaffQuestion 4 at 3-8. The Petitioner’s views on the appropriate definition of the domestic like product, however, do notbind the Commission. Our determination is based on an objective analysis of the record facts. See Torrington, 747F. Supp. at 748.
24 AHSIC’s Postconference Brief at 1-13.
25 Ecuador Respondents’ Postconference Brief at 3; Indian Respondents’ Postconference Brief at 3; IndonesianRespondents’ Postconference Brief at 2; Thai Respondents’ Postconference Brief at 4. Rubicon Group takes noposition on the domestic like product issue. Rubicon Group’s Postconference Brief at 4.
7
D. Analysis
As discussed below, we find a single domestic like product, encompassing both fresh warmwatershrimp and the frozen warmwater shrimp described in the scope of the investigations.
The record in these investigations does not indicate that there have been any changes in theproduct characteristics of either fresh or frozen warmwater shrimp since the prior investigations andreviews.26 Indeed, as previously stated, Petitioner acknowledges that the product characteristics have notchanged.27 Moreover, Petitioner does not argue that the factors the Commission would apply in itssemifinished product analysis support a domestic like product definition different from the one theCommission has found in prior proceedings involving virtually the same scope of investigation. Rather, itargues that the Commission should not apply the analysis because it would result in a definition of thedomestic industry that Petitioner does not prefer. Under the statute, however, the domestic industrydefinition is not the starting point of the Commission’s analysis, but instead follows from the definition ofthe domestic like product.28
Moreover, Petitioner begins with the premise that the scope definition only includes frozenshrimp that has been further processed and is suitable for commercial use or sale, and not shrimp that hasbeen frozen on board the fishing boats. Offshore shrimping vessels brine-freeze shrimp on board the boatto temporarily preserve the shrimp while the boats are fishing. This permits the boats to make longeroffshore trips, perhaps lasting as long as several weeks.29 Inshore shrimp boats place shrimp on ice or inice slush in vats during their shorter voyages, such that the shrimp arriving at the dock is fresh, i.e., neverfrozen. Petitioner argues that the “forms [fresh shrimp and brine-frozen shrimp] of the shrimp processorsbuy from boats and docks are completely different from the final processed product that U.S. processorsproduce.”30 It relies on the FDA standard governing processed shrimp, which it contends “has excludedonboard freezing from its definition of ‘processing’ because ‘freezing is an operation that is routinelyused onboard a harvest vessel in order to preserve the quality of the fish until it is landed for furtherprocessing.’”31
While frozen shrimp suitable for commercial use or sale may arguably be the stage at which allsubject imports enter the U.S. market and FDA standards applicable to processed shrimp may arguablynot apply to shrimp that is frozen on board vessels, the scope language in these investigations referssimply to “frozen shrimp” without reference or limitation to any specific method of freezing or any stageof processing at which the freezing must occur.32 The scope states as follows in relevant part:
The scope of these investigations is certain frozen warmwater shrimp and prawns,whether wild-caught (ocean harvested) or farm-raised (produced by aquaculture), head-on orhead-off, shell-on or peeled, tail-on or tail-off, deveined or not deveined, cooked or raw, orotherwise processed in frozen form, regardless of size.
26 CR at I-11-16; PR at I-10-13.
27 Petitioner’s Postconference Brief, Staff Question 4 at 1; Conf. Tr. at 66.
28 Compare 19 U.S.C. § 1677 (4)(A) with 19 U.S.C. § 1677 (10).
29 Petitioner’s Postconference Brief, Question 2 at 2 and Question 3 at 4.
30 Petitioner’s Postconference Brief, Question 2 at 1-5.
31 Petitioner’ Postconference Brief, Question 2 at 2-3.
32 We do not find the scope language in question to be ambiguous. Even if there were an ambiguity concerningwhether a given product is in or out of the scope, the Commission will decide the issue for purposes of its injurydetermination, while still deferring to the language and intent of Commerce’s rulings. See generally e.g., CoatedPaper Suitable for High-Quality Print Graphics Using Sheet-Fed Presses from China and Indonesia, Inv. Nos. 701-TA-470-471 and 731-TA-1169-1170 (Final), USITC Pub. 4192 at 4-6 (Nov. 2010).
8

The frozen warmwater shrimp and prawn products included in the scope,regardless of definitions in the Harmonized Tariff Schedule of the United States(“HTSUS”), are products which are processed from warmwater shrimp and prawnsthrough freezing and which are sold in any count size.33
Moreover, in the original antidumping duty investigations, the Commission stated in its analysis ofwhether to include fresh shrimp in the domestic like product that the scope of those investigations (whichis nearly identical to the current scope) included onboard frozen shrimp. In discussing separate markets,the Commission stated as follows:
Separate Markets. There are separate markets for fresh and processed warmwater shrimp in thesense that vessels sell their catch to a dock house or processor, while processors sell shrimp toend users and distributors. However, this distinction may more properly be characterized as onebetween harvested shrimp and processed shrimp than between “fresh” shrimp and processedshrimp. Because warmwater shrimp is commonly frozen and deheaded on the vessel, the producta vessel sells at the dock is not necessarily “fresh” shrimp.34
Petitioner’s argument would have the effect of including some but not all shrimp fishermen in thedefinition of the domestic industry. Since some of the shrimp sold at the dock is in fresh form (not inscope) and some has already been brine-frozen (included in the scope),35 those shrimp fishermen thatfurther process by freezing shrimp on board their vessels would produce the domestic like product andthus would be included in the domestic industry under either Petitioner’s proposed domestic like productdefinition or the one that the other parties advocate. Only under Petitioner’s proposal, however, wouldthe shrimp fishermen who sell only fresh warmwater shrimp not be included in the domestic industry.36
It is undisputed that the overwhelming majority of fresh shrimp is not sold as a “finished”product, but is used as an input (as is onboard frozen shrimp) for further processing into frozen productssuitable for commercial use or sale. Consequently, fresh and processed shrimp are products at differentstages of the same production process. In light of this, we conclude that use of the “semifinished product”like product analysis is appropriate to determine whether fresh shrimp should be included in the same likeproduct as the processed frozen shrimp products within the scope, as it was in prior Commissionproceedings concerning this product.37
33 78 Fed. Reg. 5416, 5420-21 (Jan. 25, 2013) (emphasis added).
34 USITC Pub. 3748 at 13-14.
35 See CR at I-13; PR at I-12; and Conf. Tr. at 70-72.
36 The Commission may, when appropriate, include domestic articles in the domestic like product that are inaddition to those described in the scope. See, e.g., USEC, Inc. v. United States, 34 Fed. Appx. 725, 730 (Fed. Cir.2002) (“The ITC may not modify the class or kind of imported merchandise examined by Commerce.”); CertainLined School Paper Supplies from China, India, and Indonesia, Inv. Nos. 701-TA-442-443 and 731-TA-1095-1097(Final), USITC Pub. 3884 at 10-11(Sept. 2006); Professional Electric Cutting and Sanding/Grinding Tools fromJapan, Inv. No. 731-TA-571 (Final), USITC Pub. 2536 at 62 (July 1992), aff’d Makita Corp. v. United States, 974 F.Supp. 770, 785 (CIT 1997) (affirming domestic like product definitions expanded beyond scope of professional toolsto also include consumer electric cutting and sanding/grinding tools); Torrington, 747 F. Supp. at 748-52 (affirmingCommission determination of six like products in investigations in which Commerce found five classes or kinds);see also Cleo Inc. v. United States, 501 F.3d 1291, 1298, n.1 (Fed. Cir. 2007) (“Commerce’s [scope] finding doesnot control the Commission’s [like product] determination”).
37 In a semifinished product analysis, the Commission examines the following: (1) whether the upstream article isdedicated to the production of the downstream article or has independent uses; (2) whether there are perceived to be
(continued...)
9

Petitioner concedes that the facts on the record of the current investigations are the same as thefacts in the prior proceedings. We agree that when the semifinished product analysis is applied to therecord in these investigations, it supports the findings the Commission made in the 2004 antidumpingduty investigations:38
• Dedication for Use. The vast majority of fresh warmwater shrimp undergoes further processing. Petitioner has estimated that 95 percent of fresh warmwater shrimp is dedicated for processing.39
• Separate Markets. There are separate markets for harvested (whether fresh or brine-frozen)shrimp and processed warmwater shrimp in the sense that vessels sell their catch to a dock houseor processor, while processors sell shrimp to end users and distributors. However, fresh shrimpand shrimp frozen on the vessel are both sold at the dock.40
• Differences in Physical Characteristics and Functions of the Upstream and Downstream Articles. The processing of fresh and brine-frozen shrimp does not change the essential character orfunctions of the upstream article.41
• Differences in Value. Based on shrimp input costs for domestic processors provided in thepetition, it is estimated that frozen processed shrimp has about a 20 to 25 percent higher valuethan fresh and brine-frozen shrimp.42
• Extent of Processes Used to Transform Downstream Product into Upstream Product. The basicprocessing needed to transform fresh shrimp to processed shrimp – freezing and deheading – canbe and is performed directly on the vessel. Processors use a variety of cleaning, weighing, andsorting equipment, as well as blast freezers, to further process frozen, shell-on shrimp.43
Conclusion. Based on the record in these preliminary phase investigations and on application of
the semifinished products like product analysis, we include fresh shrimp in the same domestic likeproduct as frozen shrimp, whether frozen on board a vessel or further processed suitable for commercialuse or sale. Fresh shrimp is overwhelmingly sold in a processed form, and the initial stages of processingdo not significantly change the physical characteristics and uses of the product and appear to add at mostmoderate value to the product. Based on these factors, we define a single domestic like product
37 (...continued)separate markets for the upstream and downstream articles; (3) differences in the physical characteristics andfunctions of the upstream and downstream articles; (4) differences in the costs or value of the verticallydifferentiated articles; and (5) the significance and extent of the processes used to transform the upstream into thedownstream articles. E.g., Crystalline Silicon Photovoltaic Cells and Modules from China, Inv. Nos. 701-TA-481and 731-TA-1190 (Preliminary), USITC Pub. 4295 at 10, n.47 (Dec. 2011); Drill Pipe and Drill Collars from China,Inv. Nos. 701-TA-474 and 731-TA-1176 (Preliminary), USITC Pub. 4127 at 7 (Mar. 2010) (involving green tubesand finished drill pipe); Live Swine from Canada, Inv. No. 731-TA-1076 (Final), USITC Pub. 3766 at 8, n.40 (Apr.2005); Certain Frozen Fish Fillets from Vietnam, Inv. No. 731-TA-1012 (Preliminary), USITC Pub. 3533 at 7 (Aug.2002).
38 See 2004 Preliminary Determinations, USITC Pub. 3672 at 14-15 (2004).
39 AHSIC’s Postconference Brief at 5, referring to Petitioner’s January 15, 2012 Submission to Commerce andthe USITC.
40 See generally CR at I-13-14; PR at I-11-12.
41 See generally CR at I-14-15; PR at I-12-13.
42 AHSIC’s Postconference Brief at 12, calculated from Petition at I-33 and I-45. In the 2004 preliminaryantidumping duty determination, the Commission found that the price the processor receives for a processed frozenheadless shell-on product is approximately 25 to 40 percent more than the price the vessel receives at the dock forthe same size shrimp product. USITC Pub. 3672 at 15.
43 See generally CR at I-13-14; PR at I-11-12.
10

encompassing both fresh warmwater shrimp and the frozen warmwater shrimp described in the scopedefinition.
IV. DOMESTIC INDUSTRY
The domestic industry is defined as the domestic “producers as a whole of a domestic likeproduct, or those producers whose collective output of a domestic like product constitutes a majorproportion of the total domestic production of the product.”44 In defining the domestic industry, theCommission’s general practice has been to include in the industry producers of all domestic production ofthe like product, whether toll-produced, captively consumed, or sold in the domestic merchant market.45
We must determine whether any producer of the domestic like product should be excluded fromthe domestic industry pursuant to 19 U.S.C. § 1677(4)(B). Subsection 1677(4)(B) allows theCommission, if appropriate circumstances exist, to exclude from the domestic industry producers that arerelated to an exporter or importer of subject merchandise or which are themselves importers.46 Exclusionof such a producer is within the Commission’s discretion based upon the facts presented in eachinvestigation.47
44 19 U.S.C. § 1677(4)(A).
45 In the prior antidumping duty investigations and reviews, the Commission found that processing activities suchas deheading, grading, machine peeling, deveining, and cooking were all sufficient activities to constitute domesticproduction because these operations typically each required specialized equipment and added more value to theprocess than any preceding stage. By contrast, the Commission found that marinating and skewering did notconstitute domestic production because they involved no specialized equipment and added relatively modest value tothe processed shrimp product. Finally, the Commission found that breading could not constitute domesticproduction activity because breaded shrimp was not part of the domestic like product in the prior antidumping dutyinvestigations and reviews. Antidumping Duty Final Determinations, USITC Pub. 3748 at 12-13; 2011 ReviewDeterminations, USITC Pub. 4221 at 8-9. The record does not indicate any change in the nature of shrimpprocessing since the time of the antidumping duty investigations and reviews. CR at I-14-16; PR at I-12-13. Petitioner agrees with the findings that the Commission made in the prior investigations and reviews, andRespondents have not addressed the issue. Conf. Tr. at 77. Thus, we make the same findings as we did in the priorantidumping duty investigations and reviews concerning what shrimp processing activities constitute domesticproduction. Based on these findings, we find that all responding firms engage in sufficient production-relatedactivities to be considered domestic producers.
46 19 U.S.C. § 1677(4)(B).
47 The primary factors the Commission has examined in deciding whether appropriate circumstances exist toexclude a related party include the following: (1) the percentage of domestic production attributable to the importingproducer; (2) the reason the U.S. producer has decided to import the product subject to investigation, i.e., whetherthe firm benefits from the LTFV sales or subsidies or whether the firm must import in order to enable it to continueproduction and compete in the U.S. market; and (3) the position of the related producer vis-a-vis the rest of theindustry, i.e., whether inclusion or exclusion of the related party will skew the data for the rest of the industry. See,e.g., Torrington Co. v. United States, 790 F. Supp. 1161 (Ct. Int’l Trade 1992), aff’d mem., 991 F.2d 809 (Fed. Cir.1993). The Commission has also considered the ratio of import shipments to U.S. production for related producersand whether the primary interest of the related producer lies in domestic production or importation. These latter twoconsiderations were cited as appropriate factors in Allied Mineral Products, Inc. v. United States, 28 CIT 1861, 1865(2004) (“The most significant factor considered by the Commission in making the ‘appropriate circumstances’determination is whether the domestic producer accrued a substantial benefit from its importation of the subjectmerchandise.”); USEC, Inc. v. United States, 132 F. Supp. 2d 1, 12 (Ct. Int’l Trade 2001) (“the provision’s purposeis to exclude from the industry headcount domestic producers substantially benefitting from their relationships withforeign exporters.”), aff’d, 34 Fed. Appx. 725 (Fed. Cir. 2002); S. Rep. No. 249, 96th Cong. 1st Sess. at 83 (1979)(“where a U.S. producer is related to a foreign exporter and the foreign exporter directs his exports to the United
(continued...)
11

One U.S. processor, Tampa Bay Fisheries, imported frozen shrimp directly from subject countriesduring the period of investigation.48 As such, it is a related party as defined by the statute.49 We find thatappropriate circumstances do not exist, however, to exclude Tampa Bay Fisheries from the domesticindustry.50
Tampa Bay Fisheries is the *** responding domestic processor, accounting for *** of thedomestic industry’s shipments in 2011.51 Its imports of subject merchandise were relatively *** as ashare of its domestic production during the period of investigation. Tampa Bay Fisheries’ domesticproduction *** in 2011.52 Its imports of subject merchandise, which were primarily from China andIndonesia, *** in 2011.53 Its annual ratios of subject imports to production *** in 2011.54 Tampa BayFisheries stated at the staff conference that the domestic suppliers cannot provide the amount of shrimpthat it needs or generally supply the peeled shrimp which is required by its customers.55 Tampa BayFisheries *** the petitions.56 Relative to the overall operating income margin for reporting domestic
47 (...continued)States so as not to compete with his related U.S. producer, this should be a case where the ITC would not considerthe related U.S. producer to be a part of the domestic industry”).
48 CR at III-10 and Table III-9; PR at III-9 and Table III-9. Tampa Bay Fisheries is a production company that,along with its sister companies, is part of one of the largest private-owned shrimp importing and processing groupsin the United States. CR at III-10; PR at III-9.
49 Fourteen other U.S. processors did not import subject merchandise directly, but did purchase such merchandise. CR/PR at Table III-9. The Commission has previously concluded that a purchaser may be treated as a related partyif it controls large volumes of subject imports. The Commission has found such control to exist when the domesticproducer was responsible for a predominant proportion of an importer’s purchases and these purchases weresubstantial. See, e.g., Foundry Coke from China, Inv. No. 731-TA-891 (Final), USITC Pub. 3449 at 8-9 (Sept.2001). Most of the processors that purchased subject merchandise did so in small amounts. Although total annualimports from subject sources were at least 894 million pounds during each year of the period of investigation,CR/PR at Table IV-2, only one of these 14 processors purchased as much as two million pounds of imports in acalendar year. *** purchased *** in 2009 and 2010, but only *** in 2011. CR at Table III-9. The recordconsequently indicates that neither *** nor any of the other 13 processors is responsible for a predominant portion ofany importer’s purchases. Accordingly, we find that none of the processors that purchased subject merchandisewarrants treatment as a related party.
50 No party has addressed the related party issue.
51 CR/PR at Table III-2.
52 CR/PR at Table III-9.
53 CR/PR at Tables III-9 and IV-1. Tampa Bay Fisheries also purchased subject imports throughout the period:*** in interim 2012. CR/PR at Table III-9. Its purchases in 2011 represented about *** of total subject imports inthat year. CR/PR at Tables III-9 and IV-2.
54 CR/PR at Table III-9.
55 CR/PR at Table III-9 n.4, and Conf. Tr. at 115-116.
56 CR/PR at Table III-2.
12

processors during the period of investigation, Tampa Bay’s operating margin was ***.57 58 59 In view ofthe foregoing, specifically its relatively small and declining ratio of subject imports to production, whichindicates its principal interest lies in domestic production, and the fact that no party has argued for itsexclusion from the domestic industry, we find that appropriate circumstances do not exist to excludeTampa Bay Fisheries as a related party for purposes of the preliminary phase of the investigations.
Accordingly, in light of the definition of the domestic like product and the foregoing analysis, wedefine a single domestic industry encompassing all warmwater shrimp fishermen and processors ofwarmwater shrimp.60
V. CUMULATION61
For purposes of evaluating the volume and effects for a determination of whether there is areasonable indication of material injury by reason of subject imports, section 771(7)(G)(i) of the TariffAct requires the Commission to cumulate subject imports from all countries as to which petitions werefiled and/or investigations self-initiated by Commerce on the same day, if such imports compete witheach other and with the domestic like product in the U.S. market.62 In assessing whether subject imports
57 USITC auditor notes (preliminary phase), attachment A (processors included in financial results).
58 Consistent with her practice in past investigations and reviews, Commissioner Aranoff does not rely onindividual-company operating income margins, which reflect a domestic producer’s financial operations related toproduction of the domestic like product, in assessing whether a related party has benefitted from importation ofsubject merchandise. Rather, she determines whether to exclude a related party based principally on its ratio ofsubject imports to domestic production and whether its primary interests lie in domestic production or importation.
59 For purposes of the preliminary phase of these investigations, Commissioner Pinkert does not rely upon anyrelated producer’s financial performance in determining whether there are appropriate circumstances to exclude itfrom the domestic industry. In his view, the present record is not sufficient to link the producer’s profitability on itsU.S. operations to any specific benefit it derives from its related party status.
60 While there is limited U.S. farm production and no U.S. shrimp farming entities responded to theCommission’s questionnaire, U.S. shrimp farm producers would also be included in the domestic industry. Duringthe period of investigation, farm-raised shrimp production accounted for 1.0 percent to 1.6 percent of domesticproduction. Calculated from CR/PR at Table IV-4 (revised).
61 Negligibility under 19 U.S.C. § 1677(24) is not an issue in these investigations. The official import statisticsindicate that subject imports as a share of the volume of all such merchandise imported into the United States exceedthe requisite statutory negligibility thresholds. CR/PR at Table IV-3. In the case of countervailing dutyinvestigations involving developing countries (as designated by the U.S. Trade Representative), the statute indicatesthat the negligibility limits are 4 percent and 9 percent, rather than 3 percent and 7 percent applicable to otherimports. 19 U.S.C. § 1677 (24)(B). Ecuador, Malaysia and Thailand have been designated as developing countries,and India and Indonesia have been designated as least developed countries by the U.S. Trade Representative. Thus,imports from these five subject countries are subject to the 4 percent and 9 percent negligibility limits in theseinvestigations. 15 C.F.R. § 2013.1 (regarding negligible import standards for definition of “Developing Country”under 19 U.S.C. § 1677(36)(A) and definition of “Least Developed Country” under 19 U.S.C. § 1677(36)(B)).
For the 12-month period of December 2011 to November 2012, imports from China and Vietnam (governedby the 3 percent statutory negligible standard) accounted for 3.2 percent and 8.3 percent, respectively, of totalimports of frozen shrimp, as measured by quantity. CR/PR at Table IV-3. For the 12-month period of December2011 to November 2012, imports from Ecuador, India, Indonesia, Malaysia, and Thailand (governed by the 4 percentstatutory negligible standard) accounted for 15.7 percent, 13.2 percent 15.2 percent, 4.4 percent, and 27.2 percent,respectively, of total imports of frozen shrimp, as measured by quantity. CR/PR at Table IV-3. We thereforeconclude that subject imports from all seven countries are not negligible.
62 19 U.S.C. § 1677(7)(G)(i).
13
compete with each other and with the domestic like product, the Commission generally has consideredfour factors:
(1) the degree of fungibility between subject imports from different countries and betweensubject imports and the domestic like product, including consideration of specificcustomer requirements and other quality-related questions;(2) the presence of sales or offers to sell in the same geographic markets of subjectimports from different countries and the domestic like product;(3) the existence of common or similar channels of distribution for subject importsfrom different countries and the domestic like product; and(4) whether the subject imports are simultaneously present in the market.63
While no single factor is necessarily determinative, and the list of factors is not exclusive, thesefactors are intended to provide the Commission with a framework for determining whether the subjectimports compete with each other and with the domestic like product.64 Only a “reasonable overlap” ofcompetition is required.65
Petitioner contends that each of the four factors supports cumulation of imports from the sevencountries subject to these investigations.66 Respondents do not contest (and with the exception of theEcuador Respondent do not address) the issue of cumulation.67
The threshold requirement for cumulation is satisfied because Petitioner filed the countervailingduty petitions with respect to all seven countries on the same day, December 28, 2012.68 In addition,none of the statutory exceptions to cumulation applies. As discussed below, we find a reasonable overlapof competition among subject imports from all seven countries and between subject imports from eachsource and the domestic like product.69
63 See Certain Cast-Iron Pipe Fittings from Brazil, the Republic of Korea, and Taiwan, Inv. Nos. 731-TA-278-280 (Final), USITC Pub. 1845 (May 1986), aff’d, Fundicao Tupy, S.A. v. United States, 678 F. Supp. 898 (Ct.Int’l Trade), aff’d, 859 F.2d 915 (Fed. Cir. 1988).
64 See, e.g., Wieland Werke, AG v. United States, 718 F. Supp. 50 (Ct. Int’l Trade 1989).
65 The Statement of Administrative Action to the Uruguay Round Agreements Act, H.R. Rep. No. 103-316(1994) (“SAA”) expressly states that “the new section will not affect current Commission practice under which thestatutory requirement is satisfied if there is a reasonable overlap of competition.” H.R. Doc. No. 103-316, Vol. I at848 (citing Fundicao Tupy, S.A. v. United States, 678 F. Supp. 898, 902 (Ct. Int'l Trade 1988)), aff’d, 859 F.2d 915(Fed. Cir. 1988); see Goss Graphic Sys., Inc. v. United States, 33 F. Supp. 2d 1082, 1087 (Ct. Int’l Trade 1998)(“cumulation does not require two products to be highly fungible”); Wieland Werke, AG, 718 F. Supp. at 52(“Completely overlapping markets are not required.”).
66 Petitioner’s Postconference Brief at 10-13.
67 The Ecuador Respondent indicates that for purposes of this preliminary phase only, it “does not opposecumulation. However, the Chamber reserves its right to contest cumulation of Ecuadorian imports in the final phaseif the Commerce Department finds countervailable subsidy margins (which we strongly doubt will happen).” Ecuador Respondent’s Postconference Brief at 7. In addition, the Rubicon Group does not mention cumulation forpurposes of the Commission’s present material injury analysis, but explicitly assumes cumulation for purposes of theCommission’s threat analysis in alleging that “[c]umulated subject imports do not threaten the domestic industrywith material injury.” Rubicon Group’s Postconference Brief at 21.
68 CR/PR at I-1; see 19 U.S.C. § 1677(7)(G)(i).
69 In the original antidumping duty investigations and subsequent five-year reviews involving subject importsfrom four of the subject countries in these countervailing duty investigations (China, India, Thailand and Vietnam),the Commission found a reasonable overlap of competition; the original investigations also included subject importsfrom Ecuador. Specifically, the Commission found clear overlaps in channels of distribution and geographic
(continued...)
14

Fungibility. The record in these investigations indicates that there is a moderate degree ofsubstitutability between U.S.-produced frozen shrimp and that imported from subject countries.70 Mostresponding domestic processors reported that subject imports from all subject countries are “always” or“frequently” used interchangeably with each other and with the domestic like product.71 While mostresponding importers reported that subject imports are “sometimes” or “frequently” used interchangeablywith each other and with the domestic like product, there also were a number of importers reporting thesubject imports and U.S. product are “never” interchangeable.72 Factors cited as limitinginterchangeability include differences between wild-caught and farm-raised shrimp; species of shrimp;size, flavor and texture of shrimp; type of processing; country of origin; and other factors.73 When askedwhether differences other than price are ever significant to purchasers in choosing between shrimp fromsubject countries and from the United States, a plurality of responding domestic processors reported“never.”74 Responding importers were divided on the question, with a plurality reporting that differencesother than price are “always” significant between the U.S. product and subject sources, but only“sometimes” between subject sources.75
Geographic Overlap. Both U.S. producers and importers reported selling frozen shrimp to allregions in the contiguous United States during the period of investigation.76 Thus, frozen shrimp from allsources served a nationwide market.
Channels of Distribution. Both the domestic like product and the subject imports are sold todistributors, end users, and retail/institutional customers such as grocers and restaurants. While themajority of domestically produced product and subject imports from China is sold to distributors and themajority of subject imports from the other six countries is sold to retail/institutional customers, the shareto each channel of distribution has varied between countries and changed over the period ofinvestigation.77
Simultaneous presence. During the period of investigation, subject imports from all sevencountries entered the United States in every month and the domestic industry reported selling in everyquarter.78 Therefore, frozen shrimp from all sources was simultaneously present in the U.S. market duringthe period of investigation.
For the foregoing reasons, we cumulate subject imports from China, Ecuador, India, Indonesia,Malaysia, Thailand, and Vietnam for purposes of our analysis of whether there is a reasonable indicationof material injury to the domestic industry by reason of subject imports.
69 (...continued)presence and a general perception among market participants of at least some degree of interchangeability betweenthe domestic like product and the subject imports. Antidumping Duty Final Determinations, USITC Pub. 3748 at19-21; 2011 Review Determinations, USITC Pub. 4221 at 15 and 16.
70 CR at II-14; PR at II-11.
71 CR/PR at Table II-6.
72 CR/PR at Table II-6.
73 CR at II-17; PR at II-14.
74 CR/PR at Table II-7.
75 CR/PR at Table II-7.
76 CR at II-3 and Table II-2; PR at II-3 and Table II-2.
77 CR/PR at Table II-1.
78 CR at IV-8-9; PR at IV-8; CR/PR at Tables V-1 to V-4.
15

VI. REASONABLE INDICATION OF MATERIAL INJURY BY REASON OF SUBJECTIMPORTS
A. Legal Standard
In the preliminary phase of antidumping or countervailing duty investigations, the Commissiondetermines whether there is a reasonable indication that an industry in the United States is materiallyinjured or threatened with material injury by reason of the imports under investigation.79 In making thisdetermination, the Commission must consider the volume of subject imports, their effect on prices for thedomestic like product, and their impact on domestic producers of the domestic like product, but only inthe context of U.S. production operations.80 The statute defines “material injury” as “harm which is notinconsequential, immaterial, or unimportant.”81 In assessing whether there is a reasonable indication thatthe domestic industry is materially injured by reason of subject imports, we consider all relevanteconomic factors that bear on the state of the industry in the United States.82 No single factor isdispositive, and all relevant factors are considered “within the context of the business cycle andconditions of competition that are distinctive to the affected industry.”83
Although the statute requires the Commission to determine whether there is a reasonableindication that the domestic industry is “materially injured by reason of” unfairly traded imports,84 it doesnot define the phrase “by reason of,” indicating that this aspect of the injury analysis is left to theCommission’s reasonable exercise of its discretion.85 In identifying a causal link, if any, between subjectimports and material injury to the domestic industry, the Commission examines the facts of record thatrelate to the significance of the volume and price effects of the subject imports and any impact of thoseimports on the condition of the domestic industry. This evaluation under the “by reason of” standardmust ensure that subject imports are more than a minimal or tangential cause of injury and that there is asufficient causal, not merely a temporal, nexus between subject imports and material injury.86
In many investigations, there are other economic factors at work, some or all of which may alsobe having adverse effects on the domestic industry. Such economic factors might include nonsubjectimports; changes in technology, demand, or consumer tastes; competition among domestic producers; or
79 19 U.S.C. §§ 1671b(a), 1673b(a).
80 19 U.S.C. § 1677(7)(B)( i). The Commission “may consider such other economic factors as are relevant to thedetermination,” but shall “identify each {such} factor ... {a}nd explain in full its relevance to the determination.” 19 U.S.C. § 1677(7)(B).
81 19 U.S.C. § 1677(7)(A).
82 19 U.S.C. § 1677(7)(C)(iii).
83 19 U.S.C. § 1677(7)(C)(iii).
84 19 U.S.C. §§ 1671b(a), 1673b(a).
85 Angus Chemical Co. v. United States, 140 F.3d 1478, 1484-85 (Fed. Cir. 1998) (“{T}he statute does not‘compel the commissioners’ to employ {a particular methodology}.”), aff’g 944 F. Supp. 943, 951 (Ct. Int’l Trade1996).
86 The United States Court of Appeals for the Federal Circuit (“ Federal Circuit”), in addressing the causationstandard of the statute, observed that “{a}s long as its effects are not merely incidental, tangential, or trivial, theforeign product sold at less than fair value meets the causation requirement.” Nippon Steel Corp. v. USITC, 345F.3d 1379, 1384 (Fed. Cir. 2003). This was further ratified in Mittal Steel Point Lisas Ltd. v. United States, 542F.3d 867, 873 (Fed. Cir. 2008), where the Federal Circuit, quoting Gerald Metals, Inc. v. United States, 132 F.3d716, 722 (Fed. Cir. 1997), stated that “this court requires evidence in the record ‘to show that the harm occurred “byreason of” the LTFV imports, not by reason of a minimal or tangential contribution to material harm caused byLTFV goods.’” See also Nippon Steel Corp. v. United States, 458 F.3d 1345, 1357 (Fed. Cir. 2006); TaiwanSemiconductor Industry Ass’n v. USITC, 266 F.3d 1339, 1345 (Fed. Cir. 2001).
16

management decisions by domestic producers. The legislative history explains that the Commission mustexamine factors other than subject imports to ensure that it is not attributing injury from other factors tothe subject imports, thereby inflating an otherwise tangential cause of injury into one that satisfies thestatutory material injury threshold.87 In performing its examination, however, the Commission need notisolate the injury caused by other factors from injury caused by unfairly traded imports.88 Nor does the“by reason of” standard require that unfairly traded imports be the “principal” cause of injury orcontemplate that injury from unfairly traded imports be weighed against other factors, such as nonsubjectimports, which may be contributing to overall injury to an industry.89 It is clear that the existence ofinjury caused by other factors does not compel a negative determination.90
Assessment of whether material injury to the domestic industry is “by reason of” subject imports“does not require the Commission to address the causation issue in any particular way,” as long as “theinjury to the domestic industry can reasonably be attributed to the subject imports” and the Commission“ensure{s} that it is not attributing injury from other sources to the subject imports.”91 92 Indeed, the
87 SAA at 851-52 (1994) (“{T}he Commission must examine other factors to ensure that it is not attributinginjury from other sources to the subject imports.”); S. Rep. 96-249 at 75 (1979) (the Commission “will considerinformation which indicates that harm is caused by factors other than less-than-fair-value imports.”); H.R. Rep.96-317 at 47 (1979) (“in examining the overall injury being experienced by a domestic industry, the ITC will takeinto account evidence presented to it which demonstrates that the harm attributed by the petitioner to the subsidizedor dumped imports is attributable to such other factors;” those factors include “the volume and prices ofnonsubsidized imports or imports sold at fair value, contraction in demand or changes in patterns of consumption,trade restrictive practices of and competition between the foreign and domestic producers, developments intechnology and the export performance and productivity of the domestic industry”); accord Mittal Steel, 542 F.3d at877.
88 SAA at 851-52 (“{T}he Commission need not isolate the injury caused by other factors from injury caused byunfair imports.”); Taiwan Semiconductor Industry Ass’n v. USITC, 266 F.3d 1339, 1345 (Fed. Cir. 2001) (“{T}heCommission need not isolate the injury caused by other factors from injury caused by unfair imports ... . Rather, theCommission must examine other factors to ensure that it is not attributing injury from other sources to the subjectimports.” (emphasis in original)); Asociacion de Productores de Salmon y Trucha de Chile AG v. United States, 180F. Supp. 2d 1360, 1375 (Ct. Int’l Trade 2002) (“{t}he Commission is not required to isolate the effects of subjectimports from other factors contributing to injury” or make “bright-line distinctions” between the effects of subjectimports and other causes.); see also Softwood Lumber from Canada, Inv. Nos. 701-TA-414 and 731-TA-928(Remand), USITC Pub. 3658 at 100-01 (Dec. 2003) (Commission recognized that “{i}f an alleged other factor isfound not to have or threaten to have injurious effects to the domestic industry, i.e., it is not an ‘other causal factor,’then there is nothing to further examine regarding attribution to injury”), citing Gerald Metals, Inc. v. United States,132 F.3d 716, 722 (Fed. Cir. 1997) (the statute “does not suggest that an importer of LTFV goods can escapecountervailing duties by finding some tangential or minor cause unrelated to the LTFV goods that contributed to theharmful effects on domestic market prices.”).
89 S. Rep. 96-249 at 74-75; H.R. Rep. 96-317 at 47.
90 See Nippon Steel Corp., 345 F.3d at 1381 (“an affirmative material-injury determination under the statuterequires no more than a substantial-factor showing. That is, the ‘dumping’ need not be the sole or principal cause ofinjury.”).
91 Mittal Steel, 542 F.3d at 877-78; see also id. at 873 (“While the Commission may not enter an affirmativedetermination unless it finds that a domestic industry is materially injured ‘by reason of’ subject imports, theCommission is not required to follow a single methodology for making that determination ... . {and has} broaddiscretion with respect to its choice of methodology.”) citing United States Steel Group v. United States, 96 F.3d1352, 1362 (Fed. Cir. 1996) and S. Rep. 96-249 at 75.
92 Commissioner Pinkert does not join this paragraph or the following three paragraphs. He points out that theFederal Circuit, in Bratsk, 444 F.3d 1369, and Mittal Steel, held that the Commission is required, in certaincircumstances when considering present material injury, to undertake a particular kind of analysis of nonsubject
(continued...)
17

Federal Circuit has examined and affirmed various Commission methodologies and has disavowed “rigidadherence to a specific formula.”93
The Federal Circuit’s decisions in Gerald Metals, Bratsk, and Mittal Steel all involved caseswhere the relevant “other factor” was the presence in the market of significant volumes of price-competitive nonsubject imports. The Commission interpreted the Federal Circuit’s guidance in Bratsk asrequiring it to apply a particular additional methodology following its finding of material injury in casesinvolving commodity products and a significant market presence of price-competitive nonsubjectimports.94 The additional “replacement/benefit” test looked at whether nonsubject imports might havereplaced subject imports without any benefit to the U.S. industry. The Commission applied that specificadditional test in subsequent cases, including the Carbon and Certain Alloy Steel Wire Rod from Trinidadand Tobago determination that underlies the Mittal Steel litigation.
Mittal Steel clarifies that the Commission’s interpretation of Bratsk was too rigid and makes clearthat the Federal Circuit does not require the Commission to apply an additional test nor any one specificmethodology; instead, the court requires the Commission to have “evidence in the record ‘to show thatthe harm occurred ‘by reason of’ the LTFV imports,’” and requires that the Commission not attributeinjury from nonsubject imports or other factors to subject imports.95 Accordingly, we do not considerourselves required to apply the replacement/benefit test that was included in Commission opinionssubsequent to Bratsk.
The progression of Gerald Metals, Bratsk, and Mittal Steel clarifies that, in cases involvingcommodity products where price-competitive nonsubject imports are a significant factor in the U.S.market, the Court will require the Commission to give full consideration, with adequate explanation, tonon-attribution issues when it performs its causation analysis.
The question of whether the material injury threshold for subject imports is satisfiednotwithstanding any injury from other factors is factual, subject to review under the substantial evidencestandard. Congress has delegated this factual finding to the Commission because of the agency’sinstitutional expertise in resolving injury issues.96
92 (...continued)imports, albeit without reliance on presumptions or rigid formulas. Mittal Steel explains as follows:
What Bratsk held is that “where commodity products are at issue and fairly traded, price-competitive,nonsubject imports are in the market,” the Commission would not fulfill its obligation to consider animportant aspect of the problem if it failed to consider whether nonsubject or non-LTFV imports wouldhave replaced LTFV subject imports during the period of investigation without a continuing benefit to thedomestic industry. 444 F.3d at 1369. Under those circumstances, Bratsk requires the Commission toconsider whether replacement of the LTFV subject imports might have occurred during the period ofinvestigation, and it requires the Commission to provide an explanation of its conclusion with respect tothat factor.
542 F.3d at 878.
93 Nucor Corp. v. United States, 414 F.3d 1331, 1336, 1341 (Fed. Cir. 2005); see also Mittal Steel, 542 F.3d at879 (“Bratsk did not read into the antidumping statute a Procrustean formula for determining whether a domesticinjury was ‘by reason’ of subject imports.”).
94 Mittal Steel, 542 F.3d at 875-79.
95 Mittal Steel, 542 F.3d at 873 (quoting from Gerald Metals, 132 F.3d at 722), 875-79 & n.2 (recognizing theCommission’s alternative interpretation of Bratsk as a reminder to conduct a non-attribution analysis).
96 Mittal Steel, 542 F.3d at 873; Nippon Steel Corp., 458 F.3d at 1350, citing U.S. Steel Group, 96 F.3d at 1357;S. Rep. 96-249 at 75 (“The determination of the ITC with respect to causation is ... complex and difficult, and is amatter for the judgment of the ITC.”).
18

B. Conditions of Competition and the Business Cycle
The following conditions of competition inform our analysis of whether there is a reasonableindication of material injury by reason of cumulated subject imports from China, Ecuador, India,Indonesia, Malaysia, Thailand, and Vietnam.
1. Demand Conditions
Apparent U.S. consumption of warmwater shrimp fluctuated within a relatively narrow rangeduring the period of investigation. Apparent U.S. consumption was 1.28 billion pounds in 2009, declinedto 1.25 billion pounds in 2010, and increased to 1.30 billion pounds in 2011.97 Apparent U.S.consumption of *** during January-August 2012 was less than the 776 million pounds during January-August 2011.98
As was the case in the prior investigations and reviews, warmwater shrimp continues to be usedprincipally in meal preparations. Demand for the product comes from retail sellers of both prepared andunprepared warmwater shrimp, such as grocers and restaurants.99 The market tendency is for large shrimp(less than 36 per pound, heads-off, shell-on basis) to be sold raw and frozen to restaurants, hotels, andother food institutions; for small to medium shrimp (36-60 per pound) to be breaded, canned or sold atretail (e.g., supermarkets); and for extra small (61 to 70 per pound) and tiny shrimp (more than 70 perpound) to be used by canners, dryers, and producers of specialty products.100 Between 2009 and 2011,U.S. consumption of shrimp per capita ranged from 4.0 pounds to 4.2 pounds.101
Domestic processors’ and U.S. importers’ perceptions of changes in U.S. demand during theperiod of investigation were mixed.102 As previously stated, apparent U.S. consumption fluctuated fromyear to year, but was basically stable from 2009 to 2011. Firms reported that the demand for frozenshrimp declined because of the recession and the April 20, 2010 “Deepwater Horizon” incident in theGulf of Mexico (the “Gulf Oil Spill”),103 while increased demand was driven by the reported healthbenefits of eating seafood/shrimp (a low-fat food).104
97 CR/PR at Table IV-5 (revised).
98 CR/PR at Table IV-5 (revised). Because NOAA Fisheries Service data on domestic shipments are availableonly through August 2012, partial year data on apparent U.S. consumption and market share have been calculated ona January-August basis. See CR/PR at Tables IV-4 and IV-5, as revised in INV-LL-014 (Feb. 5, 2013). By contrast,interim period data collected in the Commission questionnaires are reported on a January-September basis.
99 CR at II-11; PR at II-9. In the prior antidumping duty investigations, it was estimated that 80 percent of shrimpin the U.S. market are bought by restaurants. CR at I-13; PR at I-11.
100 CR at I-12; PR at I-11.
101 CR at I-12; PR at I-11.
102 CR/PR at Table II-4; Petitioner’s Postconference Brief at 14-16; Ecuador Respondents’ Postconference Briefat 9, 10, 18 and Exhibit 5; Rubicon Group’s Postconference Brief at 10-11.
103 Respondents argue that demand for domestic shrimp continues to be affected by oil-spill related concerns. See, e.g., Indonesian Respondents’ Postconference Brief at 28-30.
104 CR at II-12; PR at II-9.
19
2. Supply Conditions
Domestically produced shrimp is overwhelmingly wild-caught (ocean-harvested).105 Harvestingtakes place in the waters of the Gulf of Mexico and off the Atlantic Coast from the Carolinas to Florida.106 In the United States, the main fishing season is from May to December, with different times of the yearbetter for different species of shrimp.107 During the off season (roughly January through April), fishermenmake repairs and upgrades, and U.S. processors make sales from inventory. Historically, prices havebeen higher when the supply of both fresh and frozen shrimp is lower, such as in the off season.108 Phenomena that affect the waters in which shrimp is harvested and in the coastal areas where fishingboats are docked and processing plants are located will also affect the supply of the domestic like product. Processors reported that hurricanes and other weather-related problems, pollution-caused diseases, and“black gill” disease affected the shrimp harvest and consequently the supply of frozen shrimp.109 Additionally, areas in the Gulf were closed to fishing for various periods of time in 2010 because of theGulf Oil Spill; most U.S. processors said the spill both reduced supply and undermined demand, whileBritish Petroleum (“BP”)’s willingness to pay for losses and its hiring of boats for the clean-up effortreduced the number of boats engaged in shrimping.110
Petitioner acknowledges that the domestic industry cannot harvest sufficient shrimp to satisfyU.S. demand.111 Indeed, during the period of investigation, the domestic industry supplied between 9.6percent and 12.5 percent of apparent U.S. consumption on an annual basis.112 That is substantially lessthan the share supplied by subject imports and slightly less than the share supplied by nonsubjectimports.113
Shrimp imported from subject sources is generally farm-raised; shrimp of many different speciescan be farmed, and shrimp farms generally are designed principally to produce shrimp for export.114
105 CR at II-1 and II-8; PR at II-1 and II-6.
106 CR/PR at II-3.
107 CR at II-5; PR at II-4.
108 CR at II-5-6; PR at II-4-5.
109 CR at II-8; PR at II-6.
110 CR at II-8; PR at II-6. In the prior antidumping duty reviews, there was evidence that in June 2010, as muchas 36.6 percent of the Gulf of Mexico was closed to fishing due to the Gulf Oil Spill, with the closures encompassingonly 0.4 percent of the Gulf by November 2010. USITC Pub. 4221 at II-5, n.10. During this period, a largepercentage of the Gulf shrimping fleet received payments from BP either for assistance in the Gulf clean-up or ascompensation for damages. Because boats used in the clean-up effort were not shrimping, supply was lower butprices were higher for domestically harvested shrimp. Id. at II-5, n.12.
111 Petitioner’s Postconference Brief at 18-19. As the Commission previously has noted, "there is no short supplyprovision in the statute" and "the fact that the domestic industry may not be able to supply all of demand does notmean the industry may not be materially injured or threatened with material injury by reason of subject imports." Softwood Lumber from Canada, Inv. Nos. 701-TA-414 and 731-TA-928 (Remand), USITC Pub. 3658 at 108, n.310(Dec. 2003); see also Small Diameter Graphite Electrodes from China, Inv. No. 731-TA-1143 (Final), USITC Pub.4062 at 22-23 (Feb. 2009); Sodium Hexametaphosphate from China, Inv. No. 731-TA-1110 (Final), USITC Pub.3984 at 27 n.109 (Mar. 2008).
112 CR/PR at Table IV-5 (revised).
113 CR/PR at Table IV-5 (revised).
114 CR at II-8; PR at II-6. Imports of shrimp from nonsubject sources are available both as farmed and wild-caught; Mexico, the largest nonsubject source of imports, provides wild-caught shrimp with the same seasonalsupply period as U.S. product. Id. at II-11; PR at II-8-9.
20

Respondents describe the subject imports as having year-round availability, although some reportedseasonality in particular sizes or species.115
Subject imports supplied the majority of apparent U.S. consumption and an increasing share ofconsumption during the period of investigation, ranging from 70.0 percent to 76.6 percent of the U.S.market on an annual basis.116 Imports from four of the subject countries (China, India, Thailand, andVietnam) were covered by antidumping duty orders during the period of investigation.117
Nonsubject sources supplied a declining share of the U.S. market, with their share declining from17.5 percent in 2009 to 13.8 percent in 2010 and 13.5 percent in 2011; they were 11.7 percent of themarket in January-August 2011 and *** percent in January-August 2012.118 The largest sources ofnonsubject imports during January 2009-September 2012 were Mexico, Honduras, Peru, and Guyana;these countries collectively accounted for 61.7 percent of nonsubject imports during that period.119
3. Substitutability120
The parties have expressed divergent views on the substitutability of the domestic like productand the subject imports, with Petitioner arguing that the products are at least moderately substitutable121
and Respondents arguing that any competition between the domestic like product and the subject importsis attenuated.122 As noted in the discussion of cumulation, U.S. processors and importers provided
115 CR at II-6 and n.9; PR at II-5 and n.9.
116 CR/PR at Table IV-5 (revised).
117 The antidumping duty orders covering imports from Ecuador were revoked with respect to all producers onAugust 15, 2007. 72 Fed. Reg. 48257 (Aug. 23, 2007). The order on subject imports from India was revoked withrespect to producer Devi effective February 1, 2009. 75 Fed. Reg. 41813 (July 19, 2010). The order on subjectimports from Thailand was revoked with respect to multiple producers effective January 16, 2009. See 75 Fed. Reg.27299, 27300 (May 14, 2010). The United States also maintains an antidumping duty order on imports of frozenwarmwater shrimp from Brazil, CR at I-4; PR at I-3, but imports from Brazil are not subject to these countervailingduty investigations.
118 CR/PR at Table IV-5 (revised).
119 CR at II-11; PR at II-9.
120 Commissioner Pearson does not join this section of these Views. See Dissenting Views of CommissionerDaniel R. Pearson.
121 Petitioner’s Postconference Brief at 20-26. Petitioner contends that imported and domestic product competeacross the market; for the same major purchasers, in retail, food service, and distribution; and across product forms,sizes, and types. In particular, it counters Respondents’ argument about sizing and product quality, long-termcontracts, military purchases of domestic shrimp, availability from domestic processors of certain types of value-added product (e.g., peeled and deveined, tail-on), and traceability from the point of harvest to consumption. Petitioner claims that the Commission has previously found that any differences that may exist between wild-caughtand farmed shrimp do not significantly limit substitutability and that changes in price of one type (farmed or wild-caught) always or usually affect prices of the other type.
122 Ecuador Respondents’ Postconference Brief at 11-13; Indian Respondents’ Postconference Brief at 5-6;Indonesian Respondents’ Brief at 7-15; Thai Respondents’ Postconference Brief at 5-10; Rubicon Group’sPostconference Brief at 4-10. Respondents argue that the domestic wild-caught shrimp and the imported farm-raisedshrimp are interchangeable only in the broadest sense, i.e., both forms can be cooked and eaten with little differencenoted in the taste by the average consumer, and that domestic wild-caught shrimp is not a substitute for the vastmajority of buyers. Thus, they argue competition between domestic and imported shrimp is attenuated for a widevariety of reasons, including differences between wild-caught and farm-raised shrimp; species of shrimp; size, flavorand texture of shrimp; degree of processing; country of origin; year-round vs. seasonal availability; contract vs. spotsales; ability to supply large volumes; individually quick frozen (IQF) vs. block-frozen forms; and other factors.
(continued...)
21

different general assessments of interchangeability, with U.S. processors overwhelmingly reporting thatthe domestic like product and imports from each subject country were always or frequentlyinterchangeable, and most responding importers reporting that the domestic like product and imports fromeach subject country were sometimes or frequently interchangeable.123
One distinction between the domestic like product and the subject imports is that the domesticlike product is overwhelmingly wild-caught, while the subject imports are predominantly farm-raised. However, the record does not indicate that this distinction, taken alone, significantly limits substitutabilitybetween the domestic like product and the subject imports.124 The record in these investigations also doesnot indicate clear distinctions in the markets or customers served by the domestic like product and thesubject imports. Both the domestic like product and the subject imports are available in every region ofthe country and through the same channels of distribution.125
The record indicates that the domestic industry supplies all major product forms. Although alarge proportion of domestic production is block-frozen product, the domestic industry has the capacity toproduce appreciable quantities of IQF product.126 The domestic industry also offers products in allpossible size ranges. Similarly, the record does not indicate any major product form that the subjectimports do not supply.127
We find that differences in product mix and availability among the subject imports and thedomestic like product limit to some extent the substitutability of warmwater shrimp from differentsources. Nevertheless, we do not perceive significant differences in availability or product range amongthe domestically produced and subject products. While the record in these investigations supports findingthat the products are at least moderate substitutes and that they compete for sales in the U.S. market, wewill seek more information in any final phase investigations, including purchaser responses to
122 (...continued)Rubicon Group’s Postconference Brief at 4; Thai Respondents’ Postconference Brief at 6-8; CR at II-17; PR at II-14.
123 CR/PR at Table II-6. In any final phase investigations, the Commission will collect information frompurchasers of frozen shrimp, who may purchase both the subject and domestic products and thus have first-handexperience with the products, concerning whether the products have the same end uses. For these preliminaryinvestigations, we also have considered information provided by purchasers in the 2011 antidumping duty five-yearreviews for some guidance about purchasers’ experiences regarding the substitutability of domestically producedwild-caught shrimp and imported farmed-raised shrimp. In those reviews, a majority of purchasers reported that thedomestic like product and the imports from each country subject to the 2011 reviews were always or frequentlyinterchangeable. USITC Pub. 4221 at Table II-12.
124 In the 2011 antidumping duty reviews, the evidence showed that a majority of reporting purchasers purchasedwild-caught and farm-raised shrimp for the same end uses, and three times as many purchasers indicated that the twotypes of shrimp were purchased for the same end uses as reported that they were not. USITC Pub. 4221 at Table II-17.
125 CR/PR at Tables II-1 and II-2. The evidence demonstrates that the subject imports have a larger presence insome channels of distribution, particularly those involving end users and retail buyers, than does the domesticproduct. CR/PR at Table II-1. To a large extent, this may be a function of subject imports accounting overall for amuch larger share of apparent U.S. consumption than domestic production. As explained in section V. above, boththe subject imports and the domestic like product are available in all channels of distribution. Moreover, it isundisputed that both the subject imports and the domestic like product participate in sales to distributors. In the2011 antidumping duty reviews, the evidence showed that each of the five leading purchasers (which togetherrepresented more than 87 percent of reported purchases) purchased both the domestic like product and at least someimports from the countries subject to those reviews, and four purchased the domestic like product and imports frommultiple subject countries. USITC Pub. 4221 at II-16.
126 CR/PR at Table III-6.
127 See, e.g., USITC Pub. 4221 at II-31-33; Petitioner’s Postconference Brief, Question 7 at 1 and Exhibit 23.
22

Commission questionnaires, regarding the competition between subject imports and the domestic likeproduct.
4. Other Conditions of Competition
Most U.S. processors and importers reported selling the majority of warmwater shrimp in the spotmarket.128 Both U.S. processors and importers entered into short-term contracts of three to six monthsduration.129 Respondents contend that only importers are able to compete for sales to large restaurantchains and other customers that plan and advertise menu promotions far in advance because domesticproducers are not able to guarantee that they can supply large enough quantities of shrimp meetingpurchasers’ precise specifications far in advance of delivery.130
U.S. processors reported that fuel is the most important cost for fishermen.131 High fuel costs canserve as a disincentive to fishermen to take their boats out to harvest shrimp.132 Diesel prices in the GulfCoast region nearly doubled from January 2009 to May 2011, but have not increased markedly throughSeptember 2012.133
C. Volume of Subject Imports
Section 771(7)(C)(i) of the Act provides that the “Commission shall consider whether the volumeof imports of the merchandise, or any increase in that volume, either in absolute terms or relative toproduction or consumption in the United States, is significant.”134
The cumulated volume of subject imports was already large at the beginning of the period ofinvestigation, then increased steadily between 2009 and 2011. The cumulated volume of subject importsrose from 893.7 million pounds in 2009 to 956.8 million pounds in 2010, then to 984.2 million pounds in2011. The volume was slightly lower in interim 2012 than in interim 2011.135 Subject import marketshare rose from 70.0 percent in 2009 to 76.6 percent in 2010 and then declined slightly to 76.0 percent in2011; it was 76.6 percent in January-August 2011 and *** in January-August 2012.136 While apparent
128 CR/PR at V-2 n.3. Thirty-five of 41 responding U.S. processors and 24 of 43 responding importers reportedselling the majority of warmwater shrimp in the spot market; 24 processors and 15 importers sold all of their producton a spot basis. Id.
129 CR/PR at V-2. Only importers reported providing long-term contracts for one to three years. Id.
130 CR/PR at V-2.
131 CR/PR at V-1; Conf. Tr. at 39 (“Fishermen in turn need to be able to cover their cost of production, the mostsignificant of which is fuel.”).
132 CR/PR at II-3, II-4, and V-1; Conf. Tr. at 39 (“When we can’t pay enough to cover the fisherman’s cost, theyeither have to tie up their boats or leave the fishing life altogether.”).
133 CR/PR at Figure V-1.
134 19 U.S.C. § 1677(7)(C)(i).
135 CR/PR at Table IV-4 (revised). Subject imports totaled 594.8 million pounds in January-August 2011 and574.2 million pounds in January-August 2012. CR/PR at Table IV-4 (revised). We note that official Commerceimport data are available for the January-September interim periods. However, because the NOAA Fisheries Servicedata used for U.S. shipments in the calculation of U.S. market share are only available for the January-Augustinterim periods, we are discussing the January-August interim period data here. The cumulated volume of subjectimports for the January-September interim period shows the same trend as the January-August interim data. SeeCR/PR at Table IV-2.
136 CR/PR at Table IV-5 (revised).
23

U.S. consumption was relatively flat and U.S. shipments declined overall between 2009 and 2011,137 thedomestic industry lost market share138 and subject imports experienced significant gains.139
For purposes of these preliminary determinations, we find that the cumulated volume of subjectimports, and the increase in that volume, is significant both in absolute terms and relative to consumptionand production in the United States.
D. Price Effects of the Subject Imports
Section 771(C)(ii) of the Act provides that, in evaluating the price effects of subject imports, the Commission shall consider whether – (I) there has been significant price undersellingby the imported merchandise as compared with the price of domestic like products of theUnited States, and (II) the effect of imports of such merchandise otherwise depressesprices to a significant degree or prevents price increases, which otherwise would haveoccurred, to a significant degree.140
The record in these preliminary phase investigations indicates that subject imports anddomestically produced frozen shrimp are at least moderately substitutable and that price is at least amoderately important factor in purchasing decisions.141
The Commission collected quarterly pricing data on four warmwater shrimp products.142 ThirtyU.S. producers and 40 importers provided usable pricing data for sales of the requested products,although not all firms reported pricing for all products for all quarters. Pricing data reported by thesefirms accounted for *** percent of U.S. producers’ shipments of frozen shrimp and 0.4 percent of U.S.shipments of imports from China, 5.2 percent of imports from Ecuador, 2.2. percent of imports fromIndia, 4.5 percent of imports from Indonesia, 15.4 percent of imports from Malaysia, 3.1 percent ofimports from Thailand, and 3.1 percent of imports from Vietnam during the period of investigation.143
137 Apparent U.S. consumption fluctuated annually and increased overall from 1.28 billion pounds in 2009 to 1.30billion pounds in 2011. CR/PR at Table IV-4 (revised). Converted U.S. shipments declined from 159.4 millionpounds in 2009 to 120.0 million pounds in 2010, and then increased to 136.6 million pounds in 2011. Id. (Converted U.S. shipments are U.S. production converted to pounds of headless shell-on weight using a conversionfactor of 0.629. Id. at n.3.).
138 The domestic industry’s market share, as measured by quantity, fell from 12.5 percent in 2009 to 9.6 percent in2010, then rose slightly to 10.5 percent in 2011. It was 11.7 percent in January-August 2011 and *** in January-August 2012. CR/PR at Table IV-5 (revised)
139 The ratio of subject imports to converted U.S. production fluctuated annually but increased significantlybetween 2009 and 2011. It was 560.7 percent in 2009, 797.3 percent in 2010 and 720.6 percent in 2011. CR/PR atTable IV-6.
140 19 U.S.C. § 1677(7)(C)(ii).
141 In the 2011 antidumping duty reviews, purchasers reported that price played a major role in purchasingdecisions – of 33 responding purchasers, 27 reported price as a very important purchasing consideration. USITCPub. 4221 at Table II-10. Moreover, purchasers most commonly listed price as the number two factor in purchasingdecisions. Id. at Table II-9. Although a large majority of purchasers named quality as the number one factor inpurchasing decisions, the domestic like product was at least as likely as the subject imports to satisfy purchasers’quality requirements. Id. at Table II-11.
142 Three of these are block-frozen products, each of different sizes (10-15 count, 41-50 count, and 71-90 count). The fourth product was an IQF product (26-30 count). There also were differences for each product regarding theextent of processing (e.g., headless, shell-on product; peeled and deveined, tail off). CR at V-3; PR at V-2-3.
143 CR at V-3 and V-4; PR at V-3.
24

The pricing data show that the subject imports undersold the domestic like product in 138instances, or 39.4 percent of total comparisons, and oversold the domestic like product in 212 instances.144 The margins of underselling ranged from 0.4 percent to 31.0 percent, and the average margin ofunderselling was 12.6 percent.145
We recognize that imports from four of the subject countries (China, India, Thailand andVietnam) are covered by antidumping duty orders, which appear to have had disciplining effects on pricesfor these subject imports during the period of investigation.146 For this reason, we place less weight onthe price comparison data for purposes of these preliminary determinations. We also note the fairlylimited pricing product coverage, particularly of domestically produced frozen shrimp.147 In any finalphase investigations, we invite the parties in their comments on our draft questionnaires to suggest pricingproducts that are likely to provide greater coverage of their sales in the U.S. market so that we may get aclearer impression of how and the extent to which products from different sources compete in the U.S.market.
Prices for the domestic like product and the subject imports fluctuated within a fairly narrowrange, showing some increases but no discernible trend throughout the 15 quarters for which data werecollected.148 Thus, we do not find evidence of significant price depression. The pricing data do, however,show some indication that prices for the domestic like product and the subject imports moved in concert,and that price changes for the subject imports affected prices for the domestic like product.149 Moreover,we find some evidence that subject imports have had price suppressing effects during the period. Overthe period of investigation, the domestic industry’s ratio of cost of goods sold (“COGS”) to net sales washigh and increased each year.150 Increases in annual net sales revenue were not enough to cover increasesin costs, suggesting that the domestic industry was experiencing a cost/price squeeze.151 152
144 CR/PR at Table V-6.
145 CR/PR at Table V-6.
146 CR/PR at I-3 and I-4.
147 The reported pricing data, particularly reported domestic pricing data, are also at variance with pricing datapublished by Urner-Barry, a monitoring service. See Petitioner’s Postconference Brief at 33-38; Petition at ExhibitI-20; Ecuador Respondent’s Postconference Brief at Exhibits 10 and 11. We recognize, however, that the Urner-Barry pricing data are regional (i.e., U.S. product prices are compared with farm-raised Asian product prices) and arenot limited to the specific subject countries.
148 CR at V-17; PR at V-12. Prices for product 1 fluctuated, with declines overall in U.S. prices and increases inprices for most subject imports. For product 2, U.S. prices fluctuated and prices for most subject imports fell withinthe range of U.S. prices. For product 3, U.S. prices rose in 2010, peaked in 2011 and then declined while prices formost subject imports were higher than U.S. prices but followed a similar pattern to U.S. prices. For product 4, U.S.prices increased and there appeared to be large amount of variation in the prices for most subject imports.
149 As evident in Figure V-3, prices for product 2 for all sources, except subject imports from Vietnam moved inconcert within a very narrow range throughout the period of investigation. Prices for products 1, 3 and 4, as shownin Figures V-2, V-4, and V-5, also fluctuated within a fairly narrow range.
150 The ratio of COGS to net sales increased from 91.0 percent in 2009 to 92.5 percent in 2010 and 93.0 percent in2011. The ratio of COGS to net sales was 92.6 percent in interim 2011 and 93.4 percent in interim 2012. CR/PR atTable VI-1.
151 CR/PR at Table VI-1. Unit net sales values were $3.07 in 2009, $3.64 in 2010, $3.76 in 2011, $3.71 in interim2011, and $3.84 in interim 2012. Unit COGS values were $2.79 in 2009, $3.37 in 2010, $3.49 in 2011, $3.44 ininterim 2011, and $3.59 in interim 2012. Id.
152 The Commission staff was unable to confirm any of the alleged lost sales during the preliminary phase of theseinvestigations. CR at V-21; PR at V-16.
25

Accordingly, based on the record in the preliminary phase of these investigations, we find someevidence that the substantial and increasing volume of subject imports have prevented price increaseswhich otherwise would have occurred to a significant degree.
E. Impact of the Subject Imports
Section 771(7)(C)(iii) of the Act provides that the Commission, in examining the impact of thesubject imports on the domestic industry, “shall evaluate all relevant economic factors which have abearing on the state of the industry.”153 These factors include output, sales, inventories, capacityutilization, market share, employment, wages, productivity, profits, cash flow, return on investment,ability to raise capital, research and development, and factors affecting domestic prices. No single factoris dispositive and all relevant factors are considered “within the context of the business cycle andconditions of competition that are distinctive to the affected industry.”154
As was true in the prior investigations and reviews, the domestic industry has two primarysegments – fishermen and processors.155 We will examine the data pertaining to industry performanceseparately for each segment, as the Commission has done in the past.156
Public data indicate that fishermen’s wild-catch landings fluctuated during the period ofinvestigation. Landings declined from 261.8 million pounds in 2009 to 199.0 million pounds in 2010,and then increased to 234.2 million pounds in 2011.157 Wild-catch landings were considerably lower in2010, when the Gulf Oil Spill limited shrimp fishing, than in 2009 or 2011. The responding fishermenreported fluctuations between years but an overall increase in warmwater shrimp harvested; they reportedharvesting 9.1 million pounds of warmwater shrimp in 2009, 7.1 million pounds in 2010, 9.3 millionpounds in 2011, 6.7 million pounds in interim (January-September) 2011, and 5.5 million pounds ininterim 2012.158 The responding fishermen reported that the number of production and related workers(PRWs) increased from 225 to 233 from 2009 to 2011; there were 233 PRWs in both interim 2011 andinterim 2012.159 Hours worked, wages paid, and boat days at sea increased each year, but were lower ininterim 2012 than in interim 2011.160
The financial results of responding fishermen also fluctuated during the period of investigation. The responding fishermen’s ratio of operating expenses to net sales was relatively high, even though it
153 19 U.S.C. § 1677(7)(C)(iii); see also SAA at 851 and 885 (“In material injury determinations, the Commissionconsiders, in addition to imports, other factors that may be contributing to overall injury. While these factors, insome cases, may account for the injury to the domestic industry, they also may demonstrate that an industry is facingdifficulties from a variety of sources and is vulnerable to dumped or subsidized imports.”)
154 19 U.S.C. § 1677(7)(C)(iii); see also SAA at 851, 885; Live Cattle from Canada and Mexico, Inv. Nos. 701-TA-386, 731-TA-812-813 (Preliminary), USITC Pub. 3155 at 25 n.148 (Feb. 1999).
155 Shrimp aquaculture in the United States peaked in 2003 at about 4.5 percent of production. CR at I-12, n.14;PR at I-10, n.14. During the period of investigation, farmed shrimp production accounted for 1.0 percent to 1.6percent of domestic production. Calculated from CR/PR at Table IV-4 (revised).
156 In the short time frame of these preliminary phase investigations, the Commission received timelyquestionnaire responses from a relatively small share of the shrimp fishermen, which may limit therepresentativeness of the data. For these reasons, we place less weight on data regarding the fishermen segment ofthe domestic industry. In any final investigations, the Commission will seek more coverage of the fishermensegment of the domestic industry.
157 CR/PR at Table IV-4 (revised).
158 CR/PR at Table E-3. Interim period data discussed in this section for all indicators except share of apparentU.S. consumption are calculated on a January-September basis.
159 CR/PR at Table E-3.
160 CR/PR at Table E-3.
26

declined each year from 98.3 percent in 2009 to 93.6 percent in 2011.161 Fishermen reported operatingincome as a ratio to net sales of 1.7 percent in 2009, 5.7 percent in 2010, and 6.4 percent in 2011. Ininterim 2012, when responding fishermen had lower sales quantities than in interim 2011 but higheraverage unit values (“AUVs”) than in any full year, they reported an operating income ratio of 4.4percent, which was below the 10.3 percent ratio in interim 2011.162 We observe that, because of non-operating income received from sources such as distributions pursuant to the Continued Dumping andSubsidies Offset Act of 2000 (CDSOA) and, in 2010 and 2011, Gulf Oil Spill compensation, respondingfishermen reported positive net income for every period in the period of investigation.
Processors’ production exhibited the same trends as wild-catch landings. Production decreasedfrom 222.2 million pounds in 2009 to 181.3 million pounds in 2010, and then increased to 198.0 millionpounds in 2011.163 Production was lower in interim 2012, at 144.0 million pounds, than in interim 2011,at 151.7 million pounds.164 Processors’ capacity rose during each year of the period of investigation,increasing from 658.6 million pounds in 2009 to 704.9 million pounds in 2011; capacity was 506.7million pounds in interim 2011 and 522.9 million pounds in interim 2012.165 Capacity utilizationfluctuated, decreasing from 32.9 percent in 2009 to 25.6 percent in 2010, then increasing to 27.4 percentin 2011. The 26.9 percent capacity utilization rate in interim 2012 was lower than the 29.2 percent rate ininterim 2011.166
Processors’ U.S. shipments showed the same trends as production, decreasing from *** in 2009to *** in 2010, then increasing to *** in 2011. U.S. shipments of *** in interim 2012 were lower thanthe *** of shipments in interim 2011.167 Ending inventory quantities fluctuated annually and increasedoverall from 35.9 million pounds in 2009 to 38.4 million pounds in 2011; ending inventory quantitieswere 34.5 million pounds in interim 2011 and 46.1 million pounds in interim 2012.168
With respect to employment, the number of production and related workers, hours worked, andtotal wages paid fluctuated annually and declined overall from 2009 to 2011.169 Hourly wages and laborproductivity increased each year of the period.170
161 Calculated from CR/PR at Table E-4. For purposes of this discussion, operating expenses includeofficer/partner salaries.
162 Calculated from CR/PR at Table E-4. For purposes of this discussion, operating income refers to net salesvalue minus operating expenses and officer/partner salaries.
163 CR/PR at Table III-4.
164 CR/PR at Table III-4.
165 CR/PR at Table III-4.
166 CR/PR at Table III-4.
167 CR/PR at Table III-4. Export shipments were very small in relation to domestic shipments and declinedoverall from 2009 to 2011. Id.
168 CR/PR at Table III-8.
169 The number of PRWs fell from 2,069 in 2009 to 1,859 in 2010, then rose slightly to 1,922 in 2011. It totaled1,830 in interim 2011 and 1,782 in interim 2012. CR/PR at Table III-10. Wages paid decreased from $49.7 millionin 2009 to $43.3 million in 2010, and then increased to $47.4 million in 2011. They totaled $36.6 million in interim2011 and $35.5 million in interim 2012. Id. Hours worked totaled 3.9 million hours in 2009, declined to 3.1 millionhours in 2010, and then increased to 3.3 million hours in 2011. Hours worked totaled 2.8 million hours in interim2011 and 2.7 million hours in interim 2012. Id.
170 Labor productivity increased from 53.8 pounds per hour worked in 2009 to 54.0 pounds per hour worked in2010 and 56.5 pounds per hour worked in 2011. Labor productivity was 51.2 pounds per hour worked in interim2011 and 50.8 pounds per hour worked in interim 2012. CR/PR at Table III-10. Hourly wages rose from $11.77 in2009 to $12.74 in 2010 and $13.28 in 2011. Hourly wages were incrementally higher in interim 2012, at $12.37,than in interim 2011, when they were $12.19. Id.
27

Over the period of investigation, the indicators of the domestic processors’ financial conditionshowed some positive and some negative trends. The processors’ total net sales values increased eachyear from $651.4 million in 2009 to $662.1 million in 2010 and $725.0 million in 2011.171 Theprocessors’ COGS also increased each year; as a share of net sales, it was 91.0 percent in 2009, 92.5percent in 2010 and 93.0 percent in 2011.172 Thus, while the processors were profitable each year from2009 to 2011, their performance was marginal and declining; their operating income margin decreasedfrom 1.8 percent in 2009 to 0.9 percent in 2010, and 0.3 percent in 2011.173 Operating performanceshowed further deterioration in interim 2012.174 Almost half of the reporting firms exhibited operatinglosses in 2011.175 Capital expenditures fluctuated between years from 2009 to 2011 and were higher ininterim 2012 than in interim 2011.176 177
Despite increases in processors’ net sales value over the period of investigation, they were able tosustain only a marginal, albeit positive, operating margin, except for interim 2012 when they sustained aloss. As discussed above, we have found the cumulated volume of subject imports and the market shareof those imports to have been significant over the period of investigation and that there is some evidenceof price suppression by the subject imports. Consequently, we find, for purposes of the preliminary phaseof these investigations, that there is a reasonable indication that the large and increasing volume of subjectimports had an adverse impact on the domestic industry.
In conducting our impact analysis, we have also considered the role of other factors so as not toattribute injury from other factors to subject imports. We have closely considered the role of nonsubjectimports.178 Nonsubject imports declined in volume and market share between 2009 and 2011,179 and
171 CR/PR at Table VI-1.
172 CR/PR at Table VI-1.
173 CR/PR at Table VI-1.
174 CR/PR at Table VI-1. Total net sales value in interim 2012, at $523.2 million, was lower than in interim 2011,at $548.2 million. COGS as a share of net sales, however, was higher, and the processors experienced furtherdeclines in financial performance in interim 2012; processors’ operating income margins were 1.0 percent in interim2011 and negative 1.2 percent in interim 2012. Id.
175 CR/PR at Table VI-1. Respondents point to the abnormally high SG&A ratios for certain processors resultingin low operating profit ratios as another cause of injury to the domestic industry. Ecuador Respondents’Postconference Brief at 30-31; Indonesian Respondents’ Postconference Brief at 25-26. With the exception ofinterim 2012, U.S. processors’ SG&A expenses as a share of net sales moved within a relatively narrow range. Thehigher SG&A expenses in interim 2012 compared to interim 2011 ***. CR at VI-6 and n.8; PR at VI-5 and n.8.
176 Capital expenditures increased from $4.7 million in 2009 to $10.2 million in 2010, and then declined to $7.7million in 2011. They totaled $4.1 million in interim 2011 and $4.8 million in interim 2012. CR/PR at Table VI-3.
177 Like the fishermen, a notable feature of the U.S. processors’ financial results is the amount of “other income”reported. This ranged from a low of $19.2 million in 2009 to a high of $50.3 million in interim 2012. While “otherincome” includes a variety of items, its most significant component after 2009 appears to be settlementdisbursements related to the Gulf Oil Spill, with a smaller relative share accounted for by CDSOA receipts. CR atVI-6 and VI-7; PR at VI-5. The parties disagree regarding how the Commission should consider the settlementdisbursements and CDSOA receipts in evaluating the industry’s financial results. Petitioner suggests that thedisbursements and receipts should be considered a non-operating item, and Respondents propose that they should beconsidered the functional equivalent of operating income. See, e.g., Conf. Tr. at 54-55 and 138-139. TheCommission’s report follows the standard format, classifying such “other income” as non-recurring items belowoperating income to distinguish it from the primary operations examined. In any final phase investigations, we willseek information regarding the continuation of settlement disbursements and CDSOA receipts.
178 Based on the record evidence in the preliminary phase of these investigations, Commissioner Pinkert finds thatprice competitive, nonsubject imports were a significant factor in the U.S. market for frozen warmwater shrimpduring the period of investigation. CR/PR at Table C-1. He further notes, however, that, regardless of whether
(continued...)
28

subject imports’ gains in market share exceeded the loss of market share by nonsubject imports.180 Inaddition, pricing data indicate that nonsubject imports from Mexico were priced higher than subjectimports in 99 of 170 quarterly price comparisons.181
While Respondents have raised several alleged other factors that they argue could be responsiblefor any difficulties experienced by the domestic industry rather than subject imports,182 there is limitedevidence on the record in the preliminary phase of these investigations to address such alleged otherfactors. We observe that while natural or manmade disasters such as the Gulf Oil Spill may have affectedthe domestic industry’s performance, the Commission’s analysis must take the industry as it finds it.183 Moreover, while the Gulf Oil Spill affected the domestic industry’s supply during 2010, the industry’ssupply began to return to pre-spill levels in 2011, and subject imports increased that year as the industry’soperating performance declined. Finally, Respondents’ arguments in these investigations regarding thedomestic industry’s ability to supply the U.S. market, whether due to the nature of wild-caught harvestingor the industry’s alleged inability to provide specific niche products, are similar to those raised andrejected in prior investigations and reviews.184 In any final phase investigations, we will seek moreinformation regarding any other factors so as not to attribute any injury from such factors to the subjectimports.
Consequently, for purposes of these preliminary determinations, we conclude that the cumulatedsubject imports have had a significant adverse impact on the domestic industry.
CONCLUSION
For the foregoing reasons, and based on the record in the preliminary phase of theseinvestigations, we find that there is a reasonable indication that an industry in the United States is
178 (...continued)frozen warmwater shrimp constitutes a commodity product (there is considerable argumentation in theseinvestigations with respect to the interchangeability of shrimp from different country sources), the record does notsupport finding that nonsubject imports would have replaced subject imports during the period of investigationwithout benefit to the domestic industry if subject imports had exited the U.S. market. Nonsubject imports did notaccount for greater than 17.5 percent of the U.S. market in any year of the period, id., and there is no recordinformation regarding the ability or propensity of nonsubject suppliers to replace subject imports. See CR at VII-13- VII-14, PR at VII-10. Moreover, the available price data indicate that, in the majority of instances, imports ofshrimp from Mexico (the largest nonsubject source) were sold at higher prices than shrimp originating both insubject countries and in the United States. CR at V-21, PR at V-16.
179 Nonsubject import market share fell from 17.5 percent in 2009 to 13.8 percent in 2010, then to 13.5 percent in2011. Nonsubject import market share was 11.7 percent in interim (January-August) 2011 and *** in interim(January-August) 2012. CR/PR at Table IV-5 (revised).
180 Subject import market share increased from 70.0 percent in 2009 to 76.6 percent in 2010, and then declinedslightly to 76.0 percent in 2011. Subject import market share was 76.6 percent in interim 2011 and *** in interim2012. CR/PR at Table IV-5.
181 CR at V-21; PR at V-16.
182 Some of their alternative explanations include (1) declines in supply and demand resulting from the Gulf OilSpill; (2) limits on the availability of domestic supply; (3) the domestic industry’s inability to supply certaincustomers; (4) the fuel-dependent production process used by the U.S. shrimp fishermen; (5) imports fromnonsubject countries; (6) the hypoxic zone; and (7) the economic recession in the United States. See, e.g., IndianRespondents’ Postconference Brief at 12; Ecuador Respondents’ Postconference Brief at 13-18; IndonesianRespondents’ Postconference Brief at 26-33.
183 See Iwatsu Electric Co. v. United States, 758 F. Supp. 1506, 1512, 1518 (Ct. Int’l Trade 1991).
184 USITC Pub. 3748 at 34; USITC Pub. 4221 at 36. In any final phase investigations we intend to examinefurther the degree to which competition between subject imports and the domestic product may now be attenuated.
29

materially injured by reason of allegedly subsidized frozen warmwater shrimp from China, Ecuador,India, Indonesia, Malaysia, Thailand, and Vietnam.
30
DISSENTING VIEWS OF COMMISSIONER DANIEL R. PEARSON
Based on the record in the preliminary phase of these investigations, I find that there is noreasonable indication that an industry in the United States is materially injured or threatened with materialinjury by reason of subject imports of frozen warmwater shrimp from China, Ecuador, India, Indonesia,Malaysia, Thailand, and Vietnam that are allegedly subsidized.1
I. NO REASONABLE INDICATION OF MATERIAL INJURY BY REASON OFCUMULATED SUBJECT IMPORTS
A. Conditions of competition
In the Commission’s first investigations of this product I noted that the record containedextensive evidence of quality differences between the domestic like product and subject imports.2 Duringthe review of those original investigations, I found such extensive evidence of quality differences betweenthe domestic like product and subject imports to the degree that competition between the products wasattenuated.3 I find that the record in these preliminary investigations again indicates a significantattenuation of competition between the domestic like product and subject imports.
The domestic like product is overwhelmingly comprised of wild-caught shrimp,4 while subjectimports consist overwhelmingly of farm-raised shrimp.5 In the years prior to this period of investigation(POI), domestic landings of warmwater shrimp were relatively stable for several decades, averagingapproximately 260 million pounds and exceeding 300 million pounds just three times since 1970.6 Thislongterm stability suggests there is a limit on the amount of shrimp the domestic industry’s fishermen canproduce, regardless of price or demand. Although domestic landings have been relatively stable, therewill always be a degree of unpredictability in the volume, size, and composition of a given year’s catch.7
The supply of subject imports, and nonsubject imports as well, is larger, more flexible, and morepredictable, factors that would naturally make the product more attractive to purchasers that are moreconcerned about access to high and consistent volumes of shrimp.8
The distinctions between wild-caught and farm-raised shrimp are important to some marketparticipants. A significant majority of responding domestic processors report that the domestic likeproduct is always or frequently interchangeable with both subject and nonsubject imports.9 Importers aresignificantly more likely to report that the domestic like product is only sometimes interchangeable withsubject and nonsubject imports, and nearly as many responding importers report that the domestic like
1 I join and adopt as my own sections I-VI.B.2 and VI.B.4 of the majority Views.
2 USITC Pub. 3748 at 52.
3 USITC Pub. 4221 at 39.
4 CR/PR at Tables III-1 and IV-4.
5 CR at II-8, PR at II-6.
6 Ecuador Respondent’s postconference brief at 1 and Exh. 1.
7 USITC Pub. 4221 at 39, citing INV-JJ-016 at II-42 n.66.
8 Tr. at 111 (Faria ) (“Our customers need year around consistency and high quality from one container toanother.... [I]mported shrimp have more uniform and consistent quality”); Tr. at 185 (Lunn) (“they wantpredictability over time, that can’t be given by the wild-caught shrimpers”)
9 CR/PR at Table II-6.
31
product is never interchangeable with subject imports as report that they are sometimes interchangeable.10
Importers are also more likely to report fewer limitations on interchangeability among imports than areU.S. processors.11
A plurality of responding domestic processors report that perceived differences other than priceare never significant, although a significant number report that non-price differences are alwaysimportant.12 Few importers report that nonprice differences are never important, particularly betweendomestic and subject or nonsubject product, while a majority report that non-price differences are alwaysimportant in competition between the domestic like product and most subject imports.13 Importersgenerally rated non-price differences as less important in competition among subject imports and betweensubject imports and nonsubject imports.14
Responding importers cited a variety of reasons for the limited interchangeability between thedomestic like product and subject imports. Importers noted that some customers prefer domestic shrimpbecause it is considered to be free of chemicals and antibiotics, while other customers prefer theconsistent quality of farmed shrimp. Importers claim that the domestic like product is sold mainly inheadless/shell on form, while subject imports are available in a greater variety of formats, species, andsizes. Subject imports themselves vary as well, with certain species available from only specific countries,while subject producers in some countries specialize in certain formats.15 Respondents also claim that thedomestic like product is more likely to be sold as block frozen, while subject imports are more likely to besold in individually quick frozen (IQF) form.16
Responding importers also note that farmed shrimp is available in larger and more predictablevolumes than wild-caught shrimp and in more uniform sizes.17 Farmed shrimp such as subject imports istherefore more suitable to high-volume customers such as national restaurant and supermarket chains whoneed regular and guaranteed quantities with uniform appearance.18 Restaurants in particular are alsointerested in purchasing more processed products, to cut down on labor costs.19
These significant differences in the nature of the domestic like product and subject imports haveled to significant differences in the customer base for the respective products. The domestic like productis sold predominantly to distributors, and for most of the POI, sales to distributors accounted for
10 CR/PR at Table II-6.
11 CR/PR at Table II-6. The record in these preliminary investigations does not include questionnaire responsesfrom purchasers. During the recent review of the antidumping orders on Brazil, China, India, Thailand, and Vietnam,purchasers were also less likely than domestic processors to consider subject imports as always interchangeable withthe domestic like product. INV-JJ-016 at Table II-12.
12 CR/PR at Table II-7.
13 CR/PR at Table II-7.
14 CR/PR at Table II-7.
15 CR at II-17-18, PR at II-14-II-15.
16 Thai Respondents’ postconference brief at 7. The record gathered during the recent review indicated that arelatively modest amount of the domestic like product was shipped in IQF form, while IQF accounted for asubstantial majority of subject imports. USITC Pub. 4221 at 40. The record does not contain a breakout of domesticor imported shrimp by freezing method. However, the domestic industry’s block freezing capacity is significantlygreater than its IQF capacity. CR/PR at Table III-6. Of the four products for which quarterly pricing was gathered,only one was an IQF product, and domestic pricing data gathered for that product reflected *** than for any of theblock frozen products. CR/PR at Tables V-1-V-4.
17 CR at II-18-19, PR at II-14-II-15; Thai Respondents’ postconference brief at 7-8
18 CR at II-18; Tr. at 111 (Faria) and 185 (Lunn).
19 INV-JJ-016 at II-39-40.
32

80 percent or more of all shipments.20 Subject imports, on the other hand, are significantly more likely tobe sold to retailer or institutional buyers such as restaurants or hotels. Such purchasers accounted forupwards of 80 percent of all subject import shipments during this POI.21
Domestic processors have noted that many customers buy both the domestic like product andsubject imports and use the domestic like product and subject imports for the same end uses.22 Thedisparity in channels of distribution suggests the overlap is limited.23 But the record also suggests thateven those customers who buy both do not treat the domestic like product and subject imports asinterchangeable.24 Domestic and imported shrimp are packaged separately and priced separately.25
The record suggests that while there might be some overlap in channels of distribution, thesubject imports’ primary market is not the same as the primary market for the domestic like product.Subject imports appeal primarily to a market that needs a large, predictable volume of relatively uniformand relatively highly-processed product. The domestic like product appeals primarily to those who likethe wild-caught product.
B. Volume Effects of Subject Imports
Section 771(7)(C)(I) of the Act provides that the “Commission shall consider whether the volumeof imports of the merchandise, or any increase in that volume, either in absolute terms or relative toproduction or consumption in the United States, is significant.”26
The volume of cumulated subject imports increased by 10.1 percent between 2009 and 2011, andthe share of the market held by subject imports increased from 70.0 percent in 2009 to 76.0 percent in2011.27 Subject import volume in January-August 2012 was 6.3 percent lower than in January-August2011.28 Market share for January-August 2012 was *** percent, compared to 76.6 percent in January-August 2011.29 Subject import volume thus increased both absolutely and relatively between 2009 and2011.
20 CR/PR at Table II-1. Sales to distributors have accounted for a significant majority of domestic shipments sinceat least 2005. INV-JJ-016 at Table II-1.
21 CR/PR at Table II-1.
22 Petitioner’s postconference brief at 22-23.
23 See also Tr. at 110-111 (Faria) (“we do not encounter competition from domestic wild caught shrimp.... [W]ehave never engaged in head to head competition with any of the Petitioners for an account.... [W]e focus oncustomers that strongly prefer farm-raised shrimp”); Tr. at 115, 116 (Paterson) (“I never have a domestic shrimpprocessing company call to offer me product for sale....[W]e sell nationally, and other than in those specific nichemarkets, we do not see domestic shrimp marketed nationally”).
24 Tr. at 110 (Faria) (“We supply large customers across the country and the orders presented to us by retailsupermarkets, chain restaurants, cruise lines and casinos all ask for farm-raised shrimp.... Our customers give usspecification sheets that identify the species, the quantity, the size...they want to purchase. These terms are notnegotiable, they are requirements.... In a small number of cases we might see domestic shrimp specified, but wenever see both farm shrimp and wild shrimp listed on the same specification”)
25 Thai Respondents’ postconference brief at 6-8; Rubicon Group’s postconference brief at 17-18; SEAIpostconference brief at 5-6.
26 19 U.S.C. § 1677(7)(C)(I).
27 CR/PR at Table C-1.
28 CR/PR at Table C-1.
29 CR/PR at Table C-1.
33

Conversely, shipments of the domestic like product were down by *** percent in 2010 from2009, and though shipment volume increased in 2011, shipments were still *** percent lower than in2009.30 Shipments in interim 2012 were *** percent lower than in interim 2011.31 The domesticindustry’s market share slipped from 12.5 percent in 2009 to 9.6 percent in 2010 and then to 10.5 percentin 2011.32 The domestic like product accounted for *** percent of apparent U.S. consumption in interim2012, compared to 11.7 percent in interim 2011.33 The domestic industry lost both volume and marketshare over the POI.
Nonetheless, I do not find the volume of subject imports to be significant. As noted above,apparent domestic consumption in the U.S. market has been dominated by subject imports for a very longtime, and in fact the market share of the domestic industry has been relatively stable since 2005.34
Apparent domestic consumption has also been relatively stable since 2007.35 The relatively high volumeof subject imports and the relatively high subject import market share seen over this POI are acontinuation of a longstanding equilibrium, an equilibrium that was reached when a significant volume ofimported frozen shrimp was already subject to antidumping duty orders.36
Shrimp harvesting by the domestic fleet in the Gulf of Mexico was significantly disrupted by theDeepwater Horizon oil spill, significantly limiting the raw material available for processing in 2010 andalso limiting production in 2011.37 The decline in domestic shipments and the resulting loss of marketshare was not driven by the presence of subject imports in the market, as domestic shipments have variedvery little over a relatively long period of time, regardless of the volume of subject imports.38
Subject import volume did increase in 2010 as domestic shipments declined.39 However, thevolume of nonsubject imports declined in nearly equal measure, leaving the total volume of importedfrozen warmwater shrimp virtually unchanged.40 This suggests that the primary competition for subjectimports in the U.S. market is with nonsubject imports, which also consist mostly of farm-raised shrimp,rather than with the domestic like product. Similarly, in January-August 2012, shipments of the domesticlike product and imports of subject imported shrimp as a share of the U.S. market were lower than in theJanuary-August 2011 period.41 Nonsubject imports, however, increased both absolutely and relatively,although total import volume was lower than in January-August 2011.42 Again, this suggests that subjectand nonsubject imports compete for the same segment of the market; as noted above, these products shareimportant characteristics that make imports, both subject and nonsubject, suitable to a different set ofcustomers than those who prefer domestic shrimp.
30 CR/PR at Table C-1.
31 CR/PR at Table C-1.
32 CR/PR at Table C-1.
33 CR/PR at Table C-1.
34 CR/PR at Table C-1; INV-JJ-016 at Table I-1.
35 CR/PR at Table C-1; INV-JJ-016 at Table I-1.
36 INV-JJ-016 at Table I-1.
37 CR at II-4-II-5, II-7-II-8, and VI-5, PR at II-4, II-6, and VI-1 and VI-3.
38 INV-JJ-016 at Table I-1.
39 CR/PR at Table IV-4.
40 CR/PR at Table IV-4.
41 CR/PR at Table IV-5.
42 CR/PR at Table IV-5.
34

Domestic production and shipments are influenced most strongly by harvesting conditions ratherthan by import volume. This is apparent in the lack of correlation between domestic production andshipments and subject import volume over a lengthy period of time, both prior to and after the impositionof antidumping duty orders on some sources of farm-raised shrimp.43 While U.S. production andshipments were down in the wake of the Deepwater Horizon spill, the domestic industry’s market share by 2011 and January-August 2012 had returned to historic norms. Total shipments were lower in January-August 2012 than in January-August 2011,44 but this decline is more likely related to continuing concernson the part of consumers about the safety of Gulf shrimp or a reflection of the more general decline inapparent domestic consumption than to the specific volume of subject imports.
For the foregoing reasons, despite the substantial total volume and market share of subjectimports, I do not find subject import volume to be significant. The high volume and market share ofsubject imports have been constants in the U.S. market, and the record suggests significant attenuation ofcompetition between those subject imports and the domestic like product.
C. Price Effects of Subject Imports
Section 771(C)(ii) of the Act provides that, in evaluating the price effects of subject imports, the Commission shall consider whether – (I) there has been significant price undersellingby the imported merchandise as compared with the price of domestic like products of theUnited States, and (II) the effect of imports of such merchandise otherwise depressesprices to a significant degree or prevents price increases, which otherwise would haveoccurred, to a significant degree.45
Product-specific pricing data were gathered for four products, three block frozen and one IQFproduct. The data gathered reflected a surprising degree of overselling by subject imports. Subjectimports oversold the domestic like product in 212 of 350 quarterly comparisons, by an average margin of21.9 percent.46 Subject imports undersold the domestic like product in 138 quarterly comparisons, by anaverage margin of 12.6 percent.47
While demand for frozen warmwater shrimp was stable throughout most of the POI, with perhapsa modest decline late in the period, prices rose throughout the POI. The average unit value (AUV) for netsales of the domestic like product rose 18.6 percent between 2009 and 2010. This increase might simplyhave been a reflection of the significantly reduced domestic supply as a result of the Deepwater Horizonspill, but AUVs in 2011 were higher than in 2010, although net sales reflected a significant improvementover depressed 2010 levels. Overall AUVs in 2011 were 22.5 percent higher than in 2009. In interim2012, AUVs were 3.5 percent higher than in interim 2011. Thus, the record suggests that the domestic
43 INV-JJ-016 at Table I-1.
44 CR/PR at Table IV-4.
45 19 U.S.C. § 1677(7)(C)(ii).
46 CR/PR at Table V-6.
47 CR/PR at Table V-6. Domestic processors have questioned the accuracy of the product-specific pricing dataand argue that subject imports consistently undersold the domestic like product. Petitioner’s postconference brief at33. Domestic processors have also suggested other possible price comparisons. Petitioner’s postconference brief at34-37. At this time I do not find any reason to discount the product-specific pricing data. However, my findingsregarding price effects depend primarily on my findings regarding attenuation of competition rather than any specificitem of pricing data.
35

industry was not experiencing price depression during the POI.48 AUVs for both subject imports andnonsubject imports were also higher in 2011 than in 2009.49
Despite the rising sales values, unit COGS for the domestic processors rose faster than salesvalues, and the ratio of COGS to sales was higher in interim 2012 than in interim 2011.50 This suggeststhe industry was suffering a cost-price squeeze late in the POI. However, I find it unlikely that any cost-price squeeze was related to subject import volume or pricing. As noted above, competition between thedomestic like product and subject imports is significantly attenuated, with the products competing inmostly separate markets. The significant amount and degree of overselling by subject imports alsosuggests that these products are not competing for the same customers.
For the foregoing reasons, I do not find that domestic prices were depressed to a significantdegree, or that there has been significant price suppression by reason of the subject imports.
D. Impact of Subject Imports
Section 771(7)(C)(iii) of the Act provides that the Commission, in examining the impact of thesubject imports on the domestic industry, “shall evaluate all relevant economic factors which have abearing on the state of the industry.”51 These factors include output, sales, inventories, capacityutilization, market share, employment, wages, productivity, profits, cash flow, return on investment,ability to raise capital, research and development, and factors affecting domestic prices. No single factoris dispositive and all relevant factors are considered “within the context of the business cycle andconditions of competition that are distinctive to the affected industry.”52
Domestic processors saw a steady deterioration in performance over the POI. Capacity increasedby 7.0 percent between 2009 and 2011, and interim 2012 production capacity was 3.2 percent higher thanin interim 2011. Production, however, declined sharply in the wake of the Deepwater Horizon oil spill inthe Gulf and made only a partial recovery in 2011. Capacity utilization, which has historically been low,declined. The number of production workers fell between 2009 and 2011, as did hours worked and totalwages paid; all three measures were lower in interim 2012 than in interim 2011.53
The domestic industry’s net sales declined in the wake of the Deepwater Horizon oil spill butmade a partial recovery in 2011. Net sales were somewhat lower in interim 2012 than in interim 2011.Average unit sales values increased throughout the POI and were at a peak in interim 2012, but total salesvalue was somewhat lower in interim 2012. Unit costs rose between 2009 and 2011 and were higher ininterim 2012 than in interim 2011. The industry’s COGS-sales ratio rose throughout the POI as well, and
48 I am mindful that AUVs are not necessarily a reliable indicator of price trends in an industry such as this, giventhe variety of products. I note that prices for the individual domestic like products were higher in 2012 than in therelevant quarters of 2009 for each of the four products. CR/PR at Tables V-1-V-5.
49 CR/PR at Table C-1.
50 CR/PR at Table C-1.
51 19 U.S.C. § 1677(7)(C)(iii); see also SAA at 851 and 885 (“In material injury determinations, the Commissionconsiders, in addition to imports, other factors that may be contributing to overall injury. While these factors, insome cases, may account for the injury to the domestic industry, they also may demonstrate that an industry is facingdifficulties from a variety of sources and is vulnerable to dumped or subsidized imports.”)
52 19 U.S.C. § 1677(7)(C)(iii); see also SAA at 851, 885; Live Cattle from Canada and Mexico, Invs. Nos. 701-TA-386, 731-TA-812-813 (Prelim.), USITC Pub. 3155 at 25 n.148 (Feb. 1999).
53 I have defined the domestic industry to include shrimp fishermen as well. The record has limited data on thecondition of the shrimping fleet. The available information indicate that this portion of the industry saw significantincreases in operating expenses relative to net sales late in the POI. CR/PR at Table E-4.
36

the industry had an operating loss in interim 2012.54 The industry’s financial performance continued todeteriorate even after production and sales began to recover from the Deepwater Horizon spill.
This industry has been a marginally profitable one for some time.55 The imposition of a set ofantidumping duty orders had no significant impact on the industry’s profitability.56 The profitabilityfigures seen in this POI are in line with the industry’s performance over the last decade and in line withthe industry’s performance both before and after the imposition of antidumping duty orders.57 In reachingmy determination during the sunset review of those orders, I found the continuity of results to be furtherevidence that the competition between the domestic like product and subject imports was attenuated.58 Ifind the record here to be similarly persuasive. The industry’s 2012 interim results are somewhat weakeven by longer historical standards, but these poorer results occurred at a time when subject importvolume was declining rather than rising and subject import market share was also declining somewhat,losing both market share and volume to nonsubject imports. The industry’s declining performance wasthus not correlated with either subject import volume or market share increases.59
I have already found attenuated competition and a lack of significant volume or price effects. Itherefore do not find that there is a reasonable indication that cumulated subject imports are having anadverse impact on the domestic industry. I find that the record as a whole contains clear and convincingevidence that there is no reasonable indication of material injury by reason of subject imports of frozenwarmwater shrimp and that no likelihood exists that contrary evidence would arise in any final-phaseinvestigation.
II. NO REASONABLE INDICATION OF A THREAT OF MATERIAL INJURY BYREASON OF CUMULATED SUBJECT IMPORTS
Section 771(7)(F) of the Tariff Act directs the Commission to determine whether the U.S.industry is threatened with material injury by reason of the subject imports by analyzing whether “furtherdumped or subsidized imports are imminent and whether material injury by reason of imports wouldoccur unless an order is issued or a suspension agreement is accepted.”60 The Commission may not makesuch a determination “on the basis of mere conjecture or supposition,” and considers the threat factors “asa whole” in making its determination whether dumped or subsidized imports are imminent and whether
54 Respondents have questioned the inclusion of some domestic industry expenditures as SG&A expenditures.Ecuador Respondent’s postconference brief at 30-31; Indonesian Respondents postconference brief at 25-26. ***.CR at VI-6 n.8, PR at VI-5 n.8. In reaching my determination I have therefore assumed the reported SG&A expensesare accurate and correctly classified.
55 INV-JJ-016 at Table I-1.
56 INV-JJ-016 at Table I-1.
57 INV-JJ-016 at Table I-1.
58 USITC Pub. 4221 at 41, 42.
59 The domestic industry has received significant funds both through CDSOA and settlements related to theDeepwater Horizon oil spill. These funds have been classified by recipients as “other income” and thus not includedin operating income. CR at VI-6-VI-7. For purposes of these preliminary determinations I have accepted theseclassifications and not considered other income when evaluating the condition of the industry or the impact ofsubject imports.
60 19 U.S.C. § 1677(7)(F)(ii).
37
material injury by reason of subject imports would occur unless an order is issued.61 In making mydetermination, I consider all statutory threat factors that are relevant to these investigations.62 63
Under section 771(7)(H) of the Tariff Act, the Commission may “to the extent practicable”cumulatively assess the volume and price effects of subject imports from all countries as to whichpetitions were filed on the same day if the requirements for cumulation in the material injury context aresatisfied.64 As detailed above, the requirements for cumulation in the material injury context are satisfied.No party has argued against cumulation for the threat analysis or suggested that the conditions ofcompetition likely to confront subject imports from any country will likely different to a significantdegree in the imminent future. I therefore exercise my discretion to consider subject imports from China,Ecuador, India, Indonesia, Malaysia, Thailand, and Vietnam on a cumulated basis for purposes of thisthreat analysis.
61 19 U.S.C. § 1677(7)(F)(ii).
62 These factors are as follows:
(I) if a countervailable subsidy is involved, such information as may be presented to it by the administeringauthority as to the nature of the subsidy (particularly as to whether the countervailable subsidy is a subsidydescribed in Article 3 or 6.1 of the Subsidies Agreement) and whether imports of the subject merchandiseare likely to increase,
(II) any existing unused production capacity or imminent, substantial increase in production capacity in theexporting country indicating the likelihood of substantially increased imports of the subject merchandiseinto the United States, taking into account the availability of other export markets to absorb any additionalexports,
(III) a significant rate of increase of the volume or market penetration of imports of the subject merchandiseindicating the likelihood of substantially increased imports,
(IV) whether imports of the subject merchandise are entering at prices that are likely to have a significantdepressing or suppressing effect on domestic prices and are likely to increase demand for further imports,
(V) inventories of the subject merchandise,
(VI) the potential for product-shifting if production facilities in the foreign country, which can be used toproduce the subject merchandise, are currently being used to produce other products.
* * *
(IX) any other demonstrable adverse trends that indicate the probability that there is likely to be materialinjury by reason of imports (or sale for importation) of the subject merchandise (whether or not it is actuallybeing imported at the time).
19 U.S.C. § 1677(7)(F)(I).
63 I note that Commerce in its initiation notice found sufficient information to initiate countervailing dutyinvestigations of multiple subsidy programs in each subject country. CR/PR at I-4-I-9. I have taken these allegationsinto consideration in making this determination and do not find that these allegations alter my determination.
64 19 U.S.C. § 1677(7)(H).
38

The industries in the subject countries are generally large and have increased in both capacity andproduction in recent years.65 Cumulated capacity rose from nearly 2.441 billion pounds in 2009 to2.810 billion in 2011, and capacity for 2013 is projected at 2.804 billion.66 Production increased from1.358 billion pounds in 2009 to 1.462 billion in 2011, with projected production at 1.350 billion for2013.67 The industry in each country is very export-oriented, relying on exports to absorb over 85 percentof production.68 However, these conditions were true for the subject producers throughout the POI.Subject import volume increased somewhat between 2009 and 2011 but mostly took market share fromnonsubject imports rather than from the domestic like product, and both subject import volume andmarket share were down late in the POI. Imports of farm-raised shrimp, which includes the vast majorityof subject imports, have accounted for approximately 90 percent of apparent U.S. consumption for anextended period of time.69 That same pattern held throughout this POI, and nothing on the record suggeststhat the market fundamentals that drive this particular configuration are likely to change. While imports,subject and nonsubject, are primarily farm-raised and the domestic like product primarily wild-caught,imports and the domestic like product will continue to serve different parts of the market. Nor do theinventories on hand or the product already on order suggest a significant change in the marketarrangement or the volume of subject imports.
I have also considered price effects and found subject imports to neither depress nor suppressdomestic prices. The available data suggest that subject imports frequently oversold the domestic likeproduct and by significant margins, again suggesting that these products do not serve the same markets. Ithus do not find that subject imports are likely to enter the U.S. market at such prices or in such manner asto depress or suppress prices for the domestic product.
The domestic industry is arguably vulnerable, with a relatively poor performance late in the POI.Despite generally modest returns, however, the industry has continued to make investments and was ableto increase capacity over the POI. The true extent and duration of the effects of the Deepwater Horizonspill are not yet fully known, and it is possible that neither the supply of domestic frozen warmwatershrimp nor the demand for it will fully recover. But the effects of the oil spill, however lasting or deep,are unrelated to the volume or pricing of subject imports. The industry may remain vulnerable to furthermaterial injury in the imminent future, but not from the volume or pricing of subject imports.
I therefore conclude that the record as a whole contains clear and convincing evidence that thereis no reasonable indication of a threat of material injury by reason of cumulated subject imports of frozenwarmwater shrimp from China, Ecuador, India, Indonesia, Malaysia, Thailand, and Vietnam and that nolikelihood exists that contrary evidence would arise in any final phase investigation.
CONCLUSION
Despite having considerable empathy for an industry in which hundreds of independentbusinesses work hard to maintain treasured lifestyles by dealing with unpredictable factors over whichthey have no control, I conclude that there is no reasonable indication that a domestic industry ismaterially injured or threatened with material injury by reason of imports of frozen warmwater shrimpfrom China, Ecuador, India, Indonesia, Malaysia, Thailand, and Vietnam that are allegedly subsidized.
65 CR/PR at Tables VII-1-VII-7.
66 CR/PR at Table VII-8.
67 CR/PR at Table VII-8.
68 CR/PR at Tables VII-1-VII-7.
69 INV-JJ-016 at Table I-1.
39


PART I: INTRODUCTION
BACKGROUND
These investigations result from a petition filed with the U.S. Department of Commerce(“Commerce”) and the U.S. International Trade Commission (“USITC” or “Commission”) by theCoalition of Gulf Shrimp Industries (COGSI), Biloxi, MS, on December 28, 2012, alleging that anindustry in the United States is materially injured and threatened with material injury by reason ofsubsidized imports of certain frozen warmwater shrimp1 from China, Ecuador, India, Indonesia, Malaysia,Thailand, and Vietnam. Information relating to the background of the investigation is provided below.2
Effective date Action
December 28, 2012 Petition filed with Commerce and the Commission; institution of Commissioninvestigation (78 FR 764, January 4, 2013)
January 18, 2013 Commission’s conference1
January 25, 2013 Commerce’s notice of initiation (78 FR 5416)
February 7, 2013 Commission’s vote
February 11, 2013 Commission determinations transmitted to Commerce
February 19, 2013 Commission views transmitted to Commerce 1 A list of witnesses appearing at the conference is presented in app. B.
STATUTORY CRITERIA AND ORGANIZATION OF THE REPORT
Statutory Criteria
Section 771(7)(B) of the Tariff Act of 1930 (the “Act”) (19 U.S.C. § 1677(7)(B)) provides that inmaking its determinations of injury to an industry in the United States, the Commission--
shall consider (I) the volume of imports of the subject merchandise, (II)the effect of imports of that merchandise on prices in the United Statesfor domestic like products, and (III) the impact of imports of suchmerchandise on domestic producers of domestic like products, but onlyin the context of production operations within the United States; and . . .may consider such other economic factors as are relevant to thedetermination regarding whether there is material injury by reason ofimports.
Section 771(7)(C) of the Act (19 U.S.C. § 1677(7)(C)) further provides that--
In evaluating the volume of imports of merchandise, the Commissionshall consider whether the volume of imports of the merchandise, or anyincrease in that volume, either in absolute terms or relative to productionor consumption in the United States is significant.
1 See the section entitled “The Subject Merchandise” in Part I of this report for a complete description of themerchandise subject to this investigation.
2 Federal Register notices cited in the tabulation are presented in app. A.
I-1

. . .In evaluating the effect of imports of such merchandise on prices, theCommission shall consider whether . . . (I) there has been significantprice underselling by the imported merchandise as compared with theprice of domestic like products of the United States, and (II) the effect ofimports of such merchandise otherwise depresses prices to a significantdegree or prevents price increases, which otherwise would haveoccurred, to a significant degree.. . .In examining the impact required to be considered under subparagraph(B)(i)(III), the Commission shall evaluate (within the context of thebusiness cycle and conditions of competition that are distinctive to theaffected industry) all relevant economic factors which have a bearing onthe state of the industry in the United States, including, but not limited to. . . (I) actual and potential declines in output, sales, market share, profits,productivity, return on investments, and utilization of capacity, (II)factors affecting domestic prices, (III) actual and potential negativeeffects on cash flow, inventories, employment, wages, growth, ability toraise capital, and investment, (IV) actual and potential negative effectson the existing development and production efforts of the domesticindustry, including efforts to develop a derivative or more advancedversion of the domestic like product, and (V) in {an antidumpinginvestigation}, the magnitude of the margin of dumping.
Organization of the Report
Part I of this report presents information on the subject merchandise, alleged subsidy margins,and domestic like product. Part II of this report presents information on conditions of competition andother relevant economic factors. Part III presents information on the condition of the U.S. industry,including data on capacity, production, shipments, inventories, and employment. Parts IV and V presentthe volume of subject imports and pricing of domestic and imported products, respectively. Part VIpresents information on the financial experience of U.S. producers. Part VII presents the statutoryrequirements and information obtained for use in the Commission’s consideration of the question of threatof material injury as well as information regarding nonsubject countries.
U.S. MARKET SUMMARY
Apparent U.S. consumption of frozen warmwater shrimp totaled approximately 1.3 billionpounds ($5.7 billion) in 2011. U.S. shipments3 of frozen warmwater shrimp totaled 136.6 million pounds($701.8 million) in 2011, and accounted for 10.5 percent of apparent U.S. consumption by quantity and12.4 percent by value. U.S. imports from subject sources totaled 984.2 million pounds ($4.3 billion) in2011 and accounted for 76.0 percent of apparent U.S. consumption by quantity and 75.6 percent by value. U.S. imports from nonsubject sources totaled 174.6 million pounds ($681.6 million) in 2011 andaccounted for 13.5 percent of apparent U.S. consumption by quantity and 12.0 percent by value.
3 U.S. shipments are derived from National Marine Fisheries Service data.
I-2

SUMMARY DATA AND DATA SOURCES
A summary of data collected in these investigations is presented in appendix C, table C-1. U.S.industry data are based on questionnaire responses of 58 firms, 38 of which provided usable data, thataccounted for 83.8 percent of U.S. production of frozen warmwater shrimp during 2011. U.S. importsare based on official Commerce import data and from questionnaire responses from 46 U.S. importers thatare believed to have accounted for 55.5 percent of total subject imports and 52.9 percent of total importsfrom China, 48.1 percent of total imports from Ecuador, 51.7 percent of total imports from India, 64.7percent of total imports from Indonesia, 43.5 percent of total imports from Malaysia, 61.5 percent of totalimports from Thailand, and 43.1 percent of total imports from Vietnam in 2011. A summary of trade andfinancial data as well as related information for fishermen as collected is presented in appendix E.4
PREVIOUS AND RELATED INVESTIGATIONS
Frozen warmwater shrimp has been the subject of prior antidumping duty investigations in theUnited States. On December 31, 2003, following receipt of a petition filed with the Commission andCommerce by the Ad Hoc Shrimp Trade Action Committee, Washington DC, the Commission institutedantidumping duty investigations on certain frozen and canned warmwater shrimp from Brazil, China,Ecuador, India, Thailand, and Vietnam (Inv. Nos. 731-TA-1063, 1064, 1066-1068). In January 2005, theCommission determined that an industry in the United States was materially injured by reason of frozenwarmwater shrimp imports from Brazil, China, Ecuador, India, Thailand, and Vietnam, found byCommerce to be sold in the United States at LTFV.5
In May 2005, pursuant to section 751(b) of the Act, the Commission instituted changedcircumstances investigations (Inv. Nos. 751-TA-28-29) on the antidumping duty orders from India andThailand. In November 2005, the Commission determined that revocation of the antidumping duty orderscovering warmwater shrimp from India and Thailand would be likely to lead to a continuation orrecurrence of material injury to an industry in the United States.6 In August 2007, the order on importsfrom Ecuador was revoked as a result of World Trade Organization (“WTO”) panel findings.7 In March2011, the Commission completed its first five year reviews on the antidumping duty orders on Brazil,China, India, Thailand, and Vietnam, and determined that revocation of the orders would be likely to leadto a continuation or recurrence of material injury to an industry in the United States within a reasonablyforeseeable time.8
4 Appendix E includes responses of fishermen which were filed in a timely manner, and which were determinedto be complete by Commission staff.
5 Certain Frozen and Canned Warmwater Shrimp From Brazil, China, Ecuador, India, Thailand, and Vietnam,70 FR 3943, January 27, 2005. The Commission also determined that an industry in the United States was notinjured by reason of imports from China, Thailand, and Vietnam of canned warmwater shrimp and prawns that hadbeen found by Commerce to be sold at LTFV. Additionally, the Commission determined that imports from Brazil,Ecuador, and India of canned warmwater shrimp and prawns were negligible.
6 Frozen Warmwater Shrimp from Brazil, China, India, Thailand, and Vietnam, Investigation Nos. 731-TA-1063,1064, 1066-1068 (Review), USITC Publication 4221, March 2011, p. I-3.
7 Implementation of the Findings of the WTO Panel in United States Antidumping Measure on Shrimp fromEcuador: Notice of Determination Under section 129 of the Uruguay Round Agreements Act and Revocation of theAntidumping Duty Order on Frozen Warmwater Shrimp from Ecuador,72 FR 48257, August 23, 2007.
8 Frozen Warmwater Shrimp From Brazil, China, India, Thailand, and Vietnam, 76 FR 18782, April 5, 2011.
I-3
NATURE AND EXTENT OF ALLEGED SUBSIDIES
Alleged Subsidies
On January 25, 2013, Commerce published a notice in the Federal Register of the initiation of itscountervailing duty investigation on frozen warmwater shrimp from China, Ecuador, India, Indonesia,Malaysia, Thailand, and Vietnam.9 Commerce identified the following 25 alleged subsidy programs inChina, seven in Ecuador, 21 in India, 14 in Indonesia, 16 in Malaysia, 12 in Thailand, and 20 in Vietnam.
China
A. Grant Programs1. Guangdong Province Funds for Enterprise Outward Expansion2. State Key Technology Renovation Project Fund Program3. Central Government, Provincial, and Municipal Grants Under the Famous Brands Program4. Grants Under the Healthy Development of the Aquaculture Industry Program5. Grants by the Central Government and the Xuzhou District Government in Connection withConstruction of Fishery Industry Zones and Farms6. Grants from the Huanhua City Government for Fry Breeding7. Central Government Grants Under the 2010 Aquatic Products Quality and Safety SupervisionProgram8. Government Grants for Fishery Machinery and Equipment Purchases9. Grants from Banfu Country Government for Development of Breeding Stock
B. Income Tax Programs1. Tax Incentives for Enterprises Engaged in Aquaculture and Processing2. Two Free, Three Half Program3. Export Oriented FIEs4. Tax Refund for Profit Reinvestment in Export-Oriented Enterprises5. Tax Incentives for FIEs in Special Economic Zones
C. Other Tax Programs1. VAT Exemption on Imports of Shrimp Fry2. VAT Refunds for FIEs on Purchases of Chinese-Made Equipment3. VAT Refunds for Domestic Firms on Purchases of Chinese-Made Equipment4. VAT and Tariff Exemption for Using Imported Equipment in Encouraged Industries
D. Loans1. Preferential Lending to Shrimp Producers by the Central Government andProvince of Guangdong2. Central Government Provision of Loan Guarantees at the Zhanjiang City Seafood Center3. Export Sellers Credits from China Export-Import Bank (China ExIm)4. Export Buyers Credits from China Export-Import Bank (China ExIm)
9 Certain Frozen Warmwater Shrimp From the People's Republic of China, Ecuador, India, Indonesia, Malaysia,Thailand, and the Socialist Republic of Vietnam: Initiation of Countervailing Duty Investigations, 78 FR 5416,January 25, 2013.
I-4

E. LTAR Programs1. Central Government Provision of Rent for LTAR and Waiver of Management Fees at theZhanjiang City Seafood Center2. Central Government Provision of Cold Storage Services at the Zhanjiang City Seafood Centerfor LTAR
F. Other Programs1. Export Credit Insurance from Sinosure
Ecuador
A. Income Tax Programs1. Tax Exemptions for Fishing, Aquaculture, Processing, and Trading Firms2. Tax Incentives for Priority Sectors under the 2010 Organic Production Code
B. Loan Programs1. Preferential Loans from the National Finance Corporation and the National Development Bank2. Export Credits from CFN
C. Grant Programs1. Funding under the National Agro-Industrial Development Plan2. Exemption of Land Fees to Shrimp Farmers and Processors
D. Export Restraints1. Export Restraints on Raw and Unprocessed Shrimp
India
A. Duty Entitlement Passbook Scheme (“DEPS”) and Successor Programs
B. Tax and Duty Incentives under the Special Economic Zone (“SEZ”) Program
C. Tax and Duty Incentives under the Export-Oriented Unit (“EOU”) Program
D. Duty Incentives under the Export Promotion Capital Goods (“EPGC”) Program
E. Export Financing
F. Export Credit Insurance
G. Subsidized Loans to the Marine Products Industry
Subsidies Provided by the Marine Products Export Development Authority (“MPEDA”)
H. MPEDA Subsidies for New Shrimp Farms
I. MPEDA Subsidies for Shrimp Hatcheries
J. MPEDA Subsidies for Hatchery PCR Labs
I-5

K. MPEDA Subsidies for Shrimp Farm Effluent Treatment Systems
L. MPEDA Assistance for Organic Shrimp Farmers
M. MPEDA Technology Upgrade Scheme for Marine Products
N. MPEDA Refrigerated Truck and Container Subsidy
O. MPEDA Cold Storage Subsidy
P. MPEDA Insulated Fish Box Subsidy
Q. MPEDA Subsidies for In-Process Quality Control Labs
R. MPEDA Subsidies for the Construction and Renovation of Pre-Processing Centers
S. MPEDA Worker Insurance Subsidy
T. MPEDA Sea Freight Assistance
U. Development of Inland Fisheries and Aquaculture Scheme
V. Assistance from the National Fisheries Development Board (NFDB) - Direct Transfers
Indonesia10
A. Government Provision of Loans to the Indonesian Fishing and Aquaculture Sector
B. Government Provision of Goods and Services for Less Than Adequate Remuneration (LTAR)1. Government Provision of Goods and Services Used to Promote the Indonesian Fishing andAquaculture Sector for LTAR 2. Government Provision of Electricity to the Indonesian Fishing and Aquaculture Sector forLTAR3. Government Provision of Land to the Indonesian Fishing and Aquaculture Sector for LTAR4. Government Provision of Shrimp Breeding Stock and Fry for LTAR
C. Tax Incentives from the Capital Investment Coordinating Board
D. Import Duty and VAT Exemptions in Bonded Zones
E. Grant Programs1. Government Provision of Grants to the Indonesian Fishing and Aquaculture Sector2. Government Provision of Grants for the Lampung Shrimp Pond Project
F. Export Financing Programs1. Export Financing from the Indonesia Export-Import Bank
10 Petitioner has also made a specific allegation of CP Prima’s uncreditworthiness. However, Commerce willonly initiate an investigation on this allegation if CP Prima is selected as a company respondent in its investigation.
I-6

2. Export Credit Insurance3. Export Credit Guarantees
G. Export Ban on Raw Shrimp
H. Debt Forgiveness from the Government of Indonesia
Malaysia
A. Provision of Grants under the Economic Transformation Program - Replicating Integrated AquacultureModel (IZAQs)
B. Provision of Leases and Land at Less Than Adequate Remuneration under the ETP - IZAQs
C. Pioneer Status Program
D. Investment Tax Allowance
E. Infrastructure Allowance
F. Reinvestment Allowance
G. Accelerated Capital Allowance
H. 100% Allowance on Capital Expenditure for Approved Agricultural Projects
I. Tax Incentives for Approved Food Production Activities
J. Double Deduction for the Promotion of Exports
K. Export Credit Refinancing Program
L. Supplier Credit Facility
M. Buyer Credit Facility
N. Double Deductions for Export Credit Insurance Premiums
O. Tax Exemptions for Exporters in Free Trade Zones
P. Duty Exemptions for Exporters in Free Trade Zones
Thailand
A. Subsidized Loans to the Shrimp Industry
B. Loans under Bank of Thailand Refinancing Programs
C. Discounted Financing for Machinery Upgrades
I-7

D. Short-Term Export Financing from Thailand ExIm Bank
E. Medium- and Long-Term Export Financing from Thailand ExIm Bank
F. RTG Pledging Program for Shrimp
G. RTG Price Guarantee Program for Shrimp
H. Purchase of Shrimp for More Than Adequate Remuneration
I. Price Controls on Shrimp Feed
J. Tax Coupons for Exported Goods
K. Industrial Estate Tax Incentives
L. Tax Incentives, Duty Exemptions, and Other Benefits under the Investment Promotion Act
Vietnam
A. Income Tax Programs1. Enterprise Income Tax Preferences under Articles 20 and 21 of Decree 512. Enterprise Income Tax Preferences Under Article 23 of Decree 513. Income Tax Preferences for Encouraged Industries under Chapter V of Decree 1644. Income Tax Preferences for Exporters 39 under Article 27 of Decree 51, and Article 39 ofDecree 164
B. Other Income Tax Programs1. Income Tax Preferences for FIEs2. Income Tax Reduction for Labor-Intensive Enterprises Under Decree No. 101/2011/ND-CP
C. Other Tax Programs1. Exemption of Import Tax on Equipment and Machinery Imported to Create FixedAssets Under Article 26 of Decree 51732. Import Duty Exemptions for Imported Raw Materials for Exported Goods3. Land-Use Tax Exemption/Reduction Under Article 19 of Decree 51
D. Preferential Lending1. Preferential Loans under the Aquaculture Development Scheme2. Preferential Loans for Aquaculture Upgrades3. Preferential Loans under the Seafood Processing Development Plan4. Preferential Loans for Exporters5. Investment Support Under Article 30 of Decree 51
E. The Provision of Goods and Services for Less Than Adequate Remuneration (LTAR)1. Provision of Land at LTAR under the Aquaculture Scheme2. Land-Use Levy Exemption/Reduction Under Article 17 of Decree 513. Land Rent Exemptions Under Article 18 of Decree 514. Exemption from Land and Water Rents for Encouraged Industries Under Decree 142
I-8

F. Grants1. Grants under the Aquaculture Scheme2. Grants under the Seafood Processing Development Plan
THE SUBJECT MERCHANDISE
Commerce’s Scope
Commerce has defined the scope of these investigations as follows:
Certain frozen warmwater shrimp includes certain frozen warmwater shrimp andprawns, whether wild-caught (ocean harvested) or farm-raised (produced byaquaculture), head-on or head-off, shell-on or peeled, tail-on or tail-off,11 deveined ornot deveined, cooked or raw, or otherwise processed in frozen form, regardless of size.
The frozen warmwater shrimp and prawn products included the scope, regardless ofdefinitions in the Harmonized Tariff Schedule of the United States (“HTSUS”), are productswhich are processed from warmwater shrimp and prawns through freezing and which are sold inany count size.
The products described above may be processed from any species of warmwater shrimpand prawns. Warmwater shrimp and prawns are generally classified in, but are not limited to, thePenaeidae family. Some examples of the farmed and wild-caught warmwater species include,but are not limited to, whiteleg shrimp (Penaeus vannemei), banana prawn (Penaeusmerguiensis), fleshy prawn (Penaeus chinensis), giant river prawn (Macrobrachium rosenbergii),giant tiger prawn (Penaeus monodon), redspotted shrimp (Penaeus brasiliensis), southern brownshrimp (Penaeus subtilis), southern pink shrimp (Penaeus notialis), southern rough shrimp(Trachypenaeus curvirostris), southern white shrimp (Penaeus schmitti), blue shrimp (Penaeusstylirostris), western white shrimp (Penaeus occidentalis), and Indian white prawn (Penaeusindicus).
Frozen shrimp and prawns that are packed with marinade, spices or sauce are included inthe scope. In addition, food preparations (including dusted shrimp), which are not “preparedmeals,” that contain more than 20 percent by weight of shrimp or prawn are also included in thescope.
Excluded from the scope are: (1) breaded shrimp and prawns; (2) shrimp and prawnsgenerally classified in the Pandalidae family and commonly referred to as coldwater shrimp, inany state of processing; (3) fresh shrimp and prawns whether shell-on or peeled; (4) shrimp andprawns in prepared meals; (5) dried shrimp and prawns; (6) canned warmwater shrimp andprawns; and (7) certain “battered shrimp” (see below).
“Battered shrimp” is a shrimp-based product: (1) that is produced from fresh (or thawed-from-frozen) and peeled shrimp; (2) to which a “dusting” layer of rice or wheat flour of atleast 95 percent purity has been applied; (3) with the entire surface of the shrimp flesh thoroughlyand evenly coated with the flour; (4) with the non-shrimp content of the end product constitutingbetween four and 10 percent of the product's total weight after being dusted, but prior to beingfrozen; and (5) that is subjected to individually quick frozen (“IQF”) freezing immediately afterapplication of the dusting layer. When dusted in accordance with the definition of dusting above,
11 “Tails” in this context means the tail fan, which includes the telson and the uropods.
I-9
the battered shrimp product is also coated with a wet viscous layer containing egg and/or milk,and par-fried.12
Tariff Treatment
Based upon the scope set forth by the Department of Commerce, information available to theCommission indicates that the subject goods are imported under the following provisions of the 2013HTS: subheadings 0306.17.00 (statistical reporting numbers 0306.17.0003, 0306.17.0006, 0306.17.0009,0306.17.0012, 0306.17.0015, 0306.17.0018, 0306.17.0021, 0306.17.0024, 0306.17.0027, and0306.17.0040), 1605.21.10 (statistical reporting number 1605.21.1030), and 1605.29.10 (statisticalreporting number 1605.29.1010). Current tariff rates for frozen warmwater shrimp as set forth in the HTSfor 2013 are presented in Appendix D.
THE PRODUCT
Description and Applications
The imported products subject to these investigations are frozen warmwater shrimp. The subjectproduct can be any species of warmwater shrimp and includes both shrimp that were harvested from theocean (wild-caught) and those produced by aquaculture (farm-raised). The shrimp can be in a widevariety of processed forms including head-on or head-off, tail-on or tail-off, shell-on or peeled, anddeveined or not deveined. They may be raw or further processed by cooking, skewering, or addition ofmarinades, spices, or sauces. Food preparations containing more than 20 percent by weight of shrimp areincluded in the subject product, as are dusted shrimp.
Warmwater shrimp are crustaceans that usually inhabit salt waters in coastal regions in the tropicsand subtropics. There are also freshwater species of shrimp. The warmwater shrimp subject to theseinvestigations are either wild-caught or farm-raised in tropical or subtropical regions, are generallyclassified in the Penaeidae family, and comprise shrimp of several genera and species.13 In the UnitedStates, virtually all warmwater shrimp are wild-caught.14 The catch is composed primarily of brownshrimp (Penaeus aztecus), white shrimp (Penaeus setiferus), and pink shrimp (Penaeus duorarum).Shrimp vary greatly in size, depending on age and species. They typically grow to a harvestable sizewithin one year; their size largely depends on the time of year they are harvested. 15
12 Certain Frozen Warmwater Shrimp From the People's Republic of China, Ecuador, India, Indonesia,Malaysia, Thailand, and the Socialist Republic of Vietnam: Initiation of Countervailing Duty Investigations, 78 FR5416, January 25, 2013.
13 In the previous antidumping duty investigations, it was noted that subject imports included, but were notlimited to, shrimp from the following species: whiteleg shrimp (Penaeus vannamei), banana prawn (Penaeusmerguiensis), fleshy prawn (Penaeus chinensis), giant river prawn (Machrobrachium rosenbergii), giant tiger prawn(Penaeus monodon), redspotted shrimp (Penaeus brasiliensis), southern brown shrimp (Penaeus subtilis), southernpink shrimp (Penaeus notialis), southern rough shrimp (Trachypenaeus curvirostris), southern white shrimp(Penaeus schmitti), blue shrimp (Penaeus stylirostris), western white shrimp (Penaeus occidentalis), and Indianwhite prawn (Penaeus indicus). Certain Frozen or Canned Warmwater Shrimp and Prawns from Brazil, China,Ecuador, India, Thailand, and Vietnam, Inv. Nos. 731-TA-1063-1068 (Final), USITC Publication 3748, January2005, p. I-5.
14 Shrimp aquaculture in the United States peaked in 2003 at around 4.5 percent of production and, in 2010,represented approximately 0.9 percent of production.
15 U.S. shrimp fisheries in both the South Atlantic and the Gulf of Mexico are seasonal, and seasonal peaks varyby species, with white shrimp and brown shrimp peaking between the late spring and the fall, and pink shrimp
(continued...)
I-10
Fresh shrimp (never frozen) in any form are excluded from Commerce’s scope definition.Likewise, coldwater shrimp in any form,16 shrimp in prepared meals, breaded shrimp, canned shrimp, anddried shrimp are excluded from the subject product.
Over the subject period, U.S. consumption of shrimp was consistent from year to year, at 4.1pounds per capita in 2009, 4.0 pounds per capita in 2010, and 4.2 pounds per capita in 2011.17 Warmwater shrimp are used principally for human consumption and are sold primarily on the basis ofsize. Because the tail section is the edible portion and spoilage is more rapid with the head on, mostshrimp are marketed raw and frozen with the heads off. The market tendency is for large shrimp (lessthan 36 per pound, heads-off, shell-on basis) to be sold raw and frozen to restaurants, hotels, and otherfood institutions; for small to medium shrimp (36 to 60 per pound) to be breaded, canned, or sold at retail;and for extra small (61 to 70 per pound) and tiny shrimp (more than 70 per pound) to be used by canners,dryers, and producers of specialty products. In the previous antidumping duty investigations, it wasestimated that 80 percent of shrimp in the U.S. market are bought by restaurants.18
Production Process19
Harvesting
The U.S. Gulf and South Atlantic warmwater shrimp20 fleet is composed of vessels21 spreadacross about two dozen port communities. The vessels fall into one of three broad categories: recreational shrimpers, commercial bait shrimpers, and commercial shrimpers. The catch of recreationalshrimpers and commercial bait shrimpers is very small in proportion to the catch of commercialshrimpers, who account for the great bulk of all U.S. Gulf and South Atlantic warmwater shrimp landings.
There are two categories of commercial shrimpers. Inshore shrimpers operate small boatstypically manned by one person on day-long trips in bays, estuaries, and shallow near-shore waters.Offshore shrimpers operate larger vessels typically manned by a crew of three in deeper waters out to the200-mile U.S. territorial limit. In 2011, shrimp caught less than 3 miles offshore accounted for about 42
15 (...continued)peaking in the first half of the calendar year.
16 Species of coldwater shrimp, which are generally classified in the Pandalidae family, have different physicalcharacteristics than warmwater species. In particular, they are generally much smaller in size than warmwaterspecies. Coldwater shrimp are harvested and processed in cold water regions (e.g., the U.S. Pacific Northwest, NewEngland, Canada, Greenland, Iceland, and Norway).
17 National Marine Fisheries Service (NMFS), Fisheries of the United States, 2011, August 2012, p. 96.
18 Certain Frozen or Canned Warmwater Shrimp and Prawns from Brazil, China, Ecuador, India, Thailand, andVietnam, Inv. Nos. 731-TA-1063-1068 (Final), USITC Publication 3748, January 2005, p. I-6.
19 Except as otherwise noted, background information in this section is sourced from U.S. Tariff Commission,Shrimp: Report on Investigation No. 332-40, 1961
20 Shrimp harvested off the Pacific and Northern Atlantic coasts is coldwater shrimp.
21 The number of shrimp vessels has declined substantially in recent years. In 2005, NOAA estimated that thenumber of vessels dropped from 4,000 to 2,500 between 2000 and 2005, and the number has reportedly declinedfurther since then. In press reports, COGSI reported a 50 percent decline in the number of vessels in the past tenyears (Hotakainen, “U.S. Shrimp Processors Seek Federal Help to Slow Imports,” McClatchy, January 15, 2013,http://www.mcclatchydc.com/2013/01/15/179931/us-shrimp-processors-seek-federal.html#storylink=cpy (accessedJanuary 25, 2013)).
I-11

percent of warmwater shrimp landings, with the remaining 58 percent caught between 3 and 200 milesoffshore. Some offshore vessels can freeze their catch and thus make trips lasting several weeks.22
Offshore shrimpers use vessels that are typically 56 to 85 feet in length, constructed of steel, anddiesel-powered. Such vessels are often equipped with sophisticated electronic gear for navigation,communication and locating shrimp. Most vessels are individually owned, often by the skipper. Majorcosts of operating a vessel include crew share (wages) and fuel as well as depreciation, mortgagepayments, insurance, and maintenance on the vessel.
Vessels catch shrimp by towing one or more large, funnel-shaped nets. The U.S. fleet,particularly that portion in the Gulf, is relatively mobile and migrates with the seasonal warmwatershrimp populations, or away from areas of poor fishing. Therefore vessels may land shrimp at differentports in different states. Some shrimp vessels are equipped to perform simple processing steps (e.g.,deheading, washing, grading, icing, or freezing) while at sea. Shrimp may be placed in mesh bags priorto freezing. Thus, warmwater shrimp can be landed either whole or headed (heads-off) and either fresh orfrozen, and shrimp in different forms can be landed from the same trip. Upon unloading, shrimp aregenerally sold at dockside to dealers or processors. As payment, the vessel's crew typically receive apercentage of the revenue generated by the catch. While horizontal and vertical integration is limited,some shrimpers also process shrimp and/or own multiple vessels.23
Because of the differing feeding habits, migration patterns, and habitats of the different species,Gulf and South Atlantic shrimp vessels usually land one species at a time. Likewise, harvesting activitiesand hence, landings in the U.S. Gulf and South Atlantic, exhibit seasonal patterns that are influenced bythe natural patterns of development of the different species of warmwater shrimp.
Processing
While some processors own their boats, most have buying arrangements with several shrimpvessels. After unloading, shrimp are transferred to processing facilities, which are often located dockside,and undergo initial processing such as separating shrimp from ice, weighing, washing, sizing, andgrading.24
At this stage, shrimp may either be frozen in whole form (head-on, shell-on) or may undergo anumber of further steps such as deheading, peeling, deveining, and cooking. Resulting from these stepsare shrimp in a variety of forms (e.g., head-on, shell-on; headless, shell-on; raw, peeled; and cooked,peeled). Regardless of their specific processed form, shrimp then are typically frozen (with the exceptionthat cooked, peeled shrimp may be canned rather than frozen).
Many processing steps (e.g., washing, grading, peeling, deveining, and cooking) may beperformed manually or mechanically using purpose-built machinery.25 Peeling can be done by one of twotypes of machines - the Laitram machine that operates by pushing the shrimp out of its shell, or theJonsson machine that must be fed manually and that peels the shrimp with cutting equipment.
Freezing may take either of two forms: block frozen or individually quick frozen (IQF). In theblock freezing method, shrimp and water are poured into a frame and frozen, typically in 5-pound blocks.The block is then sealed with a wrap that provides a barrier to moisture and vapor. The IQF method uses
22 National Marine Fisheries Service (NMFS), Fisheries of the United States, 2011, August 2012, p. 15.
23 Certain Frozen or Canned Warmwater Shrimp and Prawns from Brazil, China, Ecuador, India, Thailand, andVietnam, Inv. Nos. 731-TA-1063-1068 (Final), USITC Publication 3748, January 2005, p. I-7.
24 Ibid.
25 Certain Frozen or Canned Warmwater Shrimp and Prawns from Brazil, China, Ecuador, India, Thailand, andVietnam, Inv. Nos. 731-TA-1063-1068 (Final), USITC Publication 3748, January 2005, p. I-8.
I-12

carbon dioxide, nitrogen, or ammonia to freeze each shrimp individually as it travels on a belt.26 IQFlines require significant capital investment and are thus less common among smaller processors.27 Blockfrozen shrimp is most suited to customers who know that they are going use at least the full block in oneday,28 since it must be defrosted all at once.
Processing of warmwater shrimp is conducted by a variety of types of operations. Dealers (a.k.a.shrimp houses or fish houses) and packing houses perform minimal processing steps (e.g., weighing,washing, sorting, and packing) for other processors or distributors. Other processors, variously known asfreezers, peelers, and breaders, produce the variety of processed forms of shrimp noted previously andperform additional steps such as breading, cutting, and preparing specialty items.
Figure I-1Frozen warmwater shrimp: Production process
Source: Certain Frozen or Canned Warmwater Shrimp and Prawns from Brazil, China, Ecuador, India, Thailand, andVietnam, Inv. Nos. 731-TA-1063-1068 (Final), USITC Publication 3748, January 2005, p. I-9.
26 Conference transcript, p. 88 (Babin).
27 Conference transcript, p. 52 (Drake).
28 Conference transcript, pp. 88-89 (Babin).
I-13

DOMESTIC LIKE PRODUCT ISSUES
The Commission’s decision regarding the appropriate domestic product(s) that are “like” thesubject imported product is based on a number of factors including: (1) physical characteristics and uses;(2) common manufacturing facilities and production employees; (3) interchangeability; (4) customer andproducer perceptions; (5) channels of distribution; and (6) price. In the antidumping duty ordersconcerning the same product that is the subject of these petitions, the Commission included fresh shrimpas part of the domestic like product, using the “semifinished products” analysis.29
Petitioners propose defining the domestic like product to include only certain frozen warmwatershrimp (i.e., the subject product).30 Respondents argue that the domestic like product should include freshshrimp, as it did in the previous antidumping duty investigations.31 32 The Ad Hoc Shrimp IndustryCommittee33 also contends that there is one domestic like product that includes fresh and frozenwarmwater shrimp.34
29 Certain Frozen or Canned Warmwater Shrimp and Prawns from Brazil, China, Ecuador, India, Thailand, andVietnam, Inv. Nos. 731-TA-1063-1068 (Final), USITC Publication 3748, January 2005, p. 6. Fresh shrimp was alsoincluded in the domestic like product for the five-year review of these investigations. Frozen Warmwater Shrimpfrom Brazil, China, India, Thailand, and Vietnam, Inv. Nos. 731-TA-1063, 1064, 1066-1068 (Review), USITCPublication 4221, March 2011, p. 6.
30 Petition, p. I-2.
31 Trade Pacific’s postconference brief, p. 4; National Chamber of Aquaculture’s postconference brief, p. 3;Seafood Exports Association of India’s postconference brief, p. 3; Indonesian respondents’ postconference brief, p. 2.
32 Rubicon Group takes no position on the domestic like product issue. Rubicon Group’s postconference brief, p. 4.
33 The Ad Hoc Shrimp Industry Committee is comprised of several hundred businesses operating with the U.S.domestic shrimp industry, and takes no position on the petitions.
34 The Ad Hoc Shrimp Industry Committee’s postconference brief, p. 1.
I-14

II-1
PART II: CONDITIONS OF COMPETITION IN THE U.S. MARKET
U.S. MARKET CHARACTERISTICS
Warmwater shrimp are intended for human consumption and may be farm-raised or wild-caught, and may be processed to varying levels (e.g., peeled, deveined, shell-off, tail-off, marinated, skewered, or sauced). There are also multiple species of shrimp both farm-raised and wild-caught, and they exist in a range of sizes.1
For U.S.-processed warmwater shrimp, fresh shrimp are harvested (generally wild) and brought to dock by fishermen. Some deheading, sorting, and freezing may take place on the fishing boats. U.S. processors buy the fresh or frozen shrimp at the dock, and then may inspect, weigh, count, devein, peel, and cook it before freezing (refreezing) it. Some of the production will be put into inventory for later sale. U.S. processors may sell the warmwater shrimp to distributors or to retail customers directly, or have their sales handled by brokers. The market is similar for importers of warmwater shrimp; however, importers may sometimes import the warmwater shrimp and then process it themselves, either into another form of warmwater shrimp (e.g., marinated or sauced) or into a nonsubject product (e.g., breaded shrimp).2 Some processors process both U.S. and imported shrimp.3
CHANNELS OF DISTRIBUTION
U.S. processors sold product mainly to distributors while importers sold product from subject countries mainly to retailers and institutional buyers, as shown in table II-1. The major exception to this was product imported from China; this was sold mainly to distributors. Most Malaysian product was mainly sold to distributors in 2009 and most Indian product was sold to distributors in January to September 2012. Imports of product from nonsubject countries are also mainly sold to distributors.
1Certain Frozen or Canned Warmwater Shrimp and Prawns from Brazil, China, Ecuador, India, Thailand, and Vietnam, Invs. Nos. 731-TA-1063-1068 (Review), USITC Publication 4221, March 2011, p. II-1.
2 Certain Frozen or Canned Warmwater Shrimp and Prawns from Brazil, China, Ecuador, India, Thailand, and Vietnam, Invs. Nos. 731-TA-1063-1068 (Final), USITC Publication 3748, January 2005, p. II-1.
3 Conference transcript, p. 33 (Kimbough).

II-2
Table II-1 Frozen warmwater shrimp: U.S. processors’ and U.S. importers’ U.S. shipments by sources and channels of distribution, 2009-11, and January-September 2012
Item
Period
2009 2010 2011Jan.-Sept.
2012Share of U.S. shipments (percent)
U.S. processors’ U.S. shipments of frozen warmwater shrimp to:Distributors 66.6 86.4 81.4 85.1End users 9.2 5.2 6.5 6.3To retailers1/institutional buyers2 24.2 8.4 12.1 8.6
U.S. importers’ U.S. shipments of frozen warmwater shrimp from China:Distributors 68.3 94.1 92.0 97.6End users 1.0 0.4 0.2 0.1To retailers1/institutional buyers2 30.7 5.4 7.7 2.2
U.S. importers’ U.S. shipments of frozen warmwater shrimp from Ecuador:Distributors 18.5 9.7 8.7 17.4End users 0.3 18.6 6.0 43.1To retailers1/institutional buyers2 81.1 71.7 85.3 39.5
U.S. importers’ U.S. shipments of frozen warmwater shrimp from India:Distributors 3.9 14.1 18.1 72.5End users 0.1 0.2 0.4 2.3To retailers1/institutional buyers2 96.0 85.7 81.5 25.2
U.S. importers’ U.S. shipments of frozen warmwater shrimp from Indonesia:Distributors 3.5 7.0 3.8 6.2End users 1.0 1.8 0.8 1.1To retailers1/institutional buyers2 95.5 91.1 95.4 92.7
U.S. importers’ U.S. shipments of frozen warmwater shrimp from Malaysia:Distributors 54.7 1.1 1.2 1.0End users 0.0 0.0 0.0 0.0To retailers1/institutional buyers2 45.3 98.9 98.8 99.0
U.S. importers’ U.S. shipments of frozen warmwater shrimp from Thailand:Distributors 15.9 4.4 20.3 17.7End users 0.1 0.1 0.3 0.5To retailers1/institutional buyers2 84.0 95.5 79.5 81.8
U.S. importers’ U.S. shipments of fresh shrimp from Vietnam:Distributors 9.8 7.3 5.8 7.5End users 0.1 0.1 0.0 0.1To retailers1/institutional buyers2 90.1 92.6 94.2 92.4
U.S. importers’ U.S. shipments of fresh shrimp from all subject countries:Distributors 16.6 4.6 7.5 9.7End users 0.2 2.4 1.1 9.0To retailers1/institutional buyers2 83.2 93.0 91.5 81.3
U.S. importers’ U.S. shipments of fresh shrimp from all other countries:Distributors 80.1 72.4 69.3 55.5End users 2.0 2.0 3.2 3.4To retailers1/institutional buyers2 17.8 25.6 27.5 41.1
1 Entities that purchase and resell to end users (i.e., supermarkets and other retailers that sell to customers). 2 Entities such as restaurants, hotels, hospitals, etc.
Note.—numbers may not add to 100 because of rounding.
Source: Compiled from data submitted in response to Commission questionnaires.

II-3
GEOGRAPHIC DISTRIBUTION
Both U.S. processors and importers reported selling frozen warmwater shrimp to all regions in the contiguous United States (table II-2). Fourteen of 43 responding processors reported selling half or more of their product within 100 miles of their production facility, 20 sold half or more between 101 and 1,000 miles, and 6 sold half or more over 1,000 miles. Twenty-five of the 54 responding importers reported selling half or more of their product within 100 miles of their U.S. point of shipment, 17 reported selling half or more between 100 miles and 1,000 miles of their U.S. point of shipment, and 6 reported selling half or more over 1,000 miles from their U.S. point of shipment.
Table II-2 Frozen warmwater shrimp: U.S. processors’ and U.S. importers’ U.S. shipments by region
Regions U.S. processors Imports Northeast 28 32 Midwest 28 33 Southeast 40 33 Central Southwest 38 35 Mountains 17 28 Pacific Coast 20 37 Other1 6 15 1 All other U.S. markets, including AK, HI, PR, VI, among others.
Source: Compiled from data submitted in response to Commission questionnaires.
SUPPLY AND DEMAND CONSIDERATIONS
U.S. Supply
U.S. supply of fresh shrimp and natural cycle
U.S. fishermen generally harvest white, pink, and brown shrimp from the Gulf, with white and pink shrimp from the Carolina and Florida Atlantic coasts, respectively. U.S. shrimp fishermen primarily harvest only shrimp, and changes to harvests of other animals would be expensive since their equipment (trawlers, nets, etc.) are not appropriate for catching other forms of seafood. Fishermen’s decisions whether or not to shrimp depend on fixed costs including the cost of the boat, boat maintenance, insurance, and debt-servicing costs, and variable costs, including most importantly fuel, as well as equipment repair and replacement, and labor.4
Supply of warmwater shrimp in the United States
Based on available information, U.S. warmwater shrimp processors have the ability to respond to changes in demand with moderate changes in their quantity of shipments to the U.S. market. The main contributing factors to the moderate degree of responsiveness of supply are some availability of inventories, and large unused processing capacity. Supply responsiveness is limited by few alternative
4 Certain Frozen or Canned Warmwater Shrimp and Prawns from Brazil, China, Ecuador, India, Thailand, and Vietnam, Invs. Nos. 731-TA-1063-1068 (Review), USITC Publication 4221, March 2011, p. II-4.

II-4
markets and production alternatives, and biological/environmental limits on the amount of fresh shrimp that can be fished from U.S. waters.
Thirty of 47 responding processors reported that they had been unable to supply shrimp, citing: prices were below their costs; lack of fishing because of low prices; BP oil spill; high fuel costs reduced vessel profit; lack of funds for long-term inventories; vessels hired to work for BP or shrimping areas closed; and unpredictable prices. Forty-four of 60 responding processors reported that U.S. regulations affect supply, including: labor laws, environmental regulations, FDA, HACCP,5 and other regulations that increase costs but also may improve the quality and safety of the food produced. Forty processors reported that other countries’ regulations affected supply, and a number of these reported that lack of regulation in other countries reduce their competitors’ costs; other differences included that the EU has banned substances that are permitted or not tested for by the United States causing a lower grade to be imported into the U.S. market, and a tariff on U.S. product sold in the EU. Forty-seven processors reported manmade disasters had affected supply; most cited the BP oil spill.
Almost half of the importers (21 of 44) reported supply constraints, including: unavailability of wild U.S. shrimp; FDA random inspections cause delay; if demand is high sometimes supply is not available; demand in China has reduced availability; seasonality; antidumping bond requirements make it difficult to purchase as much as needed; and diseases reduce availability. Most importers (39 of 46) reported that U.S. regulations affect supply, including: FDA inspections slow delivery; and antidumping regulations limit availability. Most importers also reported that other countries’ regulations affect supply, including: labor laws in Ecuador and other labor concerns; other countries’ antibiotic restrictions are more stringent than those of the United States; and other countries do not have FDA type regulations.
Thirteen of the 43 responding U.S. processors and 11 of the 42 responding importers reported changes in their product range, product mix, and/or marketing since January 2009. U.S. processors reported changes, including: processing equipment is now being installed in Asia, allowing Asian producers to export pealed and IQF product to the U.S. market; there has been an effort to market U.S. shrimp, both wild and farmed, as better in food safety, quality, and flavor; imports of prepared products which compete with domestic product that requires preparation; BP oil spill held up shrimp marketing; the oil spill has affected the size of shrimp caught as low prices make fishing for lower priced smaller shrimp uneconomic; a flood of imports from India has driven prices down; and imports from India, Indonesia, and Malaysia have reduced the price of large headless shrimp. Importers also reported changes, including: increased availability of white shrimp; low priced inferior quality Indian product has changed the product mix with customers purchasing more white shrimp rather than black tigers; the poor economy has increased sales of smaller shrimp at lower prices; more farming of large sizes of white that get higher prices; increased demand; new items; endorsements; and health conscience.
Seasonality
The U.S. supply of wild-caught fresh shrimp varies by season. The main fishing season is May to December, although different times of the year are better for particular species and sizes. In the offseason (roughly January through April), some fishermen take time for maintenance and upgrades while others continue fishing. Although U.S. processors are able to maintain some supply of warmwater shrimp during the offseason by freezing part of their in-season inventory for later sale, prices have been historically higher in the offseason as supply of both fresh and frozen shrimp is lower. U.S. processors
5 Hazard analysis & critical control points (HACCP) “is a management system in which food safety is addressed through the analysis and control of biological, chemical, and physical hazards from raw material production, procurement and handling, to manufacturing, distribution and consumption of the finished product.” Source: HTTP://WWW.FDA.Gov/food/foodsafery/hazardanalysiscriticalcontrolpointsHACCP/default 2/1/2013

II-5
and fishermen have described this seasonal supply characteristic as a necessary cycle for fishermen and U.S. processors to make money (through higher offseason prices) and make needed repairs and upgrades.6
Most of U.S. processors (34 of 46) and most of importers (26 of 46) reported that there are business cycles or seasonality in U.S. warmwater shrimp supply.7 U.S. processors reported that U.S. shrimping tends to be seasonal,8 while imports are not because of the process of farming.9 Other factors mentioned included: demand related to the economy, holidays/lent; mainly eaten in warmer weather; size of the shrimp being caught differs from month to month; and imports have affected the business cycle.
U.S. processors’ supply
Industry capacity
U.S. processors’ capacity increased from 658.6 million pounds in 2009 to 704.9 million in 2011. The capacity utilization rate decreased from 32.9 percent in 2009 to 27.4 percent in 2011 and from 29.2 percent in January to September 2011 to 26.9 percent in January to September 2012. This relatively low level of capacity utilization suggests that U.S. processors may have substantial capacity to increase processing of frozen warmwater shrimp in response to an increase in prices. The actual responsiveness of supply, given excess capacity, depends on the availability of shrimp to be processed which is determined by the amount of shrimp available and the size and success of the shrimp fishing fleet.
Export markets
U.S. processors’ exports, as a percentage of total shipments, were less than one tenth of one percent throughout the period. U.S. processors may have very little, if any, ability to shift shipments between the U.S. market and other markets in response to price changes.
Inventory levels
U.S. processors maintain inventories to respond to year-round demand for warmwater shrimp and seasonal fluctuations in landings. U.S. processors’ inventories increased slightly. U.S. processors’ inventories, as a ratio of their total warmwater shrimp shipments, increased from 16.6 percent in 2009 to 19.8 percent in 2011, and from 17.3 percent in the first three quarters of 2011 to 25.5 percent in the first three quarters of 2012. These inventory levels suggest that U.S. processors may have some ability to respond to changes in demand with changes in the quantity shipped from inventories.
Production alternatives
Only 4 of 55 responding processors stated that they could switch production from frozen warmwater shrimp to other products. Other products that processors reportedly can produce on the same equipment as frozen warmwater shrimp are fresh shrimp and breaded shrimp.
6 Certain Frozen or Canned Warmwater Shrimp and Prawns from Brazil, China, Ecuador, India, Thailand, and Vietnam, Invs. Nos. 731-TA-1063-1068 (Review), USITC Publication 4221, March 2011, p. II-6.
7 Some processors reported that business was not seasonal because they carried product for year round sales. 8 Some reported that white shrimp and brown shrimp have different seasons. 9 Some importers reported imports also were available seasonally, with more shrimp production in the summer,
and black tiger shrimp are not available from January through March.

II-6
Supply constraints
Thirty of 47 responding processors reported that they were unable to supply product. Processors reported that shrimping boats only when it was economic for them to do so, they would not work when shrimp prices were low or fuel costs were high; that they did not always have all sizes of shrimp that might be requested; that the BP oil spill reduced production; that they had to decline orders and not take new customers; that they lack funds for long-term inventory; and that supply was constrained by natural disasters.
U.S. processors reported that fishing, safety, sanitary, environmental, business, and employment regulations increased their costs, thus affecting their supply. A number of processors questioned if imports faced the same level of regulation/enforcement. Processors were also asked about “manmade” or natural disasters or diseases. Most processors mentioned that the BP oil spill both reduced supply and undermined demand, while BP’s willingness to pay for losses and hiring of boats for the cleanup effort reduced the number of boats shrimping. Firms also reported that hurricanes and other weather related problems,10 pollution causing diseases, and “black gill” disease affected the supply of frozen warm water shrimp.
Respondents report that commercial landings in Gulf and South Atlantic states have averaged 260 million pounds per year for the last 40 years and that from 2001 through 2011 they averaged 250 million pounds per year; thus U.S. processors are not going to be able to increase their production much if prices improve, or imports decline. 11
Subject imports
Imports constitute the vast majority of the U.S. warmwater shrimp market. Warmwater shrimp production in subject foreign countries primarily uses farm-raised shrimp unlike U.S. production which primarily uses wild-caught shrimp. Shrimp of many different species can be farmed, and shrimp farms are usually designed principally for export.
Imports from subject countries increased from 894 million pounds in 2009 to 984 million in 2011 and subject imports increased from 80.0 percent of the quantity of all U.S. imports to 84.9 percent in that time. Country-by-country data were available for imports of the majority of product imported into the U.S. markets for all subject countries except Malaysia and Vietnam (table II-3).
10 Other weather problems reported included: unusually warm weather that increased predation; freezes that reduced the shrimp population; and floods that reduced the shrimp population.
11 Conference transcript, pp. 131-132 (Goldfeder).

II-7
Table II-3Frozen warmwater shrimp: Capacity, total shipments to the U.S. market, capacity utilization, inventories, sales to various markets and overall capability to shift sales to the United States
Year
Total capacity
U.S.imports1 Capacity
utilization
Inventories to
shipments
Sales to markets
Factors influencing supply responsiveness to changes in the U.S. market 1,000 short tons
Home U.S.Percent
China:
2009 *** 49,600 *** *** *** ***
Having the second lowest capacity and shipments to the U.S. market reported for 2011 may reduce China’s ability to increase supply tothe U.S. market. High inventories at the end of the period and significant exports to other countries increase its ability to increase shipments to the U.S. market; while relatively high and rising capacity utilization reduce its ability to increase shipments to the U.S. market.2011 *** 42,032 *** *** *** ***
Ecuador:
2009 312,569 133,934 57.6 4.5 3.0 44.5
Ecuador’s increasing capacity and increasing shipments to the U.S. market may increase its ability to increase supply to the U.S. market. Relatively low capacity utilization, and large quantities shipped to other markets may increase its ability to shift shipments to the U.S. market. Low inventories, however, reduce its ability to shift shipments to the U.S. market. 2011 498,848 160,421 55.9 6.5 3.1 35.3
India:
2009 617,182 42,486 16.2 12.7 0.2 33.4
India has the second largest capacity of the subject countries, as well as rapidly growing shipments to the U.S. market, which may increase its ability to increase supply to the U.S. market. Very low capacity utilization (although rising), and large share of production exported to other markets may allow it to increase shipments to the U.S. market. 2011 687,259 104,959 23.7 12.3 0.0 54.6
Indonesia:
2009 323,147 145,390 50.9 9.4 4.9 60.8
Indonesia had the second largest shipments of product to the U.S. market in 2009, however exports to the U.S. market have risen relatively little and it is no longer the second largest in 2011. High quantities sold may increase the ability to increase supply to the U.S. market; low capacity utilization increases Indonesia’s ability to shift shipments to the U.S. market. 2011 303,700 146,746 57.1 13.8 1.4 68.7
Malaysia:
2009 *** 39,466 *** *** *** ***Relatively low shipments to the U.S. may reduce Malaysian ability to increase supply to the U.S. market. However, shipments have been rising rapidly. (Data are limited by the very low response rate). 2011 *** 63,414 *** *** *** ***
Table continued on the next page.
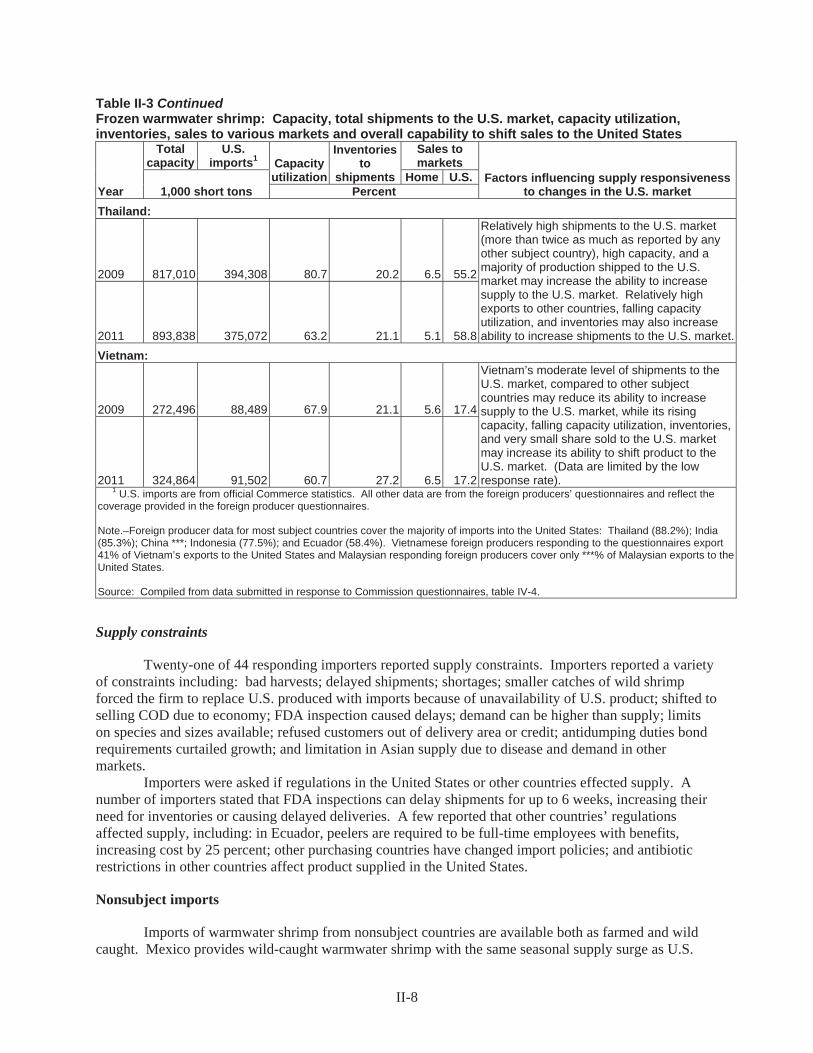
II-8
Table II-3 ContinuedFrozen warmwater shrimp: Capacity, total shipments to the U.S. market, capacity utilization, inventories, sales to various markets and overall capability to shift sales to the United States
Year
Total capacity
U.S.imports1 Capacity
utilization
Inventories to
shipments
Sales to markets
Factors influencing supply responsiveness to changes in the U.S. market 1,000 short tons
Home U.S.Percent
Thailand:
2009 817,010 394,308 80.7 20.2 6.5 55.2
Relatively high shipments to the U.S. market (more than twice as much as reported by any other subject country), high capacity, and a majority of production shipped to the U.S. market may increase the ability to increase supply to the U.S. market. Relatively high exports to other countries, falling capacity utilization, and inventories may also increase ability to increase shipments to the U.S. market.2011 893,838 375,072 63.2 21.1 5.1 58.8
Vietnam:
2009 272,496 88,489 67.9 21.1 5.6 17.4
Vietnam’s moderate level of shipments to the U.S. market, compared to other subject countries may reduce its ability to increase supply to the U.S. market, while its rising capacity, falling capacity utilization, inventories, and very small share sold to the U.S. market may increase its ability to shift product to the U.S. market. (Data are limited by the low response rate). 2011 324,864 91,502 60.7 27.2 6.5 17.2
1 U.S. imports are from official Commerce statistics. All other data are from the foreign producers’ questionnaires and reflect the coverage provided in the foreign producer questionnaires.
Note.–Foreign producer data for most subject countries cover the majority of imports into the United States: Thailand (88.2%); India (85.3%); China ***; Indonesia (77.5%); and Ecuador (58.4%). Vietnamese foreign producers responding to the questionnaires export41% of Vietnam’s exports to the United States and Malaysian responding foreign producers cover only ***% of Malaysian exports to the United States.
Source: Compiled from data submitted in response to Commission questionnaires, table IV-4.
Supply constraints
Twenty-one of 44 responding importers reported supply constraints. Importers reported a variety of constraints including: bad harvests; delayed shipments; shortages; smaller catches of wild shrimp forced the firm to replace U.S. produced with imports because of unavailability of U.S. product; shifted to selling COD due to economy; FDA inspection caused delays; demand can be higher than supply; limits on species and sizes available; refused customers out of delivery area or credit; antidumping duties bond requirements curtailed growth; and limitation in Asian supply due to disease and demand in other markets.
Importers were asked if regulations in the United States or other countries effected supply. A number of importers stated that FDA inspections can delay shipments for up to 6 weeks, increasing their need for inventories or causing delayed deliveries. A few reported that other countries’ regulations affected supply, including: in Ecuador, peelers are required to be full-time employees with benefits, increasing cost by 25 percent; other purchasing countries have changed import policies; and antibiotic restrictions in other countries affect product supplied in the United States.
Nonsubject imports
Imports of warmwater shrimp from nonsubject countries are available both as farmed and wild caught. Mexico provides wild-caught warmwater shrimp with the same seasonal supply surge as U.S.

II-9
production. Other major nonsubject country sources include Honduras, Peru, Guyana, Bangladesh, Singapore, and Venezuela.
The largest sources of nonsubject imports during January 2009-September 2012 were Mexico, Honduras, Peru, and Guyana. Combined, these countries accounted for 61.7 percent of nonsubject imports during that period.
Respondents report that nonsubject countries could supply the U.S. market all the frozen warmwater shrimp it is now importing without any imports from subject country sources 12 and that nonsubject imports would have a similar impact on U.S. prices as product from subject countries.13
U.S. Demand
Demand for warmwater shrimp comes from retail sellers of both prepared and unprepared warmwater shrimp (e.g., grocery stores) and restaurants. In recent years, larger restaurant chains and U.S. seafood processors (i.e., breaders, skewers, and marinates) have demanded warmwater shrimp in larger quantities, with year-round availability, standardized sizes, and lower prices. There is some seasonality in U.S. shrimp demand, which is typically higher around Easter, Christmas, and New Year’s.14
End Uses
U.S. demand for frozen warmwater shrimp depends on the demand for shrimp as food either as a standalone item or as an ingredient with other food. Downstream products included breaded shrimp, frozen meals, and skillet meals. Petitioners report that the “food service industry” purchases the majority of frozen warmwater shrimp in the United States. In the food service industry, it is used as a center-of-the-plate item, and accounts for the largest portion of the costs of the meal. 15
Business Cycle
While processors and importers reported important cycles affecting supply, few mentioned any cycles in demand. Petitioners, however, report that with the recent economic downturn, the food service industry has become more cost conscious.16
Apparent Consumption
Apparent U.S. consumption of frozen warmwater shrimp fluctuated during 2009-11. In 2009, apparent consumption was 1,276 million pounds; apparent consumption fell to 1,249 million pounds in 2010, and rose to 1,295 million pounds in 2011. Overall, apparent U.S. consumption in 2011 was 1.5 percent higher than in 2009. Firms indicated that demand for frozen warmwater shrimp declined because of the recession and the BP oil spill, while increased demand was driven by the reported health benefits of eating seafood, shrimp being a low fat food, and demographics.17
12 Conference transcript, p. 169 (Connelly). 13 Ecuador National Chamber of Aquaculture (NCA) post conference brief, pp. 21-22. 14 Certain Frozen or Canned Warmwater Shrimp and Prawns from Brazil, China, Ecuador, India, Thailand, and
Vietnam, Invs. Nos. 731-TA-1063-1068 (Review), USITC Publication 4221, March 2011, p. II-15. 15 Conference transcript, pp. 35-36 (Kimbrough). 16 Conference transcript, p. 36 (Kimbrough). 17 U.S. processors also reported that demand had fallen because of low-priced imports and importers reported
that the steady supply of shrimp increased demand.

II-10
Demand Perceptions
Most U.S. processors reported that U.S. demand had decreased or fluctuated since 2009, while most importers reported that demand had increased or was unchanged since 2009 (table II-4).
Table II-4 Frozen warmwater shrimp: Reported changes in demand in the United States
SupplierNumber reporting actual changes in demand in the United States since 2009
Increased No change Decreased Fluctuated U.S. processors 3 7 19 11
Importers 15 12 5 10
Source: Compiled from data submitted in response to Commission questionnaires.
Firms were asked how demand had changed outside the U.S. market (table II-5). Few processors responded and half of those responding reported no change in demand. Most importers (18 of 23), however, reported that demand outside the United States had increased. Importers that reported demand growth cited consumer affluence or growth in developing countries.
Table II-5Frozen warmwater shrimp: Reported changes in demand outside of the United States
Supplier
Number reporting actual changes in demand outside the United States since 2009
Increased No change Decreased Fluctuated U.S. processors 1 9 5 3
U.S. importers 18 1 1 3 Source: Compiled from data submitted in response to Commission questionnaires.
Substitute products
All U.S. processors and almost all importers reported that there were no substitutes.18 In general, there are few, if any, close substitutes for warmwater shrimp. While other proteins, particularly meats, fish, or shellfish may be consumed, they offer different tastes, textures, and presentations. One possible substitute for imported subject frozen warmwater shrimp is increased imports of value-added product, such as breaded shrimp, produced overseas, rather than having the frozen warmwater shrimp imported and having the value added in the United States.19
Cost share
Frozen warmwater shrimp accounts for a moderate-to-large share of the cost of the end-use products in which it is used. Reported cost shares for some end uses were as follows: distribution (95 percent); prawn in prepared meals (17- 25 percent); breaded shrimp (35-65 percent); and skillet meals (28 percent). Petitioners estimated that shrimp cost 75 percent of the total cost of food in a restaurant meal, but this cost excludes other restaurant costs such as labor and overhead.20
18 One of 39 responding importers reported a substitute (any protein). 19 Conference transcript, pp. 118, 159 (Patterson). 20 Conference transcript, p. 85 (McLendon).

II-11
Buy American
Respondents report that some of the U.S. market is covered by “Buy American” provisions, in particular U.S. Government purchases mainly for military.21 U.S. processors report that purchases under the Berry Amendment for the military account for between 2.2 and 2.4 percent of U.S. domestic shrimp production.22 Respondents report that some U.S. Commissaries “have committed to stocking Gulf Seafood and that the number might increase.”23
SUBSTITUTABILITY ISSUES
The degree of substitution between domestic and imported frozen warmwater shrimp depends upon such factors as relative prices, quality (e.g., species characteristics, consistency, flavor profile, etc.), and conditions of sale (e.g., price discounts/rebates, availability, payment terms, product services, reliability of supply, etc.). Based on available data, staff believes that there is a moderate degree of substitutability between U.S.-produced frozen warmwater shrimp and that imported from subject countries.
Factors Affecting Purchasing Decisions
Comparisons of Domestic Products, Subject Imports, and Nonsubject Imports
Processors and importers were asked whether frozen warmwater shrimp can “always,” “frequently,” “sometimes,” or “never” be used interchangeably, and whether there are differences other than price among sources (tables II-6 and II-7). Most processors reported that product from all country pairs was
21 Conference transcript, p. 99 (Bloom). 22 Petitioners’ post conference brief, Staff Questions 8, p. 2. 23 Petitioners’ post conference brief, exhibit 17.

II-12
Table II-6Frozen warmwater shrimp: Perceived interchangeability, by country pairs
Country pair
Number of firmsU.S. processors U.S. importers
A F S N A F S NU.S. vs. Subject
U.S. vs. China 20 14 2 2 0 4 8 6
U.S. vs. Ecuador 20 15 2 2 0 2 12 11
U.S. vs. India 20 15 2 2 0 4 10 11
U.S. vs. Indonesia 19 15 3 2 0 4 11 11
U.S. vs. Malaysia 20 14 2 2 2 3 10 7
U.S. vs. Thailand 20 15 2 2 2 3 13 11
U.S. vs. Vietnam 20 15 2 2 0 4 9 9 U.S. vs. Nonsubject
U.S. vs. Nonsubject 18 11 2 2 0 2 8 5 Subject vs. Subject
China vs. Ecuador 17 12 1 2 3 5 9 2
China vs. India 18 12 2 1 2 7 10 1
China vs. Indonesia 20 11 1 1 2 7 10 1
China vs. Malaysia 20 11 1 1 1 7 9 0
China vs. Thailand 19 12 1 1 3 7 9 1
China vs. Vietnam 20 11 1 1 2 7 10 2
Ecuador vs. India 17 12 2 1 3 3 15 3
Ecuador vs. Indonesia 18 12 1 2 3 4 13 3
Ecuador vs. Malaysia 18 12 1 2 2 3 10 2
Ecuador vs. Thailand 18 13 2 1 3 4 14 3
Ecuador vs. Vietnam 18 12 1 2 3 3 13 3
India vs. Indonesia 19 12 1 1 3 7 13 1
India vs. Malaysia 19 12 1 1 2 6 10 1
India vs. Thailand 18 12 2 1 2 9 14 1
India vs. Vietnam 19 11 2 1 2 8 12 1
Indonesia vs. Malaysia 20 11 1 1 4 7 6 2
Indonesia vs. Thailand 19 11 2 1 6 12 9 0
Indonesia vs. Vietnam 19 11 2 1 5 10 8 2
Malaysia vs. Thailand 19 11 1 2 4 7 7 1
Malaysia vs. Vietnam 19 11 1 2 4 6 8 2
Thailand vs. Vietnam 19 13 1 1 5 8 10 0 Subject vs. Nonsubject
China vs. Nonsubject 17 8 2 1 0 4 9 1
Ecuador vs. Nonsubject 17 8 2 1 1 4 9 1
India vs. Nonsubject 17 8 2 1 0 3 11 1
Indonesia vs. Nonsubject 17 8 2 1 1 3 10 2
Malaysia vs. Nonsubject 17 8 2 1 1 3 8 0
Thailand vs. Nonsubject 17 8 2 1 1 3 11 1
Vietnam vs. Nonsubject 17 8 2 1 0 4 10 1 Note.--A = Always, F = Frequently, S = Sometimes, N = Never.
Source: Compiled from data submitted in response to Commission questionnaires.
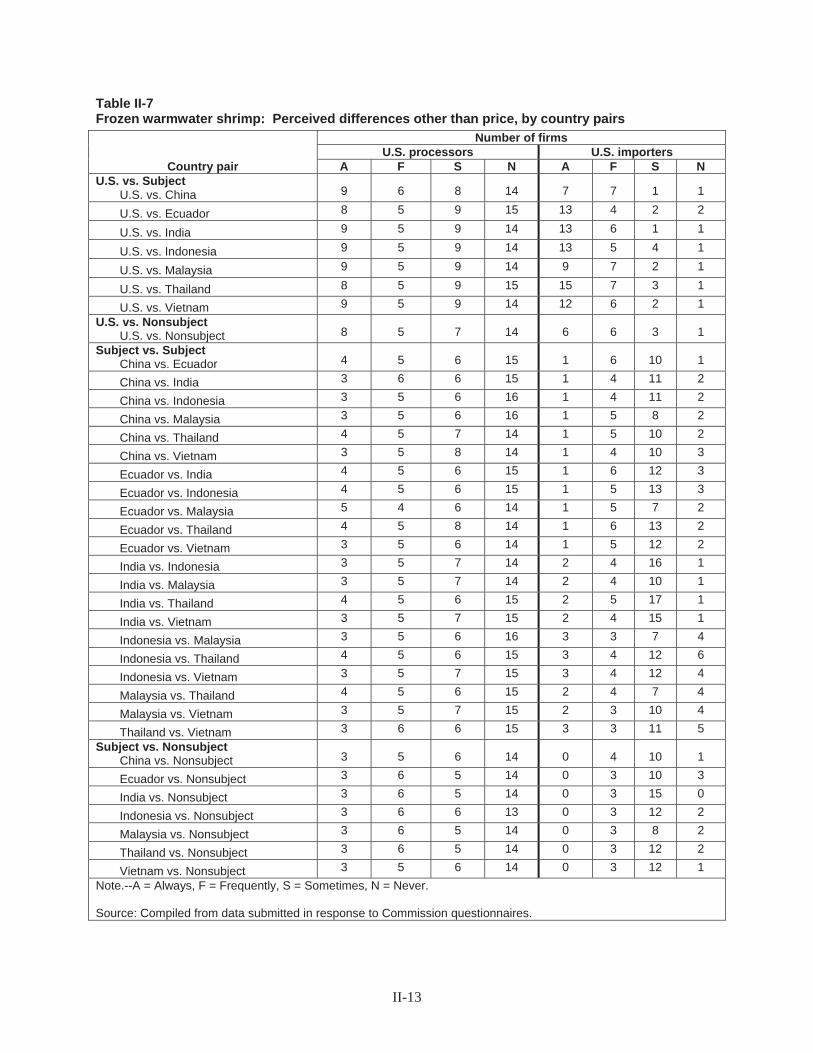
II-13
Table II-7Frozen warmwater shrimp: Perceived differences other than price, by country pairs
Country pair
Number of firmsU.S. processors U.S. importers
A F S N A F S NU.S. vs. Subject
U.S. vs. China 9 6 8 14 7 7 1 1
U.S. vs. Ecuador 8 5 9 15 13 4 2 2
U.S. vs. India 9 5 9 14 13 6 1 1
U.S. vs. Indonesia 9 5 9 14 13 5 4 1
U.S. vs. Malaysia 9 5 9 14 9 7 2 1
U.S. vs. Thailand 8 5 9 15 15 7 3 1
U.S. vs. Vietnam 9 5 9 14 12 6 2 1 U.S. vs. Nonsubject
U.S. vs. Nonsubject 8 5 7 14 6 6 3 1 Subject vs. Subject
China vs. Ecuador 4 5 6 15 1 6 10 1
China vs. India 3 6 6 15 1 4 11 2
China vs. Indonesia 3 5 6 16 1 4 11 2
China vs. Malaysia 3 5 6 16 1 5 8 2
China vs. Thailand 4 5 7 14 1 5 10 2
China vs. Vietnam 3 5 8 14 1 4 10 3
Ecuador vs. India 4 5 6 15 1 6 12 3
Ecuador vs. Indonesia 4 5 6 15 1 5 13 3
Ecuador vs. Malaysia 5 4 6 14 1 5 7 2
Ecuador vs. Thailand 4 5 8 14 1 6 13 2
Ecuador vs. Vietnam 3 5 6 14 1 5 12 2
India vs. Indonesia 3 5 7 14 2 4 16 1
India vs. Malaysia 3 5 7 14 2 4 10 1
India vs. Thailand 4 5 6 15 2 5 17 1
India vs. Vietnam 3 5 7 15 2 4 15 1
Indonesia vs. Malaysia 3 5 6 16 3 3 7 4
Indonesia vs. Thailand 4 5 6 15 3 4 12 6
Indonesia vs. Vietnam 3 5 7 15 3 4 12 4
Malaysia vs. Thailand 4 5 6 15 2 4 7 4
Malaysia vs. Vietnam 3 5 7 15 2 3 10 4
Thailand vs. Vietnam 3 6 6 15 3 3 11 5 Subject vs. Nonsubject
China vs. Nonsubject 3 5 6 14 0 4 10 1
Ecuador vs. Nonsubject 3 6 5 14 0 3 10 3
India vs. Nonsubject 3 6 5 14 0 3 15 0
Indonesia vs. Nonsubject 3 6 6 13 0 3 12 2
Malaysia vs. Nonsubject 3 6 5 14 0 3 8 2
Thailand vs. Nonsubject 3 6 5 14 0 3 12 2
Vietnam vs. Nonsubject 3 5 6 14 0 3 12 1 Note.--A = Always, F = Frequently, S = Sometimes, N = Never.
Source: Compiled from data submitted in response to Commission questionnaires.

II-14
“always” or “frequently” interchangeable. Most importers, however, reported that U.S. and imported product was only “sometimes” or “never” interchangeable and that product from different subject and nonsubject countries was “frequently” or “sometimes” interchangeable. Factors cited as limiting interchangeability include:
differences between wild and farmed shrimp (some consumers prefer domestic wild shrimp because it is considered to be free of antibiotics, chemicals and other food hazards, while shrimp from aquaculture is perceived to be prone to misuse of antibiotic and chemicals; U.S. product is wild, and wild may not be as available; U.S. wild caught product cannot be used for extended large contracts with narrow size spectrum due to size irregularity of wild; customers prefer consistent quality and supply of farm raised products, thus there is no overlap); differences in the types of shrimp (preference for tiger shrimp available from Indonesia but not the United States); differences in size, flavor, and texture of shrimp; differences in processing (U.S. product is sold mainly headless shell on while imports have more forms; United States does not produce cooked tail on or easy zip and the sizes importers sell; machine grading and packing decreases yield and increases defects of U.S. product); differences among countries (customers need to trust country of origin; farmed from Asian countries are often interchangeable between countries; China, Indonesia, Malaysia, Thailand, and Vietnam produce mainly peeled and deveined or cooked, India produces mostly shell on which competes directly with U.S. and Mexican product in large sizes; Ecuador has more small size shell on and all sizes head on which other countries do not do; Ecuador does not have the capacity to produce the same products made in Asia; Chinese product is lower quality than that from Ecuador); andother differences (water quality; and customers use product from different sources in different applications).
Most processors reported that there were either “never” or only “sometimes” differences other than price for product from each of the country pairs. Most importers, however, reported there were either “always” or “usually” differences other than price between U.S. and imported product and most importers reported that there were “sometimes” differences between most subject pairs and subject and nonsubject pairs.24 Reported differences not listed above include: small shrimp from Ecuador is hand peeled and phosphate free; BP oil spill has messed up local production, quality, and infrastructure; U.S. facilities lack good food safety controls; seasonality and labor expertise differ between countries; quality and technical support from Vietnam, Thailand, and Indonesia; import product comes from many areas and thus gives a year round supply; Vietnam and India produce tigers, the United States does not produce tiger shrimp; Thailand produces small vannamei shrimp in large volumes and the United States does not produce these in large volumes; customers prefer block frozen material that can’t be easily damaged; and Indian product is lower quality than that from Indonesia, Malaysia, Thailand, and Vietnam.
Respondents reported that there are numerous differences between U.S. and imported frozen warmwater shrimp and that these differences cause “limited to no direct competition between domestic frozen shrimp and imports.” 25 They reported that customers that want “consistent high quality product year round must buy imported farmed shrimp” and “while there are sizeable processors in the United States, none of these guys can guarantee delivery to me in the sizes and quantities that I want, when I want.”26 In addition, “restaurants can plan menus and pricing due to the programming and consistency of farmed shrimp. Supermarkets can plan advertising schedules without having to store large volumes of
24 Most importers reported that there were either “usually” or “sometimes” differences other than price between Malaysia and other subject countries.
25 Conference transcript, p. 107 (McCloskey). 26 Conference transcript, p. 99 (Bloom).
II-15
product. This leads to healthier cash flows and reduced supply chain costs.” 27 Respondents also report that the type of processing of imported and U.S. products differ; “most of Eastern Fish's imports from subject countries are further processed goods, which are almost unavailable from the domestic industry. Most U.S. product is marketed in the basic shell on block form, and to the degree that shrimp are peeled, they are mostly peeled by machine with significant broken shrimp and shell remaining.” 28 Further they report that “Gulf Coast frozen shrimp frequently has a poor appearance.” 29 They report, however, that “the frozen domestic product has its market segment. This tends to consist of smaller stores and regional distributors located in Southern, Midwest, and Mid-Atlantic states. More out of tradition than anything else, these customers still place a premium on wild caught U.S. product, whether in fresh or frozen form.”30
Although respondents argue that “for customers that demand traceability, wild caught U.S. shrimp is generally not an option,” 31 some petitioners report having traceability -- “we have recently passed the Global Food Safety Institution's safe quality foods audit, a globally recognized food safety quality management and traceability certification. Most of the boats that supply our company with shrimp have GPS units onboard that trace exactly where the boats are shrimping, and all of our product is labeled with the unloading location.”32
Representatives of the Indian processors reported that Indian product “basically does not compete with U.S. processors. We compete with … Thailand, Indonesia, Ecuador, Vietnam, China, and a few other nonsubject countries.”33 The Indonesian representative reported that Indonesian product competes mainly with other imports,34 and also reported that it was increasingly focusing on selling to its domestic market.35
27 Conference transcript, p. 100 (Bloom). 28 Conference transcript, p. 100 (Bloom). 29 Conference transcript, p. 103 (McCloskey). 30 Conference transcript, p. 106 (McCloskey). 31 Conference transcript, p. 110 (Faria). 32 Conference transcript, p. 42 (McLendon). 33 Conference transcript, pp. 123-124 (Sait). 34 Conference transcript, p. 126 (Layton). 35 Conference transcript, p. 129 (Layton).


PART III: U.S. PROCESSORS’ PRODUCTION, SHIPMENTS, ANDEMPLOYMENT
The Commission analyzes a number of factors in making injury determinations (see 19 U.S.C. §§1677(7)(B) and 1677(7)(C)). Information on the alleged subsidies was presented earlier in this report andinformation on the volume and pricing of imports of the subject merchandise is presented in Parts IV andV. Information on the other factors specified is presented in this section and/or Part VI and (except asnoted) is based on the questionnaire responses of 58 firms, 38 of which provide usable data, thataccounted for 83.8 percent of U.S. production based on live (head-on shell-on) weight during 2011.1
U.S. PROCESSORS
Warmwater shrimp is largely wild-caught in the United States in the Gulf of Mexico and theSoutheastern Atlantic.2 Table III-1 presents warmwater shrimp landings and farm production, by region,in 2011.
Table III-1Warmwater shrimp: Wild-catch landings and farm production, by region, 2011
Region Wild-catch landings Farm production All warmwater shrimp
Quantity (1,000 pounds)
Gulf 211,998 2,192 214,190
South Atlantic 22,198 (1) 22,198
Total 234,196 2,192 236,388
1 Data not available.
Note.–Farm production data is only available for Texas. U.S. processors reported that 99.3 percent of their shrimpused for production is wild-caught.
Source: NMFS, Fisheries of the United States, 2011; staff interview with Granvil Treece, Texas A&M.
Table III-2 presents a list of current domestic processors of frozen warmwater shrimp and eachcompany’s position on the petition, location, and share of reported production of frozen warmwatershrimp in 2011. No U.S. processors are related to foreign producers of the subject merchandise and twoare related to U.S. importers of the subject merchandise. In addition, as discussed in greater detail below,one U.S. processor, *** directly imports the subject merchandise and 15 purchase the subjectmerchandise from U.S. importers.
1 Staff’s coverage estimate is based on a comparison of data compiled from Commission questionnaires (198.0million pounds) to official NMFS statistics.
2 The limited farm production is also largely concentrated in the same states.
III-1

Table III-2Frozen warmwater shrimp: U.S. processors, positions on the petition, U.S. production locations,related and/or affiliated firms, and shares of 2011 reported U.S. production
FirmPosition on
petition Location
Share of 2011reported
production(percent)
Bama Sea Products *** FL ***
Bayou Shrimp Processors, Inc.1 *** LA ***
Best Sea Pack of Texas, Inc. *** TX (2)
Biloxi Freezing and Processing, Inc.3 *** MS ***
Bluewater Shrimp Company, Inc *** LA ***
Bon Secour Fisheries, Inc. *** AL ***
C F Gollott & Son Seafood Inc *** MS ***
C.J. Seafood, LLC *** SC (2)
Cape Canaveral Shrimp Co. *** FL (2)
Carson and Co., Inc. *** AL ***
David Chauvin's Seafood Co., LLC4 *** LA (2)
Dean Blanchard Seafood, Inc. *** LA (2)
Dominick's Seafood, Inc. *** AL ***
DoRan Seafood, LLC *** LA ***
Fisherman's Reef Shrimp Co. *** TX ***
Gar Shrimp Corp. *** TX ***
Garcia Enterprises, Inc. (DBA Quality Seafood) *** TX (2)
Golden Gulf Coat Packaging Co., Inc. *** MS ***
Graham Shrimp Co., Inc. *** AL ***
Table continued on next page.
III-2

Table III-2--ContinuedFrozen warmwater shrimp: U.S. processors, positions on the petition, U.S. productionlocations, related and/or affiliated firms, and shares of 2011 reported U.S. production
FirmPosition on
petition Location
Share of 2011reported
production(percent)
Gulf Crown Seafood Co, Inc. *** LA ***
Gulf Fish, Inc. *** LA ***
Gulf Island Shrimp and Seafood II, LLC *** LA ***
Gulf Pride Enterprises, Inc. *** MS ***
Gulf Shrimp, Inc. *** FL (2)
Gulf South, Inc. *** LA (2)
Hi Seas of Dulac inc. *** LA ***
International Oceanic Enterprises, Inc. of Alabama 5 *** AL ***
Intracoastal Seafood, Inc. *** LA (2)
James F. Dubberly (DBA Dubberly's MobileSeafood)6 *** GA (2)
JBS Packing Company, Inc. *** TX ***
Lafitte Frozen Foods Corp. *** LA ***
Lazaretta Packing, Inc. *** GA ***
Mariah Jade Shrimp Co.7 *** LA (2)
Mary Thi Nguyen (DBA Seafood Mart) *** LA (2)
Ocean Harvest Wholesale, Inc. *** TX ***
Ocean Pride Seafood *** LA (2)
Ocean Springs Seafood Marketing, Inc. *** MS (2)
Palacios Processor's, Inc. (DBA LighthouseSeafood) *** TX ***
Pascagoula Ice and Freezer Co., Inc. *** MS (2)
Paul Piazza and Son, Inc. *** LA ***
Pearl, Inc. (DBA Indian Ridge Shrimp Co.) *** LA ***
Penguin Frozen Food, Inc. *** IL ***
Table continued on next page.
III-3

Table III-2--ContinuedFrozen warmwater shrimp: U.S. processors, positions on the petition, U.S. productionlocations, related and/or affiliated firms, and shares of 2011 reported U.S. production
FirmPosition on
petition Location
Share of 2011reported
production(percent)
Philly Seafood Company, Inc.8 *** TX (2)
R A Lesso Brokerage Co. *** MS ***
Sea Gold9 *** CA ***
Sea Pearl Seafood Company, Inc. *** AL ***
Seabrook Seafood *** TX ***
Smith and Sons Seafood, Inc. *** GA ***
Tampa Bay Fisheries10 *** FL ***
Tex Mex Cold Storage *** TX (2)
Texas Gulf Seafood, Inc. *** TX ***
Texas Pack, Inc. *** TX (2)
The Seafood Shed11 *** LA (2)
Thunderbolt Fisherman's Seafood12 *** GA (2)
Tideland Seafood Co., Inc. *** LA ***
Tommy's Seafood Inc. *** LA ***
Vincent Piazza Jr. and Sons Sea *** LA (13)
Wood's Fisheries, Inc. *** FL ***
1 ***. 2 ***. 3 ***. 4 ***. 5 ***. 6 ***. 7 ***. 8 ***. 9 ***. 10 ***. 11 ***. 12 ***. 13 ***.
Note.–Because of rounding, figures may not add to the totals shown.
Source: Compiled from data submitted in response to Commission questionnaires.
III-4
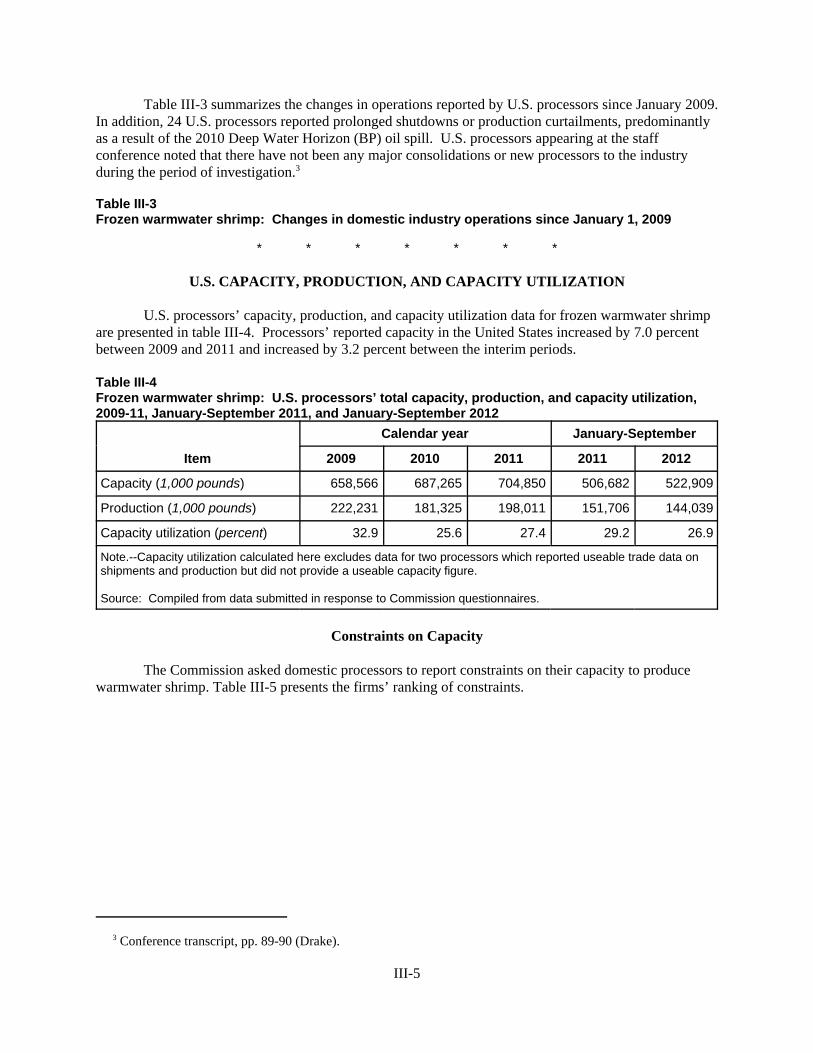
Table III-3 summarizes the changes in operations reported by U.S. processors since January 2009. In addition, 24 U.S. processors reported prolonged shutdowns or production curtailments, predominantlyas a result of the 2010 Deep Water Horizon (BP) oil spill. U.S. processors appearing at the staffconference noted that there have not been any major consolidations or new processors to the industryduring the period of investigation.3
Table III-3Frozen warmwater shrimp: Changes in domestic industry operations since January 1, 2009
* * * * * * *
U.S. CAPACITY, PRODUCTION, AND CAPACITY UTILIZATION
U.S. processors’ capacity, production, and capacity utilization data for frozen warmwater shrimpare presented in table III-4. Processors’ reported capacity in the United States increased by 7.0 percentbetween 2009 and 2011 and increased by 3.2 percent between the interim periods.
Table III-4Frozen warmwater shrimp: U.S. processors’ total capacity, production, and capacity utilization,2009-11, January-September 2011, and January-September 2012
Item
Calendar year January-September
2009 2010 2011 2011 2012
Capacity (1,000 pounds) 658,566 687,265 704,850 506,682 522,909
Production (1,000 pounds) 222,231 181,325 198,011 151,706 144,039
Capacity utilization (percent) 32.9 25.6 27.4 29.2 26.9
Note.--Capacity utilization calculated here excludes data for two processors which reported useable trade data onshipments and production but did not provide a useable capacity figure.
Source: Compiled from data submitted in response to Commission questionnaires.
Constraints on Capacity
The Commission asked domestic processors to report constraints on their capacity to producewarmwater shrimp. Table III-5 presents the firms’ ranking of constraints.
3 Conference transcript, pp. 89-90 (Drake).
III-5
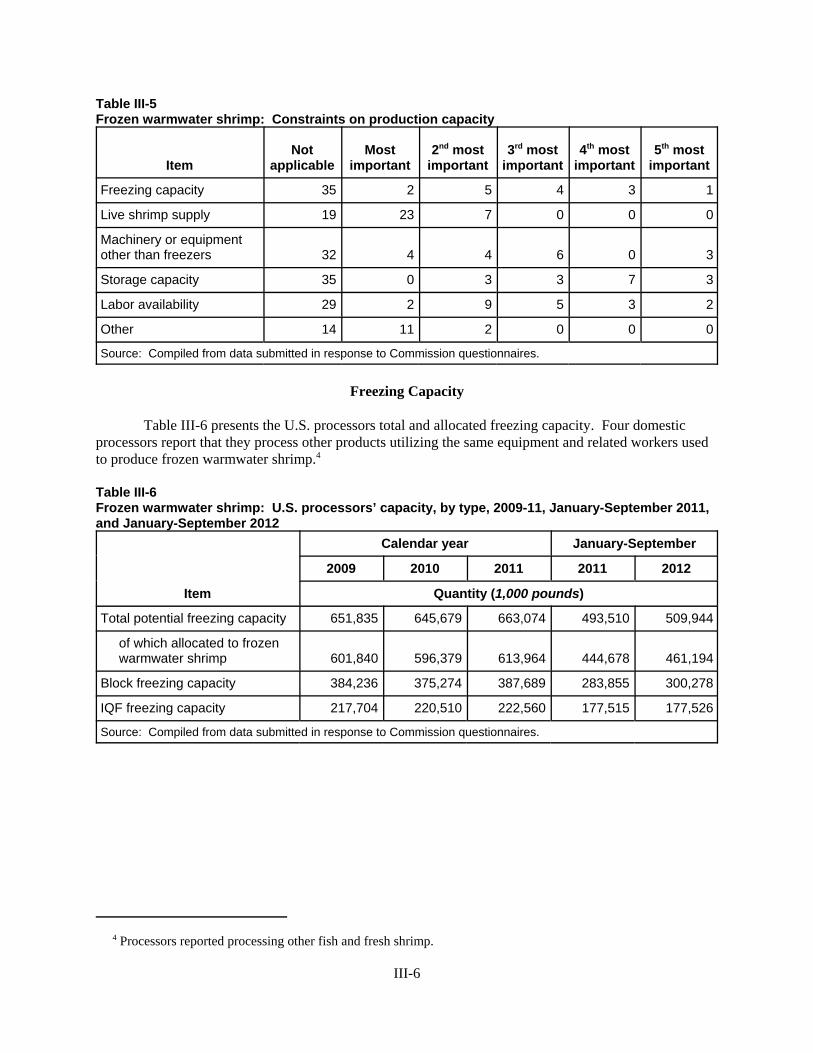
Table III-5Frozen warmwater shrimp: Constraints on production capacity
ItemNot
applicableMost
important2nd most
important3rd most
important4th most
important5th most
important
Freezing capacity 35 2 5 4 3 1
Live shrimp supply 19 23 7 0 0 0
Machinery or equipmentother than freezers 32 4 4 6 0 3
Storage capacity 35 0 3 3 7 3
Labor availability 29 2 9 5 3 2
Other 14 11 2 0 0 0
Source: Compiled from data submitted in response to Commission questionnaires.
Freezing Capacity
Table III-6 presents the U.S. processors total and allocated freezing capacity. Four domesticprocessors report that they process other products utilizing the same equipment and related workers usedto produce frozen warmwater shrimp.4
Table III-6Frozen warmwater shrimp: U.S. processors’ capacity, by type, 2009-11, January-September 2011,and January-September 2012
Item
Calendar year January-September
2009 2010 2011 2011 2012
Quantity (1,000 pounds)
Total potential freezing capacity 651,835 645,679 663,074 493,510 509,944
of which allocated to frozen warmwater shrimp 601,840 596,379 613,964 444,678 461,194
Block freezing capacity 384,236 375,274 387,689 283,855 300,278
IQF freezing capacity 217,704 220,510 222,560 177,515 177,526
Source: Compiled from data submitted in response to Commission questionnaires.
4 Processors reported processing other fish and fresh shrimp.
III-6

U.S. PROCESSORS’ SHIPMENTS
Data on U.S. processors’ shipments of frozen warmwater shrimp are presented in table III-7. Thequantity of U.S. processors’ U.S. shipments fluctuated from 2009 to 2011 but decreased overall by ***percent, and decreased by *** percent in the interim periods. The unit values of U.S. shipments increasedin each year from 2009 to 2011, increasing overall by *** percent. Unit values also increased during theinterim periods, by *** percent.
Table III-7Frozen warmwater shrimp: U.S. processors’ shipments, by types, 2009-11, January-September2011, and January-September 2012
Item
Calendar year January-September
2009 2010 2011 2011 2012
Quantity (1,000 pounds)
Commercial shipments 213,426 184,254 191,603 147,671 133,561
Internal consumption *** *** *** *** ***
Transfers to related firms *** *** *** *** ***
U.S. shipments *** *** *** *** ***
Export shipments *** *** *** *** ***
Total shipments *** *** *** *** ***
Value (1,000 dollars)
Commercial shipments 659,085 662,554 718,707 543,068 509,864
Internal consumption *** *** *** *** ***
Transfers to related firms *** *** *** *** ***
U.S. shipments *** *** *** *** ***
Export shipments *** *** *** *** ***
Total shipments *** *** *** *** ***
Unit value (per pound)
Commercial shipments $3.09 $3.60 $3.75 $3.68 $3.82
Internal consumption *** *** *** *** ***
Transfers to related firms *** *** *** *** ***
U.S. shipments *** *** *** *** ***
Export shipments *** *** *** *** ***
Total shipments *** *** *** *** ***
Table continued on next page.
III-7

Table III-7--ContinuedFrozen warmwater shrimp: U.S. processors’ shipments, by types, 2009-11, January-September2011, and January-September 2012
Item
Calendar year January-September
2009 2010 2011 2011 2012
Share of quantity (percent)
Commercial shipments 98.6 98.9 98.8 98.7 98.4
Internal consumption *** *** *** *** ***
Transfers to related firms *** *** *** *** ***
U.S. shipments *** *** *** *** ***
Export shipments *** *** *** *** ***
Total shipments 100.0 100.0 100.0 100.0 100.0
Note.–Because of rounding, figures may not add to the totals shown.
Source: Compiled from data submitted in response to Commission questionnaires.
U.S. PROCESSORS’ INVENTORIES
Table III-8 presents domestic processors’ end-of-period inventories for frozen warmwater shrimp. The domestic industry’s inventories of warmwater shrimp increased by 6.9 percent from 2009 to 2011,and also increased by 33.6 percent during the interim periods. Inventories, relative to total shipments,increased by 3.2 percentage points from 2009 to 2011, and by 8.2 percentage points during the interimperiods. Domestic processors hold more inventory in the off season, which is at the end and the verybeginning of the calendar year.5
5 Conference transcript, p. 64 (Drake).
III-8
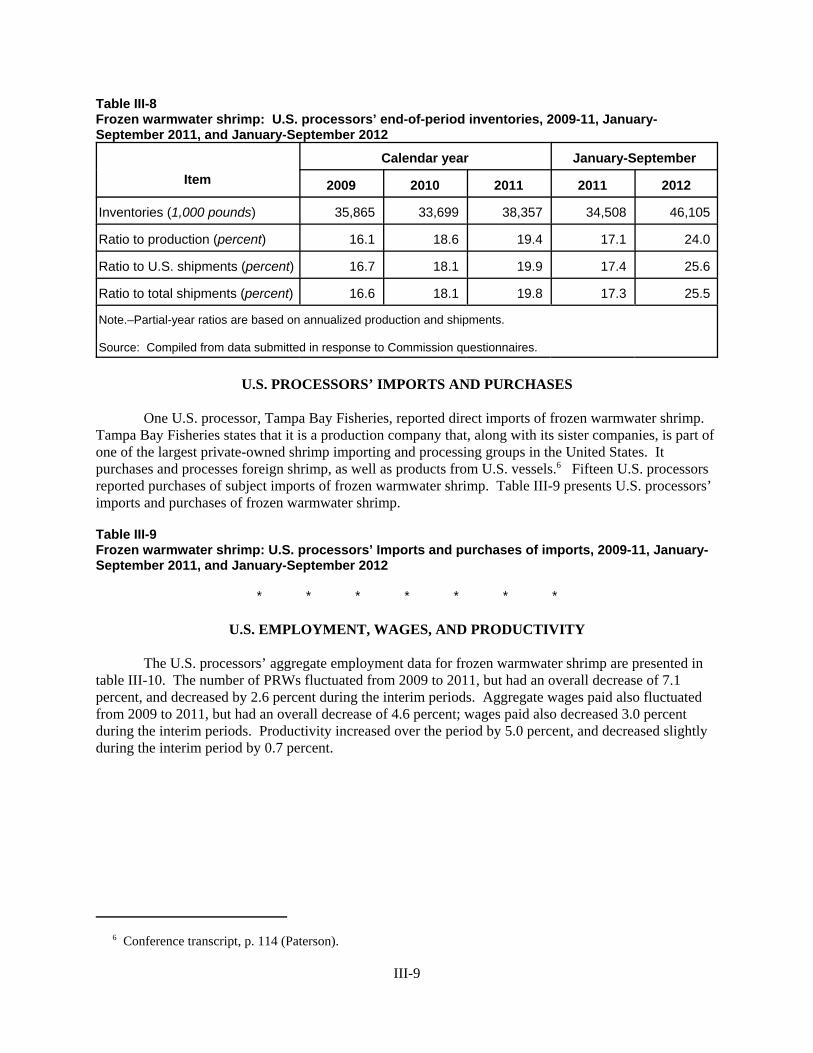
Table III-8Frozen warmwater shrimp: U.S. processors’ end-of-period inventories, 2009-11, January-September 2011, and January-September 2012
ItemCalendar year January-September
2009 2010 2011 2011 2012
Inventories (1,000 pounds) 35,865 33,699 38,357 34,508 46,105
Ratio to production (percent) 16.1 18.6 19.4 17.1 24.0
Ratio to U.S. shipments (percent) 16.7 18.1 19.9 17.4 25.6
Ratio to total shipments (percent) 16.6 18.1 19.8 17.3 25.5
Note.–Partial-year ratios are based on annualized production and shipments.
Source: Compiled from data submitted in response to Commission questionnaires.
U.S. PROCESSORS’ IMPORTS AND PURCHASES
One U.S. processor, Tampa Bay Fisheries, reported direct imports of frozen warmwater shrimp. Tampa Bay Fisheries states that it is a production company that, along with its sister companies, is part ofone of the largest private-owned shrimp importing and processing groups in the United States. Itpurchases and processes foreign shrimp, as well as products from U.S. vessels.6 Fifteen U.S. processorsreported purchases of subject imports of frozen warmwater shrimp. Table III-9 presents U.S. processors’imports and purchases of frozen warmwater shrimp.
Table III-9Frozen warmwater shrimp: U.S. processors’ Imports and purchases of imports, 2009-11, January-September 2011, and January-September 2012
* * * * * * *
U.S. EMPLOYMENT, WAGES, AND PRODUCTIVITY
The U.S. processors’ aggregate employment data for frozen warmwater shrimp are presented intable III-10. The number of PRWs fluctuated from 2009 to 2011, but had an overall decrease of 7.1percent, and decreased by 2.6 percent during the interim periods. Aggregate wages paid also fluctuatedfrom 2009 to 2011, but had an overall decrease of 4.6 percent; wages paid also decreased 3.0 percentduring the interim periods. Productivity increased over the period by 5.0 percent, and decreased slightlyduring the interim period by 0.7 percent.
6 Conference transcript, p. 114 (Paterson).
III-9

Table III-10Frozen warmwater shrimp: U.S. processors’ employment-related data, 2009-11, January-September 2011, and January-September 2012
Item
Calendar year January-September
2009 2010 2011 2011 2012
Production and related workers (PRWs) 2,069 1,859 1,922 1,830 1,782
Hours worked by PRWs (1,000 hours) 3,885 3,143 3,321 2,807 2,714
Hours worked per PRW 1,968 1,777 1,810 1,611 1,598
Wages paid to PRWs (1,000 dollars) 49,677 43,340 47,411 36,606 35,490
Hourly wages $11.77 $12.74 $13.28 $12.19 $12.37
Productivity (pounds produced per hour) 53.8 54.0 56.5 51.2 50.8
Unit labor costs (per pound) $0.23 $0.25 $0.25 $0.25 $0.25
Note.-- Calculations exclude data for a number of firms that provided partial employment data.
Source: Compiled from data submitted in response to Commission questionnaires.
III-10

PART IV: U.S. IMPORTS, APPARENT CONSUMPTION, ANDMARKET SHARES
U.S. IMPORTERS
Importer questionnaires were sent to 92 firms believed to be importers of subject frozenwarmwater shrimp, as well as to all U.S. processors of frozen warmwater shrimp.1 Questionnaireresponses were received from 46 companies, representing 55.5 percent of total subject imports and 52.9percent of total imports from China, 48.1 percent of total imports from Ecuador, 51.7 percent of totalimports from India, 64.7 percent of total imports from Indonesia, 43.5 percent of total imports fromMalaysia, 61.5 percent of total imports from Thailand, and 43.1 percent of total imports from Vietnam in2011.2 Table IV-1 lists all responding U.S. importers of frozen warmwater shrimp, the countries theyimport from, and their shares of U.S. imports in 2011.
Table IV-1Frozen warmwater shrimp: U.S. importers, countries from which they import, and shares ofsubject imports, 2011
Importer Chi
na
Ecua
dor
Indi
a
Indo
nesi
a
Mal
aysi
a
Thai
land
Viet
nam
Shar
e of
201
1 re
porte
dsu
bjec
t U.S
. im
ports
Aqua Star (USA), Corp.1 *** *** *** *** *** *** *** ***
Arista Industries, Inc. *** *** *** *** *** *** *** ***
Best Choice Trading Corp. *** *** *** *** *** *** *** (2)
C.P. Food Products, Inc.3 *** *** *** *** *** *** *** ***
Censea, Inc. *** *** *** *** *** *** *** ***
Table continued on next page.
1 The Commission sent questionnaires to firms that, based on a review of data provided by U.S. Customs andBorder Protection (“Customs”), may have imported greater than *** percent of total imports under HTS subheadingslisted in table IV-2 in any one subject country since 2009.
2 Coverage was calculated based on the official Commerce import statistics compared to the quantity of imports,in million pounds, reported in questionnaire data (22.232 for China, 77.226 for Ecuador, 54.283 for India, 95.011 forIndonesia, 27.566 for Malaysia, 230.841 for Thailand, and 39.469 for Vietnam).
IV-1
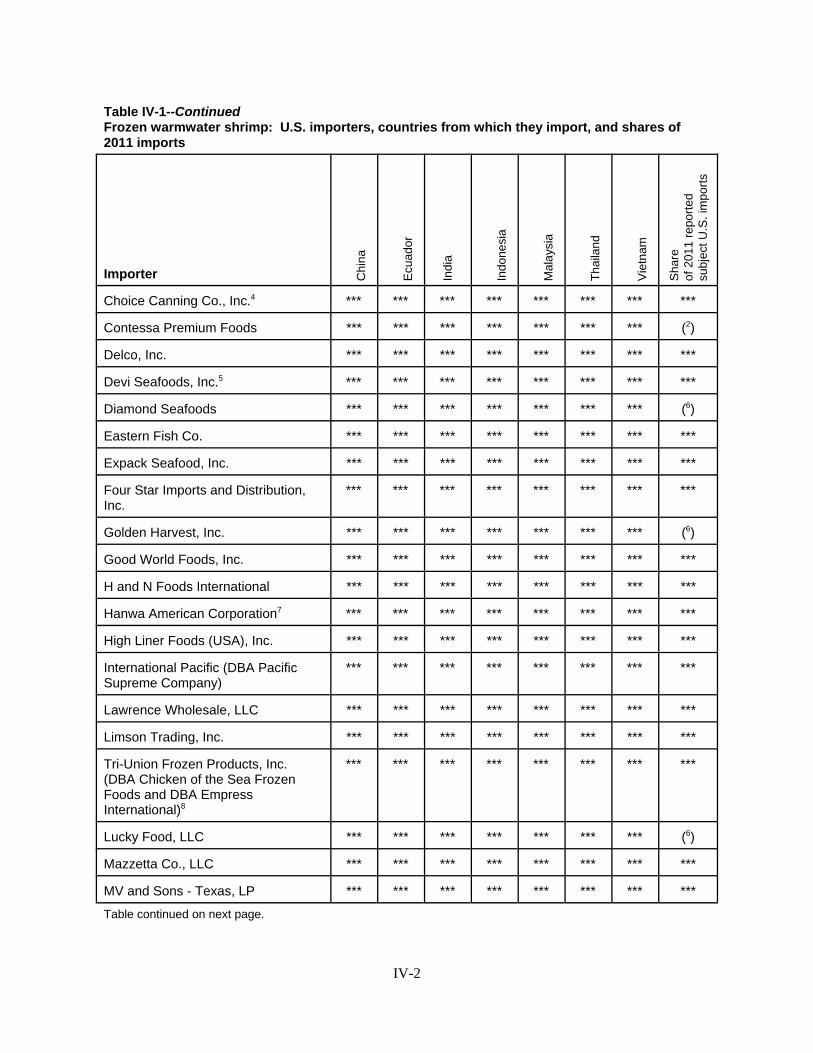
Table IV-1--ContinuedFrozen warmwater shrimp: U.S. importers, countries from which they import, and shares of2011 imports
Importer Chi
na
Ecua
dor
Indi
a
Indo
nesi
a
Mal
aysi
a
Thai
land
Viet
nam
Shar
e of
201
1 re
porte
dsu
bjec
t U.S
. im
ports
Choice Canning Co., Inc.4 *** *** *** *** *** *** *** ***
Contessa Premium Foods *** *** *** *** *** *** *** (2)
Delco, Inc. *** *** *** *** *** *** *** ***
Devi Seafoods, Inc.5 *** *** *** *** *** *** *** ***
Diamond Seafoods *** *** *** *** *** *** *** (6)
Eastern Fish Co. *** *** *** *** *** *** *** ***
Expack Seafood, Inc. *** *** *** *** *** *** *** ***
Four Star Imports and Distribution,Inc.
*** *** *** *** *** *** *** ***
Golden Harvest, Inc. *** *** *** *** *** *** *** (6)
Good World Foods, Inc. *** *** *** *** *** *** *** ***
H and N Foods International *** *** *** *** *** *** *** ***
Hanwa American Corporation7 *** *** *** *** *** *** *** ***
High Liner Foods (USA), Inc. *** *** *** *** *** *** *** ***
International Pacific (DBA PacificSupreme Company)
*** *** *** *** *** *** *** ***
Lawrence Wholesale, LLC *** *** *** *** *** *** *** ***
Limson Trading, Inc. *** *** *** *** *** *** *** ***
Tri-Union Frozen Products, Inc.(DBA Chicken of the Sea FrozenFoods and DBA EmpressInternational)8
*** *** *** *** *** *** *** ***
Lucky Food, LLC *** *** *** *** *** *** *** (6)
Mazzetta Co., LLC *** *** *** *** *** *** *** ***
MV and Sons - Texas, LP *** *** *** *** *** *** *** ***
Table continued on next page.
IV-2

Table IV-1--ContinuedFrozen warmwater shrimp: U.S. importers, countries from which they import, and shares of2011 imports
Importer Chi
na
Ecua
dor
Indi
a
Indo
nesi
a
Mal
aysi
a
Thai
land
Viet
nam
Shar
e of
201
1 re
porte
dsu
bjec
t U.S
. im
ports
North Food Group, Inc. *** *** *** *** *** *** *** ***
Ocean Bistro Corp.9 *** *** *** *** *** *** *** ***
Ocean Food, Inc. *** *** *** *** *** *** *** ***
Ore Cal Corp. *** *** *** *** *** *** *** ***
Pacific American Fish Co., Inc. *** *** *** *** *** *** *** ***
Pacific Breeze Seafood, Inc.10 *** *** *** *** *** *** *** ***
Pacific Coral Seafood Co., Inc. *** *** *** *** *** *** *** ***
Pescanova, Inc. (DBA Pescanova USA)11
*** *** *** *** *** *** *** ***
Pioneer Seafood Trading Co. *** *** *** *** *** *** *** (6)
Polar Seafood Company, LLC *** *** *** *** *** *** *** ***
Prime Seafood12 *** *** *** *** *** *** *** ***
PSC Enterprise, LLC *** *** *** *** *** *** *** ***
Ramona Trading, Inc. *** *** *** *** *** *** *** ***
Rubicon Resources, LLC13 *** *** *** *** *** *** *** ***
Sea Harvest Seafood Co. *** *** *** *** *** *** *** ***
Shells and Fish Import and ExportCo.14
*** *** *** *** *** *** *** ***
Southwind Foods, LLC (DBA GreatAmerican Seafood Imports)
*** *** *** *** *** *** *** ***
Sunnywell Seafood Trading Co., LLC *** *** *** *** *** *** *** ***
Suram Trading Corp. *** *** *** *** *** *** *** ***
Tampa Bay Fisheries15 *** *** *** *** *** *** *** ***
Worldwide Food Products *** *** *** *** *** *** *** ***
Total 100%
Table continued on next page.
IV-3

Table IV-1--ContinuedFrozen warmwater shrimp: U.S. importers, countries from which they import, and shares of2011 imports
1***. 2***. 3***. 4***. 5***. 6***. 7***. 8***. 9***. 10***. 11***. 12***. 13***. 14***. 15***.
Source: Compiled from data submitted in response to Commission questionnaires.
U.S. IMPORTS
Table IV-2 presents data for U.S. imports of frozen warmwater shrimp. Imports from Chinadecreased by 15.3 percent from 2009 to 2011, and decreased by 23.8 percent in the interim periods.Imports from Ecuador increased by 19.8 percent from 2009 to 2011, and then increased by 13.9 percent inthe interim periods. Imports from India increased by the largest percent of all subject countries, by 147.0percent from 2009 to 2011, and then increased by 24.7 percent in the interim periods. Imports fromIndonesia increased by less than one percent from 2009 to 2011, and then increased by 3.8 percent in theinterim periods. Imports from Malaysia increased by 60.7 percent from 2009 to 2011, and then decreasedby 11.9 percent in the interim periods. Imports from Thailand decreased in both the 2009-11 and interimperiods, by 4.9 and 24.7 percent respectively. Imports from Vietnam increased by 3.4 percent from 2009to 2011, and then decreased by 11.2 percent in the interim periods.
IV-4

Table IV-2Frozen warmwater shrimp: U.S. imports, by sources, 2009-11, January-September 2011, andJanuary-September 2012
Source
Calendar year January-September
2009 2010 2011 2011 2012
Quantity (1,000 pounds)
China 49,600 54,591 42,032 28,407 21,633
Ecuador 133,935 141,620 160,422 121,864 138,853
India 42,486 65,444 104,960 72,433 90,320
Indonesia 145,391 126,661 146,747 111,798 116,090
Malaysia 39,466 52,721 63,415 40,324 35,542
Thailand 394,308 414,954 375,072 261,328 196,756
Vietnam 88,490 100,834 91,503 64,380 57,139
Subtotal (subject) 893,678 956,825 984,150 700,534 656,333
All other sources 222,951 172,475 174,570 110,715 116,366
Total 1,116,629 1,129,300 1,158,720 811,249 772,699
Value (1,000 dollars)1
China 145,582 174,857 159,147 106,181 75,733
Ecuador 339,850 418,571 540,443 411,389 445,209
India 161,163 308,832 529,412 365,157 372,197
Indonesia 487,326 485,466 686,296 522,372 493,977
Malaysia 113,842 153,999 212,566 132,841 124,460
Thailand 1,324,191 1,480,787 1,655,821 1,138,813 836,122
Vietnam 379,595 511,515 504,949 353,209 311,539
Subtotal (subject) 2,951,547 3,534,025 4,288,634 3,029,961 2,659,237
All other sources 720,432 638,578 681,566 419,105 431,129
Total 3,671,979 4,172,604 4,970,199 3,449,067 3,090,366
Unit value (per pound)1
China $2.94 $3.20 $3.79 $3.74 $3.50
Ecuador 2.54 2.96 3.37 3.38 3.21
India 3.79 4.72 5.04 5.04 4.12
Indonesia 3.35 3.83 4.68 4.67 4.26
Malaysia 2.88 2.92 3.35 3.29 3.50
Thailand 3.36 3.57 4.41 4.36 4.25
Vietnam 4.29 5.07 5.52 5.49 5.45
Subtotal (subject) 3.30 3.69 4.36 4.33 4.05
All other sources 3.23 3.70 3.90 3.79 3.70
Total 3.29 3.69 4.29 4.25 4.00
Table continued on next page.
IV-5

Table IV-2--ContinuedFrozen warmwater shrimp: U.S. imports, by sources, 2009-11, January-September 2011, andJanuary-September 2012
Source
Calendar year January-September
2009 2010 2011 2011 2012
Share of quantity (percent)
China 4.4 4.8 3.6 3.5 2.8
Ecuador 12.0 12.5 13.8 15.0 18.0
India 3.8 5.8 9.1 8.9 11.7
Indonesia 13.0 11.2 12.7 13.8 15.0
Malaysia 3.5 4.7 5.5 5.0 4.6
Thailand 35.3 36.7 32.4 32.2 25.5
Vietnam 7.9 8.9 7.9 7.9 7.4
Subtotal (subject) 80.0 84.7 84.9 86.4 84.9
All other sources 20.0 15.3 15.1 13.6 15.1
Total 100.0 100.0 100.0 100.0 100.0
Share of value (percent)
China 4.0 4.2 3.2 3.1 2.5
Ecuador 9.3 10.0 10.9 11.9 14.4
India 4.4 7.4 10.7 10.6 12.0
Indonesia 13.3 11.6 13.8 15.1 16.0
Malaysia 3.1 3.7 4.3 3.9 4.0
Thailand 36.1 35.5 33.3 33.0 27.1
Vietnam 10.3 12.3 10.2 10.2 10.1
Subtotal (subject) 80.4 84.7 86.3 87.8 86.0
All other sources 19.6 15.3 13.7 12.2 14.0
Total 100.0 100.0 100.0 100.0 100.01 Landed, duty-paid.
Note.–Because of rounding, figures may not add to the totals shown. Staff recognizes that HTS subheading 0306.16 contains outof scope product (coldwater shrimp). This HTS subheading was created in 2012 and is included to maintain data consistencyacross the entire period.
Source: Compiled from official Commerce statistics, HTS numbers 0306.13.0003, 0306.13.0006, 0306.13.0009, 0306.13.0012,0306.13.0015, 0306.13.0018, 0306.13.0021, 0306.13.0024, 0306.13.0027, 0306.13.0040,0306.16.0003, 0306.16.0006,0306.16.0009, 0306.16.0012, 0306.16.0015, 0306.16.0018, 0306.16.0021, 0306.16.0024, 0306.16.0027, 0306.16.0040,0306.17.0003, 0306.17.0006, 0306.17.0009, 0306.17.0012, 0306.17.0015, 0306.17.0018, 0306.17.0021, 0306.17.0024,0306.17.0027, 0306.17.0040, 1605.20.1010, 1605.20.1030, 1605.21.1030, 1605.29.1010.
IV-6

NEGLIGIBILITY
The statute requires that an investigation be terminated without an injury determination if importsof the subject merchandise are found to be negligible.3 Negligible imports are generally defined in theTariff Act of 1930, as amended, as imports from a country of merchandise corresponding to a domesticlike product where such imports account for less than 3 percent of the volume of all such merchandiseimported into the United States in the most recent 12-month period for which data are available thatprecedes the filing of the petition or the initiation of the investigation. However, if there are imports ofsuch merchandise from a number of countries subject to investigations initiated on the same day thatindividually account for less than 3 percent of the total volume of the subject merchandise, and if theimports from those countries collectively account for more than 7 percent of the volume of all suchmerchandise imported into the United States during the applicable 12-month period, then imports fromsuch countries are deemed not to be negligible.4 Imports from each subject country and its share of totalimports are presented in table IV-3.
Table IV-3Frozen warmwater shrimp: U.S. imports and shares of total imports, by source, December 2011–November 2012
Country Imports(1,000 pounds)
Share of total imports(percent)
China 32,185 3.2
Ecuador 160,049 15.7
India 134,488 13.2
Indonesia 154,520 15.2
Malaysia 45,129 4.4
Thailand 276,900 27.2
Vietnam 84,369 8.3
Subtotal 887,640 87.3
All other countries 129,360 12.7
Total 1,017,000 100.0
Note.-Because of rounding, figures may not add to the totals shown. Data for December 2011 includescoldwater shrimp.
Source: Compiled from official Commerce Statistics, HTS numbers 0306.13.0003, 0306.13.0006, 0306.13.0009,0306.13.0012, 0306.13.0015, 0306.13.0018, 0306.13.0021, 0306.13.0024, 0306.13.0027, 0306.13.0040,0306.17.0003, 0306.17.0006, 0306.17.0009, 0306.17.0012, 0306.17.0015, 0306.17.0018, 0306.17.0021,0306.17.0024, 0306.17.0027, 0306.17.0040, 1605.20.1010, 1605.20.1030, 1605.21.1030, 1605.29.1010.
3 Sections 703(a)(1), 705(b)(1), 733(a)(1), and 735(b)(1) of the Act (19 U.S.C. §§ 1671b(a)(1), 1671d(b)(1),1673b(a)(1), and 1673d(b)(1)).
4 Section 771(24) of the Act (19 U.S.C. § 1677(24)).
IV-7
CUMULATION CONSIDERATIONS
In assessing whether imports compete with each other and with the domestic like product, theCommission has generally considered four factors: (1) fungibility, (2) presence of sales or offers to sellin the same geographical market, (3) common or similar channels of distribution, and (4) simultaneouspresence in the market. Issues concerning fungibility and channels of distribution are addressed in Part IIof this report. With regard to geographical markets, official Commerce statistics show that the majorityof U.S. imports from China entered the United States through Los Angeles, and through 17 ports total in2009-11. The majority of imports from Ecuador entered through Los Angeles and New York, andthrough 24 ports total during the period. The majority of imports from India entered through Los Angelesand New York, and through 18 ports total during the period. The majority of imports from Indonesiaentered through Los Angeles and New York, and through 21 ports total during the period. The majorityof imports from Malaysia entered through Los Angeles and New York, and through 23 ports total duringthe period. The majority of imports from Thailand entered through Los Angeles and New York, andthrough 26 ports total during the period. The majority of imports from Vietnam entered through LosAngeles and New York, and through 22 ports total during the period. Both U.S. producers and U.S.importers reported shipping frozen warmwater shrimp geographically throughout the United States.5 Imports from China, Ecuador, India, Indonesia, Malaysia, Thailand, and Vietnam were present in everymonth of the period for which data were collected.6
APPARENT U.S. CONSUMPTION
Data concerning apparent U.S. consumption of frozen warmwater shrimp during the period ofinvestigation are shown in table IV-4 and figure IV-1. Apparent U.S. consumption decreased between2009 and 2010, but then increased in 2011, increasing overall by 1.5 percent over the entire period. Thevalue of apparent U.S. consumption increased in each year between 2009 and 2011, with an overallincrease of 31.8 percent over the period.
5 See Part II, Table II-2.
6 Commerce import statistics for HTS subheadings HTS numbers 0306.13.0003, 0306.13.0006, 0306.13.0009,0306.13.0012, 0306.13.0015, 0306.13.0018, 0306.13.0021, 0306.13.0024, 0306.13.0027,0306.13.0040,0306.16.0003, 0306.16.0006, 0306.16.0009, 0306.16.0012, 0306.16.0015, 0306.16.0018,0306.16.0021, 0306.16.0024, 0306.16.0027, 0306.16.0040, 0306.17.0003, 0306.17.0006, 0306.17.0009,0306.17.0012, 0306.17.0015, 0306.17.0018, 0306.17.0021, 0306.17.0024, 0306.17.0027, 0306.17.0040,1605.20.1010, 1605.20.1030, 1605.21.1030, and 1605.29.1010.
IV-8
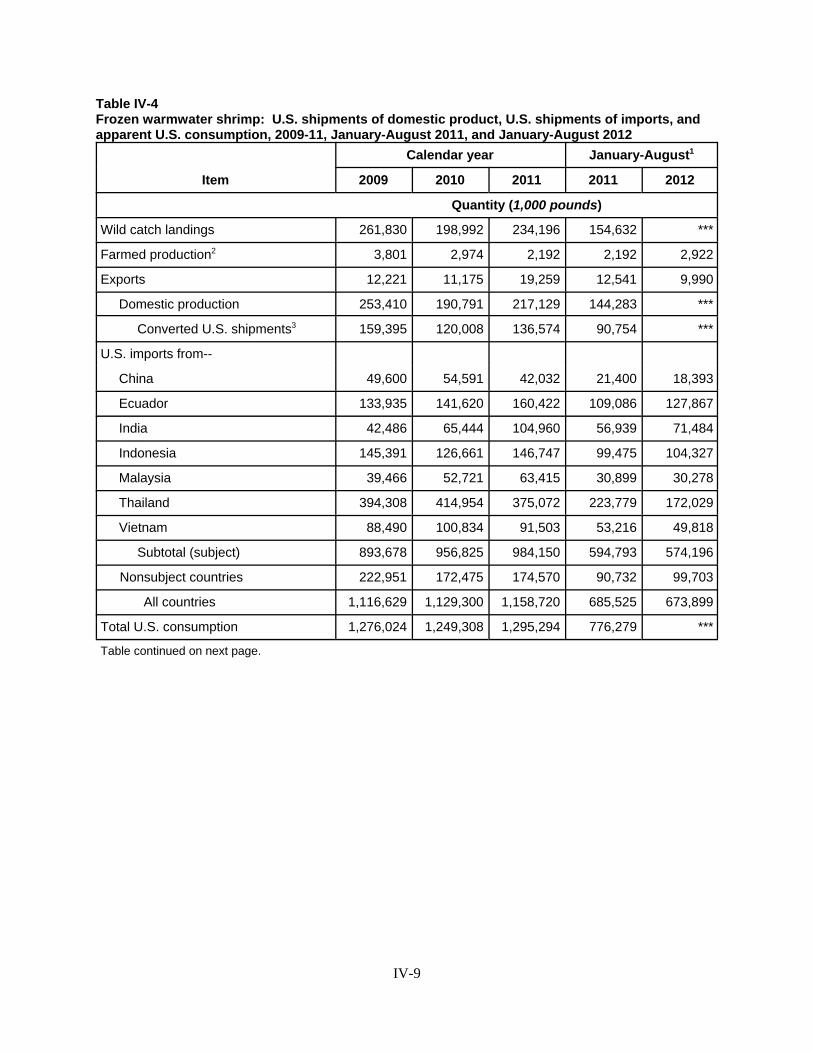
Table IV-4Frozen warmwater shrimp: U.S. shipments of domestic product, U.S. shipments of imports, andapparent U.S. consumption, 2009-11, January-August 2011, and January-August 2012
Item
Calendar year January-August1
2009 2010 2011 2011 2012
Quantity (1,000 pounds)
Wild catch landings 261,830 198,992 234,196 154,632 ***
Farmed production2 3,801 2,974 2,192 2,192 2,922
Exports 12,221 11,175 19,259 12,541 9,990
Domestic production 253,410 190,791 217,129 144,283 ***
Converted U.S. shipments3 159,395 120,008 136,574 90,754 ***
U.S. imports from--
China 49,600 54,591 42,032 21,400 18,393
Ecuador 133,935 141,620 160,422 109,086 127,867
India 42,486 65,444 104,960 56,939 71,484
Indonesia 145,391 126,661 146,747 99,475 104,327
Malaysia 39,466 52,721 63,415 30,899 30,278
Thailand 394,308 414,954 375,072 223,779 172,029
Vietnam 88,490 100,834 91,503 53,216 49,818
Subtotal (subject) 893,678 956,825 984,150 594,793 574,196
Nonsubject countries 222,951 172,475 174,570 90,732 99,703
All countries 1,116,629 1,129,300 1,158,720 685,525 673,899
Total U.S. consumption 1,276,024 1,249,308 1,295,294 776,279 ***
Table continued on next page.
IV-9

Table IV-4--ContinuedFrozen warmwater shrimp: U.S. shipments of domestic product, U.S. shipments of imports, andapparent U.S. consumption, 2009-11, January-August 2011, and January-August 2012
Item
Calendar year January-August1
2009 2010 2011 2011 2012
Value (1,000 dollars)
U.S. shipments4 631,478 543,805 701,782 468,898 ***
U.S. imports from--
China 145,582 174,857 159,147 79,062 65,119
Ecuador 339,850 418,571 540,443 367,019 410,713
India 161,163 308,832 529,412 285,585 300,994
Indonesia 487,326 485,466 686,296 463,158 448,918
Malaysia 113,842 153,999 212,566 101,584 107,939
Thailand 1,324,191 1,480,787 1,655,821 965,963 737,336
Vietnam 379,595 511,515 504,949 291,251 277,377
Subtotal (subject) 2,951,547 3,534,025 4,288,634 2,553,621 2,348,398
Nonsubject countries 720,432 638,578 681,566 345,903 369,641
All countries 3,671,979 4,172,604 4,970,199 2,899,524 2,718,038
Total U.S. consumption 4,303,457 4,716,409 5,671,982 3,368,423 ***1 2012 data is preliminary and only available through August, 2012. 2012 Wild catch landings for NC, GA, and
SC were not available, as such, South Atlantic partial year data for 2011 and 2012 only includes Florida East Coastlandings.
2 Partial year data is the same as full year data because farmed shrimp is typically stocked in April andharvested in July through October.
3 U.S. production has been converted to pounds of headless shell-on weight using a conversion factor fo 0.629. 4 U.S. processor shipment values estimated using an average of Urner Barry price series for 6 intermediate
sizes of brown and white shrimp.
Note.–Because of rounding, figures may not add to the totals shown.
Source: Wild catch and farmed production compiled from National Marine Fisheries Service “Fisheries of the UnitedStates” 2009, 2010, and 2011. January - August 2011 wild catch landings data compiled fromwww.st.nmfs.noaa.gov/st1/commercial/landings/monthly_landings.html. January - August 2012 wild catch landingsdata from NOAA Fisheries Service, ***. 2011 and 2012 farmed production from staff interview with Granvil Treece,Texas A&M. U.S. imports compiled from official import statistics, HTS numbers 0306.13.0003, 0306.13.0006,0306.13.0009, 0306.13.0012, 0306.13.0015, 0306.13.0018, 0306.13.0021, 0306.13.0024, 0306.13.0027,0306.13.0040, 0306.17.0003, 0306.17.0006, 0306.17.0009, 0306.17.0012, 0306.17.0015, 0306.17.0018,0306.17.0021, 0306.17.0024, 0306.17.0027, 0306.17.0040, 1605.20.1010, 1605.20.1030, 1605.21.1030,1605.29.1010. U.S. exports compiled from official export statistics, using the same HTS numbers as imports inchapter 03. The Schedule B export numbers used for chapter 16 are 1605.20.1010, 1605.20.1025, and1605.21.1025.
IV-10
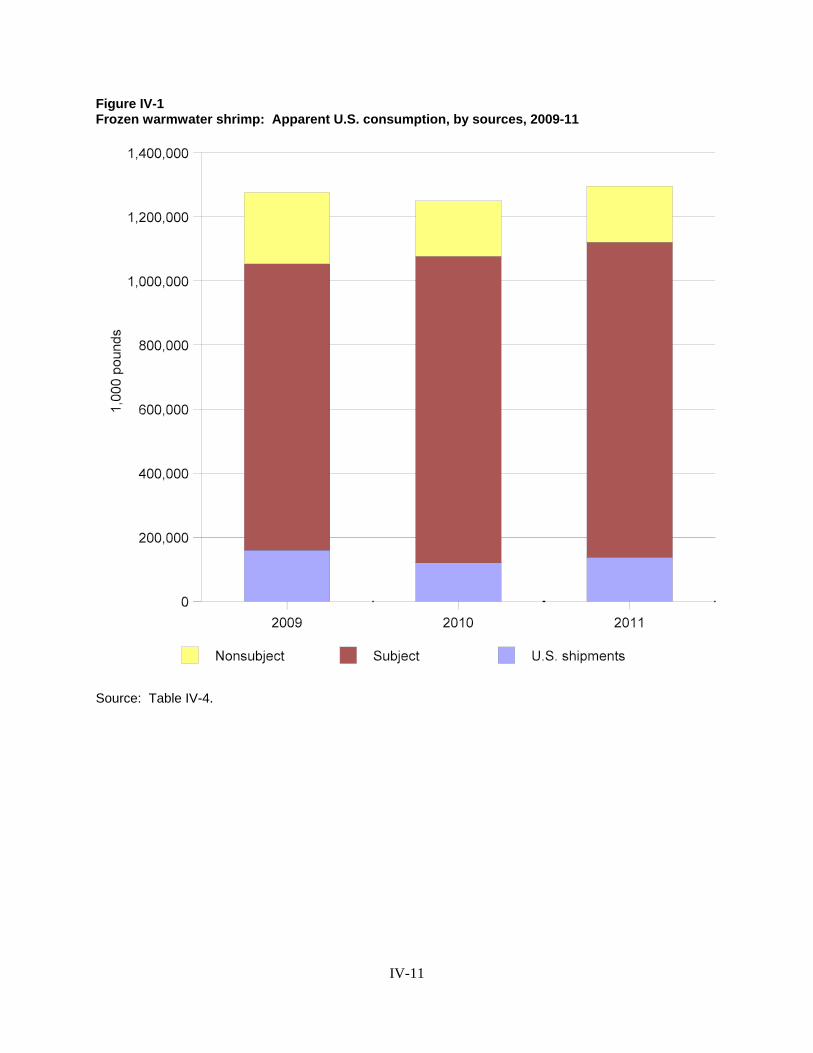
Figure IV-1Frozen warmwater shrimp: Apparent U.S. consumption, by sources, 2009-11
Source: Table IV-4.
IV-11

U.S. MARKET SHARES
U.S. market share data are presented in table IV-5. The U.S. shipments’ market share fluctuated from2009 to 2011 but decreased overall by 2 percentage points. The market share of imports of frozenwarmwater shrimp from subject countries increased by 6 percentage points from 2009 to 2011. Importsfrom nonsubject countries decreased by 4 percentage points from 2009 to 2011.
Table IV-5Frozen warmwater shrimp: U.S. consumption and market shares, 2009-11, January-August 2011,and January-August 2012
Item
Calendar year January-August
2009 2010 2011 2011 2012
Quantity (1,000 pounds)
Apparent U.S. consumption 1,276,024 1,249,308 1,295,294 776,279 ***
Value (1,000 dollars)
Apparent U.S. consumption 4,303,457 4,716,409 5,671,982 3,368,423 ***
Share of quantity (percent)
U.S. shipments 12.5 9.6 10.5 11.7 ***
U.S. imports from--
China 3.9 4.4 3.2 2.8 ***
Ecuador 10.5 11.3 12.4 14.1 ***
India 3.3 5.2 8.1 7.3 ***
Indonesia 11.4 10.1 11.3 12.8 ***
Malaysia 3.1 4.2 4.9 4.0 ***
Thailand 30.9 33.2 29.0 28.8 ***
Vietnam 6.9 8.1 7.1 6.9 ***
Subtotal (subject) 70.0 76.6 76.0 76.6 ***
Nonsubject countries 17.5 13.8 13.5 11.7 ***
All countries 87.5 90.4 89.5 88.3 ***
Table continued on next page.
IV-12

Table IV-5--ContinuedFrozen warmwater shrimp: U.S. consumption and market shares, 2009-11, January-August 2011,and January-August 2012
Item
Calendar year January-August
2009 2010 2011 2011 2012
Share of value (percent)
U.S. shipments 14.7 11.5 12.4 13.9 ***
U.S. imports from--
China 3.4 3.7 2.8 2.3 ***
Ecuador 7.9 8.9 9.5 10.9 ***
India 3.7 6.5 9.3 8.5 ***
Indonesia 11.3 10.3 12.1 13.8 ***
Malaysia 2.6 3.3 3.7 3.0 ***
Thailand 30.8 31.4 29.2 28.7 ***
Vietnam 8.8 10.8 8.9 8.6 ***
Subtotal (subject) 68.6 74.9 75.6 75.8 ***
Nonsubject countries 16.7 13.5 12.0 10.3 ***
All countries 85.3 88.5 87.6 86.1 ***
Note.–Because of rounding, figures may not add to the totals shown.
Source: Compiled from data presented in table IV-4.
IV-13

RATIO OF IMPORTS TO U.S. PRODUCTION
Information concerning the ratio of subject imports to U.S. production of frozen warmwater shrimp ispresented in table IV-6. Imports from subject countries represented 720.6 percent of U.S. production in2011, an increase of 28.5 percent since 2009.
Table IV-6Frozen warmwater shrimp: Ratio of U.S. imports to converted U.S. production, by source, 2009-11
Item
Calendar year
2009 2010 2011
Ratio of U.S. imports to converted U.S. production (percent)
China 31.1 45.5 30.8
Ecuador 84.0 118.0 117.5
India 26.7 54.5 76.9
Indonesia 91.2 105.5 107.4
Malaysia 24.8 43.9 46.4
Thailand 247.4 345.8 274.6
Vietnam 55.5 84.0 67.0
Subtotal (subject) 560.7 797.3 720.6
Nonsubject countries 139.9 143.7 127.8
All countries 700.5 941.0 848.4
Note.–Because of rounding, figures may not add to the totals shown. January-September 2011 and 2012 convertedproduction data not presented.
Source: Compiled from National Marine Fisheries Service “Fisheries of the United States” 2009, 2010, and 2011production data, converted to pounds of headless shell-on weight using a conversion factor of 0.629; and fromofficial Commerce statistics.
IV-14

V-1
PART V: PRICING DATA
FACTORS AFFECTING PRICE
Production Costs
U.S. processors reported that the most important cost for fishermen is the cost of fuel, and with rising fuel cost fishermen need higher prices for shrimp in order to continue fishing.1 Diesel prices in the Gulf Coast region nearly doubled from January 2009 to May 2011; however, since then prices have fluctuated, but not increased markedly (Figure V-1).
Figure V-1 Cost: Gulf coast diesel price by month, January 2010-September 2012
Source: http://www.eia.gov/petroleum/gasdiesel/
U.S. Inland Transportation Costs
Twenty-two U.S. processors provided usable U.S. transportation costs, averaging 5 percent and ranging from 1 to 20 percent of the total delivered cost of their U.S. shipments.2 Twenty-two importers reported usable U.S. transportation costs, averaging 5 percent and ranging from 1 to 16 percent of total delivered costs.
1 Conference transcript, p. 39 (Babin). 2 Transportation costs reported as 50 percent or higher, or as zero were not used.
0.000.501.001.502.002.503.003.504.004.50
2009 2010 2011 2012
Dollarspe
rgallon
diesel price
V-2
PRICING PRACTICES
Pricing Methods
Most firms report selling warmwater shrimp on a spot basis.3 Thirty-eight U.S. processors reported that they set prices for frozen warmwater shrimp on a transaction-by-transaction basis, 12 reported price lists, and 5 reported contracts. Forty importers reported setting prices on a transaction-by-transaction basis, 27 reported contracts, and 17 price lists. Price lists may be issued as frequently as once per week and may contain different prices for different sizes and species, for freezing method (block or IQF), and for the extent of peeling. U.S. processors’ and importers’ short-term contracts were generally three to six months, fixed both price and quantity, were not typically renegotiable, and did not typically contain meet-or-release provisions. Importers’ long-term contracts were for 1-3 years, and may fix quantity, or fix both price and quantity, and typically did not have meet-or-release provisions.Respondents report that because they are able to provide contracts for frozen warmwater shrimp where U.S. processors are less able to make contracts, importers therefore are the only ones who are able to compete in markets with the longer lead times required for advertising promotions.4
Sales Terms and Discounts
Thirty-two of 43 responding processors and 20 of 49 responding importers reported that the majority of their sales were on a delivered basis; 11 processors and 13 importers reported that most sales were on a free on board (fob) basis; while an additional 10 importers, but no processors, reported using both fob and delivered basis. Thirty-five of 36 responding U.S. processors and 26 of 29 responding importers reported sales terms of 30 days.
Overall, 26 of 43 responding U.S. processors, and 30 of 44 responding importers reported offering no or limited discounts. However, 13 U.S. processors and 11 importers reported offering quantity or total volume discounts; and 10 U.S. processors and 4 importers offer other types of discounts.5
PRICE DATA
The Commission requested U.S. processors and U.S. importers of frozen warmwater shrimp to provide quarterly data for the total quantity and value of frozen warmwater shrimp that was shipped to unrelated customers in the U.S. market. Quarterly data were requested for the period January 2009–September 2012. The products for which pricing data were requested are as follows:
Product 1.-- Frozen, raw warmwater shrimp or prawns, all species, 71 to 90 count, headless, peeled (whether or not deveined), tail-off, block frozen (cut or not cut).
Product 2.-- Frozen, raw warmwater shrimp or prawns, all species, 41 to 50 count, P&D (peeled and deveined), tail-off, block frozen (cut or not cut).
Product 3.-- Frozen, raw warmwater shrimp or prawns, all species, 10 to 15 count, headless, shell-on, block frozen.
3 Thirty-five of 41 responding U.S. processors and 24 of 43 responding importers reported selling the majority of warmwater shrimp in the spot market; 24 processors and 15 importers sold all their product on a spot basis.
4 Conference transcript, p. 100 (Bloom). 5 Three processors and one importer offered both quantity discounts and other discounts.

V-3
Product 4.-- Frozen, cooked warmwater shrimp or prawns, all species, 26 to 30 count, P&D (peeled and deveined), headless, tail-on or tail-off, IQF (individually quick frozen).
Thirty U.S. processors6 and 40 importers7 provided usable price data for sales of the four products, although not all firms reported prices for all products and all quarters. Reported pricing products represented *** percent of U.S. shipments of U.S.-produced products and 0.4 percent of imported product from China, 5.2 percent of imports from Ecuador, 2.2 percent of imports from India, 4.5 percent of imports from Indonesia, 15.4 percent of imports from Malaysia, 3.1 percent for imports from Thailand, and 3.1 percent of imports from Vietnam. Price data are presented in tables V-1 to V-4 and figures V-2 to V-5.
6 Processors providing usable price data were: ***. 7 Importers providing usable price data were: ***.

V-4
Table V-1 Frozen warmwater shrimp: Weighted-average f.o.b. prices and quantities of domestic and imported product 1,1 and margins of underselling/(overselling), by quarter, January 2009-September 2012
Period
United States China Ecuador Price
(dollarsper
pound)Quantity (pounds)
Price(dollars
perpound)
Quantity (pounds) Margin
Price(dollars
perpound)
Quantity (pounds) Margin
2009: Jan.-March 3.23 853,145 *** *** *** 2.79 275,277 13.8April.-June 2.86 1,479,307 *** *** *** 3.22 335,768 (12.7)July-Sept. 2.51 1,353,281 *** *** *** 2.71 238,688 (7.8)Oct.-Dec. 2.63 1,017,789 *** *** *** 2.82 282,892 (7.1)
2010: Jan.-March 3.24 939,319 *** *** *** 2.77 559,426 14.5April.-June 3.85 979,897 *** *** *** 2.67 674,295 30.6July-Sept. 3.03 1,196,355 *** *** *** 2.63 663,810 13.2Oct.-Dec. 3.05 1,060,885 *** *** *** 2.85 479,444 6.8
2011: Jan.-March 3.15 815,263 *** *** *** 2.95 505,975 6.1April.-June 2.71 1,457,912 *** *** *** 2.91 566,574 (7.7)July-Sept. 2.79 1,503,283 *** *** *** 2.88 550,386 (3.1)Oct.-Dec. 3.61 830,008 *** *** *** *** *** ***
2012: Jan.-March 3.99 735,206 *** *** *** 2.93 641,044 26.6April.-June 3.47 1,405,985 *** *** *** 2.88 626,267 16.8July-Sept. 3.06 1,315,899 *** *** *** 2.96 602,185 3.1
United States India Indonesia Price
(dollarsper
pound)Quantity (pounds)
Price(dollars
perpound)
Quantity (pounds) Margin
Price(dollars
perpound)
Quantity (pounds) Margin
2009: Jan.-March 3.23 853,145 -- 0 -- *** *** ***April.-June 2.86 1,479,307 -- 0 -- 3.58 127,147 (25.2)July-Sept. 2.51 1,353,281 -- 0 -- *** *** ***Oct.-Dec. 2.63 1,017,789 -- 0 -- *** *** ***
2010: Jan.-March 3.24 939,319 *** *** *** *** *** ***April.-June 3.85 979,897 -- 0 -- *** *** ***July-Sept. 3.03 1,196,355 *** *** *** *** *** ***Oct.-Dec. 3.05 1,060,885 *** *** *** *** *** ***
2011: Jan.-March 3.15 815,263 *** *** *** *** *** ***April.-June 2.71 1,457,912 -- 0 -- 4.31 132,438 (59.2)July-Sept. 2.79 1,503,283 *** *** *** 3.92 52,625 (40.3)Oct.-Dec. 3.61 830,008 *** *** *** *** *** ***
2012: Jan.-March 3.99 735,206 *** *** *** *** *** ***April.-June 3.47 1,405,985 -- 0 -- *** *** ***July-Sept. 3.06 1,315,899 *** *** *** *** *** ***
Table continued on next page.
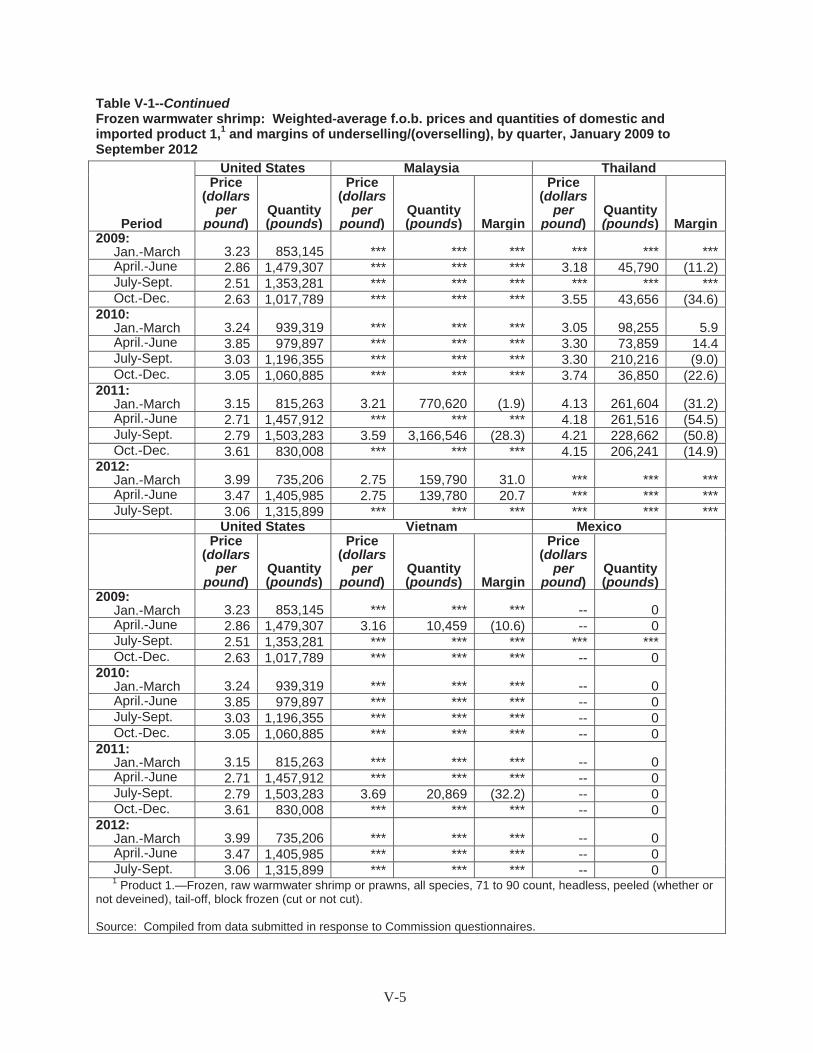
V-5
Table V-1--ContinuedFrozen warmwater shrimp: Weighted-average f.o.b. prices and quantities of domestic and imported product 1,1 and margins of underselling/(overselling), by quarter, January 2009 to September 2012
Period
United States Malaysia ThailandPrice
(dollarsper
pound)Quantity (pounds)
Price(dollars
perpound)
Quantity (pounds) Margin
Price(dollars
perpound)
Quantity (pounds) Margin
2009: Jan.-March 3.23 853,145 *** *** *** *** *** ***April.-June 2.86 1,479,307 *** *** *** 3.18 45,790 (11.2)July-Sept. 2.51 1,353,281 *** *** *** *** *** ***Oct.-Dec. 2.63 1,017,789 *** *** *** 3.55 43,656 (34.6)
2010: Jan.-March 3.24 939,319 *** *** *** 3.05 98,255 5.9April.-June 3.85 979,897 *** *** *** 3.30 73,859 14.4July-Sept. 3.03 1,196,355 *** *** *** 3.30 210,216 (9.0)Oct.-Dec. 3.05 1,060,885 *** *** *** 3.74 36,850 (22.6)
2011: Jan.-March 3.15 815,263 3.21 770,620 (1.9) 4.13 261,604 (31.2)April.-June 2.71 1,457,912 *** *** *** 4.18 261,516 (54.5)July-Sept. 2.79 1,503,283 3.59 3,166,546 (28.3) 4.21 228,662 (50.8)Oct.-Dec. 3.61 830,008 *** *** *** 4.15 206,241 (14.9)
2012: Jan.-March 3.99 735,206 2.75 159,790 31.0 *** *** ***April.-June 3.47 1,405,985 2.75 139,780 20.7 *** *** ***July-Sept. 3.06 1,315,899 *** *** *** *** *** ***
United States Vietnam Mexico Price
(dollarsper
pound)Quantity (pounds)
Price(dollars
perpound)
Quantity (pounds) Margin
Price(dollars
perpound)
Quantity (pounds)
2009: Jan.-March 3.23 853,145 *** *** *** -- 0April.-June 2.86 1,479,307 3.16 10,459 (10.6) -- 0July-Sept. 2.51 1,353,281 *** *** *** *** ***Oct.-Dec. 2.63 1,017,789 *** *** *** -- 0
2010: Jan.-March 3.24 939,319 *** *** *** -- 0April.-June 3.85 979,897 *** *** *** -- 0July-Sept. 3.03 1,196,355 *** *** *** -- 0Oct.-Dec. 3.05 1,060,885 *** *** *** -- 0
2011: Jan.-March 3.15 815,263 *** *** *** -- 0April.-June 2.71 1,457,912 *** *** *** -- 0July-Sept. 2.79 1,503,283 3.69 20,869 (32.2) -- 0Oct.-Dec. 3.61 830,008 *** *** *** -- 0
2012: Jan.-March 3.99 735,206 *** *** *** -- 0April.-June 3.47 1,405,985 *** *** *** -- 0July-Sept. 3.06 1,315,899 *** *** *** -- 0
1 Product 1.—Frozen, raw warmwater shrimp or prawns, all species, 71 to 90 count, headless, peeled (whether or not deveined), tail-off, block frozen (cut or not cut).
Source: Compiled from data submitted in response to Commission questionnaires.

V-6
Table V-2 Frozen warmwater shrimp: Weighted-average f.o.b. prices and quantities of domestic and imported product 2,1 and margins of underselling/(overselling), by quarter, January 2009 to September 2012
Period
United States Ecuador India Price
(dollarsper
pound)Quantity (pounds)
Price(dollars
perpound)
Quantity (pounds) Margin
Price(dollars
perpound)
Quantity (pounds) Margin
2009: Jan.-Mar. 3.71 385,438 2.67 1,257,385 28.2 -- 0 --April.-June 3.29 594,814 *** *** *** -- 0 --July-Sept. 2.63 1,095,020 2.83 790,277 (7.4) -- 0 --Oct.-Dec. 2.67 632,633 2.98 709,655 (11.3) -- 0 --
2010: Jan.-Mar. 3.16 344,782 2.67 1,132,936 15.6 *** *** ***April.-June 3.64 360,511 2.99 1,589,898 17.9 -- 0 --July-Sept. 3.41 752,600 3.03 1,246,229 11.1 *** *** ***Oct.-Dec. 3.25 814,530 3.23 1,076,591 0.8 *** *** ***
2011: Jan.-Mar. 3.74 586,732 *** *** *** -- 0 --April.-June 3.76 479,855 3.13 1,212,892 16.8 -- 0 --July-Sept. 3.71 1,780,600 3.14 1,150,780 15.3 *** *** ***Oct.-Dec. 4.10 665,004 3.08 764,937 24.9 -- 0 --
2012: Jan.-Mar. 4.43 319,586 3.25 1,945,964 26.6 *** *** ***April.-June 4.21 658,932 2.96 1,523,561 29.7 *** *** ***July-Sept. 3.93 1,438,008 2.98 921,318 24.1 *** *** ***
United States Indonesia Malaysia Price
(dollarsper
pound)Quantity (pounds)
Price(dollars
perpound)
Quantity (pounds) Margin
Price(dollars
perpound)
Quantity (pounds) Margin
2009: Jan.-Mar. 3.71 385,438 *** *** *** *** *** ***April.-June 3.29 594,814 3.27 294,243 0.6 *** *** ***July-Sept. 2.63 1,095,020 3.46 155,306 (31.6) *** *** ***Oct.-Dec. 2.67 632,633 3.20 201,386 (19.8) *** *** ***
2010: Jan.-Mar. 3.16 344,782 *** *** *** *** *** ***April.-June 3.64 360,511 *** *** *** 3.06 262,196 16.0July-Sept. 3.41 752,600 3.22 286,787 5.5 *** *** ***Oct.-Dec. 3.25 814,530 3.17 323,579 2.6 *** *** ***
2011: Jan.-Mar. 3.74 586,732 *** *** *** *** *** ***April.-June 3.76 479,855 3.82 113,785 (1.7) *** *** ***July-Sept. 3.71 1,780,600 3.94 155,956 (6.2) *** *** ***Oct.-Dec. 4.10 665,004 3.70 102,463 9.7 3.55 1,000,496 13.4
2012: Jan.-Mar. 4.43 319,586 3.53 115,715 20.3 3.27 80,660 26.1April.-June 4.21 658,932 3.71 96,543 11.9 *** *** ***July-Sept. 3.93 1,438,008 3.69 94,122 6.1 *** *** ***
Table continued on next page.

V-7
Table V-2--ContinuedFrozen warmwater shrimp: Weighted-average f.o.b. prices and quantities of domestic and imported product 2,1 and margins of underselling/(overselling), by quarter, January 2009 to September 2012
Period
United States Thailand VietnamPrice
(dollarsper
pound)Quantity (pounds)
Price(dollars
perpound)
Quantity (pounds) Margin
Price(dollars
perpound)
Quantity (pounds) Margin
2009: Jan.-March 3.71 385,438 *** *** *** *** *** ***April.-June 3.29 594,814 *** *** *** *** *** ***July-Sept. 2.63 1,095,020 *** *** *** *** *** ***Oct.-Dec. 2.67 632,633 *** *** *** *** *** ***
2010: Jan.-March 3.16 344,782 *** *** *** *** *** ***April.-June 3.64 360,511 *** *** *** *** *** ***July-Sept. 3.41 752,600 *** *** *** *** *** ***Oct.-Dec. 3.25 814,530 *** *** *** *** *** ***
2011: Jan.-March 3.74 586,732 *** *** *** *** *** ***April.-June 3.76 479,855 *** *** *** *** *** ***July-Sept. 3.71 1,780,600 *** *** *** *** *** ***Oct.-Dec. 4.10 665,004 *** *** *** *** *** ***
2012: Jan.-March 4.43 319,586 *** *** *** 5.55 125,377 (25.3)April.-June 4.21 658,932 *** *** *** *** *** ***July-Sept. 3.93 1,438,008 *** *** *** 5.19 185,667 (32.0)
United States Mexico Price
(dollarsper
pound)Quantity (pounds)
Price(dollars
perpound)
Quantity (pounds)
2009: Jan.-March 3.71 385,438 *** *** April.-June 3.29 594,814 *** *** July-Sept. 2.63 1,095,020 *** *** Oct.-Dec. 2.67 632,633 *** ***
2010: Jan.-March 3.16 344,782 *** *** April.-June 3.64 360,511 *** *** July-Sept. 3.41 752,600 -- 0 Oct.-Dec. 3.25 814,530 -- 0
2011: Jan.-March 3.74 586,732 -- 0 April.-June 3.76 479,855 *** *** July-Sept. 3.71 1,780,600 *** *** Oct.-Dec. 4.10 665,004 *** ***
2012: Jan.-March 4.43 319,586 *** *** April.-June 4.21 658,932 *** *** July-Sept. 3.93 1,438,008 -- 0
1 Product 2.—Frozen, raw warmwater shrimp or prawns, all species, 41 to 50 count, P&D (peeled and deveined), tail-off, block frozen (cut or not cut).
Note--Only one price was available for product 2 from China, ***.
Source: Compiled from data submitted in response to Commission questionnaires.

V-8
Table V-3 Frozen warmwater shrimp: Weighted-average f.o.b. prices and quantities of domestic and imported product 3,1 and margins of underselling/(overselling), by quarter, January 2009 to September 2012
Period
United States Ecuador India Price
(dollarsper
pound)Quantity (pounds)
Price(dollars
perpound)
Quantity (pounds) Margin
Price(dollars
perpound)
Quantity (pounds) Margin
2009: Jan.-March 5.71 276,793 *** *** *** 6.08 82,584 (6.5)April.-June 5.54 356,966 *** *** *** 6.22 107,648 (12.3)July-Sept. 5.01 497,709 *** *** *** 6.18 73,940 (23.4)Oct.-Dec. 5.64 589,371 *** *** *** 5.98 58,680 (6.1)
2010: Jan.-March 5.66 480,178 *** *** *** 6.81 71,924 (20.3)April.-June 7.50 434,147 *** *** *** 8.44 101,048 (12.5)July-Sept. 7.01 416,226 *** *** *** 9.13 106,232 (30.2)Oct.-Dec. 7.34 419,756 *** *** *** 8.26 126,446 (12.5)
2011: Jan.-March 8.60 198,727 *** *** *** 9.01 206,917 (4.7)April.-June 8.78 509,705 *** *** *** 8.78 181,672 (0.1)July-Sept. 7.52 689,080 *** *** *** 9.04 211,696 (20.3)Oct.-Dec. 7.74 591,600 *** *** *** 8.53 180,497 (10.2)
2012: Jan.-March 7.30 419,618 *** *** *** 8.59 154,730 (17.6)April.-June 6.91 383,955 *** *** *** 8.02 178,891 (16.1)July-Sept. 6.43 722,315 *** *** *** 7.26 161,733 (13.0)
United States Indonesia Malaysia Price
(dollarsper
pound)Quantity (pounds)
Price(dollars
perpound)
Quantity (pounds) Margin
Price(dollars
perpound)
Quantity (pounds) Margin
2009: Jan.-March 5.71 276,793 *** *** *** *** *** ***April.-June 5.54 356,966 6.25 41,016 (12.7) *** *** ***July-Sept. 5.01 497,709 6.18 73,800 (23.5) -- 0 --Oct.-Dec. 5.64 589,371 6.28 47,836 (11.3) -- 0 --
2010: Jan.-March 5.66 480,178 6.89 82,984 (21.7) -- 0 --April.-June 7.50 434,147 7.93 101,472 (5.7) -- 0 --July-Sept. 7.01 416,226 8.98 84,888 (28.0) -- 0 --Oct.-Dec. 7.34 419,756 8.74 44,898 (19.1) -- 0 --
2011: Jan.-March 8.60 198,727 9.41 60,683 (9.3) *** *** ***April.-June 8.78 509,705 9.11 173,540 (3.8) *** *** ***July-Sept. 7.52 689,080 9.14 55,967 (21.6) *** *** ***Oct.-Dec. 7.74 591,600 8.38 29,490 (8.2) *** *** ***
2012: Jan.-March 7.30 419,618 9.55 32,128 (30.8) *** *** ***April.-June 6.91 383,955 6.64 31,936 3.8 *** *** ***July-Sept. 6.43 722,315 *** *** *** *** *** ***
Table continued on next page.
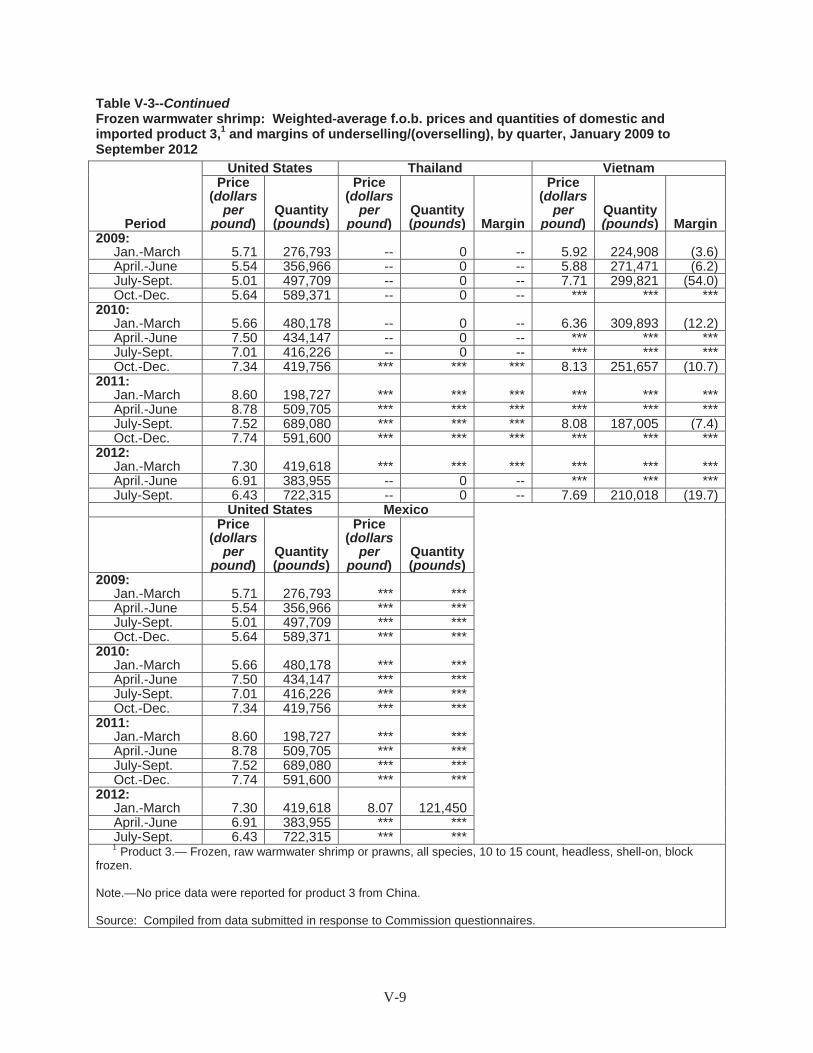
V-9
Table V-3--ContinuedFrozen warmwater shrimp: Weighted-average f.o.b. prices and quantities of domestic and imported product 3,1 and margins of underselling/(overselling), by quarter, January 2009 to September 2012
Period
United States Thailand VietnamPrice
(dollarsper
pound)Quantity (pounds)
Price(dollars
perpound)
Quantity (pounds) Margin
Price(dollars
perpound)
Quantity (pounds) Margin
2009: Jan.-March 5.71 276,793 -- 0 -- 5.92 224,908 (3.6)April.-June 5.54 356,966 -- 0 -- 5.88 271,471 (6.2)July-Sept. 5.01 497,709 -- 0 -- 7.71 299,821 (54.0)Oct.-Dec. 5.64 589,371 -- 0 -- *** *** ***
2010: Jan.-March 5.66 480,178 -- 0 -- 6.36 309,893 (12.2)April.-June 7.50 434,147 -- 0 -- *** *** ***July-Sept. 7.01 416,226 -- 0 -- *** *** ***Oct.-Dec. 7.34 419,756 *** *** *** 8.13 251,657 (10.7)
2011: Jan.-March 8.60 198,727 *** *** *** *** *** ***April.-June 8.78 509,705 *** *** *** *** *** ***July-Sept. 7.52 689,080 *** *** *** 8.08 187,005 (7.4)Oct.-Dec. 7.74 591,600 *** *** *** *** *** ***
2012: Jan.-March 7.30 419,618 *** *** *** *** *** ***April.-June 6.91 383,955 -- 0 -- *** *** ***July-Sept. 6.43 722,315 -- 0 -- 7.69 210,018 (19.7)
United States Mexico Price
(dollarsper
pound)Quantity (pounds)
Price(dollars
perpound)
Quantity (pounds)
2009: Jan.-March 5.71 276,793 *** *** April.-June 5.54 356,966 *** *** July-Sept. 5.01 497,709 *** *** Oct.-Dec. 5.64 589,371 *** ***
2010: Jan.-March 5.66 480,178 *** *** April.-June 7.50 434,147 *** *** July-Sept. 7.01 416,226 *** *** Oct.-Dec. 7.34 419,756 *** ***
2011: Jan.-March 8.60 198,727 *** *** April.-June 8.78 509,705 *** *** July-Sept. 7.52 689,080 *** *** Oct.-Dec. 7.74 591,600 *** ***
2012: Jan.-March 7.30 419,618 8.07 121,450 April.-June 6.91 383,955 *** *** July-Sept. 6.43 722,315 *** ***
1 Product 3.— Frozen, raw warmwater shrimp or prawns, all species, 10 to 15 count, headless, shell-on, block frozen.
Note.—No price data were reported for product 3 from China.
Source: Compiled from data submitted in response to Commission questionnaires.
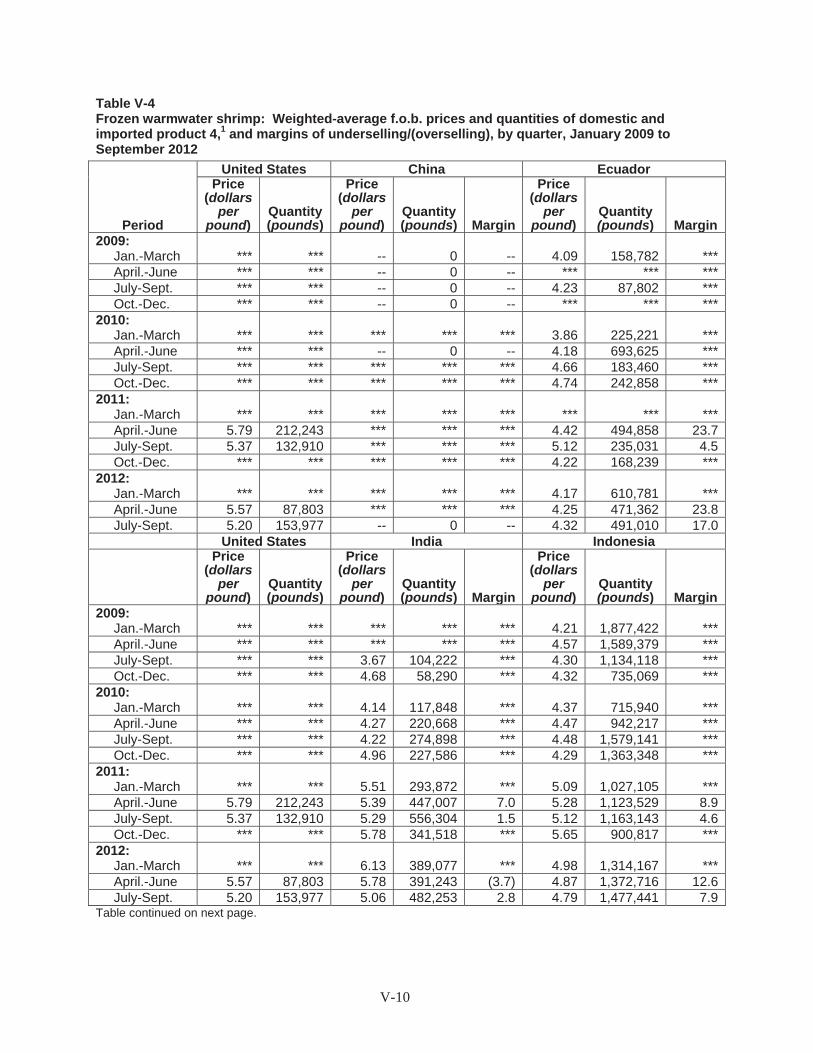
V-10
Table V-4 Frozen warmwater shrimp: Weighted-average f.o.b. prices and quantities of domestic and imported product 4,1 and margins of underselling/(overselling), by quarter, January 2009 to September 2012
Period
United States China Ecuador Price
(dollarsper
pound)Quantity (pounds)
Price(dollars
perpound)
Quantity (pounds) Margin
Price(dollars
perpound)
Quantity (pounds) Margin
2009: Jan.-March *** *** -- 0 -- 4.09 158,782 ***April.-June *** *** -- 0 -- *** *** ***July-Sept. *** *** -- 0 -- 4.23 87,802 ***Oct.-Dec. *** *** -- 0 -- *** *** ***
2010: Jan.-March *** *** *** *** *** 3.86 225,221 ***April.-June *** *** -- 0 -- 4.18 693,625 ***July-Sept. *** *** *** *** *** 4.66 183,460 ***Oct.-Dec. *** *** *** *** *** 4.74 242,858 ***
2011: Jan.-March *** *** *** *** *** *** *** ***April.-June 5.79 212,243 *** *** *** 4.42 494,858 23.7July-Sept. 5.37 132,910 *** *** *** 5.12 235,031 4.5Oct.-Dec. *** *** *** *** *** 4.22 168,239 ***
2012: Jan.-March *** *** *** *** *** 4.17 610,781 ***April.-June 5.57 87,803 *** *** *** 4.25 471,362 23.8July-Sept. 5.20 153,977 -- 0 -- 4.32 491,010 17.0
United States India Indonesia Price
(dollarsper
pound)Quantity (pounds)
Price(dollars
perpound)
Quantity (pounds) Margin
Price(dollars
perpound)
Quantity (pounds) Margin
2009: Jan.-March *** *** *** *** *** 4.21 1,877,422 ***April.-June *** *** *** *** *** 4.57 1,589,379 ***July-Sept. *** *** 3.67 104,222 *** 4.30 1,134,118 ***Oct.-Dec. *** *** 4.68 58,290 *** 4.32 735,069 ***
2010: Jan.-March *** *** 4.14 117,848 *** 4.37 715,940 ***April.-June *** *** 4.27 220,668 *** 4.47 942,217 ***July-Sept. *** *** 4.22 274,898 *** 4.48 1,579,141 ***Oct.-Dec. *** *** 4.96 227,586 *** 4.29 1,363,348 ***
2011: Jan.-March *** *** 5.51 293,872 *** 5.09 1,027,105 ***April.-June 5.79 212,243 5.39 447,007 7.0 5.28 1,123,529 8.9July-Sept. 5.37 132,910 5.29 556,304 1.5 5.12 1,163,143 4.6Oct.-Dec. *** *** 5.78 341,518 *** 5.65 900,817 ***
2012: Jan.-March *** *** 6.13 389,077 *** 4.98 1,314,167 ***April.-June 5.57 87,803 5.78 391,243 (3.7) 4.87 1,372,716 12.6July-Sept. 5.20 153,977 5.06 482,253 2.8 4.79 1,477,441 7.9
Table continued on next page.

V-11
Table V-4--ContinuedFrozen warmwater shrimp: Weighted-average f.o.b. prices and quantities of domestic and imported product 4,1 and margins of underselling/(overselling), by quarter, January 2009 to September 2012
Period
United States Malaysia Thailand Price
(dollarsper
pound)Quantity (pounds)
Price(dollars
perpound)
Quantity (pounds) Margin
Price(dollars
perpound)
Quantity (pounds) Margin
2009: Jan.-March *** *** -- 0 -- 4.87 1,667,676 ***April.-June *** *** *** *** *** 5.01 2,585,047 ***July-Sept. *** *** *** *** *** 4.78 2,529,388 ***Oct.-Dec. *** *** -- 0 -- 4.78 3,689,257 ***
2010: Jan.-March *** *** -- 0 -- 4.77 2,509,082 ***April.-June *** *** -- 0 -- 4.96 3,175,671 ***July-Sept. *** *** -- 0 -- 4.98 2,461,544 ***Oct.-Dec. *** *** *** *** *** 5.85 4,009,933 ***
2011: Jan.-March *** *** *** *** *** 6.13 1,669,636 ***April.-June 5.79 212,243 *** *** *** 6.59 1,814,914 (13.8)July-Sept. 5.37 132,910 *** *** *** 6.86 1,247,092 (27.8)Oct.-Dec. *** *** *** *** *** 6.92 2,574,070 ***
2012: Jan.-March *** *** *** *** *** 6.79 1,321,773 ***April.-June 5.57 87,803 *** *** *** 6.83 1,312,248 (22.5)July-Sept. 5.20 153,977 *** *** *** 6.34 1,404,909 (21.8)
United States Vietnam Mexico Price
(dollarsper
pound)Quantity (pounds)
Price(dollars
perpound)
Quantity (pounds) Margin
Price(dollars
perpound)
Quantity (pounds)
2009: Jan.-March *** *** 4.62 174,143 *** *** ***April.-June *** *** 5.57 247,235 *** -- 0July-Sept. *** *** 5.28 145,549 *** -- 0Oct.-Dec. *** *** 5.69 438,179 *** *** ***
2010: Jan.-March *** *** 5.27 205,302 *** *** ***April.-June *** *** 5.41 204,112 *** -- 0July-Sept. *** *** 6.13 165,175 *** -- 0Oct.-Dec. *** *** *** *** *** -- 0
2011: Jan.-March *** *** 5.42 160,801 *** -- 0April.-June 5.79 212,243 5.95 210,589 (2.8) -- 0July-Sept. 5.37 132,910 6.76 191,830 (25.9) -- 0Oct.-Dec. *** *** 7.40 460,655 *** -- 0
2012: Jan.-March *** *** 7.07 111,141 *** -- 0April.-June 5.57 87,803 6.74 144,553 (20.9) *** ***July-Sept. 5.20 153,977 6.69 196,263 (28.5) *** ***
1 Product 4.—Frozen, cooked warmwater shrimp or prawns, all species, 26 to 30 count, P&D (peeled and deveined), headless, tail-on or tail-off, IQF (individually quick frozen).
Source: Compiled from data submitted in response to Commission questionnaires.

V-12
Figure V-2 Frozen warmwater shrimp: Weighted-average f.o.b. prices and quantities of domestic and imported product 1, by quarter, January 2009-September 2012
* * * * * * *
Figure V-3 Frozen warmwater shrimp: Weighted-average f.o.b. prices and quantities of domestic product 2, by quarter, January 2009-September 2012
* * * * * * *
Figure V-4 Frozen warmwater shrimp: Weighted-average f.o.b. prices and quantities of domestic product 3, by quarter, January 2009-September 2012
* * * * * * *
Figure V-5 Frozen warmwater shrimp: Weighted-average f.o.b. prices and quantities of domestic product 4, by quarter, January 2009-September 2012
* * * * * * *
Price trends
Over the period examined, the prices for product 1 fluctuated; U.S. prices declined overall from January 2009 and September 2012, while the prices of most imports increased over the period. Prices for product 2 were higher than prices reported for product 1, with U.S. prices fluctuating and most import prices falling within the range of U.S. prices over the period; Vietnamese prices, however, tended to be much higher. U.S. product 3 prices rose in 2010, peaked in 2011 and then declined; most import prices were higher than U.S. prices but followed a similar pattern. U.S. product 4 prices tended to follow an annual cyclical pattern but prices rose in the first half of 2010 and have not returned to 2009 levels. There appears to be a great deal of variation in prices of imported product 4. Table V-5 summarizes the price changes over the period.

V-13
Table V-5 Frozen warmwater shrimp: Summary of weighted-average f.o.b. prices for products 1 through 4 from the United States and subject countries
ItemNumber of Quarters
Low price (per pound)
High price (per pound)
Change in price1
(percent) Product 1
U.S. product 1 15 2.51 3.99 (5.5) Chinese product 1 15 *** *** 23.4 Ecuador product 1 15 2.63 3.22 6.3 Indian product 1 8 *** *** (2)
Indonesian product 1 15 *** *** 26.2 Malaysian product 1 15 *** *** (22.2) Thailand product 1 15 *** *** 85.6 Vietnamese product 1 15 *** *** 31.6
Product 2 U.S. product 2 15 2.63 4.43 5.7 Chinese product 2 1 *** *** (2)
Ecuador product 2 15 2.67 3.25 11.8 Indian product 2 7 *** *** (2)
Indonesian product 2 15 *** 3.94 24.3 Malaysian product 2 15 2.95 *** 0.5 Thailand product 2 15 *** *** 16.4 Vietnamese product 2 15 *** *** 44.4
Product 3 U.S. product 3 15 5.01 8.78 12.6 Ecuador product 3 15 *** *** 4.3 Indian product 3 15 5.98 9.13 19.4 Indonesian product 3 15 *** 9.55 11.9 Malaysian product 3 9 *** *** (11.8) Thailand product 3 6 *** *** (2)
Vietnamese product 3 15 5.88 *** 30.0 Product 4
U.S. product 4 15 *** 5.79 21.3 Chinese product 4 9 *** *** (2)
Ecuador product 4 15 *** *** 5.4 Indian product 4 15 *** 6.13 54.0 Indonesian product 4 15 4.21 5.65 13.8 Malaysian product 4 10 *** *** 62.1 Thailand product 4 15 4.77 6.92 30.2 Vietnamese product 4 15 4.62 7.40 44.8 1 Percentage change is based on unrounded data. 2 Changes are not reported for products for which data were not available in both the first and last year of the period.
Source: Compiled from data submitted in response to Commission questionnaires.

V-14
Underselling and overselling summary
As shown in table V-6, there were 350 instances where prices for domestic warmwater shrimp and that imported from subject countries could be compared. Overall, subject imports were priced lower than domestic product in 138 of the possible comparisons; the average margin of underselling was 13.2 percent. Subject import prices were higher than domestic prices in 212 comparisons; the average margin of overselling was 21.9 percent. Data by country are provided in table V-7.
Table V-6 Frozen warmwater shrimp: Instances of underselling/overselling and the range and average margins, January 2009-September 2012
Product
Total Underselling Overselling
No. Range
(percent)
Average margin
(percent) No. Range
(percent)
Average margin
(percent)1 29 3.1-31.0 12.2 69 (1.0-84.7) (23.4)2 50 0.4-30.1 13.6 33 (0.9-58.3) (22.7)3 12 1.9-22.5 10.1 63 (0.1-65.1) (20.1)4 47 1.4-26.1 12.4 47 (0.2-59.5) (21.6)Total 138 0.4-31.0 12.6 212 (0.1-84.7) (21.9)Source: Compiled from data submitted in response to Commission questionnaires.
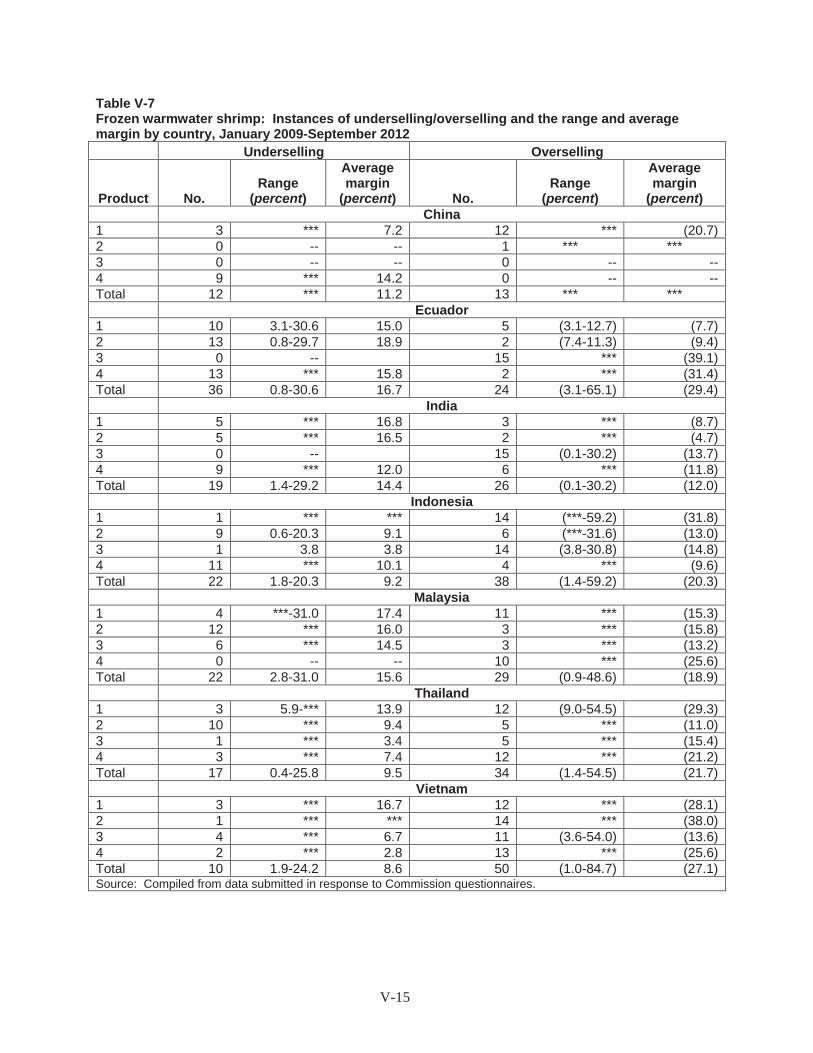
V-15
Table V-7 Frozen warmwater shrimp: Instances of underselling/overselling and the range and average margin by country, January 2009-September 2012
Underselling Overselling
Product No. Range
(percent)
Average margin
(percent) No. Range
(percent)
Average margin
(percent)China
1 3 *** 7.2 12 *** (20.7)2 0 -- -- 1 *** *** 3 0 -- -- 0 -- --4 9 *** 14.2 0 -- --Total 12 *** 11.2 13 *** ***
Ecuador 1 10 3.1-30.6 15.0 5 (3.1-12.7) (7.7)2 13 0.8-29.7 18.9 2 (7.4-11.3) (9.4)3 0 -- 15 *** (39.1)4 13 *** 15.8 2 *** (31.4)Total 36 0.8-30.6 16.7 24 (3.1-65.1) (29.4)
India 1 5 *** 16.8 3 *** (8.7)2 5 *** 16.5 2 *** (4.7)3 0 -- 15 (0.1-30.2) (13.7)4 9 *** 12.0 6 *** (11.8)Total 19 1.4-29.2 14.4 26 (0.1-30.2) (12.0)
Indonesia 1 1 *** *** 14 (***-59.2) (31.8)2 9 0.6-20.3 9.1 6 (***-31.6) (13.0)3 1 3.8 3.8 14 (3.8-30.8) (14.8)4 11 *** 10.1 4 *** (9.6)Total 22 1.8-20.3 9.2 38 (1.4-59.2) (20.3)
Malaysia 1 4 ***-31.0 17.4 11 *** (15.3)2 12 *** 16.0 3 *** (15.8)3 6 *** 14.5 3 *** (13.2)4 0 -- -- 10 *** (25.6)Total 22 2.8-31.0 15.6 29 (0.9-48.6) (18.9)
Thailand 1 3 5.9-*** 13.9 12 (9.0-54.5) (29.3)2 10 *** 9.4 5 *** (11.0)3 1 *** 3.4 5 *** (15.4)4 3 *** 7.4 12 *** (21.2)Total 17 0.4-25.8 9.5 34 (1.4-54.5) (21.7)
Vietnam 1 3 *** 16.7 12 *** (28.1)2 1 *** *** 14 *** (38.0)3 4 *** 6.7 11 (3.6-54.0) (13.6)4 2 *** 2.8 13 *** (25.6)Total 10 1.9-24.2 8.6 50 (1.0-84.7) (27.1)Source: Compiled from data submitted in response to Commission questionnaires.

V-16
Nonsubject Prices
Prices for imported shrimp from Mexico were higher than prices for product imported from subject countries in 99 of 170 possible instances and higher than U.S.-produced frozen warmwater shrimp in 27 of 32 possible instances.
LOST SALES LOST REVENUES
U.S. processors provided eight lost sales and no lost revenues allegations due to imports of frozen warmwater shrimp from China, Ecuador, India, Indonesia, Malaysia, Thailand, and Vietnam (table V-8). Seven of these were reported as shifting purchases from U.S. product to imported product; one was reported as receiving a bid for domestic product which was rejected because the price was above that of imported product. Processors were unable to provide the price that was rejected in most of the lost sales, therefore purchasers were asked to provide quantities and prices.8 The total volume of reported lost sales ranges from *** to *** pounds. The value of those lost sales for which the producers gave was $***. No purchaser has yet to respond to the verification request.9
Table V-8 Frozen warmwater shrimp: Lost sales allegations as reported by U.S. producers
* * * * * * *
8 Purchasers were requested to provide the prices they paid for imported product if they purchased imported product because its price was lower than U.S. prices therefore the price they report is a lower bound on what the U.S. price could have been during the period. This price was requested because this price would be relatively easy to report. Purchasers were also requested to report the actual quantities of subject imports purchased.
9 Staff attempted to contact purchasers using fax. None of the fax numbers provided were usable. Staff then sent purchasers letters via Fedex.
PART VI: FINANCIAL EXPERIENCE OF U.S. PROCESSORS
Background
Thirty-six domestic firms provided usable financial results on their operations processing frozenwarmwater shrimp.1 With some exceptions, the majority of these processors reported their financialresults on a calendar-year basis either using generally accepted accounting principles (“GAAP”) or a cash/tax basis form of accounting. While also reporting primarily on a calendar-year basis, the eightynine fishermen whose responses were considered usable reported their financial results primarily on atax/cash basis.2
Commercial sales make up the majority of revenue reported by processors and fishermanwith a relatively small amount classified separately as transfers or internal consumption. Accordingly, asingle revenue line item is presented in the relevant tables below. Similarly, while tolling activity (fromboth a revenue and cost perspective) is reflected in the overall operations of processors, it is notseparately identified and/or presented.
Processing Operations on Frozen Warmwater Shrimp
Income-and-loss data for processors are presented in table V1-1. A variance analysis of theseoperations is presented in table VI-2.3
The processors whose financial results make up the information presented in this section of thereport reflect a relatively wide range in terms of the amount of company-specific revenue generated. While some operational differences may distinguish smaller processors from larger processors, such asthe extent to which more capital-intensive IQF freezing is used, testimony at the staff conferenceindicated that processors (all sizes) compete in the same markets.4 Additionally, while processors may beintegrated to some extent with respect to the domestic shrimp input, this was described as the exceptionrather than the rule.5
As shown in table VI-1, there was a relatively large decline in sales volume in 2010 followed by apartial recovery in 2011. At the staff conference, this pattern was generally attributed to the Gulf oil spillin 2010 and the corresponding closure of large areas of the Gulf of Mexico to shrimp harvesting which in
1 Twenty four additional processors provided information that was generally considered unusable and is thereforenot reflected in this section of the staff report. USITC auditor notes (preliminary phase).
2 Information on warmwater shrimp operations of fisherman, including reported financial results, are presented inappendix E. Responses which were not filed in a timely manner and/or determined to be incomplete are not includedin appendix E. Ibid.
3 The Commission’s variance analysis is calculated in three parts: sales variance, cost of goods sold (“COGS”)variance, and sales, general and administrative (“SG&A”) expenses variance. Each part consists of a price variance(in the case of the sales variance) or a cost variance (in the case of the COGS and SG&A variances) and acorresponding volume (quantity) variance. The variance of total processing COGS is presented in table VI-2 insteadof the components of COGS due to apparent inconsistencies in the extent to which U.S. processors reported theseparate components of COGS (see note to table VI-1 and footnote 7). The sales or cost variance is calculated as thechange in unit price/cost times the new volume, while the volume variance is calculated as the change in volumetimes the old unit price/cost. Summarized at the bottom of the variance analysis table, the price variance is fromsales, the net cost/expense variance is the sum of those items from COGS and SG&A, respectively, and the netvolume variance is the sum of the sales, COGS, and SG&A volume variances.
4 Conference transcript, p. 53 (Drake).
5 Conference transcript, p. 59 (Drake).
VI-1

Table VI-1Frozen warmwater shrimp: Results of processors’ operations, calendar years 2009-2011, January-September 2011, January-September 2012
Item
Calendar year January-September
2009 2010 2011 2011 2012
Quantity (1,000 pounds)
Total net sales quantity 212,264 181,959 192,962 147,637 136,273
Value ($1,000)
Total net sales value 651,397 662,102 724,971 548,171 523,174
Cost of goods sold:
Total cost of goods sold1 592,910 612,348 673,875 507,621 488,615
Gross profit 58,487 49,754 51,096 40,550 34,559
Total SG&A expenses2 46,500 43,919 48,812 34,817 41,068
Operating income or (loss) 11,987 5,835 2,284 5,733 (6,509)
Interest expense 4,785 4,410 3,939 2,482 2,552
Other expenses 6,527 8,191 16,635 6,414 7,344
Other income items3 19,210 20,322 42,869 22,607 50,298
Net income 19,886 13,556 24,580 19,444 33,893
Depreciation 6,618 6,069 6,609 3,425 3,805
Estimated cash flow 26,504 19,625 31,189 22,869 37,698
Ratio to net sales (percent)
Cost of goods sold1 91.0 92.5 93.0 92.6 93.4
Gross profit 9.0 7.5 7.0 7.4 6.6
SG&A expenses2 7.1 6.6 6.7 6.4 7.9
Operating income or (loss) 1.8 0.9 0.3 1.0 (1.2)
Net income 3.1 2.0 3.4 3.5 6.5
Table continued on next page.
VI-2

Table VI-1--ContinuedFrozen warmwater shrimp: Results of processors’ operations, calendar years 2009-2011, January-September 2011, January-September 2012
Item
Calendar year January-September
2009 2010 2011 2011 2012
Unit value ($1,000)
Total net sales 3.07 3.64 3.76 3.71 3.84
Cost of goods sold:
Total cost of goods sold1 2.79 3.37 3.49 3.44 3.59
Gross profit 0.28 0.27 0.26 0.27 0.25
SG&A expenses2 0.22 0.24 0.25 0.24 0.30
Operating income or (loss) 0.06 0.03 0.01 0.04 (0.05)
Number of processors reporting
Operating losses 13 19 17 11 14
Data 36 36 35 35 351 The Commission’s U.S. processor questionnaire requested that processors report the following costs: shrimpand prawns (domestic), shrimp and prawns (imported), all other raw material costs, direct labor, and other factorycosts. While some processors reported these cost components as requested, a number of processors effectivelyreported all relevant costs in a single line item; e.g., cost of “shrimp and prawns (domestic).” USITC auditor notes(preliminary phase). Accordingly and in order to avoid presenting potentially misleading cost trends, a single lineitem for COGS is presented in this table (see also footnote 7).2 See footnote 8 regarding the increase in interim 2012 SG&A expenses. 3 See footnote 9 regarding the classification of “other income.”
Source: Compiled from data submitted in response to Commission questionnaires.
turn reduced the supply of domestic shrimp feedstock.6 As shown in appendix E, fishermen reported asimilar directional trend in sales volume in 2010 and 2011. Notwithstanding the decline in processorsales volume in 2010, overall revenue increased marginally compared to 2009 due to a relatively largepositive price variance. As shown in table VI-2 (variance analysis), the industry reported positive pricesvariances throughout the period with the 2009-10 variance being the most substantial.
While the components of COGS are not presented separately due to concerns regardingconsistency (see note to table VI-1 and footnote 7), the more detailed cost information reported to theCommission in general indicates that domestic shrimp was the primary input (ranging from a low of 65.5percent of COGS in 2009 to a high of 77.1 percent in interim 2011) with the increase in its sharecorresponding to a relative decline in the share of imported shrimp input (ranging from a high of 22.3percent of COGS in 2009 to a low of 12.1 percent in interim 2011).7 Other inputs (all other raw
6 Conference transcript, p. 36 (Kimbrough).
7 USITC auditor notes (preliminary phase). Larger-volume processors for the most part reported the requestedCOGS detail with variations in company-specific cost shares likely reflecting operational differences; e.g., ***. Smaller volume processors, in contrast, were more likely to report an aggregated COGS value in the shrimp inputcost line item; i.e., what could nominally be interpreted as the cost of procured shrimp also included costs associatedwith peeling and packing. Ibid.
VI-3

Table VI-2Frozen warmwater shrimp: Variance analysis of processors’ operations, calendar years 2009-11,January-September 2011, and January-September 2012
Item
Calendar year Jan.-Sept.
2009-11 2009-10 2010-11 2011-12
Value ($1,000)
Total net sales:
Price variance 132,808 103,707 22,830 17,196
Volume variance (59,235) (93,002) 40,039 (42,193)
Total net sales variance 73,574 10,705 62,869 (24,997)
Cost of sales:
Net cost of sales:
Cost variance (134,881) (104,090) (24,496) (20,066)
Volume variance 53,916 84,652 (37,030) 39,072
Total net cost of salesvariance
(80,965) (19,438) (61,527) 19,006
Gross profit variance (7,391) (8,733) 1,342 (5,991)
SG&A expenses:
Expense variance (6,541) (4,058) (2,237) (8,930)
Volume variance 4,228 6,639 (2,656) 2,680
Total SG&A variance (2,312) 2,581 (4,893) (6,250)
Operating income variance (9,703) (6,153) (3,551) (12,242)
Summarized as:
Price variance 132,808 103,707 22,830 17,196
Net cost/expense variance (141,422) (108,148) (26,733) (28,996)
Net volume variance (1,090) (1,711) 353 (441)
Source: Compiled from data submitted in response to Commission questionnaires.
materials, direct labor, and other factory costs) as a share of total COGS remained within a relativelynarrow range throughout the period.
Table VI-1 shows that the COGS-to-sales ratio for processing operations increased during theperiod which in turn reflects a pattern of higher average sales values that consistently failed to offsetcorresponding increases in average COGS. The higher average sales values reported by fishermen (seeappendix E) appears to be generally consistent with the pattern of higher input costs reported byprocessors.
With respect to the level of absolute gross profit collectively generated by U.S. processors (seetable VI-1), the negative impact of reduced gross profit margins was magnified by the sharp decline in
VI-4

sales volume in that year and then mitigated to some extent by the partial recovery of sales volume in2011. Lower absolute gross profit in interim 2012 compared to interim 2011 reflects a combination ofboth lower sales volume and a continued contraction of the industry’s gross profit margin.
With the exception of interim 2012 (see footnote 8), U.S. processors’ SG&A expense ratios (totalSG&A expenses divided by total sales value) moved within a relatively narrow range: from a high of 7.1percent in 2009 to a low of 6.4 percent in interim 2011. The absence of notable variations in SG&Aexpense ratios for most of the period generally indicates that the pattern of U.S. processors’ absoluteoperating income is largely explained at the level of gross profitability which, as noted above, wasnegatively impacted by an increasing COGS-to-sales ratio and an overall decline in sales volume.8
As shown in table VI-1, a notable feature of the U.S. processors’ financial results is the amount of“other income” reported: ranging from a low of $19.2 million in 2009 to a high of $50.3 million ininterim 2012. While “other income” includes a variety of items, the most significant after 2009 appearsto be settlement disbursements related to the Gulf oil spill with a smaller relative share accounted for byCDSOA receipts.9 At the staff conference, petitioners took the position that the impact of disbursementsrelated to the Gulf oil spill should be considered a non-operating item in terms of evaluating theindustry’s financial results.10 In contrast, respondents generally believe that the Commission’s analysisshould take into account the positive impact of both Gulf oil spill settlements and CDSOA receipts andconsider these items to be functional equivalents of operating income.11
As shown in appendix E and with respect to fishermen operations, disbursements and revenuegenerated from activity related to the Gulf oil spill were classified below primary warmwater shrimpoperations. Similarly, as indicated above (see footnote 9), the majority of other income reported byprocessors after 2009 appears to be related to the Gulf oil spill. While this classification is generallyconsistent with the intent of the “other income and expenses” section (i.e., to isolate income and expensesnot directly related to the primary operations being examined), the pervasive impact of the Gulf oil spillon the industry’s overall operations arguably may raise questions about how subsequent settlementincome and related revenue should be taken into account.
8 As originally reported and with respect to the U.S. processors whose financial results were considered usable,the interim 2012 SG&A expense ratio was higher compared to preceding periods due in large part to the interim2012 SG&A expenses reported by ***. January 31, 2013 e-mail to *** from USITC auditor. ***. USITC auditor notes (preliminary phase).
9 In the context of the Commission’s standard income statement format for reviews, CDSOA receipts havetraditionally been classified below operating income to distinguish them from the primary operations beingexamined. The above observation that “other income” after 2009 reflects in large part income/distributions related tothe Gulf oil spill is based on supplemental information reported by U.S. processors regarding the non-recurring items(table III-9 of U.S. processor questionnaire) included in their financial results. USITC auditor notes (preliminaryphase). To the extent that this supplemental information was not reported by all processors in the format requestedby the Commission, the amount of CDSOA receipts and/or Gulf oil spill income/distributions included in “otherincome” cannot be determined directly. While U.S. processors were not required to identify specifically CDSOAreceipts and/or Gulf oil spill income/disbursement in their financial results (table III-10 of U.S. processorquestionnaire), it was generally expected that these items would be reported in “other income.”
10 Conference transcript, pp. 54-55 (Drake). With regard to another case involving the classification/treatment of“other income,” petitioners’ counsel referenced Coated Paper and the receipt by U.S. producers of income pursuantto a refundable tax credit. According to petitioners’ counsel, an important distinction in Coated Paper is that therewas an argument that the “other income” in that case directly impacted the industry’s COGS-to-sales ratio. Incontrast, settlement money from the Gulf oil spill, according to petitioners’ counsel, only affected the industry’sfinancial results below operating income. Conference transcript, p. 55 (Drake).
11 Conference transcript, pp. 138-139 (Connely).
VI-5
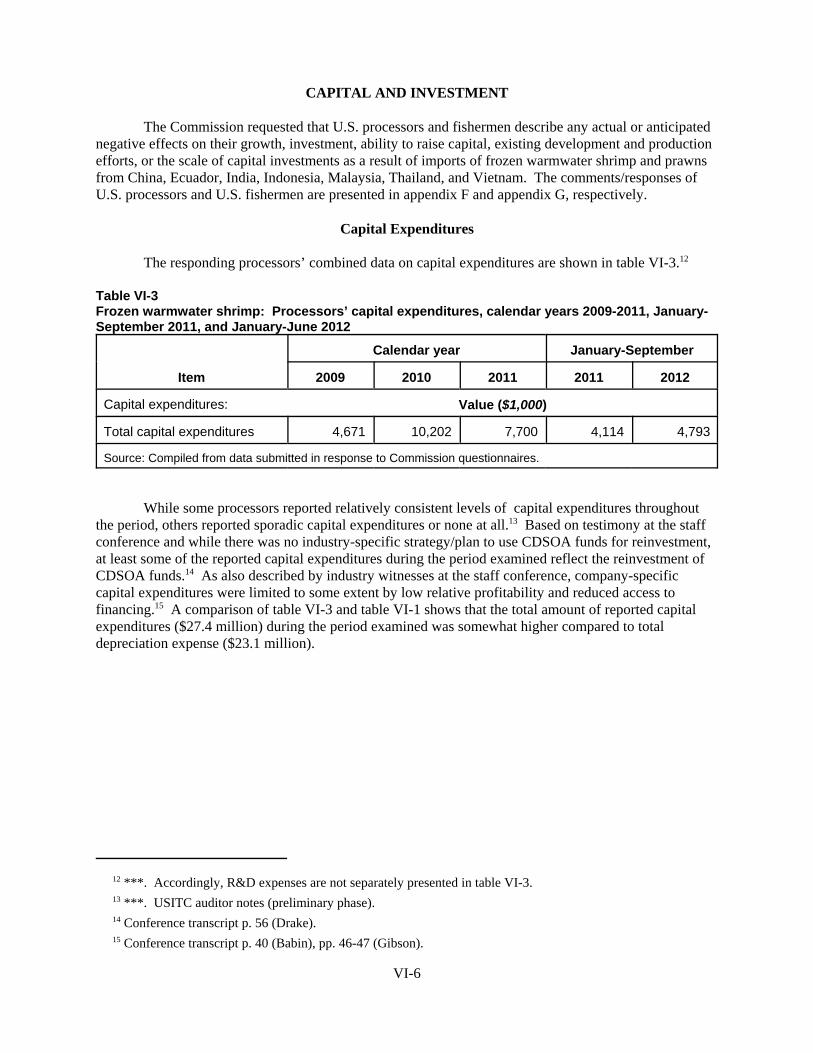
CAPITAL AND INVESTMENT
The Commission requested that U.S. processors and fishermen describe any actual or anticipatednegative effects on their growth, investment, ability to raise capital, existing development and productionefforts, or the scale of capital investments as a result of imports of frozen warmwater shrimp and prawnsfrom China, Ecuador, India, Indonesia, Malaysia, Thailand, and Vietnam. The comments/responses ofU.S. processors and U.S. fishermen are presented in appendix F and appendix G, respectively.
Capital Expenditures
The responding processors’ combined data on capital expenditures are shown in table VI-3.12
Table VI-3Frozen warmwater shrimp: Processors’ capital expenditures, calendar years 2009-2011, January-September 2011, and January-June 2012
Item
Calendar year January-September
2009 2010 2011 2011 2012
Capital expenditures: Value ($1,000)
Total capital expenditures 4,671 10,202 7,700 4,114 4,793
Source: Compiled from data submitted in response to Commission questionnaires.
While some processors reported relatively consistent levels of capital expenditures throughoutthe period, others reported sporadic capital expenditures or none at all.13 Based on testimony at the staffconference and while there was no industry-specific strategy/plan to use CDSOA funds for reinvestment,at least some of the reported capital expenditures during the period examined reflect the reinvestment ofCDSOA funds.14 As also described by industry witnesses at the staff conference, company-specificcapital expenditures were limited to some extent by low relative profitability and reduced access tofinancing.15 A comparison of table VI-3 and table VI-1 shows that the total amount of reported capitalexpenditures ($27.4 million) during the period examined was somewhat higher compared to totaldepreciation expense ($23.1 million).
12 ***. Accordingly, R&D expenses are not separately presented in table VI-3.
13 ***. USITC auditor notes (preliminary phase).
14 Conference transcript p. 56 (Drake).
15 Conference transcript p. 40 (Babin), pp. 46-47 (Gibson).
VI-6

PART VII: THREAT CONSIDERATIONS AND INFORMATION ONNONSUBJECT COUNTRIES
The Commission analyzes a number of factors in making threat determinations (see 19 U.S.C. §1677(7)(F)(i)). Information on the nature of the alleged subsidies was presented earlier in this report;information on the volume and pricing of imports of the subject merchandise is presented in Parts IV andV; and information on the effects of imports of the subject merchandise on U.S. producers’ existingdevelopment and production efforts is presented in Part VI. Information on inventories of the subjectmerchandise; foreign producers’ operations, including the potential for “product-shifting;” any otherthreat indicators, if applicable; and any dumping in third-country markets, follows. Also presented in thissection of the report is information obtained for consideration by the Commission on nonsubject countriesand the global market.
Generally speaking, common to the seven subject countries, the vast majority of the importedfrozen warmwater shrimp came from farmed, rather than wild-caught, inputs; there were very limitedhome markets; and the most important export markets were the United States, the EU, and Japan.1 Intotal, 114 foreign producer questionnaires were used to assemble the following data. The vast majority ofproducers/exporters did not have product shifting and only two firms reported inventories2 in the UnitedStates. The majority of reported constraints on production were freezing capacity, live shrimp supply,machinery or equipment other than storage capacity, and labor availability. The majority also did notanticipate any changes in operations in the future.
THE INDUSTRY IN CHINA
Table VII-1 presents data provided by Chinese producers/exporters with respect to theirwarmwater shrimp operations in China. Three firms provided useable data. Together, their exports to theUnited States were equivalent to *** percent of subject U.S. imports from China in 2011.
Table VII-1Frozen warmwater shrimp: Chinese production capacity, production, shipments, and inventories,2009-11, January-September 2011, January-September 2012, and projected 2012-13
* * * * * * *
THE INDUSTRY IN ECUADOR
Table VII-2 presents data provided by Ecuadorian producers/exporters through their counsel withrespect to their warmwater shrimp operations in Ecuador. Nine firms, all of which exported to the UnitedStates, provided useable data. The exports to the United States of these firms were equivalent to58.4 percent of subject U.S. imports from Ecuador in 2011.
1 Canada, Australia, New Zealand, Malaysia, and other Pacific Rim countries were other frequently cited markets.
2 The total for these two firms is as follows (in 1,000 pounds): *** in 2009; *** in 2010; *** in 2011; *** inJanuary-September 2011; and *** in January -September 2012.
VII-1

Table VII-2Frozen warmwater shrimp: Ecuadorian production capacity, production, shipments, andinventories, 2009-11, January-September 2011, January-September 2012, and projected 2012-13
Item
Actual experience Projections
2009 2010 2011
January-September
2012 20132011 2012
Quantity (1,000 pounds)
Capacity 312,569 474,527 498,848 397,414 478,735 603,754 624,015
Beginning inventories 5,872 8,473 12,306 14,605 21,159 19,187 20,517
Production 180,108 200,863 278,613 206,938 227,045 236,559 258,345
Shipments:Internal consumption 1,287 2,032 1,686 1,232 688 1,147 924
Home market 5,669 5,631 8,238 6,133 6,453 5,680 4,994
Exports to--The United States 83,479 84,629 93,613 81,282 82,793 90,775 89,420
All other markets 97,281 115,331 161,685 115,747 150,986 154,445 178,896
Total exports 180,760 199,960 255,298 197,029 233,779 245,220 268,316
Total shipments 187,716 207,623 265,222 204,394 240,920 252,047 274,234
End of period inventories 8,473 12,306 17,332 20,878 22,499 9,004 8,150
Ratios and shares (percent)
Capacity utilization 57.6 42.3 55.9 52.1 47.4 39.2 41.4
Internal consumption 0.7 1.0 0.6 0.6 0.3 0.5 0.3
Home market 3.0 2.7 3.1 3.0 2.7 2.3 1.8
Exports to--The United States 44.5 40.8 35.3 39.8 34.4 36.0 32.6
All other markets 51.8 55.5 61.0 56.6 62.7 61.3 65.2
Total exports 96.3 96.3 96.3 96.4 97.0 97.3 97.8
Share of total quantity ofshipments 100.0 100.0 100.0 100.0 100.0 100.0 100.0
Inventories to production 4.7 6.1 6.2 7.6 7.4 3.8 3.2
Inventories to totalshipments 4.5 5.9 6.5 7.7 7.0 3.6 3.0
Note.--Because of rounding, figures may not add to the totals shown.
Source: Compiled from data submitted in response to Commission questionnaires.
VII-2

THE INDUSTRY IN INDIA
Table VII-3 presents data provided by Indian producers/exporters through their counsel ordirectly with respect to their warmwater shrimp operations in India. Twenty-eight firms reported exportsto the United States. The shipments of these firms to the United States were equivalent to 85.3 percent ofsubject U.S. imports from India in 2011.
Table VII-3Frozen warmwater shrimp: Indian production capacity, production, shipments, and inventories,2009-11, January-September 2011, January-September 2012, and projected 2012-13
Item
Actual experience Projections
2009 2010 2011
January-September
2012 20132011 2012
Quantity (1,000 pounds)
Capacity 617,182 632,632 687,259 540,769 579,429 702,800 710,882
Beginning inventories 18,437 13,169 18,186 17,600 20,423 15,611 22,930
Production 99,877 121,861 162,897 124,423 153,302 196,695 207,888
Shipments:Internal consumption 15 57 18 11 11 12 3
Home market 211 50 66 48 308 275 296
Exports to--The United States 35,632 52,154 89,505 68,005 85,781 115,909 124,579
All other markets 70,862 66,618 74,243 57,375 57,435 77,401 83,789
Total exports 106,494 118,772 163,748 125,380 143,216 193,310 208,368
Total shipments 106,720 118,879 163,832 125,439 143,535 193,597 208,667
End of period inventories 13,602 18,438 20,163 19,004 29,749 22,787 27,040
Ratios and shares (percent)
Capacity utilization 16.2 19.3 23.7 23.0 26.5 28.0 29.2
Internal consumption (1) (1) (1) (1) (1) (1) (1)
Home market 0.2 0.0 0.0 0.0 0.2 0.1 0.1
Exports to--The United States 33.4 43.9 54.6 54.2 59.8 59.9 59.7
All other markets 66.4 56.0 45.3 45.7 40.0 40.0 40.2
Total exports 99.8 99.9 99.9 100.0 99.8 99.9 99.9
Share of total quantity ofshipments 100.0 100.0 100.0 100.0 100.0 100.0 100.0
Inventories to production 13.6 15.1 12.4 11.5 14.6 11.6 13.0
Inventories to totalshipments 12.7 15.5 12.3 11.4 15.5 11.8 13.0
1 Less than 0.5 percent.
Note.--Because of rounding, figures may not add to the totals shown.
Source: Compiled from data submitted in response to Commission questionnaires.
VII-3

THE INDUSTRY IN INDONESIA
Table VII-4 presents data provided by Indonesian producer/exporters with respect to their frozenwarmwater shrimp operations in Indonesia. Fifteen firms, all of which exported to the United States, provided useable data. Together, their exports to the United States were equivalent to 77.5 percent ofsubject U.S. imports from Indonesia in 2011.
Table VII-4Frozen warmwater shrimp: Indonesian production capacity, production, shipments, andinventories, 2009-11, January-September 2011, January-September 2012, and projected 2012-13
Item
Actual experience Projections
2009 2010 2011
January-September
2012 20132011 2012
Quantity (1,000 pounds)
Capacity 323,147 310,485 303,700 238,625 218,804 278,308 278,943
Beginning inventories 19,709 15,703 15,129 15,019 20,921 14,020 9,559
Production 164,473 144,900 173,497 125,192 127,534 167,184 170,810
Shipments:Internal consumption 21 71,877 3402 2,296 753 753 502
Home market 7,981 3,905 2,353 1,800 1,935 3,650 5,000
Exports to--The United States 99,737 90,251 113,671 83,131 90,495 121,150 118,370
All other markets 56,282 48,862 45,973 33,949 33,686 45,940 53,389
Total exports 156,019 139,112 159,644 117,081 124,181 167,090 171,759
Total shipments 164,021 214,894 165,399 121,177 126,869 171,493 177,261
End of period inventories 15,378 19,338 22,856 18,668 24,150 13,385 13,014
Ratios and shares (percent)
Capacity utilization 50.9 46.7 57.1 52.5 58.3 60.1 61.2
Internal consumption (1) 33.4 2.1 1.9 0.6 0.4 0.3
Home market 4.9 1.8 1.4 1.5 1.5 2.1 2.8
Exports to--The United States 60.8 42.0 68.7 68.6 71.3 70.6 66.8
All other markets 34.3 22.7 27.8 28.0 26.6 26.8 30.1
Total exports 95.1 64.7 96.5 96.6 97.9 97.4 96.9
Share of total quantity ofshipments 100.0 100.0 100.0 100.0 100.0 100.0 100.0
Inventories to production 9.3 13.3 13.2 11.2 14.2 8.0 7.6
Inventories to totalshipments 9.4 9.0 13.8 11.6 14.3 7.8 7.3
1 Less than 0.5 percent.
Note.--Because of rounding, figures may not add to the totals shown.
Source: Compiled from data submitted in response to Commission questionnaires.
VII-4

THE INDUSTRY IN MALAYSIA
Table VII-6 presents data provided by Malaysian producer/exporters with respect to their frozenwarmwater shrimp operations in Malaysia. Three firms, all of which exported to the United States, provided useable data. Together, their exports to the United States were equivalent to *** percent ofsubject U.S. imports from Malaysia in 2011.
Table VII-5Frozen warmwater shrimp: Malaysian production capacity, production, shipments, andinventories, 2009-11, January-September 2011, January-September 2012, and projected 2012-13
* * * * * * *
THE INDUSTRY IN THAILAND
Table VII-6 presents data provided by Thai producer/exporters with respect to their frozen warmwatershrimp operations in Thailand. Twenty-eight firms, all of which exported to the United States, provideduseable data. Together, their exports to the United States were equivalent to 88.2 percent of subject U.S.imports from Thailand in 2011.
THE INDUSTRY IN VIETNAM
Table VII-7 presents data provided by Vietnamese producers/exporters with respect to their frozenwarmwater shrimp operations in Vietnam. Twenty-eight firms, all of which exported to the United States,provided useable data. The shipments to the United States for these firms were equivalent to 41.0 percentof subject U.S. imports from Vietnam in 2011.
VII-5

Table VII-6Frozen warmwater shrimp: Thai production capacity, production, shipments, and inventories,2009-11, January-September 2011, January-September 2012, and projected 2012-13
Item
Actual experience Projections
2009 2010 2011
January-September
2012 20132011 2012
Quantity (1,000 pounds)
Capacity 817,010 882,861 893,838 683,240 661,017 808,493 812,158
Beginning inventories 120,067 130,162 114,848 116,380 118,733 115,088 111,013
Production 659,677 600,988 564,834 412,218 349,928 435,527 426,048
Shipments:Internal consumption 63,573 15,166 8,632 6,588 7,966 10,106 9,661
Home market 42,035 36,131 28,914 22,421 19,890 25,665 23,890
Exports to--The United States 356,697 366,455 330,778 242,050 176,022 225,722 214,069
All other markets 184,355 201,991 194,265 139,207 143,809 176,031 184,593
Total exports 541,052 568,446 525,043 381,257 319,831 401,753 398,662
Total shipments 646,660 619,743 562,589 410,266 347,687 437,524 432,213
End of period inventories 130,759 115,949 118,951 118,630 121,588 111,998 103,252
Ratios and shares (percent)
Capacity utilization 80.7 68.1 63.2 60.3 52.9 53.9 52.5
Internal consumption 9.8 2.4 1.5 1.6 2.3 2.3 2.2
Home market 6.5 5.8 5.1 5.5 5.7 5.9 5.5
Exports to--The United States 55.2 59.1 58.8 59.0 50.6 51.6 49.5
All other markets 28.5 32.6 34.5 33.9 41.4 40.2 42.7
Total exports 83.7 91.7 93.3 92.9 92.0 91.8 92.2
Share of total quantity ofshipments 100.0 100.0 100.0 100.0 100.0 100.0 100.0
Inventories to production 19.8 19.3 21.1 21.6 26.1 25.7 24.2
Inventories to totalshipments 20.2 18.7 21.1 21.7 26.2 25.6 23.9
Note.--Because of rounding, figures may not add to the totals shown.
Source: Compiled from data submitted in response to Commission questionnaires.
VII-6

Table VII-7Frozen warmwater shrimp: Vietnamese production capacity, production, shipments, andinventories, 2009-11, January-September 2011, January-September 2012, and projected 2012-13
Item
Actual experience Projections
2009 2010 2011
January-September
2012 20132011 2012
Quantity (1,000 pounds)
Capacity 272,496 311,044 324,864 248,278 240,741 275,953 272,188
Beginning inventories 57,227 49,624 59,872 58,697 56,454 38,099 33,050
Production 185,153 225,343 197,048 145,082 132,152 176,466 205,891
Shipments:Internal consumption 36,431 32,806 36,044 27,735 27,143 18,965 14,032
Home market 12,331 19,815 14,171 10,238 8,704 9,076 9,914
Exports to--The United States 38,124 51,040 37,508 28,452 20,235 33,665 32,337
All other markets 131,629 135,232 130,822 94,785 85,591 107,555 113,561
Total exports 169,753 186,272 168,330 123,237 105,825 141,221 145,898
Total shipments 218,515 238,892 218,545 161,210 141,672 169,262 169,844
End of period inventories 46,134 60,926 59,390 62,264 64,212 43,549 40,924
Ratios and shares (percent)
Capacity utilization 67.9 72.4 60.7 58.4 54.9 63.9 75.6
Internal consumption 16.7 13.7 16.5 17.2 19.2 11.2 8.3
Home market 5.6 8.3 6.5 6.4 6.1 5.4 5.8
Exports to--The United States 17.4 21.4 17.2 17.6 14.3 19.9 19.0
All other markets 60.2 56.6 59.9 58.8 60.4 63.5 66.9
Total exports 77.7 78.0 77.0 76.4 74.7 83.4 85.9
Share of total quantity ofshipments 100.0 100.0 100.0 100.0 100.0 100.0 100.0
Inventories to production 24.9 27.0 30.1 32.2 36.4 24.7 19.9
Inventories to totalshipments 21.1 25.5 27.2 29.0 34.0 25.7 24.1
Note.--Because of rounding, figures may not add to the totals shown.
Source: Compiled from data submitted in response to Commission questionnaires.
THE SEVEN SUBJECT COUNTRIES
Generally speaking, common to the seven subject countries, the vast majority of the importedfrozen warmwater shrimp came from farmed, rather than wild-caught, inputs; there were very limitedhome markets; and the most important export markets were the United States, the EU, and Japan. Table
VII-7
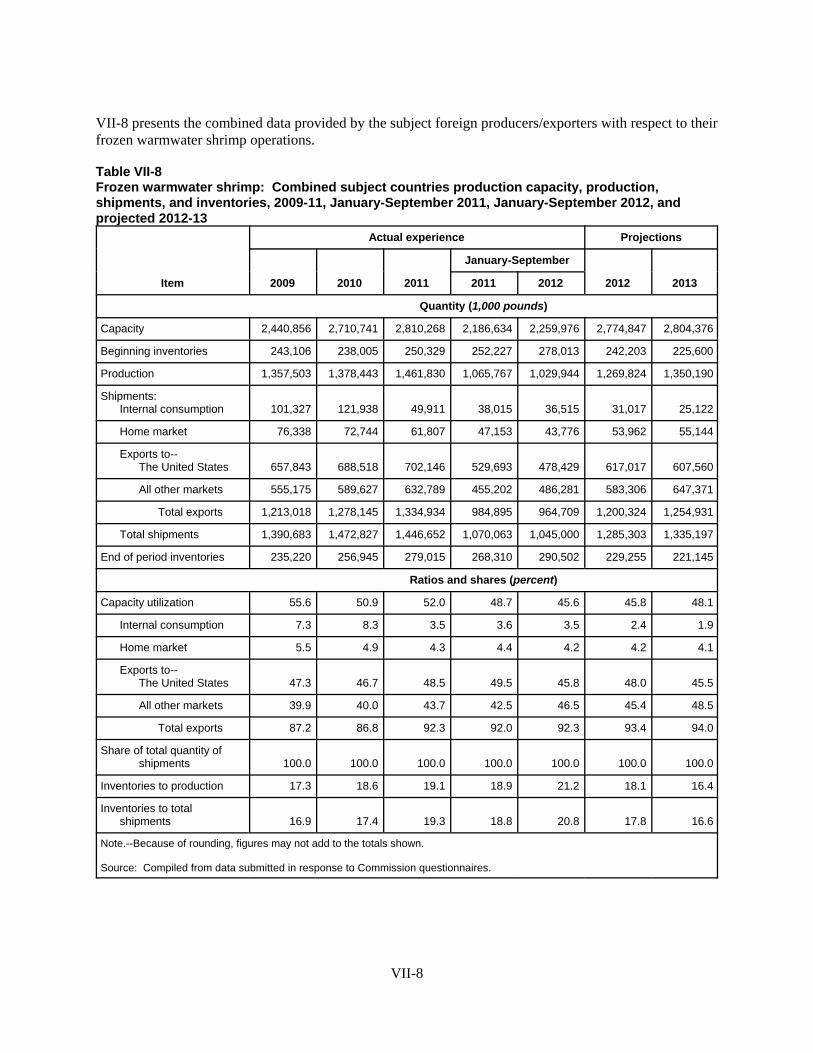
VII-8 presents the combined data provided by the subject foreign producers/exporters with respect to theirfrozen warmwater shrimp operations.
Table VII-8Frozen warmwater shrimp: Combined subject countries production capacity, production,shipments, and inventories, 2009-11, January-September 2011, January-September 2012, andprojected 2012-13
Item
Actual experience Projections
2009 2010 2011
January-September
2012 20132011 2012
Quantity (1,000 pounds)
Capacity 2,440,856 2,710,741 2,810,268 2,186,634 2,259,976 2,774,847 2,804,376
Beginning inventories 243,106 238,005 250,329 252,227 278,013 242,203 225,600
Production 1,357,503 1,378,443 1,461,830 1,065,767 1,029,944 1,269,824 1,350,190
Shipments:Internal consumption 101,327 121,938 49,911 38,015 36,515 31,017 25,122
Home market 76,338 72,744 61,807 47,153 43,776 53,962 55,144
Exports to--The United States 657,843 688,518 702,146 529,693 478,429 617,017 607,560
All other markets 555,175 589,627 632,789 455,202 486,281 583,306 647,371
Total exports 1,213,018 1,278,145 1,334,934 984,895 964,709 1,200,324 1,254,931
Total shipments 1,390,683 1,472,827 1,446,652 1,070,063 1,045,000 1,285,303 1,335,197
End of period inventories 235,220 256,945 279,015 268,310 290,502 229,255 221,145
Ratios and shares (percent)
Capacity utilization 55.6 50.9 52.0 48.7 45.6 45.8 48.1
Internal consumption 7.3 8.3 3.5 3.6 3.5 2.4 1.9
Home market 5.5 4.9 4.3 4.4 4.2 4.2 4.1
Exports to--The United States 47.3 46.7 48.5 49.5 45.8 48.0 45.5
All other markets 39.9 40.0 43.7 42.5 46.5 45.4 48.5
Total exports 87.2 86.8 92.3 92.0 92.3 93.4 94.0
Share of total quantity ofshipments 100.0 100.0 100.0 100.0 100.0 100.0 100.0
Inventories to production 17.3 18.6 19.1 18.9 21.2 18.1 16.4
Inventories to totalshipments 16.9 17.4 19.3 18.8 20.8 17.8 16.6
Note.--Because of rounding, figures may not add to the totals shown.
Source: Compiled from data submitted in response to Commission questionnaires.
VII-8

Freezing capacities
Reported total and allocated freezing capacity for 103 of the 144 reporting foreign producers’freeze-processed products at their facilities since 2009 is presented in table VII-9.
Table VII-9Frozen warmwater shrimp: Freezing capacity, 2009-11, January-September 2001, and January-September 2012
Item 2009 2010 2011
January-September
2011 2012
(Quantity in 1,000 pounds)
Total potential freezing capacity 2,621,641 2,884,072 3,096,670 2,355,965 2,505,550
allocated to frozen warmwatershrimp
2,094,054 2,304,473 2,492,216 1,895,803 2,020,012
Total block freezing capacity 1,071,312 1,125,306 1,192,408 921,393 960,016
Total IQF freezing capacity 1,396,296 1,604,573 1,741,677 1,308,725 1,661,256
Source: Compiled from data submitted in response to Commission questionnaires.
U.S. INVENTORIES OF FROZEN WARMWATER SHRIMP FROM SUBJECT COUNTRIES
As discussed earlier, only two firms reported U.S. inventories accounting for less than 0.5 percentof subject imports.
U.S. IMPORTERS’ CURRENT ORDERS
The Commission requested importers to indicate whether they imported or arranged for theimportation of frozen warmwater shrimp from subject and nonsubject countries after September 30, 2012. Table VII-10 presents reported arranged imports by 30 importers.
ANTIDUMPING INVESTIGATIONS IN THIRD-COUNTRY MARKETS
According to the World Bank's Global Antidumping Database, which covers most countriesthrough 2011, there are no other orders concerning shrimp.
VII-9

Table VII-10Frozen warmwater shrimp: Arranged imports after September 30, 2012
CountryOct. - Dec.
2012Jan. - Mar.
2013Apr. - June
2013July - Sept.
2013Oct.2012 -Sept. 2013
(Quantity in 1,000 pounds)
China 7,065 4,300 144 0 11,509
Ecuador 8,032 4,221 573 341 13,166
India 21,293 12,023 5,900 6,579 45,795
Indonesia 21,593 12,078 6,935 4,901 45,506
Malaysia 5,041 2,546 1,750 3,150 12,488
Thailand 39,986 18,730 12,388 6,806 77,909
Vietnam 15,910 7,986 6,298 0 30,193
Subtotal, subject 118,919 61,883 33,987 21,777 236,566
All other sources 32,306 24,537 24,208 25,220 106,272
Source: Compiled from data submitted in response to Commission questionnaires.
INFORMATION ON NONSUBJECT COUNTRIES
In assessing whether the domestic industry is materially injured or threatened with material injury“by reason of subject imports,” the legislative history states “that the Commission must examine allrelevant evidence, including any known factors, other than the dumped or subsidized imports, that may beinjuring the domestic industry, and that the Commission must examine those other factors (including non-subject imports) ‘to ensure that it is not attributing injury from other sources to the subject imports.’”3
Global Market
Imports of warmwater shrimp from nonsubject countries are available both as farmed andwild-caught. Mexico is the sixth-largest source of U.S. frozen shrimp imports and provides both farmedand wild-caught warmwater shrimp, with the wild-caught subject to the same seasonal supply surge asU.S. production. Mexico is the leading nonsubject source of wild-caught warmwater shrimp imports. In2008, however, Mexico's production was approximately 68 percent farmed and 32 percent wild-caught, reflecting an increased reliance on aquaculture from several years earlier. Other nonsubject countrysources, primarily for farmed shrimp, include Bangladesh, Honduras, and Peru.4
3 Mittal Steel Point Lisas Ltd. v. United States, Slip Op. 2007-1552 at 17 (Fed. Cir., Sept. 18, 2008), quoting fromStatement of Administrative Action on Uruguay Round Agreements Act, H.R. Rep. 103-316, Vol. I at 851-52; seealso Bratsk Aluminum Smelter v. United States, 444 F.3d 1369 (Fed. Cir. 2006).
4 Dubay, Kristen, Saori Tokuoka, and Gary Gereffi. A Value Chain Analysis of the Sinaloa, Mexico ShrimpFishery. Duke University, Center on Globalization, Governance & Competitiveness, March 2010.http://cggc.duke.edu/environment/CGGC_SinaloaShrimp_Report.pdf.
VII-10

APPENDIX A
FEDERAL REGISTER NOTICES
A-1


Table A-1Frozen warmwater shrimp: Federal Register notices
Publication date Title and citationJanuary 4, 2013 Frozen Warmwater Shrimp From China, Ecuador, India, Indonesia,
Malaysia, Thailand, and Vietnam; Institution of Countervailing Duty Investigations and Scheduling of Preliminary Phase Investigations, 78 FR 764
January 25, 2013 Certain Frozen Warmwater Shrimp From the People's Republic of China,Ecuador, India, Indonesia, Malaysia, Thailand, and the Socialist Republic ofVietnam: Initiation of Countervailing Duty Investigations, 78 FR 5416
A-3


APPENDIX B
CONFERENCE WITNESSES
B-1


B‐3
CALENDAR OF PUBLIC PRELIMINARY CONFERENCE
Those listed below are scheduled to appear as witnesses at the United States International
Trade Commission’s preliminary conference:
Subject: Frozen Warmwater Shrimp from China, Ecuador, India, Indonesia, Malaysia, Thailand, and Vietnam
Inv. Nos.: 701-TA-491-497 (Preliminary)
Date and Time: January 18, 2013 - 9:30 a.m.
Sessions will be held in connection with this preliminary investigation in the A L J
C o u r t r o o m B ( R o o m 1 1 1 ) , 500 E Street, S.W., Washington, D.C.
TIME OPENING REMARKS: ALLOCATION:
Petitioner (Elizabeth J. Drake, Stewart and Stewart) 5 minutes Respondents (Warren E. Connelly, Akin Gump Strauss Hauer & 5 minutes Feld LLP) In Support of the Imposition of TIME
Countervailing Duty Orders: ALLOCATION: Stewart and Stewart 60 minutes Washington, DC on behalf of and Leake and Anderson, LLP New Orleans, LA on behalf of The Coalition of Gulf Shrimp Industries (“COGSI”) Carson Kimbrough, President, Carson & Co., Inc. Alan Gibson, President and Owner, Tidelands Seafood Co., Inc. Daniel J. Babin, General Manger, Gulf Fish Inc.

B‐4
In Support of the Imposition of Countervailing Duty Orders (continued):
Ernest Anderson, President, Graham Shrimp Co., Inc.
Jonathan McLendon, Vice President, Biloxi Freezing & Processing, Inc. and M&M Processing, LLC David Chauvin, David Chauvin’s Seafood Company Inc. C. David Veal, Executive Director, Coalition Of Gulf Shrimp Industries Terence P. Stewart ) Eric P. Salonen ) Elizabeth J. Drake ) – OF COUNSEL Philip A. Butler ) Jennifer M. Smith ) Edward T. Hayes )
In Opposition to the Imposition of TIME Countervailing Duty Orders: ALLOCATION:
60 minutes total
White & Case LLP Washington, D.C. on behalf of Andaman Seafood Co., Ltd. Chanthaburi Frozen Food Co., Ltd. Chanthaburi Seafoods Co., Ltd. Phatthana Seafood Co., Ltd. Phatthana Frozen Food Co., Ltd. Sea Wealth Frozen Food Co., Ltd. Rubcion Resources, LLC (collectively “Rubicon Group”) Mark McCloskey, Senior Vice President, Purchasing and Product Development, The H&N Group Jay C. Campbell ) ) – OF COUNSEL Keir Whitson )

B‐5
In Opposition to the Imposition of Countervailing Duty Orders (continued):
Arent Fox LLP Washington, D.C. on behalf of Seafood Exporters Association of India (“SEAI”) Elias Sait, Secretary General, SEAI Robert Paterson, President and Chief Executive Officer, Tampa Bay Fisheries Mark P. Lunn ) – OF COUNSEL Trade Pacific PLLC Washington, D.C. on behalf of Eastern Fish Company Chicken of the Sea Frozen Foods Marine Gold Products Limited Pakfood Public Company Limited Thai Royal Frozen Food Company Limited Thai Union Frozen Products Public Company Limited Thai Union Seafood Company Limited Eric Bloom, President, Eastern Fish Company Carlos A. Faria, Vice President of Operations, Chicken of the Sea Frozen Foods Robert G. Gosselink ) – OF COUNSEL
Akin Gump Strauss Hauer & Feld LLP Washington, D.C. on behalf of The National Chamber of Aquaculture Warren E. Connelly ) ) – OF COUNSEL Jarrod M. Goldfeder )
B‐6
In Opposition to the Imposition of Countervailing Duty Orders (continued): Mayer Brown LLP Washington, D.C. on behalf of The Government of Indonesia Indonesia Fishery Product Processing & Marketing Association Duane W. Layton ) ) – OF COUNSEL
Jing Zhang ) REBUTTAL/CLOSING REMARKS:
Petitioner (Elizabeth J. Drake, Stewart and Stewart) 10 minutes Respondents (Mark P. Lunn, Arent Fox LLP and 10 minutes
Robert G. Gosselink, Trade Pacific PLLC)
-END-

APPENDIX C
SUMMARY DATA
C-1


Table C-1Frozen warmwater shrimp: Summary data concerning the U.S. market, 2009-11, January-September 2011, and January-September 2012 1
Jan.-Sept. (1)2009 2010 2011 2011 2012 2009-11 2009-10 2010-11 2011-12
U.S. consumption quantity: (1)Amount................................................... 1,276,024 1,249,308 1,295,294 776,279 *** 1.5 (2.1) 3.7 ***Producers' share (2)............................... 12.5 9.6 10.5 11.7 *** (1.9) (2.9) 0.9 ***Importers' share (2):
China.................................................... 3.9 4.4 3.2 2.8 *** (0.6) 0.5 (1.1) ***Ecuador............................................... 10.5 11.3 12.4 14.1 *** 1.9 0.8 1.0 ***India..................................................... 3.3 5.2 8.1 7.3 *** 4.8 1.9 2.9 ***Indonesia............................................. 11.4 10.1 11.3 12.8 *** (0.1) (1.3) 1.2 ***Malaysia............................................... 3.1 4.2 4.9 4.0 *** 1.8 1.1 0.7 ***Thailand............................................... 30.9 33.2 29.0 28.8 *** (1.9) 2.3 (4.3) ***Vietnam................................................ 6.9 8.1 7.1 6.9 *** 0.1 1.1 (1.0) ***
Subtotal, subject............................... 70.0 76.6 76.0 76.6 *** 5.9 6.6 (0.6) ***Nonsubjectcountries............................. 17.5 13.8 13.5 11.7 *** (4.0) (3.7) (0.3) ***
Total imports..................................... 87.5 90.4 89.5 88.3 *** 1.9 2.9 (0.9) ***
U.S. consumption value: (1)Amount................................................... 4,303,457 4,716,409 5,671,982 3,368,423 *** 31.8 9.6 20.3 ***Producers' share (2)............................... 14.7 11.5 12.4 13.9 *** (2.3) (3.1) 0.8 ***Importers' share (2):
China.................................................... 3.4 3.7 2.8 2.3 *** (0.6) 0.3 (0.9) ***Ecuador............................................... 7.9 8.9 9.5 10.9 *** 1.6 1.0 0.7 ***India..................................................... 3.7 6.5 9.3 8.5 *** 5.6 2.8 2.8 ***Indonesia............................................. 11.3 10.3 12.1 13.8 *** 0.8 (1.0) 1.8 ***Malaysia............................................... 2.6 3.3 3.7 3.0 *** 1.1 0.6 0.5 ***Thailand............................................... 30.8 31.4 29.2 28.7 *** (1.6) 0.6 (2.2) ***Vietnam................................................ 8.8 10.8 8.9 8.6 *** 0.1 2.0 (1.9) ***
Subtotal, subject............................... 68.6 74.9 75.6 75.8 *** 7.0 6.3 0.7 ***Nonsubjectcountries............................. 16.7 13.5 12.0 10.3 *** (4.7) (3.2) (1.5) ***
Total imports..................................... 85.3 88.5 87.6 86.1 *** 2.3 3.1 (0.8) ***
U.S. imports from:China:
Quantity................................................ 49,600 54,591 42,032 28,407 21,633 (15.3) 10.1 (23.0) (23.8)Value.................................................... 145,582 174,857 159,147 106,181 75,733 9.3 20.1 (9.0) (28.7)Unit value............................................. $2.94 $3.20 $3.79 $3.74 $3.50 29.0 9.1 18.2 (6.3)Ending inventory quantity..................... *** *** *** *** *** (3) (3) (3) ***
Ecuador:Quantity................................................ 133,935 141,620 160,422 121,864 138,853 19.8 5.7 13.3 13.9Value.................................................... 339,850 418,571 540,443 411,389 445,209 59.0 23.2 29.1 8.2Unit value............................................. $2.54 $2.96 $3.37 $3.38 $3.21 32.8 16.5 14.0 (5.0)Ending inventory quantity..................... *** *** *** *** *** *** *** *** ***
India:Quantity................................................ 42,486 65,444 104,960 72,433 90,320 147.0 54.0 60.4 24.7Value.................................................... 161,163 308,832 529,412 365,157 372,197 228.5 91.6 71.4 1.9Unit value............................................. $3.79 $4.72 $5.04 $5.04 $4.12 33.0 24.4 6.9 (18.3)Ending inventory quantity..................... 2,982 19,789 25,914 20,653 23,877 769.0 563.6 31.0 15.6
Indonesia:Quantity................................................ 145,391 126,661 146,747 111,798 116,090 0.9 (12.9) 15.9 3.8Value.................................................... 487,326 485,466 686,296 522,372 493,977 40.8 (0.4) 41.4 (5.4)Unit value............................................. $3.35 $3.83 $4.68 $4.67 $4.26 39.5 14.3 22.0 (8.9)Ending inventory quantity..................... 13,316 10,263 16,099 15,273 13,162 20.9 (22.9) 56.9 (13.8)
Malaysia:Quantity................................................ 39,466 52,721 63,415 40,324 35,542 60.7 33.6 20.3 (11.9)Value.................................................... 113,842 153,999 212,566 132,841 124,460 86.7 35.3 38.0 (6.3)Unit value............................................. $2.88 $2.92 $3.35 $3.29 $3.50 16.2 1.3 14.8 6.3Ending inventory quantity..................... *** *** *** *** *** *** *** *** ***
Thailand:Quantity................................................ 394,308 414,954 375,072 261,328 196,756 (4.9) 5.2 (9.6) (24.7)Value.................................................... 1,324,191 1,480,787 1,655,821 1,138,813 836,122 25.0 11.8 11.8 (26.6)Unit value............................................. $3.36 $3.57 $4.41 $4.36 $4.25 31.5 6.3 23.7 (2.5)Ending inventory quantity..................... 45,315 40,715 53,030 51,002 39,985 17.0 (10.2) 30.2 (21.6)
Vietnam:Quantity................................................ 88,490 100,834 91,503 64,380 57,139 3.4 13.9 (9.3) (11.2)Value.................................................... 379,595 511,515 504,949 353,209 311,539 33.0 34.8 (1.3) (11.8)Unit value............................................. $4.29 $5.07 $5.52 $5.49 $5.45 28.6 18.3 8.8 (0.6)Ending inventory quantity..................... *** *** *** *** *** *** *** *** ***
Subject sources:Quantity................................................ 893,678 956,825 984,150 700,534 656,333 10.1 7.1 2.9 (6.3)Value.................................................... 2,951,547 3,534,025 4,288,634 3,029,961 2,659,237 45.3 19.7 21.4 (12.2)Unit value............................................. $3.30 $3.69 $4.36 $4.33 $4.05 31.9 11.8 18.0 (6.3)Ending inventory quantity..................... 95,450 97,012 124,473 111,478 108,819 30.4 1.6 28.3 (2.4)
Nonsubject sources:Quantity................................................ 222,951 172,475 174,570 110,715 116,366 (21.7) (22.6) 1.2 5.1Value.................................................... 720,432 638,578 681,566 419,105 431,129 (5.4) (11.4) 6.7 2.9Unit value............................................. $3.23 $3.70 $3.90 $3.79 $3.70 20.8 14.6 5.5 (2.1)Ending inventory quantity..................... 11,902 11,786 8,578 6,765 6,362 (27.9) (1.0) (27.2) (6.0)
All sources:Quantity................................................ 1,116,629 1,129,300 1,158,720 811,249 772,699 3.8 1.1 2.6 (4.8)Value.................................................... 3,671,979 4,172,604 4,970,199 3,449,067 3,090,366 35.4 13.6 19.1 (10.4)Unit value............................................. $3.29 $3.69 $4.29 $4.25 $4.00 30.4 12.4 16.1 (5.9)Ending inventory quantity..................... 107,352 108,798 133,051 118,243 115,181 23.9 1.3 22.3 (2.6)
Table continued next page
(Quantity=1,000 pounds; Value=1,000 dollars; Unit values, unit labor costs, and unit expenses=dollars per pound; Period changes=percent--exceptions noted)
Report data Period changesJanuary-September (1)
C-3

Table C-1--ContinuedFrozen warmwater shrimp: Summary data concerning the U.S. market, 2009-11, January-September 2011, and January-September 2012(Quantity=1,000 pounds; Value=1,000 dollars; Unit values, unit labor costs, and unit expenses=dollars per pound; Period changes=percent--exceptions noted)
Jan.-Sept.2009 2010 2011 2011 2012 2009-11 2009-10 2010-11 2011-12
U.S. producers':Average capacity quantity....................... 658,566 687,265 704,850 506,682 522,909 7.0 4.4 2.6 3.2Production quantity................................. 222,231 181,325 198,011 151,706 144,039 (10.9) (18.4) 9.2 (5.1)Capacity utilization (2) (4)...................... 32.9 25.6 27.4 29.2 26.9 (5.5) (7.2) 1.7 (2.2)U.S. shipments:
Quantity................................................ *** *** *** *** *** *** *** *** ***Value.................................................... *** *** *** *** *** *** *** *** ***Unit value............................................. *** *** *** *** *** *** *** *** ***
Export shipments:Quantity................................................ *** *** *** *** *** *** *** *** ***Value.................................................... *** *** *** *** *** *** *** *** ***Unit value............................................. *** *** *** *** *** *** *** *** ***
Ending inventory quantity....................... 35,865 33,699 38,357 34,508 46,105 6.9 (6.0) 13.8 33.6Inventories/total shipments (2)................ 16.6 18.1 19.8 17.3 25.5 3.2 1.5 1.7 8.2Production workers................................. 2,069 1,859 1,922 1,830 1,783 (7.1) (10.1) 3.4 (2.6)Hours worked (1,000s)............................ 3,885 3,143 3,321 2,807 2,714 (14.5) (19.1) 5.7 (3.3)Wages paid ($1,000).............................. 49,677 43,340 47,411 36,606 35,490 (4.6) (12.8) 9.4 (3.0)Productivity (lbs per hour) (4).................. 53.8 54.0 56.5 51.2 50.8 5.0 0.2 4.7 (0.7)Unit labor costs (4)................................. $0.23 $0.25 $0.25 $0.25 $0.25 6.9 7.2 (0.3) 2.3Net Sales:
Quantity................................................ 212,264 181,959 192,962 147,637 136,273 (9.1) (14.3) 6.0 (7.7)Value.................................................... 651,397 662,102 724,971 548,171 523,174 11.3 1.6 9.5 (4.6)Unit value............................................. $3.07 $3.64 $3.76 $3.71 $3.84 22.5 18.6 3.3 3.5
Cost of goods sold (COGS).................... 592,910 612,348 673,875 507,621 488,615 13.7 3.3 10.0 (3.7)Gross profit of (loss)............................... 58,487 49,754 51,096 40,550 34,559 (12.6) (14.9) 2.7 (14.8)SG&A expenses..................................... 46,500 43,919 48,812 34,817 41,068 5.0 (5.6) 11.1 18.0Operating income or (loss)...................... 11,987 5,835 2,284 5,733 (6,509) (80.9) (51.3) (60.9) (3)Capital expenditures.............................. 4,671 10,202 7,700 4,114 4,793 64.8 118.4 (24.5) 16.5Unit COGS.............................................. $2.79 $3.37 $3.49 $3.44 $3.59 25.1 20.8 3.6 4.4Unit SG&A expenses............................. $0.22 $0.24 $0.25 $0.24 $0.30 13.6 9.1 4.2 25.0Unit operating income or (loss)............... $0.06 $0.03 $0.01 $0.04 ($0.05) (83.3) (50.0) (66.7) (3)COGS/sales (2)...................................... 91.0 92.5 93.0 92.6 93.4 2.0 1.5 0.5 0.8Operating income or (loss)/sales (2)...... 1.8 0.9 0.3 1.0 (1.2) (1.5) (0.9) (0.6) (2.2)
Notes:(1) All partial year period data are January to September, except consumption data which are January to August as 2012 NOAA data are only available for this 8 month period.(2) Report data are in percent and period changes are in percentage points.(3) Undefined.(4) Calculations exclude data for firms that did not report both data elements necessary for the calculation.
January-September
C-4
Report data Period changes

APPENDIX D
TARIFF TREATMENT
D-1

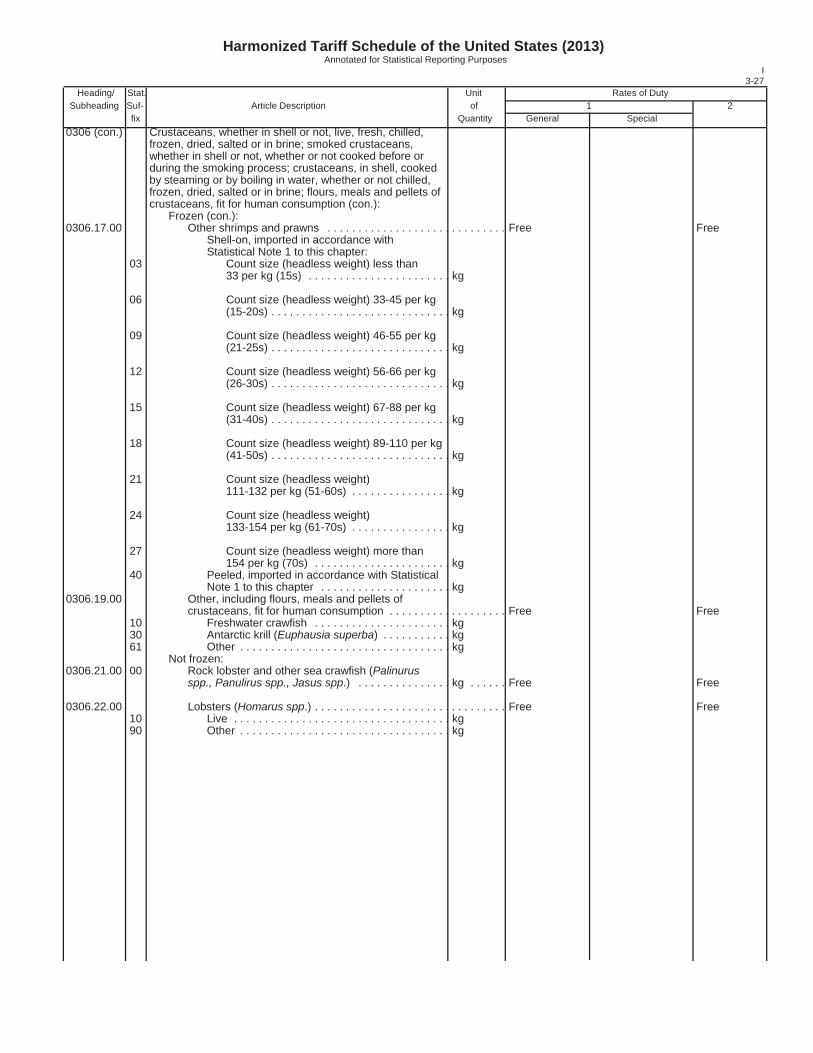
Harmonized Tariff Schedule of the United States (2013) Annotated for Statistical Reporting Purposes
I3-27
Heading/ Stat. Unit Rates of Duty Subheading Suf- Article Description of 1 2 fix Quantity General Special0306 (con.) Crustaceans, whether in shell or not, live, fresh, chilled,
frozen, dried, salted or in brine; smoked crustaceans,whether in shell or not, whether or not cooked before orduring the smoking process; crustaceans, in shell, cooked by steaming or by boiling in water, whether or not chilled, frozen, dried, salted or in brine; flours, meals and pellets of crustaceans, fit for human consumption (con.):
Frozen (con.):0306.17.00 Other shrimps and prawns . . . . . . . . . . . . . . . . . . . . . . . . . . . . . Free Free
Shell-on, imported in accordance with Statistical Note 1 to this chapter:
03 Count size (headless weight) less than 33 per kg (15s) . . . . . . . . . . . . . . . . . . . . . . . kg
06 Count size (headless weight) 33-45 per kg (15-20s) . . . . . . . . . . . . . . . . . . . . . . . . . . . . . kg
09 Count size (headless weight) 46-55 per kg (21-25s) . . . . . . . . . . . . . . . . . . . . . . . . . . . . . kg
12 Count size (headless weight) 56-66 per kg (26-30s) . . . . . . . . . . . . . . . . . . . . . . . . . . . . . kg
15 Count size (headless weight) 67-88 per kg (31-40s) . . . . . . . . . . . . . . . . . . . . . . . . . . . . . kg
18 Count size (headless weight) 89-110 per kg(41-50s) . . . . . . . . . . . . . . . . . . . . . . . . . . . . . kg
21 Count size (headless weight)111-132 per kg (51-60s) . . . . . . . . . . . . . . . . kg
24 Count size (headless weight)133-154 per kg (61-70s) . . . . . . . . . . . . . . . . kg
27 Count size (headless weight) more than 154 per kg (70s) . . . . . . . . . . . . . . . . . . . . . . kg
40 Peeled, imported in accordance with Statistical Note 1 to this chapter . . . . . . . . . . . . . . . . . . . . . kg
0306.19.00 Other, including flours, meals and pellets of crustaceans, fit for human consumption . . . . . . . . . . . . . . . . . . . Free Free
10 Freshwater crawfish . . . . . . . . . . . . . . . . . . . . . . kg 30 Antarctic krill (Euphausia superba) . . . . . . . . . . . kg 61 Other . . . . . . . . . . . . . . . . . . . . . . . . . . . . . . . . . . kg
Not frozen:0306.21.00 00 Rock lobster and other sea crawfish (Palinurus
spp., Panulirus spp., Jasus spp.) . . . . . . . . . . . . . . . kg . . . . . . Free Free
0306.22.00 Lobsters (Homarus spp.) . . . . . . . . . . . . . . . . . . . . . . . . . . . . . . . Free Free 10 Live . . . . . . . . . . . . . . . . . . . . . . . . . . . . . . . . . . . kg 90 Other . . . . . . . . . . . . . . . . . . . . . . . . . . . . . . . . . . kg

Harmonized Tariff Schedule of the United States (2013) Annotated for Statistical Reporting Purposes
IV16-12
Heading/ Stat. Unit Rates of Duty
Subheading Suf- Article Description of 1 2
fix Quantity General Special
1605 (con.) Crustaceans, molluscs and other aquatic invertebrates, prepared or preserved (con.):
Shrimps and prawns:1605.21 Not in airtight containers:1605.21.05 00 Products containing fish meat; prepared meals.. kg. . . . . . . 5% Free (A*,AU,BH, 20%
CA,CL,CO,E,IL, J,JO,MA,MX, OM,P,PA,PE,SG)3% (KR)
1605.21.10 Other. . . . . . . . . . . . . . . . . . . . . . . . . . . . . . . . . . . . . . . . . . . . . Free FreeFrozen, imported in accordance withStatistical Note 1 to this chapter:
20 Breaded. . . . . . . . . . . . . . . . . . . . . . . . . . kg 30 Other. . . . . . . . . . . . . . . . . . . . . . . . . . . . . kg 50 Other, imported in accordance with
Statistical Note 1 to this chapter.. . . . . . . . . . kg1605.29 Other:1605.29.05 00 Products containing fish meat; prepared meals.. kg. . . . . . . 5% Free (A*,AU,BH, 20%
CA,CL,CO,E,IL,J, JO,MA,MX,OM, P,PA,PE,SG)3% (KR)
1605.29.10 Other. . . . . . . . . . . . . . . . . . . . . . . . . . . . . . . . . . . . . . . . . . . . . Free Free 10 Frozen, imported in accordance with
Statistical Note 1 to this chapter.. . . . . . . . . . kg
40 Other, imported in accordance withStatistical Note 1 to this chapter.. . . . . . . . . . kg
1605.30 Lobster:1605.30.05 Products containing fish meat; prepared meals. . . . . . . . . . . . . . . 10% Free (A,AU,BH,CA, 20%
CL,CO,E,IL,J,JO, MA,MX,OM,P,PA, PE,SG)3.3% (KR)
10 In airtight containers. . . . . . . . . . . . . . . . . . . . . . . kg 90 Other. . . . . . . . . . . . . . . . . . . . . . . . . . . . . . . . . . . kg
1605.30.10 Other. . . . . . . . . . . . . . . . . . . . . . . . . . . . . . . . . . . . . . . . . . . . . . . . Free FreeLobster meat, cooked by steaming or boiling inwater and out of shell, whether or not frozen but not further prepared or preserved:
10 Frozen. . . . . . . . . . . . . . . . . . . . . . . . . . . . . . . kg 30 Not frozen. . . . . . . . . . . . . . . . . . . . . . . . . . . . kg
Other: 50 In airtight containers. . . . . . . . . . . . . . . . . . . . kg 90 Other. . . . . . . . . . . . . . . . . . . . . . . . . . . . . . . . kg
1605.40 Other crustaceans:1605.40.05 00 Products containing fish meat; prepared meals. . . . . kg. . . . . . . Free 20%1605.40.10 Other. . . . . . . . . . . . . . . . . . . . . . . . . . . . . . . . . . . . . . . . . . . . . . . . Free Free
10 Peeled freshwater crawfish tail meat. . . . . . . . . . kg 90 Other. . . . . . . . . . . . . . . . . . . . . . . . . . . . . . . . . . . kg
Molluscs:1605.51 Oysters:1605.51.05 00 Products containing fish meat; prepared
meals. . . . . . . . . . . . . . . . . . . . . . . . . . . . . . . . . . . kg. . . . . . . Free 20%
Other:1605.51.40 00 Smoked. . . . . . . . . . . . . . . . . . . . . . . . . . . . . . kg. . . . . . . Free 7.5%1605.51.50 00 Other. . . . . . . . . . . . . . . . . . . . . . . . . . . . . . . . kg. . . . . . . 4.7% Free (A+,AU,BH, 12.5%
CA,CL,CO,D,E, IL,J,JO,MA,MX, OM,P,PA,PE,SG)3.7% (KR)
1605.52 Scallops, including queen scallops:1605.52.05 00 Products containing fish meat;
prepared meals. . . . . . . . . . . . . . . . . . . . . . . . . . . kg. . . . . . . Free 20%
1605.52.60 00 Other. . . . . . . . . . . . . . . . . . . . . . . . . . . . . . . . . . . kg. . . . . . . Free Free

APPENDIX E
U.S. FISHERMEN DATA
E-1

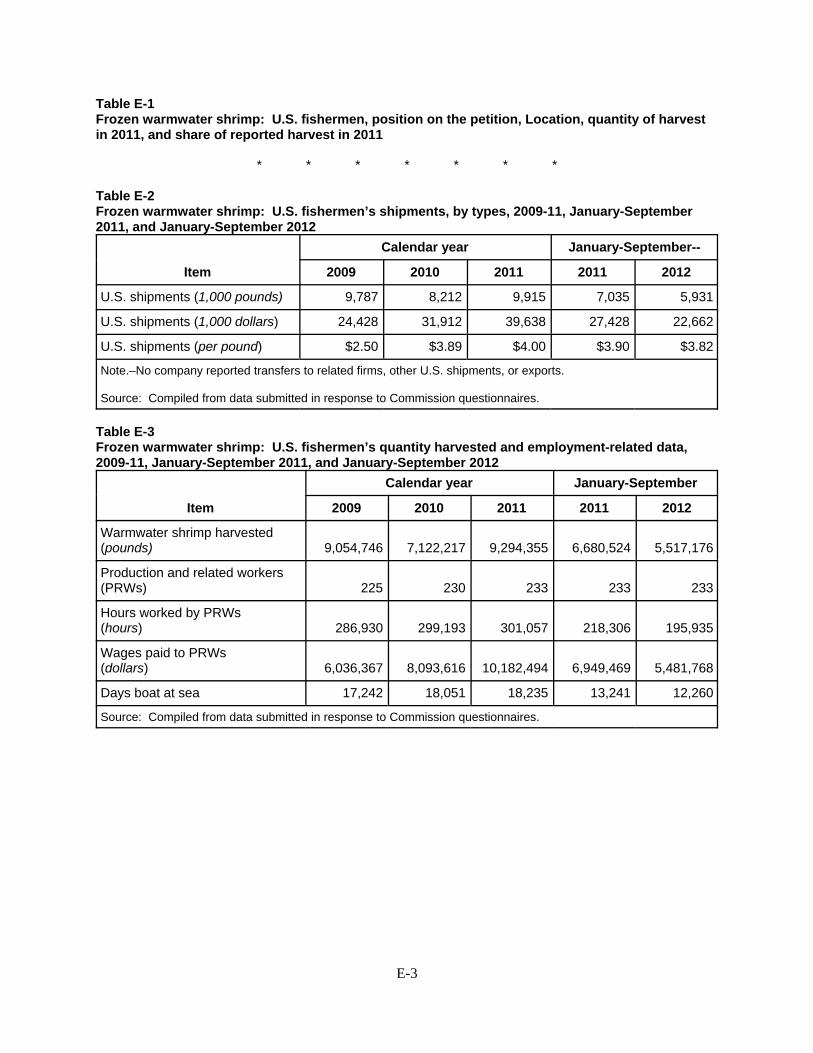
Table E-1Frozen warmwater shrimp: U.S. fishermen, position on the petition, Location, quantity of harvestin 2011, and share of reported harvest in 2011
* * * * * * *
Table E-2Frozen warmwater shrimp: U.S. fishermen’s shipments, by types, 2009-11, January-September2011, and January-September 2012
Item
Calendar year January-September--
2009 2010 2011 2011 2012
U.S. shipments (1,000 pounds) 9,787 8,212 9,915 7,035 5,931
U.S. shipments (1,000 dollars) 24,428 31,912 39,638 27,428 22,662
U.S. shipments (per pound) $2.50 $3.89 $4.00 $3.90 $3.82
Note.–No company reported transfers to related firms, other U.S. shipments, or exports.
Source: Compiled from data submitted in response to Commission questionnaires.
Table E-3Frozen warmwater shrimp: U.S. fishermen’s quantity harvested and employment-related data,2009-11, January-September 2011, and January-September 2012
Item
Calendar year January-September
2009 2010 2011 2011 2012
Warmwater shrimp harvested(pounds) 9,054,746 7,122,217 9,294,355 6,680,524 5,517,176
Production and related workers(PRWs) 225 230 233 233 233
Hours worked by PRWs(hours) 286,930 299,193 301,057 218,306 195,935
Wages paid to PRWs (dollars) 6,036,367 8,093,616 10,182,494 6,949,469 5,481,768
Days boat at sea 17,242 18,051 18,235 13,241 12,260
Source: Compiled from data submitted in response to Commission questionnaires.
E-3

Table E-4Warmwater shrimp: Financial results of fishermen, calendar years 2009-2011, January-September 2011, January-September 2012
Item
Calendar year January-September
2009 2010 2011 2011 2012
Quantity (1,000 pounds)
Net sales quantity 12,811 10,202 12,482 8,760 7,283
Value ($1,000)
Net sales value 31,090 39,642 48,203 33,576 29,848
Operating expenses 30,362 37,105 44,868 30,053 28,439
Net income before salaries 728 2,537 3,335 3,524 1,409
Officer/partner salaries 204 269 274 81 107
Other rev. and Gulf oil spill compensation 486 2,406 2,342 881 1,846
Net income 1,010 4,674 5,403 4,324 3,148
Ratio to net sales (percent)
Operating expenses 97.7 93.6 93.1 89.5 95.3
Net income before salaries 2.3 6.4 6.9 10.5 4.7
Net income 3.2 11.8 11.2 12.9 10.5
Unit value ($1,000)
Net sales value 2.43 3.89 3.86 3.83 4.10
Operating expenses 2.37 3.64 3.59 3.43 3.90
Net income before salaries 0.06 0.25 0.27 0.40 0.19
Officer/partner salaries 0.02 0.03 0.02 0.01 0.01
Other rev. and Gulf oil spill compensation 0.04 0.24 0.19 0.10 0.25
Net income 0.08 0.46 0.43 0.49 0.43
Value ($1,000)
Capital expenditures 1,142 645 800 723 738
Number of fishermen reporting
Net losses before salaries 42 29 22 19 42
Net losses 36 17 14 16 34
Data 88 89 89 89 89
Source: Compiled from data submitted in response to Commission questionnaires.
E-4

APPENDIX F
ALLEGED EFFECTS OF IMPORTS ON U.S. PROCESSORS’EXISTING DEVELOPMENT AND PRODUCTION EFFORTS
GROWTH, INVESTMENT, AND ABILITY TO RAISE CAPITAL

The Commission requested that U.S. processors describe any actual or anticipated negativeeffects since January 1, 2009 on their growth, investment, ability to raise capital, existing developmentand production efforts, or the scale of capital investments as a result of imports of frozen warmwatershrimp and prawns from China, Ecuador, India, Indonesia, Malaysia, Thailand, and Vietnam. Unlessspecifically noted, the processors did not distinguish between China, Ecuador, India, Indonesia, Malaysia,Thailand, and Vietnam in their comments. The responses of those processors that provided useablefinancial results data are as follows:
Actual Negative Effects
Bama Sea Products ***.Bayou Shrimp Proc. ***.Biloxi Freezing ***.Bluewater Shrimp ***. Bon Secour ***.Carson & Co. ***.CF Gollott ***.Dominick’s Seafood ***.DoRan Seafood ***.Fisherman’s Reef ***.Golden Gulf Coast ***. Graham Shrimp ***.Gulf Crown ***.Gulf Fish ***.Gulf Island Shrimp ***. Gulf Pride ***.Gulf South ***.Hi Seas of Dulac ***.Indian Ridge Shrimp ***.Int. Oceanic Ent. ***.JBS Packing ***.Lafitte Frozen Foods ***.Lazaretta Packing ***.Lighthouse Seafood ***.Ocean Harvest ***.Ocean Pride ***.Paul Piazza & Sons ***.Penguin Frozen Foods ***.RA Lesso Brokerage ***.Seagold ***.Sea Pearl Seafood ***.Tampa Bay Fisheries ***.Texas Gulf Seafood ***.Tideland Seafood ***.Tommy’s Seafood ***.Wood’s Fisheries ***.
F-3

Anticipated Negative Effects
Bama Sea Products ***.Bayou Shrimp Proc. ***.Biloxi Freezing ***.Bluewater Shrimp ***. Bon Secour ***.Carson & Co. ***.CF Gollott ***.Dominick’s Seafood ***.DoRan Seafood ***.Fisherman’s Reef ***.Golden Gulf Coast ***. Graham Shrimp ***.Gulf Crown ***.Gulf Fish ***.Gulf Island Shrimp ***. Gulf Pride ***.Gulf South ***.Hi Seas of Dulac ***.Indian Ridge Shrimp ***.Int. Oceanic Ent. ***.JBS Packing ***.Lafitte Frozen Foods ***.Lazaretta Packing ***.Lighthouse Seafood ***.Ocean Harvest ***.Ocean Pride ***.Paul Piazza & Sons ***.Penguin Frozen Foods ***.RA Lesso Brokerage ***.Seagold ***.Sea Pearl Seafood ***.Tampa Bay Fisheries ***.Texas Gulf Seafood ***.Tideland Seafood ***.Tommy’s Seafood ***.Wood’s Fisheries ***.
F-4

APPENDIX G
ALLEGED EFFECTS OF IMPORTS ON U.S. FISHERMEN’SEXISTING DEVELOPMENT AND PRODUCTION EFFORTS
GROWTH, INVESTMENT, AND ABILITY TO RAISE CAPITAL


The Commission requested that U.S. fishermen describe any actual or anticipated negative effectssince January 1, 2009 on their growth, investment, ability to raise capital, existing development andproduction efforts, or the scale of capital investments as a result of imports of frozen warmwater shrimpand prawns from China, Ecuador, India, Indonesia, Malaysia, Thailand, and Vietnam. Unless specificallynoted, fishermen did not distinguish between China, Ecuador, India, Indonesia, Malaysia, Thailand, andVietnam in their comments. A summary of the responses of those fishermen that provided useable tradedata are as follows:
Actual and Anticipated Negative Effects
Nineteen U.S. fishermen reported no actual negative effects, while 48 fishermen reported thatthey experienced actual negative effects. With respect to those fishermen reporting actual negativeeffects, the impact was classified as follows: cancellations, postponement, or rejection of expansionproject (34); denial or rejection of investment proposal (12), reduction in the size of capital investments(25); rejection of bank loans (15); lower of credit rating (13); and “other” (20).
Seventy-five fishermen reported anticipated negative effects, while zero reported that theyanticipated no negative effects.1
1 The total number of fishermen reporting usable trade date, 85, is greater than the total number reporting theextent of actual negative effects, 67, or anticipated negative effects, 75. These differences generally reflect the factthat not all fishermen reporting usable trade data responded to the above-referenced questions regarding actualand/or anticipated negative effects.
G-3