frx report designer 6.7 user’s guide · chapter 8: using extensible business ... including xbrl...
TRANSCRIPT

© Copyright 2004 FRx Software Corporation.All rights reserved.
FRx® Report Designer 6.7 User’s Guide

Revision History
Legal NoticesFRx Software Corporation makes no representations or warranties with respect to the contents of this manual and specifically disclaims any implied warranties of merchantability or fitness for any particular purpose.
We welcome user comments and reserve the right to revise this publication and to make improvements or changes to the products and programs described in this publication at any time without notice.
Printed in the United States of America.
No part of this publication may be reproduced in any form without the prior written consent of FRx Software Corporation.
Copyright and Trademarks Notice© Copyright 2004 by FRx Software Corporation. All rights reserved. Microsoft, FRx, instant!OLAP, and Drilldown Viewer are either registered trademarks or trademarks of Microsoft Corporation or FRx Software Corporation or their affiliates in the United States and/or other countries. All other registered trademarks and trademarks are property of their respective owners. FRx Software Corporation is a subsidiary of Microsoft Corporation.
Document Number Document Date Software Release
RDUG March 1, 2004 6.7

Contents
iFRx Report Designer 6.7 User’s Guide
Preface ........................................................................................................................... viiWho Should Read this Guide ........................................................................................... viiHow this Guide is Organized ............................................................................................ viiWhat’s New in Report Designer 6.7..................................................................................viiiImproved in FRx 6.7 .........................................................................................................viiiAvailable Product Documentation ..................................................................................... ixOther Documentation ......................................................................................................... xConventions Used in this Guide ........................................................................................ xiHow to Contact Us............................................................................................................. xiSoftware Licensing ............................................................................................................ xi
Chapter 1: Welcome to FRx Report Designer ............................................................. 1Using This Guide ...............................................................................................................3
Keyboard Commands ................................................................................................3Mouse Commands .....................................................................................................3Typographical Conventions .......................................................................................3Note and Warning Messages .....................................................................................4
System Requirements .......................................................................................................5Installing and Starting Report Designer ............................................................................5
Starting Report Designer ...........................................................................................5Understanding Report Designer: An Overview .................................................................6
Building Blocks ..........................................................................................................6User Security ............................................................................................................8Report Specification Sets ..........................................................................................8Presentation Quality Reports .....................................................................................8FRx DrillDown Viewer ................................................................................................9Account Codes ..........................................................................................................9
Getting Around in Report Designer .................................................................................11The Report Designer Control Panel ...........................................................................11The Toolbar................................................................................................................12Basic Report Designer Techniques and Keyboard Commands ...............................13Record Control Boxes ................................................................................................18
Defining Available Commands on Report Designer Menus .............................................18

ii
Contents
FRx Report Designer 6.7 User’s Guide
Chapter 2: Creating Basic Reports with FRx Report Designer ................................ 21Creating a Company ........................................................................................................22Creating a Sample Report ...............................................................................................25Building a Row Format from the Chart of Accounts .........................................................26Modifying a Row Format ..................................................................................................28
Revenue Rows ..........................................................................................................28Operating Expenses Rows.........................................................................................35Income Rows .............................................................................................................38
Saving Your Row Format File ..........................................................................................42Creating a Column Layout ...............................................................................................43Working with Reporting Trees .........................................................................................46
Viewing an Existing Tree ...........................................................................................46Creating a New Reporting Tree ................................................................................47
Creating a New Catalog ID ..............................................................................................49Generating and Viewing a Report ...................................................................................53Completing Your Setup ...................................................................................................55
Chapter 3: Creating Row Formats .............................................................................. 57Row Format Menu Functions ...........................................................................................58
File Menu ...................................................................................................................58Edit Menu ...................................................................................................................59Format Menu..............................................................................................................63Link Menu...................................................................................................................65
Row Format Toolbar .........................................................................................................65Account Code Segments .................................................................................................66Building a Row Format .....................................................................................................67
Building a Row Format From the Chart of Accounts .................................................67Defining the Account Segments in a Row Format .....................................................68Opening a Row Format ..............................................................................................70
Modifying Row Formats ....................................................................................................70Row Code Column .....................................................................................................71 Description Column...................................................................................................71Fmt Code Column ......................................................................................................73Related Rates/Rows/Unit Column..............................................................................80Normal Balance Column ............................................................................................82Print Control Column..................................................................................................82G Column ................................................................................................................83Link Column ..............................................................................................................84
Totaling and Calculations .................................................................................................86Standard Totaling (TOT) ...........................................................................................86Formula Totaling (CAL)..............................................................................................86Point and Click Totaling for TOT and CAL rows ........................................................92
General Ledger Account Codes .....................................................................................94Zero Balance Accounts .............................................................................................94

iii
Contents
FRx Report Designer 6.7 User’s Guide
Defining an Account Code ........................................................................................94Defining Only the Natural Code ................................................................................94Defining the Full Account Code .................................................................................95Entering General Ledger Codes ...............................................................................96Using Wildcards and Ranges ....................................................................................97Linking to Account Types ........................................................................................100Account Sets ...........................................................................................................101Using Account Modifiers .........................................................................................103Combining Account Modifiers ..................................................................................105Restricting Rows with Book Codes .........................................................................106Using Account Attributes and Transaction Attributes in Rows ................................107
Assigning Currency Codes ............................................................................................111Automatic Rounding for Balance Sheets .......................................................................112
Chapter 4: Linking to Other Sources of Information .............................................. 115Creating Summary Reports Using Row Links .............................................................116
Natural Row Format .................................................................................................118DetlBSIS Row Format ..............................................................................................118SummryBS Row Format ..........................................................................................119Column Layout .........................................................................................................119Reporting Tree .........................................................................................................120
Establishing Links...........................................................................................................121Creating Row Formatting Links ...............................................................................122Linking Rows to a Summary Report .......................................................................123
Linking to External Worksheets .....................................................................................124Referencing External Worksheet Cells ...................................................................125Identifying Individual Worksheet Cells ....................................................................125Automatic Matching of Worksheet Columns to the Current Period..........................127Using a Combined Worksheet Link .........................................................................128Using a Separate Worksheet Link............................................................................130
Chapter 5: Creating Column Layouts ....................................................................... 137Opening the Column Layout Window ............................................................................138Column Layout Menu Functions.....................................................................................140
File Menu ................................................................................................................140Edit Menu ................................................................................................................141
Adding Column Headers ...............................................................................................143Creating Typical Headers ........................................................................................143Creating Dynamic (Conditional) Headers ................................................................146
Adding Column Detail ....................................................................................................147Specifying Column Types .......................................................................................148Defining General Ledger Columns ..........................................................................150Adding Calculation Formulas ..................................................................................155Adding Special Formatting Options .........................................................................157

iv
Contents
FRx Report Designer 6.7 User’s Guide
Adding Column Restrictions ....................................................................................164Selecting a Reporting Unit ......................................................................................165Formatting Multicurrency Reports ..........................................................................167Account Filters ........................................................................................................169Attribute Filters ........................................................................................................170Restricting Columns to Specific Dates ....................................................................171Justification .............................................................................................................172Adding the OLAP Description to the Column Layout ..............................................173
Customizing Transaction Detail Reports .......................................................................173Creating Multiple Period Transaction Detail Reports ..............................................174Creating Year-to-Date Transaction Detail Reports .................................................175Creating Debit/Credit Reports .................................................................................175
Creating Tabular Reports ..............................................................................................177
Chapter 6: Creating a Reporting Tree ...................................................................... 179Understanding Reporting Trees ...................................................................................181
Reporting Unit Structure ..........................................................................................181Multiple Reporting Trees .........................................................................................182Account Masks ........................................................................................................183Account Mask Structure and Segments ..................................................................183
Reporting Tree Window .................................................................................................187Graphical Reporting Tree ........................................................................................187Reporting Tree Worksheet ......................................................................................188
Reporting Tree Menus and Toolbar Icon........................................................................190Reporting Tree Menus .............................................................................................190Reporting Tree Toolbar Icon ...................................................................................196
Understanding Building Reporting Trees .......................................................................197Understanding Building Reporting Trees Automatically ..........................................197Understanding Building Reporting Trees Manually .................................................203
Building Reporting Trees Manually.................................................................................205Building a Reporting Tree with the Reporting Tree Worksheet ...............................205Building a Reporting Tree with the Reporting Units Dialog Box...............................206Defining Parent-Child Relationships .......................................................................211Verifying a Unit’s Parent Unit ...................................................................................212
Building Reporting Trees Automatically .......................................................................213Adding Text and E-mail Links to a Reporting Tree.........................................................216
Adding Text to the Reporting Units in a Tree ..........................................................216Adding E-mail Addresses to a Reporting Tree ........................................................217
Securing Reporting Tree Units .......................................................................................221
Chapter 7: Understanding the Catalog of Reports ................................................. 223Catalog of Reports Window ..........................................................................................224Catalog of Reports Menu Bar .........................................................................................225
File Menu .................................................................................................................225

v
Contents
FRx Report Designer 6.7 User’s Guide
Edit Menu ................................................................................................................226 Catalog Menu..........................................................................................................226 Window Menu .........................................................................................................227
Catalog of Reports Toolbar ............................................................................................229Catalog Identification ......................................................................................................230
Identifying a New Report..........................................................................................230Specifying Report Periods and Dates ......................................................................233
Tabs for Building and Formatting Reports ......................................................................236Building Blocks Tab .......................................................................................................237
Selecting Row Formats ............................................................................................237Selecting Column Layouts .......................................................................................239Selecting a Reporting Tree ......................................................................................240
Output Tab......................................................................................................................243Selecting Report Output Options .............................................................................244Printing Reports .......................................................................................................251E-mailing Reports ....................................................................................................254Publishing Reports to the Web ................................................................................255
Page Options Tab...........................................................................................................257Page Setup Tab .......................................................................................................257Headers / Footers Tab .............................................................................................258
Report Options Tab ........................................................................................................261Formatting Tab ........................................................................................................261Acct/Tran Detail Tab ................................................................................................267Tree Options Tab .....................................................................................................269Advanced Tab ..........................................................................................................270Currency Translation Tab.........................................................................................273
Reports ...........................................................................................................................274Creating a Report.....................................................................................................274Generating a Report.................................................................................................277Printing Catalog Information ....................................................................................279Chaining Your Reports ............................................................................................280Cloning Your Reports ..............................................................................................282Including Additional Text in a Report ......................................................................283
Scheduling Reports for Processing ................................................................................284
Chapter 8: Using Extensible Business Reporting Language (XBRL) ................... 285Extensible Business Reporting Language (XBRL) Overview .........................................286Including XBRL Elements in the Row Format ................................................................289
Creating a Link to the XBRL Taxonomy...................................................................289Adding XBRL Element Tags to the Row Format .....................................................290Updating Existing Row Formats for XBRL 2.0 ........................................................291
Including XBRL Elements in the Column Layout ...........................................................293Selecting XBRL Output Type in the Catalog of Reports .................................................295
Selecting XBRL Output Type from the Catalog of Reports .....................................296Selecting FRD Output Type For XBRL Reports.......................................................297

vi
Contents
FRx Report Designer 6.7 User’s Guide
XBRL Definitions ............................................................................................................298
Chapter 9: Using FRx Currency Translation ........................................................... 299FRx Currency Translation: Overview..............................................................................300Setting Up the FRx System for Currency Translation.....................................................302Designing Currency Translation Reports .......................................................................303
Activating DAX Currency Translation ......................................................................303Using Currency Translation Codes in a Row Format ..............................................303Using Currency Translation in the Column Layout ..................................................306Using Currency Rate Subtype ID in Column Layouts .............................................307Setting Currency Options in the Catalog of Reports ...............................................309
Appendix A: Answers to Common User Questions ................................................ 313Frequently Asked Questions (FAQs) ..............................................................................314
Incomplete Report Output ........................................................................................314Reports Using Reporting Tree with Overstated Numbers........................................315External Worksheet Data Not Displaying .................................................................316Changing Report Descriptions .................................................................................317Specific Headings for Specific Column Layouts.......................................................317Balance Sheet: Totalling Rounded Numbers ...........................................................317Restricting Income Statement Accounts in the Account Detail Report ....................318Out of Balance Message when Drilling into Transaction Detail ...............................318Restore a Deleted or Overwritten Row, Column, or Tree ........................................319
Error Messages ..............................................................................................................320Building Block User Error .........................................................................................320Disk or Network Error...............................................................................................320Specification Set Database Security does not Match Current FRxSys32 Security Setting ......................................................................................................322
FRx System Information .................................................................................................324Client Installation Types ...........................................................................................324Moving FRx to a New Location or New Server ........................................................325Permissions Required for FRx Users.......................................................................328Maintaining FRx Data Files and Preventing Corruption ...........................................329
Glossary....................................................................................................................... 333
Index............................................................................................................................. 343

viiFRx Report Designer 6.7 User’s Guide
Who Should Read this GuideThe purpose of this guide is to explain the functions, features, and capabilities of Microsoft® Business Solutions for Analytics–FRx®.
The guide includes:
General information about the logic and workings of FRx® Report Designer to draw financial data from your general ledger.
Step-by-step instructions for building reports using various Report Designer features.
Technical reference information that explains the purpose, function, and output result for every option in the product.
This guide is written for all users of Report Designer who create or run FRx financial reports.
How this Guide is OrganizedThis guide is organized into the following chapters:
Chapter 1, “Welcome to FRx Report Designer”
Chapter 2, “Creating Basic Reports with FRx Report Designer”
Chapter 3, “Creating Row Formats”
Chapter 4, “Linking to Other Sources of Information”
Chapter 5, “Creating Column Layouts”
Chapter 6, “Creating a Reporting Tree”
Chapter 7, “Understanding the Catalog of Reports”
Chapter 8, “Using Extensible Business Reporting Language (XBRL)”
Chapter 9, “Using FRx Currency Translation”
Preface

viii
Preface
FRx Report Designer 6.7 User’s Guide
What’s New in Report Designer 6.7This version of the software includes the following new features.
Product name and logo–We have introduced a new product name, logo and demonstration data that aligns the FRx product and FRx Software's ownership with one of the most recognizable brands in the industry- Microsoft Corporation. Through this association, existing customers and prospective buyers will know how we are evolving. While staying true to the trustworthy roots of our heritage, we are backed by the seasoned and insightful strength and vision shared by our parent company. And we will continue to reflect these ideals and live up to the standards set by our brand.
FRx® Report Manager–Report Manager is a powerful optional module that makes it easy to pull together FRx reports with the other information end-users need to do their work, all delivered in one, comprehensive report book. It automates the time consuming and manual process of producing report books containing many different types of documents and files. Report Manager helps users present information in a manner that is logical, organized and relevant. Finally, Report Manager allows users to create report books with information specialized to the needs of each individual user, then streamlines the printing and distribution of the complete presentation. Report Manager allows:
Multiple output types including FRx® DrillDown ViewerTM files, Microsoft Office documents and other reports produced from diverse reporting packages to be packaged together for posting to a network or Web site, or for delivery via email or print. Recipients to view all documents contained in a report book using an enhanced version of the DrillDown Viewer software. Headers, footers and consecutive page numbering throughout the entire book.Report generation locally or via the FRx® Report Server.
On-demand reference guides–Comprehensive User Guides in a bound format are now available on-demand as a helpful reference for common tasks and troubleshooting. The information has been reorganized into soft cover books, which include: FRx® Report Designer 6.7 User’s Guide, FRx® Report Designer 6.7 Administrator’s Guide, FRx® Report Server 6.7 User’s Guide, FRx® DrillDown Viewer™ and FRx® Report Launcher 6.7 User’s Guide, FRx® Report Manager 6.7 User’s Guide, FRx® WebPort 6.7 User and Administrator’s Guide, and FRx 6.7 Sample ReportsA useful document designed to help customers determine which User Guides to obtain is included with each product shipment. Additionally, all User Guides are included on the FRx 6.7 product CD.
Improved in FRx 6.7
Microsoft Excel graphing via FRx® instant!OLAP®software
instant!OLAP is now included in every edition, from FRx® Desktop through FRx® Enterprise. Additional functionality includes the ability for users to utilize the

ix
Preface
FRx Report Designer 6.7 User’s Guide
instant!OLAP software output format and export a report directly into a pivot table for automatic graphing in Excel.
XBRL
Remaining at the forefront of advances in Extensible Business Reporting Language (XBRL) technology, the support of the 1.0 taxonomy has been upgraded to the 2.0 standard. FRx Software understands the need for users to transfer complex, highly confidential corporate financial information to regulators, banks, investors and boards of directors using a trusted standard of financial communication. Because of this, we will continue to make advances in the XBRL compatibility of FRx, ensuring functional compliance as XBRL is further adopted by corporations and consumers of sensitive financial data.
FRx® Currency Translation
The Currency Translation module has been enhanced to allow for greater flexibility in the calculation of translation rates. There are now two ways to calculate monthly average rates. Additionally, annual average rates can be calculated, thereby streamlining the maintenance necessary for Column Layouts when creating FRx reports. Users can now translate individual layers that represent transactions while comparing the total amount in the historical rates table to the appropriate general ledger total. This ensures that all transactions have been accounted for when converting data at the appropriate historic rates. Finally, we have addressed several software modification requests to improve the Currency Translation product module as a whole.
FRx® WebPort
FRx® WebView has been consolidated into FRx WebPort to form a single product module that is available to all FRx users regardless of product edition or general ledger. Users can quickly publish Microsoft Word or Microsoft Excel documents with their FRx reports for easy access by others on a secure Intranet site.
Stability and Performance
Improvements to FRx 6.7 allow for faster report generation and quicker export of reports to the FRx DrillDown Viewer and printing options. Additionally, FRx has been upgraded to support Microsoft Access 2002 and changes have been made to the database access technology. These enhancements ensure a more stable environment. In addition, improvements to the way the general ledger index (G32 file) is built will reduce the likelihood of database corruption.
Available Product DocumentationThe following documentation is available for this product.
FRx® 6.7 Installation and Configuration Guide–This guide helps system installation personnel install FRx products through hands-on instructions.
FRx® Report Designer Getting Started Guide–This guide helps new users understand how to set up and configure the Report Designer to work with their company's specific general ledger data.

x
Preface
FRx Report Designer 6.7 User’s Guide
FRx® Report Designer 6.7 User’s Guide–This guide helps users apply the Report Designer components to design and generate reports.
FRx® Report Designer 6.7 Administrator’s Guide–This guide helps FRx system administrators who set up and administer Report Designer and/or maintain the currency translation rates database.
FRx® DrillDown Viewer™ and FRx® Report Launcher 6.7 User’s Guide–This guide helps users display, print, and export FRx financial reports to the FRx DrillDown Viewer, and launch reports from the FRx Report Launcher.
FRx® Report Server 6.7 User’s Guide–This guide helps users manage reports running on FRx Report Server and use the schedule to create, revise, and manage report schedules and exceptions.
FRx® Report Manager 6.7 User’s Guide–This guide helps users generate, display, print, subscribe to, export, save, and send reports that were created and saved using the Report Designer.
FRx® WebPort 6.7 User and Administrator’s Guide–This guide helps authorized users send FRx report output to the FRx WebPort repository and view reports via a Web browser. It also helps WebPort administrators manage report files and folders and control user access to WebPort.
FRx 6.7 Sample Reports–This guide provides users with examples of key reports using a demonstration database and Report Designer.
Other DocumentationSome components of the FRx product include online help that is installed with that component. The following online help volumes are available:
FRx® Report Designer Online Help
FRx® DrillDown ViewerTM Online Help
FRx® Report Launcher Online Help
FRx® Report Server Online Help
FRx® Report Manager Online Help
FRx® WebPort Online Help

xi
Preface
FRx Report Designer 6.7 User’s Guide
Conventions Used in this GuideThe following conventions are used through this guide.
How to Contact Us
Software LicensingFRx software is licensed to our customers with specific configurations and capabilities for each installation. The software license controls the number of licensed concurrent users, expiration dates, and version-specific features available under the terms of your license agreement. Contact your reseller for more information about adding features under your FRx Software license agreement.
Convention Description
Bold Used in procedures to indicate an on-screen item, such as a button name.
Italics Used to indicate emphasis.
Command Used to indicate a command, file name, or path.
Used to indicate information that supplements the main text.
Used to indicate information about how to use the application in a different way.
Used to indicate that a specific action or lack of a specific action could result in the loss of data.
Used to indicate that a specific action or lack of a specific action could result in physical harm to your computer or the server.
Mailing Address:FRx Software Corporation4700 South Syracuse Parkway, Suite 150 Denver, Colorado 80237
Software Support Telephone:1-800-FRx-SOLV(1-800-379-7658) Toll Free (+1) 303-741-8000 Main
Web Site: http://www.frxsoftware.com
Email:Documentation: [email protected]: [email protected] information: [email protected] suggestions: [email protected]
Note
Tip
Caution
Warning

1
Chapter 1
FRx Report Designer 6.7 User’s Guide
Welcome to FRx Report Designer
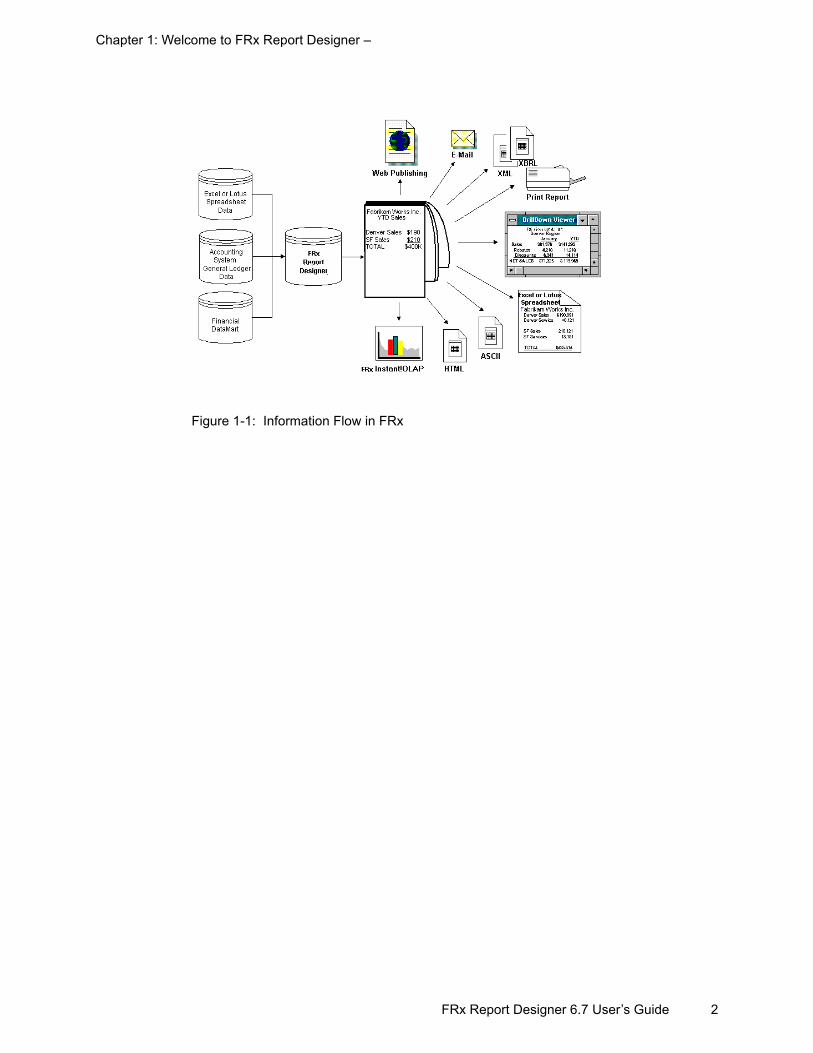
Welcome to Microsoft® Business Solutions for Analytics–FRx®.FRx breaks traditional reporting constraints, allowing you to be more creative and productive when building financial reports from your general ledger. FRx extends the power of your accounting system by simplifying and enhancing your financial and management reporting. FRx® Report Designer extracts information from your general ledger and optionally combines it with information from Lotus 1-2-3 or Microsoft® Excel spreadsheets. Then, it uses your customized report formats and your customized management reporting hierarchy to produce reports. These reports can be viewed, printed, sent as e-mail, or exported to a text or spreadsheet file.
Using This Guide . . . . . . . . . . . . . . . . . . . . . 3
System Requirements . . . . . . . . . . . . . . . . . 5
Installing and Starting Report Designer . . . . 5
Understanding Report Designer: An Overview6
Getting Around in Report Designer . . . . . . 11
Defining Available Commands on Report Designer Menus. . . . . . . . . . . . . . . . . . . . . 18
2FRx Report Designer 6.7 User’s Guide
Chapter 1: Welcome to FRx Report Designer –
Figure 1-1: Information Flow in FRx

3FRx Report Designer 6.7 User’s Guide
Chapter 1: Welcome to FRx Report Designer – Using This Guide
Using This Guide The following sections describe the conventions used throughout this User’s Guide.
Keyboard Commands
Mouse Commands
Typographical Conventions
Note and Warning Messages
Keyboard Commands This guide uses the keyboard commands type, enter, select, and press.
Type means to key in the data specified in the instruction.
Enter means to key in the data and then press the ENTER key.
Select means to mark menus and submenu options, highlight text, and choose items from drop-down list boxes.
Press means to press a key or combination of keys on the keyboard.If you need to press a combination of keys simultaneously, the keys are shown with a plus (+) between them. For example:
Ctrl+D means to press and hold the Ctrl key and then press D.
In some cases, you should press a key, release it, and then press another key. When this is the case, keys are shown with a comma (,) between them. For example:
Press Alt, F, N is the keyboard shortcut to open the File menu, and then choose New.
Sometimes, a key exists in more than one place on the keyboard. As a rule, it’s a good habit to use the keys to the left of the numeric keypad because you might want to turn on NumLock to enter numbers.
Mouse Commands The mouse commands used in this guide include click, double-click, right-click, and select.
Click means to click the left mouse button. In this User’s Guide, you click buttons, check boxes, and boxes within windows and dialog boxes.
Double-click means to quickly click the mouse button twice without moving the mouse.
Right-click means to click the right mouse button.
Select means to mark menus and submenu options, highlight text, and choose items from drop-down list boxes.
Typographical Conventions Within steps, bold type represents onscreen items (such as menus, boxes, and buttons) and information you type. For example:
In the Description box, type Tabular Balance Sheet.
Italic type indicates emphasis. For example:

4FRx Report Designer 6.7 User’s Guide
Chapter 1: Welcome to FRx Report Designer – Using This Guide
This code defines the base row for columns that calculate a percentage of the base row.
Note and Warning Messages Notes and warnings indicate additional information. They are indicated by the following formats:
Note: This note indicates additional information in procedural steps that may be important for you to know.
Warning: This warning advises you to take or avoid a specific action in procedural steps.
Note This note indicates additional information in overview sections that may be important for you to know.
Warning This warning advises you to take or avoid a specific action in overview sections.

5FRx Report Designer 6.7 User’s Guide
Chapter 1: Welcome to FRx Report Designer – System Requirements
System Requirements Specification requirements for installing and running FRx are outlined in the System Requirements and Installation Guidelines included on your Microsoft® Business Solutions for Analytics–FRx® CD-ROM.
Installing and Starting Report Designer The installation program displays several prompts used to configure Report Designer for your environment. For example, it displays a default directory and subdirectory where it installs FRx. See the System Requirements and Installation Guidelines on your Microsoft® Business Solutions for Analytics–FRx® CD-ROM for information about installing Report Designer.You can override the default values during installation. For more information, see your FRx® Report Designer Getting Started Guide.
The README.TXT File FRx is shipped with a Readme file that describes late-breaking information not described in this guide. You can open this text file from the FRx installation CD-ROM or, following installation, from the FRx 6.7 program folder.
Sample FRx Companies FRx includes data and sample reports for two fictional companies: Fabrikam Works, Inc. (FW) and Fabrikam Works Canada, Inc. (FWC). For more information on how to use this demonstration data, open the READSAMP.PDF file located on the FRx installation CD-ROM.
Starting Report Designer Report Designer must always be started from Windows.
To start Report Designer from Windows
1 Click Start, point to Programs, then point to FRx 6.7, and click the Report Designer icon to display the Select a Company to Work With dialog box.
2 Select one of the FRx sample companies, FW or FWC, and click OK.

6FRx Report Designer 6.7 User’s Guide
Chapter 1: Welcome to FRx Report Designer – Understanding Report Designer: An Overview
Understanding Report Designer: An Overview In Report Designer, you keep the design of your reports completely separate from your general ledger. As a result, you can easily change a report without modifying your accounting system’s general ledger.As you use Report Designer, you will see that every part of the system has been designed with flexibility in mind. There are many options available and many different ways of achieving the desired results. You can use the Report Designer default settings to quickly generate reports or you can customize your reports and change the settings throughout Report Designer.This section contains information and instructions on:
Building Blocks
User Security
Report Specification Sets
Presentation Quality Reports
FRx® DrillDown ViewerTM
Account Codes
Building Blocks The design philosophy behind Report Designer is simple: break everything down to the smallest possible component, and then mix and match components as needed.With this building block approach, you can easily combine text, amounts, calculations, and summarization in an unlimited fashion. This approach increases your ability to produce the reports you need. Equally important, it encourages creativity by making it easy to look at your operations in different ways.The individual building blocks of a report work something like a three-dimensional spreadsheet, but with more power.
Row formats. These are the descriptive lines (for example, salaries or sales) on a report.
Column layouts. These are the actual monetary amounts and calculations, plus reporting periods and book codes.

7FRx Report Designer 6.7 User’s Guide
Chapter 1: Welcome to FRx Report Designer – Understanding Report Designer: An Overview
Reporting trees. These are similar to an organizational chart. It contains individual reporting units that represent each box in the chart. These units can be either individual departments from the general ledger or higher-level units that summarize data from other reporting units.
The following sample report illustrates how the building blocks are combined to create a report.
Figure 1-2: Sample Report
Catalog of Reports. FRx reports are stored in the Catalog of Reports. Each catalog entry is made up of the row, column, and (optional) tree that define the report. Once these elements are entered, a report can be run.
In the Catalog of Reports, you also specify the type of report you want to print:
Financial reports
Account detail reports
Transaction detail reports
Rows were defined in the Row Format building block.
These columns were defined in the Column Layout building block.
This reporting unit was defined in the Reporting Tree building block.

8FRx Report Designer 6.7 User’s Guide
Chapter 1: Welcome to FRx Report Designer – Understanding Report Designer: An Overview
Any combination of these report typesYou can report on a summary, company-wide basis or on selected units from a reporting tree. The resulting report is customized in accordance with the row format and column layout you use.
User Security When the optional FRx security is activated, a system administrator can limit individual users and/or groups of users to specific items within FRx. The FRx security system works in addition to security in the underlying accounting system.
Report Specification Sets All FRx report specifications (row formats, column layouts, reporting trees, and catalogs) are stored in relational databases called specification sets. In client/server environments, it is helpful to store the report specification sets on the network so multiple users can access each company’s reports.
For more information see “Creating Specification Sets” in Chapter 2 of the FRx® Report Designer 6.7 Administrator’s Guide.
Presentation Quality Reports Using the powerful print controls and formatting in FRx, you can produce presentation quality reports. Using FRx’s built-in print controls and formatting, you can:
Use fonts, colors, shading, boxes, and lines in your reports
Format individual rows and columns independently
Format individual column headers, page headers, and footers
Reduce, enlarge, or automatically adjust your page size
Send reports via e-mail directly from the Report Designer or the DrillDown Viewer
Generate groups of reports using the FRx® Report Launcher without opening Report Designer
Publish reports to a Web server

9FRx Report Designer 6.7 User’s Guide
Chapter 1: Welcome to FRx Report Designer – Understanding Report Designer: An Overview
Figure 1-3: Tabular Balance Sheet
FRx® DrillDown ViewerTM With the standalone DrillDown Viewer, users in your company can look at FRx reports even if they do not have access to Report Designer. Using this program, users can select reporting units from the reporting tree and then view and print financial statements and underlying account and transaction detail reports.You can also use DrillDown Viewer to send reports to other users with e-mail, delete reports, print reports, and export reports to a spreadsheet file with formulas. For more information about the DrillDown Viewer, refer to your FRx® DrillDown Viewer™ and FRx® Report Launcher 6.7 User’s Guide.
Account Codes Although accounting systems typically treat general ledger codes as single indivisible units, Report Designer looks at account codes in a way that increases your reporting flexibility.
Fabrikam Works, Inc.Tabular Balance Sheet
For the Five Months Ending May 31, 2004
ASSETS
Cash - Checking $134,111.13Cash - Money Market 46,751.00
Total Cash 180,862.13
Accounts Receivable 166,164.00Allowance For Bad Debts (2,184.00)Intl Corp Receivable 271,213.00
Net Accounts Receivable 435,193.00
Total Inventories 779,026.00
Prepaid Assets 3,289.00
Current Assets 1,398,370.13
Leasehold Improvements 69,600.00Office Furniture And Fixtures 34,500.00Office Equipment 37,700.00Less Accumulated Depreciation (40,635.00)
Net Fixed Assets 101,165.00
Total Assets $1,499,535.13
LIABILITIES AND SHAREHOLDERS' EQUITY
Accounts Payable $84,253.00Accrued Liabilities 137,867.00
Total Current Liabilities 222,120.00
Leases Payable 10,100.00Notes Payable 142,794.00
Long-Term Liabilities 152,894.00
Total Liabilities 375,014.00
Capital Stock 50,000.00Additional Paid-In Capital 500,269.00Year-to Date Income 377,152.13Retained Earnings 197,100.00
Shareholders' Equity 1,124,521.13
Liabilities and Equity $1,499,535.13

10FRx Report Designer 6.7 User’s Guide
Chapter 1: Welcome to FRx Report Designer – Understanding Report Designer: An Overview
Most organizations have some type of structure that separates operations into different categories. A typical general ledger account code contains at least one account code segment that describes the type of account (for example, cash or sales). This segment of the general ledger code (sometimes referred to in accounting systems as the object code, main account, or primary account) is referred to as the natural account code segment in Report Designer. The remainder of the full general ledger account code typically defines the department, division, location, area, task, project, and other categories within the overall structure of the organization. In Report Designer, these segments of the general ledger code are called the responsibility account code segments.
.
Figure 1-4: General Ledger Account Code
Report Designer uses the concept of base year and base period rather than current year and current period. This allows you to design column layouts that are easily adapted to different reporting needs. If you used current period to print a report for the prior period (or any other period), you have to modify the column layout. By using the base concept, once you specify the base period in the column layout, all you need to do is tell Report Designer what base period to run the report for in the Catalog of Reports.The base period in the Catalog of Reports usually defaults to the current period. So when you design column layouts, think of base period and year as the current period and year. Then, when you start printing reports, you can generate the same report with different base periods or years.
Note This distinction between the account’s natural and responsibility segments is critical to the successful use of FRx. Typically, users define the natural segment in a row format and the responsibility segments in a reporting tree. These codes are combined in various ways when reports are printed. When Report Designer’s automatic build process creates row formats and reporting trees, by default it separates the responsibility and natural portions of the account code.
Cash Denver Corporate1100 1000 000
Natural Division Department
Full general ledger account code
Responsibility account code segment

11FRx Report Designer 6.7 User’s Guide
Chapter 1: Welcome to FRx Report Designer – Getting Around in Report Designer
Getting Around in Report Designer FRx is a Microsoft® Windows® application that takes full advantage of the Microsoft Windows 9x and Microsoft Windows XP environments. If you are not familiar with Windows menus, windows, buttons, multiple windows, and other Windows features, refer to your Windows documentation.This section contains information and instructions on:
The Report Designer Control Panel
The Toolbar
Basic Report Designer Techniques and Keyboard Commands
Record Control Boxes
The Report Designer Control PanelWhen you start the Report Designer and select a default company, its Control Panel appears on your screen.
Figure 1-5: Report Designer Control Panel
This is the main Report Designer window. The three building blocks (Row Formats, Column Layouts, and Reporting Trees) are at the top level. Below these building blocks is the Catalog of Reports, which combines elements from each of the other building blocks.From the main Report Designer window, you can access every Report Designer function. You can modify any report building block or the Catalog of Reports by using the mouse or arrow keys to select the appropriate portion of the Control Panel.
To select any Report Designer building block (rows, columns and reporting trees) or the Catalog of Reports, click its icon. For more information about rows, columns, and reporting trees, see Chapter 3, “Creating Row Formats”; Chapter 4, “Linking to Other Sources of Information”; and Chapter 6, “Creating a Reporting Tree”.
To access functions that relate to your Report Designer configuration and companies, use the commands on the Company menu. For more information on these functions,

12FRx Report Designer 6.7 User’s Guide
Chapter 1: Welcome to FRx Report Designer – Getting Around in Report Designer
see Chapter 2, Adding Company Information, in your FRx® Report Designer 6.7 Administrator’s Guide.
To access system administrator functions, including security setup and maintenance, use the Admin menu commands. For more information on these functions, see Chapter 1, Performing Administrative Duties, in your FRx® Report Designer 6.7 Administrator’s Guide.
To quickly get started setting up reports for your own company, see Chapter 2, “Creating Basic Reports with FRx Report Designer”.
The ToolbarEach main window displays a toolbar below its menu bar. The following toolbar buttons are common to all main windows. Toolbar buttons specific to certain windows are explained in their appropriate chapters.
Toolbar Button Description
Creates a new row format, column layout, catalog, or reporting tree. Or, on the File menu, click New.
Opens an existing row format, column layout, catalog, or reporting tree. Or, on the File menu, click Open.
Saves the current row format, column layout, reporting tree, or catalog record. Or, on the File menu, click Save.
Prints the current row format, column layout, catalog, or reporting tree. Or, on the File menu, click Print.
Cuts the selected text to the Windows clipboard. Or, on the Edit menu, click Cut.
Copies the selected text to the Windows clipboard. Or, on the Edit menu, click Copy.
Pastes the contents of the Windows clipboard to the cursor location. Or, on the Edit menu, click Paste.
Locks any Report Designer component (Row Format, Column Layout, Reporting Tree, or Catalog ID) against accidental changes.
Opens the Catalog of Reports building block. When you select this toolbar button, the Catalog of Reports window opens. When you close this window, you return to the Report Designer Control Panel.
Table 1-1: Toolbar Buttons

13FRx Report Designer 6.7 User’s Guide
Chapter 1: Welcome to FRx Report Designer – Getting Around in Report Designer
Basic Report Designer Techniques and Keyboard Commands You can use many the following keys and techniques throughout Report Designer.
Accessing Help From Within Report Designer
Using the Menus
Navigating Through the Report Designer Windows
Navigating Without a Mouse or Other Pointing Device
Editing a Box (F2)
Selecting Rows or Columns
Displaying a List of Available Entries (F3)
Using the Right Mouse Button
Accessing Help From Within Report DesignerPress F1 for help related to the current task.
Or, on the Help menu, click Contents.
Click the toolbar Help button.
Using the MenusTo display a menu
Select one of the menus with the mouse pointer and click.
Press the Alt key and the keyboard key that corresponds to its underlined letter. For example, to select the File menu, press Alt+F.
To select a command from the menu
Click on the command.
Press the keyboard key that corresponds to its underlined letter. For example, to select the New command from the File menu, press N.
To exit the menu without making a selection
Press Esc twice or click in the main window outside the menu.
Note Menus that are the same for all Report Designer windows are described in “Defining Available Commands on Report Designer Menus” on page 18. Menus used in specific Report Designer building blocks (Row Formats, Column Layouts, Reporting Trees or the Catalog of Reports), are described in the chapter for that building block.

14FRx Report Designer 6.7 User’s Guide
Chapter 1: Welcome to FRx Report Designer – Getting Around in Report Designer
Navigating Through the Report Designer WindowsTo open a building block without closing the current one, on the File menu, point to New, and click Column.
To close an open building block, on the File menu, click Close.
If you’re in a window, click Cancel to return to the main window. Or, to execute your selections, click OK.
To exit Report Designer, on the File menu, click Exit.
Navigating Without a Mouse or Other Pointing DeviceEvery window has a Control-menu box to the left of the title bar.
To access the Control-menu box for a window that has the focus (that is, a window from which you cannot access the main window), press and hold the Alt key, and then press the spacebar.
To access the Control-menu box for a child window (that is a window from which you can access the main window), activate the window by selecting the title bar, press and hold the Alt key, and then press the Hyphen (-) key.
Editing a Box (F2)You can use the F2 key to edit boxes in the Row Format, Column Layout, or Reporting Tree building blocks.
Press F2 to edit the contents of a box.
When you are editing, the system defaults to insert mode (if you type characters, they are inserted at the cursor position). To switch to typeover mode (typed characters replace existing characters), press the Insert key.
If you are editing a box (after pressing the F2 key), press Esc to restore the original box contents.
Selecting Rows or ColumnsYou can select an entire row or column in your building blocks by highlighting it.
To highlight a row with the keyboard, press and hold the Shift key while pressing the spacebar.
To highlight a row with your mouse, click the box to the left of the Row Code cell.
To highlight a column with the keyboard, press and hold the Ctrl key while pressing the spacebar.
To highlight a column with the mouse, click the box at the top of the column.
Note You can have up to four worksheets of each building block open at one time.

15FRx Report Designer 6.7 User’s Guide
Chapter 1: Welcome to FRx Report Designer – Getting Around in Report Designer
Displaying a List of Available Entries (F3)List boxes have a down arrow button on the right side. If you click this button, a list of available entries appears.
There are four ways to display a list of available options:
Click the down arrow button.
Double-click on a cell that contains a down arrow button.
Place your cursor in the cell and then press F3.
Place your cursor in the cell, then on the Edit menu, click Zoom.
Using the Right Mouse ButtonYou can right-click to open a shortcut edit menu from any of the Report Designer building blocks. The following menu appears when you right-click from a row format, column layout, or reporting tree cell.
Figure 1-6: Shortcut Edit Menu
You can edit the box using one of the following options.
Note On some list boxes, such as those in the Column Layout window, the down arrow button appears only when you select the cell (move the cursor to that cell).
Shortcut Menu Selection
Description and Steps
Cut Use the Cut command to remove information from a building block cell:
1 Highlight the information you want to cut.2 Right-click and select Cut.
Copy Use the Copy command to copy information from a building block cell:
1 Highlight the information you want to copy.2 Right-click and select Copy.
Table 1-2: Shortcut Edit Menu Selections

16FRx Report Designer 6.7 User’s Guide
Chapter 1: Welcome to FRx Report Designer – Getting Around in Report Designer
To find text
1 Right-click in the building block you want to search.
Paste Use the Paste command to paste information into a building block cell:
1 Click the box in which you want to paste.2 Right-click and select Paste.
Clear Use the Clear command to clear information from a building block cell:
1 Highlight the information that you want to clear.2 Right-click the cell, row, column, or unit.3 Select Clear.
Find Use the Find command to locate information contained in a building block cell:
Refer to the instructions To find text, later in this chapter.
Replace Use the Replace command to locate and replace information in a building block box:
Refer to the instructions To replace text, later in this chapter.
Delete Row, Column, Unit
Use the Delete command to delete an entire row, column, or reporting unit:
1 Select the row, column, or unit that you want to delete and then right-click.
2 From the menu, select Delete Row, Delete Column, or Delete Unit.
Insert Row, Column, Unit
Use the Insert command to insert an entire row, column, or reporting unit:
1 To insert a row or unit, place your cursor in the cell directly below where you want to insert the row or unit.
2 To insert a column, select the column directly before where you want to insert the new column.
3 Right-click and select Insert Row, Insert Column, or Insert Unit.
Report Designer inserts the row, column, or unit above the highlighted row, column, or unit.
Shortcut Menu Selection
Description and Steps
Table 1-2: Shortcut Edit Menu Selections (Continued)

17FRx Report Designer 6.7 User’s Guide
Chapter 1: Welcome to FRx Report Designer – Getting Around in Report Designer
2 Select Find to display the Find dialog box.
3 In the Find What box, type the text you are trying to locate.
4 Click Find Next.
5 To conduct a more specific search, select one or more options from the Search Options section of the dialog box.After locating the text, you can replace it with new text by clicking Replace.
To replace text
1 Right-click in the building block you want to search.
2 Select Replace to display the Replace dialog box.
3 In the Find what box, type the text you want to find.
4 In the Replace with box, enter the text you want to replace it with.
5 Click Replace to replace a single occurrence of the text or Replace All to replace all occurrences of the text.
Display-only BoxesDisplay-only boxes show information that may be useful to you in the function you’re performing. The information in these boxes is for viewing only.
Figure 1-7: Display-only Box
Use these options to modify your search.
This is an example of a display-only box. It displays a description of the selected row format.

18FRx Report Designer 6.7 User’s Guide
Chapter 1: Welcome to FRx Report Designer – Defining Available Commands on Report Designer Menus
Record Control BoxesSome windows in FRx contain record control boxes. A record control box looks like the following picture.
Figure 1-8: Record Control Box
Defining Available Commands on Report Designer Menus Each row format, column layout, reporting tree, and catalog window in Report Designer has a menu bar at the top of the window. Each menu system contains several menus. Some menu commands, such as those in the File menu, have many of the same commands for all Report Designer windows. Other menus are used in some Report Designer windows but not in others. For example, the Tree menu is only accessible from the Reporting Tree window.This section describes the menus and options that are standard on all the Report Designer main windows. Menus that appear only in specific windows and building block options (for example, the Row Formats window) are discussed in their respective chapters.
Record Control Description
Arrow Buttons Click the far right or left arrow buttons to move to the first or last alphabetically sorted record in the series (for example, the last catalog).
Click the inside arrow button to move to the previous or next record.
Find Click Find to display a selection dialog box that lists all related records in alphabetical order. As you begin to type a record name into the Search box, the cursor moves to the first record that begins with the letters you typed. You can also select a record by clicking its name on the list.
New Click New to enter a new record into Report Designer. In some cases, default values may be provided.
Clone Click Clone to clear the form’s primary (unique) keys and retain all other information. You can use this button to copy information from an existing record to a new record.
Save Click Save to save any modifications you’ve made to the current record.
Delete Click Delete to permanently delete the current record from Report Designer. You will be asked to confirm that you really want to delete the record.
Table 1-3: Record Control Box Selections

19FRx Report Designer 6.7 User’s Guide
Chapter 1: Welcome to FRx Report Designer – Defining Available Commands on Report Designer Menus
Use this table as a quick reference list for using the standard menus.
To Select this menu and command
Open a new row, column, or tree
On the File menu, click New.
Open an existing row, column, tree, or catalog ID
On the File menu, click Open.
Close an open window On the File menu, click Close.
Close all open windows
On the File menu, click Close All.
Save the current file On the File menu, click Save (or press Ctrl+S).
Save the current file with a new name
On the File menu, click Save As (or press Ctrl+A).
Change the printer setup
On the File menu, click Print Setup.
Repair your specification set or FRx system database
On the File menu, click Compact FRx Database.
Exit from Report Designer
On the File menu, click Exit.
View the company information
On the Company menu, click Information.
Change your default company
On the Company menu, click Select Default.
Edit the amount and date formatting
On the Company menu, click International Formats.
Edit specification sets On the Company menu, click Specification Sets.
Turn on or turn off the toolbar
On the Options menu, click Tool Bar.
Turn on or turn off the status bar
On the Options menu, click Status Bar.
Turn on or turn off the edit bar
On the Options menu, click Edit Bar.
Table 1-4: Report Designer Standard Menus

20FRx Report Designer 6.7 User’s Guide
Chapter 1: Welcome to FRx Report Designer – Defining Available Commands on Report Designer Menus
Display the Report Designer Control Panel
On the Window menu, click Control Panel (or press F6).
Display all open windows above and below one another
On the Window menu, click Tile Horizontal.
Display all open windows next to one another
On the Window menu, click Tile Vertical.
Display all open windows over one another
On the Window menu, click Cascade.
Get help on Report Designer
On the Help menu, click Contents.
Get help on a box in Report Designer
On the Help menu, click Context Sensitive.
Find out the Report Designer release number and available windows system resources
On the Help menu, click About.
To Select this menu and command
Table 1-4: Report Designer Standard Menus (Continued)

21
Chapter 2
FRx Report Designer 6.7 User’s Guide
Creating Basic Reports with FRxReport Designer
This chapter describes how to create a basic report in the FRx® Report Designer. In this chapter, you learn step-by-step how to build, save, and view a report. To get up to speed quickly, read this chapter before using Report Designer. For examples of many specific types of reports, see FRx® 6.7 Sample Reports.Although there are many features and options available in Report Designer, you do not need to understand all of them in order to produce excellent reports. Many users can significantly improve their reporting capabilities using just the basic features that are described in this chapter.
As you become more familiar with Microsoft® Business Solutions for Analytics–FRx®, you can take advantage of some of its more advanced features. At this point, refer to the remaining chapters in this guide for more detailed explanations of all the FRx features.The material that follows is much easier to understand when you display Report Designer on your screen. So before you continue, make sure that FRx is installed and ready to go.
Creating a Company . . . . . . . . . . . . . . . 22
Creating a Sample Report . . . . . . . . . . . 25
Building a Row Format from the Chart of Accounts . . . . . . . . . . . . . . . . . . . . . . . . 26
Modifying a Row Format . . . . . . . . . . . . 28
Saving Your Row Format File . . . . . . . . 42
Creating a Column Layout . . . . . . . . . . . 43
Working with Reporting Trees . . . . . . . . 46
Creating a New Catalog ID . . . . . . . . . . 49
Generating and Viewing a Report . . . . . 53
Completing Your Setup . . . . . . . . . . . . . 55

22FRx Report Designer 6.7 User’s Guide
Chapter 2: Creating Basic Reports with FRx Report Designer – Creating a Company
Creating a Company When you first begin to use FRx, you must supply Report Designer with information that is specific to your individual company or companies.
To create a company
1 Start Report Designer to display the FRx Control Panel.
2 On the Company menu, click Information to display the Company Information dialog box.
The Company Information dialog box displays showing the first company information record.
3 Click the New icon to clear the boxes in the Company Information dialog box.
4 In the FRx company code box, type a unique code that describes this company and corresponds with your general ledger name.
Caution: FRx does not recognize the following symbols as valid company code characters: ‘ ” | / \ : ? * < >.
23FRx Report Designer 6.7 User’s Guide
Chapter 2: Creating Basic Reports with FRx Report Designer – Creating a Company
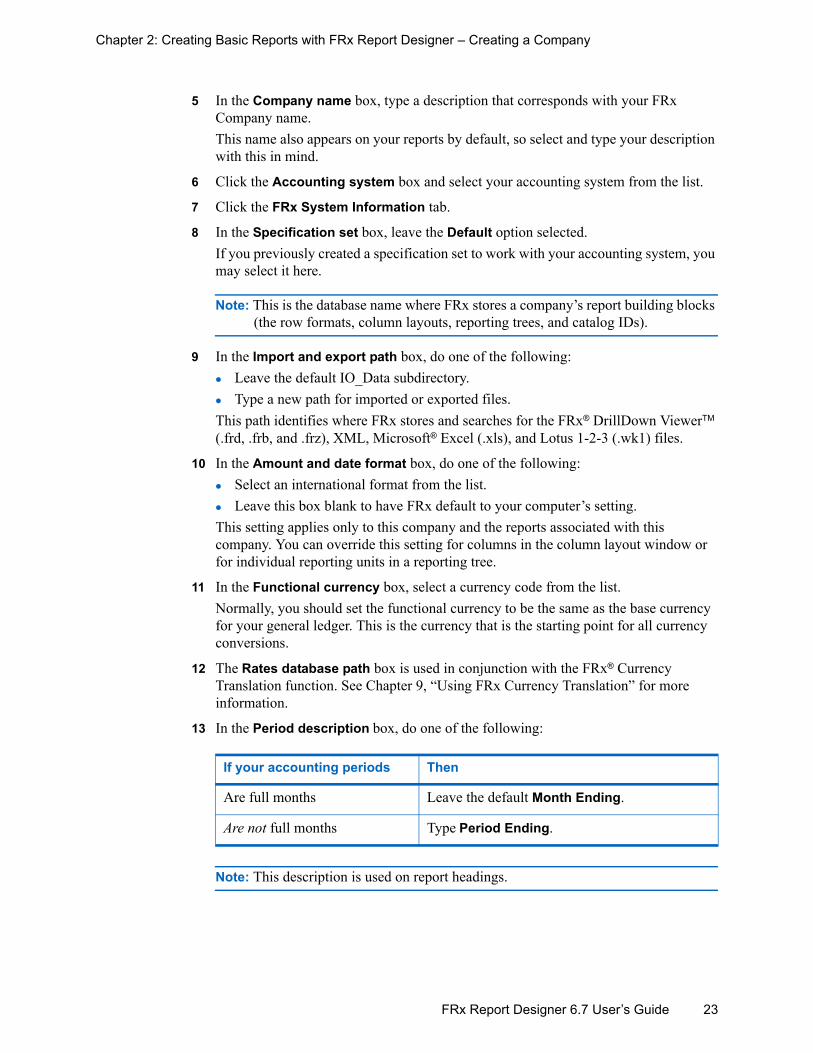
5 In the Company name box, type a description that corresponds with your FRx Company name. This name also appears on your reports by default, so select and type your description with this in mind.
6 Click the Accounting system box and select your accounting system from the list.
7 Click the FRx System Information tab.
8 In the Specification set box, leave the Default option selected. If you previously created a specification set to work with your accounting system, you may select it here.
Note: This is the database name where FRx stores a company’s report building blocks (the row formats, column layouts, reporting trees, and catalog IDs).
9 In the Import and export path box, do one of the following:Leave the default IO_Data subdirectory.Type a new path for imported or exported files.
This path identifies where FRx stores and searches for the FRx® DrillDown ViewerTM (.frd, .frb, and .frz), XML, Microsoft® Excel (.xls), and Lotus 1-2-3 (.wk1) files.
10 In the Amount and date format box, do one of the following:Select an international format from the list.Leave this box blank to have FRx default to your computer’s setting.
This setting applies only to this company and the reports associated with this company. You can override this setting for columns in the column layout window or for individual reporting units in a reporting tree.
11 In the Functional currency box, select a currency code from the list. Normally, you should set the functional currency to be the same as the base currency for your general ledger. This is the currency that is the starting point for all currency conversions.
12 The Rates database path box is used in conjunction with the FRx® Currency Translation function. See Chapter 9, “Using FRx Currency Translation” for more information.
13 In the Period description box, do one of the following:
Note: This description is used on report headings.
If your accounting periods Then
Are full months Leave the default Month Ending.
Are not full months Type Period Ending.

24FRx Report Designer 6.7 User’s Guide
Chapter 2: Creating Basic Reports with FRx Report Designer – Creating a Company
14 In the Plural Description box, do one of the following:
The text that you type in this box is used in your report headings. For example, if you type Months Ending in this box, the heading for a report generated for March 2004 will read For the Months Ending March 31, 2004.
15 Click the System Specific Information tab.
16 Refer to the FRx® Report Designer Getting Started Guide shipped with FRx to complete this tab.
If your accounting periods Then
Are full months Leave the default Months Ending.
Are not full months Type Periods Ending.

25FRx Report Designer 6.7 User’s Guide
Chapter 2: Creating Basic Reports with FRx Report Designer – Creating a Sample Report
Creating a Sample Report The following pages topics illustrate how to create the sample income statement shown in Figure 2-1. This report is based on the Fabrikam Works sample data. Use the sample data to follow the steps and create the sample report yourself. Or, you can modify the instructions to use your own company, chart of accounts, and corporate structure.
Figure 2-1: Income Statement

26FRx Report Designer 6.7 User’s Guide
Chapter 2: Creating Basic Reports with FRx Report Designer – Building a Row Format from the Chart of
Building a Row Format from the Chart of Accounts FRx is designed to be flexible and easy to use. One way it accomplishes this goal is to provide you with familiar interface features that you may already be using in Windows-based spreadsheet programs, such as Microsoft Excel.The flexibility of Report Designer makes each row format useful in many different situations. Keep in mind that if you plan to use the same format for more than one department, you do not need to repeat this procedure for each department.In this section, you learn how to build a new row format by automatically pulling data from the FabrikamWorks, Inc. sample database. After you build this row format, the row format contains row codes that identify each row, row description, general ledger code, and other information extracted from the FabrikamWorks chart of accounts.
To build a row format
1 From the FRx Control Panel, on the Company menu, click Select Default to display the Select Default Company dialog box.
2 In the Select Default Company dialog box, select FW.
3 Click OK to return to the FRx Control Panel.
4 On the File menu, point to New, and then click Row.
Note: The row format name at the top of the window is Untitled 1, which means you are working with a new, unsaved file.
5 On the Edit menu, click Add Rows from Chart of Accounts to display the Add Rows From Chart of Accounts dialog box.
For information about using the natural account code segment, see “Account Codes” on page 9 in Chapter 1.

27FRx Report Designer 6.7 User’s Guide
Chapter 2: Creating Basic Reports with FRx Report Designer – Building a Row Format from the Chart of
6 Then do the following:In the first Account Range Start box, type 4100.In the first Account Range End box, type 5500.
Note: When you type a segment, Report Designer pulls only the unique codes for that segment into the row format. For example, the natural segment 4100 can be included in hundreds of general ledger accounts, but appears only one time in the row format.
7 The Starting row code box automatically defaults to row 100.This default displays Row 100 as the first row when you open the Row Format window.
8 The Increment each row by box automatically defaults to 30.This default increments each row code in the Row Format window by 30. For example, the first row is numbered 100, the second row is numbered 130, and so on.
9 Click OK to display the accounts 4100 to 5500 in the Row Format window.
Tip: Do not try to create a format that contains all of the general ledger account and subaccount combinations in your company. Report Designer works with many small row formats and then uses the reporting tree and other techniques to run reports for multiple departments. If your selection results in more than a few hundred report rows, break the format down into smaller sections of the report.

28FRx Report Designer 6.7 User’s Guide
Chapter 2: Creating Basic Reports with FRx Report Designer – Modifying a Row Format
Modifying a Row Format This section describes the steps to format report rows for a sample income statement including:
Revenue Rows
Operating Expenses Rows
Income Rows
Revenue Rows The Row Codes 25-259 used below in Figure 2-2 represent formatted rows for a sample income statement. The revenue rows in this sample income statement include Revenue description, Sales, Net Sales, Cost of Goods Sold (COGS), Gross Margin, and rows to create a separation from expenses.
Figure 2-2: Accounts in Row Formats Window, Row Codes 25–259
Adding a Revenue DescriptionYou can modify the sample row format you created in “Building a Row Format from the Chart of Accounts” on page 26 to include additional rows, and then designate the rows as Revenue using the DES format code. You can add Revenue report rows in the row format window, with rows displayed. The revenue Row Codes 25-75 in Figure 2-2 are based on the following instructions.
Note The row codes that you create in the sample report could be different than those shown in Figure 2-2.
Revenue
Sales
Net Sales
COGS
Separate Revenue from Expense
Gross Margin

29FRx Report Designer 6.7 User’s Guide
Chapter 2: Creating Basic Reports with FRx Report Designer – Modifying a Row Format
To add revenue description report rows
1 Look at the top of the sample row format (Row Code 100) you created in the previous section.
2 From row 100, select three rows.
3 On the Edit menu, click Insert Row to add three new rows.
4 Do the following:
You have now added a Revenue heading and spacing around your heading using the DES (Description) format code.
Modifying Sales Report RowsYou can make changes to column values, change row codes, and add or delete rows. The Sales Row Codes 100-199 in Figure 2-2 on page 28 were modified using the following instructions.
In Do this
The first new row 1 Click the Fmt Code column, select DES from the list.
2 Click OK to return to the Row Format window.
The second new row Click the Description column, and in the edit bar, type Revenue.
The third new row 1 Click the Fmt Code column and select DES from the list.
2 Click OK to return to the Row Format window.

30FRx Report Designer 6.7 User’s Guide
Chapter 2: Creating Basic Reports with FRx Report Designer – Modifying a Row Format
To modify sales report rows
1 Go to the Sales row in your sample row format.
In our example, this row is Row Code 100.
2 Click the Link to General Ledger column.
3 Then, in the edit bar, change 4100 to 410?–(4109).
Note: In row 100, a C appears in the Norm Bal column. This reverses the sign of the normal balance credit account and makes it appear as a positive amount on the report.
4 Select the Sales (Elimination) row.
5 On the Edit menu, click Delete Row. This removes the elimination row from the report.
6 Starting with the COGS row, select three rows.
7 On the Edit menu, click Insert Row to add three new rows.
8 In the row following the Sales Discounts row, click the Fmt Code column and select --- Fmt Code from the list. This places an underline beneath the Sales Discounts row.
9 Review your formatted Sales row.
Adding a Net Sales Row that Includes a Formula You can modify a row to include net sales by changing the format code to TOT (total) and adding a formula to calculate net sales. The Net Sales Row Code 206 in Figure 2-2 on page 28 was added using the following instructions.

31FRx Report Designer 6.7 User’s Guide
Chapter 2: Creating Basic Reports with FRx Report Designer – Modifying a Row Format
To add a net sales row that includes a formula
1 Go to the row following the underline format you created for Sales Discounts.
In our sample row format, this is Row Code 206.
2 Click the Fmt Code column and select TOT from the list. Report Designer calculates a total when you select this code.
3 Click the Related Rates/Rows/Unit column and type the row codes for the following formula:
<Sales row code>- (minus) <Sales Returns row code>- (minus) <Sales Discount row code>.
In our sample row format, the net sales formula is 100-160-190.
4 Review your formatted Net Sales row.
Modifying COGS Report RowsYou can apply the formatting features you used in the previous sections to modify the COGS report rows. The COGS Report Codes 213-231 in Figure 2-2 on page 28 were modified using the following instructions.

32FRx Report Designer 6.7 User’s Guide
Chapter 2: Creating Basic Reports with FRx Report Designer – Modifying a Row Format
To modify COGS report rows
1 Go to the row following the Net Sales row.
In our example, this is Row Code 213.
2 Click in the Fmt Code column and select DES from the list.
3 In the COGS row, click the Link to General Ledger column, and in the edit bar, change 4500 to 450? -(4509). The wildcard (?) tells Report Designer to include all natural accounts from 4500 to 4509.
4 Select the COGS (Elimination) row.
5 On the Edit menu, click Delete Row.
6 Starting with the Salary Expense row, select seven rows.
7 On the Edit menu, click Insert Row to add seven new rows.
8 In the row following COGS, select the -- Fmt Code.
9 Review your formatted COGS rows.
Adding a Gross Margin Row that Includes a FormulaYou can include a formula in the Related Rates/Rows/Unit column that calculates the gross margin by adding the Net Sales row and the COGS row together. The Gross Margin Row Code 238 in Figure 2-2 on page 28 was added based on the following instructions.

33FRx Report Designer 6.7 User’s Guide
Chapter 2: Creating Basic Reports with FRx Report Designer – Modifying a Row Format
To add a gross margin row that includes a formula
1 Go to the row following the underline format row for COGS.
In our example, this is Row Code 238.
2 Click the Description column, and in the edit bar, type Gross Margin.
3 Click the Fmt Code column and select TOT from the list.
4 In the Related Rates/Rows/Unit column, type the row codes for the following formula:
<Net Sales row code>- (minus) <COGS row code>.
In our sample row format, the gross margin row formula is 206-220.
5 In the row following the Gross Margin row, click the Fmt Code column and select --- Fmt Code from the list. This inserts an underline under the previous row.
6 Review your formatted Gross Margin rows.
Separating Revenue Rows from Operating Expenses RowsYou can separate the Revenue portion of the sample income statement from operating expenses using row formatting options. The Separate Revenue from Expense Row Codes 252 to 259 in Figure 2-2 on page 28 are based on the following instructions.

34FRx Report Designer 6.7 User’s Guide
Chapter 2: Creating Basic Reports with FRx Report Designer – Modifying a Row Format
To separate revenue rows from operating expenses rows
1 Go to the row following the underline format row for Gross Margin.
In our example, this is Row Code 252.
2 Click the Fmt Code column and select DES from the list.
3 In the next row, repeat step 2.
4 Review your formatting to separate revenue from operating expense rows.

35FRx Report Designer 6.7 User’s Guide
Chapter 2: Creating Basic Reports with FRx Report Designer – Modifying a Row Format
Operating Expenses RowsNow that the revenue portion of your income statement is formatted, you are ready to modify the Operating Expenses rows in your sample row format. Row Codes 226-565, shown below in Figure 2-3, represented formatted expense rows.
Figure 2-3: Accounts in Row Formats Window, Row Codes 266–565.
Adding Operating Expenses RowAs with Revenue you can modify the sample row format to designate a row as Operating Expenses using the DES format code. The Operating Expenses Row Codes 266 and 273 in Figure 2-3 are based on the following instructions.
To add Operating Expenses row
1 Go to the row following the revenue separating rows.
In our example, this is Row Code 266.
2 Click the Description column.
3 In the edit bar, type Operating Expenses.
4 Click the Fmt Code column and select DES from the list.
Note The row codes that you create in the sample report could be different than those shown in this example.
Operating Expenses
Expenses
Total Operating Expenses

36FRx Report Designer 6.7 User’s Guide
Chapter 2: Creating Basic Reports with FRx Report Designer – Modifying a Row Format
5 Review your formatted Operating Expenses row.
Modifying the Expenses Report RowsYou can accept expense rows as they are or apply modifications with features that you used in the previous sections. The Expenses Row Codes 280 to 555 in Figure 2-3 on page 35 were modified based on the following instructions.To modify the expenses report rows
1 Go to the expense rows in your sample row format.
2 Leave the following rows as they are: Salary Expense, Officers Comp, Depreciation Expense, Office Expense, Supplies Expense - Service, Maintenance Expense, Rent Expense, Travel Expense, and Advertising Expense.
3 In the Commissions Expense row, click the Link to General Ledger column.
4 Then, in the edit bar, change 5400 to 54?? to include all natural accounts beginning with 54 into this report row.
5 Starting with the Income Tax Expense row, select five rows.
6 On the Edit menu, click Insert Row.
7 In the next row below Commissions Expense, click the --- Fmt Code column and select --- Fmt Code from the list.

37FRx Report Designer 6.7 User’s Guide
Chapter 2: Creating Basic Reports with FRx Report Designer – Modifying a Row Format
8 Review your formatted expense rows.
Adding a Total Operating Expenses Row using a FormulaYou can include a formula in the Related Rates/Rows/Unit column that calculates the total operating expenses. The Total Operating Exp Row Code 560 shown in Figure 2-3 on page 35 is based on the following instructions.
To add a Total Operating Expenses row using a formula
1 Go to the row following the underline format row for Commissions Expense.
In our example, this is Row Code 560.
2 Click the Description column.
3 Then, in the edit bar, type Total Operating Expenses.
4 Click the Fmt Code column, and select TOT from the list.
5 Click the Related Rates/Rows/Unit column
6 In the edit bar, use the formula row code range: <Salary Expense row code> TO <Commissions Expense row code>. In our example row format, the total operating expense formula is 280 TO 550.
7 In the next row, click the Fmt Code column, and select --- Fmt Code from the list.This places an underline beneath the Total Operating Expenses row in your report.
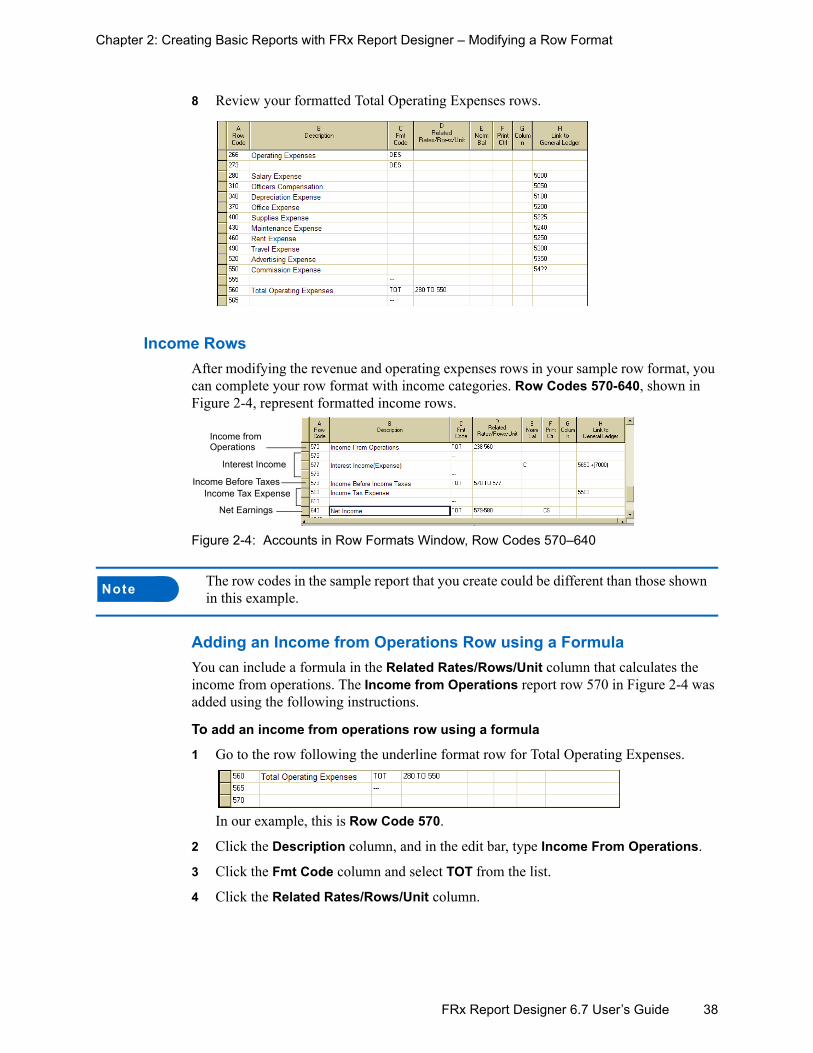
38FRx Report Designer 6.7 User’s Guide
Chapter 2: Creating Basic Reports with FRx Report Designer – Modifying a Row Format
8 Review your formatted Total Operating Expenses rows.
Income Rows After modifying the revenue and operating expenses rows in your sample row format, you can complete your row format with income categories. Row Codes 570-640, shown in Figure 2-4, represent formatted income rows.
Figure 2-4: Accounts in Row Formats Window, Row Codes 570–640
Adding an Income from Operations Row using a FormulaYou can include a formula in the Related Rates/Rows/Unit column that calculates the income from operations. The Income from Operations report row 570 in Figure 2-4 was added using the following instructions.
To add an income from operations row using a formula
1 Go to the row following the underline format row for Total Operating Expenses.
In our example, this is Row Code 570.
2 Click the Description column, and in the edit bar, type Income From Operations.
3 Click the Fmt Code column and select TOT from the list.
4 Click the Related Rates/Rows/Unit column.
Note The row codes in the sample report that you create could be different than those shown in this example.
Income Before Taxes
Income fromOperations
Interest Income
Income Tax Expense
Net Earnings

39FRx Report Designer 6.7 User’s Guide
Chapter 2: Creating Basic Reports with FRx Report Designer – Modifying a Row Format
5 Then, in the edit bar, use the formula <Gross Margin row code>-(minus)<Total Operating Expenses row code> to calculate income from operations.In our example, row format, the formula is 238-560.
6 In the row following the Income From Operations row, click the Fmt Code column and select --- Fmt Code from the list.This places an underline beneath the Income From Operations row.
7 Review your formatted Income From Operations rows.
Adding Interest Income RowsYou can insert and modify income rows by applying formatting features you have used in the above sections. The Interest Income Row Codes 575 to 578 in Figure 2-4 are based on the following instructions.
To add interest income rows
1 Go to the Income Tax Expense row.
In our example, this is Row Code 580.
2 Starting with this Income Tax Expense row, select three rows.
3 On the Edit menu, click Insert Row to insert three new rows.
4 In the first inserted row, click the Description column, and in the edit bar, type Interest Income (Expense).
5 Click the Norm Bal column and select C from the list.
6 Click In the Link to General Ledger column, and in the edit bar, type 5650+7000.
7 In the next row, click the Fmt Code column and select --- Fmt Code from the list.This places an underline beneath the Interest Income (Expense) row.
8 Review your formatted Interest Income (Expense) rows.
Adding an Income Before Income Taxes Row using a FormulaYou can include a formula in the Related Rates/Rows/Unit column that calculates the income before income taxes. The Income Before Income Taxes Row Code 579 in Figure 2-4 on page 38 is based on the following instructions.
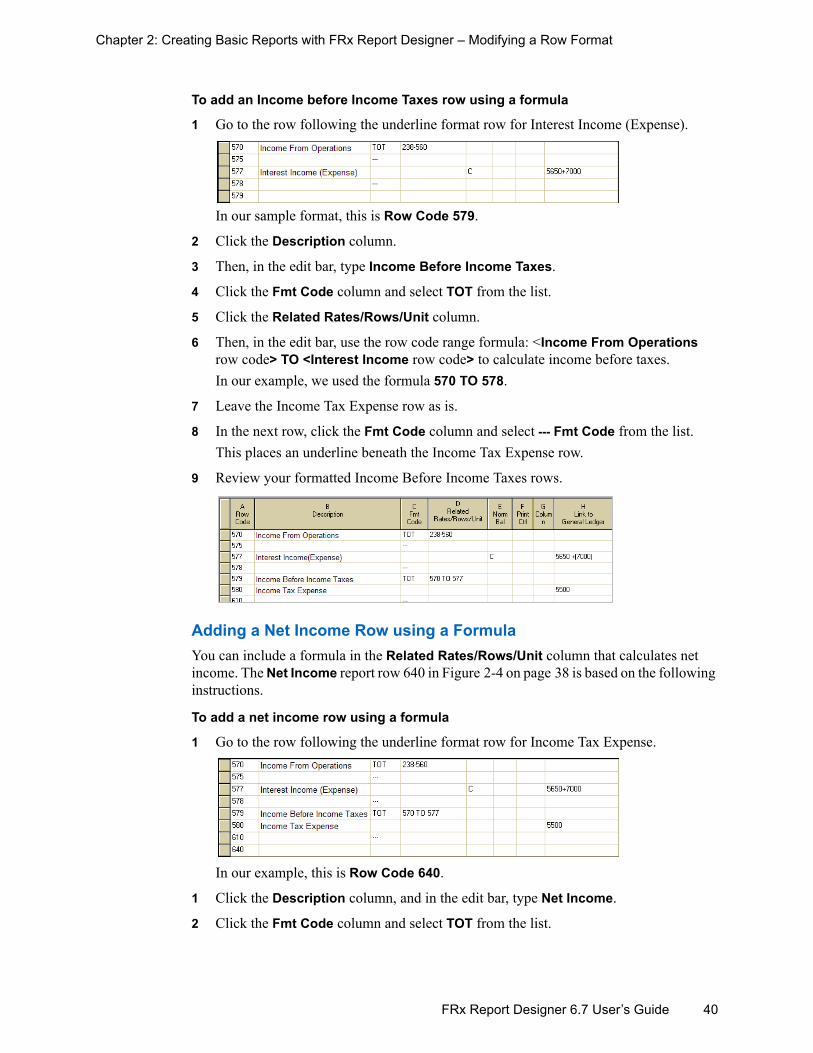
40FRx Report Designer 6.7 User’s Guide
Chapter 2: Creating Basic Reports with FRx Report Designer – Modifying a Row Format
To add an Income before Income Taxes row using a formula
1 Go to the row following the underline format row for Interest Income (Expense).
In our sample format, this is Row Code 579.
2 Click the Description column.
3 Then, in the edit bar, type Income Before Income Taxes.
4 Click the Fmt Code column and select TOT from the list.
5 Click the Related Rates/Rows/Unit column.
6 Then, in the edit bar, use the row code range formula: <Income From Operations row code> TO <Interest Income row code> to calculate income before taxes. In our example, we used the formula 570 TO 578.
7 Leave the Income Tax Expense row as is.
8 In the next row, click the Fmt Code column and select --- Fmt Code from the list.This places an underline beneath the Income Tax Expense row.
9 Review your formatted Income Before Income Taxes rows.
Adding a Net Income Row using a FormulaYou can include a formula in the Related Rates/Rows/Unit column that calculates net income. The Net Income report row 640 in Figure 2-4 on page 38 is based on the following instructions.
To add a net income row using a formula
1 Go to the row following the underline format row for Income Tax Expense.
In our example, this is Row Code 640.
1 Click the Description column, and in the edit bar, type Net Income.
2 Click the Fmt Code column and select TOT from the list.

41FRx Report Designer 6.7 User’s Guide
Chapter 2: Creating Basic Reports with FRx Report Designer – Modifying a Row Format
3 Click the Related Rates/Rows/Unit column.
4 In the edit bar, type the following formula: <Income Before Income Taxes row code>- (minus) <Income Tax Expense row code>. In our example row format, we used the formula 580-610.
5 Click the Print Ctrl column, and in the edit bar, type CS to include a currency symbol for this row.
6 Review your formatted Net Income row.

42FRx Report Designer 6.7 User’s Guide
Chapter 2: Creating Basic Reports with FRx Report Designer – Saving Your Row Format File
Saving Your Row Format File After you have built and modified a new row format, you can save the file to use as your sample report. You can now use this same format for more than one department with Report Designer. The flexibility of Report Designer uses each row format for more than one situation. Report Designer also uses the reporting tree and other techniques to run reports for multiple departments. See “To view an existing tree” on page 46.To save your Row Format file
1 Review your completed row format for the sample income statement.
2 On the File menu, click Save to display the Row Format dialog box.
3 In the Row Format dialog box do the following:In the Name box, type a unique name for the row format.In the Description box, type a description for the row format.

43FRx Report Designer 6.7 User’s Guide
Chapter 2: Creating Basic Reports with FRx Report Designer – Creating a Column Layout
4 Click OK to save the file and return to the Row Format window.
Creating a Column Layout You can define the layout of your report columns. The information in a column layout is combined with the information in a row format (and any reporting tree information), and is stored in the Catalog of Reports.
To create a column layout
1 On the Report Designer Control Panel window, click Column Layouts to display the Open Column dialog box.
2 Click New to display a blank Column Layout window.
3 In the first Column Headers row, in column B, double-click to display the Header Options dialog box.
4 Click Insert Code to display the Select Column Heading dialog box.
5 Select @Month.
6 Click OK to accept and return to the Headers Options dialog box.

44FRx Report Designer 6.7 User’s Guide
Chapter 2: Creating Basic Reports with FRx Report Designer – Creating a Column Layout
7 In the Headers Options dialog box, click OK to return to the Column Layout window.
8 In the Column Headers first row, in column C, type YTD.
9 In the Column Detail Type row, double-click column A to display the Zoom (Select the Type of Column) box.
10 Select DESC from the list and click OK to return to the Column Layout window.This places your row format descriptions in this column.
11 In the Column Detail Column Width row, double-click column A, and in the edit bar, type 40. This makes the first column 40 characters wide.
12 In the Column Detail TYPE row, double-click column B to display the Zoom (Select the Type of Column) box.

45FRx Report Designer 6.7 User’s Guide
Chapter 2: Creating Basic Reports with FRx Report Designer – Creating a Column Layout
13 Select GL from the list, and click OK to return to the Column Layout window.Report Designer inserts the following default values:
Actual or Budget cell: ACTUALFiscal Year cell: BASEPeriod Code cell: BASECurrent Per/YTD cell: CUR
14 In the Column Detail TYPE row, double-click column C to display the the Zoom (Select the Type of Column) box.
15 Select GL from the list, and click OK to return to the Column Layout window.
16 In the Column Detail Current Per/YTD row, double-click column C to display the Zoom (Select the Amount to Use) box.
Note: Multiple book codes or YTD codes are not supported at the transaction level in Report Designer.
17 Select YTD and click OK to return to the Column Layout window.
18 On the File menu, click Save to display the Column Layout dialog box.
19 In the Column Layout dialog box do the following:In the Name box, type a unique name for the new column layout.In the Description box, type a description for the column layout.
20 Click OK to save the file and return to the Column Layout window.

46FRx Report Designer 6.7 User’s Guide
Chapter 2: Creating Basic Reports with FRx Report Designer – Working with Reporting Trees
Working with Reporting Trees The reporting tree is a visual representation of departments, branch offices, and profit centers within your company. You can automatically build a reporting tree from information in your chart of accounts. For additional information on reporting trees, including how to add additional text or e-mail addresses, see Chapter 6, “Creating a Reporting Tree”.
This section contains information and instructions on:
Viewing an Existing Tree
Creating a New Reporting Tree
Viewing an Existing Tree To view an existing tree
1 On the FRx Control Panel, click Reporting Trees to display the Open Tree dialog box.
2 Select any sample reporting tree.
3 Click OK to display the reporting tree in the Reporting Tree window.
The tree structure displays graphically to the left of the window with the worksheet to the right. This design makes the reporting tree hierarchy easy to see while working on the reporting tree detail.
Note Although the reporting tree offers a great deal of power and flexibility, you can also create a report without one.

47FRx Report Designer 6.7 User’s Guide
Chapter 2: Creating Basic Reports with FRx Report Designer – Working with Reporting Trees
4 Repeat step 2 for other reporting trees to familiarize yourself with the manner in which trees display in Report Designer.
5 When you are finished reviewing the tree, on the File menu, click Close.
Creating a New Reporting Tree Now that you have seen a sample reporting tree, you can create a new reporting tree based on the Fabrikam Works, Inc. sample database.
To create a new reporting tree
1 From the FRx Control Panel window, on the File menu, point to New, and then click Tree to display a blank Reporting Tree window.
2 On the Edit menu, click Add Reporting Units from Chart of Accts to display the Add Reporting Units from Chart of Accounts dialog box.
Tip: You can use the Add Reporting Units from Chart of Accounts dialog box to define the account segments that you want FRx to include from your chart of accounts. Each account segment is presented in an edit box. By default, the natural segment contains hook characters (&).
3 In the Add Reporting Units from Chart of Accounts dialog box, do the following:
Under Do
Segment Ranges, in the first row
1 In the From Acct box, type 1100.2 In the To Acct edit box, type 2200.
Segment Ranges, in the second row
1 In the From Acct edit box, type 0012 In the To Acct edit box, type 004.
The account segment uses hooks for its Natural Segment.
Edit Boxes

48FRx Report Designer 6.7 User’s Guide
Chapter 2: Creating Basic Reports with FRx Report Designer – Working with Reporting Trees
4 Click OK to build a new reporting tree from the Chart of Accounts and display it in the worksheet.
5 On the File menu, click Save to display the Reporting Tree dialog box.
6 In the Reporting Tree dialog box do the following: In the Name box, type a unique name for the new reporting tree.In the Description box, type a description for the reporting tree.
7 Click OK to save the reporting tree and return to the Reporting Tree Window.

49FRx Report Designer 6.7 User’s Guide
Chapter 2: Creating Basic Reports with FRx Report Designer – Creating a New Catalog ID
Creating a New Catalog ID In the Catalog of Reports, you bring together your row format, column layout, and any reporting tree, and then assign it a catalog ID name.
To create a catalog ID
1 From the Report Designer Control Panel window, on the File menu, click Catalog of Reports to display the Select Catalog for Display dialog box.
2 Click New to open the Catalog of Reports window with the default settings.
3 In the Catalog ID box, type a code to describe this sample report. For example, type IncStmt.
Note: The Catalog ID is a user-defined name. The name can be up to 16 characters in length, but cannot contain any of the following invalid naming characters: ‘ ” | / \ : ? * < >.

50FRx Report Designer 6.7 User’s Guide
Chapter 2: Creating Basic Reports with FRx Report Designer – Creating a New Catalog ID
4 In the Company box, click the arrow to display the Select a Company for this Record dialog box.
5 Select FW from the list and click OK to return to the Catalog of Reports window.
6 In the Detail Level list box, select one of the following detail level reports:
7 In the Provisional list box, select one of the following:
Select To create
Financial Report A high-level summary report
Account Only A report that contains only account detail balances
Financial & Account Two reports: a high-level summary and an account detail
Transaction Only A report that contains transaction details
Financial & Transaction Two reports: a high-level summary and a transaction detail
Select To include
Use Posted Balances Only Only transactions and balances posted in the general ledger
Provisional: Posted + Unposted Activity
All transactions and balances entered and posted in the general ledger
Include Unposted Activity Only
Only transactions entered but not yet posted in the general ledger

51FRx Report Designer 6.7 User’s Guide
Chapter 2: Creating Basic Reports with FRx Report Designer – Creating a New Catalog ID
8 Click the Report Date arrow to display the Periods and Dates dialog box.
9 In the Base Year box, type 2003.
10 Click OK to confirm and return to the Catalog of Reports window.
Note: For more information about the Report Date, see “Specifying Report Periods and Dates” on page 233.
11 Click the Building Blocks tab.
12 In the Row Format box, click the arrow to display the Choose a Row Format box.
13 Select the row format you created (or the sample row format, IncStmt) and click OK.

52FRx Report Designer 6.7 User’s Guide
Chapter 2: Creating Basic Reports with FRx Report Designer – Creating a New Catalog ID
14 In the Column Layout box, click the arrow to display the Choose a Column Layout box.
15 Then, do one of the following:Select the column layout that you created Select Curr_YTD (The sample column layout.)
16 Click OK.
17 Under Reporting Tree, select the Use Reporting Tree check box.
Note: For the Income Statement sample report you do not need a reporting tree. To create a report without a reporting tree, leave the Use Reporting Tree check box blank.
18 In the Reporting Tree box, click the arrow to display the Choose a Reporting Tree box.
19 Select the reporting tree you created or FabrkWrkA (the sample reporting tree) and click OK.
20 Click Save.
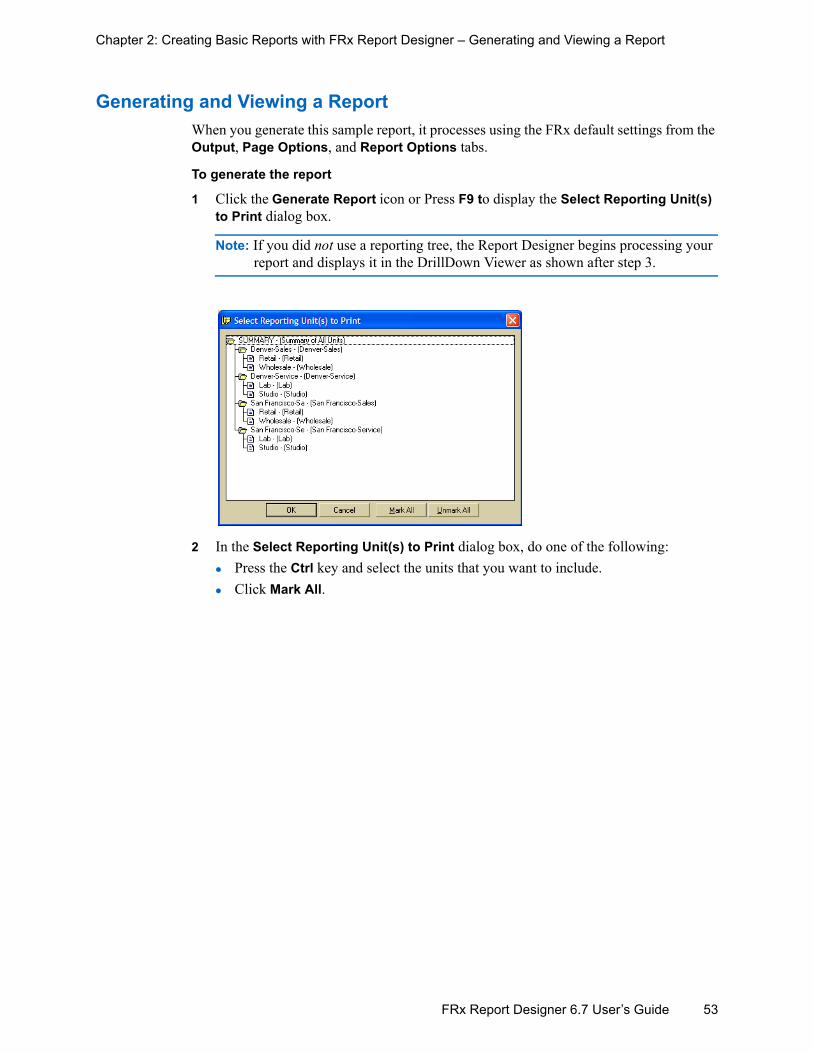
53FRx Report Designer 6.7 User’s Guide
Chapter 2: Creating Basic Reports with FRx Report Designer – Generating and Viewing a Report
Generating and Viewing a Report When you generate this sample report, it processes using the FRx default settings from the Output, Page Options, and Report Options tabs.
To generate the report
1 Click the Generate Report icon or Press F9 to display the Select Reporting Unit(s) to Print dialog box.
Note: If you did not use a reporting tree, the Report Designer begins processing your report and displays it in the DrillDown Viewer as shown after step 3.
2 In the Select Reporting Unit(s) to Print dialog box, do one of the following:Press the Ctrl key and select the units that you want to include.Click Mark All.

54FRx Report Designer 6.7 User’s Guide
Chapter 2: Creating Basic Reports with FRx Report Designer – Generating and Viewing a Report
3 Click OK to process the report and display it in the DrillDown Viewer.
4 To view additional information, you can do the following:
To View Do this
A report row broken out by reporting units, from the current reporting unit
Double-click a report row.
Other reporting units, from the reporting tree
On the reporting tree, double-click a the reporting unit.
Note See FRx® DrillDown Viewer™ and FRx® Report Launcher 6.7 User’s Guide for information about viewing, printing, and exporting your reports using the DrillDown Viewer.

55FRx Report Designer 6.7 User’s Guide
Chapter 2: Creating Basic Reports with FRx Report Designer – Completing Your Setup
Completing Your Setup Congratulations! You know how to create report in the Report Designer. Now, you can finish editing your row format, or create a new row format or reporting tree as necessary. For more information, see the following chapters and guides.
For information about...
See
Row formats Chapter 3, “Creating Row Formats.”
Linking Chapter 4, “Linking to Other Sources of Information”
Column layouts Chapter 5, “Creating Column Layouts.”
Reporting trees Chapter 6, “Creating a Reporting Tree.”
Reports Chapter 7, “Understanding the Catalog of Reports.”
Companies, international formats
FRx® Report Designer 6.7 Administrator’s Guide.
FRx Administration and Security
FRx® Report Designer 6.7 Administrator’s Guide.
FRx Report Server FRx® Report Server 6.7 User’s Guide
DrillDown Viewer and Report Launcher
FRx® DrillDown Viewer™ and FRx® Report Launcher 6.7 User’s Guide
FRx Report Manager FRx® Report Manager 6.7 User’s Guide
FRx WebPort FRx® WebPort 6.7 User and Administrator’s Guide
Table 2-1: FRx Related Chapters and Guides

56FRx Report Designer 6.7 User’s Guide
Chapter 2: Creating Basic Reports with FRx Report Designer – Completing Your Setup

57
Chapter 3
FRx Report Designer 6.7 User’s Guide
Creating Row Formats
A row format is a template that specifies the structure of each line in an FRx report. For example, row formats specify:
Descriptive rows or lines in a report (for example, Cash and Total Revenue)
All totaling and inter-row calculations
The general ledger codes (or links to row formats or external spreadsheets)
This chapter explains how to build row formats and use the features of this FRx® Report Designer building block.
Row Format Menu Functions. . . . . . . . . 58
Row Format Toolbar. . . . . . . . . . . . . . . . 65
Account Code Segments . . . . . . . . . . . . 66
Building a Row Format. . . . . . . . . . . . . . 67
Modifying Row Formats . . . . . . . . . . . . . 70
Totaling and Calculations . . . . . . . . . . . . 86
General Ledger Account Codes. . . . . . . 94
Assigning Currency Codes . . . . . . . . . 111
Automatic Rounding for Balance Sheets112

58FRx Report Designer 6.7 User’s Guide
Chapter 3: Creating Row Formats – Row Format Menu Functions
Row Format Menu FunctionsThe menu functions described in this chapter are specific to the Row Format window. For information about menus that appear in all FRx main windows, see “Defining Available Commands on Report Designer Menus” on page 18.This section contains information and instructions on the:
File Menu
Edit Menu
Format Menu
Link Menu
File Menu The following are File menu commands and are specific to the row format building block.
Figure 3-1: Row Format: File Menu
File Menu Commands Description
Rename Renames the row and description.
Delete Deletes a row, column, tree, or catalog.
Print Row Format Prints the row format.
Table 3-1: File Menu Options for Row Format

59FRx Report Designer 6.7 User’s Guide
Chapter 3: Creating Row Formats – Row Format Menu Functions
Edit Menu The Edit menu provides you with the standard Windows functions such as copy and paste as well as specific Report Designer functions.
Figure 3-2: Row Format: Edit Menu
File Menu Commands Description
Cut (Ctrl+X) Removes the selection from the current location and moves it to the Microsoft® Windows® clipboard.
Copy (Ctrl+C) Copies the current selection to the Windows clipboard.
Paste (Ctrl+V) Copies the contents of the Windows clipboard to the cursor position. If the clipboard is empty, this command is unavailable and appears dimmed. You can use the Paste function to paste copied information from other Windows-based applications, or from other FRx worksheets, into this worksheet.
Clear Clears (blanks out) all selected cells.
Find (Ctrl+F) Locates information contained in the row format.
Replace (Ctrl+R) Locates and replaces information contained in the row format.
Table 3-2: Row Format Edit Menu Commands

60FRx Report Designer 6.7 User’s Guide
Chapter 3: Creating Row Formats – Row Format Menu Functions
For more details and instructions on the commands outlined in the above table, review the following topics:
Cut (Ctrl+X)
Find (Ctrl +F)
Replace (Ctrl+R)
Renumber Rows
Description (Ctrl+D)
Delete Row
Insert Row
Add Rows from Chart of Accounts
This command allows you to create a new row format (with general ledger accounts) using data from your current chart of accounts. A selected subset of general ledger account information is transferred to the new row format.
For more information about using this command, see “Building a Row Format From the Chart of Accounts” on page 67.
Renumber Rows Allows you to define starting row codes and a number by which to increment the row codes that follow.
Description (Ctrl+D) Opens a dialog box where you can edit a row format description.
Rounding Adjustments See “Automatic Rounding for Balance Sheets” on page 112.
Account Sets With FRx, you can create an account set by assigning a name to a group of accounts. Then, you can use this account set name in multiple row formats. See “Account Sets” on page 101.
Delete Row This command deletes one or more rows.
Insert Row This command inserts one or more new rows.
Zoom (F3) Opens a box-specific window of valid values. Same as double-clicking on a cell.
File Menu Commands Description
Table 3-2: Row Format Edit Menu Commands

61FRx Report Designer 6.7 User’s Guide
Chapter 3: Creating Row Formats – Row Format Menu Functions
Cut (Ctrl+X)Removes the selection from the current location and moves it to the Microsoft® Windows® clipboard:
1 Select the cell you want to cut.
2 On the Edit menu, click Cut. The text disappears from the cell.
3 Paste the selection from the Microsoft® Windows® clipboard to another cell in FRx or to another Windows application.
Find (Ctrl+F)To find text
1 Click Find to open the Find dialog box.
1 In the Find What box, enter the text you want to locate.
2 Click Find Next.
3 To conduct a more specific search, select one or more options from the Search Options section of the dialog box.
Replace (Ctrl+R)
To replace text
1 In the Find what box, enter the text you want to find.
2 Click Replace to open the Replace dialog box.
3 In the Replace with box, enter the text you want to replace it with.
4 Click Replace to replace a single occurrence of the text or Replace All to replace all occurrences of the text.

62FRx Report Designer 6.7 User’s Guide
Chapter 3: Creating Row Formats – Row Format Menu Functions
Renumber RowsThis command allows you to define starting row codes and a number by which to increment the row codes that follow. Blank row codes and label row codes are not affected by renumbering.
Figure 3-3: Renumber Rows Dialog Box
Description (Ctrl+D)This opens a dialog box where you can edit a row format description.
Figure 3-4: Row Format Dialog Box
The Name and Specification set boxes are display only. You cannot access or change them.Enter the text you want to describe the row format in the Description box; you can use upper- and lower-case letters, numbers, and spaces.
Delete RowTo delete a row
1 Click the gray box to the left of the row code to be deleted.
2 Select the Delete Row command.
To delete one or more consecutive rows
1 Highlight the rows’ gray boxes.
2 Select the Delete Row command. A window asks you to confirm the deletion.
Insert RowTo insert a row
1 Click the gray box to the left of the row code of the row following where you want the new row.
2 Select the Insert Row command.
Note You must save the row format in order to save the description change.

63FRx Report Designer 6.7 User’s Guide
Chapter 3: Creating Row Formats – Row Format Menu Functions
To insert more than one row
1 Highlight the gray boxes of the number of rows to be inserted.
2 Select the Insert Row command. When you insert a new row, FRx assigns a new row code number. This number is typically halfway between the number in the row code above and the number of the row code below the newly added row. For example, a row inserted between rows 130 and 160 might be assigned a row code of 145.
Format Menu Use the Format menu to control the font styles and column width in a report.
Figure 3-5: Row Format: Format Menu
Font StylesUse this command to create and edit different font styles and shading for your report. You can apply fonts globally or to a specific row within a report.
To create or edit a font style before using it
1 On the Format menu, click Font Styles to display the Font Styles dialog box.
2 Choose from the following options:
To Do this
Create a new font style 1 Click New.2 In the Font Style Name box, enter a
name for the new style.
Edit an existing font style
1 Click Find.2 In the Select Font Style dialog box,
select the font that you want to edit and click OK.

64FRx Report Designer 6.7 User’s Guide
Chapter 3: Creating Row Formats – Row Format Menu Functions
3 Choose from the following options:
4 Click Save.
5 Click Close.
Column WidthThis command opens the Column Width dialog box. Use this box to specify the width of a column on screen as well as to hide or unhide it.
Figure 3-6: Column Width Dialog Box
You can also change the width of FRx columns with the mouse, using the same technique as in Windows-based spreadsheets like Microsoft® Excel. Drag the column edge until the column is the size you want it to be.To modify the column width when printing the report, you need to adjust it in the column layout. For more information, see “Column Width” on page 157.
To change the width of a column in the row format
1 Type a new number in the Column Width box.
2 Click OK.You may wish to hide one or more columns so that they are not visible on the worksheet.
To hide one or more columns
1 Select the columns.
2 On the Format menu, click Column Width... to display the Column Width dialog box.
3 Click Hide.
4 Click OK.
To unhide all hidden columns
Click Unhide in the Column Width dialog box.
To Do this
Apply a font, font style, or size
1 Click Font.2 Make your selections and click OK.
Apply shading to the style
1 Click Shading.2 Select or define the background color
that you want to use and click OK.

65FRx Report Designer 6.7 User’s Guide
Chapter 3: Creating Row Formats – Row Format Toolbar
Link Menu Although most row formats contain only general ledger account codes as the source of information, any row format can also contain links to other FRx row formats, to other fiscal years, to XBRL taxonomy files, or to Lotus 1-2-3 or Microsoft® Excel spreadsheets. Any format can contain links to several different sources. The Open Link Window command opens the Links dialog box. For more information about linking, see Chapter 4.
Row Format Toolbar The Row Format window has a set of toolbar buttons that display below the menus. Common toolbar buttons are explained in “Getting Around in Report Designer” on page 11 in Chapter 1. The following toolbar buttons are exclusive to the Row Format window.
Toolbar Button Description
Opens the Links dialog box. This has the same effect as selecting Open Link Window from the Links menu. For more information, see “Link Menu” on page 65.
Applies a font style to one or more consecutive rows:
1 Select the Description cell (column B).2 Click the Font Style box to see a list of font styles.
To edit or add a new font style, open the Font Styles dialog box by selecting Font Styles from the Format menu. For detailed information about creating and editing font styles, see “Font Styles” on page 63.
Table 3-3: Row Format Toolbar Buttons

66FRx Report Designer 6.7 User’s Guide
Chapter 3: Creating Row Formats – Account Code Segments
Account Code Segments The full account code refers to all the segments that exist within the chart of accounts structure. The full account code can be broken down into the natural (or main) account code segment and the responsibility account code segments.The natural or main account code segment is the most fundamental element of the full account code in your general ledger. The natural account segment represents the primary purpose of the account, such as sales, travel expense, and cash. Most organizations create their full account codes with multiple responsibility segments that build on the same natural account segment.The responsibility account code segments typically represent responsibilities, such as location, division, department, area, task, project, product, and other categories within the overall structure of the organization. Responsibility account segments include all of the general ledger segments except the natural account segment.Although a row format can contain any portion of the full account code, the most flexible row format contains only the natural account segment. With this type of row format, you can use many different column layouts and reporting trees. A row format used without a reporting tree (when generating the report) requires the row format to contain the natural account segment or the full account code. When you define a report that includes a row format containing just the natural account segment and a column layout, FRx creates a financial report that defines natural account segment information summarized for the entire organization.However, you may at times want to generate multiple financial reports, one for each of your responsibility segment values (such as locations, divisions, and departments). By having your reporting tree focus on the responsibility segments of the full account code, you get more flexibility when pulling information from the general ledger.The reporting tree identifies not only each of the responsibility segments’ values that you would like to report on, but also the relationship of each responsibility segment to the other responsibility segments within your organization. Reports that use a reporting tree combine the general ledger account code information in the row format with the account code information contained in the tree to create multiple financial reports. For more detailed information on reporting trees, see “Creating a Reporting Tree” on page 179.

67FRx Report Designer 6.7 User’s Guide
Chapter 3: Creating Row Formats – Building a Row Format
Building a Row Format Although FRx supports up to 8000 general ledger rows, we suggest designing your row format as a high-level summary (500 rows or less), using the techniques outlined in the following sections. This makes creating and maintaining your row formats easy and lets you produce detailed reports that display all account information.You create row formats in two ways:
Manually, by entering the row information into the Row Format window
Automatically, by building basic formats directly from your general ledger chart of accounts as described in the following sections
This section contains information and instructions on:
Building a Row Format From the Chart of Accounts
Defining the Account Segments in a Row Format
Opening a Row Format
Building a Row Format From the Chart of Accounts A master row format contains every unique natural account from all departments. This format may contain many more accounts than a single department uses. By default, FRx suppresses printing any row without a corresponding balance in the general ledger. This allows you to use the master format for all departments, but still generate custom reports for each department.When you build a row format from the chart of accounts, FRx examines your entire chart of accounts or the account range you specify. FRx then creates a master format with the account code segment you specified in the row format. The selected account code segment is typically the natural account code segment.
To build a master row format
1 On the File menu, point to New, and then click Row to open an untitled Row Format window.

68FRx Report Designer 6.7 User’s Guide
Chapter 3: Creating Row Formats – Building a Row Format
2 On the Edit menu, click Add Rows from Chart of Accounts to display the Add Rows From Chart of Accounts dialog box.
The Description boxes contain descriptions for the segments of your account code. These descriptions vary according to how the account code was set up in the general ledger.
The Account Mask determines which account segments are stored in the row format. (If you use a reporting tree, the account mask also determines which account segments are pulled from the reporting tree.)
The # symbol tells FRx to not include that character in the row build process.The & (hook) symbol tells FRx to include that character in the row format.
Note: The # and & symbols work on a character-by-character basis, although you typically use the same symbol within a segment.
The default mask, defined from your general ledger, has & symbols in the natural segment and # symbols in the responsibility segments.
3 To create a master format, accept the default mask by clicking OK.
Note: Keep in mind that if you plan to use the same format for more than one department, you don’t need to repeat this procedure for each department.
Defining the Account Segments in a Row FormatTo define the account segments in a row format
1 On the File menu, point to New, and then click Row to open an untitled Row Format window.
2 On the Edit menu, Add Rows from Chart of Accounts to display the Add Rows From Chart of Accounts dialog box.
3 Select & symbols for every account position that is to be transferred to the row format. You can also click the All &&& button to change all the ### symbols within a segment to &&&.

69FRx Report Designer 6.7 User’s Guide
Chapter 3: Creating Row Formats – Building a Row Format
4 If you want to include a specific range of accounts, enter the beginning account number in the Account Range Start and the ending account number in the Account Range End boxes. If you want to include all the general ledger codes for the selected segment, leave these boxes blank.
Note: You do not need to enter the entire account in the Account Range Start and Account Range End boxes. For example, if you want to limit a format to natural codes 4100 to 5400, enter these codes under the Natural account code box.
5 Enter values in the Starting row code and Increment each row by boxes. This tells FRx the row code for the first row in the new row format and the spacing between numbers. By accepting the default settings, the first row code will be 100, followed by rows incremented by 30. For example, 100, 130, 160, 190, 220, and so on.
Note: Don’t try to create a row format that contains all general ledger account combinations in the company. Report Designer works best with many small row formats and uses the reporting tree and other techniques to run reports for multiple departments. If your selection results in more than a few hundred report rows, you should break the format down into smaller sections of the report using the account range feature, described in the next section.

70FRx Report Designer 6.7 User’s Guide
Chapter 3: Creating Row Formats – Modifying Row Formats
6 Click OK to build the row format.After the build is complete, the row format window appears showing row codes that identify each row, row descriptions, and general ledger account codes. The following figure shows the asset accounts in a master row format.
A row format built from the chart of accounts provides a base to which you can add:
Totals
Calculations
Formatting
Opening a Row FormatTo open a new Row Format
1 From the FRx Control Panel, select the Row Formats building block.
2 Select one of the following options: Select a row format from the Open Row dialog box and click OK.Click New to create a new row format.
Modifying Row Formats Each column in the row format contains specific codes, links, text, general ledger data, or other infomation that can be modified to control the way the row generates output in the resulting FRx report. The topics in this section describe the functions, features, and available options for each column in the row format.
Note If your account code includes spaces as part of the account structure, FRx inserts an underscore (_) character in place of the space by default. If you want to substitute another character for the underscore, you need to change it in the FRx System Preferences dialog box. For more information, see the FRx® Report Designer 6.7 Administrator’s Guide.

71FRx Report Designer 6.7 User’s Guide
Chapter 3: Creating Row Formats – Modifying Row Formats
This section contains information and instructions on the:
Row Code Column
Description Column
Fmt Code Column
Related Rates/Rows/Unit Column
Normal Balance Column
Print Control Column
G Column
Link Column
Row Code ColumnThe numbers or labels in the Row Code column identify each row in the worksheet. You use the row code in calculations and totals, when formatting, and to link to other row formats.A row code is required for rows that are referred to by other rows (such as totals). You can mix numeric, alphanumeric, and blank row codes within a row format.The row code can be any number or a descriptive label that identifies that row. A label:
Can be any combination of numbers and letters up to 16 characters
Must begin with an alphabetic character (a to z).
Can use the underscore (_) character, but no other special characters can be used These are examples of valid row codes: 320, TL_NET_INCOME and TL_NET_94.To renumber your row codes, select the Edit menu, and click Renumber Rows to renumber numeric codes.You can renumber in row formats that combine row code numbers with row code labels. FRx renumbers row codes that begin with numbers (for example, 130, 246), and skips renumbering of any row codes that begin with letters (for example, INCOME_93, TP0693).
Description ColumnEnter the description exactly as it should print on a report. You define the width of the description column in the column layout (particularly important when entering a long description, which might be cut off on a generated report). For more information about column layouts, see “Creating Column Layouts” on page 137. To identify the reporting unit when you generate reports for multiple units in a reporting tree, type the @UNIT code in the Description cell. When you generate the report, FRx
Note When you renumber row codes, FRx automatically updates TOT and CAL references. For example, if the range of rows in a TOT row is 100 to 160 and you renumber starting with 90, the starting TOT range changes to 90 instead of 100.

72FRx Report Designer 6.7 User’s Guide
Chapter 3: Creating Row Formats – Modifying Row Formats
inserts the reporting unit’s Title/Description. For information about reporting trees and reporting units, see “Creating a Reporting Tree” on page 179.You can include an Additional Text code for additional text entries from a reporting tree in a row format. Enter the Additional Text code in the format @UNITT[#], where [#] is the additional text entry number for the reporting unit. For example, @UNITT4 specifies the fourth additional text entry for the reporting unit. When the report is generated, the report row will display the additional text.For more information about creating additional text entries in a reporting tree, see “Adding Text to the Reporting Units in a Tree” on page 216.
To use additional text in the row format
1 From the Row Format window, select the Description cell of the row in which you want to add the Additional Text code. (Insert rows, if necessary.)
2 Select from the following options:
3 On the File menu, click Save to save the row format.
To Do this
Apply a font style to the additional text
Click the Font Style arrow and select a font style from the list.
Restrict the additional text to a specific reporting unit
1 Select the Related Rates/Rows/Unit cell of the additional text row.
2 Click the Related Rates/Rows/Unit arrow to open the Select Tree for Lookup dialog box.
3 Double-click the reporting tree you want to use.
4 When the Select a Reporting Unit for Restriction dialog box appears, double-click the reporting unit to which the row is to be restricted.

73FRx Report Designer 6.7 User’s Guide
Chapter 3: Creating Row Formats – Modifying Row Formats
4 Type @UNITT[#], substituting the unit text number for [#].
Note: For example, @UNITT4 specifies the fourth additional text entry for the reporting unit from Column Z of the tree.
5 Select from the following options:
Fmt Code ColumnFormat codes control the content of a row. Every row is interpreted as a general ledger detail row unless a code is present in the Fmt Code column. Double-click the Fmt Code column to display a list of available codes.
TOTThis code allows you to use simple mathematical operands (+ or -) between amounts or row codes that you specify in the Related Rates/Rows/Unit column. For more information about this format code, see “Totaling and Calculations” on page 86.
To Do this
Apply a font style to the additional text
Click the Font Style arrow and select a font style from the list.
Restrict the additional text to a specific reporting unit
1 Select the Related Rates/Rows/Unit cell of the additional text row.
2 Click the Related Rates/Rows/Unit arrow to open the Select Tree for Lookup dialog box.
3 Double-click the reporting tree you want to use.
4 When the Select a Reporting Unit for Restriction dialog box appears, double-click the reporting unit to which the row is to be restricted.

74FRx Report Designer 6.7 User’s Guide
Chapter 3: Creating Row Formats – Modifying Row Formats
CALThis code allows you to use complex mathematical operands (+, -, *, /, and IF/THEN/ELSE statements) between amounts or row codes that you specify in the Related Rates/Rows/Unit column. For more information on calculations, see “Formula Totaling (CAL)” on page 86.
DESThe DES code inserts headings and blank lines in reports. For example, row 95 in the following figure uses the DES code to insert a blank line. Row 98 uses DES to insert the description “Revenue.”
LFT, RGT, CENThese codes align the row format Description column information on the left, right, or center of the report line, regardless of its placement in the column layout.
CBRThe CBR (Change Base Row) code defines the base row for columns that calculate a percentage of or multiply by the base row for each row in the report. You can have multiple CBRs in a row format such as one with net sales, one with gross sales, and one with total expenses. Usually, the CBR is used to create a percentage for accounts compared to a total line. For example, you could compare accounts like salary percentages and manager salaries as a percentage of net sales. Enter the allocation base row code in the Related Rates/Rows/Unit column. This base row is used for the calculation and remains in effect until another CBR row is defined. The following figures illustrate the CBR format code. In the row format, the CBR code is in row 45. The Related Rates/Rows/Unit column of row 45 shows row 140, which is the Net Sales row. The calculation formula in column C is B/BASE and a special format mask. This tells FRx to divide the amount in column B by the amount in column B of the base row (row 140) and to put the result in column C of that row. The result is that each amount in column C is the amount in column B expressed as a percentage of net sales. Similarly, each amount in column E is the amount in column D expressed as a percentage of net sales.
Note If a report contains title rows and underscore rows where all detail rows have been suppressed (because of zero balances, for example), you can suppress the printing of format rows using the Related Rates/Rows/Unit column. For more information, see “Relating a Format Row to an Amount Row” on page 81.

75FRx Report Designer 6.7 User’s Guide
Chapter 3: Creating Row Formats – Modifying Row Formats
Figure 3-7: Using Base Row in Row Format Window
Figure 3-8: Using Base Row in Column Layouts Window
For more information, refer to your FRx® DrillDown Viewer™ and FRx® Report Launcher 6.7 User’s Guide.
PBThis code is used for reports that contain both a balance sheet and an income statement. The code:
Starts a new report page.
Tells FRx the page is a balance sheet (or supporting schedule to the balance sheet).
Places the title from the Description column (in this row) into the report heading. To activate this feature, you must also use the @ROW option in the report header (in the Catalog of Reports). For more information, see “Understanding the Catalog of Reports” on page 223.
Suppresses printing of all columns other than the BS column when the column layout contains multiple amount columns and the BS option is selected in the Print Control section of one column in the column layout. This allows a report to contain both a multi-column income statement (for example, Current Period & Year to Date) and a
The format code CBR (row 45) calculates a percentage of the base row for each row in the report. The base row is identified in the Related Rates/Rows/Unit column (row 140, the Net Sales row, in this example). The Net Sales row is used for percent calculations until another CBR row is defined. See the following column layout.
B/BASE tells FRx to divide the amount in column B by the base row (row 140 in the above row format) and to put the result in column C of that row.
This is the special format mask; using this format, the numbers in this report display as a percentage with one decimal point and negative numbers are in parentheses.

76FRx Report Designer 6.7 User’s Guide
Chapter 3: Creating Row Formats – Modifying Row Formats
single-column balance sheet (for example, Year to Date only). For more information, see “Creating Column Layouts” on page 137.
PIThis code starts a new page for an income statement. It functions like the PB code, except that it tells FRx the page is an income statement. You can use this code to force a page break in any report.All columns from the column layout print in an income statement, including any columns that use a BS (Balance Sheet column) print control code.
---This code places a single line under all amount columns. You can also suppress the line for certain columns if required (for example, percent columns). For more information, see “Adding Column Restrictions” on page 164.
===This code places a double line under all amount columns.
LNEThis code prints a line across the entire page. After choosing this Fmt Code option, you can also enter one of the following line descriptions in the Description column:
Type = 1: thin line (default)
Type = 2: thick line
Type = 3: dotted line
Type = 4: two lines, thick line followed by thin line
Type = 5: two lines: thin line followed by thick line
Note: Because of the way that lines are defined in HTML, only single line types 1, 2, and 3 are supported for reports that are output in HTML formats, including DrillDown Viewer Enhanced XML (.frd) and Standard XML (.xml) files, when viewed in FRx WebPort.
Note Use the Balance Sheet/Income Statement distinction only if your report includes both a Balance Sheet and an Income Statement and if the column display should be different for each type of report.
Note If a report contains title rows and underscore rows where all detail rows have been suppressed (because of zero balances, for example), you can suppress the printing of format rows using the Related Rates/Rows/Unit column. For more information, see “Relating a Format Row to an Amount Row” on page 81.

77FRx Report Designer 6.7 User’s Guide
Chapter 3: Creating Row Formats – Modifying Row Formats
The following figure illustrates a row format with line types 1 and 2. Following this is the report that this row format creates. Note the thick line (type 2) above the reporting unit (Consolidated) and the thin lines (type 1) below Payables and Cost of Goods Sold.
Figure 3-9: Formatting Examples in Row Format Window
Figure 3-10: Sample Report with Examples of Line Type
BXB and BXCThese codes indicate the beginning and end of a box. FRx draws a box around the report rows that begin with the BXB row and end with the BXC row.
REMThis code indicates that the row is a remark row only and is not printed on the report. Use REM in the row format to explain your formatting techniques.
SORT and ASORTThese codes sort expenses or revenues, sequence an actual or budget variance report by the largest variance, or sort the row descriptions alphabetically.The SORT code sorts the report in ascending or descending order based on the value in a selected column.
To use the SORT code
1 Select the SORT format code.
Sample FRx ReportFor the Three Months Ending March 31, 2002(Dollars in Thousands)
Monthly Activity Year To DateCurrent Year Last Year
January February March Actual Budget Variance Actual % Change
ConsolidatedCash $2,471 $2,522 $5,429 $10,422 ($10,422) $129,009 91.90%Payables (8,365) 1,254 (13,956) (21,067) (21,067) 322,633 (106.50%)Net Sales 505,607 513,951 1,090,500 2,110,058 787,002 1,323,056 2,764,416 (23.70%)Cost of Goods Sold 311,722 318,268 798,339 1,428,329 490,304 (938,025) 2,015,147 29.10%Gross Profit 193,885 195,683 292,161 681,729 296,698 (385,031) 749,269 9.00%Operating Expenses 167,944 169,374 170,822 508,140 277,883 (230,257) 450,754 (12.70%)Provision for Taxes 6,910 7,012 7,111 21,033 4,659 (16,374) 79,873 73.70%Other Income (Expenses) (352) (339) (325) (1,016) (1,940) 924 (2,688) (62.20%)
Net Income 18,679 18,958 113,903 151,540 12,216 (139,324) 215,954 29.80%
Line Type = 2
Line Type = 1
78FRx Report Designer 6.7 User’s Guide
Chapter 3: Creating Row Formats – Modifying Row Formats
2 Enter the range of rows to be sorted in the Related Rates/Rows/Unit column.
3 Enter the column letter to be used for the sort in the Column column.The report is sorted in ascending order by default. For descending order, enter a negative sign (-) before the column letter.The ASORT code sorts the report by the absolute value of the value in the selected column. In other words, the sign of the value is ignored in the sort. This format code shows values sequenced by the magnitude of the variance, whether positive or negative.
To use the ASORT code
1 Select the ASORT format code.
2 Enter the range of rows to be sorted in the Related Rates/Rows/Unit column.
3 Enter the column letter to be used for the sort in the Column column.The report is sorted in ascending order by default. For descending order, enter a negative sign (-) before the column letter.
Note: Do not include formatting or total rows in a sort calculation. If you include format or total rows, FRx sorts these rows along with the general ledger rows.

79FRx Report Designer 6.7 User’s Guide
Chapter 3: Creating Row Formats – Modifying Row Formats
The row format in the following figure demonstrates the use of the SORT and ASORT format codes. Following this is the report that this row format creates.
Figure 3-11: SORT and ASORT in Row Format Window
Figure 3-12: Sorted Sample Report
CCHISTThis code tells FRx to perform currency conversion using the historical rate from the currency translation table. The historical rate is commonly used for rows that show non-monetary assets, such as fixed assets, inventory, or capital stock. When you use the CCHIST row code, you must also select a Historical Rate ID as the related rate in Column D of the row.
CCAVGThis code tells FRx to perform currency conversion using the average exchange rate from the currency translation table. The average rate is commonly used for income rows in the report. When you use the CCAVG row code, you must also select an average type (AVGDAILY, AVGWEEKLY, or AVGMONTHLY) as the related rate in Column D of the row.
CCSPOTThis code tells FRx to perform currency translation using the spot (current) exchange rate from the currency translation table. The spot rate is commonly used for cash accounts.
Note Use the following format codes with the separately-licensed FRx® Currency Translation module. Your software license determines if Currency Translation is available with your installation. Contact your vendor for more information about currency conversion licensing.
The Sort format code sorts the report in ascending or descending order based on the values in your selected column.
The Asort format code sorts the report by the absolute values in your selected column.
Fabrikam Works, Inc.Variance Analysis (Sorted by Variance)
Service Division-San FranciscoFor the Four Months Ending April 30, 2002
April YTDActual Budget Variance Actual Budget Variance
Sorted by Monthly Variance in Ascending OrderSalary Expense $16,566 $11,007 ($5,559) $64,035 $42,564 ($21,471)Rent Expense 2,251 1,495 (756) 8,699 5,782 (2,917)Travel Expense 670 444 (226) 2,589 1,722 (867)Sales 39,219 26,057 13,162 151,587 100,766 50,821
Sorted by YTD Absolute Variance in Descending OrderSales 39,219 26,057 13,162 151,587 100,766 50,821Salary Expense 16,566 11,007 (5,559) 64,035 42,564 (21,471)Rent Expense 2,251 1,495 (756) 8,699 5,782 (2,917)Travel Expense 670 444 (226) 2,589 1,722 (867)
This section of the report is sorted in descending order.
This section of the report is sorted in ascending order.

80FRx Report Designer 6.7 User’s Guide
Chapter 3: Creating Row Formats – Modifying Row Formats
CCXThis code suppresses any currency conversion for this row and remains in effect until a different currency code is encountered.
Related Rates/Rows/Unit ColumnThis column can:
Tell FRx that a description or underline row is linked to an amount row. Consequently, the title and underscore prints only when the related amount does. For more information, see “Relating a Format Row to an Amount Row” on page 81.
Define the rows to include in a calculation when using a TOT or CAL format code. For more information, see “Totaling and Calculations” on page 86.
Restrict a row to a specific reporting unit. For more information, see “Restricting a Row to a Reporting Unit” on page 80.
Tell FRx which Historical Rate ID to use as the related rate when using the CCHIST format code, or which type of average to calculate (daily, weekly, monthly, etc.) when using the CCAVG format code.
Define the rows to sort when using with the SORT or ASORT format code.
Define the base row for calculations when using the CBR format code.You can design a single row format to use with all responsibility segments, such as locations, divisions, and departments, in your organization. FRx allows you to build a reporting tree to define all of the different detail and summary responsibility segments, which are referred to as reporting units. However, you may sometimes want to designate a row in a report to apply to a specific reporting unit in your reporting tree. For example, you may want to create an individual row that details the total operating expenses for a specific department. To do this, zoom in the Related Rates/Rows/Unit cell of the row format and select both a reporting tree and reporting unit. FRx restricts this row to this specific reporting unit.
Restricting a Row to a Reporting Unit To restrict a row to a reporting unit
1 In the Related Rates/Rows/Unit column, double-click to open the Select Tree for Lookup dialog box.
2 Double-click the reporting tree you want to use.
Note Restricting a row to a specific reporting unit is particularly important when the full account code is used in a row format. When you use the full account code, the amount is reported to every unit in the reporting tree with the potential for significant duplication of the amount as it is rolled up in the tree. To avoid duplication, restrict the row to a reporting unit.

81FRx Report Designer 6.7 User’s Guide
Chapter 3: Creating Row Formats – Modifying Row Formats
3 When the Select a Reporting Unit for Restriction dialog box appears, double-click the reporting unit to which the row is to be restricted.The reporting unit that you select appears in the Related Rates/Rows/Unit column.
FRx uses the following rules to roll up amounts to parent units in a reporting tree:
Reporting units that use an account mask in the reporting tree, corresponds with the row amount in the reporting unit report. The units do not duplicate that amount in the parent unit report.Reporting units that do not use an account mask in the reporting tree (that is, parent units), corresponds with the row amount in the child unit report and roll up the amount to the specified parent unit. If the parent unit has five child units, the row appears five times (once for each child unit) in the parent report.Reporting units that include the full account code restrict based on the preceding rule. Therefore, when you restrict rows that include a full account code to a unit containing an account mask, FRx includes the row amount without duplication for that unit and its parent units.
Note: If a parent unit also uses a general ledger account template, the account is pulled into the parent unit, thus causing a duplication of data.
4 Enter a general ledger code in the Link to General Ledger column.
Relating a Format Row to an Amount Row To relate a format row to an amount row
When you build a row format, you can define format rows, or non-amount rows, by using Fmt Codes such as DES, LFT, RGT, CEN, ---, and ===. To avoid printing titles or underscores when no amounts are present, relate the format rows to corresponding amount rows. To relate a formatting row to an amount row, enter the row code from the amount row in the Related Rates/Rows/Unit column of the formatting row.Figure 3-13 shows a row format that relates rows 150 and 170 to the amount in row 160. If there is no value to display in row 160, then FRx suppresses rows 150 and 170.
Figure 3-13: Relating Rows in Row Format Window
Here’s another example. Suppose you enter a row for the descriptive title Operating Expenses, followed by a list of expense accounts and a total row for those expense accounts. If you run a report for a department with no operating expense accounts (and you have suppressed printing zero balance accounts in the catalog of reports), the title “Operating Expenses” appears on the report without any supporting amount entries.

82FRx Report Designer 6.7 User’s Guide
Chapter 3: Creating Row Formats – Modifying Row Formats
To avoid this problem, enter the row code for the Total Operating Expenses amount row in the Related Rates/Rows/Unit cell of the Operating Expenses descriptive row. The Operating Expenses title will not appear when the operating expense total is zero. Use the same technique for underscores and other format-only rows.
Normal Balance ColumnIf you want to reverse the sign of a row or if the normal balance of an account is a credit, enter a C in the Norm Bal column. When general ledger amounts pull in to a row format, FRx reverses the sign on all credit balance accounts. When FRx converts these accounts it removes the debit/credit characteristic from all amounts and makes totaling very straightforward. For example, to calculate net income, you simply subtract expenses from income.Totaled and calculated rows typically are not affected by a C code unless you select the XCR print control option in the related column layout. By selecting XCR in the column layout, you reverse the sign of any row that contains a C in the Norm Bal column. This is especially important when you want to show all unfavorable variances as negative amounts. If a totaled or calculated number displays the wrong sign, add a C to the Norm Bal column in the row format to reverse the sign. For more information on the column layout Print Control, see “Print Control Codes” on page 158
Print Control ColumnThe row format Print Ctrl column controls print formatting features of the current row. These print control codes apply to amount rows only.
NPIndicates a non-printing row. This row is not printed on the report, but can be used in all calculations.
CSIncludes a currency sign (for example, $) on all amount columns, except percentage columns which never receive a currency sign. (On the Company menu, click International Formats to set up the currency formats.)
XDSuppresses display of accounts on account or transaction detail reports. This feature is useful when a row includes multiple accounts that should not be listed in the account detail or transaction detail report.
X0Suppresses display of the row if all amounts are zero. This is meaningful only when the suppress zero balance option is not selected in the catalog of reports.
B0Leaves zero columns blank.
DRDisplays the debit amounts of the accounts for the selected period.

83FRx Report Designer 6.7 User’s Guide
Chapter 3: Creating Row Formats – Modifying Row Formats
CRDisplays the credit amounts of the accounts for the selected period.
XRSuppresses rollup of amounts from a child to the parent unit.
SRSuppresses a column from being rounded.
G Column Use this column to create a tabular balance sheet (see Figure 3-14) or to restrict a row to certain report columns. You can designate a particular report column to contain a row amount by entering the column letter (for example, A, B, C) in the Column. This code applies only to the selected row. You also use this column with the SORT or ASORT
Note You can use several codes in the same row. To do so, separate the codes with commas or select them with the mouse.

84FRx Report Designer 6.7 User’s Guide
Chapter 3: Creating Row Formats – Modifying Row Formats
format codes. For more information on sorting column values, see “SORT and ASORT” on page 77.
Figure 3-14: Tabular Balance Sheet
Link Column This column identifies the sources for the numbers that make up the row. The amounts in this column contain general ledger account codes.Normally, the amounts in this column contain general ledger account codes, but you can also link to:
Other row formats
XBRL taxonomy
Microsoft® Excel or Lotus 1-2-3 worksheet
When this link type is selected
The description on the Link column changes to
GL (all years) Link to General Ledger
Table 3-4: Link Types and Descriptions
Fabrikam Works, Inc.Tabular Balance Sheet
For the Five Months Ending May 31, 2004
ASSETS
Cash - Checking $134,111.13Cash - Money Market 46,751.00
Total Cash 180,862.13
Accounts Receivable 166,164.00Allowance For Bad Debts (2,184.00)Intl Corp Receivable 271,213.00
Net Accounts Receivable 435,193.00
Total Inventories 779,026.00
Prepaid Assets 3,289.00
Current Assets 1,398,370.13
Leasehold Improvements 69,600.00Office Furniture And Fixtures 34,500.00Office Equipment 37,700.00Less Accumulated Depreciation (40,635.00)
Net Fixed Assets 101,165.00
Total Assets $1,499,535.13
LIABILITIES AND SHAREHOLDERS' EQUITY
Accounts Payable $84,253.00Accrued Liabilities 137,867.00
Total Current Liabilities 222,120.00
Leases Payable 10,100.00Notes Payable 142,794.00
Long-Term Liabilities 152,894.00
Total Liabilities 375,014.00
Capital Stock 50,000.00Additional Paid-In Capital 500,269.00Year-to Date Income 377,152.13Retained Earnings 197,100.00
Shareholders' Equity 1,124,521.13
Liabilities and Equity $1,499,535.13
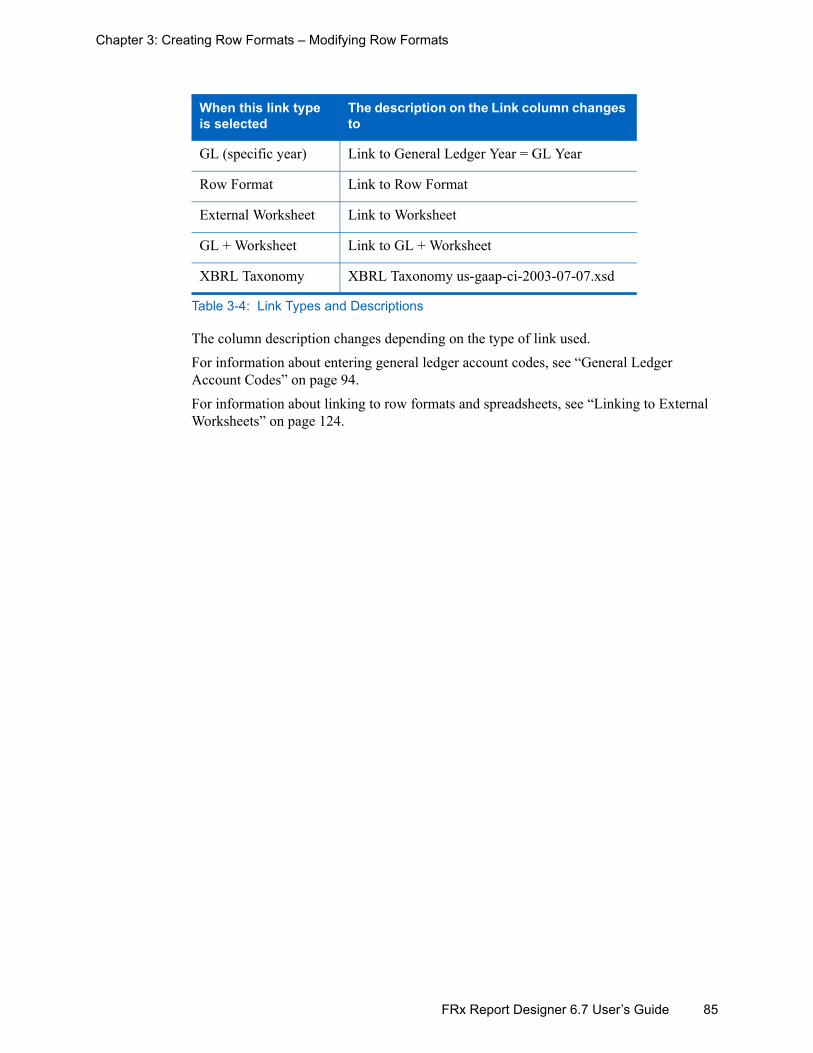
85FRx Report Designer 6.7 User’s Guide
Chapter 3: Creating Row Formats – Modifying Row Formats
The column description changes depending on the type of link used.For information about entering general ledger account codes, see “General Ledger Account Codes” on page 94.For information about linking to row formats and spreadsheets, see “Linking to External Worksheets” on page 124.
GL (specific year) Link to General Ledger Year = GL Year
Row Format Link to Row Format
External Worksheet Link to Worksheet
GL + Worksheet Link to GL + Worksheet
XBRL Taxonomy XBRL Taxonomy us-gaap-ci-2003-07-07.xsd
When this link type is selected
The description on the Link column changes to
Table 3-4: Link Types and Descriptions

86FRx Report Designer 6.7 User’s Guide
Chapter 3: Creating Row Formats – Totaling and Calculations
Totaling and Calculations This section contains information and instructions on:
Standard Totaling (TOT)
Formula Totaling (CAL)
Point and Click Totaling for TOT and CAL rows
Standard Totaling (TOT) The totaling (TOT) format code adds or subtracts amounts in other rows. A total formula can contain any combination of ranges and individual row codes up to 256 characters. See Figure 3-15 for examples of total formulas in the Related Rates/Rows/Unit column. With the TOT format code, you can do the following:
Enter individual row codes separated by a plus (+) or minus (-) sign, as in row 610.
Enter descriptive row codes separated by a plus (+) or minus (-) sign. For example, a TOT statement might look like LIABILITIES+EQUITY (see row 566).
Enter a range of row codes separated by the word TO (see row 548).
Combine ranges and individual row codes.
Figure 3-15: Standard Totaling in Row Format Window
You can pull in rows from anywhere in the current row format, regardless of their location or inclusion in another total. Total rows or detail rows can be used in any combination.
Formula Totaling (CAL)Whereas the TOT format code is oriented toward traditional financial reporting, the calculation (CAL) format code is similar to a spreadsheet formula. Using CAL, you can perform calculations that involve individual cells, multiplication and division, or absolute amounts (actual numbers included in the formula).
Note All TOT rows that fall within the range are automatically excluded. This allows you to create a grand total by specifying the entire range of rows regardless of any intermediate subtotals. The exception to this is if the TOT is in the first row of the range
This is a simple calculation using +.
You can use descriptive labels in your calculations.
You can use a total range.

87FRx Report Designer 6.7 User’s Guide
Chapter 3: Creating Row Formats – Totaling and Calculations
To use the CAL format code, enter CAL as the Fmt Code and place a formula in the Related Rates/Rows/Unit column. The formula can include numbers and operators (+, -, / and *) and parentheses ( ) in any combination.
Indicating All or Specific ColumnsWhen you enter a row code, you must also enter either a column letter (for example, A120 for column A, row code 120), or use the @ character to indicate all columns (for example, @120 for all columns, row 120). Any number that doesn’t have a column letter or @ character is assumed to be a real number. See the following figure for examples of these rules.
In a row, the number of row codes and parentheses is limited to 256 characters. For example, the formula in row 480 is a valid formula.
If you reference a row with a label row code, you must separate the column letter from the label with a period (.). See row 680.
The @ character does not require the period separator. See row 720.
Figure 3-16: Calculations in Row Format Window
Modifying a Number in Selected ColumnsThe CAL format can be very helpful when you need to modify a number in one column of a particular row, but not affect other columns in the report.The following figure illustrates calculations that place the row calculation results into specific report columns.
To perform a calculation on all report (GL) columns, you do not need to enter any column assignment. For example, if you enter @130*.75, FRx multiplies each column in row 130 by .75, and places the result in the current row. See row 190.
To restrict a formula to certain columns, enter the column letter followed by an equal (=) sign and the formula. If you enter B=@130*.75, the calculation is performed only on column B, as shown in row 220.
Note You can only export TOT formulas to a Lotus or Microsoft® Excel spreadsheet; CAL formulas will not export.

88FRx Report Designer 6.7 User’s Guide
Chapter 3: Creating Row Formats – Totaling and Calculations
You can specify multiple columns as shown in row 250. When you use @ with specific column placement, the @ relates to the restricting column. Row 250 translates to the following:A=(A100/A130)*.75B=(B100/B130)*.75C=(C100/C130)*.75
You can enter ranges, as shown in row 280.
Multiple column formulas can be entered in one row if they are separated by commas, as shown in row 310.
Figure 3-17: Calculation Applied to Specific Report Columns
Creating Multiple Description Columns You can use the CAL format code to create reports with multiple descriptions like the side-by-side balance sheet that follows.
Figure 3-18: Side-by-Side Balance Sheet
The following windows show portions of the row format used to create the side-by-side balance sheet. Rows 130 to 280 and 1030 to 1180 pull information from the general ledger, but the NP Print Control code prevents them from printing.
ASSETS LIABILITIES AND SHAREHOLDERS' EQUITY
Cash - Checking $109,267 Accounts Payable $86,742Cash - Money Market 46,518 Accrued Taxes
---------------------- Accrued Liabilities 108,689 Total Cash 155,785 Suspense Account
----------------------Accounts Receivable 162,906 Total Current Liabilities 195,431Allowance For Bad Debts (2,142)Intl Corp Receivable 268,528 Leases Payable 10,100
---------------------- Notes Payable 144,178 Net Accounts Receivable 429,292 ----------------------
Long-Term Liabilities 154,278 Total Inventories 698,075 ----------------------
Total Liabilities 349,709 Prepaid Assets 3,462
---------------------- Current Assets 1,286,614
Capital Stock 50,000Leasehold Improvements 69,600 Additional Paid-In Capital 500,269Office Furniture And Fixtures 34,500 Year-to Date Income 295,556Office Equipment 37,700 Retained Earnings 197,100Less Accumulated Depreciation (35,780) Treasury Stock
---------------------- ---------------------- Net Fixed Assets 106,020 Shareholders' Equity 1,042,925
Total Assets $1,392,634 Liabilities and Equity $1,392,634
Fabrikam Works, Inc.Side by Side Balance Sheet
For the Four Months Ending April 30, 2004

89FRx Report Designer 6.7 User’s Guide
Chapter 3: Creating Row Formats – Totaling and Calculations
Rows 1870 to 2020 demonstrate how to use the CAL format code to format the information from the non-printing rows. For example, row 1930 is interpreted as follows:
Place the results of columns A and B from row 190 (Cash - Checking) into columns A and B of the current row.
Place the results of columns A and B from row 1090 (Accounts Payable) into columns C and D of the current row.
Figure 3-19: Row Format Windows for Side-by-Side Balance Sheet
Using CAL Codes CAL codes must be on rows that do not include links to general ledger. However, you can place CAL codes on consecutive rows, suppress printing of those rows, and use the TOT command to combine them for report purposes. Refer to rows 340 to 400 in the following figure as an example.
Figure 3-20: CAL Codes in Row Format Window
These two sets of rows pull data from the general ledger. The NP Print Control code keeps these rows from printing in the report.
These rows use the CAL format code to pull the information from the non-printing rows into the side-by-side report.

90FRx Report Designer 6.7 User’s Guide
Chapter 3: Creating Row Formats – Totaling and Calculations
Special Amount FormattingYou can specify the exact print format for a CAL result by adding special amount formatting at the end of a formula. This amount formatting is used regardless of what is entered in the Catalog of Reports window or the International Formats dialog box. In the following figure, Row 160 shows how to divide the amount in B100 by the amount in C130 and print the result with three decimal places.
Figure 3-21: Amount Formatting in Row Format Window
Entering IF/THEN/ELSE StatementsIF/THEN/ELSE statements can be added to any calculation that is valid for use with the CAL format. Enter IF/THEN/ELSE calculation formulas in the Related Rates/Rows/Unit cell using the following format:
IF <true/false statement> THEN <formula> ELSE <formula>
The ELSE <formula> is optional.
IF StatementsThe statement following IF can be any statement that can be evaluated as true or false. This can be a simple evaluation:
IF A200>0
It can be a complex statement containing multiple expressions: IF A200>10000 OR ((A340/B1200)*2 <1200)
Note If a format is specified, it overrides any rounding selected for the report. For more information about formats, see “Formatting Tab” on page 261 and “Entering International Amount and Date Formats” in your FRx® Report Designer 6.7 Administrator’s Guide.

91FRx Report Designer 6.7 User’s Guide
Chapter 3: Creating Row Formats – Totaling and Calculations
THEN and ELSE FormulasThe THEN and ELSE formulas can be any valid calculation from the simplest value assignments to complex formulas. Note the formulas in the following window.
IF A200>0 THEN A=B200
This statement specifies that IF the value in column A of row 200 is greater than zero, THEN place the value from column B row 200 into column A of the current row. See row 300.
In this statement you can also use the @ character in either true/false evaluations or in the formula to represent all columns. For example, the formula described in the IF/THEN statement above placed a value in one column of the current row.
In row 400, the value from B200 is placed in every column of the current row. In row 500, the value from each column in row 200 is placed in the corresponding column in the current row. With the formula in row 600, you instruct FRx to evaluate each column in row 200, and if greater than 0, place its value in the same column in the current row.
Figure 3-22: IF/THEN/ELSE Statements in Row Format Window
Using @UNIT restrict a row to only a single reporting unit. To accomplish this, you specify the restriction in a row containing a Calculation (CAL) format code. The resulting amount is not rolled up to a higher-level unit.The calculation row can also refer to a general ledger row, as described in the following example. The calculation is recorded in the Related Rates/Rows/Unit cell of the row format as with the general ledger-type restriction. It requires the use of a conditional calculation beginning with IF @UNIT, such as:
IF @UNIT(SALES) THEN @100 ELSE 0
This calculation places the amount from Row 100 in each column of the report, but only for the Sales unit. If there were multiple units named “sales,” the amount displays in each of those units. Additionally, row 100 could be a general ledger row with a full account code and further be defined as non-printing. This prevents that amount from appearing in all units in the tree. You could also limit the amount to a single column of the report by using a column letter reference rather than the @ sign in front of the row code number.
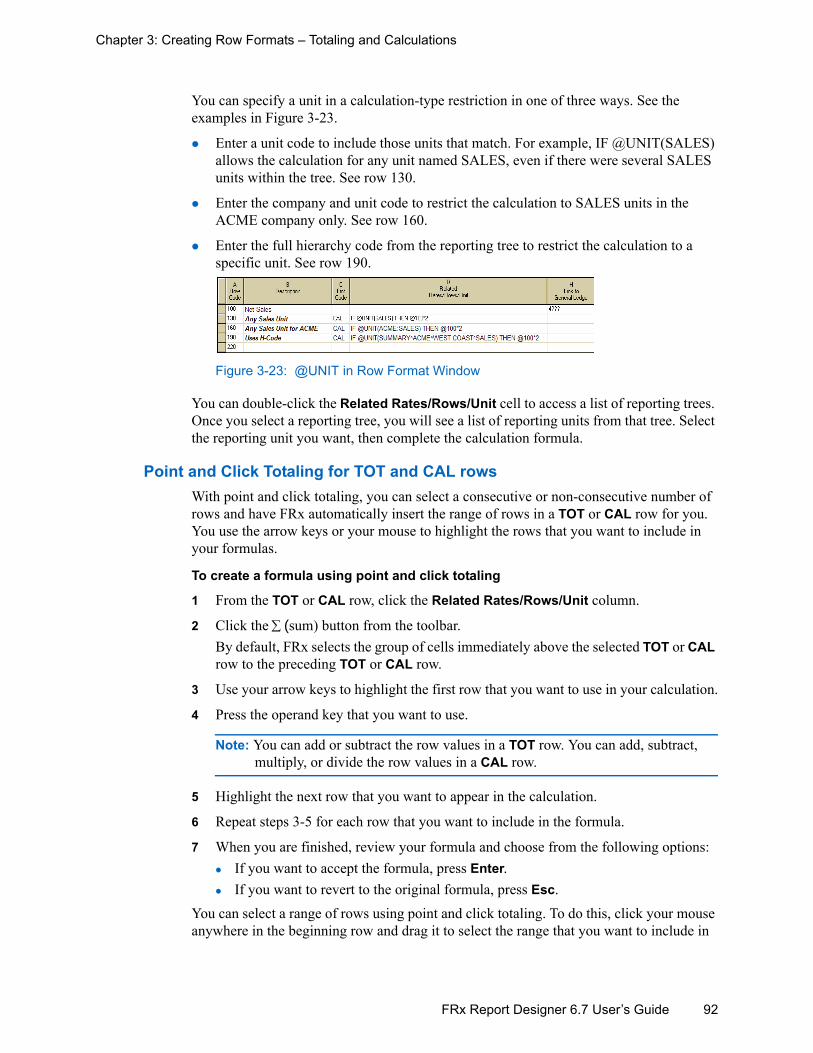
92FRx Report Designer 6.7 User’s Guide
Chapter 3: Creating Row Formats – Totaling and Calculations
You can specify a unit in a calculation-type restriction in one of three ways. See the examples in Figure 3-23.
Enter a unit code to include those units that match. For example, IF @UNIT(SALES) allows the calculation for any unit named SALES, even if there were several SALES units within the tree. See row 130.
Enter the company and unit code to restrict the calculation to SALES units in the ACME company only. See row 160.
Enter the full hierarchy code from the reporting tree to restrict the calculation to a specific unit. See row 190.
Figure 3-23: @UNIT in Row Format Window
You can double-click the Related Rates/Rows/Unit cell to access a list of reporting trees. Once you select a reporting tree, you will see a list of reporting units from that tree. Select the reporting unit you want, then complete the calculation formula.
Point and Click Totaling for TOT and CAL rowsWith point and click totaling, you can select a consecutive or non-consecutive number of rows and have FRx automatically insert the range of rows in a TOT or CAL row for you. You use the arrow keys or your mouse to highlight the rows that you want to include in your formulas.
To create a formula using point and click totaling
1 From the TOT or CAL row, click the Related Rates/Rows/Unit column.
2 Click the ∑ (sum) button from the toolbar.By default, FRx selects the group of cells immediately above the selected TOT or CAL row to the preceding TOT or CAL row.
3 Use your arrow keys to highlight the first row that you want to use in your calculation.
4 Press the operand key that you want to use.
Note: You can add or subtract the row values in a TOT row. You can add, subtract, multiply, or divide the row values in a CAL row.
5 Highlight the next row that you want to appear in the calculation.
6 Repeat steps 3-5 for each row that you want to include in the formula.
7 When you are finished, review your formula and choose from the following options:If you want to accept the formula, press Enter.If you want to revert to the original formula, press Esc.
You can select a range of rows using point and click totaling. To do this, click your mouse anywhere in the beginning row and drag it to select the range that you want to include in
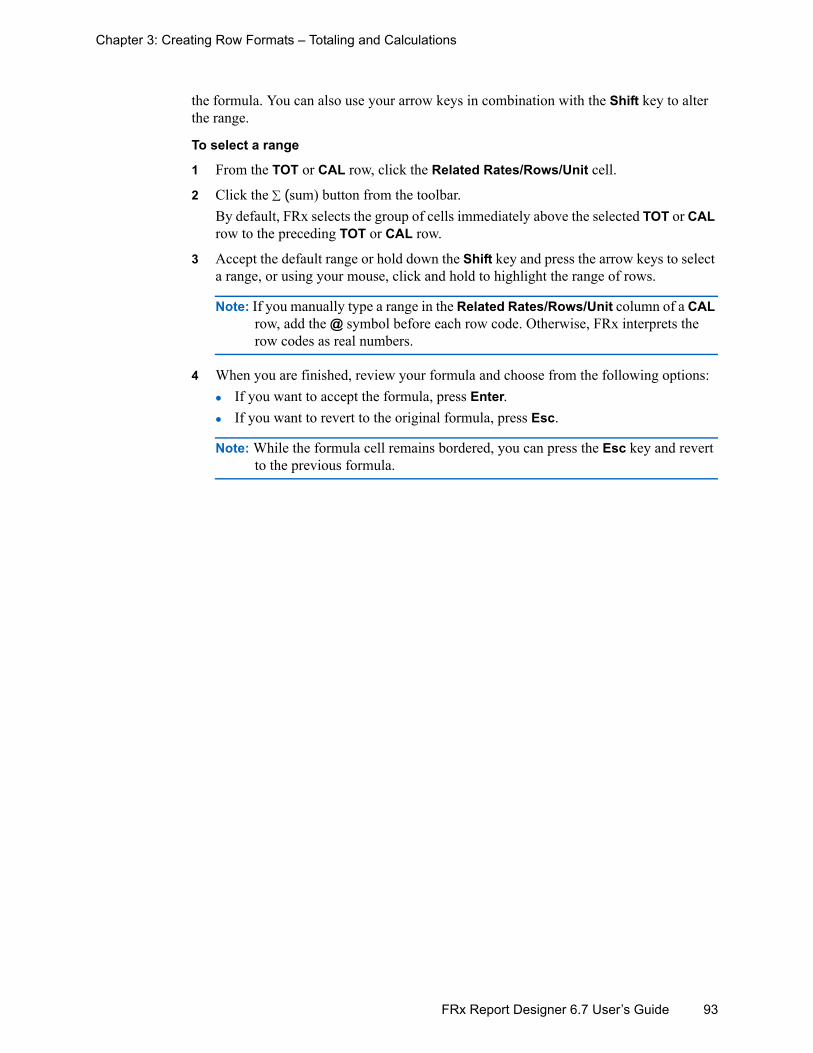
93FRx Report Designer 6.7 User’s Guide
Chapter 3: Creating Row Formats – Totaling and Calculations
the formula. You can also use your arrow keys in combination with the Shift key to alter the range.
To select a range
1 From the TOT or CAL row, click the Related Rates/Rows/Unit cell.
2 Click the ∑ (sum) button from the toolbar.By default, FRx selects the group of cells immediately above the selected TOT or CAL row to the preceding TOT or CAL row.
3 Accept the default range or hold down the Shift key and press the arrow keys to select a range, or using your mouse, click and hold to highlight the range of rows.
Note: If you manually type a range in the Related Rates/Rows/Unit column of a CAL row, add the @ symbol before each row code. Otherwise, FRx interprets the row codes as real numbers.
4 When you are finished, review your formula and choose from the following options:If you want to accept the formula, press Enter.If you want to revert to the original formula, press Esc.
Note: While the formula cell remains bordered, you can press the Esc key and revert to the previous formula.

94FRx Report Designer 6.7 User’s Guide
Chapter 3: Creating Row Formats – General Ledger Account Codes
General Ledger Account Codes The Link to General Ledger column is where you specify the general ledger account codes to include in each row of a report. This section includes information and instructions on:
Zero Balance Accounts
Defining an Account Code
Defining Only the Natural Code
Defining the Full Account Code
Entering General Ledger Codes
Using Wildcards and Ranges
Linking to Account Types
Account Sets
Using Account Modifiers
Restricting Rows with Book Codes
Using Account Attributes and Transaction Attributes in Rows
Zero Balance Accounts By default, FRx suppresses the printing of any row that does not have a corresponding general ledger balance. This allows you to define all natural account code segments in your report row format and then use that one row format with any of your departments.
Defining an Account Code In the Link to General Ledger cell, you can enter a general ledger account using the natural account code segment, full account code, or a combination of the natural segment and one or more responsibility segments.
Defining Only the Natural Code The most flexible row format is one that contains only the natural segment of the account code. For example, you could use the natural account code segment 6010 as the advertising expense code for all of your departments. Then you could define 6010 in the report row format and specify the associated responsibility segments in the reporting units of the reporting tree.
Note If your account code includes spaces as part of the account structure, FRx inserts an underscore ( _ ) character in place of the space by default. If you want to change the underscore character, you need to change it in the System Preferences dialog box. For more information, see your FRx® Report Designer 6.7 Administrator’s Guide.

95FRx Report Designer 6.7 User’s Guide
Chapter 3: Creating Row Formats – General Ledger Account Codes
The full account code is created when FRx combines the row format with the reporting tree at report creation time.
Defining the Full Account Code If you define the full account code, your row format options narrow sharply. For example, if you use the entire account code to generate detailed departmental reports, higher-level reports may not be possible.If you enter the full account code in the row format, that account will always be used when you generate reports. The row format looks elsewhere for responsibility segments only when there are no responsibility segments entered in the account code definition in the row format. However, you can link data from one row format to another to create summary reports.You can combine the full account code with natural segments in a single row format. This technique can be helpful when you want to use the account template in the reporting tree for most accounts, but also include accounts from other responsibility segments, such as divisions or departments. It’s also helpful for generating company-wide information (such as total sales revenue) in one row, and then calculating the proportion of department total to company total. When you use a full account code that has wildcard characters for each position outside of the natural code, you include all accounts with that natural segment for the entire company.
Figure 3-24: Full Account Code in Row Format Window
Note Although row formats that contain the natural account code segment are the most flexible for you to use, you can create row formats that contain a subset of the full account code. This will work well as long as the same number of hooks are present in the account mask of each unit in the reporting tree. For more information, see “Account Masks” on page 183.
Note Any row with the full account code is included in every unit of your reporting tree, regardless of any responsibility segments that may be contained in the tree. This can cause dramatic overstatement of amounts in summary unit reports.
There are two ways to avoid this problem. You can restrict that row to a particular reporting unit. See “Restricting a Row to a Reporting Unit” on page 80. You can also use the XR (suppress rollup) print control code. See “Print Control Column” on page 82.

96FRx Report Designer 6.7 User’s Guide
Chapter 3: Creating Row Formats – General Ledger Account Codes
Entering General Ledger Codes
To enter general ledger codes
1 Double-click in the Link to General Ledger column to display the GL Account Links dialog box.
2 Double-click a cell in the From Account (range) -or- Individual Account or Account Set column.The Select General Ledger Account dialog box appears. From this dialog box you can view or search for all the accounts or account sets in your general ledger.
3 In the Search box, type the first digits of an account code.
4 Select an account and click OK.
5 When you are finished creating the link, click OK.If you have specific questions about any option or box in the GL Account Links dialog box, please review the following sections.
To zoom on an account segment in a row format
1 From a row format, double-click the Link to General Ledger cell.
2 Click the Account Code option.
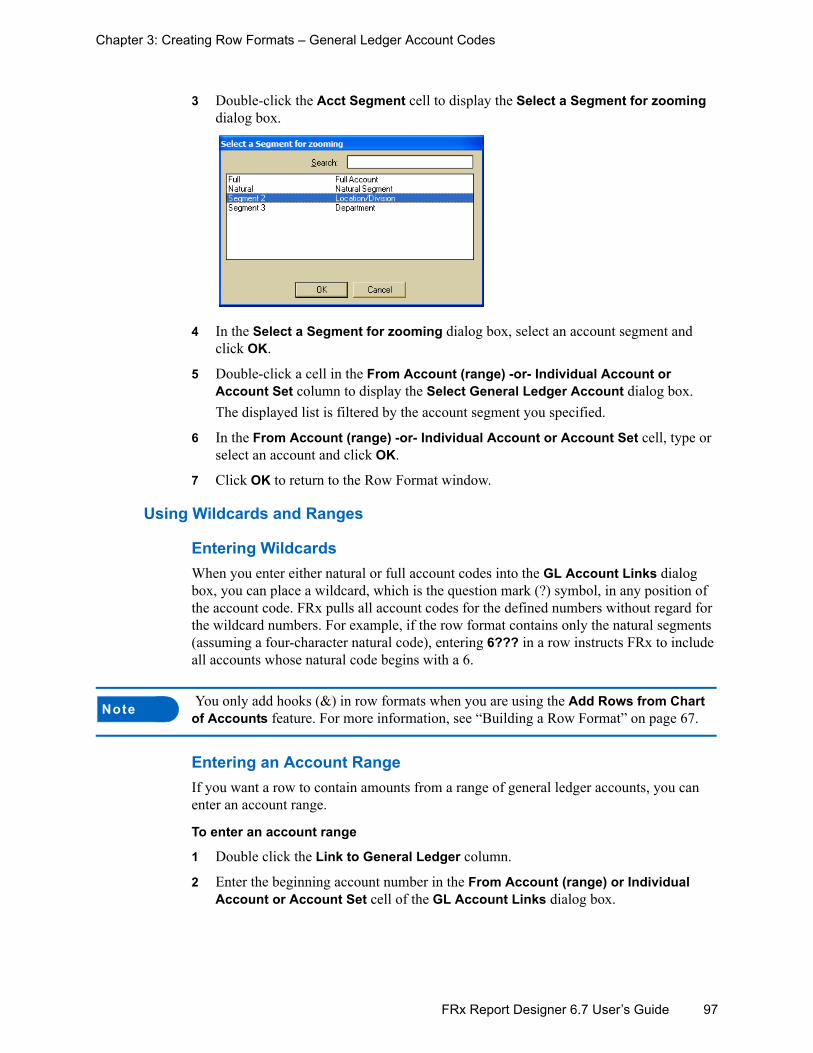
97FRx Report Designer 6.7 User’s Guide
Chapter 3: Creating Row Formats – General Ledger Account Codes
3 Double-click the Acct Segment cell to display the Select a Segment for zooming dialog box.
4 In the Select a Segment for zooming dialog box, select an account segment and click OK.
5 Double-click a cell in the From Account (range) -or- Individual Account or Account Set column to display the Select General Ledger Account dialog box. The displayed list is filtered by the account segment you specified.
6 In the From Account (range) -or- Individual Account or Account Set cell, type or select an account and click OK.
7 Click OK to return to the Row Format window.
Using Wildcards and Ranges
Entering WildcardsWhen you enter either natural or full account codes into the GL Account Links dialog box, you can place a wildcard, which is the question mark (?) symbol, in any position of the account code. FRx pulls all account codes for the defined numbers without regard for the wildcard numbers. For example, if the row format contains only the natural segments (assuming a four-character natural code), entering 6??? in a row instructs FRx to include all accounts whose natural code begins with a 6.
Entering an Account RangeIf you want a row to contain amounts from a range of general ledger accounts, you can enter an account range.
To enter an account range
1 Double click the Link to General Ledger column.
2 Enter the beginning account number in the From Account (range) or Individual Account or Account Set cell of the GL Account Links dialog box.
Note You only add hooks (&) in row formats when you are using the Add Rows from Chart of Accounts feature. For more information, see “Building a Row Format” on page 67.

98FRx Report Designer 6.7 User’s Guide
Chapter 3: Creating Row Formats – General Ledger Account Codes
3 Enter the ending account number in the To Account (range) box.The entry that appears in the Formula box (at the top of the GL Account Links dialog box) might look like this, for example:
+(6100 TO 6900)
This tells FRx to pull data from account 6100 through account 6900 inclusively into the row amount.
Entering Ranges Using a Multi-segment Account CodeWhen entering a range using a full account code, the range comparison is done on a segment-by-segment basis. For example, the range 5000-1000-00 TO 6000-2000-00 includes only accounts that match each segment. In this case, the first segment must be between 5000 and 6000, the second segment must be between 1000 and 2000, and the last segment must be 00.For example, the account 5100-1100-01 would not be included in the report because the last segment is out of range.
Using Operators in AccountsYou can add or subtract accounts from other accounts using plus (+) and minus (-) signs.
To use operators in accounts
1 Double click the Link to General Ledger column.
2 In the Op +/- box of the GL Account Links dialog box, click the box until the operator that you want to use appears.
3 In the From Account (range) -or- Individual Account or Account Set box, enter or select an account number.
The following table shows the acceptable formats to add and subtract general ledger codes.
To Use this format
Add full account codes
1205-2000-000+1205-2100-000
Add partial account codes
1205+1210
Add wildcard accounts
120?+11??
Add a range of full account codes
+(1205-1000-000 TO 1205-2000-000)
Add a range of partial account codes
+(1200 TO 1205)
Table 3-5: Acceptable Formats for Adding and Subtracting Account Codes

99FRx Report Designer 6.7 User’s Guide
Chapter 3: Creating Row Formats – General Ledger Account Codes
Although you can edit the accounts in the regular worksheet edit box, use the GL Account Links dialog box to apply the correct formatting to your account links. Any of the accounts can include wildcard (?) characters.
The GL Account Links dialog box demonstrates how to enter accounts 450? minus account 4509.
Figure 3-25: GL Account Links Dialog Box: Entering Accounts
Add a range of wildcard accounts
+(120? TO 130?)
Subtract a full account code
1205-2100-000-(1205-2000-000)
Subtract a partial account code
1210-(1205)
Subtract a wildcard account
1100-(120?)
Subtract a range of full account codes
-(1205-1000-000 TO 1205-2000-000)
Subtract a range of partial account codes
-(1200 TO 1205)
Subtract a range of wildcard accounts
-(120? TO 130?)
Note If you want to subtract accounts, you must put parentheses around those accounts. For example, if you enter 450?-(4509) you are telling FRx to subtract account 4509 from any account that starts with 450.
To Use this format
Table 3-5: Acceptable Formats for Adding and Subtracting Account Codes (Continued)

100FRx Report Designer 6.7 User’s Guide
Chapter 3: Creating Row Formats – General Ledger Account Codes
Acct SegmentSpecify the type of account segment (Full or Natural), or a specific account segment of your general ledger to filter the displayed list in the From Account (range) -or- Individual Account or Account Set cell.
Combining Accounts with RangesSpecific accounts, ranges of accounts, and wildcards can be combined in a row. The following example assumes a four-character natural code:
6210+6220+(6420 TO 7999)-(71??)
Figure 3-26: GL Account Links Dialog Box: Combining Accounts and Wildcards
Linking to Account Types Account types are category or group names defined in your general ledger that combine or relate various account codes. For example, the account type Assets might include all the cash accounts as well as accounts receivable. Using account types helps reduce report maintenance and shows a “big picture” perspective.
To link to an account type
1 From the row that you want to link, double-click the Link to General Ledger cell.
2 In the GL Account Links dialog box, the Account Code option is selected by default; select Account Type.
Note: When you select Account Type, the GL Account Links dialog box displays specific account type fields.
3 Double-click an Account Type cell.
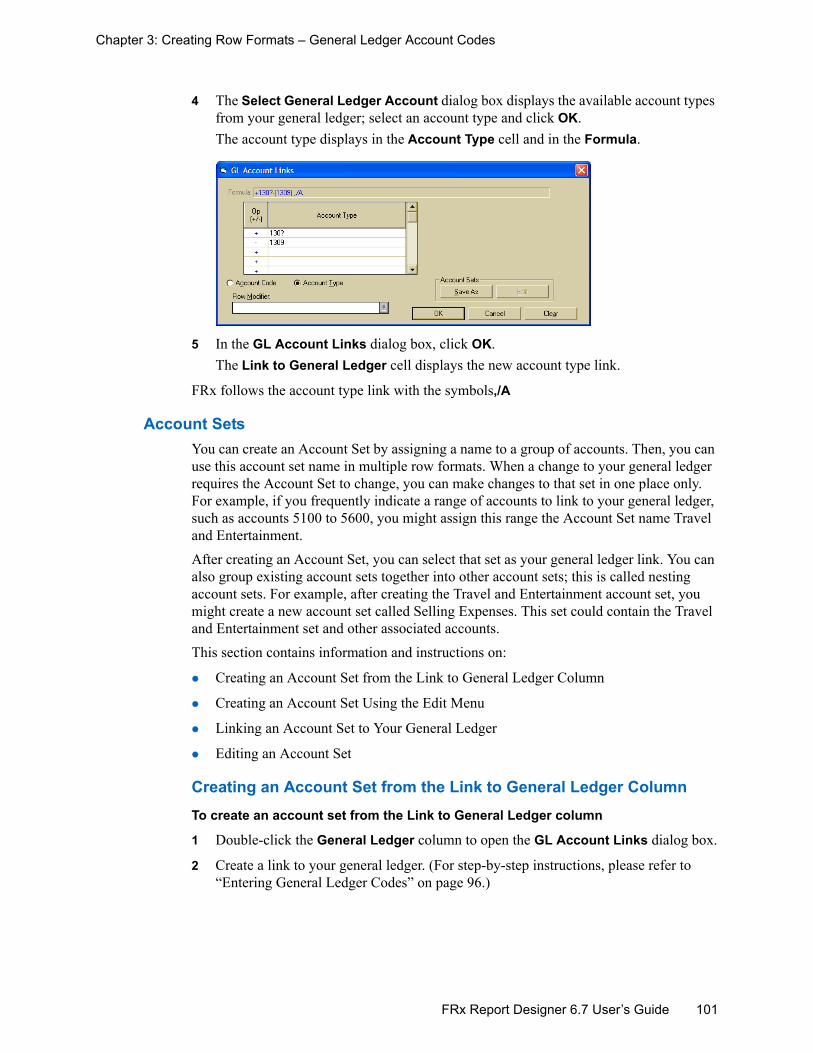
101FRx Report Designer 6.7 User’s Guide
Chapter 3: Creating Row Formats – General Ledger Account Codes
4 The Select General Ledger Account dialog box displays the available account types from your general ledger; select an account type and click OK.The account type displays in the Account Type cell and in the Formula.
5 In the GL Account Links dialog box, click OK.The Link to General Ledger cell displays the new account type link.
FRx follows the account type link with the symbols,/A
Account Sets You can create an Account Set by assigning a name to a group of accounts. Then, you can use this account set name in multiple row formats. When a change to your general ledger requires the Account Set to change, you can make changes to that set in one place only. For example, if you frequently indicate a range of accounts to link to your general ledger, such as accounts 5100 to 5600, you might assign this range the Account Set name Travel and Entertainment.After creating an Account Set, you can select that set as your general ledger link. You can also group existing account sets together into other account sets; this is called nesting account sets. For example, after creating the Travel and Entertainment account set, you might create a new account set called Selling Expenses. This set could contain the Travel and Entertainment set and other associated accounts.This section contains information and instructions on:
Creating an Account Set from the Link to General Ledger Column
Creating an Account Set Using the Edit Menu
Linking an Account Set to Your General Ledger
Editing an Account Set
Creating an Account Set from the Link to General Ledger ColumnTo create an account set from the Link to General Ledger column
1 Double-click the General Ledger column to open the GL Account Links dialog box.
2 Create a link to your general ledger. (For step-by-step instructions, please refer to “Entering General Ledger Codes” on page 96.)

102FRx Report Designer 6.7 User’s Guide
Chapter 3: Creating Row Formats – General Ledger Account Codes
3 Click the Save As button under the Account Sets options to display the Save As Account Set dialog box.
4 Type a name and description for the account set, and then click OK.When you return to the GL Account Links dialog box, you see the word SET followed by the account set name in parentheses. For example, +SET(Expense).
Creating an Account Set Using the Edit MenuTo create an account set using the Edit menu or right-click
1 On the Edit menu, click Account Sets or right-click and select Account Sets to display the Account Sets dialog box.
If there are existing account sets, click New after the Account Sets dialog box appears.
2 Create a link to your general ledger. (For step-by-step instructions, please see “Entering General Ledger Codes” on page 96.)
3 Select Yes from the Acct Set cell box by clicking on it.
4 Click the Account Set Name box and type a name for the account set.The account set name you enter here will appear in the Link to General Ledger column of the Row Format window.

103FRx Report Designer 6.7 User’s Guide
Chapter 3: Creating Row Formats – General Ledger Account Codes
5 If you want to add an alternate name or more detailed description for the account set, click the Description box and type a name or description in this optional box. The description you type here appears in the Description column of the Row Format window.
6 From the Account Sets control box, click Save.
7 When you are finished creating the account set, click Close.Once you create your account set, you need to link it to your general ledger.
Linking an Account Set to Your General LedgerTo link an account set to your general ledger
1 Double-click the Link to General Ledger column to open the GL Account Links dialog box.
2 Click the Acct Set box to change the account set indicator to Yes.
3 Double-click a cell in the From Account (range) -or- Individual Account or Account Set column.
4 In the Select Account Set dialog box, select an account set and click OK.The selected account set appears in the Link to General Ledger column and the account set description appears in the Description column.
If changes occur to your account structure, you need to edit your existing account sets.
Editing an Account Set To edit an account set
1 Click to highlight the account set name.
2 From the Account Sets buttons, click Edit to display the GL Account Links dialog box.
3 Make the changes to the account set.
4 When you are finished making changes, click Save in the Account Sets record control box.
5 Click Close.
6 Click OK.
Using Account Modifiers Typically, when you select a specific account, FRx combines the account with the fiscal years, periods, and other information that you specify in the column layout. However, you might need to use different information (such as different fiscal periods) for specific rows. By adding account modifiers, which apply to every account in the row, you can change the nature or use of the specified accounts.

104FRx Report Designer 6.7 User’s Guide
Chapter 3: Creating Row Formats – General Ledger Account Codes
To use Account Modifiers
1 From the GL Account Links dialog box, click the Row Modifier arrow to display the Row Modifier dialog box.
2 From the Row Modifier dialog box, click the Account Modifier arrow to display the Select an Account Modifier zoom box.
3 To print a beginning balance for an account, select /BB. For example, if you entered 1420 in the From Account (range) -or- Individual Account or Account Set box and /BB in the Account Modifier box, the link to general ledger displays this:
1420, /BB
When you generate the report, the balance at the beginning of the period displays in the Current Period column, while the balance for the beginning of the year displays in the Year-to-Date column.
4 To specify a different period for every column in a row, place a slash (/) character in the Account Modifier box (for example, /-1 or /+3). If your column layout adjusts for each period by the modifier amount, and you want your reports to generate and adjust by period, you need to add this account modifier.For example, using /-1 as the account modifier pulls data for period 10 in a column layout that is currently pulling data for period 11. This applies to this row only.
5 To change Curr (current) to YTD (or vice versa) for every column in a row, enter C or Y.

105FRx Report Designer 6.7 User’s Guide
Chapter 3: Creating Row Formats – General Ledger Account Codes
For example, the following row format and report figures use the /Y account modifier to stack year-to-date balances below current balances.
Figure 3-27: Row Format Window with Year-to-Date Account Modifier
The following report illustrates the use of the /Y format code.
Figure 3-28: Year-to-Date Balances Below Current Balances
Combining Account ModifiersYou can combine the period offset account modifier with the current and year-to-date account modifiers. For example, if you use the code /C-2, FRx uses the current balance for the period that is two periods earlier than the period specified in the column layout. However, if you use the code /Y-1, FRx forces each column balance to use the year-to-date balance one period earlier than the other rows.
The /Y account modifier stacks the year-to-date balances below current balances in the report below.
The year-to-date totals appear below the Current Period Activity.
Fabrikam Works, Inc.Gross Profit Per Unit Sold
For the Month Ending June 30, 2004
Denver San Francisco CombinedRetail Wholesale Retail Wholesale Retail Wholesale Total Sales
CURRENT PERIOD ACTIVITY
Sales $135,293 $48,248 $122,666 $46,857 $257,959 $95,105 $353,064Cost of Goods Sold 105,698 33,101 95,711 35,008 201,409 68,109 269,518 Gross Profit 29,595 15,147 26,955 11,849 56,550 26,996 83,546
Total Units Sold 25,230 9,884 28,704 11,413 53,934 21,297 75,231
Gross Profit / Unit Sold 1.173 1.533 0.939 1.038 1.049 1.268 1.111
YEAR TO DATE ACTIVITY
Sales $766,930 $273,503 $695,354 $265,617 $1,462,284 $539,120 $2,001,404Cost of Goods Sold 599,164 187,636 542,553 198,449 1,141,717 386,085 1,527,802 Gross Profit 167,766 85,867 152,801 67,168 320,567 153,035 473,602
Total Units Sold 147,715 61,253 167,959 67,294 315,674 128,547 444,221
Gross Profit / Unit Sold 1.136 1.402 0.91 0.998 1.016 1.191 1.066

106FRx Report Designer 6.7 User’s Guide
Chapter 3: Creating Row Formats – General Ledger Account Codes
Figure 3-29 shows the effect of various account modifiers.
Figure 3-29: Report Displaying Results of Account Modifiers
Restricting Rows with Book Codes You can limit a row to an existing book code. However, you must have created a column layout that includes at least one GL-type column with a book code. In order for your reports to restrict the correct data, you must associate the restricted row format with the appropriate column layout in the report catalog.
You can select a book code restriction from the GL Account Links dialog box, or if you know the book code, add it directly into the Link to General Ledger column.
To add a book code restriction using the GL Account Links dialog box
1 Double-click the Link to General Ledger column to open the GL Account Links dialog box.
Note Any book code restriction you enter in a row will override those selected in the column layout for that row only.
April May June Account Current YTD Current YTD Current YTD
4100 4100 (979,053) (3,841,539) (996,275) (4,837,814) (1,019,266) (5,857,080)
4???+5??? 4??? +(5???) (79,371) (294,638) (81,363) (376,001) (82,615) (458,616)
4100 TO 4999 (4100 TO 4999) (258,172) (1,007,441) (263,252) (1,270,693) (269,347) (1,540,040)
1100 - Cash 1100 26,545 109,267 24,844 134,111 14,278 148,389
Account Modifier (G/L)
/Y (YTD Numbers in a current column) 4100, /Y (3,841,539) (3,841,539) (4,837,814) (4,837,814) (5,857,080) (5,857,080)
Can look at Previous periods for YTD (Y-1) 4100, /Y-1 (2,862,486) (2,862,486) (3,841,539) (3,841,539) (4,837,814) (4,837,814)
Can look at next periods for YTD (Y+2) 4??? +(5???), /Y+2 (458,616) (458,616) (543,441) (543,441) (629,681) (629,681)
/C (Current Numbers in a YTD Column) 4100, /C (979,053) (979,053) (996,275) (996,275) (1,019,266) (1,019,266)
Can look at Previous periods for Cur (C-2) 4100, /C-2 (955,055) (955,055) (965,452) (965,452) (979,053) (979,053)
Can look at next periods for both Cur + YTD (4100 TO 4999), +1 (263,252) (1,270,693) (269,347) (1,540,040) (275,078) (1,815,118)
/BB (Beg balance for the period or Year ) (4100 TO 4999), /BB (749,269) 0 (1,007,441) 0 (1,270,693) 0
Used for Cash Flow statements 1100, /BB 82,722 44,600 109,267 44,600 134,111 44,600
FilmWork DemoExample Modifiers
Fabrikam Works, Inc. Example Modifiers
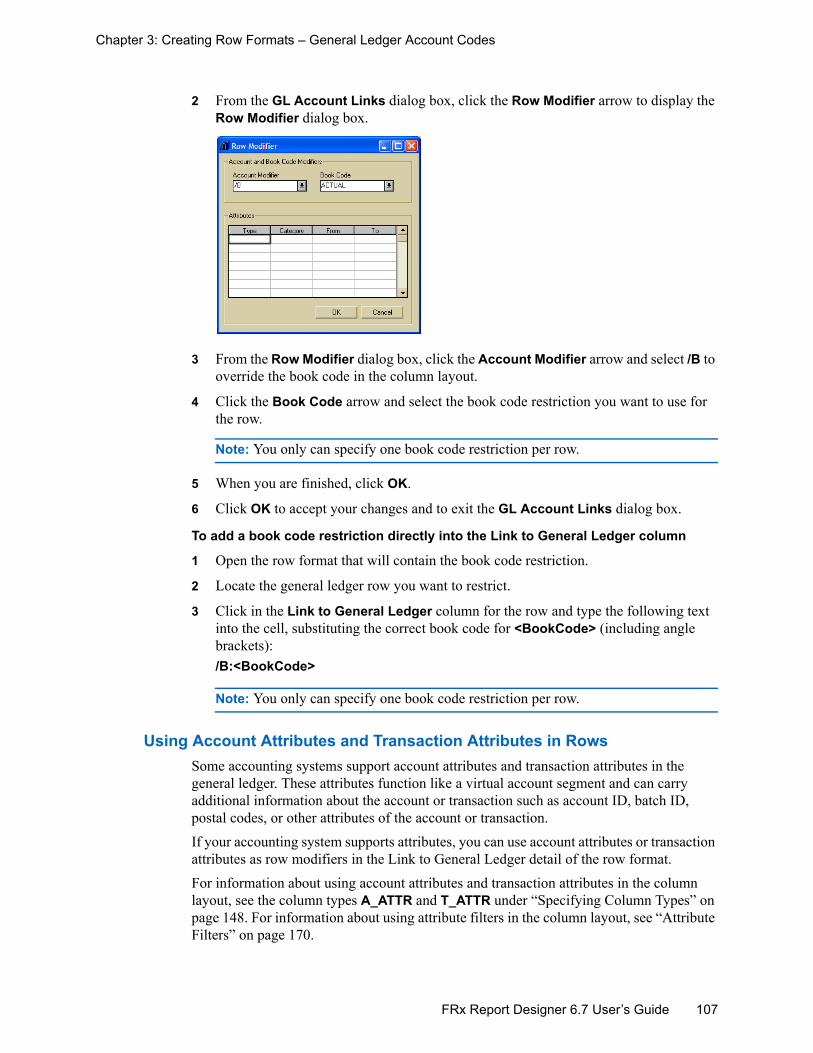
107FRx Report Designer 6.7 User’s Guide
Chapter 3: Creating Row Formats – General Ledger Account Codes
2 From the GL Account Links dialog box, click the Row Modifier arrow to display the Row Modifier dialog box.
3 From the Row Modifier dialog box, click the Account Modifier arrow and select /B to override the book code in the column layout.
4 Click the Book Code arrow and select the book code restriction you want to use for the row.
Note: You only can specify one book code restriction per row.
5 When you are finished, click OK.
6 Click OK to accept your changes and to exit the GL Account Links dialog box.
To add a book code restriction directly into the Link to General Ledger column
1 Open the row format that will contain the book code restriction.
2 Locate the general ledger row you want to restrict.
3 Click in the Link to General Ledger column for the row and type the following text into the cell, substituting the correct book code for <BookCode> (including angle brackets):/B:<BookCode>
Note: You only can specify one book code restriction per row.
Using Account Attributes and Transaction Attributes in Rows Some accounting systems support account attributes and transaction attributes in the general ledger. These attributes function like a virtual account segment and can carry additional information about the account or transaction such as account ID, batch ID, postal codes, or other attributes of the account or transaction. If your accounting system supports attributes, you can use account attributes or transaction attributes as row modifiers in the Link to General Ledger detail of the row format. For information about using account attributes and transaction attributes in the column layout, see the column types A_ATTR and T_ATTR under “Specifying Column Types” on page 148. For information about using attribute filters in the column layout, see “Attribute Filters” on page 170.

108FRx Report Designer 6.7 User’s Guide
Chapter 3: Creating Row Formats – General Ledger Account Codes
To add account or transaction attributes using the GL Account Links dialog box
1 Double-click the Link to General Ledger column to display the GL Account Links dialog box.
2 From the GL Account Links dialog box, click the Row Modifier arrow to display the Row Modifier dialog box.
3 From the Attributes section of the Row Modifier dialog box, double-click the cell in the Type column to display the Select Attribute Type dialog box.
4 From the Select Attribute Type dialog box, select an attribute type, then click OK.

109FRx Report Designer 6.7 User’s Guide
Chapter 3: Creating Row Formats – General Ledger Account Codes
5 From the Row Modifier dialog box, double-click the cell in the Category column to display the Select Attribute Category dialog box.
Note: The attribute categories displayed in the list will depend on your accounting system and the attribute type you selected in the previous step.
6 From the Select Attribute Category dialog box, select an attribute category, then click OK.
7 From the Row Modifier dialog box, double-click the cell in the From column to display the Select Attribute Value dialog box.
Note: The attribute values displayed in the list will depend on your accounting system and the attribute category you selected in the previous step.
Some attribute categories, such as date or amount, may not display a list of values. You can type the date or amount values in the From and To cells to define the range of attribute values.
8 From the Select Attribute Value dialog box, select the beginning attribute value in the range, then click OK.
9 From the Row Modifier dialog box, double-click the cell in the To column to display the Select Attribute Value dialog box.
10 From the Select Attribute Value dialog box, select the ending attribute value in the range, then click OK.

110FRx Report Designer 6.7 User’s Guide
Chapter 3: Creating Row Formats – General Ledger Account Codes
11 From the Row Modifier dialog box, click OK.The GL Account Links dialog box appears, with the account or transaction attributes in the Row Modifier box and displayed in the Formula box.
12 From the GL Account Links dialog box, click OK to return your selections to the Row Format window.

111FRx Report Designer 6.7 User’s Guide
Chapter 3: Creating Row Formats – Assigning Currency Codes
Assigning Currency Codes For international reporting, you can assign currencies in the row format and the column layout. For the best performance, we recommend that you assign the currency codes in the column layout. Currency codes in the row format override the column layout currency code selections. These currency overrides provide additional flexibility but may decrease the performance of FRx. For more information on assigning currency codes in the column layout, see “Formatting Multicurrency Reports” on page 167.
To assign currencies in the row format
1 On the File menu, point to Open, and then click Row.
2 In the Open Row dialog box, double-click the row format that you want to assign currencies to.
3 Find the row that you want to assign a different currency and click the Link to General Ledger cell of that row. The account codes and formula used for this row appear in the edit bar.
4 In the edit bar, click the end of the formula and enter the following text:, /{CURRENCY_CODE}
Replacing CURRENCY_CODE with a specific currency code or ? to include all currency codes that exist for the accounts.
5 Repeat steps 3 and 4 for each row that you want to assign a different currency.

112FRx Report Designer 6.7 User’s Guide
Chapter 3: Creating Row Formats – Automatic Rounding for Balance Sheets
Automatic Rounding for Balance Sheets When amounts are rounded to whole dollars, thousands, or millions, totals may be out of balance. Refer to the following table to see how rows are rounded.
InTable 3-6, the total of rows 100 and 200 differ when rounding is turned on. When you use the rounding option in a balance sheet report, you can use the row format rounding adjustment feature. This feature balances balance sheets when you select report rounding in the Catalog of Reports window.Using the rounding adjustment feature, you identify specific row codes in the Rounding Adjustment dialog box that FRx uses to adjust the report balance. These row codes must be linked directly to your general ledger. In other words, the row must have an account code in its Link to General Ledger column. Do not reference a description, calculated, or totaled row.
To adjust rounding in balance sheet reports
1 Open the row format you want to adjust.
2 On the Edit menu, click Rounding Adjustments to display the Rounding Adjustments dialog box.
3 In the Rounding Adjustment row box, enter the row code that you want adjusted to balance the balance sheet.
Note: You can enter descriptive (for example, TOTAL_ASSETS) or numeric (for example, 110) row codes in this dialog box. However, the row codes that you enter must be valid row codes in order for the rounding adjustment to work.
4 In the Total Assets row box, enter the Total Assets row code.
5 In the Total Liabilities & Equity row box, enter the Total Liabilities and Equity row code.
Row Code Amounts without rounding
Amount with rounding to whole thousands
100 3,600 4
200 3,700 4
TOTAL 7,300 8
Table 3-6: Rounding in Balance Sheets

113FRx Report Designer 6.7 User’s Guide
Chapter 3: Creating Row Formats – Automatic Rounding for Balance Sheets
6 In the Adjustment Amount Limit box, enter the limit (expressed as a positive whole number) that you want to place on automatic adjustments. FRx compares this amount with the absolute value of the actual rounding difference.When you generate your report, if the Rounding Adjustment row value decreases or increases beyond the defined Adjustment Amount Limit, a message appears.
Note: FRx applies the adjustment limit based on the Rounding of Amounts option that you select in the Catalog of Reports. For example, if you select to round your report to thousands and enter 2 in the Adjustment Amount Limit, FRx displays a warning message when the Rounding Adjustment row value increases or decreases by more than $2,000.
7 Click OK.The amounts in your balance sheet will balance even when rounding is turned on.For additional information on rounding, refer to “Rounding of Amounts” on page 263.

114FRx Report Designer 6.7 User’s Guide
Chapter 3: Creating Row Formats – Automatic Rounding for Balance Sheets

115
Chapter 4
FRx Report Designer 6.7 User’s Guide
Linking to Other Sources ofInformation
Linking increases reporting flexibility by allowing you to link to other sources of information within the same row format or across multiple row formats. You can link to several sources of information in your reports including:
General ledger accounts
Other row formats
External worksheets like Lotus 1-2-3 or Microsoft® Excel
Year-to-year changes in account codesThis chapter includes complete instructions for creating these links.
Creating Summary Reports Using Row Links116
Establishing Links . . . . . . . . . . . . . . . . 121
Linking to External Worksheets . . . . . . 124

116FRx Report Designer 6.7 User’s Guide
Chapter 4: Linking to Other Sources of Information – Creating Summary Reports Using Row Links
You can create a row format that pulls information from another row format, and that format, in turn, uses general ledger accounts to draw data from your accounting system.When used in conjunction with a reporting tree, linking allows each unit in the tree to use a different row format. This means that each unit can pull in different account code structures or data sources (general ledger or external worksheet), as well as different report presentations (summary versus detail or unique fonts).Reports can be summarized and displayed in unlimited ways Using the reporting tree, you can stack reports up to nine levels deep.In addition to linking to other row formats and external worksheets, you can also define links to other fiscal years. This is particularly useful for generating comparative reports when your general ledger coding conventions have changed from year to year.This section contains information and instructions on:
Creating Summary Reports Using Row Links
Establishing Links
Linking to External Worksheets
Creating Summary Reports Using Row Links One of the greatest strengths of FRx® Report Designer is its ability to summarize data from one row format to another. This allows you to create detailed reports directly from the account data in your general ledger, and then combine or summarize this detail in different summary reports.You can create a master row format, and then use it as a source for other reports. Row linking reduces the setup and maintenance time for detail and summary level reports. For example, you can:
1 Create a master row format that links to the general ledger.
2 Create a new row format for a balance sheet and income statement linked to the master row format.
3 Create a row format for a summarized balance sheet linked to the detail balance sheet.

117FRx Report Designer 6.7 User’s Guide
Chapter 4: Linking to Other Sources of Information – Creating Summary Reports Using Row Links
Figure 4-1 illustrates these general ledger, detail balance sheet-income statement, and summary balance sheet links.
Figure 4-1: Creating Summary Reports Using Links
This section contains information and instructions on:
Natural Row Format
DetlBSIS Row Format
SummryBS Row Format
Column Layout
Reporting Tree
Detail Report
DetlBSIS
NATURAL row format
Summary Balance Sheet
SummryBS
Detl BSIS row format
Report:
Row Format:
Linked to:
Trial Balance
Natural
General Ledger

118FRx Report Designer 6.7 User’s Guide
Chapter 4: Linking to Other Sources of Information – Creating Summary Reports Using Row Links
Natural Row Format The Natural row format shown in Figure 4-2 links to the asset accounts in the general ledger.
Figure 4-2: Asset Accounts in Natural Row Format
DetlBSIS Row FormatThe DetllBSIS row format links to the Natural row format. The following figure shows how asset account balances from row codes 100 to 799 of the Natural row format are incorporated into the assets portion of the detailed balance sheet. The link is established by selecting the row format option in the Link Type box in the Links dialog box.In the following figure, row 100 in the DetlBSIS row format links to rows 100 to 199 of the Natural row format. Report Designer adds the values that were accumulated in rows 100 to 199 in the Natural row format and places the total in row 280 of the DetlBSIS row format.
Figure 4-3: Detailed Balance Sheet Data in DetlBSIS Row Format
These rows link to ranges of rows, adding the values and placing them here.
When you use the Row Fmt Codes PB (New Page - Balance Sheet), you must use the Column Layout Print Control option BS (Column is Balance Sheet Column in Mixed IS/BS Report) under the YTD Column so the balance sheet prints correctly.
Amount information is being pulled from the NATURAL row format.

119FRx Report Designer 6.7 User’s Guide
Chapter 4: Linking to Other Sources of Information – Creating Summary Reports Using Row Links
SummryBS Row FormatThe SummryBS row format for the summary balance sheet links to the DetaillBSIS row format, again using the row format option in the Link Type box in the Links dialog box.In the following figure, row 100 of the SummryBS row format has the same value as row 490 of the DetlBSIS row format.
Figure 4-4: Summary Balance Sheet Data in SmmaryBS Row Format
Column Layout All three reports must use the same column layout such as the Curr_YTD Column Layout shown in Figure 4-5.
Figure 4-5: Current Year-to-date Column Layouts Window
In addition, the DetlBSIS row format, requires that you use the Print Control Option BS (Column is Balance Sheet Column in Mixed IS/BS Report) under the YTD Column. This option is required because the DetlBSIS row format uses the PB (Page Break) as a format code. Using these two codes tells Report Designer to print the consolidated Balance Sheet.
This row 100 has the same value asrow 490 in the DetlBSIS row format.
Amount information is being pulled from the DetlBSIS row format.

120FRx Report Designer 6.7 User’s Guide
Chapter 4: Linking to Other Sources of Information – Creating Summary Reports Using Row Links
Reporting TreeAll three reports can use a reporting tree like the one shown in Figure 4-6.
Figure 4-6: Row Linking in Reporting Trees Window
Note the following important points about the reporting tree:
The account mask is used only in the lowest level of the tree because the Natural unit code is the only one that uses a row format (Natural) that draws information from the general ledger.
The hierarchy of reporting units in the reporting tree must match the links within the row formats.
The middle unit in the tree (Detail B/S & I/S) uses the DetlBSIS row format, which is linked to the Natural row format. That is, this unit gets information from the Natural row format rather than from the general ledger.
The highest unit in the tree (Summary B/S) uses the SummryBS row format, which is linked to the DetlBSIS row format. This unit gets information from the DetlBSIS row format rather than from the general ledger.
If the reporting units in the tree are not matched properly to the row formats, you may get the following error message.
Figure 4-7: Report Designer Reporting Engine Error Message
When you generate the report from the Catalog of Reports using the row format, column layout, and reporting tree, you get three separate reports while only accessing the general ledger once. See Figure 4-1 on page 117.
Summary B/S uses the SummryBS row format that links to the DetlBSIS row format.
Detail B/S & I/S uses the DetlBSIS row format that links to the Natural row format.
Fabrikam Works Natural uses the Natural row format that links to the general ledger. Notice the account mask.

121FRx Report Designer 6.7 User’s Guide
Chapter 4: Linking to Other Sources of Information – Establishing Links
Establishing LinksAll links are defined from the Row Format window. Most row formats that use general ledger account codes are created by automatic transfer from the chart of accounts. You can also create a new row format by selecting New from the File menu. In both cases, Report Designer automatically creates a link to the general ledger by default. You can have a maximum of 19 link columns within a row format.To create links in the Row Format window, you use the Links dialog box shown in Figure 4-8.
Figure 4-8: Links Dialog Box
In the Link Type box, you select the type of link to create, such as row format, external worksheet, or XBRL. For more information on linking to worksheets, see “Using a Combined Worksheet Link” on page 128, and “Using a Separate Worksheet Link” on page 130.Use the General Ledger Year box to create multiple general ledger link columns to the appropriate year. General ledger link columns are useful when creating year-to-year comparative reports and the general ledger account coding changes from one year to the next. Report Designer uses this link for that fiscal year, as well as any earlier years, unless there is already a link for an earlier year. This section contains information and instructions on:
Creating Row Formatting Links
Linking Rows to a Summary Report

122FRx Report Designer 6.7 User’s Guide
Chapter 4: Linking to Other Sources of Information – Establishing Links
Creating Row Formatting Links To create links
1 From the FRx Control Panel, open a row format or select a new one.
2 On the Link menu, click Open Link Window to display the Links dialog box.
Note: You can also open the Links dialog box by clicking the Link Form icon or double-clicking the Link to General Ledger column heading.
3 Click the Link Type arrow and select one of the following links:General Ledger (Link Type G)Row Format (Link Type R)External Worksheet (for example, Lotus 1-2-3 or Microsoft Excel) (Link Type W)
Note: Report Designer can import Microsoft Excel .xls files and Lotus .wks, .wk1, or .wk3 files.
GL + WorkSheet (Link Type B)XBRL Taxonomy Files (Link Type X)
4 In the Link Name box, accept the name assigned by Report Designer or type another name to identify the link. (Report Designer assigns names sequentially, for example, GL1, ROW1, GL2, ROW2.)

123FRx Report Designer 6.7 User’s Guide
Chapter 4: Linking to Other Sources of Information – Establishing Links
5 Then, use one the following options:
6 In the Optional Description box, as needed, type a description of the link. This information appears in the Link column header description.
7 If you selected a general ledger link, use one of the following options:
8 Click Save to save the new link information.
9 As needed, you can click Delete to delete the currently displayed link, New to create a new link, or Find to select another link to edit.
10 Click Close to close the Links dialog box.
Linking Rows to a Summary Report To link rows to a summary report
1 Create the necessary row formats, as described under “Creating Row Formatting Links” on page 122.
If Then
You selected General Ledger in the Link Type box
Go to step 6.
You selected Row Format in the Link Type box
Click the Source Row Format arrow and select a row format for the link.
You selected External Worksheet in the Link Type box
Go to step 6.
You selected GL + Worksheet in the Link Type box
Click the Worksheet File Name arrow and type or select the worksheet name.
You selected XBRL in the Link Type box
Click the XBRL Taxonomy Files arrow and type or select the XBRL file.
For more information, see “Using Extensible Business Reporting Language (XBRL)” on page 285.
To Do this
Create a year-to-year general ledger link
In the General Ledger Year box type a year.
Use the same account codes for all years
Leave the General Ledger Year box blank.

124FRx Report Designer 6.7 User’s Guide
Chapter 4: Linking to Other Sources of Information – Linking to External Worksheets
2 From the FRx Control Panel, on the File menu, open a tree.
3 In the Row Format column (I) of the reporting tree, select the row format to use for the link.
Note: If you specify a row format for one branch of the tree, you must specify a row format for all branches in the tree.
4 To link specific rows from the row format to the summary report, type the row codes in the reporting tree Row Link column (Q). When you type the row codes, specify a range of row codes (100 TO 300) or individual rows (100+120-130) but not both.
5 Click Save to link your rows.
6 In the Catalog of Reports Building Blocks tab, select the Use row format(s) and Worksheet Links from Reporting Tree check box for this report.
Linking to External Worksheets Report Designer lets you extend your financial reporting capabilities with Microsoft Excel or Lotus 1-2-3. You can import data from one of these programs and combine that data with data from your general ledger. For example, you can import budget figures from a worksheet and then create a report that compares actual figures from the general ledger to the budget figures from the worksheet.External worksheet data can be accessed in two ways: a combined worksheet link, or a separate worksheet link.
The easiest method, a combined worksheet link, combines external worksheet cell references in the same link column as your general ledger account codes. When you do this, some rows in a given column of your report contain general ledger information while other rows in that same column contain worksheet data. This is the preferred method when you are importing limited amounts of data (such as work hours, headcount, or units sold) and when associating the data with a particular unit in the reporting tree is not required.
You can use a separate worksheet link to access multiple rows and columns of worksheet data and associate one or more external worksheets with one or more reporting units in the reporting tree. You create a special column in the row format that links to the worksheet cell addresses, and then add the worksheet file names to the reporting tree.
This section contains information and instructions on:
Referencing External Worksheet Cells
Note Linking to spreadsheets that have identical layouts reduces the number of link columns required in the row format and reduces maintenance time.

125FRx Report Designer 6.7 User’s Guide
Chapter 4: Linking to Other Sources of Information – Linking to External Worksheets
Identifying Individual Worksheet Cells
Automatic Matching of Worksheet Columns to the Current Period
Using a Combined Worksheet Link
Using a Separate Worksheet Link
Referencing External Worksheet Cells Because the column layout is defined separately from the row format, you must determine which Report Designer columns receive the worksheet data. You should have a copy of the column layout you will use as well as the referenced worksheet in the row format.
When referring a particular worksheet in a workbook, be sure the worksheet name is at least two characters, for example, [workbook.xls]AA.
When referring to a worksheet cell address, use the column letter and row number reference, such as C10 (column C, row 10). Report Designer does not support range labels. When referring to a specific sheet in a Lotus worksheet, use the sheet letter in addition to the column letter and row number reference. For example, use A:C10, where A: represents the sheet letter.
Identifying Individual Worksheet Cells In the row format, you can specify a series of worksheet cell addresses to place data in specific columns. Depending upon how your worksheet is organized, specify these addresses using one of the following methods:
Direct reference
Value placement
Direct column placement
Direct Reference The most direct way to reference a cell from an external worksheet is to type @WKS, followed by the column code to receive the cell followed by an equal sign (=)
Note Report Designer columns that accept external worksheet data are those identified in the column layout as GL or WKS. If you place a worksheet cell in a CALC, DESC, or FILL column, the value is ignored.

126FRx Report Designer 6.7 User’s Guide
Chapter 4: Linking to Other Sources of Information – Linking to External Worksheets
and the worksheet cell itself. The cell references must be enclosed in parentheses. See “Format Conventions” on page 129 for examples.
For example, to place the information contained in cell B10 of your worksheet into column D of your report, your link would be
@WKS (D=B10).
You can also place external worksheet cells in several Report Designer columns by typing multiple Report Designer column/worksheet cell references, like this:
@WKS (D=B10, E=B11, F=B12)
Value PlacementThis method allows you to type a list of cell addresses that are automatically placed into valid columns (GL or WKS columns) and skip any invalid columns. Simply specify cell addresses separated by spaces. For example, the amounts corresponding to the cell addresses in the list
A12 A13 B23 C118
are placed into the first columns that are GL or WKS columns.
Direct Column Placement (Common Method)Use this method if your worksheet is arranged exactly like your proposed Report Designer report. Specify the column to receive data by listing worksheet cells separated by commas. For example, assume you are using a Report Designer column layout that has six columns: columns A through F, where C is a Description column and E is a Calculation column. To place four worksheet cells into the remaining columns, you would type the cell addresses as:
A12, A13,, B23,, C118
Note the extra commas in the above list. Each comma corresponds to a Report Designer column. In the example, the cells match up like this:
Note You cannot combine worksheet cells through a formula and then place the results in a report. You can, however, place different cell references on consecutive rows in Report Designer and present the total in a report.
Report Designer Column
A B C D E F
Worksheet Cell A12 A13 - B23 - C118
Note After you code the worksheet cell addresses into a row format, try not to insert or delete rows or columns in the external worksheet. If you do, the worksheet cell reference changes and your Report Designer links will be incorrect.

127FRx Report Designer 6.7 User’s Guide
Chapter 4: Linking to Other Sources of Information – Linking to External Worksheets
Automatic Matching of Worksheet Columns to the Current PeriodUse one of the following methods to link to worksheets that cover multiple reporting periods:
Column Period Offset (CPO)
Row Period Offset (RPO)
Column Period Offset (CPO)If the worksheet you are linking to has multiple columns that represent different periods (such as a worksheet with a 12-month detailed budget forecast), you can use the /CPO (Column Period Offset) switch. This tells Report Designer to match the accounting periods in the column layout with the appropriate columns in the worksheet. You can use this technique with either worksheet link method.To use the /CPO switch, type the cell address that points one column to the left of the first period (column) in the worksheet for the given row; then, add the /CPO switch at the end of the cell address.Example of Linking to Multiple Columns with /CPO Switch
The worksheet shown in Figure 4-9 is used to link to a row format in Figure 4-10 to create a Gross Profit Per Unit report. This worksheet has monthly statistics in columns B through M.
Figure 4-9: Worksheet with Monthly Statistics
Row 430 in Figure 4-10 shows how to use the /CPO switch to link the columns from the worksheet.
Figure 4-10: Column Period Offset in Row Format Window
123456789
10111213141516171819202122
A B C D E F G H I J K L M NFabrikam Works, Inc.Units Sold
JAN FEB MAR APR MAY JUN JUL AUG SEP OCT NOV DEC TOTALUnits Sold Denver Wholesale 9,000 9,500 11,475 9,690 11,705 9,884 11,939 10,081 12,177 10,283 12,421 10,489 128,644 Retail 23,000 24,250 25,000 24,735 25,500 25,230 26,010 25,734 26,530 26,249 27,061 26,774 306,073 San Francisco Wholesale 11,000 10,970 11,248 11,189 11,473 11,413 11,702 11,641 11,936 11,874 12,175 12,112 138,735 Retail 25,000 27,589 28,973 28,141 29,552 28,704 30,144 29,278 30,746 29,863 31,361 30,460 349,811 Total Units 68,000 72,309 76,696 73,755 78,230 75,230 79,795 76,735 81,390 78,270 83,018 79,835 923,263
Year to Date
Units Sold Denver Wholesale 9,000 18,500 29,975 39,665 51,370 61,253 73,192 83,273 95,451 105,734 118,155 128,644 128,644 Retail 23,000 47,250 72,250 96,985 122,485 147,715 173,725 199,459 225,989 252,238 279,299 306,073 306,073 San Francisco Wholesale 11,000 21,970 33,218 44,407 55,880 67,294 78,996 90,637 102,574 114,448 126,623 138,735 138,735 Retail 25,000 52,589 81,562 109,703 139,255 167,959 198,102 227,380 258,126 287,990 319,351 349,811 349,811 Total Units 68,000 140,309 217,005 290,760 368,990 444,220 524,015 600,750 682,140 760,410 843,428 923,263 923,263

128FRx Report Designer 6.7 User’s Guide
Chapter 4: Linking to Other Sources of Information – Linking to External Worksheets
When you run a report for period 1, Report Designer uses the values in column B of the worksheet (January); for period 2, the values in column C of the worksheet (February), and so forth.Notice that all cells referenced (A7, A6, etc.) are one column to the left of the actual amounts you would like brought into your report.
Row Period Offset (RPO)If the worksheet you are linking to has multiple rows that represent different periods, you can use the /RPO (Row Period Offset) switch to match the column layout accounting periods with the appropriate worksheet rows. You can use this technique with either worksheet link method. To use the /RPO switch, enter the cell address that points one row above the first period (row) in the worksheet for a given column; then, add the /RPO switch at the end of the cell address.
Using Multiple WKS ColumnsIf you use either the /CPO or /RPO switch and you specify multiple WKS columns in the column layout, Report Designer matches an external worksheet column with each WKS column. In this case, you must place a value in the period cell of each WKS column. You can use a specific period (such as 6) or a relative period (such as B+2).For more information on adding a value to the period cell, see “Period Code” on page 152.
Using a Combined Worksheet Link You can include the worksheet cell references in the Link to General Ledger column of the row format if you:
Need to import only limited amounts of worksheet data from a single file
Do not need to use a reporting treeTo include worksheet cell addresses in the same link as your general ledger codes, you must first change the link type.
To change the link type
1 From the row format worksheet Link menu, select Open Link Window or click the Link Form icon in the toolbar to display the Links dialog box.
Note If more than one worksheet cell is referenced, the /CPO (or /RPO - discussed on the following page) is only displayed once, at the end of the worksheet cell listing. See row 430 in Figure 4-10 as an example.

129FRx Report Designer 6.7 User’s Guide
Chapter 4: Linking to Other Sources of Information – Linking to External Worksheets
2 In the Link Type box, change General Ledger to GL + Worksheet.
3 Accept the Report Designer default value in the Link Name box, or if you would like to use your own link naming system, type a new name.
4 In the Worksheet File Name box, click the arrow.
5 In the Worksheet File dialog box, type or select the worksheet to use and click Open.
6 To specify a specific worksheet, select one of the following options:
Note: Report Designer imports only the first sheet in a Lotus 1-2-3 WK3 spreadsheet. To select a different sheet, save the sheet as a separate WK3 file.
If you type a file without a full path, Report Designer uses the path defined for the default IO_Data directory in the Company Information dialog box. The file name appears by default in the Link to GL + Worksheet header description.
7 In the Optional Description box, you can type a description of the link.
8 Click Save.
9 Click Close.
Entering Worksheet Cell AddressesType the worksheet cell address in the Link to GL + Worksheet column along with the @WKS(x=) worksheet formula indicator, for example:
@WKS (B=A12,C=A13,D=A14)
The row format shown in Figure 4-10 on page 127 illustrates how to use a combined worksheet link.
Row 370 calculates gross profit.
Row 430 imports total units sold from the worksheet shown previously.
Row 490 calculates gross profit per unit sold by dividing row 370 by row 430.
Format ConventionsTake these rules into consideration when you use the combined link method:
Always specify the worksheet file name in the row format link.
Always begin the cell reference with the @WKS worksheet indicator; this tells Report Designer that this is a reference to an external worksheet and not a general ledger account.
To Do this
Specify a worksheet within a Microsoft Excel workbook
Type the workbook name in brackets followed by the worksheet name, for example:
[COMPBUDG.XLS]DENVER
To specify a sheet within a Lotus 1-2-3 WK1 spreadsheet
Type the spreadsheet name in brackets followed by the sheet letter.
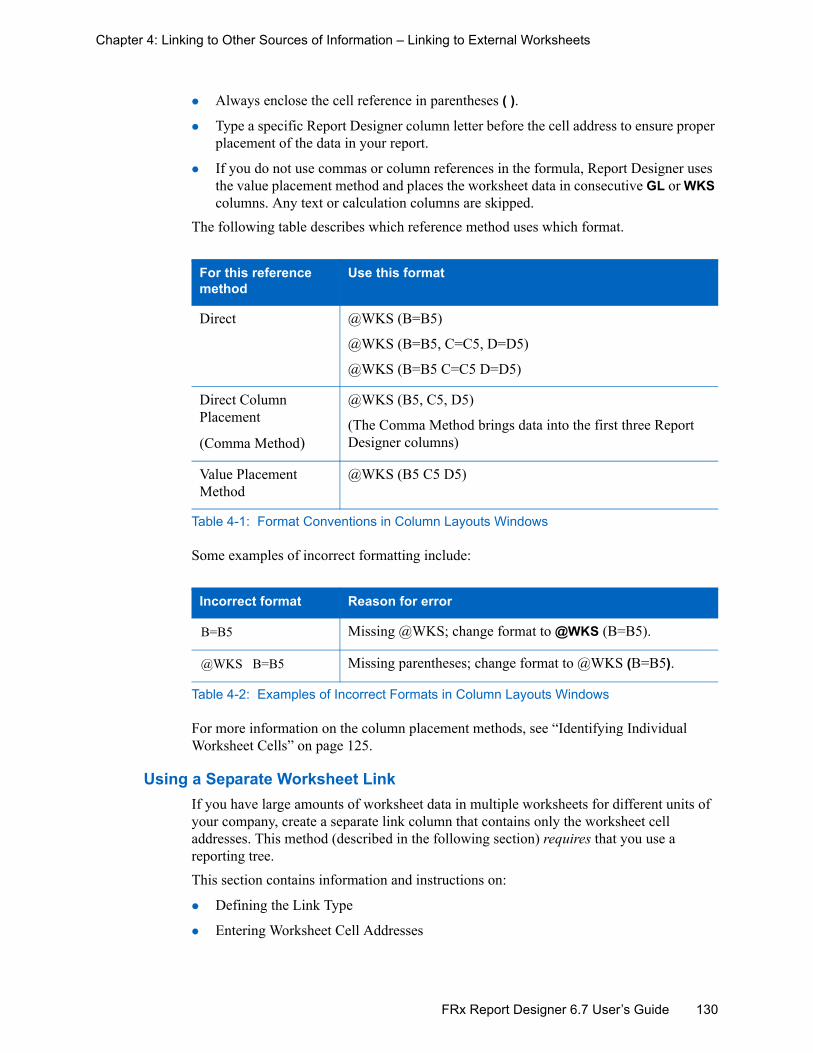
130FRx Report Designer 6.7 User’s Guide
Chapter 4: Linking to Other Sources of Information – Linking to External Worksheets
Always enclose the cell reference in parentheses ( ).
Type a specific Report Designer column letter before the cell address to ensure proper placement of the data in your report.
If you do not use commas or column references in the formula, Report Designer uses the value placement method and places the worksheet data in consecutive GL or WKS columns. Any text or calculation columns are skipped.
The following table describes which reference method uses which format.
Some examples of incorrect formatting include:
For more information on the column placement methods, see “Identifying Individual Worksheet Cells” on page 125.
Using a Separate Worksheet LinkIf you have large amounts of worksheet data in multiple worksheets for different units of your company, create a separate link column that contains only the worksheet cell addresses. This method (described in the following section) requires that you use a reporting tree.This section contains information and instructions on:
Defining the Link Type
Entering Worksheet Cell Addresses
For this reference method
Use this format
Direct @WKS (B=B5)
@WKS (B=B5, C=C5, D=D5)
@WKS (B=B5 C=C5 D=D5)
Direct Column Placement
(Comma Method)
@WKS (B5, C5, D5)
(The Comma Method brings data into the first three Report Designer columns)
Value Placement Method
@WKS (B5 C5 D5)
Table 4-1: Format Conventions in Column Layouts Windows
Incorrect format Reason for error
B=B5 Missing @WKS; change format to @WKS (B=B5).
@WKS B=B5 Missing parentheses; change format to @WKS (B=B5).
Table 4-2: Examples of Incorrect Formats in Column Layouts Windows

131FRx Report Designer 6.7 User’s Guide
Chapter 4: Linking to Other Sources of Information – Linking to External Worksheets
Identifying the Worksheet in the Reporting Tree
Setting Up the Catalog ID
Defining the Link Type This method requires that you create a new row format Link column.
To define a separate worksheet link
1 In the row format worksheet Link menu, select Open Link Window or click the Link Form icon to display the Links dialog box.
2 Click New to create a new link.
3 In the Link Type box, change General Ledger to External Worksheet.
4 Accept the Report Designer default value in the Link Name box, or if you would like to use your own link naming system, enter another name.
5 In the Optional Description box, you can optionally type a description of the link.This description displays in the row format Link column description and in the reporting tree Ext Link column.
6 Click Save.
7 Click Close.
Entering Worksheet Cell Addresses The steps for entering worksheet cell addresses for a separate link are the same as those discussed in “Entering Worksheet Cell Addresses” on page 129 with one exception. When you use a Link to Worksheet column, you do not need to enter @WKS before the cell references because the column refers only to a worksheet.

132FRx Report Designer 6.7 User’s Guide
Chapter 4: Linking to Other Sources of Information – Linking to External Worksheets
Example of Separate Worksheet Linking
The budget forecast worksheets for San Francisco, Denver, and Corporate Headquarters shown in Figure 4-11, Figure 4-12, and Figure 4-13 are linked to the row format in Figure 4-14 to report total compensation expenses.
Figure 4-11: Budget Forecast for San Francisco
Figure 4-12: Budget Forecast for Denver
Figure 4-13: Budget Forecast for Corporate Headquarters
A B C D E F G H I J K L M N1 Fabrikam Works, Inc.2 Budget Forecast: San Francisco34 Jan Feb Mar Apr May Jun Jul Aug Sep Oct Nov Dec Total5 Sales 202,941 207,000 211,140 215,363 219,670 224,063 228,545 233,115 237,778 242,533 247,384 252,332 2,721,8646 Sales Returns (3,521) (3,591) (3,663) (3,737) (3,811) (3,887) (3,965) (4,045) (4,125) (4,208) (4,292) (4,378) (47,223)7 Sales Discounts (11,737) (11,972) (12,211) (12,455) (12,705) (12,959) (13,218) (13,482) (13,752) (14,027) (14,307) (14,593) (157,418)8 Total Sales 187,683 191,437 195,265 199,171 203,154 207,217 211,362 215,589 219,901 224,299 228,785 233,360 2,517,2239 10 Cost of Goods Sold 116,500 118,830 121,207 123,631 126,103 128,625 131,198 133,822 136,498 139,228 142,013 144,853 1,562,50811 Gross Profit 71,183 72,607 74,059 75,540 77,051 78,592 80,164 81,767 83,402 85,070 86,772 88,507 954,71412 13 Salary Expense 30,910 31,528 30,000 30,000 30,000 30,000 30,000 30,000 31,000 31,000 31,000 31,000 366,43814 Commissions Expense 11,524 11,754 10,000 10,000 10,000 10,000 10,000 10,000 11,000 11,000 11,000 11,000 127,27815 Total Compensation 42,434 43,282 40,000 40,000 40,000 40,000 40,000 40,000 42,000 42,000 42,000 42,000 493,71616 17 Depreciation 2,500 2,550 2,601 2,653 2,706 2,760 2,815 2,872 2,929 2,988 3,047 3,108 33,52918 Office Expense 1,841 1,878 1,915 1,954 1,993 2,033 2,073 2,115 2,157 2,200 2,244 2,289 24,69219 Supplies 315 321 328 334 341 348 355 362 369 376 384 392 4,22520 Maintainence 620 632 645 658 671 685 698 712 726 741 756 771 8,31521 Rent 4,500 4,590 4,682 4,775 4,871 4,968 5,068 5,169 5,272 5,378 5,485 5,595 60,35322 Travel 4,075 4,157 4,240 4,324 4,411 4,499 4,589 4,681 4,775 4,870 4,967 5,067 54,65523 Advertising 3,359 3,426 3,495 3,565 3,636 3,709 3,783 3,858 3,936 4,014 4,095 4,176 45,05224 Total Other G&A 17,210 17,554 17,906 18,263 18,629 19,002 19,381 19,769 20,164 20,567 20,978 21,398 230,82125 26 Before Tax Income 11,539 11,770 12,005 12,245 12,490 12,740 12,995 13,255 13,520 13,790 14,066 14,347 143,223
A B C D E F G H I J K L M N1 Fabrikam Works, Inc.2 Budget Forecast: Denver34 Jan Feb Mar Apr May Jun Jul Aug Sep Oct Nov Dec Total5 Sales 230008 234608 239300 244086 248968 253947 259026 264207 269491 274881 280378 285986 30848866 Sales Returns -3850 -3927 -4006 -4086 -4167 -4251 -4336 -4422 -4511 -4601 -4693 -4787 -516377 Sales Discounts -12832 -13089 -13350 -13617 -13890 -14168 -14451 -14740 -15035 -15335 -15642 -15955 -1721048 Total Sales 213326 217593 221944 226383 230911 235529 240240 245045 249945 254944 260043 265244 28611479 10 Cost of Goods Sold 123700 126174 128697 131271 133897 136575 139306 142092 144934 147833 150790 153805 165907511 Gross Profit 89626 91419 93247 95112 97014 98954 100934 102953 105011 107111 109253 111439 120207312 13 Salary Expense 35800 36516 35000 35000 35000 35000 35000 36000 36000 36000 36000 36000 42731614 Commissions Expense 13972 14251 12000 12000 12000 12000 12000 13000 13000 13000 13000 13000 15322315 Total Compensation 49772 50767 47000 47000 47000 47000 47000 49000 49000 49000 49000 49000 58053916 17 Depreciation 2355 2402 2450 2499 2549 2600 2652 2705 2759 2814 2871 2928 3158418 Office Expense 1782 1818 1854 1891 1929 1967 2007 2047 2088 2130 2172 2216 2390119 Supplies 350 357 364 371 379 386 394 402 410 418 427 435 469320 Maintenance 550 561 572 584 595 607 619 632 644 657 670 684 737521 Rent 4675 4769 4864 4961 5060 5162 5265 5370 5478 5587 5699 5813 6270322 Travel 3700 3774 3849 3926 4005 4085 4167 4250 4335 4422 4510 4600 4962323 Advertising 3666 3739 3814 3890 3968 4048 4129 4211 4295 4381 4469 4558 4916824 Total Other G&A 17078 17420 17767 18122 18485 18855 19233 19617 20009 20409 20818 21234 2290472526 Before Tax Income 22776 23231 23696 24170 24653 25146 25649 26162 26686 27219 27764 28320 305472
A B C D E F G H I J K L M N1 Fabrikam Works, Inc.2 Budget Forecast: Headquarters34 JAN FEB MAR APR MAY JUN JUL AUG SEP OCT NOV DEC TOTAL5 Officers' Comp 25,000 25,250 25,503 25,758 26,015 26,275 26,538 26,803 27,071 27,342 27,616 27,892 317,0636 7 Other G&A Expense 2,000 2,020 2,040 2,061 2,081 2,102 2,123 2,144 2,166 2,187 2,209 2,231 25,3648 9 Interest Income 228 230 233 235 237 240 242 244 247 249 252 254 2,891
10 Interest Expense 1,125 1,136 1,148 1,159 1,171 1,182 1,194 1,206 1,218 1,230 1,243 1,255 14,26711 Total Other Inc/(Exp) (897) (906) (915) (924) (934) (942) (952) (962) (971) (981) (991) (1,001) (11,376)1213 Net Inc Before Tax (27,897) (28,176) (28,458) (28,742) (29,030) (29,320) (29,613) (29,909) (30,208) (30,511) (30,816) (31,124) (353,804)1415 Income Tax Expense 24,000 25,000 25,000 25,000 27,000 27,000 27,000 29,000 29,000 29,000 30,000 30,000 327,0001617 Net Income/(Loss) (28,944) (29,233) (29,526) (29,821) (30,119) (30,420) (30,725) (31,032) (31,342) (31,656) (31,972) (32,292) (367,082)
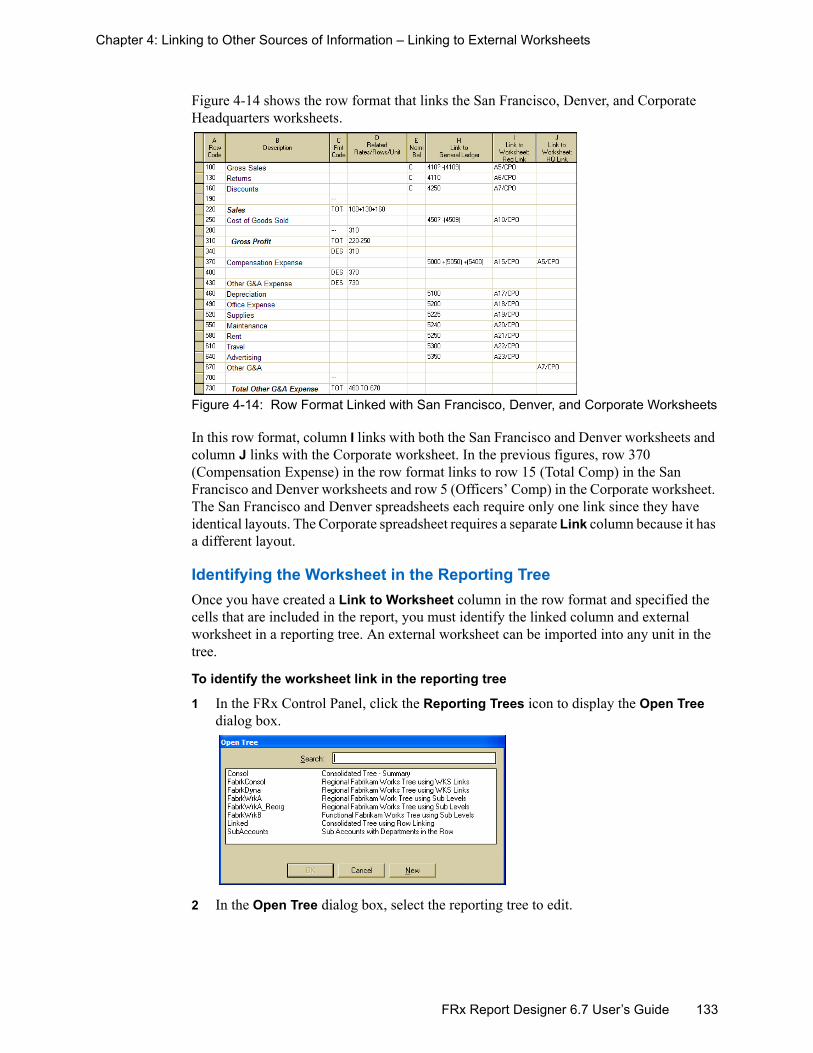
133FRx Report Designer 6.7 User’s Guide
Chapter 4: Linking to Other Sources of Information – Linking to External Worksheets
Figure 4-14 shows the row format that links the San Francisco, Denver, and Corporate Headquarters worksheets.
Figure 4-14: Row Format Linked with San Francisco, Denver, and Corporate Worksheets
In this row format, column I links with both the San Francisco and Denver worksheets and column J links with the Corporate worksheet. In the previous figures, row 370 (Compensation Expense) in the row format links to row 15 (Total Comp) in the San Francisco and Denver worksheets and row 5 (Officers’ Comp) in the Corporate worksheet. The San Francisco and Denver spreadsheets each require only one link since they have identical layouts. The Corporate spreadsheet requires a separate Link column because it has a different layout.
Identifying the Worksheet in the Reporting TreeOnce you have created a Link to Worksheet column in the row format and specified the cells that are included in the report, you must identify the linked column and external worksheet in a reporting tree. An external worksheet can be imported into any unit in the tree.
To identify the worksheet link in the reporting tree
1 In the FRx Control Panel, click the Reporting Trees icon to display the Open Tree dialog box.
2 In the Open Tree dialog box, select the reporting tree to edit.

134FRx Report Designer 6.7 User’s Guide
Chapter 4: Linking to Other Sources of Information – Linking to External Worksheets
3 Click the reporting unit that imports your worksheet data, and then press F8 (or click Tree Form on the toolbar) to open the Reporting Units dialog box.
4 Under Optional Row Formats and Links, click the Row Format Name arrow to display the Choose a Row Format dialog box.
5 In the Choose a Row Format dialog box, select the row format with the worksheet link information and click OK.
6 Click the Wks Link arrow to display the Links for: dialog box.
7 Select the worksheet link and click OK.

135FRx Report Designer 6.7 User’s Guide
Chapter 4: Linking to Other Sources of Information – Linking to External Worksheets
8 Click the Wks File Name arrow to display the Select Import File dialog box.
9 In the Select Import File dialog box, type or select the worksheet file to import into this unit and click Open.
10 To specify a specific worksheet, select on of the following options:
Note: Report Designer imports only the first sheet in a Lotus 1-2-3 WK3 spreadsheet. To select a different sheet, save the sheet as a separate WK3 file.
If you type a file without a full path, Report Designer uses the path defined for the default IO_Data directory in the Company Information dialog box. The file name appears by default in the Link to GL + Worksheet header description.
11 Repeat steps 3 through 10 for every reporting unit that you want to receive worksheet data. Make sure that the worksheet file names are entered in the corresponding unit of the reporting tree to prevent incorrect data in your report.
To Do this
Specify a worksheet within a Microsoft Excel workbook
Type the workbook name in brackets followed by the worksheet name, for example:
[COMPBUDG.XLS]DENVER
To specify a sheet within a Lotus 1-2-3 WK1 spreadsheet
Type the spreadsheet name in brackets followed by the sheet letter.

136FRx Report Designer 6.7 User’s Guide
Chapter 4: Linking to Other Sources of Information – Linking to External Worksheets
12 In the Reporting Units dialog box, click OK to accept your changes and return to the Reporting Tree window.
Note: Remember to specify a row format for each reporting unit.
The worksheets are referenced in Ext File (T) and Ext Link (W) columns of the reporting tree.
Setting Up the Catalog ID After you create the reporting tree, you can set up and generate your report.
To set up the Catalog ID
1 From the FRx Control Panel, open the Catalog of Reports.
2 From the Catalog of Reports window, select the Use Row Format from Reporting Tree check box (in the Row Format section). This tells Report Designer to pull the row formats (and worksheet file names) from the reporting tree.
3 Generate your report.
Note If you do not specify a row format for each reporting unit in the tree, then Report Designer uses the identified row format (that appears dimmed in the Row Format box) for those units by default.

137
Chapter 5
FRx Report Designer 6.7 User’s Guide
Creating Column Layouts
In the column layout, you define the contents of your report columns, any calculations specific to your columns, and column headings within your report. The information in a column layout is combined with the information in a row format (and optionally, with reporting tree information) that you specify and store in the catalog of reports. Each column layout that you create can be combined with one or more row formats.A column layout can contain up to 255 separate columns such as descriptive text, general ledger or worksheet amounts, and calculations.
FRx® Report Designer uses the same spreadsheet technique for column layouts as for row formats. Enter columns across the page as you want them to appear on your reports.
Opening the Column Layout Window . 138
Column Layout Menu Functions . . . . . 140
Adding Column Headers . . . . . . . . . . . 143
Adding Column Detail . . . . . . . . . . . . . 147
Customizing Transaction Detail Reports173
Creating Tabular Reports . . . . . . . . . . . 177

138FRx Report Designer 6.7 User’s Guide
Chapter 5: Creating Column Layouts – Opening the Column Layout Window
Opening the Column Layout Window You can either create a new column layout and start building it from scratch, or you may prefer to open an existing column layout (such as one you previously created or those created using sample data) and modify the information in the column to create new column layouts.Report Designer supports up to 255 columns within one column format. For example, columns A through Z are followed by columns AA through AZ, and so forth.
To start a new column layout
1 On the File menu, point to New, and then click Column to display a blank Column Layout window.
To open an existing column layout
1 From the FRx Control Panel, click the Column Layouts icon to display a list of available column layouts in the Open Column dialog box.

139FRx Report Designer 6.7 User’s Guide
Chapter 5: Creating Column Layouts – Opening the Column Layout Window
2 Double-click a column layout to display the Column Layout window.
The column layout you selected displays in the window.

140FRx Report Designer 6.7 User’s Guide
Chapter 5: Creating Column Layouts – Column Layout Menu Functions
Column Layout Menu FunctionsWithin the Column Layout window, the File and Edit menus provide you with additional functions.This section contains information and instructions on the:
File Menu
Edit Menu
File Menu The following is the column layout File menu.
Figure 5-1: Column Layout File Menu
The options that are specific to column layouts are defined in the following table.
Note The menus described in this chapter are specific to the Column Layout window. For information about menus that appear in all Report Designer main windows, see “Defining Available Commands on Report Designer Menus” on page 18.
File Menu Commands Description
Rename Renames the column and description.
Delete Deletes a row, column, or tree.
Print Column Layout Prints the column layout.
Table 5-1: Menu Options for Column Layout

141FRx Report Designer 6.7 User’s Guide
Chapter 5: Creating Column Layouts – Column Layout Menu Functions
Edit Menu
Figure 5-2: Column Layout Edit Menu
The options that are specific to column layouts are defined in the following table.
Delete ColumnTo deletes one or more columns, do the following:
1 Click the gray box at the top of the column you want to delete.
2 Select Delete Column.To delete one or more consecutive columns, highlight the columns and select the Delete Column command.
A window asks you to confirm the deletion.
Edit Menu Command Description
Description Use to edit a column layout description. You can use upper- and lower-case letters, numbers, and spaces.
The Name and Specification Set boxes are display-only boxes. You cannot access or change them.
Note: You must save the column layout in order to save the description change.
Delete Column Deletes one or more columns as described in the steps following this table.
Insert Column Inserts one or more new columns as described in the steps following this table.
Zoom Opens a box-specific dialog box of valid values.
To display a zoom list, click the cell arrow or to use the keyboard, move the pointer to the cell and press F3.
Table 5-2: Edit Menu Options for Column Layout

142FRx Report Designer 6.7 User’s Guide
Chapter 5: Creating Column Layouts – Column Layout Menu Functions
Insert ColumnTo insert one or more new columns, do the following:
1 Click the gray box at the top of the column after which you want to insert a new column.
2 Select Insert Column. To insert more than one column, highlight the number of columns to be inserted and select the Insert Column command.
Report Designer adds the columns.

143FRx Report Designer 6.7 User’s Guide
Chapter 5: Creating Column Layouts – Adding Column Headers
Adding Column Headers Use the Column Headers portion of the Column Layout window to enter headers for that column. Enter each column header exactly as you want it to appear at the top of your column on the printed report. By default, Report Designer centers and underlines the description over the column.The default width of a Description column is 30 characters, while the default width of an Amount column—including cents, commas, and parentheses—is 14 characters. To accommodate long headers, Report Designer allows up to 20 rows of column headers. The column headers are different and separate from the report headers that you define in the Catalog of Reports window. The column headers apply to each column of data in your report. The report headers apply to the entire report.This section contains information and instructions on:
Creating Typical Headers
Creating Dynamic (Conditional) Headers
Creating Typical Headers Double-click a cell in the Column Headers row to display the Header Options dialog box (shown in Figure 5-3) and then define your column headers.
Figure 5-3: Headers Options Dialog Box
When you use the Header Options dialog box, you see the following selections.Cell textType text in this box or click Insert Code to select special codes.
Insert CodeUse one of the following codes listed in Table 5-3 to specify variable information (such as date or period number) in any header.You can combine more than one variable code in the same cell. Since codes rely on the calendar information from the Column Detail section, codes only work with GL, WKS, or CALC columns. When

144FRx Report Designer 6.7 User’s Guide
Chapter 5: Creating Column Layouts – Adding Column Headers
you use these code for CALC columns, you must complete the Base Year or Period fields.
Header Option Description
@Month This code prints the name of the current month in the heading. The name appears in upper- and lower-case unless you enter the code, in upper-case, as @MONTH, in which case the month appears in all caps.
The name of the month abbreviates to the first three characters in your report if you chose to round the amounts to thousands, millions, or billions or if you set the column width to less than nine characters. Otherwise, the month displays by default in the full name format.
@PER This code prints the numeric form of the fiscal period identified for that column. If the column spans multiple periods, the last period in the range prints.
@PERDESC This code prints the fiscal period description identified in the general ledger.
@YR This code prints the column’s fiscal year in numeric form.
@EDATE This code prints the column ending date in the Short Date format, as specified in the Amount & Date Format box of the Company Information dialog box.
For more information about setting the short date format, see “Entering and Editing Company Information” in your FRx® Report Designer 6.7 Administrator’s Guide.
@SDATE This code prints the column start date in the Short Date format specified, as in the Amount & Date Format box of the Company Information dialog box.
For more information about setting the short date format, see “Entering and Editing Company Information” in your FRx® Report Designer 6.7 Administrator’s Guide.
@MON This code prints the abbreviated month for the selected fiscal period. The abbreviation can appear in either upper- or lower-case; edit the code to reflect the desired case. For example, if you generate a report for the fiscal period ending in February and you use @MON as the column header, the header displays as FEB; if you use @Mon the header displays as Feb.
Table 5-3: Column Header Codes

145FRx Report Designer 6.7 User’s Guide
Chapter 5: Creating Column Layouts – Adding Column Headers
Font stylesUse this box to apply a different font style to your column header. For more information about formatting font styles, see “Font Styles” on page 260 of Chapter 7.
Format optionsUse this option for underlining text or adding a box around the header text.
Spread from/ToUse these boxes to define the columns over which you want to center the text. Enter the beginning column letter in the Spread From box and the ending column letter in the To box. Report Designer centers the text over this range of columns.
JustificationUse these options to align your headers in the column or spread.
To create column headers
1 Double-click the cell over the column that you want to describe to display the Header Options dialog box.
2 In the Cell text box, do one of the followingType the appropriate text.Click Insert Code and select the appropriate the code. See Table 5-3 on page 144 for detailed code descriptions.
3 Click the Font Styles arrow, and then double-click the font style to use for the column header.
4 To apply font styles across columns (for example, columns B to G), do the following:Select the header rows for the columns. Then, on the Column Layout window toolbar, click the Font Styles drop-down box on the toolbar.Select the style.
5 In the Spread from box, type the beginning column letter; and in the To box, type the ending column letter. Report Designer centers the text over this range of columns.
To use multiple header codes
1 Click Insert Code.
2 Select a code from the list.
3 Click OK.
4 Click Insert Code again and select another code from the list.

146FRx Report Designer 6.7 User’s Guide
Chapter 5: Creating Column Layouts – Adding Column Headers
You also can mix codes with text. For example, if you enter Period @PER-@YR from @SDATE to @EDATE, it results in a printed heading that looks like this:
Period 1-02 from 01/01/02 to 01/31/02
Creating Dynamic (Conditional) Headers You can create a report in which the column header changes dynamically. For example, if you use the conditional options (P>B, P<B, and so forth), you can design header options to reflect these changes by using the base period column as a starting or ending point for a header. For example, enter A TO BASE to center column A’s header over the column that corresponds to the base period at report generation time. The following are examples using Y, where Y is the last column in your column layout.
BASE TO Y
BASE+1 to YThe column layout in Figure 5-4 uses a base period column to illustrate dynamic headings.
Figure 5-4: Dynamic Headings in Column Layout Window
For a description of conditional columns, see “Print Control for Conditional Columns” on page 162.The following figure shows these dynamic headings as they appear in the resulting report.
Figure 5-5: Dynamic Headings in FRx Report
Fabrikam Works, Inc.Film Works Inc. - All Locations
Dynamic Full Year Actual - ForecastFor the Month Ending April 30, 2002
Actuals ForecastJanuary February March April May June July August September October November

147FRx Report Designer 6.7 User’s Guide
Chapter 5: Creating Column Layouts – Adding Column Detail
Adding Column Detail The remaining rows in the Column Layout window are called Column Detail rows. These rows define detail column information such as:
Column type (for example, general ledger, spreadsheet, or calculations)
Book Code (for example, actual or budget)
Fiscal year and period
Period or year-to-date balances
Calculation Formulas
Currency Display
Special Formatting and Print Control
Transaction Start and End Dates Figure 5-6 displays and describes the Column Detail rows.
Figure 5-6: Column Detail Rows
This section contains information and instructions on:
Specifying Column Types
Defining General Ledger Columns
Adding Calculation Formulas
Adding Special Formatting Options
Note If you prefer to use keyboard commands instead of the mouse, you can press Alt+Page Down to move from the column header rows to the column detail rows. Use Alt+Page Up to move from the column detail rows to the column header rows.
Column Detail Rows
Use these rows for GL Column Types
Use to define each column in your report
Special Format Options
Currency Formatting
Use for Calculation Formulas in Calc Columns
Restricts Data Display
Restrict Display of Reporting Units
Use with General Ledger and Reporting Units
Use to Restrict GL Data Restict GL Data to Specific DatesJustifies Column
DescriptionsUse for OLAP Report

148FRx Report Designer 6.7 User’s Guide
Chapter 5: Creating Column Layouts – Adding Column Detail
Adding Column Restrictions
Selecting a Reporting Unit
Formatting Multicurrency Reports
Account Filters
Attribute Filters
Restricting Columns to Specific Datess
Justification
Adding the OLAP Description to the Column Layout
Specifying Column Types The first Column Detail row is for specifying the column type. Double-click the cell in the Column Detail row to display the Select the Type of Column dialog box shown in Figure 5-7, and then select a column type.
Figure 5-7: Column Type Dialog Box
The following list describes each column type. GLSelect the GL code to display data from the general ledger. A GL column can also display external worksheet data when you use a Link to GL + Worksheet or Link to Worksheet column in the row format.
When you select GL, this places four default settings in the next four cells.
Figure 5-8: Column Detail for TYPE: GL
You can change these default settings as needed.

149FRx Report Designer 6.7 User’s Guide
Chapter 5: Creating Column Layouts – Adding Column Detail
CALCSelect this code to display the result of a simple or complex calculation. See “Adding Calculation Formulas” on page 155.
DESCSelect this code to place the row description you entered in the row format. Although this column is frequently the first one on the report, it can be placed anywhere.
ROWSelect this code to display the individual row codes from the Row Code column in the row format.
ACCTSelect this code to display the general ledger account codes that apply to each row. For account and transaction detail reports, the full account code prints. For financial reports (and high-level reports that may be a combination of several accounts), the GL link from the row format (for example, 1100 TO 1200) prints.
FILLSelect this code to fill the cell with a character that is enclosed in single quotes. If you don’t enter a character, Report Designer leaves the column blank. For example, to fill a column with periods (...), enter FILL ‘.’.
WKS
Select this code to display data pulled from an external worksheet (for example, Lotus 1-2-3 or Microsoft® Excel).
A_ATTRSelect this code to display the Account Attribute in the column. The account attribute must apply to a single full account, and extracts underlying account information from the general ledger, such as account ID, State, or Zipcode. The Account Attribute function must be supported by your accounting system. For information about using the Account Attribute in the row format, see “Using Account Attributes and Transaction Attributes in Rows” on page 107.
When you select A_ATTR as the column type, specify the Attribute Category in the Book Code/Attribute Category detail row of the column layout.
T_ATTRSelect this code to display the Transaction Attribute in the column. Transaction attributes could include information such as the transaction Batch ID number. The Transaction Attribute function extracts attribute data from the general ledger, and must be supported by your accounting system. For information about using the Transaction Attribute in the row format, see “Using Account Attributes and Transaction Attributes in Rows” on page 107.
When you select T_ATTR as the column type, specify the Attribute Category in the Book Code/Attribute Category detail row of the column layout.
XBRL_TAGSelect this code to display the XBRL element tag found in the row format for a report that you output as an .frd file (DrillDown Viewer Enhanced XML). The XBRL_TAG is not passed from the column layout to the XBRL instance document.

150FRx Report Designer 6.7 User’s Guide
Chapter 5: Creating Column Layouts – Adding Column Detail
Transaction Detail CodesUse the transaction detail codes for presenting appropriate detail in a transaction detail report. By specifying a value in the column TYPE cell, you can create a column layout for a transaction detail report that contains a separate column for each type of transaction information. These codes are always used in conjunction with GL columns. You can include both a current and year-to-date GL column to create transaction detail reports. Figure 5-9 shows examples of Transaction Detail Codes.
Figure 5-9: Transaction Detail in Column Layout Window
To specify a Column Type
1 On the Column Layout window, double-click the Type Column Detail cell for the column to display the Select the Type of Column dialog box.
2 Select a column type.
3 Click OK to return to the Column Layout window.
Defining General Ledger Columns The next four categories under Column Detail define general ledger columns (defined as GL in the TYPE cell) as shown in Figure 5-10.
Note The codes that display in the TYPE selection window do not necessarily apply to all accounting systems. Your FRx® Report Designer Getting Started Guide contains information about types specific to your accounting system. If you select a type that is not valid with your accounting system, the column appears blank in the report. For more information about creating transaction detail reports, see “Customizing Transaction Detail Reports” on page 173.

151FRx Report Designer 6.7 User’s Guide
Chapter 5: Creating Column Layouts – Adding Column Detail
Figure 5-10: GL Column Detail
These column detail rows include:
Book Code/Attribute Category
Fiscal Year
Period Code
Current Per/YTD
Book Code/Attribute Category The Book Code/Attribute Category column detail gives you a choice of actual, budget, and non-financial (statistical) options as shown in Figure 5-11. A column layout can contain multiple actual, budget, and statistical columns for displaying different periods (current or year-to-date) and amounts.
Figure 5-11: Book Code Selections
The list that appears reflects the actual, budget, and statistical (non-financial) options that have been established in your general ledger. For more information about actual and budget amounts available from your general ledger, see the FRx® Report Designer Getting Started Guide.
To specify a Book Code/Attribute Category
1 On the Column Layout window, double-click the Book Code/Attribute Category cell for the column to display the Select a Book Code dialog box.
2 Select a book code.
3 Click OK to return to the Column Layout window.
Fiscal Year Use the Fiscal Year column detail to specify a fiscal year. Type BASE to use the base year specified at report generation time. To use other years, specify the number of years relative to the base year (using + or -). Report Designer supports up to 10 years of historical data. For example, to specify:
the prior year, type BASE-1 or -1
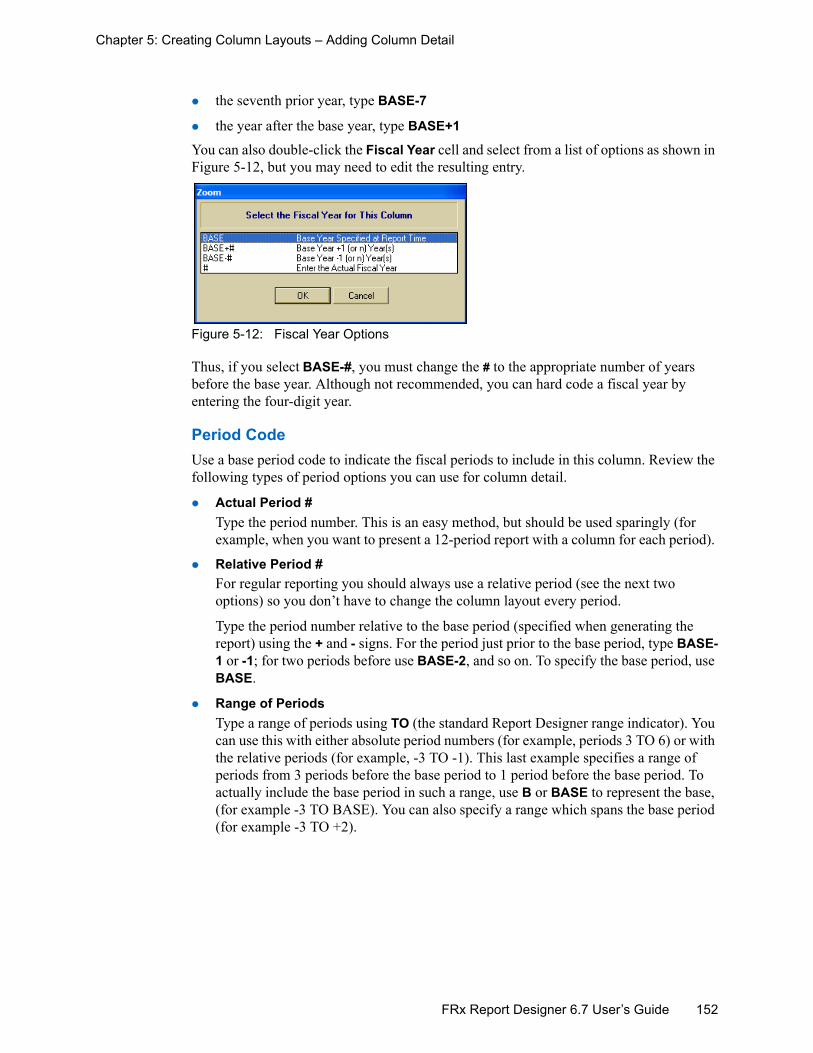
152FRx Report Designer 6.7 User’s Guide
Chapter 5: Creating Column Layouts – Adding Column Detail
the seventh prior year, type BASE-7
the year after the base year, type BASE+1
You can also double-click the Fiscal Year cell and select from a list of options as shown in Figure 5-12, but you may need to edit the resulting entry.
Figure 5-12: Fiscal Year Options
Thus, if you select BASE-#, you must change the # to the appropriate number of years before the base year. Although not recommended, you can hard code a fiscal year by entering the four-digit year.
Period Code Use a base period code to indicate the fiscal periods to include in this column. Review the following types of period options you can use for column detail.
Actual Period # Type the period number. This is an easy method, but should be used sparingly (for example, when you want to present a 12-period report with a column for each period).
Relative Period # For regular reporting you should always use a relative period (see the next two options) so you don’t have to change the column layout every period.
Type the period number relative to the base period (specified when generating the report) using the + and - signs. For the period just prior to the base period, type BASE-1 or -1; for two periods before use BASE-2, and so on. To specify the base period, use BASE.
Range of Periods Type a range of periods using TO (the standard Report Designer range indicator). You can use this with either absolute period numbers (for example, periods 3 TO 6) or with the relative periods (for example, -3 TO -1). This last example specifies a range of periods from 3 periods before the base period to 1 period before the base period. To actually include the base period in such a range, use B or BASE to represent the base, (for example -3 TO BASE). You can also specify a range which spans the base period (for example -3 TO +2).

153FRx Report Designer 6.7 User’s Guide
Chapter 5: Creating Column Layouts – Adding Column Detail
You can also double-click the Period Code cell and select from a list of period options as show in Figure 5-13, but you may need to edit the resulting entry.
Figure 5-13: Period Options
For example, if you select BASE-#, you must change # to the appropriate number of periods before the base period.
Transaction Detail Reports Type the period range in this period cell to include year-to-date transaction details in a column (or any range other than the current period). See “Customizing Transaction Detail Reports” on page 173.
Current Per/YTD Use the Current Per/YTD column detail to display period or year-to-date amounts.
Note Although you can go beyond fiscal year boundaries in any of the period specifications, Report Designer does not allow you to mix years within a range of periods. For example, if you specify periods -5 TO BASE (representing the past 6 periods) and run the report with a base period of 2, the report will not work properly. If you run it with a base period of 6, it will work properly.
You can access different years by using separate ranges in separate columns in the same report. For example, if the base period is 3, you can use the ranges (-2 TO BASE) and (-5 TO -3) because a year boundary isn’t crossed within a range. If you regularly cross year boundaries, avoid using ranges. Instead, use a column for each relative period and print the total. Suppress printing of the other columns in the Print Control cell.

154FRx Report Designer 6.7 User’s Guide
Chapter 5: Creating Column Layouts – Adding Column Detail
To Specify a Current Period/YTD Amount
1 On the Column Layout window, double-click the Current Per/YTD cell for the column to display the Select the Amount to Use dialog box.
2 Select one of the following options:CUR to cause the column to reflect current period activity.This type of column does not include beginning balances.
YTD to cause the column to reflect year-to-date amounts.This type of column includes beginning balances.
Caution: If you run a report to the Transaction level with two YTD columns, you will get an Out of Balance message. Running two YTD columns in not supported in Report Designer.
CUR/BB to reflect the beginning balance for the specified period.YTD/BB to reflect the beginning balance for the specified year.
3 Click OK to return to the Column Layout window.
The Column Layout window displays sample current and year-to-date periods.
The CUR code causes this column to reflect current period activity.
The YTD code causes this column to reflect year-to-date amounts.
The YTD/BB code causes this column to reflect the beginning balance for the base year.

155FRx Report Designer 6.7 User’s Guide
Chapter 5: Creating Column Layouts – Adding Column Detail
Adding Calculation Formulas When the amounts in a column are the result of a calculation, you must enter CALC in the TYPE cell and type the formula in the Calc Formula cell on the Column Layout window. You can add, subtract, multiply, or divide columns. You can also perform any type of complex calculation including IF/THEN/ELSE statements within the formula.
Add, SubtractTo add or subtract amounts in the columns, specify the column letter and the plus (+) and/or minus (-) sign. For example: A+B or A-B+C.You can also use the TO separator to add a range of consecutive columns; for example: A TO D.The following Column Layout window displays a Calculation column and formula.
Figure 5-14: Calculating Amounts in Column Layout Window
Column calculations can refer to any other column, including subsequent columns. Report Designer resolves the dependent columns first. If a column refers to another column that in turn refers back to the current column, a circular reference error results.
Multiply, DivideTo multiply and divide columns, type the column letters in the order in which they should be computed, separating each with the appropriate operator (* for multiplication, / for division). For example, if you type B*D, you are instructing Report Designer to multiply column B by column D.You can also refer to a specific report cell by typing a column letter and a row code. For example, if you type B100, this refers to column B, row code 100.
This adds all the column amounts that print within the range of column B to column Y and places the total in the column Z.

156FRx Report Designer 6.7 User’s Guide
Chapter 5: Creating Column Layouts – Adding Column Detail
You may want to divide an entire column by a specific report cell amount from the same column. For example, if you type B/B100, you are instructing Report Designer to divide the entire column B by the value in column B, row code 100.
Use a special format mask to format the number as a percentage. For more information, see “Special Format Mask” on page 157.
Complex CalculationsA complex calculation can contain any combination of cell references, operators, and values. For example, to compute an average of columns A and B, you type: ((A+B)/2)
There is no limit to the number of nested parentheses you can use as shown in the example (A+((B+C/2)+(C*.8)/2))+(F TO H).
Multiply or Divide by Base RowYou can create a column that displays all the values in a specified column as a percentage of base number. This feature provides a method to show relationships between rows, such as a percent of sales or percent of total expenses row.To multiply or divide each row in a specific column by a base row, type the column to be used in the calculation and *BASE or /BASE (for example, type C*BASE or C/BASE). When you use a base row calculation, make sure that each row format used with this column layout contains at least one row with a CBR (Change Base Row) format code. The CBR code identifies the row used in the calculation.
To multiply or divide by base row
1 Open the related Row Format window.
2 In the Fmt Code cell of a row above the rows that are to use the calculation, enter CBR.
3 In the Related Rates/Rows/Unit cell, enter the row code for the base row to be used as the denominator.
4 Return to the Column Layout window and create a CALC column.
5 In the Calc Formula box, type the letter of the column to use in the calculation followed by the operator and the word BASE (for example, type B/BASE.When you do this, every number in column B is divided by the number in the specified base row, and the resulting percentage is placed in the calculation column.
Note: Use a special format mask to format the number as a percentage. For more information, see “Special Format Mask” on page 157.
Note This calculation will be incorrect if you change the report’s calculation priority to Calculate Columns First on the Report Options Advanced tab in the Catalog of Reports.

157FRx Report Designer 6.7 User’s Guide
Chapter 5: Creating Column Layouts – Adding Column Detail
IF/THEN/ELSE StatementsIF/THEN/ELSE statements allow any calculation to be conditional upon the results of any other column. You can refer to other columns, but not to a report cell in the IF statement; thus, any calculation must be applied to the entire column.Type the calculation in the Calc Formula section of the column that receives the results of the calculation.
Note: You cannot place the results of a calculation in any other column; they must be in the column that contains the formula.
For example, the formula “IF B>100 THEN B ELSE C*1.25” translates to: If the amount in column B is greater than 100, place the value from column B in the CALC column. If the value is not greater than 100, multiply the value in column C by 1.25 and place the result in the CALC column.IF is always followed by a logic statement which evaluates to true or false. The formula used for both the THEN and ELSE clauses can contain references to any number of columns and may be as complex as needed, including multiple nested calculations. For example:
IF (statement) THEN H+(G*((C+D+E-F)/.25))
Adding Special Formatting Options The following column detail rows apply special formatting to selected columns. Although some of the Print Control and Column Restrictions options are specific to GL columns, most options apply to all column types.
Column WidthUse this option to specify the number of characters to use for the width of this column on the printed report. Column width is particularly important for Amount (CALC, WKS, and GL), Desc- and Fill-type columns. If the column width isn’t specified here, Report Designer uses the default widths of 30 characters for the description columns, 14 characters (including cents, commas, and parentheses) for Amount columns, and 10 characters for a Fill-type column.
Extra Spaces Before ColumnYou can use this option to separate groups of columns or to add a few spaces before the description (so the description column is indented from the left-justified titles in the report). The default number of spaces between each column is two, as defined in the Formatting tab in the Report Options tab in the Catalog of Reports. To change the default, enter the number of extra spaces to be placed in front of a given column.
Special Format MaskUse a special format mask to assign decimal, currency, and percentage formatting to your column amounts.

158FRx Report Designer 6.7 User’s Guide
Chapter 5: Creating Column Layouts – Adding Column Detail
To assign a special format mask to your column amounts
1 In the column you want to assign the mask, double-click the Special Format Mask cell in the Column Detail section to display the Select a Format dialog box.
2 Select a format and click OK.
3 Make any modifications to the special format mask in the Edit Bar.
Note: For example, a mask of #,###, will round to thousands.
When you generate your report, this format is used for this column. If no format is entered, the default format identified in the Amount & Date Format of the Company Information dialog box is used. If you defined special formats in a row calculation and in the column, the row formatting overrides the column formatting. For more information about format masking, see “Amount Formatting” in Chapter 2 of your FRx® Report Designer 6.7 Administrator’s Guide.
Print Control Codes The Print Control codes allow you the option of adjusting the display or printing characteristics of the column. To select a print option, use the following dialog box.
Figure 5-15: Special Print Control Options

159FRx Report Designer 6.7 User’s Guide
Chapter 5: Creating Column Layouts – Adding Column Detail
The following table describes each regular print control code:
Print Control Code Description
NP Select this code if the amounts in this column are part of a calculation only and should not be printed in the report.
When you use a non-printing column in a calculation, you need to directly refer to that column in the formula if you want to include it. For example, in the following calculation, the non-printing column C is included: B+C+DHowever, the non-printing column C is not included in the following calculation: B TO D
BS Select this code to indicate a column as a Balance Sheet column to be printed on a combined Balance Sheet/Income Statement Report. Since the same column layout is used for both the balance sheet and the income statement, this code is required to identify the columns that apply to the balance sheet.
XCR Select this code to create a budget or comparative report where an unfavorable variance is always negative (such as a revenue shortfall or expense overrun), apply the XCR code to a CALC column.
Select this code to reverse the sign of a CALC column amount if the normal balance of a given row is a credit (identified by a “C” in the Norm Bal column of the row format).
Note: Make sure that you code the appropriate rows (in the row format) in the Norm Bal column with a “C” for TOT and CAL rows that normally carry a credit balance.
X0 Select this code to suppress a GL column if all amounts are blanks/zeros.
SR Select this code to suppress a column from being rounded.
P<B Select this code to display this column only if the period is less than the base period.
P>B Select this code to display this column only if the period is greater than the base period.
P=B Select this code to display this column only if the period is equal to the base period.
P<=B Select this code to display this column only if the period is less than or equal to the base period.
Table 5-4: Print Control Codes

160FRx Report Designer 6.7 User’s Guide
Chapter 5: Creating Column Layouts – Adding Column Detail
P>=B Select this code to display this column only if the period is greater than or equal to the base period.
Print Control Code Description
Table 5-4: Print Control Codes (Continued)

161FRx Report Designer 6.7 User’s Guide
Chapter 5: Creating Column Layouts – Adding Column Detail
Refer to the following figures for examples of a column layout that uses the XCR code, a corresponding row format with credit signs reversed, and the resulting report.
Figure 5-16: Reversing Credit Value in Column Layout Window
Figure 5-17: Row Format with Credits Reversed in Normal Balance
The XCR print control reverses the sign of the calculation. See the corresponding report.
Notice the C codes in the Norm Bal column. This instructs Report Designer to reverse the amount signs in XCR columns.

162FRx Report Designer 6.7 User’s Guide
Chapter 5: Creating Column Layouts – Adding Column Detail
Figure 5-18: Results of Reversing Credit Value in Report
To add Print Control codes
1 Double-click the Print Control cell in the column to display the Select Special Print Control Options dialog box.
2 Select one or more codes for special printing characteristics.
Print Control for Conditional Columns When you use the conditional column options, any column can be displayed or omitted based on whether the column’s fiscal period falls before or after the base period on the report.For example, this feature allows you to create a report that displays 12 different periods in which actual amounts print for the base period and all prior periods. Budget amounts (or forecast amounts from an external spreadsheet) display for all future periods. Such a report dynamically derives the correct data for the actual or budget (or forecast) amounts based on the base period for which the report is run.
Use the following dialog box to select a print option for Conditional columns.
Figure 5-19: Special Print Control Options
Note When exporting reports to an Excel via OLE format, do not select the Export Formulas option. If you accidentally select this option, Microsoft Excel will ignore reversed credit values and your reports may be unfavorable.
Income StatementFor the Three Months Ending March 31, 2002
Actual Budget $ Variance % Variance(Unfavorable) (Unfavorable)
Net Revenue $2,136,207 $1,034,335 $1,101,872 51.58%
COGS 1,444,056 644,131 (799,925) (55.39%)Gross profit 692,151 390,204 301,947 43.62% Gross Margin % 32.4% 37.7% (5.3%)
Operating ExpensesSalaries and Wages 399,824 270,851 (128,973) (32.26%)Office Expense 52,455 36,814 (15,641) (29.82%)Advertising Expense 48,135 39,687 (8,448) (17.55%)Total Operating Expenses 500,414 347,352 (153,062) (30.59%)Net Income from Operations $191,737 $42,852 $148,885 77.65%
Fabrikam Works, Inc.

163FRx Report Designer 6.7 User’s Guide
Chapter 5: Creating Column Layouts – Adding Column Detail
The following column layout is an example of a column layout with print selections for conditional columns.
Figure 5-20: Conditional Columns in Column Layout Window
Figure 5-20, when the base period is 3, then actual amounts print for periods 1 to 3, and budget amounts (or forecast amounts from an external spreadsheet) print for periods 4 to 12.
To set up a conditional report
1 Create a column layout with two columns for each period.The first column contains actual amounts, and the second contains budget amounts.
2 For the actual column, in the Print Control row, enter the conditional operator P<=B.
3 For the budget column, in the Print Control row, enter the conditional operator P>B.
Note: When a column is suppressed by a conditional option, it is not included in any calculations.
4 Click OK to return to the Column Layout window.You can also add a total column that totals all of the periods in the year. However, if you specify a range of columns in the total, Report Designer includes only columns that are actually displayed.
These columns print only when the base period is 2 or less.
These columns print only when the base period is greater than 2.

164FRx Report Designer 6.7 User’s Guide
Chapter 5: Creating Column Layouts – Adding Column Detail
Adding Column Restrictions Use the following selections to restrict certain types of data to display within a column.
Figure 5-21: Column Restriction Selections
The following table describes each column restriction selection.
Column Restriction Code Description
SU If an underscore or double underscore (--- or ===) command is entered in the row format, selecting SU in a column suppresses the underscore for that column only. For example, you might not want to underline amounts that are the result of a percentage calculation.
ST Suppresses totals and shows only details in this column (for example, in statistical columns).
SD Suppresses details and shows only TOT rows (from the row format) in this column.
DR Restricts the amounts in the column to debit amounts.
CR Restricts the amounts in the column to credit amounts.
ADJ Restricts the amounts in the column to period adjustment amounts (if available).
XAD Restricts the amounts in the column to exclude the period adjustment amounts (if available).
PT Restricts the amounts in the column to include posted transactions only.
UPT Restricts the amounts in the column to include unposted transactions only (if available).
Table 5-5: Column Restriction Codes

165FRx Report Designer 6.7 User’s Guide
Chapter 5: Creating Column Layouts – Adding Column Detail
To add Column Restrictions
1 Double-click the Column Restrictions cell.
2 Select a code for special printing characteristics.You can use multiple codes within a single column if necessary.
Note: A Column Restriction code overrides any conflicting setting assigned in the Row Format.
3 Click OK to return to the Column Layout window.
Selecting a Reporting Unit If the column type is GL, select a tree and reporting unit code in this cell to restrict a column to a specific reporting unit. Make your selections using the Select Tree for Lookup dialog box shown in Figure 5-22.
Figure 5-22: Select Tree for Lookup Dialog Box
This feature is useful when information is applicable only to a certain unit or when you want to display reporting units side-by-side, such as in departmental side-by-side comparison reporting.
To select a Reporting Unit from a list
1 Double-click the Reporting Unit cell to display a list of trees.
2 Select a tree to use in conjunction with this column layout.
3 When the list of reporting units appears, select a unit from the list.

166FRx Report Designer 6.7 User’s Guide
Chapter 5: Creating Column Layouts – Adding Column Detail
4 Return to the Column Layout window.
Your column layout displays the use of reporting units and restrictions.
Note: If you enter a reporting unit in the column layout, be sure to use the same tree when this column layout is used in a report. If you do not, the units from the tree may not match and the columns will be blank on the report.

167FRx Report Designer 6.7 User’s Guide
Chapter 5: Creating Column Layouts – Adding Column Detail
Formatting Multicurrency Reports When creating multiple currency reports, you can use three functions in your column layout:
Currency Code
Currency Display
Currency Rate Subtype IDThe Currency Code allows you to restrict a column to a specific currency. The Currency Display allows you to specify whether the originating currency amount or a converted “functional” amount displays in the report. Using the NAT Currency Display in combination with the Currency Code prints the natural (originating) currency amount. The FUNCT Currency Display prints the amount converted to the functional currency (or home currency) for that company.
If your accounting system supports more than one exchange rate per currency, the Currency Rate Subtype ID code allows Report Designer to read the appropriate information from the general ledger. This code can be used in conjunction with a currency display code in GL columns or in columns with transaction code TCURX.
Currency Code To restrict the column to transactions originating in a specific currency
1 Double-click the Currency Code cell to open the Currency Key dialog box.
2 Select a currency from the list as defined in your general ledger.
3 Click OK to return to the Column Layout window.
Note When DAX Currency Translation is active, both the Currency Code and the Currency Display selection lists display the three-letter ISO Currency codes.

168FRx Report Designer 6.7 User’s Guide
Chapter 5: Creating Column Layouts – Adding Column Detail
Currency Display To show the selected currency in its original form or a converted amount
1 Double-click the Currency Display cell to display the Currency Type to Display dialog box.
2 As needed, select a currency to display the conversion:NAT to display the amount in originating (natural) currencyFUNCT to display the amount converted to functional (base) currency for this companyOther to display other reporting currencies (if available)
3 Click OK to return to the Column Layout window.
Example of Combining Currency Code with Currency Display
For example, if you use the BP Currency Code with the NAT Currency Display, the amounts in the local or natural currency amount display in your report. If you use the BP Currency Code with the FUNCT (or default) Currency Display, the amounts converted to the home or primary reporting currency (for example, US $) will display.When you combine the following Currency Display with the Currency Code, you receive the following report results (assumes USD is the functional currency).
Table 5-6: Currency Display and Currency Code Combination with US$ as the Functional Currency
* Current conversion rate at approximately 100 yen per dollar.
Currency Display
Currency Code
Report Result
NAT YEN Y6,000
FUNCT YEN $60*
FUNCT Blank $2,310**
NAT USD $2,250

169FRx Report Designer 6.7 User’s Guide
Chapter 5: Creating Column Layouts – Adding Column Detail
** FUNCT Currency Display with Blank Currency Code displays the sum of transactions originated in USD and YEN, shown in US $.
Currency Rate Subtype ID If your accounting system supports more than one exchange rate per currency, the Currency Rate Subtype ID code allows Report Designer to read the appropriate information from the general ledger. This code can be used in conjunction with a currency display code in GL columns or in columns with transaction code TCURX.
To use a currency rate subtype ID in a GL or TCURX column layout
1 Double-click the Currency Display cell in a GL or TCURX column to display the Currency Type to Display dialog box.
2 Select a currency code from the list and click OK.
3 In the Currency Rate Subtype ID cell, type the ID.
4 Click Save.
Account Filters For columns whose TYPE is GL, the Account Filter cell can restrict a column to specific general ledger accounts. The account filter may contain one or more accounts that are the exact length of the full account code of the current company. The filter is applied regardless of whether a tree is used. You can use wildcard characters (?) in any (or all) positions. When you specify multiple accounts, place a comma between accounts:
????-1200-???, ????-1100-???
Note To enter an account filter, double-click to open the GL Account Links dialog box. Then either enter an account number or double-click to open the Select General Ledger Account dialog box. Always enter the same number of characters as in the full account mask or the column will be blank when the report runs.
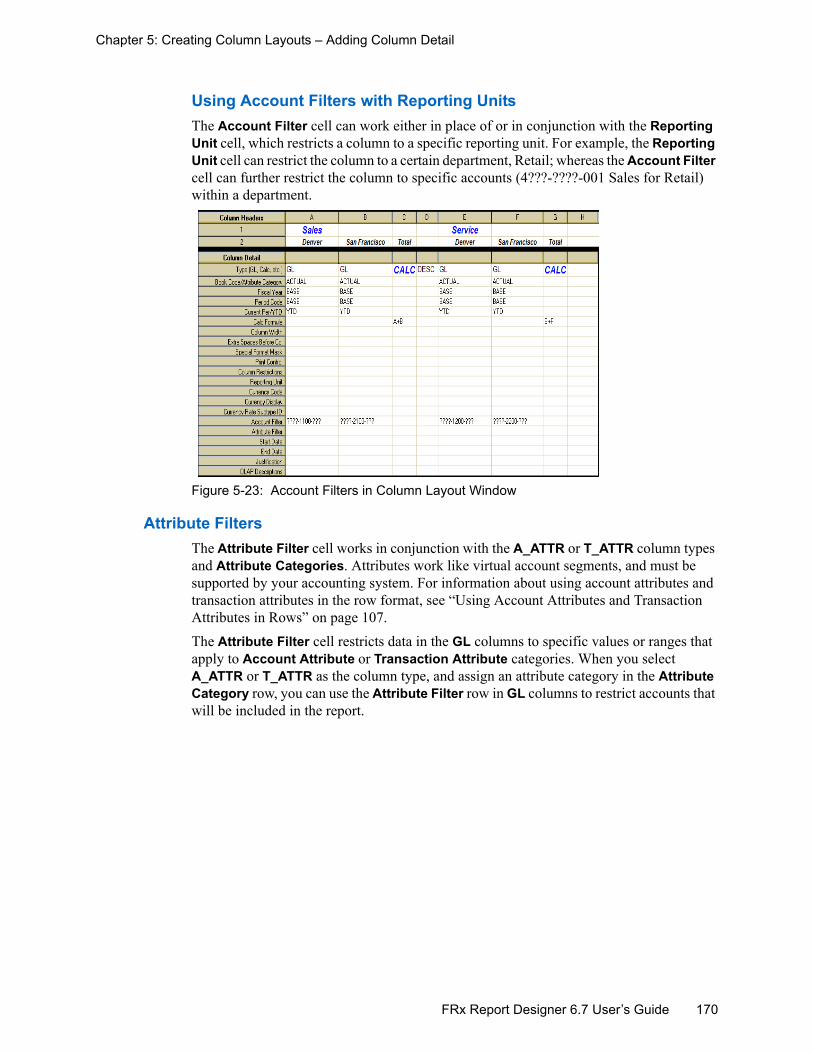
170FRx Report Designer 6.7 User’s Guide
Chapter 5: Creating Column Layouts – Adding Column Detail
Using Account Filters with Reporting UnitsThe Account Filter cell can work either in place of or in conjunction with the Reporting Unit cell, which restricts a column to a specific reporting unit. For example, the Reporting Unit cell can restrict the column to a certain department, Retail; whereas the Account Filter cell can further restrict the column to specific accounts (4???-????-001 Sales for Retail) within a department.
Figure 5-23: Account Filters in Column Layout Window
Attribute Filters The Attribute Filter cell works in conjunction with the A_ATTR or T_ATTR column types and Attribute Categories. Attributes work like virtual account segments, and must be supported by your accounting system. For information about using account attributes and transaction attributes in the row format, see “Using Account Attributes and Transaction Attributes in Rows” on page 107.The Attribute Filter cell restricts data in the GL columns to specific values or ranges that apply to Account Attribute or Transaction Attribute categories. When you select A_ATTR or T_ATTR as the column type, and assign an attribute category in the Attribute Category row, you can use the Attribute Filter row in GL columns to restrict accounts that will be included in the report.

171FRx Report Designer 6.7 User’s Guide
Chapter 5: Creating Column Layouts – Adding Column Detail
Figure 5-24shows the Account Attribute with the category Zipcode in column F. The Attribute Filter in the GL type column F specifies the range of values to include in the report.
Figure 5-24: Attribute Filters in Column Layout Window
Restricting Columns to Specific Dates The Start Date and End Date cells restrict data in GL columns to specific dates. This technique is useful for daily or weekly sales reporting, cash analysis needs, and other date-sensitive reports. You can type a date using the day of the month or a full date.
Day of MonthYou can enter either a day number or a range of days. The day number refers to the number of days after the start of the fiscal period, not the actual calendar date. For a period beginning on May 15, day 1 = May 15, day 2 = May 16, and so on.
To add a single day
1 Type the day of the fiscal period in the Start Date cell. For example:12
Using a single day includes only the transactions entered on that date in this column. For example, the day defined in the previous step includes only day 12 of the fiscal period.
To add a range of days
1 Type the beginning day of the fiscal period range in the Start Date cell. For example:12
2 Type the ending day of the fiscal period range in the End Date cell. For example: 18
Using a day range includes all the transactions entered during this range in this column. For example, the day range defined in the previous steps begins 12 days and ends 18 days into the fiscal period. Report Designer uses the month and year specified in the Fiscal Year and Period Code cells for the column.

172FRx Report Designer 6.7 User’s Guide
Chapter 5: Creating Column Layouts – Adding Column Detail
Full DateYou can type a date or a date range. We recommend that you key in the date in the MM/DD/YYYY format. However, you also can type the date in the MM/DD/YY format. If you type a two-digit year value that is greater than 30, Report Designer assigns it a 1900 century date. If you type a year value that is less than or equal to 30, Report Designer assigns it a 2000 century date.
To enter a single date
Type a start date in the Start Date cell (for example, 03/04/2002)Using a single date includes only the transactions entered on that date in this column. For example, the date defined in the previous step includes only March 4, 2002.
To enter a range of dates
1 Type a start date in the Start Date cell (for example, 12/04/2002)
2 Type an end date in the End Date cell (for example, 01/15/2004)Using a date range includes all the transactions entered during this date range in this column. For example, the date range defined in the previous steps begins December 4, 2002 and ends January 15, 2004.
Note: Any date or date range specified in the full date format overrides any period and year for the Fiscal Year and Period Code for this column.
Justification The Justification cell formats the Description column based on your selection. This option only affects the column descriptions and not the actual values.
To apply Justification formatting to a Description column
1 Double-click the Justification cell in a Description column to display the Select Justification dialog box.
2 Select one of the following options:General Justification—Applies any formatting you set up in the row format for the Description column.Left Justification—Left justifies your column descriptions.Center Justification—Centers your column descriptions.Right Justification—Right justifies your column descriptions.
3 Click OK to return to the Column Layout window.

173FRx Report Designer 6.7 User’s Guide
Chapter 5: Creating Column Layouts – Customizing Transaction Detail Reports
Adding the OLAP Description to the Column Layout If you intend to send report output to an OLAP cube using FRx® Instant!OLAP®, you need to include an OLAP Description in the Column Layout. The OLAP Description consists of the Period/Year Description and the Book Code Description. These description elements, along with the row format description and the reporting unit, identify a unique data cell in the OLAP cube. The OLAP Description row is available only for column types GL, WKS, or CALC.You can type directly into the OLAP Description cell in the Column Layout or you can double-click in the cell and type into the OLAP Descriptions dialog box. The OLAP Descriptions dialog box is the recommended entry method.You do not need to enter an OLAP description unless you are sending report output to an OLAP cube.
To add the OLAP Description to column layouts
1 From the Column Layout window, scroll down to the OLAP Description row.
2 For column types GL, CALC, or WKS, double-click the column cell in the OLAP Descriptions row to display the OLAP Descriptions dialog box.
Note: If you try to type an OLAP description into a column type other than GL, CALC, or WKS, the program displays an error message and clears the OLAP Description cell.
3 In the Period/Year Description box, type your period/year description.
4 In the Book Code Description box, type your book code description.
5 Click OK to return to the Column Layout window.
Note: Do not use the semicolon (;) character in the period/year description or book code description. The semicolon is reserved as a field separator character.
Customizing Transaction Detail Reports If you plan to generate a transaction detail report, first create a customized column layout specifically for that type of report. Several of the column layouts included with Report Designer use the following displayed column types.

174FRx Report Designer 6.7 User’s Guide
Chapter 5: Creating Column Layouts – Customizing Transaction Detail Reports
The available transaction detail TYPE codes vary depending on your general ledger. The following dialog box displays all the possible transaction detail options.
Figure 5-25: Select the Type of Column Dialog Box
When you set up the column layout for your transaction detail reports, you should normally include at least one column for the general ledger current period amounts (CUR) and at least one column for the general ledger year-to-date amounts (YTD). The transaction amounts appear in the CUR column and period balances in the YTD column. You can also include any of the transaction detail codes that are specific to your accounting system. See the FRx® Report Designer Getting Started Guide for more information.Remember, when you generate your transaction detail report you must select either the Transaction Only or Financial & Transaction option in the Detail Level box of the Catalog of Reports window.
This section contains information and instructions on:
Creating Multiple Period Transaction Detail Reports
Creating Year-to-Date Transaction Detail Reports
Creating Debit/Credit Reports
Creating Multiple Period Transaction Detail Reports Report Designer enters transaction detail amounts only in current columns (CUR) in the Current Per/YTD cell. If you want a report to cover more than one period, enter the period range in the Period Code cell of the CUR column. For example, to run a report covering the last three periods enter a Period Code of BASE-2 TO BASE in the CUR column.
Note Transaction detail accounts with a zero balance and no period activity are suppressed in your reports unless the Display Rows With No Amounts option is selected in the Formatting tab within the Report Options tab of the Catalog of Reports.

175FRx Report Designer 6.7 User’s Guide
Chapter 5: Creating Column Layouts – Customizing Transaction Detail Reports
Creating Year-to-Date Transaction Detail Reports To run a transaction detail report for the entire year, type 1 TO BASE in the Period Code cell of the CUR column and BASE in the YTD column as shown in the following example.
Figure 5-26: Year-to-Date Transaction Detail Column Layout
Creating Debit/Credit Reports To create reports that categorize transactions by debit and credit, you must have two CUR columns for the debits and credits and a YTD column for the period totals. Enter the debit code (DR) in the Column Restriction cell of one of the CUR columns and the credit code (CR) in the other. See the following example.
Figure 5-27: Debit and Credit Report Column Layout
Note Transaction reports spanning multiple fiscal years are not supported for most GL interfaces.

176FRx Report Designer 6.7 User’s Guide
Chapter 5: Creating Column Layouts – Customizing Transaction Detail Reports
As with other transaction reports, if you want to display details for multiple periods, enter a range (for example, 1 TO BASE) in the Period Code cell.
Note Using a Column Restriction code overrides any conflicting setting assigned in the row format.

177FRx Report Designer 6.7 User’s Guide
Chapter 5: Creating Column Layouts – Creating Tabular Reports
Creating Tabular Reports You can design a report with the amounts from one period extended across the page (into multiple print columns). Using multiple display columns can emphasize particular totals.
To create a tabular report
1 Create a column layout similar to the following example.
2 In the row format, you must enter the column that you want the result to be displayed in. Do this by placing the column letter in the column restriction column (column G).
Example of Column Layout for Creating a Tabular Report
In the following row format, notice the detail information (for Current Assets and Net Fixed Assets) in column B, the total format code (TOT) in column C (rows 625 and 850), and the formula for combined total assets in column D (row 910).

178FRx Report Designer 6.7 User’s Guide
Chapter 5: Creating Column Layouts – Creating Tabular Reports
When you generate the balance sheet report based on the column layout, the Balance Sheet displays as shown in Figure 5-28.
Figure 5-28: Tabular Balance Sheet
Fabrikam Works, Inc.Tabular Balance Sheet
For the Five Months Ending May 31, 2002
ASSETS
Cash - Checking $134,111.13Cash - Money Market 46,751.00 Total Cash 180,862.13Accounts Receivable 166,164.00Allowance For Bad Debts (2,184.00)Intl Corp Receivable 271,213.00 Net Accounts Receivable 435,193.00
Total Inventories 779,026.00
Prepaid Assets 3,289.00
Current Assets 1,398,370.13
Leasehold Improvements 69,600.00Office Furniture And Fixtures 34,500.00Office Equipment 37,700.00Less Accumulated Depreciation (40,635.00)
Net Fixed Assets 101,165.00
Total Assets $1,499,535.13
LIABILITIES AND SHAREHOLDERS' EQUITY
Accounts Payable $84,253.00Accrued Liabilities 137,867.00 Total Current Liabilities 222,120.00
Leases Payable 10,100.00Notes Payable 142,794.00 Long-Term Liabilities 152,894.00
Total Liabilities 375,014.00
Capital Stock 50,000.00Additional Paid-In Capital 500,269.00Year-to Date Income 377,152.13Retained Earnings 197,100.00
Shareholders' Equity 1,124,521.13
Liabilities and Equity $1,499,535.13

179
Chapter 6
FRx Report Designer 6.7 User’s Guide
Creating a Reporting Tree
The Reporting Tree function is the key to the power and flexibility of FRx® Report Designer. Although the row format and column layout are essential components in the design and functionality of financial reports, it is the reporting tree that magnifies the power of those components.
Understanding Reporting Trees . . . . . . 181
Reporting Tree Window . . . . . . . . . . . . 187
Reporting Tree Menus and Toolbar Icon190
Understanding Building Reporting Trees197
Understanding Building Reporting Trees Manually. . . . . . . . . . . . . . . . . . . . . . . . 203
Building Reporting Trees Manually . . . 205
Building Reporting Trees Automatically 213
Adding Text and E-mail Links to a Reporting Tree . . . . . . . . . . . . . . . . . . . . . . . . . . . 216
Securing Reporting Tree Units. . . . . . . 221

180FRx Report Designer 6.7 User’s Guide
Chapter 6: Creating a Reporting Tree –
Although you can create financial reports without the aid of the reporting tree, you will be using only a fraction of the capabilities of FRx. The reporting tree allows you to model a very sophisticated reporting structure and view your organization in many different ways with the click of a button. Some companies may have very complex corporate hierarchies that require hundreds of tree units, as well as other hierarchies that require much fewer tree units.

181FRx Report Designer 6.7 User’s Guide
Chapter 6: Creating a Reporting Tree – Understanding Reporting Trees
Understanding Reporting Trees Most organizations have a hierarchical structure in which departments (or other business units) report to one or more higher-level units. In a traditional organization chart, the lower units (boxes) on the chart typically report up to increasingly higher units.FRx uses the term “reporting unit” for each of the boxes in an organizational chart. A reporting unit can be an individual department from the general ledger, or it can be a higher-level (summary) unit that combines information from other reporting units. Each reporting unit represents an individual report that contains rows from a row format and columns from a column layout. The reporting tree contains a group of reporting units. FRx allows you to easily add or change reporting units without requiring a change to the general ledger.This section contains information and instructions on:
Reporting Unit Structure
Multiple Reporting Trees
Account Masks
Account Mask Structure and Segments
Reporting Unit Structure Reporting units are categorized as detail units (which draw information directly from the general ledger or from an external worksheet) and summary units (which summarize data from lower level units). An FRx reporting tree consists of parent reporting units and child reporting units.Parent reporting units are summary units that pull summarized information from the detail units. Summary units can be both a detail unit and a summary unit; that is, they can draw information from lower units as well as draw directly from the general ledger or an external spreadsheet. Thus, a parent unit can, in turn, be a child of a higher parent unit.Child reporting units can be detail units that pull information directly from the general ledger or a spreadsheet, or they can be intermediate summary units (parent to lower units and child to higher summary units).

182FRx Report Designer 6.7 User’s Guide
Chapter 6: Creating a Reporting Tree – Understanding Reporting Trees
Following is a flowchart showing the parent and child reporting units, and their hierarchical relationship, for the Fabrikam Works, Inc. Summary reporting tree.
Figure 6-1: Flowchart: Fabrikam Works, Inc. Summary Reporting Tree
Note the following reporting unit structure in the previous figure:
In this example, the Denver Office reporting unit is parent to the Sales and Service divisions (Denver).
The Sales division is both a child of the Denver office and a parent to the Retail and Wholesale departments.
The lowest level detail reporting units (Retail, Wholesale, Lab and Studio) represent departments in the general ledger.
The higher level (summary) units simply roll up (summarize) information from the department (detail) units.
Multiple Reporting Trees Since you may have more than one way of looking at your company, FRx allows you to create an unlimited number of different reporting trees. Each tree is completely independent so it can contain any combination of departments and summary units.By simply rearranging the structure among the reporting units, you can create immensely different trees. This allows you to use the same row format and column layout with each reporting tree, and print a totally different financial report layout within minutes. For example, the following figure is basically the same reporting tree as the one shown previously, but with the reporting structure changed to develop an organizational structure by business function instead of by location. These two trees demonstrate different perspectives of company operations.
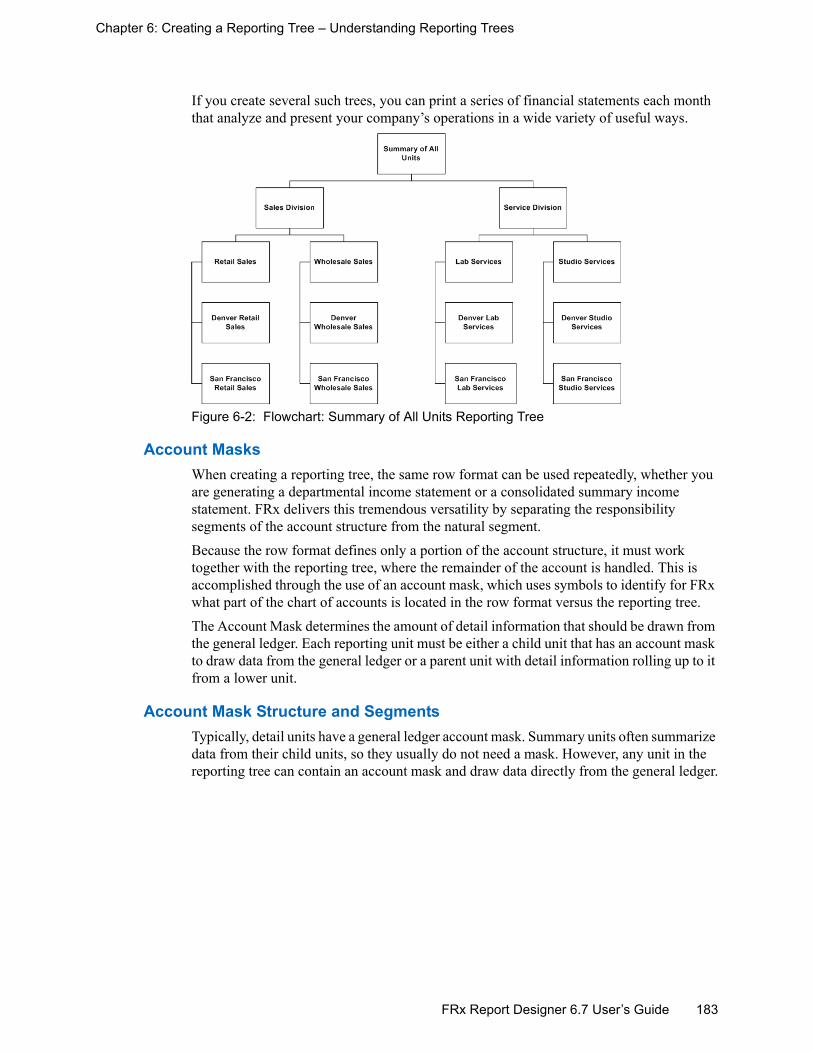
183FRx Report Designer 6.7 User’s Guide
Chapter 6: Creating a Reporting Tree – Understanding Reporting Trees
If you create several such trees, you can print a series of financial statements each month that analyze and present your company’s operations in a wide variety of useful ways.
Figure 6-2: Flowchart: Summary of All Units Reporting Tree
Account Masks When creating a reporting tree, the same row format can be used repeatedly, whether you are generating a departmental income statement or a consolidated summary income statement. FRx delivers this tremendous versatility by separating the responsibility segments of the account structure from the natural segment. Because the row format defines only a portion of the account structure, it must work together with the reporting tree, where the remainder of the account is handled. This is accomplished through the use of an account mask, which uses symbols to identify for FRx what part of the chart of accounts is located in the row format versus the reporting tree.The Account Mask determines the amount of detail information that should be drawn from the general ledger. Each reporting unit must be either a child unit that has an account mask to draw data from the general ledger or a parent unit with detail information rolling up to it from a lower unit.
Account Mask Structure and Segments Typically, detail units have a general ledger account mask. Summary units often summarize data from their child units, so they usually do not need a mask. However, any unit in the reporting tree can contain an account mask and draw data directly from the general ledger.

184FRx Report Designer 6.7 User’s Guide
Chapter 6: Creating a Reporting Tree – Understanding Reporting Trees
For example, the account mask for Fabrikam Works, Inc. is shown in the following figure.
Figure 6-3: Fabrikam Works, Inc. Account Mask Segment Structure
In the previous example, each position within a segment is depicted with an X symbol to help visualize the formatting structure of an account mask. Account masks that you create will contain a plus sign (+), a hook (&), or a wildcard (?) symbol in place of this X. These symbols (+,&,?) in the account mask tell FRx the amount of information to be drawn from the general ledger.
Account Mask ExampleIn the following figure, you can view the account mask for the Sales-Denver reporting unit in the Fabrikam Works, Inc. reporting tree.
Figure 6-4: Account Masks in Reporting Tree Window
Note The number of symbols (+, &, ?) in the reporting tree must match the number of characters or digits in the row format. For example, a row format might have seven digits in the Link to General Ledger column, representing the natural segment plus a responsibility segment. In this case, there would have to be seven hooks (&&&&&&&) in the reporting tree representing the natural and responsibility information.
Account Mask XXXX XXXX XXX
Natural Account Code
Locations:0 = Corporate HQ1 = Denver2 = San Francisco
Divisions:000 = Corporate100 = Sales200 = Service
Departments:001 = Retail002 = Wholesale003 = Lab004 = Studio012 = Intercompany
Account Mask

185FRx Report Designer 6.7 User’s Guide
Chapter 6: Creating a Reporting Tree – Understanding Reporting Trees
FRx created this account mask (&&&&-1100-???) when building the reporting tree, and now displays it in the Acct Mask column for the Sales-Denver reporting unit.
The first segment of the account mask for the Sales-Denver reporting unit (&&&&-1100-???) is the natural account code. The natural account code is depicted by four hooks represented by the ampersand (&) character. These hooks correspond to the four digits in the Link to General Ledger column of the row format shown in Figure 6-5.
Figure 6-5: Row Format with GL Link
The second segment of the Sales-Denver reporting unit mask (&&&&-1100-???) is 1100. This segment represents the location and the division, where 1 = Denver (location) and 100 = Sales (division).
Note The specific account mask for Sales-Denver reporting unit (&&&&-1100-???) was created by FRx from the account mask entered (&&&&-++++-???) when building the reporting tree. The plus signs (+) in the Location/Division position of the original account mask instruct FRx to create a unit in the tree for each location/division in the general ledger, including the Sales-Denver reporting unit. FRx then assigns a specific account mask to each reporting unit and replaces the plus signs (+) with the location/division codes from the general ledger.
For more information illustrating the effect that plus signs (+), hooks (&), and wildcards (?) have on specific account masks, see Table 6-8, “Original Account Masks and Specific Account Masks,” on page 201.
The four hooks (&&&&) in the account mask for Sales-Denver reporting unit relate to these four digits.

186FRx Report Designer 6.7 User’s Guide
Chapter 6: Creating a Reporting Tree – Understanding Reporting Trees
Finally, in the third (department) segment of the account mask (&&&&-1100-???), wildcards are listed for the Sales and Service (department) reporting units. Wildcards in this segment instruct FRx to avoid building details into the tree from the row format. The hooks (&) in the natural segment already point to general ledger links in the row format that will pull in detailed information from the account(s) listed in the Link to General Ledger column. If you do not restrict the row with these wildcards, the tree pulls in the same data for every unit. This results in summary units that contain duplicate and incorrect totals.
Note If you used a full account code in your row format, you may also need to use a reporting unit restriction in the same row to prevent pulling duplicate date for reporting units

187FRx Report Designer 6.7 User’s Guide
Chapter 6: Creating a Reporting Tree – Reporting Tree Window
Reporting Tree Window When you open a reporting tree, it displays in the Reporting Tree window as a graphical tree on the window’s left side and as a worksheet on the right side. When you point to a reporting unit on one side of the window, it is also selected on the other side.Use the Reporting Tree window to view the hierarchy of parent/child reporting units and the account masks for reporting units.This section contains information and instructions on the:
Graphical Reporting Tree
Reporting Tree Worksheet
Graphical Reporting Tree The graphical tree (on the left side of the Reporting Tree window) shows reporting units on “tree branches” that help you to easily visualize the parent/child unit hierarchy relationship.You can use the Reporting Tree Format menu to control the appearance of your graphical tree with different outline styles. For example, when you select the Tree Lines, Picture, and Text outline style option, tree icons display to the left of each unit and indicate whether the reporting unit is a parent unit or a detail unit.
Other outline views include or exclude indentations and connecting lines. For more information on selecting an outline view for your graphical tree, see “Format Menu” on page 193. You may also find it helpful to expand or collapse the graphical reporting tree for different views of the hierarchy. For information on how to expand or collapse the graphical tree, see step 4 in “To view a reporting tree” on page 188.
Tree Icon Description
This symbol indicates parent units that have units reporting to them.
This symbol indicates detail units.
Table 6-1: Reporting Tree Icons

188FRx Report Designer 6.7 User’s Guide
Chapter 6: Creating a Reporting Tree – Reporting Tree Window
The following figure shows the graphical reporting tree for Fabrikam Works, Inc. This graphical tree shows the report hierarchy, and the relationship between each parent and child reporting unit.
Figure 6-6: Graphical Reporting Tree
In this example, the graphical reporting tree shows that the Corporate reporting unit is parent to the Corp-Detail reporting unit. The Denver and San Francisco reporting units are parents to the Sales and Service child units. All three of these parent reporting units (Corporate, Denver, and San Francisco) are child units to the Fabrikam Works parent.
Reporting Tree Worksheet You can also view parent and child reporting units, and their order, in the Reporting Tree worksheet (located on the right side of the Reporting Tree window).
Figure 6-7: Reporting Tree Worksheet
The worksheet displays each reporting unit in a separate row in the order of the reporting tree hierarchy. With its easy-to-read column format, you can also view the account mask (typically, for detail units), any additional text, and other information about the reporting unit. Essentially, the worksheet contains all the information that is also in the Reporting Units dialog box for an individual reporting unit. However, the Reporting Tree worksheet gives you the advantage of viewing all the reporting units together.For more information on the Reporting Units dialog box, see “Building a Reporting Tree with the Reporting Units Dialog Box” on page 206.
To view a reporting tree
You can view both the reporting tree worksheet and graphical reporting tree in the Reporting Tree window.
Graphical Reporting Tree
Easy-to-Read Column Format

189FRx Report Designer 6.7 User’s Guide
Chapter 6: Creating a Reporting Tree – Reporting Tree Window
1 From the FRx Control Panel, click the Reporting Trees icon to display the Open Tree dialog box.
2 Select a tree from the list and c lick OK to display it in the Reporting Tree window.
The tree displays showing the parent and child reporting units in a graphical reporting tree on the left and in a worksheet reporting tree on the right.
3 On the graphical tree to the left, view the hierarchy relationship of the parent and child reporting units.
4 To expand and collapse a branch of the tree, do one of the following:On the graphical tree, double-click a parent unit. Parent units are identified by yellow folders in the graphical tree display.On the Tree menu, select Expand Branch or Collapse Branch.
Note: Branches are collapsed or expanded for viewing purposes only. These branches (or units) will still appear in the final generated report.
5 On the worksheet tree to the right, view the reporting units and account masks.
6 On the File menu, click Close to close the reporting tree window.
Worksheet Reporting TreeGraphical Reporting Tree

190FRx Report Designer 6.7 User’s Guide
Chapter 6: Creating a Reporting Tree – Reporting Tree Menus and Toolbar Icon
Reporting Tree Menus and Toolbar IconFRx provides you with menus and a toolbar icon to help you get around in the Reporting Tree window and give you easy access to reporting tree commands. The menus and toolbar icon described in this are specific to the Reporting Tree window. For information about menus that appear in all FRx main windows, see “Defining Available Commands on Report Designer Menus” on page 18. Common toolbar buttons are explained in “The Toolbar” on page 12.This section contains information and instructions on:
Reporting Tree Menus
Reporting Tree Toolbar Icon
Reporting Tree MenusThe Reporting Tree window includes the following menus with specific reporting tree functions that you will find helpful when working with reporting trees:
File Menu
Edit Menu
Format Menu
Tree MenuDescriptions of the menu commands for each of these reporting tree menus are listed in the tables that follow.
File MenuThe File menu is shown in the following figure.
Figure 6-8: Reporting Tree File Menu

191FRx Report Designer 6.7 User’s Guide
Chapter 6: Creating a Reporting Tree – Reporting Tree Menus and Toolbar Icon
Menu commands for the File menu include common functions within the reporting tree, such as renaming, deleting, printing, and so on.
Edit MenuThe Edit menu is shown in the following figure.
Figure 6-9: Reporting Trees: Edit Menu
You can use the following Edit menu commands to perform edits within the reporting tree.
File Menu Command Description
Rename Opens the Rename Tree dialog box that allows you to rename the tree.
Delete Deletes a row, column, tree, or catalog.
Print Reporting Tree Opens the Print Tree dialog box, where you can then select either Worksheet View (to print the worksheet) or Tree Listing (to print the tree).
Table 6-2: Reporting Tree File Menu Commands
Edit Menu Command Description
Cut (Ctrl + X)
Removes the selection from the current location and moves it to the Microsoft® Windows® clipboard.
Copy (Ctrl + C)
Copies the current selection to the Windows clipboard.
Paste (Ctrl + V)
Copies the contents of the Windows clipboard to the cursor position. If the clipboard is empty, this command is unavailable (dimmed). You can use the Paste function to paste information copied from other Windows applications, or from other FRx worksheets, into this worksheet.
Clear Clears (makes blank) all selected cells.
Table 6-3: Reporting Tree Edit Menu Commands

192FRx Report Designer 6.7 User’s Guide
Chapter 6: Creating a Reporting Tree – Reporting Tree Menus and Toolbar Icon
Find(Ctrl + F)
Opens the Find dialog box so that you can locate information contained in the worksheet.
Replace(Ctrl + R)
Opens the Replace dialog box so that you can locate and replace information contained in the worksheet.
Add Reporting Units from Chart of Accts
Opens the Add Reporting Units from Chart of Accounts dialog box. Use this to create a new reporting tree using current chart of accounts data.
For more information about this command, see “Understanding Building Reporting Trees Automatically” on page 197.
Description(Ctrl + D)
Opens a dialog box where you can edit a reporting tree description. In the Description box, type the text you want to describe the reporting tree. You can use upper- and lower-case letters, numbers, and spaces.
The Specification Set and Name boxes are display-only boxes. You cannot access or change them.
Note: You must save the reporting tree in order to save the description change.
Delete Unit Deletes the reporting unit at the current cursor position.
Click the gray box in front of the row you want to delete, and then click Delete Unit.
You can then confirm the deletion in the confirmation window.
Insert Unit Inserts a new reporting unit at the current cursor position.
Click the gray box in front of the reporting unit before which you want to insert a new reporting unit, and then click Insert Unit or an existing tree.
Note: You cannot insert a row on the first (summary) row.
Zoom (F3)
In cells that support this function, pens a dialog box with a list of valid values to select from; displays dimmed if this function is unavailable.
Edit Menu Command Description
Table 6-3: Reporting Tree Edit Menu Commands (Continued)
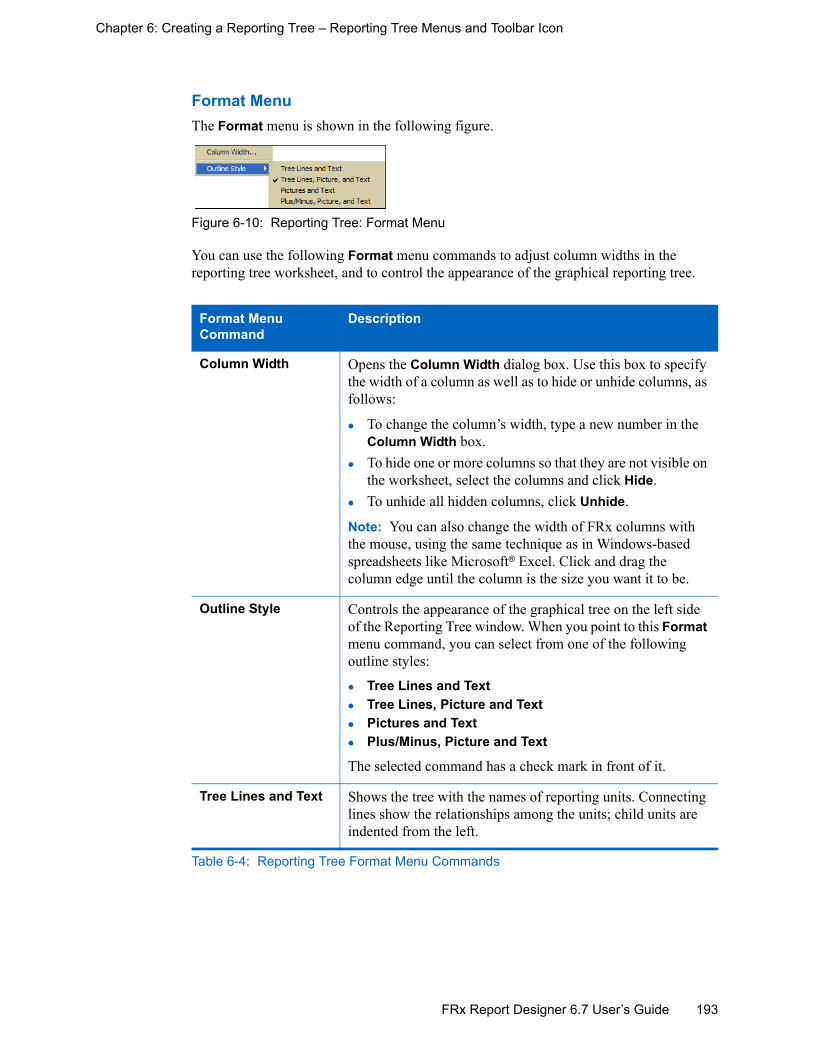
193FRx Report Designer 6.7 User’s Guide
Chapter 6: Creating a Reporting Tree – Reporting Tree Menus and Toolbar Icon
Format Menu The Format menu is shown in the following figure.
Figure 6-10: Reporting Tree: Format Menu
You can use the following Format menu commands to adjust column widths in the reporting tree worksheet, and to control the appearance of the graphical reporting tree.
Format Menu Command
Description
Column Width Opens the Column Width dialog box. Use this box to specify the width of a column as well as to hide or unhide columns, as follows:
To change the column’s width, type a new number in the Column Width box.To hide one or more columns so that they are not visible on the worksheet, select the columns and click Hide.To unhide all hidden columns, click Unhide.
Note: You can also change the width of FRx columns with the mouse, using the same technique as in Windows-based spreadsheets like Microsoft® Excel. Click and drag the column edge until the column is the size you want it to be.
Outline Style Controls the appearance of the graphical tree on the left side of the Reporting Tree window. When you point to this Format menu command, you can select from one of the following outline styles:
Tree Lines and TextTree Lines, Picture and TextPictures and TextPlus/Minus, Picture and Text
The selected command has a check mark in front of it.
Tree Lines and Text Shows the tree with the names of reporting units. Connecting lines show the relationships among the units; child units are indented from the left.
Table 6-4: Reporting Tree Format Menu Commands
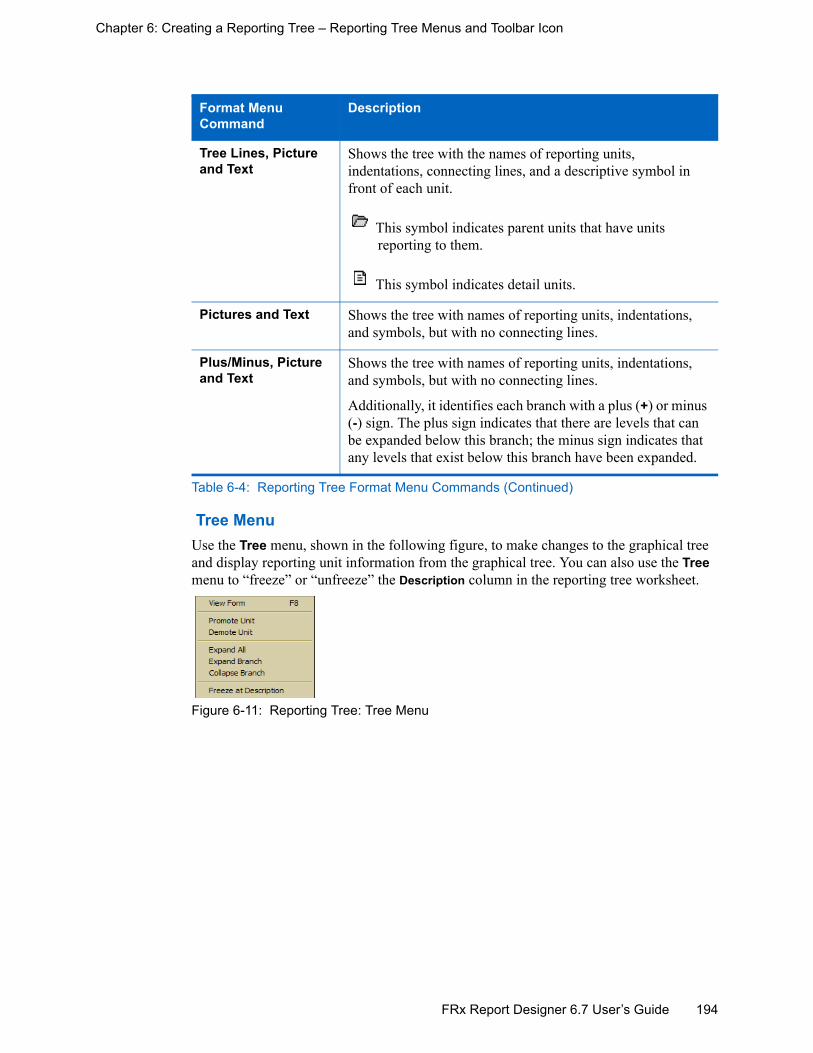
194FRx Report Designer 6.7 User’s Guide
Chapter 6: Creating a Reporting Tree – Reporting Tree Menus and Toolbar Icon
Tree MenuUse the Tree menu, shown in the following figure, to make changes to the graphical tree and display reporting unit information from the graphical tree. You can also use the Tree menu to “freeze” or “unfreeze” the Description column in the reporting tree worksheet.
Figure 6-11: Reporting Tree: Tree Menu
Tree Lines, Picture and Text
Shows the tree with the names of reporting units, indentations, connecting lines, and a descriptive symbol in front of each unit.
This symbol indicates parent units that have units reporting to them.
This symbol indicates detail units.
Pictures and Text Shows the tree with names of reporting units, indentations, and symbols, but with no connecting lines.
Plus/Minus, Picture and Text
Shows the tree with names of reporting units, indentations, and symbols, but with no connecting lines.
Additionally, it identifies each branch with a plus (+) or minus (-) sign. The plus sign indicates that there are levels that can be expanded below this branch; the minus sign indicates that any levels that exist below this branch have been expanded.
Format Menu Command
Description
Table 6-4: Reporting Tree Format Menu Commands (Continued)

195FRx Report Designer 6.7 User’s Guide
Chapter 6: Creating a Reporting Tree – Reporting Tree Menus and Toolbar Icon
On the graphical tree or worksheet, select a reporting unit (or branch, if applicable) and click one of the following Tree menu commands.
Tree Menu Command
Description
View Form Opens the Reporting Units dialog box, displaying the selected reporting unit information.
Use this dialog box to enter, delete, or change information about the selected reporting unit.
For more information about the boxes in the Reporting Units dialog box, see “Understanding Building Reporting Trees Manually” on page 203.
Promote Unit Promotes the selected unit in the reporting tree to the next highest level.
Demote Unit Demotes the selected unit in the reporting tree to the next lowest level.
Expand All Expands all of the tree’s detail.
Expand Branch Expands a selected branch by one level in the reporting tree to show additional detail.
The unit’s child units display. If there are multiple levels in the branch, they expand by an additional level each time you execute this command.
Collapse Branch Collapses a selected branch by one level in the reporting tree.
The unit’s child units disappear. If there are multiple levels in the branch, they collapse by an additional level each time you execute this command.
Table 6-5: (Reporting Tree) Tree Menu Commands - Graphical Tree Unit Selected
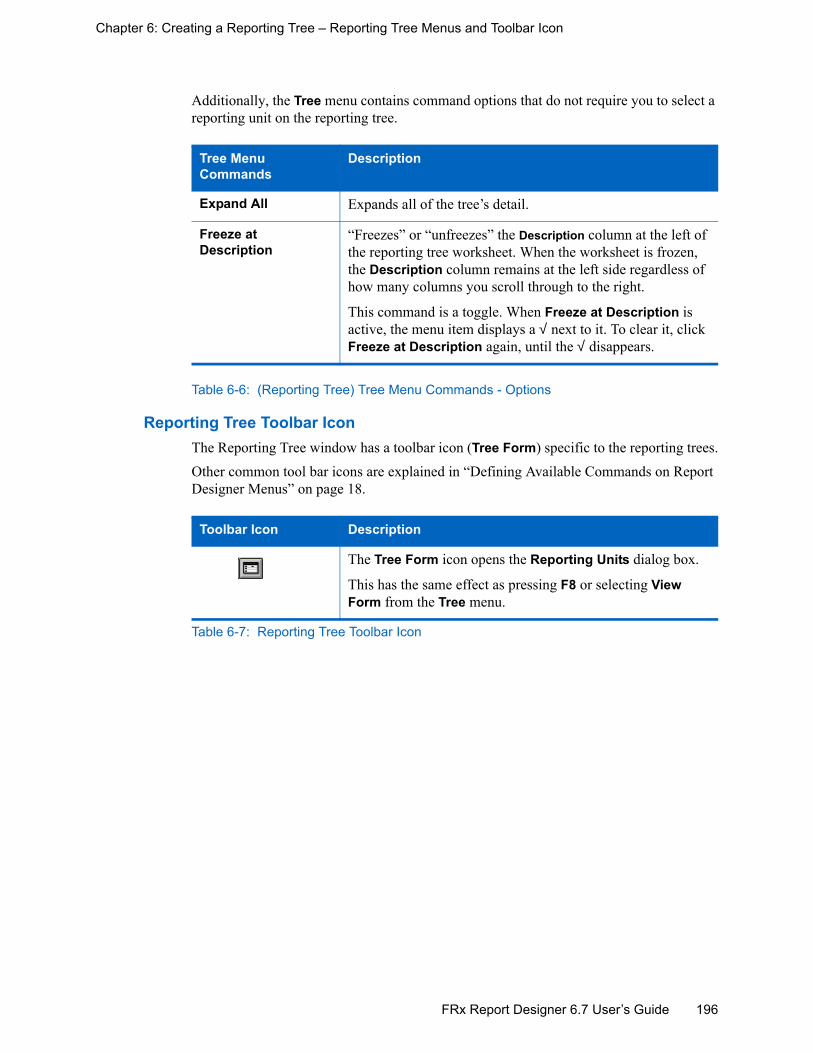
196FRx Report Designer 6.7 User’s Guide
Chapter 6: Creating a Reporting Tree – Reporting Tree Menus and Toolbar Icon
Additionally, the Tree menu contains command options that do not require you to select a reporting unit on the reporting tree.
Table 6-6: (Reporting Tree) Tree Menu Commands - Options
Reporting Tree Toolbar Icon The Reporting Tree window has a toolbar icon (Tree Form) specific to the reporting trees.Other common tool bar icons are explained in “Defining Available Commands on Report Designer Menus” on page 18.
Tree Menu Commands
Description
Expand All Expands all of the tree’s detail.
Freeze at Description
“Freezes” or “unfreezes” the Description column at the left of the reporting tree worksheet. When the worksheet is frozen, the Description column remains at the left side regardless of how many columns you scroll through to the right.
This command is a toggle. When Freeze at Description is active, the menu item displays a √ next to it. To clear it, click Freeze at Description again, until the √ disappears.
Toolbar Icon Description
The Tree Form icon opens the Reporting Units dialog box.
This has the same effect as pressing F8 or selecting View Form from the Tree menu.
Table 6-7: Reporting Tree Toolbar Icon

197FRx Report Designer 6.7 User’s Guide
Chapter 6: Creating a Reporting Tree – Understanding Building Reporting Trees
Understanding Building Reporting Trees Before you build any reporting trees, you will first need to determine the various reporting structures your company will require.The best approach is to carefully consider how you have set up your general ledger account structure. Once you have done that, you need to draw an organizational chart of your company. Use your current general ledger departments, projects, and so on as the lowest detail level. Add to these as many boxes as you need to show higher-level divisions or regions. Remember that each box represents a potential reporting unit in any of your reporting trees.This master organizational chart will help you visually to create reporting tree flowcharts that group together various boxes (reporting units) to create a reporting tree. You also will need to consider the best way to build your trees. With FRx, you can create trees using an automated build process or you can create them manually. It is important to understand both methods before designing your trees.This section contains information and instructions on:
Understanding Building Reporting Trees Automatically
Understanding Building Reporting Trees Manually
Understanding Building Reporting Trees Automatically FRx can assist you in building your reporting tree with its automated build capabilities. Before you begin you will need to understand how to use the Add Reporting Units from Chart of Accounts dialog box. We will look at some examples to show you how to complete the boxes and use the icons. Additionally, we will take a close look at the account masks entered in this window.

198FRx Report Designer 6.7 User’s Guide
Chapter 6: Creating a Reporting Tree – Understanding Building Reporting Trees
The following figure provides descriptions of each section in the Add Reporting Units from Chart of Accounts dialog box.
Figure 6-12: Add Reporting Units from Chart of Accounts Dialog Box
The appearance of this dialog box changes when you make different modifications to its options and boxes. You can make the following modifications:
Limit the location or division
Limit the department
Reverse the segment hierarchy of the tree
Split the segments into more functional components
Combine different segments
To understand these modifications more thoroughly, take a look at some of the following examples.
These boxes define how to build your reporting tree by making changes to the account mask.
The Combine icon changes the size of any of the displayed segments.
The Split icon (Cleaver), can split the segment characters.
The Segment Hierarchy box displays the segments graphically. You can move the segments to change their reporting order.
The Segment Ranges boxes can be used to specify a range of codes within each segment.

199FRx Report Designer 6.7 User’s Guide
Chapter 6: Creating a Reporting Tree – Understanding Building Reporting Trees
Example 1 - Limited Account Ranges by Location and DepartmentIn the dialog box pictured in Figure 6-13, we have limited the account ranges by location and department.
Figure 6-13: Limiting Accounts in Reporting Tree by Segment Range
Figure 6-14 shows the resulting regional reporting tree for Fabrikam Works.
Figure 6-14: Reporting Tree with Specific Locations and Departments
In this example, we have specified a range of codes for location and department segments.

200FRx Report Designer 6.7 User’s Guide
Chapter 6: Creating a Reporting Tree – Understanding Building Reporting Trees
Example 2 - Splitting the Account Mask and Changing the HierarchyIn this example, we have split the account mask and changed the hierarchy of the segments. Figure 6-15 shows how we first used the Split icon (cleaver) to separate the location away from the segment. Second, we dragged the New Segment to the top of the graphical segment hierarchy. Last, we used the Segment Range boxes to limit the account segment ranges and departments.
Figure 6-15: Splitting off the Location and Limiting Segments
The resulting functional reporting tree, sorted by location, is shown in Figure 6-16.
Figure 6-16: Functional Reporting Tree by Location
Account masks can be included in building a tree automatically. To learn more about account masks and symbols review the following topics:
Including an Account Mask when Building a Tree Automatically The account mask is built with the following segments: the natural account code, followed by the location, the divisions, and the departments.The number of positions within a segment varies with the actual number of characters or digits in the general ledger.
In this example, we used the Split icon to separate the Location/Division code and add a new segment.
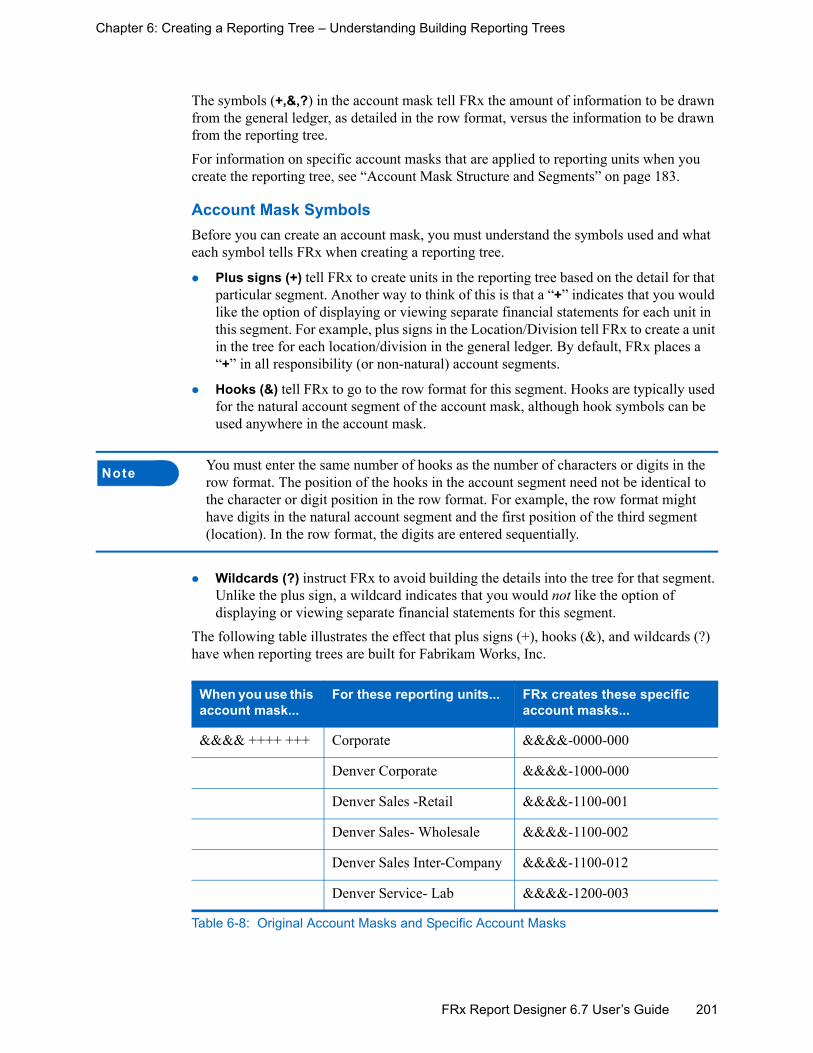
201FRx Report Designer 6.7 User’s Guide
Chapter 6: Creating a Reporting Tree – Understanding Building Reporting Trees
The symbols (+,&,?) in the account mask tell FRx the amount of information to be drawn from the general ledger, as detailed in the row format, versus the information to be drawn from the reporting tree.For information on specific account masks that are applied to reporting units when you create the reporting tree, see “Account Mask Structure and Segments” on page 183.
Account Mask SymbolsBefore you can create an account mask, you must understand the symbols used and what each symbol tells FRx when creating a reporting tree.
Plus signs (+) tell FRx to create units in the reporting tree based on the detail for that particular segment. Another way to think of this is that a “+” indicates that you would like the option of displaying or viewing separate financial statements for each unit in this segment. For example, plus signs in the Location/Division tell FRx to create a unit in the tree for each location/division in the general ledger. By default, FRx places a “+” in all responsibility (or non-natural) account segments.
Hooks (&) tell FRx to go to the row format for this segment. Hooks are typically used for the natural account segment of the account mask, although hook symbols can be used anywhere in the account mask.
Wildcards (?) instruct FRx to avoid building the details into the tree for that segment. Unlike the plus sign, a wildcard indicates that you would not like the option of displaying or viewing separate financial statements for this segment.
The following table illustrates the effect that plus signs (+), hooks (&), and wildcards (?) have when reporting trees are built for Fabrikam Works, Inc.
Note You must enter the same number of hooks as the number of characters or digits in the row format. The position of the hooks in the account segment need not be identical to the character or digit position in the row format. For example, the row format might have digits in the natural account segment and the first position of the third segment (location). In the row format, the digits are entered sequentially.
When you use this account mask...
For these reporting units... FRx creates these specific account masks...
&&&& ++++ +++ Corporate &&&&-0000-000
Denver Corporate &&&&-1000-000
Denver Sales -Retail &&&&-1100-001
Denver Sales- Wholesale &&&&-1100-002
Denver Sales Inter-Company &&&&-1100-012
Denver Service- Lab &&&&-1200-003
Table 6-8: Original Account Masks and Specific Account Masks

202FRx Report Designer 6.7 User’s Guide
Chapter 6: Creating a Reporting Tree – Understanding Building Reporting Trees
Denver Service - Studio &&&&-1200-004
San Francisco Corporate &&&&-2000-000
San Francisco Sales - Retail &&&&-2100-001
San Francisco Sales - Wholesale
&&&&-2100-002
San Francisco Sales - Inter-Company
&&&&-2100-012
San Francisco Service- Lab &&&&-2200-003
San Francisco Service - Studio
&&&&-2200-004
&&&& ++++ ??? Corporate &&&&-0000-???
Denver Corporate &&&&-1000-???
Denver Sales &&&&-1100-???
Denver Service &&&&-1200-???
San Francisco Corporate &&&&-2000-???
San Francisco Sales &&&&-2100-???
San Francisco Service &&&&-2200-???
&&&& ???? +++ Corporate &&&&-????-000
Retail &&&&-????-001
Wholesale &&&&-????-002
Lab &&&&-????-003
Studio &&&&-????-004
Inter-Company &&&&-????-012
&&&& ???? ??? All Locations, Divisions, and Departments
&&&&-????-???
When you use this account mask...
For these reporting units... FRx creates these specific account masks...
Table 6-8: Original Account Masks and Specific Account Masks (Continued)

203FRx Report Designer 6.7 User’s Guide
Chapter 6: Creating a Reporting Tree – Understanding Building Reporting Trees
The following topic describes building a reporting tree manually. You will find it helpful to review the following section whether you decide to build a reporting tree with the automatic build capabilities or whether you decide to build the reporting tree manually. Additionally, you will find the manual build information helpful for when you want to refine or edit a reporting tree that you have built automatically.When you are ready to start building a reporting tree automatically, go to “Building Reporting Trees Automatically” on page 213 for step-by-step instructions.
Understanding Building Reporting Trees Manually This section contains information you will need to understand building a reporting tree manually. You will also use this information to further refine or edit a reporting tree that you have built automatically from the general ledger chart of accounts.You can build a reporting tree manually using the Reporting Units dialog box or using the Reporting Tree worksheet. When you use the Reporting Units dialog box, you add one reporting unit at a time in a new (blank) Reporting Units dialog box. When you use the Reporting Tree worksheet, you can add a new reporting unit to the Reporting Tree window where you can also see the information for the previous units you have entered. The Reporting Tree worksheet also makes it easier for you to add similar information for the new units.You can use either the Reporting Units dialog box or the Reporting Tree worksheet to refine or edit reporting units, including reporting trees and reporting units created from the automatic build capabilities.When you build a reporting tree manually, you need to also define the parent-child relationships for the units in the reporting tree.The following topics give you information that you will need to do this.After you have built a reporting tree manually, you must define the parent-child relationships for the tree’s reporting structure.The easiest way to do this is to define all of the lowest-level child units, and then define each successive level of parent units. You can then link each parent to its appropriate children.
Detail and Summary Hierarchy CombinationsThe most common type of reporting tree is composed of parent units that pull summarized information from the detail units and child units that contain detail units of account information. However, many detail/summary hierarchy combinations can be created. A child unit can be both a child to the higher unit as well as a parent to a lower unit. See “Reporting Unit Structure” on page 181 for more information on the reporting unit structure.
Note The parent-child relationships are already defined for you if you build a reporting tree using the procedures described in “Building Reporting Trees Automatically” on page 213. You need to define these relationships only if you used the method described in “Building Reporting Trees Manually” on page 205.

204FRx Report Designer 6.7 User’s Guide
Chapter 6: Creating a Reporting Tree – Understanding Building Reporting Trees
You can create this parent/child hierarchy structure by moving individual reporting units or an entire branch (parent unit and all child units) to higher or lower levels on the graphical tree. This is called promoting and demoting units. Promoting a unit moves it to a higher level in the tree. Demoting a unit moves a unit to a lower level. When you build a tree manually, you can promote and demote reporting units using a drag-and-drop operation or using the Tree menu. See “To promote and demote reporting units with drag and drop” on page 211 or “To promote and demote reporting units with the Tree menu” on page 212 for the appropriate instructions.
Reporting Units WindowYou can also define a unit as a parent unit or assign a child to a specific parent unit on the Reporting Units window. See “To assign parent/child relationships in the Reporting Units dialog box” on page 212.After completing the tree reporting structure, you can verify that parent units have been selected for each child. For specific instructions on verifying parent units, see “To verify a unit’s parent unit” on page 212.When you are ready to start building a reporting tree manually, continue to the following section, “Building Reporting Trees Manually” on page 205.

205FRx Report Designer 6.7 User’s Guide
Chapter 6: Creating a Reporting Tree – Building Reporting Trees Manually
Building Reporting Trees ManuallyYou can build the reporting tree manually in the Reporting Tree worksheet, as shown below. Or, you can build a reporting tree manually using the Reporting Units dialog box. See “To build a reporting tree using the Reporting Units dialog box” on page 206. You can also use the Reporting Units dialog box or the worksheet in the Reporting Tree window to refine or edit an existing reporting tree.This section contains information and instructions on:
Building a Reporting Tree with the Reporting Tree Worksheet
Building a Reporting Tree with the Reporting Units Dialog Box
Defining Parent-Child Relationships
Verifying a Unit’s Parent Unit
Building a Reporting Tree with the Reporting Tree Worksheet To build a reporting tree using the Reporting Tree worksheet
1 Do one of the following:
2 In the worksheet on the right of the Reporting Tree window, enter the information for each reporting unit on a separate row and in the appropriate column. Starting with step 3, use the steps and information listed in the “To build a reporting tree using the Reporting Units dialog box” section to help you complete the worksheet.
The boxes in the Reporting Tree worksheet are essentially the same as the boxes in the Reporting Units dialog box shown in the instructions. When the labels that identify these boxes differ between the worksheet and the Reporting Units dialog box, the worksheet label is in parentheses after the dialog box label.
Note: To speed the entry of information that is the same for some or all units, you can use Copy and Paste commands on the Edit menu.
If you are Do this
Building a new reporting tree On the FRx File menu, point to New, and click Tree to display a blank Reporting Tree window.
Refining or editing an existing reporting tree
1 Do one of the following to display the Open Tree dialog box:From the FRx Control Panel, click the Reporting Trees iconOn the File menu, point to Open..., and click Tree...
2 Select a tree from the list to display it in the Reporting Tree window.
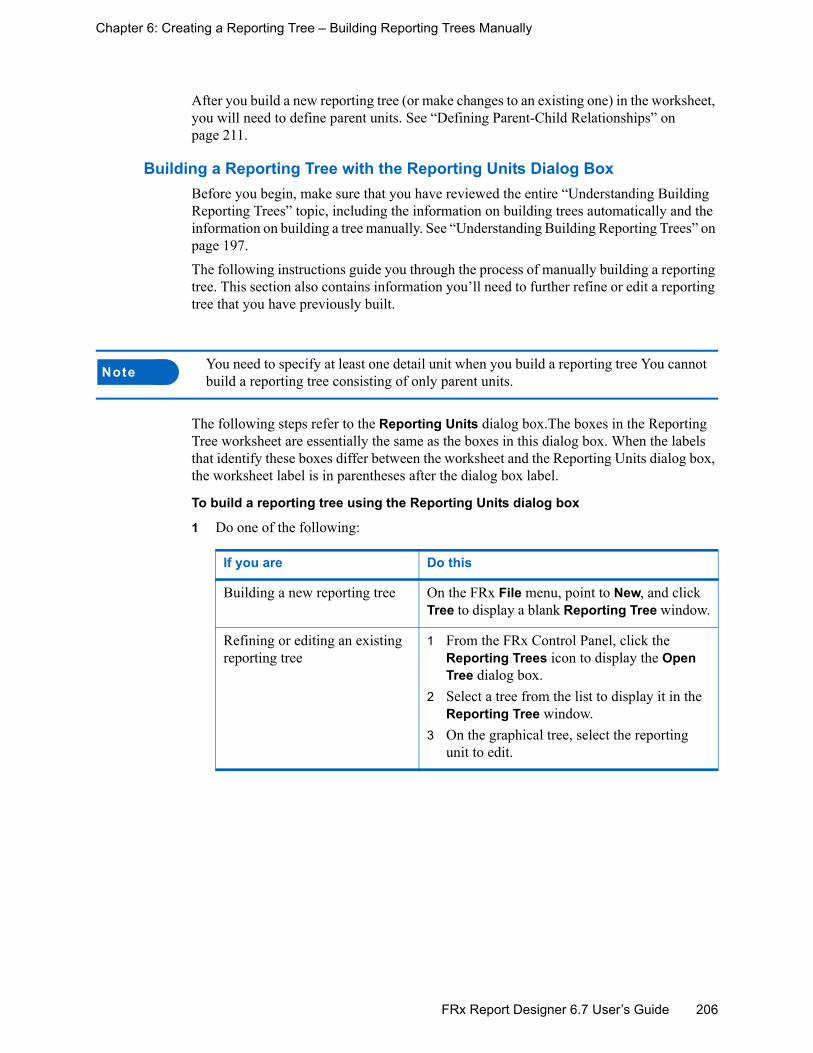
206FRx Report Designer 6.7 User’s Guide
Chapter 6: Creating a Reporting Tree – Building Reporting Trees Manually
After you build a new reporting tree (or make changes to an existing one) in the worksheet, you will need to define parent units. See “Defining Parent-Child Relationships” on page 211.
Building a Reporting Tree with the Reporting Units Dialog BoxBefore you begin, make sure that you have reviewed the entire “Understanding Building Reporting Trees” topic, including the information on building trees automatically and the information on building a tree manually. See “Understanding Building Reporting Trees” on page 197.The following instructions guide you through the process of manually building a reporting tree. This section also contains information you’ll need to further refine or edit a reporting tree that you have previously built.
The following steps refer to the Reporting Units dialog box.The boxes in the Reporting Tree worksheet are essentially the same as the boxes in this dialog box. When the labels that identify these boxes differ between the worksheet and the Reporting Units dialog box, the worksheet label is in parentheses after the dialog box label.
To build a reporting tree using the Reporting Units dialog box
1 Do one of the following:
Note You need to specify at least one detail unit when you build a reporting tree You cannot build a reporting tree consisting of only parent units.
If you are Do this
Building a new reporting tree On the FRx File menu, point to New, and click Tree to display a blank Reporting Tree window.
Refining or editing an existing reporting tree
1 From the FRx Control Panel, click the Reporting Trees icon to display the Open Tree dialog box.
2 Select a tree from the list to display it in the Reporting Tree window.
3 On the graphical tree, select the reporting unit to edit.

207FRx Report Designer 6.7 User’s Guide
Chapter 6: Creating a Reporting Tree – Building Reporting Trees Manually
2 Do one of the following to display the Reporting Units dialog box:Click the Tree Form icon.On the Tree menu, select View Form.
A blank dialog box displays if you are building a new reporting tree. If you are working with an existing reporting tree, the information for the reporting unit you selected in step 1 displays in the dialog box.
3 Do one of the following:
4 In the Unit Code box, enter a code (maximum 16 characters) to identify this reporting unit in the graphical reporting tree. For ease of use, establish a coding system that is consistent and easily understood by users.
Note: You can select the @RUNIT code in report headers and footers to display the unit code in the report. See “Reporting Unit Selection” on page 269.
5 In the % Allocation to Parent box, enter a percentage of this unit to be allocated (rolled up) to its parent unit. You can type the percentage with or without a decimal point. For example, type either .25 or 25 for a 25% rollup to the parent.
Note: If you use a percentage that is less than 1%, you must select the Allow Rollup <1% option in the Catalog of Reports. The Allow Rollup <1% option is located under Report Options on the Tree Options tab.
If you are Do this
Building a new reporting tree Complete steps 4–21.
Refining or editing an existing reporting tree
1 Complete the following steps as needed to refine or edit your reporting tree.
2 Click OK to save the changes in the reporting tree.

208FRx Report Designer 6.7 User’s Guide
Chapter 6: Creating a Reporting Tree – Building Reporting Trees Manually
The percentage you enter here applies to each row of the row format before it is added to the parent report. For example, if a child unit is to be divided evenly between two departments, the amounts in each row would be multiplied by 50% before being added to the department report.
Note: A reporting unit cannot have two parents. To do this, you would need to create another reporting unit with the same account mask to roll up the additional 50%.
6 In the Company box, select one of the following:
7 In the Title/Desc box, type an appropriate title for this reporting unit to display in selection windows for reporting units.
Note: The reporting unit title also displays in the report header or footer if you enter @TITLE as a code under Page Options, on the Header/Footers tab in the Catalog of Reports. It also displays in the report row description if you enter @UNIT in the row format description box.
8 In the Informal Desc box, type an optional informal description to be used for reference purposes only. It is not displayed in any window listings or printed on any reports.
To create a reporting tree for Do this
One particular company Select the company code from the list.
Multiple companies with similar account coding
Select @ANY from the list so that this tree can be used for all companies.
Note: If you use @ANY, FRx pulls the company information from the Catalog of Reports. Typically, the @ANY company is set for the top (summary) level of the tree, only. All child branches have a company assigned to them.
Consolidated reporting Select the appropriate company code for each unit from the list to include in the reporting tree. This directs FRx to the appropriate location and format of general ledger data for that company.
Note: This information is defined in the Company Information dialog box available from the Company menu.

209FRx Report Designer 6.7 User’s Guide
Chapter 6: Creating a Reporting Tree – Building Reporting Trees Manually
9 If you are entering a detail unit (one that pulls data from the general ledger, a row format, or an external worksheet), in the Account Mask (Acct Mask) box, you must type an account mask using the following account mask character types:
Hook (&), represented by the ampersand character, to go to the row format account codes at report generation time. Wild card (?), represented by the question mark, to avoid building any specific detail unit into the tree.
You can also place an account mask in a summary unit (for example, for expenses directly related to that unit):
Note: If you place an account mask on a summary unit, accounts that are used in parent units should not be used in child units, because this would cause amounts to be duplicated.
See Figure 6-4, “Account Masks in Reporting Tree Window,” on page 184 for an example account mask structure.
10 Do one of the following:
For more information on using international formats, refer to your FRx® Report Designer 6.7 Administrator’s Guide.
11 To begin the report for this reporting unit on a new page, do the following:Select Page Break Before Unit.In the Catalog of Reports, on the Tree Options tab, select the Report Options Use Reporting Tree to use whatever page breaks you defined in the reporting tree.
12 In the Optional Row Formats and Links section (shown below), you can enter information that specifies the unit’s links to the general ledger, external spreadsheet, or row format.
Note: For more information, see “Linking to External Worksheets” on page 124.
To Do this
Apply a format style relating to specific reporting unit amounts
In the Int’l Format box, select a format style from the list.
Keep the format specified for the unit’s company (as indicated in the Company box)
Leave the Int’l Format box blank.
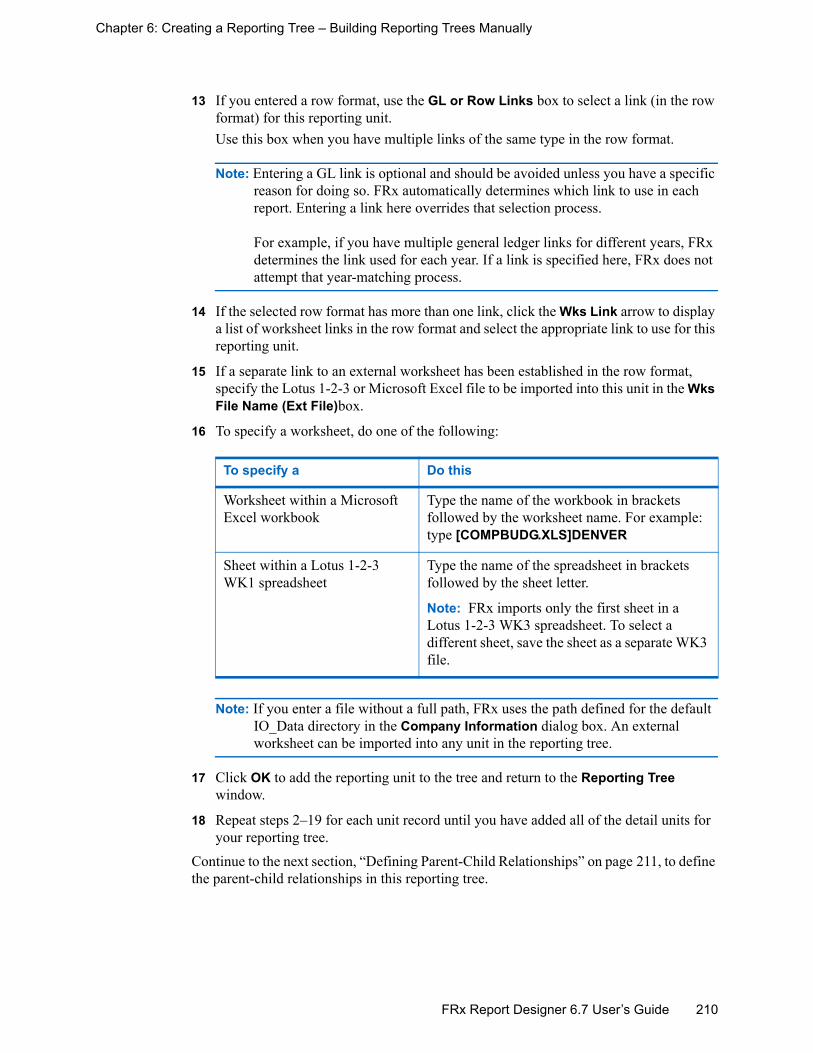
210FRx Report Designer 6.7 User’s Guide
Chapter 6: Creating a Reporting Tree – Building Reporting Trees Manually
13 If you entered a row format, use the GL or Row Links box to select a link (in the row format) for this reporting unit.Use this box when you have multiple links of the same type in the row format.
Note: Entering a GL link is optional and should be avoided unless you have a specific reason for doing so. FRx automatically determines which link to use in each report. Entering a link here overrides that selection process.
For example, if you have multiple general ledger links for different years, FRx determines the link used for each year. If a link is specified here, FRx does not attempt that year-matching process.
14 If the selected row format has more than one link, click the Wks Link arrow to display a list of worksheet links in the row format and select the appropriate link to use for this reporting unit.
15 If a separate link to an external worksheet has been established in the row format, specify the Lotus 1-2-3 or Microsoft Excel file to be imported into this unit in the Wks File Name (Ext File)box.
16 To specify a worksheet, do one of the following:
Note: If you enter a file without a full path, FRx uses the path defined for the default IO_Data directory in the Company Information dialog box. An external worksheet can be imported into any unit in the reporting tree.
17 Click OK to add the reporting unit to the tree and return to the Reporting Tree window.
18 Repeat steps 2–19 for each unit record until you have added all of the detail units for your reporting tree.
Continue to the next section, “Defining Parent-Child Relationships” on page 211, to define the parent-child relationships in this reporting tree.
To specify a Do this
Worksheet within a Microsoft Excel workbook
Type the name of the workbook in brackets followed by the worksheet name. For example: type [COMPBUDG.XLS]DENVER
Sheet within a Lotus 1-2-3 WK1 spreadsheet
Type the name of the spreadsheet in brackets followed by the sheet letter.
Note: FRx imports only the first sheet in a Lotus 1-2-3 WK3 spreadsheet. To select a different sheet, save the sheet as a separate WK3 file.

211FRx Report Designer 6.7 User’s Guide
Chapter 6: Creating a Reporting Tree – Building Reporting Trees Manually
Defining Parent-Child Relationships Follow these instructions only if you build a reporting tree manually. The parent-child relationships are already defined for you if you build a reporting tree using the procedures described in “Building Reporting Trees Automatically” on page 213. After you build a reporting tree manually, you must define the parent-child relationship of the reporting unit. You can do this by promoting and demoting reporting units on the graphical reporting tree using one of the following methods:
The drag and drop operation - See “To promote and demote reporting units with drag and drop” on page 211.
The Tree menu - See “To promote and demote reporting units with the Tree menu” on page 212.
You can also use the Reporting Units dialog box to assign a child unit to a parent unit, or designate a unit as the parent unit. See “To assign parent/child relationships in the Reporting Units dialog box” on page 212 for instructions.For more information on defining parent units, see “Defining Parent-Child Relationships” on page 211. After you defined the parent-child relationship, you can verify the parent unit for a specific reporting unit. See “To verify a unit’s parent unit” on page 212 for instructions.This section contains information and instructions on:
Promoting and Demoting Reporting Units with Drag and Drop
Promoting and Demoting Reporting Units with the Tree Menu
Assigning Parent/Child Relationships in the Reporting Units Dialog Box
Promoting and Demoting Reporting Units with Drag and Drop To promote and demote reporting units with drag and drop
You can rearrange the organizational structure of the reporting tree by dragging and dropping a reporting unit into a new position. When you drag a reporting unit, the pointer’s graphic icon changes to indicate the current position of the reporting unit. The different graphic icons of the tree pointer are shown in the following table.
1 In the Reporting Tree window, on the graphical tree, click a reporting unit.
2 Drag and drop the unit to a new position.
Reporting tree pointer
Description
Use this pointer to make the selected unit a child of the targeted unit.
Use this pointer to make the selected unit a child of the targeted unit.
Table 6-9: Reporting Tree Pointer
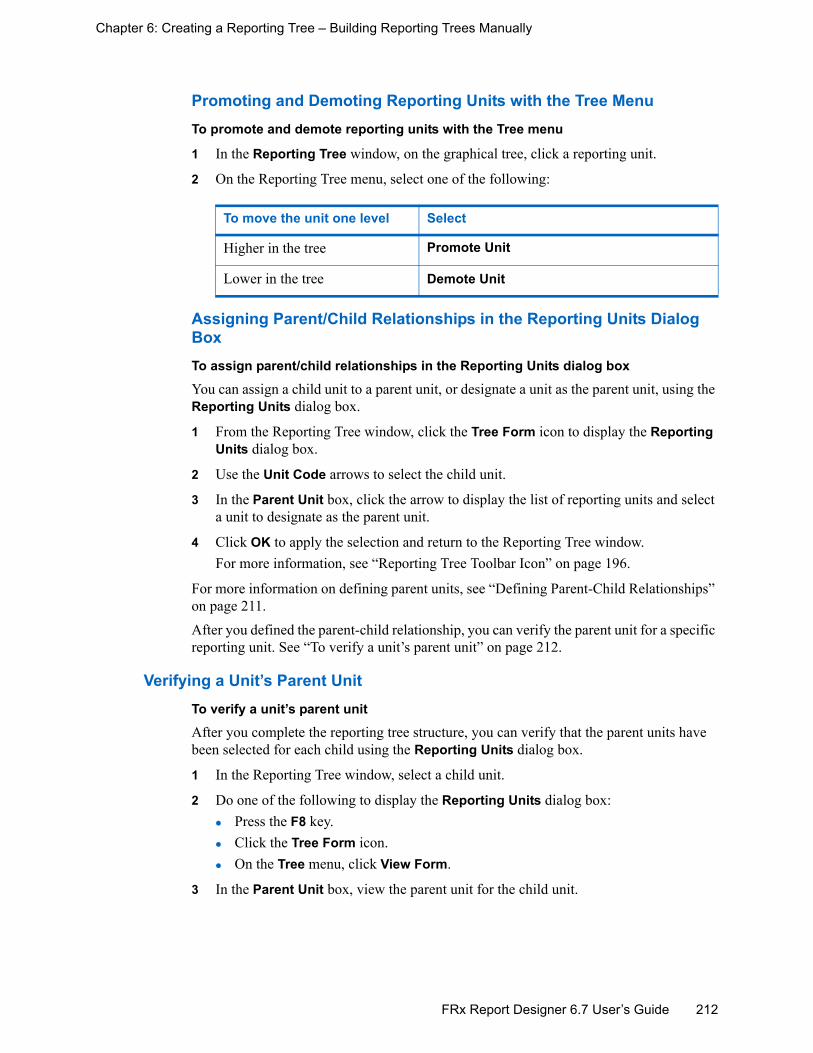
212FRx Report Designer 6.7 User’s Guide
Chapter 6: Creating a Reporting Tree – Building Reporting Trees Manually
Promoting and Demoting Reporting Units with the Tree MenuTo promote and demote reporting units with the Tree menu
1 In the Reporting Tree window, on the graphical tree, click a reporting unit.
2 On the Reporting Tree menu, select one of the following:
Assigning Parent/Child Relationships in the Reporting Units Dialog BoxTo assign parent/child relationships in the Reporting Units dialog box
You can assign a child unit to a parent unit, or designate a unit as the parent unit, using the Reporting Units dialog box.
1 From the Reporting Tree window, click the Tree Form icon to display the Reporting Units dialog box.
2 Use the Unit Code arrows to select the child unit.
3 In the Parent Unit box, click the arrow to display the list of reporting units and select a unit to designate as the parent unit.
4 Click OK to apply the selection and return to the Reporting Tree window. For more information, see “Reporting Tree Toolbar Icon” on page 196.
For more information on defining parent units, see “Defining Parent-Child Relationships” on page 211. After you defined the parent-child relationship, you can verify the parent unit for a specific reporting unit. See “To verify a unit’s parent unit” on page 212.
Verifying a Unit’s Parent UnitTo verify a unit’s parent unit
After you complete the reporting tree structure, you can verify that the parent units have been selected for each child using the Reporting Units dialog box.
1 In the Reporting Tree window, select a child unit.
2 Do one of the following to display the Reporting Units dialog box:Press the F8 key.Click the Tree Form icon.On the Tree menu, click View Form.
3 In the Parent Unit box, view the parent unit for the child unit. tree has been added to the box
To move the unit one level Select
Higher in the tree Promote Unit
Lower in the tree Demote Unit
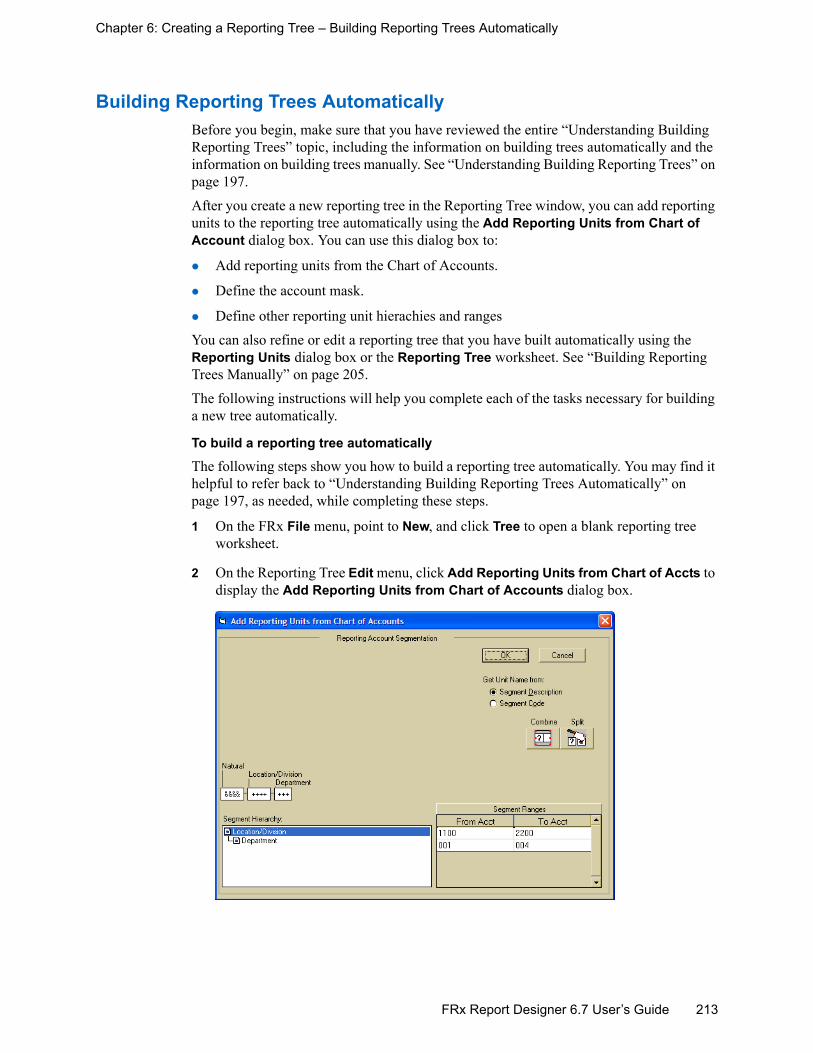
213FRx Report Designer 6.7 User’s Guide
Chapter 6: Creating a Reporting Tree – Building Reporting Trees Automatically
Building Reporting Trees Automatically Before you begin, make sure that you have reviewed the entire “Understanding Building Reporting Trees” topic, including the information on building trees automatically and the information on building trees manually. See “Understanding Building Reporting Trees” on page 197.After you create a new reporting tree in the Reporting Tree window, you can add reporting units to the reporting tree automatically using the Add Reporting Units from Chart of Account dialog box. You can use this dialog box to:
Add reporting units from the Chart of Accounts.
Define the account mask.
Define other reporting unit hierachies and rangesYou can also refine or edit a reporting tree that you have built automatically using the Reporting Units dialog box or the Reporting Tree worksheet. See “Building Reporting Trees Manually” on page 205.The following instructions will help you complete each of the tasks necessary for building a new tree automatically.
To build a reporting tree automatically
The following steps show you how to build a reporting tree automatically. You may find it helpful to refer back to “Understanding Building Reporting Trees Automatically” on page 197, as needed, while completing these steps.
1 On the FRx File menu, point to New, and click Tree to open a blank reporting tree worksheet.
2 On the Reporting Tree Edit menu, click Add Reporting Units from Chart of Accts to display the Add Reporting Units from Chart of Accounts dialog box.

214FRx Report Designer 6.7 User’s Guide
Chapter 6: Creating a Reporting Tree – Building Reporting Trees Automatically
3 Under Reporting Account Segmentation, in the Natural segment box, type a hook (&) for each number in the natural account segment to tell FRx to go to the row format.For example, use &&&& for a four-digit natural account segment.
4 Under Reporting Account Segmentation, in each segment box, type an account mask using one of the following account mask character types.
5 To change the size of any of the displayed segments, click Combine, and then click the segment separator. Otherwise, go to step 7.
6 With the segment separator selected, use the double arrows to re-size the box.
7 To split a segment (such as location/division), click Split, and then click the part of the segment where you want to split the characters to create a new segment.
8 To change the hierarchy of the segments in the Segment Hierarchy box, click the segment you want to move, and drag it to the segment to which it should report.
Note: This is where you define how segments report to each other and define ranges, if desired, for each segment.
9 To specify a range of account numbers to bring to the new reporting tree, in the Segment Hierarchy box, select the segment for which you want to define ranges and complete steps 10-11. Otherwise, go to step 12.
Note: When you select the segment in the Segment Hierarchy box, the cursor moves to the From Acct box for that segment.
10 In the From Acct box for that segment, type the first account number in the range, and press the TAB key to move the cursor to the To Acct box.
11 In the To Acct box, type the last account number you want to use for this segment.
Account mask character type Tells FRx to
Plus sign (+)
Note: By default, FRx places a + (plus sign) in the all of the responsibility (or non-natural) account segments.
Create a unit in the tree for this segment information in the general ledger.
Hook (&), represented by the ampersand character
Go to the row format for the this segment information.
Wild card (?), represented by the question mark
Avoid building details into the tree for this segment information.

215FRx Report Designer 6.7 User’s Guide
Chapter 6: Creating a Reporting Tree – Building Reporting Trees Automatically
12 In the Segment Hierachy box, select a segment, and under Get Unit Name from, select one of the following:
13 For each segment in the Segment Hierarchy box, repeat steps 4-12.
14 When you have defined your account segments, hierarchies, and ranges the way you want them brought in to the new reporting tree from the chart of accounts, click OK to build a reporting tree and display it in the Reporting Tree worksheet.
15 When you are through editing the new tree’s reporting units, on the Reporting Tree File menu, click Save to save the new tree.
Get Unit Name option To assign the tree segment a
Segment Description Descriptive name based on your general ledger segment information.
Segment Code Short name as the actual account code segment value.

216FRx Report Designer 6.7 User’s Guide
Chapter 6: Creating a Reporting Tree – Adding Text and E-mail Links to a Reporting Tree
Adding Text and E-mail Links to a Reporting TreeAfter you build a reporting tree, either manually or automatically, you can add text entries or an e-mail link to the reporting units in the tree. The following section, “To add additional text to the reporting units in a tree” shows you how to add text entries. See “To add e-mail addresses to a reporting tree” on page 217 when you want to add any e-mail links.This section contains information and instructions on:
Adding Text to the Reporting Units in a Tree
Adding E-mail Addresses to a Reporting Tree
Adding Text to the Reporting Units in a Tree You can create up to ten additional text entries for each reporting unit in a reporting tree. Each additional text entry can have a maximum length of 255 characters. Once you have created the additional text entries in the reporting tree, you can add the additional text entries to the row format or to the header/footer section in reports. For more information about adding additional text to row formats, see “To use additional text in the row format” on page 72. For information about adding additional text to the headers and footers in reports, see “Including Additional Text in a Report” on page 283.
To add additional text to the reporting units in a tree
1 In the Reporting Tree window, select the Reporting Unit row to which you want to add text.
2 Scroll to the right in the worksheet, and then click in the Additional Text cell for the reporting unit.
3 Click the Additional Text arrow to display the Additional Text dialog box.

217FRx Report Designer 6.7 User’s Guide
Chapter 6: Creating a Reporting Tree – Adding Text and E-mail Links to a Reporting Tree
4 In the Additional Text dialog box, you can do the following:
Note: The Additional Text box has ten rows available for text entries. You can include two entries in an Additional Text box separated by a semicolon (;). For example, in the first Additional Text box, type Adjusted after acquisition(;)Unadjusted.To use a semicolon as a character in the text entry, enclose the semicolon in single quotes (‘;’).
Adding E-mail Addresses to a Reporting Tree You can enter e-mail recipients in the Reporting Tree window, in the Catalog of Reports, or both. E-mail addresses must be set up in the reporting tree in order to make the Use Tree or Combined Catalog and Tree options available from the Catalog of Reports. Selecting a combined catalog and tree e-mail security sends users in the catalog an e-mailed file containing only the units available to them in the tree. For more information about selecting the Use Tree e-mail option from the Catalog of Reports, see “Enable E-mail Options” on page 254.
To add e-mail addresses to a reporting tree
1 From the FRx Control Panel, click the Reporting Trees icon to display the Open Tree dialog box.
2 Select a reporting tree.
To Do this
Add additional text to a reporting unit
1 In the first blank row, type the text (up to 255 characters).
2 To add additional text entries for this reporting unit, in a new blank row, type the text.
3 Click OK.
Remove a text entry for a reporting unit
1 Select the entry to remove.2 Click Clear.
Close the Additional Text dialog box without saving changes
Click Cancel.

218FRx Report Designer 6.7 User’s Guide
Chapter 6: Creating a Reporting Tree – Adding Text and E-mail Links to a Reporting Tree
3 Click OK to display the reporting tree in the Reporting Tree window.
4 On the graphical tree, select a reporting unit. The corresponding row in the worksheet to the right becomes highlighted.
5 In the worksheet, scroll to the right to display the Security/E-Mail column.
6 In the selected reporting unit row, click the Security/E-Mail arrow to display the Tree Unit Security and E-mail dialog box.
7 To include lower level (child) reporting units in the e-mail recipient’s view of the report, select the Add to children check box.

219FRx Report Designer 6.7 User’s Guide
Chapter 6: Creating a Reporting Tree – Adding Text and E-mail Links to a Reporting Tree
8 To add users to the Access Granted list box, do one of the following:
To add Do this
Users from the e-mail address books
1 In the Tree Unit Security and E-mail dialog box, click E-mail to display the e-mail address book dialog box.
2 In the Show Names from the box, select an address book from the list to display a list of user e-mail addresses.
3 In the e-mail address list on the left, select a user’s e-mail address from the list.
Note: To select multiple e-mail user addresses, press the Ctrl key and select each e-mail address to include.
4 Click To-> to add the e-mail addresses for the selected users to the list on the right.
5 Click OK.
Users from the FRx Users list Note: The FRx Users list is available only when FRx Security is active. User profiles must include an e-mail address for this selection to work correctly. See your FRx® Report Designer 6.7 Administrator’s Guide for details.
1 In the Tree Unit Security and E-mail dialog box, click FRx Users to display the Select a User dialog box.
2 Select the user names to include from the list.
Note: To select multiple user names, press the Ctrl key and select each user to include.
3 Click OK.

220FRx Report Designer 6.7 User’s Guide
Chapter 6: Creating a Reporting Tree – Adding Text and E-mail Links to a Reporting Tree
9 To remove a user (or group) from the Access Granted list, do the following:
10 Click OK.
11 On the Reporting Tree File menu, click Save to save the tree.
Users from the FRx Groups list Note: The FRx Groups list is available only when FRx Security is active. User profiles for all members of the group must include the individual e-mail addresses for this selection to work correctly. See your FRx® Report Designer 6.7 Administrator’s Guide for details.
1 In the Tree Unit Security and E-mail dialog box, click FRx Groups to display the Select a Group dialog box.
2 Select the group names to include from the list.
Note: To select multiple user names, press the Ctrl key and select each user to include.
3 Click OK.
Individual users 1 In the Add Individual Users box, type the e-mail address of the user.
2 Click Add.
To remove Do this
Specific users (or group) 1 In the Access Granted list box, select the user e-mail address to remove.
Note: To select multiple user e-mail addresses, press the Ctrl key and select each e-mail address to remove.
2 Click Remove.
All users and clear the entire list Click Remove All.
To add Do this

221FRx Report Designer 6.7 User’s Guide
Chapter 6: Creating a Reporting Tree – Securing Reporting Tree Units
Securing Reporting Tree UnitsWhen FRx security is active, you can restrict access to individual reporting units with the tree from the Security/E-Mail column in the reporting tree worksheet. Only those users and groups who have been granted access can view the report detail for the secured reporting units in the resulting FRx reports.
To secure reporting tree units
1 Open a reporting tree in Report Designer.
2 Select the reporting unit to secure in the graphical reporting tree or select the reporting unit row in the worksheet.The selected reporting unit row is highlighted. This helps you follow the row as you scroll right to display column P.
3 Double-click the Security/E-Mail cell (column P) in the selected row to open the Tree Security and E-mail dialog box.

222FRx Report Designer 6.7 User’s Guide
Chapter 6: Creating a Reporting Tree – Securing Reporting Tree Units
4 Select from the following options:
Note: You may grant access to both users and groups in the same reporting unit Security/E-Mail cell.
5 To remove a user (or group) from the Access Granted list, do the following:
6 Click OK.
7 On the Reporting Tree File menu, click Save to save the tree.
To grant access to Do this
Specific FRx users 1 Click FRx Users to open the Select a User dialog box.
2 Select the user ID and user name row from the list.
3 Click OK to add the selected user to the Access Granted list.
4 Repeat steps 1 to 4 to add other users.
Members of FRx groups 1 Click FRx Groups to open the Select Group dialog box.
2 Select the group ID and group name row from the list.
3 Click OK to add the selected group to the Access Granted list.
4 Repeat steps 1 to 4 to add other groups.
To remove Do this
Specific users (or group) 1 In the Access Granted list box, select the user e-mail address to remove.
2 Click Remove.
All users and clear the entire list Click Remove All.

223
Chapter 7
FRx Report Designer 6.7 User’s Guide
Understanding the Catalog of Reports
From the Catalog of Reports window, you combine your row format, column layout, and reporting tree building blocks to create a report. In this window, you give the new report a catalog ID name; fine-tune its formatting; and then view, print, or export it as a file that can be read by Microsoft® Excel or Lotus 1-2-3.This chapter explains:
Each option and tab in the Catalog of Reports window.
How to create, generate, chain, and clone reports.
Catalog of Reports Window . . . . . . . . . . . 224
Catalog of Reports Menu Bar . . . . . . . . . 225
Catalog of Reports Toolbar . . . . . . . . . . . 229
Catalog Identification . . . . . . . . . . . . . . . . 230
Tabs for Building and Formatting Reports 236
Building Blocks Tab . . . . . . . . . . . . . . . . . 237
Output Tab . . . . . . . . . . . . . . . . . . . . . . . . 243
Page Options Tab . . . . . . . . . . . . . . . . . . 257
Report Options Tab . . . . . . . . . . . . . . . . . 261
Reports . . . . . . . . . . . . . . . . . . . . . . . . . . 274
Scheduling Reports for Processing . . . . . 284

224FRx Report Designer 6.7 User’s Guide
Chapter 7: Understanding the Catalog of Reports – Catalog of Reports Window
Catalog of Reports Window When you open the Catalog of Reports, the Catalog of Reports window displays as shown in Figure 7-1.
Figure 7-1: Catalog of Reports Window
The main elements of the Catalog of Reports window are:
Catalog of Reports Menu Bar
Catalog of Reports Toolbar
Catalog Identification
Tabs for Building and Formatting Reports
When you open an existing Catalog ID, its name displays here.
Tab options for formatting reports
Toolbar
Menu Bar

225FRx Report Designer 6.7 User’s Guide
Chapter 7: Understanding the Catalog of Reports – Catalog of Reports Menu Bar
Catalog of Reports Menu BarThe Catalog of Reports includes the following menus with unique Catalog of Report functions:
File Menu
Edit Menu
Catalog Menu
Window Menu
File MenuThe Catalog of Reports File menu includes the typical windows options as well as page and print setup and report generation selections as shown in Figure 7-2.
Figure 7-2: Catalog of Reports File Menu
The File menu contains the following report-specific commands.
File Menu Commands
Description
Page Setup... Changes the page setup of your report.
Generate... Generates your reports and sets or changes your default report output. See “Generating a Report” on page 277.
Print Catalog... (Ctrl+P)
Prints selected catalog information. See “Printing Catalog Information” on page 279.
Table 7-1: Catalog of Reports File Menu Commands

226FRx Report Designer 6.7 User’s Guide
Chapter 7: Understanding the Catalog of Reports – Catalog of Reports Menu Bar
Edit MenuThe Catalog of Reports Edit menu, shown in Figure 7-3, allows you to edit the building blocks of your report: the row format, column layout, and reporting tree.
Figure 7-3: Catalog of Reports Edit Menu
The Catalog of Reports Edit menu contains the following commands.
Catalog MenuThe Catalog menu, as shown in Figure 7-4, corresponds to the tab options in the Catalog of Reports window that you use to build and format your reports.
Figure 7-4: Catalog of Reports Catalog Menu
Note Cut, Copy, Paste, and Clear are not available from the Edit menu when the Catalog of Reports is open.
Edit Menu Command Description
Font Styles... Applies different font styles and shading to your report.
You can apply fonts globally or to a specific row, column, or report heading. With the variety of font options available, you can create customized reports to present your financial data with style. See “Font Styles” on page 260.
Row Format Opens the row format used for the open catalog ID.
Column Layout Opens the column layout used for the open catalog ID.
Reporting Tree Opens the reporting tree used for the open catalog ID.
Zoom... (F3)
Displays the Select Catalog for Display dialog box, and a list of Catalog IDs to select from.
Table 7-2: Catalog of Reports Edit Menu Commands

227FRx Report Designer 6.7 User’s Guide
Chapter 7: Understanding the Catalog of Reports – Catalog of Reports Menu Bar
The Catalog menu allows you to display and access the following tabs and menu selections in the Catalog of Reports window.
Window MenuThe Catalog of Reports Window menu, as shown in Figure 7-5, allows you to access the Report Server and Schedule.
Figure 7-5: Catalog of Reports Window Menu
Catalog Menu Command Description
Building Blocks Displays the Building Block tab.
Output, and then click Output Options.
Displays the commands:
Output Options to display options for the report output.E-mail to display the E-mail Options tab.Web Publishing to display the Web Publishing tab.
Schedules Displays the Schedule dialog box.
This command is only available if the FRx® Report Server is available and running.
Page Options Displays the commands:
Page Setup to display the Page Setup tab.Headers/Footers to display the Headers / Footers tab.
Report Options Displays the commands:
Formatting to display the Formatting tab.Account/Transaction Detail... to display the Acct/Trans tab.Tree Options to display the Tree Options tab. Advanced to display the Advanced tab.Currency Translation to display the Currency Translation tab.
Use Defaults Replaces the settings with the catalog ID’s default settings
Table 7-3: Catalog Menu Commands

228FRx Report Designer 6.7 User’s Guide
Chapter 7: Understanding the Catalog of Reports – Catalog of Reports Menu Bar
The Window menu includes the following commands in the Catalog of Reports.
Window Menu Command
Description
Report Server Status Displays the Report Server Status dialog box where you can check the status of a report.
For additional information on this dialog box, see your FRx® Report Server 6.7 User’s Guide.
Note: This option is unavailable (dimmed) if you have not purchased or installed this software component.
Schedule Displays the Schedule dialog box where you can check the status of a report’s schedule.
For more information on this command, see your FRx® Report Server 6.7 User’s Guide.
Note: This option is unavailable (dimmed) if you have not purchased or installed the Report Server application component.
Table 7-4: Window Menu Commands

229FRx Report Designer 6.7 User’s Guide
Chapter 7: Understanding the Catalog of Reports – Catalog of Reports Toolbar
Catalog of Reports ToolbarThe Catalog of Reports window displays some additional buttons not located on the main toolbar. For main toolbar button descriptions, see “The Toolbar” on page 12 of this guide.
Toolbar Button Description
Opens the row format that is associated with the currently displayed Catalog ID. For more information, see “Edit Menu” on page 226.
Opens the column layout that is associated with the currently displayed Catalog ID. For more information, see “Edit Menu” on page 226.
Opens the reporting tree that is associated with the currently displayed Catalog ID. For more information, see “Edit Menu” on page 226.
Opens the row format, column layout, and reporting tree that are associated with the currently displayed Catalog ID.
Opens FRx® DrillDown ViewerTM if a report has already been generated to DrillDown Viewer for the currently displayed Catalog ID.
Opens Report Schedule only if you installed Report Server.
Note: Schedule is a Report Server feature This option is unavailable (dimmed) if you have not purchased or installed the Report Server software component.
Generates the selected report. If you installed Report Server, FRx sends your report to the Report Server queue by default. If Report Server is not installed, all reports process locally on your workstation. For more information on Report Server, see your FRx® Report Server 6.7 User’s Guide.
To set the default or change the report processing location, from the File menu, choose Generate... and in the Generate Report dialog box, set the default value.
Note: When you generate a report for one of the sample companies (Fabrikam Works, Inc.or Fabrikam Works Canada), FRx processes the report locally by default.
Table 7-5: Catalog of Reports Toolbar Selections
Note For main toolbar button descriptions, see “The Toolbar” on page 12 of this guide.

230FRx Report Designer 6.7 User’s Guide
Chapter 7: Understanding the Catalog of Reports – Catalog Identification
Catalog IdentificationUse the Catalog of Reports window to identify, date, build, and format your reports.
Figure 7-6: Catalog of Reports Window: Report Identification and Tabs
The top portion of the Catalog of Reports window is used for report identification, periods, and dates. This section contains information and instructions on:
Identifying a New Report
Specifying Report Periods and Dates
Tabs for Building and Formatting Reports
Identifying a New Report The top portion of the Catalog of Reports window is used for report identification. The following list describes the catalog and company options you use to identify a report.
Catalog IDUse to create a unique Catalog ID name.
Catalog ID DescriptionUse for a catalog description.
Company FRx uses the accounting calendar information (fiscal year and periods) from the company you select to generate a report. If you select the company code @ANY, FRx uses the current default company.
For more information on creating a new company, see your FRx® Report Designer 6.7 Administrator’s Guide.
The Catalog of Reports report identification
The Catalog of Reports tabs

231FRx Report Designer 6.7 User’s Guide
Chapter 7: Understanding the Catalog of Reports – Catalog Identification
To identify a new report
1 Open the Catalog of Reports window.
2 In the Catalog ID box, type a unique Catalog ID name, up to 16 characters in length.
Caution: FRx does not recognize the following symbols as valid Catalog ID characters: ‘ ” | / \ : ? * < > .
3 In the Catalog ID Description box type a catalog description, which can be up to 50 characters in length.
4 In the Company box, use your default company or select a different company from the drop-down list and click OK.
Note: If you choose the @ANY Company, the report runs for the default company or the companies identified in the associated reporting tree.
5 The Company Description box automatically displays a description based on your company selection.

232FRx Report Designer 6.7 User’s Guide
Chapter 7: Understanding the Catalog of Reports – Catalog Identification
6 From the Detail Level drop-down list box, select one of the following report detail levels:
Note: When you print a report, the difference between an Account Only report and a Financial & Account report becomes significant. If you select the Financial & Account detail level, FRx prints both a summary financial report and an account detail report. When you select the Account Only detail level, only the account detail report prints.
To Select
Create a high-level summary report
Financial Report
Create a report that contains only account detail balances
Account Only
Create a report that contains a high-level summary as well as account details
Financial & Account
Create a report that contains only transaction details
Transaction Only
Create a report that contains a high-level summary as well as transaction details
Financial & Transaction
Accounts with a zero balance and no period activity are typically suppressed in transaction detail reports.
To view and drill into the Account detail information
Account Only or Financial & Account
To view transaction details or both account and transaction detail
Transaction Only or Financial &Transaction

233FRx Report Designer 6.7 User’s Guide
Chapter 7: Understanding the Catalog of Reports – Catalog Identification
7 From the Provisional drop-down list box, select one of the following balance options to include in your report:
Note: FRx can create reports based on posted balances or reports that include amounts from unposted balances for creating provisional (pro-forma) reports.
Specifying Report Periods and Dates Use the Periods and Dates box shown in Figure 7-7 to indicate the base period, base year, and date for your report.
Figure 7-7: Periods and Dates
The following period and date selections are available to you:Base PeriodChanges to the base period are not saved with the catalog ID. To save the base period, you must assign a default base period in the Default Base Period box. The Default Base Period box determines the initial setting in the Base Period box.
Although you can hard code period numbers in the column layout, a column layout typically refers to the base period that you set here. Usually in the column layout, you set the period relative to the base period and then define that specific period here in the Catalog of Reports. If you choose to enter a specific period number in the column layout, that number overrides this base period setting.
Base YearEnter the fiscal year that you want the report to use. You can save a base period and year with the report. For more information, see “Default Base Period” on page 234.
To Select
Include only transactions and balances posted in your general ledger
Use Posted Balances Only
Include all transactions and balances entered and posted in your general ledger
Provisional: Posted + Unposted Activity
Include only transactions entered but not yet posted in your general ledger
Include Unposted Activity Only

234FRx Report Designer 6.7 User’s Guide
Chapter 7: Understanding the Catalog of Reports – Catalog Identification
Rebuild FRx GL IndexesSelect this check box to rebuild the local GL index before processing the report.
Period Covered This box automatically combines the Base Period in text form with the Period Description or Plural Description (used for multiple periods) from the Company Information dialog box. For more information on the Company Information settings, see your FRx® Report Designer 6.7 Administrator’s Guide.
You can manually edit this text as needed; however, your changes are not saved when you save your report.
The description in this box appears in the report headers by default. Use the @TXTPER and @TXTP+D codes in the Headers / Footers tab to include the Period Covered description in your report. For more information about using period descriptions in the headers and footers, see the Headers / Footers Tab on page 258.
Report DateThis description changes based on your previous report date selections. This description appears in the report headers by default.
This description is used in the @TXTDATE and @TXTP+D codes in the Headers /Footers tab. For more information about using report dates in the headers and
footers, see the Headers / Footers Tab on page 258.
Default Base PeriodThis setting determines the initial settings for the Base Year and Base Period. This is the only setting that is saved with the catalog ID. To change a setting, click the Default Base Period box and select one of the following from the list:
Default Period List
Use
Sys Defines the base period as the current system period
FRx uses the computer’s Regional Settings to determine the current system date and then applies this date to the accounting system’s current period settings to define the current system period. For example, if the current system date is 8/21/00 and there are 12 monthly periods in the accounting system, the current system period ends on 8/31/00.
S-1 Defines the base period as one period before the current system period
S-2 Defines the base period as two periods before the current system period
S+1 Define the base period as one period after the current system period
Table 7-6: Selections for Default Base Period

235FRx Report Designer 6.7 User’s Guide
Chapter 7: Understanding the Catalog of Reports – Catalog Identification
To identify report periods and dates
1 Click the arrow to the right of the Report Date box to display the Periods and Dates dialog box.
2 In the Base Period box, type the fiscal base period number for the report to use. To save a base period and year with the report, see the Default Base Period on page 234. which discusses the Default Base Period settings.
3 Select the Rebuild FRx GL Indexes check box to rebuild the local GL index before processing the report.
4 In the Period Covered box, edit the text as needed.
5 In the Report Date box, edit the text as needed.
6 To change the Default Base Period, click the Default Base Period box and select one from the list.To edit these codes, select a code and change the period number to reflect the appropriate base period. For example, to specify the base period as five periods prior to the current general ledger period, click the Default Base Period arrow, select C-1, and manually change the setting to C-5.
7 Click OK to populate the Report Date box in the Catalog of Reports window.FRx calculates a date using the information you entered in the Periods and Dates dialog box.
CUR Defines the base period as the current processing period as defined in the general ledger
C-1 Defines the base period as one period prior to the current general ledger period
C-2 Defines the base period as two periods prior to the current general ledger period
C+1 Defines the base period as one period after the current general ledger period
01 To hard code a specific period number
Default Period List
Use
Table 7-6: Selections for Default Base Period (Continued)

236FRx Report Designer 6.7 User’s Guide
Chapter 7: Understanding the Catalog of Reports – Tabs for Building and Formatting Reports
Tabs for Building and Formatting ReportsThe tabs in the Catalog of Reports window contains options that build and format your reports. Some Catalog of Reports subtabs, such as Web Publishing and Currency Translation, are only available if your FRx installation includes these separately licensed functions. Your FRx windows could vary somewhat from the complete set of examples and descriptions included in this guide.The following table describes each main tab and associated subtab available from the Catalog of Reports window.
Main Tab Subtab
Building Blocks None
Output Output Options—Use this tab to specify the type of report output. For example, you could print the report or export it as a Microsoft Excel file. E-mail Options—Use this tab to indicate the distribution list and file distribution method for automatically e-mailing reports.Web Publishing—Authorized users can use this tab to send the report to the FRx® WebPort.
Page Options Page Setup—Use this tab to specify your report page layout. Headers / Footers tabs—Use this tab to specify your report headers and footers.
Report Options Formatting—Use this tab to control rounding and formatting of amounts at the report level.Acct/Tran Detail—Use this tab to select options for displaying account and transaction details in reports.Tree Options—Use this tab to specify the reporting units included in a report.Advanced—Use this tab to set roll up basis, calculation and processing priority, and exception reporting for a report.Currency Translation—Use this tab to establish conversion options for currency reporting.
Table 7-7: Tabs for Building and Formatting Reports

237FRx Report Designer 6.7 User’s Guide
Chapter 7: Understanding the Catalog of Reports – Building Blocks Tab
Building Blocks Tab Use the row format, column layout, and reporting tree options under the Building Blocks tab to build your report.
Figure 7-8: Catalog of Reports: Building Blocks Tab
This section contains information and instructions on:
Selecting Row Formats
Selecting Column Layouts
Selecting a Reporting Tree
Selecting Row Formats
Row Format OptionsUse the following options for the row format:
Row FormatUse to select a row format for your report. For more information on row formats, see Chapter 3, “Creating Row Formats.”
Effective DatesThis option changes the report presentation based on a specific point in time. To assign multiple row formats to the report tied to an effective date or report period, select this option. When the report is generated, FRx selects the row format using the Report Date information.
Row Format Options
Column Layout Options
Reporting Tree Options

238FRx Report Designer 6.7 User’s Guide
Chapter 7: Understanding the Catalog of Reports – Building Blocks Tab
Use Row Format(s) and Worksheet Links from Reporting TreeIf in the reporting tree you specify the row formats or worksheets for your report to use, select this option. If you do not select this check box, FRx uses the row format selected previously in the Row Format box for every unit in the reporting tree.
Note: If you select this option and every reporting unit does not reference a row format, then FRx uses the identified row format (that appears dimmed in the Row Format box) for those units by default.
For more information on reporting trees and assigning row formats and worksheets in the reporting tree, see “Understanding Building Reporting Trees Manually” on page 203.
To select a row format
1 Click the arrow to the right of the Row Format box to display the Choose a Row Format dialog box.
2 Select a row format and click OK to return to the Catalog of Reports window.The Row Format list box automatically displays a Description
3 Then, click the Effective Dates check box, located on the right side of the Row Format Description, to display the Effective Dates dialog box.

239FRx Report Designer 6.7 User’s Guide
Chapter 7: Understanding the Catalog of Reports – Building Blocks Tab
4 In the Effective Dates dialog box, select one of the following:Use Period Numbers to make a row format effective as of a selected period.Use Dates to make a row format effective as of a selected date.
5 Double-click the Format Name box to display the Choose a Row Format dialog box.
6 Select a row format and click OK.
7 Double-click the Date Period or Starting Date box, and enter the period number or date for the selected row format.The row format goes into effect as of the date or period you select.
8 Repeat steps 5-7 for each row format that you want to include.
Note: If you run the report for a period or date that is not covered in the Effective Dates list, the report will run using the row format that was originally selected (displayed as dimmed in the Row Format box).
9 Click OK to return the Catalog of Reports window.
Selecting Column Layouts
Column Layout OptionsUse the following options for the column layout:
Column LayoutUse to select a column layout for your report. For more information on column layouts, see Chapter 5, “Creating Column Layouts.”
Effective Dates This option changes the report presentation based on a specific point in time. To assign multiple column layouts to the report tied to an effective date or report period, select this option. When the report is generated, FRx selects the column layout using the Report Date information.
To select a column layout
1 Click the arrow to the right of the Column Layout box to display the Choose a Column Layout dialog box.
2 In the Choose a Column Layout dialog box, select a column layout and click OK.The Column Layout list box automatically displays a description.

240FRx Report Designer 6.7 User’s Guide
Chapter 7: Understanding the Catalog of Reports – Building Blocks Tab
3 Then, select the Effective Dates check box, located on the right side of the Column Layout Description, to display the Effective Dates dialog box.
4 In the Effective Dates dialog box, select one of the following:Use Period Numbers to make a row format effective as of a selected period.Use Dates to make a row format effective as of a selected date.
5 Double-click the Format Name box to display the Choose a Column Layout dialog box.
6 Select a column layout and click OK.
7 Double-click the Date Period or Starting Date box, and enter the period number or date for the selected row format.The row format goes into effect as of the date or period you select.
8 Repeat steps 5-7 for each column layout that you want to include.
Note: If you run the report for a period or date that is not covered in the Effective Dates list, the report will run using the row format that was originally selected (displayed as dimmed in the Row Format box).
9 Click OK to return the Catalog of Reports window.
Selecting a Reporting Tree
Reporting Tree OptionsUse the Reporting Tree options to include a reporting tree in your report. However, you do not need a reporting tree to create a report. If you decide not to use a reporting tree, the row format of your report must use natural account segments, full account codes, or some combination thereof.Use the following options for the reporting tree:
Reporting TreeSelect to include a reporting tree in your report. For more information on reporting trees, see Chapter 6, “Creating a Reporting Tree.”

241FRx Report Designer 6.7 User’s Guide
Chapter 7: Understanding the Catalog of Reports – Building Blocks Tab
Effective DatesUse the Effective Dates option to change the report presentation based on a specific point in time. To assign multiple reporting trees to the report tied to an effective date or report period, select this option. When the report is generated, FRx selects the reporting tree using the Report Date information.
Starting UnitThe Starting Unit option for reporting trees allows you to select the levels down from the starting unit in the Tree Options tab.
Note: Selecting the Starting Unit limits which branches of the tree appear when you generate the report. To run the report for the entire tree, click None in the Units for Tree selection box to remove this Starting Unit.
To select a reporting tree
1 Select the Use Reporting Tree check box.
2 Click the Reporting Tree arrow to display the Choose a Reporting Tree dialog box.
3 In the Choose a Reporting Tree dialog box, select a reporting tree and click OK.The Reporting Tree list box automatically displays a description.
4 Then, select the Effective Dates check box, located on the right side of the Reporting Tree Description box, to display the Effective Dates dialog box.

242FRx Report Designer 6.7 User’s Guide
Chapter 7: Understanding the Catalog of Reports – Building Blocks Tab
5 In the Effective Dates dialog box, select one of the following:Use Period Numbers to make a row format effective as of a selected period.Use Dates to make a row format effective as of a selected date.
6 Double-click the Format Name box to display the Choose a Reporting Tree dialog box.
7 Select a reporting tree and click OK.
8 Double-click the Date Period or Starting Date box, and enter the period number or date for the selected row format.The row format goes into effect as of the date or period you select.
9 Repeat steps 6-8 for each reporting tree that you want to include.
10 Click OK to return to the Catalog of Reports window.
11 To specify a starting unit, click the Starting Unit arrow to display the Units for Tree dialog box.
12 In the Units for Tree dialog box, select the starting reporting unit and click OK.
Note: Leave this box blank to generate the entire reporting tree. For more information on the Tree Options tab, see “Tree Options Tab” on page 269.

243FRx Report Designer 6.7 User’s Guide
Chapter 7: Understanding the Catalog of Reports – Output Tab
Output TabUse the Output tab to change your report output. Within the Output tab are three subtabs, the Output Options tab, the E-mail Options tab, and the Web Publishing tab. Use these tabs to change your report output, to specify e-mail options, or to publish a report to a Web repository.
Figure 7-9: Output Options Tab in the Catalog of Reports
This section contains information and instructions on:
Selecting Report Output Options
E-mailing Reports
Publishing Reports to the Web
Output tab
The Output Options tab in the Catalog of Reports window is active by default.

244FRx Report Designer 6.7 User’s Guide
Chapter 7: Understanding the Catalog of Reports – Output Tab
Selecting Report Output OptionsUse the Output Options tab to select the following specific report output options and settings:
Report Output OptionsUse to select a report output method. To select your report output method, use the Output drop-down list shown in Figure 7-10.
Figure 7-10: Output Options List
The descriptions and usages of these options are described below.PrinterUse to print a report to your default printer.
FRx DrillDown Viewer (Enhanced XML) Use this default setting to send a report to the DrillDown Viewer for viewing on a computer running Microsoft® Windows® 2000 and Windows XP. When you select this option, FRx saves this file with an .frd extension by default. (The default path where FRx stores the file is determined by the Import/Export Path selected in the Company Information dialog box.)
When you open the file in the DrillDown Viewer, you can view your report on screen, print it, export it to other applications, send it via e-mail, and save it with another name. For more information on the DrillDown Viewer, see your FRx® DrillDown Viewer™ and FRx® Report Launcher 6.7 User’s Guide.
HTML (Via Excel 2000)This option produces report output as an HTML file. When you select this option, FRx saves the file with an .htm extension. If you do not have the Excel 2000 application on your workstation, FRx will display an error message.
When you use this option, you must select the Activate Browser option under HTML Options to view the generated HTML report in a Web browser immediately.
XMLUse this option to export the report as an XML file. The output file is in the standard XML format and can be imported into other XML-compatible applications or displayed in a Web browser.
XBRLUse this option to generate XBRL instance documents that include XBRL elements and syntax. XBRL output requires the row format to include XBRL Element Tags applied to GL Link, CAL, and TOT rows. Only the rows that are tagged with an XBRL Element tag will be passed into the instance document.

245FRx Report Designer 6.7 User’s Guide
Chapter 7: Understanding the Catalog of Reports – Output Tab
Excel 5 or above (via OLE) Use this option to export your report to a Microsoft Excel 5 workbook via OLE. To do this, you must have Microsoft Excel 5.0 (or later) installed on your workstation or on Report Server (if you queue the report for processing).When you select this option, the following options display on the Output Options tab.
These options are described in the following table.
Excel OLE Options Description
Activate Workbook Use this option to open a Microsoft Excel workbook after generating a report. If you do not select this option, your report is saved as an .xls file and Microsoft Excel does not open automatically.
Format as Excel Outline
If you generate an account or transaction detail report, you can use Excel’s built-in outline control to allow the user to hide or show row details. Select this check box to enable this feature.
Password To assign a password to your Microsoft Excel (.xls) file, and protect it from unauthorized access, type a password in this box.
Print Headings Use to include your defined column and report headings in the worksheet file
Print Format Rows Use to include your defined format rows (DES, LFT,RGT, and CEN rows) in the worksheet file. If you do not select this option, only amount rows export to the worksheet.
Print Underscore Rows
To include underscore (and double underscore) rows in the worksheet files
Export Formulas Use this option only with worksheets to export formulas from the row format (TOT) and column layout to the worksheet.
Table 7-8: Formatted Excel Output Options

246FRx Report Designer 6.7 User’s Guide
Chapter 7: Understanding the Catalog of Reports – Output Tab
Worksheet OptionsThe following Excel and Lotus output options are available from the Output Options tab:
Export to Lotus (WK1) to export your report to a Lotus 1-2-3 WK1 file. Export to Excel (XLS) to export your report to a Microsoft Excel XLS file. This file can then be read (without custom fonts) by any version of Microsoft Excel.
When you select one of these worksheet options, the following output options display on the Output Options tab.
These options are described in the following table.
ASCII OptionsThe following ASCII output options are available from the Output Options tab:
Export to ASCII (Comma Delimited) to export your report to a comma-delimited ASCII text file.Export to ASCII (Formatted Text) to export your report to an ASCII formatted text file. This output type displays your data in aligned columns, separated by
Worksheet Options Description
Print Headings Use to include your defined column and report headings in the worksheet file
Print Format Rows Use to include your defined format rows (DES, LFT,RGT, and CEN rows) in the worksheet file. If you do not select this option, only amount rows export to the worksheet.
Print Underscore Rows To include underscore (and double underscore) rows in the worksheet files
Export Formulas Use this option only with worksheets to export formulas from the row format (TOT) and column layout to the worksheet.
Table 7-9: Worksheet Format Options

247FRx Report Designer 6.7 User’s Guide
Chapter 7: Understanding the Catalog of Reports – Output Tab
spaces. Use this option to display reports on non-Windows computers and terminals.
When you select one of these ASCII options, the following output options display on the Output Options tab.
FRx instant!OLAP – Microsoft Server Cube Options
ASCII Options Description
Maximum Lines per Page Use only with the ASCII Formatted Text to determine the number of report lines to print per page. (The ASCII Comma Delimited option creates a continuous report without page breaks, and this option becomes unavailable or dimmed.)
Print Headings Use to include your defined column and report headings in the worksheet file
Print Format Rows Use to include your defined format rows (DES, LFT,RGT, and CEN rows) in the worksheet file. If you do not select this option, only amount rows export to the worksheet.
Print Underscore Rows To include underscore (and double underscore) rows in the worksheet files
Table 7-10: ASCII Format Options
Note Only Administrators (users who are included in the OLAP Administrator group in the NT server) are authorized to select the FRx instant!OLAP Microsoft Server Cube option.

248FRx Report Designer 6.7 User’s Guide
Chapter 7: Understanding the Catalog of Reports – Output Tab
When you select this option, the following selections display under the Output Options tab, on the right side of the screen.
A description of these OLAP cube selections are listed in the following table.
Microsoft Server Cube Options
Description
Cube Name Type the name of the FRx instant!OLAP cube file on the server.
Cube Description Displays the OLAP cube description.
Use integrated NT Security
Use this option to use your NT network User ID and password. If you use the Integrated NT Security option, you do not need to use the User ID and Password boxes in the FRx instant!OLAP – Microsoft Server Cube Settings.
UserID If you did not select the Use integrated NT Security option, type your login user ID to the OLAP cube server in this box.
Password If you did not select the Use integrated NT Security option, type your login Password to the OLAP cube server in this box.
Cube Server Type or select the name of the server where the OLAP cube is located.
Cube Database Type or select the name of the OLAP cube database
Fact Server Type or select the name of the server where the OLAP cube FACT tables are located.
Note: FACT tables are the relational representation of the XML-based report files. They are an interim compilation of the report data that supports the OLAP cube generation. For server-based cubes, the FACT tables are kept permanently in a user-defined SQL Server/ Database location.
Table 7-11: FRx instant!OLAP Microsoft Server Cube Settings

249FRx Report Designer 6.7 User’s Guide
Chapter 7: Understanding the Catalog of Reports – Output Tab
FRx instant!OLAP – Microsoft Local Cube Options
When you select this option, the following selections display under the Output Options tab, on the right side of the screen.
A description of these selections are listed in the following table.
Excel Pivot Chart
When you select this option, the following selections display under the Output Options tab, on the right side of the screen.
Fact Database Type or select the name of the database where the Microsoft SQL OLAP cube FACT tables are located.
Microsoft Local Cube Options
Description
Cube Name Type the name of the OLAP cube file.
Cube Description Type the OLAP cube description.
Table 7-12: Microsoft Local Cube Options
Microsoft Server Cube Options
Description
Table 7-11: FRx instant!OLAP Microsoft Server Cube Settings (Continued)

250FRx Report Designer 6.7 User’s Guide
Chapter 7: Understanding the Catalog of Reports – Output Tab
A description of these selections are listed in the following table.
Excel Pivot Table
When you select this option, the following selections display under the Output Options tab, on the right side of the screen.
A description of these selections are listed in the following table.
File NameThe File Name list box displays the report file name. To change the file name or path, select a file name from the drop-down box. Using the Output File Name dialog box, you can select a different drive, directory, and file name for the report.If you do not select a path, the file saves to the Import/Export Path that you selected in the Company Information dialog box.The File Name box is dimmed if you select Printer from the Output box.
Note: When you select the Send as Link to File option from the E-mail tab, you must specify a shared network directory or use Uniform Naming Conventions (UNC); for example: \\computer name\share name\directory name\file name.
Excel Pivot Chart Options
Description
Cube Name Type the name of the Excel Pivot Chart cube file.
Cube Description Type the Excel Pivot Chart cube description.
Table 7-13: Excel Pivot Chart Options
Excel Pivot Table Options
Description
Cube Name Type the name of the Excel Pivot Table cube file.
Cube Description Type the Excel Pivot Table cube description.
Table 7-14: Excel Pivot Table Options

251FRx Report Designer 6.7 User’s Guide
Chapter 7: Understanding the Catalog of Reports – Output Tab
Replace File Without WarningWhen you save a new report with the same name as an existing file, a warning message appears informing you that the file already exists. To disable this warning message and have FRx automatically overwrite the existing file, select this option.
Prompt for Output Type at Run TimeIf you want to receive a prompt to select the report output method before generating the report, select this check box.
Delete File After Printing/Viewing/Sending To automatically delete the FRx report file after printing, viewing, or sending it, select this check box. This option is helpful if security or disk space is a concern. If you do not select this option, the output file remains on the disk for subsequent viewing, printing, or sending.
Print ImmediatelyTo generate your report using the selected output method and send it directly to your default printer, select this check box. This box appears dimmed if you select Printer from the Output box.
Chain to Catalog IDTo automatically run another report whenever the current report is generated, select the catalog ID here. To do this, click the Chain to Catalog ID arrow. In the Select Catalog for Display dialog box, select the catalog ID to run after this one and click OK. You can chain many reports together using this feature.For more information on chaining reports, see “Chaining Your Reports” on page 280.
Restart Page NumberingTo use individual report page numbering for each chained report, select this check box. For example, if Report A has page numbers 1 through 5 and Report B has page numbers 1 through 8, this option retains each report’s page numbering. If you do not select this option, the page numbers would be 1 through 5 for Report A and pages 6 through 13 for Report B.
Printing ReportsIf the Report Server application is installed, this release of Report Designer lets you select a local printer or a server printer from the Catalog of Reports. This feature gives you more flexibility when you print reports. Local printer selections apply to the current Report Designer session. Valid server printer settings remain in effect until you change the settings to another valid server printer.
When Report Server is installed, and you select Printer as the output option from the Catalog of Reports, Report Designer dynamically displays a Define Printers button on the Output Options tab.
Note If Report Server is not installed and you are generating reports locally, on the File menu click Print, and select a valid printer from the Print dialog box.

252FRx Report Designer 6.7 User’s Guide
Chapter 7: Understanding the Catalog of Reports – Output Tab
For other output options, such as the default DrillDown Viewer (Enhanced XML) option, Report Designer dynamically displays a Select Printer button when you select the Print Immediately check box.
This section includes information and instructions on:
Selecting a Printer from the Catalog of Reports Output Options
Selecting a Printer from the Print Immediately Option
Selecting a Printer from the Catalog of Reports Output Options
To select a printer from the Catalog of Reports output options
1 Display the report record in the Catalog of Reports.
2 Select the Output tab.
3 From the Output tab, select the Output Options tab.
4 Click the Output Option arrow and select Printer from the list.If FRx Report Server is installed, the Define Printers button appears on the Output Options tab.
5 Click Define Printers to display the Printer Selections dialog box.
Note When Printer is selected as the output option, the Print Immediately check box is disabled (dimmed).

253FRx Report Designer 6.7 User’s Guide
Chapter 7: Understanding the Catalog of Reports – Output Tab
6 From the Printer Selections dialog box, select one of the following options:To select a local printer for the current session, click the Local Printer Selection arrow and select a valid, installed, local printer from the list.To select a server printer as the default for the report, click the Server Printer Selection arrow and select a printer from the list.
Note: The Server Printer Selection is saved to the catalog and affects all printer output until a different server printer is selected.
7 Click OK to accept the printer selection and close the Printer Selections dialog box.
8 Click Save to save the report record in the Catalog of Reports.
Selecting a Printer from the Print Immediately Option
To select a printer from the Print Immediately option
1 Display the report record in the Catalog of Reports.
2 Select the Output tab.
3 From the Output tab, select the Output Options tab.
4 Click the Print Immediately check box.
Note: If you are generating reports locally, the report prints on the default local printer for the workstation.
If FRx Report Server is installed, the Select Printer button appears on the Output Options tab.
5 Click Select Printer to display the Printer Selections dialog box.
6 From the Printer Selections dialog box, select one of the following options:To print immediately to a local printer, click the Local Printer Selection arrow and select a printer from the list.To print immediately to a server printer, click the Server Printer Selection arrow and select a printer from the list.
7 Click OK to accept the printer selection and close the Printer Selections dialog box.
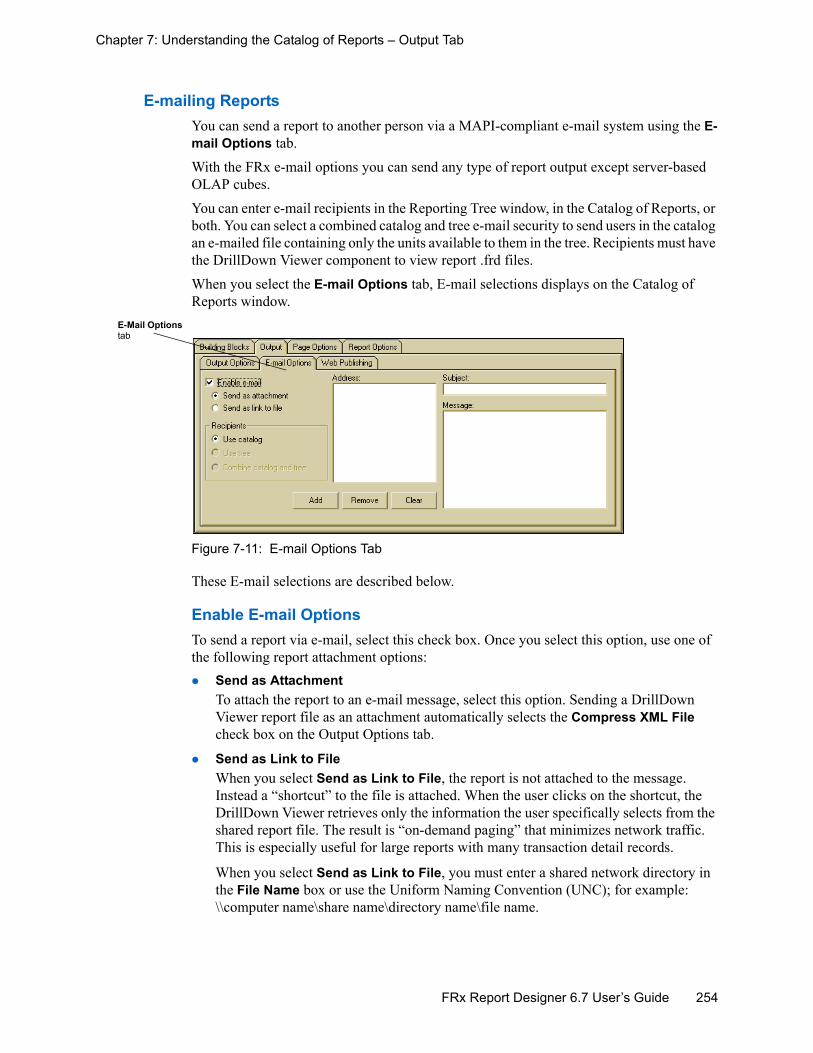
254FRx Report Designer 6.7 User’s Guide
Chapter 7: Understanding the Catalog of Reports – Output Tab
E-mailing Reports You can send a report to another person via a MAPI-compliant e-mail system using the E-mail Options tab.With the FRx e-mail options you can send any type of report output except server-based OLAP cubes. You can enter e-mail recipients in the Reporting Tree window, in the Catalog of Reports, or both. You can select a combined catalog and tree e-mail security to send users in the catalog an e-mailed file containing only the units available to them in the tree. Recipients must have the DrillDown Viewer component to view report .frd files.When you select the E-mail Options tab, E-mail selections displays on the Catalog of Reports window.
Figure 7-11: E-mail Options Tab
These E-mail selections are described below.
Enable E-mail OptionsTo send a report via e-mail, select this check box. Once you select this option, use one of the following report attachment options:
Send as AttachmentTo attach the report to an e-mail message, select this option. Sending a DrillDown Viewer report file as an attachment automatically selects the Compress XML File check box on the Output Options tab.
Send as Link to FileWhen you select Send as Link to File, the report is not attached to the message. Instead a “shortcut” to the file is attached. When the user clicks on the shortcut, the DrillDown Viewer retrieves only the information the user specifically selects from the shared report file. The result is “on-demand paging” that minimizes network traffic. This is especially useful for large reports with many transaction detail records.
When you select Send as Link to File, you must enter a shared network directory in the File Name box or use the Uniform Naming Convention (UNC); for example: \\computer name\share name\directory name\file name.
E-Mail Options tab

255FRx Report Designer 6.7 User’s Guide
Chapter 7: Understanding the Catalog of Reports – Output Tab
Recipients OptionsSelect this option to designate that recipients receive certain reports or reporting units. Once you select this option, use one of the following catalog or tree options:
Use CatalogTo send the entire report to e-mail recipients who are set up in the catalog, select this option
Use TreeTo send reports containing only the reporting units designated for recipients in the tree, select this option. E-mail recipients must be set up in the reporting tree to make this option available.
Combine Catalog and TreeTo send reports to those users set up in the catalog, but only the reporting units available to them in the tree, select this option. A recipient must be set up in both the catalog and the tree, or no report will be sent.
AddressThis box displays the report’s recipients. This information is read from your default e-mail program. Apply any of the following functions to Address recipients:
AddTo select a name from your e-mail manager system, or to type a new name and e-mail address, click this button.
RemoveTo remove an address from the Address box, click the address you want to remove, and then click this button.
ClearTo clear all addresses, click this button.
SubjectTo add a subject title to the e-mail message, type the subject title here.
MessageTo add a message to the e-mail message, type your message here.
Publishing Reports to the Web The FRx® WebPort lets you store, manage, and render both FRx and non-FRx reports (including Microsoft® Word documents and Excel spreadsheets) for viewing in a Web browser. WebPort interface allows you to both browse reports and drill down into specific reports to the detail available.There are two ways to add reports to the WebPort. First, authorized FRx users can send report output to the WebPort from Report Designer and from FRx® Report Launcher. Second, FRx Administrators can use the WebPort Administrator function to add, change, or delete reports, folders, and users.
For information about using the WebPort Administrator functions, see the FRx® WebPort 6.7 User and Administrator’s Guide.

256FRx Report Designer 6.7 User’s Guide
Chapter 7: Understanding the Catalog of Reports – Output Tab
If you are authorized to do so in FRx Security, you can send report output to the WebPort from Report Designer Catalog of Reports or from Report Launcher Catalog Run Properties. The Publish to Web option is available only for XML and Enhanced XML output types.
Figure 7-12: Catalog of Reports Window: Web Publishing Tab
Select the Web Publishing tab to publish your report to the Web. Use the following options to specify a Web location, folder name, and report name:
Web LocationTo specify the Web location on your server, type the path of the WebPort in this box or click the arrow and browse to select the WebPort repository file (repository.xml).
Folder NameTo select the folder in the WebPort to which you want to save the report, type the name of the folder in this box. If you type the name of a folder that does not exist, FRx will create the new folder in the WebPort.
Report NameTo name the report as it will display in the WebPort, type the report name in this box. The Catalog ID is used as the report name, by default.
Web Publishing tab

257FRx Report Designer 6.7 User’s Guide
Chapter 7: Understanding the Catalog of Reports – Page Options Tab
Page Options TabWithin the Page Options tab are two sub tabs, the Page Setup tab and the Headers / Footers tab. You can use these tabs to change your report page formatting.
Figure 7-13: Catalog of Reports Window: Page Setup Tab
Page Setup TabThe Page Setup tab contains your report page setup options. These options are described below.
MarginsThe Left, Right, Top, and Bottom Margins boxes display the report page margins. The default margin value is .75.To change the margins, select the margin value and enter the new value.
OrientationThis section displays the report page orientation. To change the orientation, select one of the following options:
PortraitDisplays the report vertically on the page.
LandscapeDisplays the report horizontally on the page
ScalingThis option displays the percentage of scaling in a report. To change the scaling, select one of the following options:
Reduce/Enlarge toChanges the report size to the percentage you enter in the % box. The default is 100%.
Shrink to Page WidthFits the report columns within the width of a single page.
CollateCollates multiple report copies.
Page Options tab
In this tab portion of the Catalog of Reports Window, the Page Setup tab is active by default.

258FRx Report Designer 6.7 User’s Guide
Chapter 7: Understanding the Catalog of Reports – Page Options Tab
CopiesIndicates the number of report copies to print.
Default Font StyleThis box displays the default font used in the report. FRx uses this font where you have not selected a specific font in the row format, column layout, or Catalog of Reports headers/footers. To change the default font style, select a font from the Default Font Style list.
Headers / Footers TabFrom the Headers / Footers tab, you define and format the report headers and footers.
Figure 7-14: Catalog of Reports Window: Headers / Footers Tab
Headers and FootersThe following options allow you to add and align headers and footers in your report:
Left, Centered, or RightType text or codes in these cells to right, center, or left-align the information in the header or footer.
Center Headers / Footers on PageCenter your headers and footers horizontally on the report page. If you do not select this option, your headers and footers center over the report data.
Page HeadersUse or change the report headings.
Page FootersUse or change report footers.
CodesThese codes pull variable information into the headers and footers of your report. Use the Left, Center, or Right formatting options to define the Code alignment.
Headers/Footers tab

259FRx Report Designer 6.7 User’s Guide
Chapter 7: Understanding the Catalog of Reports – Page Options Tab
Using the following table, select one of the following codes from the drop-down list:
Code FRx includes the information from the...
@COMP Company Information dialog box, Company Name box
@TITLE Reporting Tree window, column D, Title/Description
@ROW Row Format description
@COL Column Layout description
@TXTDATE Periods and Dates dialog box, Report Date box
@NUMDTE Catalog of Reports window, Report Date box formatted as mm/dd/yy
@TXTPER Periods and Dates dialog box, Period Covered text box
@TXTP+D Periods and Dates dialog box, Period Covered and Report Date boxes
@TXTPER# Periods and Dates dialog box, Base Period box formatted as text
@PAGE Print page number
@RUNIT Reporting Tree window, column B, Company and column C, Unit Code
@PDATE Current computer system date at processing
@PTIME Current computer system time at processing
@CAT Catalog of Reports window, Catalog ID box
@BLANK To force a blank line
@CATDESC Catalog of Reports window, Catalog Description box
@ROUND Formatting tab, Rounding of Amounts box
@FNAME Output Options, File Name box
@TREE To use report header from tree format
@FILTER To use an account filter
@UNITT[#] Additional Text entry from the reporting tree
Table 7-15: Header/Footer Codes

260FRx Report Designer 6.7 User’s Guide
Chapter 7: Understanding the Catalog of Reports – Page Options Tab
Font StylesThis option sets font styles for the selected Headers / Footers cells. To change the report header or footer font style, select the text. Then, select a font style from the Font Styles list.You can create new font styles or edit existing ones, and then use these styles in your report.Use this option to create and edit fonts and apply shading to the font used in your report headers and footers.
To create or edit a font style
1 On the Headers / Footers tab, click Edit Font Styles... or select Font Styles from the Edit menu to display the Font Styles dialog box.
2 Use one of the following font style options:
3 Click Save.
4 Click Close.
To Do this
Create a new font style 1 Click New.2 In the Font Style Name box, enter a name
for the new style.
Edit an existing font style 1 In the Font Styles dialog box, select a font.2 Click Font... to display the Font dialog box.3 Make changes, as necessary, to Font, Font
style, Size, Effects, or Color attributes and click OK.
Apply a font, font style, or size 1 Click Font.2 Make your selections and click OK.
Apply shading to the style 1 Click Shading.2 Select or define the background color and
click OK.

261FRx Report Designer 6.7 User’s Guide
Chapter 7: Understanding the Catalog of Reports – Report Options Tab
ClearUse the Clear option to clear the Headers / Footers text or codes from the Left, Centered, or Right cells.
To clear text
1 Select the text or code to remove.
2 Click Clear.
Report Options TabThe Report Options tab contains options such as formatting and rounding amounts, formatting detail reports, subtotaling and filtering account detail, formatting reporting trees, generating an exception report, and currency conversion. To access these options, you use five subtabs under the Report Options tab.
Figure 7-15: Catalog of Reports Window: Reports Option Tab
This section contains information and instructions on the five Report Options subtabs including the:
Formatting Tab
Acct/Tran Detail Tab
Tree Options Tab
Advanced Tab
Currency Translation Tab
Formatting Tab You control formatting and rounding of amounts at the report level from the Formatting tab.
General OptionsUse the General Options to display the following formatting options:
Report Options tab
The Formatting tab is active by default

262FRx Report Designer 6.7 User’s Guide
Chapter 7: Understanding the Catalog of Reports – Report Options Tab
Use ( ) For Negative NumbersTo use parentheses ( ) to indicate negative numbers, select this check box (the default). If you do not select this option, the report indicates negative numbers with a minus sign (-).
Display Commas in AmountsTo include the thousands separators in currency amounts that you entered in the 1000 Separator box of the International Formats dialog box, select this check box (the default).
Use % Signs on PercentagesTo include a percentage sign (%) in all percentage-related columns, select this check box (the default).
Currency Symbol on 1st RowTo display a currency symbol in all amount columns on the first row of each page, select this check box (the default). When you select this box, you do not need to enter a CS print control in the first row of your row format. The actual format used is specified in the Amount with Currency Symbol box in the International Formats dialog box.
Display Blanks for Zero AmountsTo display blank spaces instead of zeros for all zero balances in the entire report, select this check box (the default).
Display Rows With No AmountsTo display rows with zero balances, select this check box. By default, FRx suppresses rows with zero balances in all amount columns.
Display Reports With No Active RowsSelect this check box to generate a report for every unit of a reporting tree, even if there are no amounts displayed.
Empty reports may still display if title rows or other format rows are present. To prevent extraneous titles from printing on a report without amounts, relate each descriptive row to an amount row. For more information on relating rows, see “Relating a Format Row to an Amount Row” on page 81
Allow Column Text OverflowTo allow text to overflow to the next empty column, select this check box (the default).
Extra Lines Between RowsTo change the number of lines that print between your report rows, enter a number here.
Spaces Between ColumnsTo change the default number of spaces that print between your report columns, enter that number here.
You can also enter the number of spaces before a column in the Extra Spaces Before Col cell in the column layout.

263FRx Report Designer 6.7 User’s Guide
Chapter 7: Understanding the Catalog of Reports – Report Options Tab
Rounding of Amounts
Figure 7-16: Rounding Options in Formatting Tab
The options in this section of the screen allow you to select the level of rounding used in your report, to round row values before totalling a report, and to round the reporting unit values before rolling up into a summary unit.
Rounding
This box displays the type of rounding used in your report. To change the level of rounding used in your report, click the Rounding of Amounts arrow and select from the following options:
Although rounding by definition produces rounding differences (or “rounding errors”), you can alter how and when rounding is performed to balance your need for precision and internal integrity of reports. The following two rounding options will cause changes to totals and summary reports. For specific examples of how these options work together, see “Examples of Combining Rounding Options” on page 265.
If you select this option... $1,117,691,600.48 rounds to...
No Rounding $1,117,691,600.48
Whole Dollars $1,117,691,600
Thousands (000.0) $1,117,691.6
Whole Thousands (000) $1,117,692
Millions $1,117.7
Whole Millions $1,118
Billions $1.1
Whole Billions $1
Table 7-16: Rounding Options
Rounding options

264FRx Report Designer 6.7 User’s Guide
Chapter 7: Understanding the Catalog of Reports – Report Options Tab
Use Rounded Values for Calculations and Totals
To round the row values before totaling the report, select this check box (the default setting). If you prefer to perform the calculations and then round the results, clear this check box.See Table 7-19 on page 266 and Table 7-20 on page 266 for examples of how this option affects your reports.
Roll up Rounded Values in the Tree
If the report uses a reporting tree, select this check box to round the reporting unit values and then roll up the results into the summary unit. To first roll up actual values and then round the results, clear this check box. When you use this option, every report in your tree totals correctly (foots). However, your summary report totals may not be the same as a similar summary report that does not use a reporting tree.When you clear this option, every report in your tree foots and there are no rounding differences in the summary unit. However, the individual reporting units may not add up (cross-foot) to the summary total.
Note Note: Selecting both the Use Rounded Values for Calculations and Totals and the Roll up Rounded Values in the Tree options may result in significant rounding differences.

265FRx Report Designer 6.7 User’s Guide
Chapter 7: Understanding the Catalog of Reports – Report Options Tab
Examples of Combining Rounding OptionsWhen you round your reports, you can choose to round the report values before or after totaling and you can choose to round the reporting units before or after rolling up to the parent unit. The following table identifies the different rounding option combinations and the effect on rounding differences.
This section shows several examples of how totals and roll ups perform using the different rounding option combinations. In all cases, FRx consistently totals the parent unit rows after rolling up the child units.The following table displays report values that are not rounded. All reports (USA and Canada) foot and cross-foot to the Combined report.
The following two examples use rounded values in calculations and totals. Example 1 also rolls up rounded values in the reporting tree. Example 2 does not round before rolling up.
Note The term “foot” means to total down to the row calculation, the term “cross-foot” means to total across, rolling up the child units to the parent unit.
Accounts USA Canada Combined
Cash 1413.48 1201.20 2614.68
Accounts Receivable 287.37 100.40 387.77
Prepaid Expenses 112.47 200.05 312.52
Total Current Assets 1813.32 1501.65 3314.97
Table 7-18: No Rounding
Rounding Selections
Does this report foot?
Does this report cross-foot?
Significant Use Rounded Values for Calculations and TotalsRoll up Rounded Values in the Tree Yes Yes
Rou
ndin
gD
iffer
ence
s
Use Rounded Values for Calculations and TotalsRoll up Rounded Values in the Tree Yes No
Use Rounded Values for Calculations and TotalsRoll up Rounded Values in the Tree No Yes
Use Rounded Values for Calculations and TotalsRoll up Rounded Values in the Tree No No
None No Rounding Yes Yes
Table 7-17: Rounding Selections and Differences

266FRx Report Designer 6.7 User’s Guide
Chapter 7: Understanding the Catalog of Reports – Report Options Tab
In Table 7-19, row totaling is performed after rounding so each individual report foots correctly. If you select Roll up Rounded Values in the Tree, each row in the child unit (USA and Canada) also cross-foots to the parent (Combined) unit. If you clear the Roll up Rounded Values in the Tree option, the child units do not cross-foot to the parent (1812+1501 does not equal 3316).The following table contains two examples that do not use rounded values in calculations and totals. Example 3 rolls up rounded values in the reporting tree. Example 4 does not round before rolling up.
In Table 7-20, rounding is performed after totaling in each report. By doing this, report totals may appear to be incorrect. In the example 3 USA report, 1413+287+112 does not equal 1813. In example 4, the reports do not foot or cross-foot to the parent. This last example results in a report that appears to be wildly incorrect, yet the final combined summary number, 3315 (the Total Current Assets: Combined value), is the only summary number of the four rounding examples that is precise when compared with the original non-rounded number (3314.97=3315).
Example 1 Example 2
Use Rounded Values for Calculations and TotalsRoll up Rounded Values in the Tree
Use Rounded Values for Calculations and TotalsRoll up Rounded Values in the Tree
Accounts USA Canada Combined USA Canada Combined
Cash 1413 1201 2614 1413 1201 2615
Accounts Receivable
287 100 387 287 100 388
Prepaid Expenses 112 200 312 112 200 313
Total Current Assets
1812 1501 3313 1812 1501 3316
Table 7-19: Using Rounded Values in Calculations and Totals
Example 3 Example 4
Use Rounded Values for Calculations and TotalsRoll up Rounded Values in the Tree
Use Rounded Values for Calculations and TotalsRoll up Rounded Values in the Tree
Accounts USA Canada Combined USA Canada Combined
Cash 1413 1201 2614 1413 1201 2615
Accounts Receivable
287 100 387 287 100 388
Prepaid Expenses 112 200 312 112 200 313
Total Current Assets
1813 1502 3313 1813 1502 3315
Table 7-20: Without Using Rounded Values in Calculations and Totals

267FRx Report Designer 6.7 User’s Guide
Chapter 7: Understanding the Catalog of Reports – Report Options Tab
Acct/Tran Detail TabThe Acct/Tran Detail tab contains a variety of options for formatting detail reports as shown in Figure 7-17.
Figure 7-17: Catalog of Reports Window: Acct/Tran Detail Tab
Options for Account Detail ReportsThe following list explains the options available:
Display GL Account CodeTo include the general ledger account codes in your report, select this check box. FRx places the general ledger account number into the report description (DESC) column at the account and transaction detail level.
Display Account Description from ChartTo include account descriptions from the chart of accounts in your account and transaction detail report, select this check box (the default). FRx includes as much of the account description as will fit into the report description (DESC) column.
Display Row CodeTo display the row format row codes in your account and transaction detail report, select this check box (the default).
Combine Posted and Unposted AmountsTo combine posted and unposted balances in your account and transaction detail report, select this check box (the default). If you do not select this option, FRx displays the posted and unposted amounts on separate account detail line items for each account with unposted activity.
Display Underscore before TotalsTo display an underscore line before each row total in account detail reports, select this check box (the default).
For transaction detail reports, select this option to print an underscore before and after each period total, each account total and row total.
Mark Unposted Accounts with *To flag unposted balances or transactions with an asterisk (*), select this check box (the default). If you select the Combine Posted and Unposted Amounts option, an asterisk appears at the transaction detail level for every unposted transaction. If you do not select the Combine Posted and Unposted Amounts option, an asterisk appears
Acct/Tran Detail tab

268FRx Report Designer 6.7 User’s Guide
Chapter 7: Understanding the Catalog of Reports – Report Options Tab
at the account detail level for the unposted account balance as well as the transaction detail level for all unposted transactions.
Include Detail for Non-Printing RowsTo include non-printing rows that you defined in the row format (NP Print Ctrl), select this check box (the default).
Sort GL Accounts by Natural CodeTo sort accounts by their natural account code segments, select this check box.
Suppress CBR CalculationIf you include a BASE row calculation in the column layout, you must specify a CBR row in the row format. With these in place, FRx attempts to perform the appropriate calculation on each row of the financial statement regardless of detail level. The Suppress CBR Calculation option determines whether the calculation is performed if you select an account or transaction detail level report. This option is selected by default because a report with many accounts can take longer to process.
Options for Subtotal/Filtering Account DetailIf you choose Financial Report under Detail Level, Subtotal/Filtering Account Detail options are unavailable. The following list of options are available if you choose Account Only, Financial & Account, Transaction Only, or Financial & Transaction as the Detail Level for the report:
Subtotal on SegmentTo subtotal on an account segment in your account detail report, select this check box, and then type or select the account segment number in the box below this check box. Subtotaling affects only the account detail section of a report.
When you use subtotaling from the Catalog of Reports, you can print the subtotaled account detail or export this information without using the FRx DrillDown Viewer.
Use Account FilterTo use an account filter subtotal, select this check box, and then enter the account filter in the box below this check box.
This filter applies to every row, column, and tree intersection, and lets you run a report for specific units using a filter without changing the tree. Or, without creating a tree, you can run a report for a specific unit. When you retrieve the account detail, the application finds all children and grandchildren, and then retrieves the accounts for all these related units.
When subtotaling from the catalog with a tree, the financial reports are exported for each level of the tree; however, instead of displaying the account detail for the lowest unit, the account detail prints or exports from the summary level.
Note: If you generate a report with an account filter, when you view the report in the DrillDown Viewer, the subtotal Use Account Filter option is unavailable.
Header LabelType a header for your report that indicates the account filter you are using for your subtotals.

269FRx Report Designer 6.7 User’s Guide
Chapter 7: Understanding the Catalog of Reports – Report Options Tab
This header label is very important when you run the report using several different filters; the header label identifies which filter was used to create each report.
Options for Transaction Detail ReportsThe following options are available for Transaction Detail Reports:
Subtotal By PeriodTo print the opening balance, period subtotals, and YTD total in the YTD column, select this check box (the default). If you do not select this option, only the opening balance and YTD total prints on the report.
Transaction RoundingTo apply rounding to every transaction in your transaction detail report, select this check box. To use this option, you must click Round to Whole Dollars on the Formatting tab.
Tree Options TabIf your report includes a reporting tree, you can control the way your report appears using the Tree Options tab.
Figure 7-18: Catalog of Reports Window: Tree Options Tab
Reporting Unit SelectionThe Reporting Unit Selection allows you to select the following options:
Select Units at Run TimeDisplay the reporting tree (before report generation) so that you can mark the reporting units to include in your report.
Include All UnitsUse to automatically include all units of a reporting tree.
If you specify a Starting Unit from the Building Blocks tab, FRx includes the starting unit and all child units. This produces the same result as marking the starting units and those units below when you select the Select Units at Run Time option.
Include Specific Number of LevelsUse to indicate the number of levels from the starting unit to process.
Tree Options tab

270FRx Report Designer 6.7 User’s Guide
Chapter 7: Understanding the Catalog of Reports – Report Options Tab
Levels Down From Starting UnitType the number of levels to include in your report. One level represents a parent-child relationship and two levels represent a parent-child-child relationship.
This box does not appear dimmed, but is inaccessible unless you select the Include Specific Number of Levels option.
Page BreaksThe following options are available for page breaks:
Before Each Reporting UnitTo begin a new report page with each reporting unit, select this check box (the default).
No Page Breaks between UnitsTo print the reporting units without any page breaks between units, select this option.
Use Reporting TreeTo use the page breaks as defined in the reporting tree, select this option.
Restart Numbering with Every UnitTo restart the page numbering of each reporting tree unit within a report, select this option. If you want to use sequential page numbering for all of the selected reporting units, do not select this check box.
Allow Rollup <1%To allow a roll up of less than one percent, select this check box. If you do not select this option, an entry of .25 in the Rollup% cell of the reporting tree indicates that 25% of each row should be rolled up to the parent. With this box selected, an entry of .25 would limit the roll up to .25% (one fourth of one percent). For additional information, see “Building Reporting Trees Manually” on page 205.
Disable Tree SecurityTo allow all users to drill down into all detail levels, select this check box.
Advanced TabThe Advanced tab contains several different advanced settings. You can use the settings to:
Generate an exception report with your report
Roll up periods by number or date
Change report processing priority

271FRx Report Designer 6.7 User’s Guide
Chapter 7: Understanding the Catalog of Reports – Report Options Tab
Change calculation priority
Figure 7-19: Catalog of Reports Window: Advanced Tab
Exception ReportThe following selections are available to you:
Report Missing AccountsTo generate an exception report that shows the general ledger account balances that were not included in the financial report, select this check box. FRx determines missing accounts using the lowest and highest account numbers from the row format, then displays a list of those accounts that are not in the row format but exist in the general ledger.
Note: If a missing account is higher or lower than all the accounts in the row format, it is not included in the exception report.
Report Duplicate AccountsTo generate an exception report that shows any accounts that were included more than once in the original report, select this check box. FRx determines the duplicate accounts from the account codes used in the row format.
Rollup BasisUse the following rollup options:
Period NumbersTo roll up accounts by period numbers in multi-company reporting trees, select this option (the default).
Period DatesTo roll up accounts by period dates in multi-company reporting trees, select this option.
Note The Rollup Basis options are especially useful for companies with different start and end period dates, and fiscal year dates.
Advanced tab

272FRx Report Designer 6.7 User’s Guide
Chapter 7: Understanding the Catalog of Reports – Report Options Tab
Report QueuePriority Level
To change the report-processing priority level on the Report Server, click the Priority Level arrow and select High, Medium, or Low.
Calculation PriorityThe following calculation options are available:
Calculate Columns FirstTo perform the column calculations before the row calculations, select this option. This option might be necessary when a column calculation (CALC) intersects a total (TOT) or calculation (CAL) row, and you want the row calculation to overwrite the column calculation.
Calculate Rows FirstTo perform the row calculations before the column calculations, select this option (the default). This option works best in the following situations:
Report with a CALC column or with simple calculationsRow format and column layout that use only simple mathematical operands (+ and -)
Other OptionsThe following options are available to you:
Include Amounts in Future PeriodsTo include amounts in columns that specify periods beyond the base period (as defined in the Report Date box), select this option (the default). If you do not want the future period amounts to appear in your report, clear this box.
Note This is a Report Server feature and is not available in the Desktop edition.

273FRx Report Designer 6.7 User’s Guide
Chapter 7: Understanding the Catalog of Reports – Report Options Tab
Display Report Processing StatusTo display the FRx Reporting Engine status window during report generation, select this option (the default).
Figure 7-20: FRx Reporting Engine Status Window
Missing Unit WarningWith this option selected, a warning message displays during report processing when a column or row is restricted to a reporting unit and the reporting unit does not exist or was not selected in the tree (the default). If you want to use a restricted row or column in other reports and do not want to see this warning, clear this check box.
Exclude Inactive Accounts (If Available)If your Open Financial System Interface (OFSI) supports the exclusion of inactive accounts, select this option to generate reports that exclude inactive accounts. By default, this option is not checked. If you check this option and your OFSI does not support inactive accounts, your reports are not affected.
Disable ledger refreshThis option is unavailable (dimmed) for OFSI interfaces to the general ledger.
Currency Translation TabIf your report includes more than one currency, use the Currency Translation tab to establish conversion options.
Figure 7-21: Catalog of Reports Window: Currency Translation Tab
The following DAX currency options are available to you:
Currency Translation tab

274FRx Report Designer 6.7 User’s Guide
Chapter 7: Understanding the Catalog of Reports – Reports
Spot Rate SourceThis box identifies the database from which the spot (daily) currency exchange rate is taken. Select FRx to use the DAX Currency Conversion tables; select OFSI (General Ledger) to extract currency exchange rate data from the general ledger.
Historical Rate SourceThis box identifies the database from which the historical currency exchange rate is taken. FRx is the only option available for the Historical Rate Source, because both historic conversion rates and base currency amounts are read from the FRx DAX rate table.
Change Average CalculationsSelect this check box to calculate exchange rate averages as (Sum of Rates / Number of Rates Entered * Balance).
Leave this check box blank to calculate averages Sum Rates/No. of Days * Amount).
ReportsWhen you create a new report, some of the boxes, check boxes, and options in the Catalog of Reports window are completed by default. When you generate a report using the default settings, it displays only summary information for the posted balances of the system date minus one period (S-1). By default, the report is generated as a DrillDown Viewer (Enhanced XML) file to view in the DrillDown Viewer. This section contains information and instructions on:
Creating a Report
Generating a Report
Printing Catalog Information
Chaining Your Reports
Cloning Your Reports
Including Additional Text in a Report
Creating a ReportTo create a report
1 From the FRx Control Panel, click Catalog of Reports to display the Select Catalog for Display dialog box.

275FRx Report Designer 6.7 User’s Guide
Chapter 7: Understanding the Catalog of Reports – Reports
2 Click New to display a new Catalog of Reports window.
3 In the Catalog ID box, type the report name.
4 In the box to the right of the Catalog ID box, type a report description.
5 Check the company code displayed in the Company box; this is the default company.
6 Click the Detail Level arrow and use one of the following report detail options:
If Then
The displayed code is for your report company
Go to step 6.
The displayed code is not the report company
1 Click the Company arrow.2 In the Select a Company for this Record
dialog box, select the correct company code and click OK.
3 Go to step 6.
To Select
Create a financial report Financial Report
Create a account detail report Account Only
Create a financial and an account detail report
Financial & Account

276FRx Report Designer 6.7 User’s Guide
Chapter 7: Understanding the Catalog of Reports – Reports
7 Click the Provisional arrow and select one of the following provisional data options:
8 To change the report date, click the Report Date arrow to display the Periods and Dates dialog box.
9 In the Base Period box, enter the period that you want the report to use.In the Base Year box, enter the report fiscal year.The Period Covered and Report Date descriptions change based on your previous selections; you can click in the boxes and edit the text as needed. This text appears in your report header. If you want to save a base period with this report, click the Default Base Period arrow and select or edit the available options. For more information, see Specifying Report Periods and Dates on page 233.
10 Click OK to return to the Catalog of Reports Window.
11 On the Building Blocks tab, do the following:In the Row Format list box, select a row format and click OK.In the Column Layout list box, select a column layout and click OK.
12 To generate the report with a reporting tree, select a reporting tree from the Reporting Tree list box and click OK.
13 On the File menu, click Save.
Create a transaction detail report
Transaction Only
Create a financial report including account and transaction details
Financial & Transaction
To Select
Include only posted transactions and balances
Use Posted Balances Only
Include all posted and unposted balances and transactions
Provisional: Posted + Unposted Activity
Include transactions that have not been posted
Include Unposted Activity Only
To Select
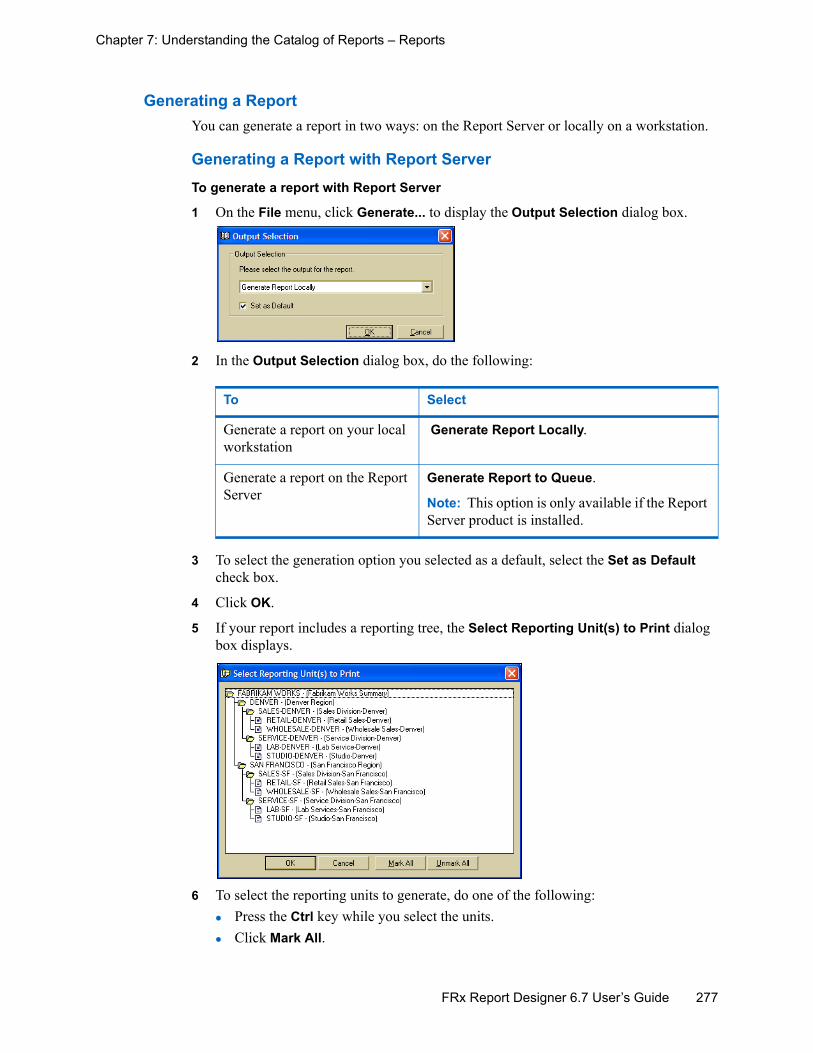
277FRx Report Designer 6.7 User’s Guide
Chapter 7: Understanding the Catalog of Reports – Reports
Generating a ReportYou can generate a report in two ways: on the Report Server or locally on a workstation.
Generating a Report with Report ServerTo generate a report with Report Server
1 On the File menu, click Generate... to display the Output Selection dialog box.
2 In the Output Selection dialog box, do the following:
3 To select the generation option you selected as a default, select the Set as Default check box.
4 Click OK.
5 If your report includes a reporting tree, the Select Reporting Unit(s) to Print dialog box displays.
6 To select the reporting units to generate, do one of the following:Press the Ctrl key while you select the units.Click Mark All.
To Select
Generate a report on your local workstation
Generate Report Locally.
Generate a report on the Report Server
Generate Report to Queue.
Note: This option is only available if the Report Server product is installed.

278FRx Report Designer 6.7 User’s Guide
Chapter 7: Understanding the Catalog of Reports – Reports
7 Click OK.
8 Report processing proceeds according to your Output Selection in step 1, as follows:If you selected to generate the report locally, the Report Status dialog box displays a summary of the report progress. To stop processing, click Cancel.When FRx finishes processing the report, the DrillDown Viewer opens and displays it.
If you selected to generate the report on the Report Server, the Catalog(s) queued successfully message box appears.
9 Click OK to close the message window and continue processing the report on the Report Server.For more information on the Report Server, see your FRx® Report Server 6.7 User’s Guide.
Generating a Report LocallyFor more information on the Report Server, see your FRx® Report Server 6.7 User’s Guide.
To generate a report locally
1 On the Catalog of Reports toolbar, click Generate Report to display the Output Selection dialog box.
The Generate Report Locally option displays because the Report Server is not installed.
2 Click OK.
3 If your report includes a reporting tree, the Select Reporting Unit(s) to Print dialog box appears.
4 Select the reporting units that you want to generate by pressing the Ctrl key while you select the units or click Mark All.
5 Click OK.

279FRx Report Designer 6.7 User’s Guide
Chapter 7: Understanding the Catalog of Reports – Reports
6 The Report Status dialog box displays a summary of the report progress. To stop processing, click Cancel.When FRx finishes processing the report, the DrillDown Viewer opens and displays it.
Printing Catalog Information To print catalog information
1 On the File menu, click Print Catalog...to display the Print Catalog Information dialog box.
2 Do one of the following:
3 Select one of the following optionsTo print summary information, click Print Summary.Your report prints the following format:
To print information about Do this
Multiple reports Press and hold the Ctrl key while you select the reports.
All reports Click Select All.
Catalog Information Building Blocks
Catalog Id Row
Catalog Description Row Description
Company Code Column
Column Description
Tree
Tree Description

280FRx Report Designer 6.7 User’s Guide
Chapter 7: Understanding the Catalog of Reports – Reports
To print detail information, click Print Detail.Your reports prints report detail in the following format:
4 Verify the print settings.
5 Click OK.
Chaining Your Reports When you want to generate several reports at a time, chain them together so that they generate one after the other.
To chain reports together
1 From the FRx Control Panel, click Catalog of Reports to display the Select Catalog for Display dialog box.
2 In the Select Catalog for Display dialog box, select the first Catalog ID that you want to generate and click OK.
3 Click the Output tab.
4 Click the Chain to Catalog ID arrow.
Catalog Information
Building Blocks Report Information
Report Formatting
Catalog ID Row Base Period Left Margin
Catalog Description
Row Description Detail Level Right Margin
Company Code Column Provisional Top Margin
Column Description
Output Type Bottom Margin
Tree File Name Orientation
Tree Description Chained to Catalog
Scaling
Exception Reporting
Calculation Priority
Rounding
Print Selection

281FRx Report Designer 6.7 User’s Guide
Chapter 7: Understanding the Catalog of Reports – Reports
5 In the Select Catalog for Display dialog box, select the Catalog ID that you want to run after the current report and click OK.The Catalog ID that you selected appears in the Chain to Catalog ID box. Whenever you run the current Catalog ID, this report runs immediately after it.
6 From the Output tab, clear the Prompt for Output Type at Run Time box.This allows the reports to process without interruption.
7 Click the Building Blocks tab and choose from the following options:
8 Click Save.
If Then do this
The current Catalog ID does not include a reporting tree
Go to step 8.
The Catalog ID includes a reporting tree
1 Click the Report Options tab.2 Click the Tree Options tab.3 In the Reporting Unit Selection section,
choose from the following options:To process all units in the reporting tree, click the Include All Units check box.To process specific reporting tree levels:
1. Select the Include Specific Number of Levels box.
2. Enter a value in the Levels Down form Starting Unit box.
3. From the Building Blocks tab, select a Starting Unit.
This allows the reports to process without interruption.
To select specific units before processing the report, select the Select Units at Run Time box.
In this example, the CashFlow report is generated immediately after Tran_Dept

282FRx Report Designer 6.7 User’s Guide
Chapter 7: Understanding the Catalog of Reports – Reports
9 Click Find.
10 In the Select Catalog for Display dialog box, select the last chained report and click OK.
11 Choose from the following options:
The Catalog IDs run, one after the other, in the order they were chained.
Cloning Your Reports It takes a lot of care to set up a report the way that you want. To simplify the process, you can reuse your catalog IDs by cloning them. Cloning your catalog IDs allows you to use your own report definitions as the default for creating new definitions.
To clone a catalog ID
1 From the FRx Control Panel, click Catalog of Reports.
2 In the Select Catalog for Display dialog box, select the report that you want to clone and click OK.
3 In the Catalog Records record control box, click Clone.This clears two boxes, the Catalog ID and the File Name in the Output tab. All other original report settings remain.
4 In the Catalog ID box, type a new Catalog ID name.When you enter a new catalog ID, the File Name in the Output tab automatically uses the first eight characters of your new catalog ID name for the default file name.
5 In the Catalog ID description box, you can replace the existing description with a new one.
6 Check the company code displayed in the Company box; this is the default company.
To Do this
Add another report to the chain Repeat steps 3 through 10 for each report that you want to chain together.
Complete the chain and run the reports
1 Click Save.2 Select Generate Report.3 In the confirmation message box, click Yes.
If Then
The displayed code is for your report company
Go to step 7.
The displayed code is not the report company
1 Click the Company arrow.2 In the Select a Company for this Record
dialog box, select the correct company code and click OK.

283FRx Report Designer 6.7 User’s Guide
Chapter 7: Understanding the Catalog of Reports – Reports
7 Review your report selections and make changes, as needed.
8 Click Save.To generate your report, see “Generating a Report” on page 277.
Including Additional Text in a Report The Additional Text feature lets you add additional text entries from the Additional Text column in the Reporting Trees window to the header/footer section in reports. For information about creating Additional Text entries in the reporting trees, see “Adding Text to the Reporting Units in a Tree” on page 216.
To include additional text in the report header or footer
1 From the Catalog of Reports window, click the Page Options tab.
2 Click the Headers / Footers tab.
3 Select either the Page Headers or Pages Footers option.
4 Click the Left, Center, or Right cell to select the text alignment.
5 Click the Codes arrow and select Text[#] from Reporting Tree (@UNITT[#]).
Note: Select the actual unit text entry number indicated by the # symbol. For example, @UNITT4 specifies the fourth additional text entry for the reporting unit.
6 Click Save.
7 Click Close.

284FRx Report Designer 6.7 User’s Guide
Chapter 7: Understanding the Catalog of Reports – Scheduling Reports for Processing
Scheduling Reports for ProcessingIf you installed the Report Server, you can use the scheduling function to schedule reports to process once or on an hourly, daily, weekly, monthly, or yearly basis. The Schedule icon is available on the toolbars for all Report Designer windows. For complete details on using the scheduling function, refer to Chapter 2 of the FRx® Report Server 6.7 User’s Guide.
The Report Server, also discussed in detail in the FRx® Report Server 6.7 User’s Guide, is a separate product that serves as a high-performance report processor. After installing the Report Server, you can use the it to generate reports. As a result, you can continue working on your local workstation while the reports run on the Report Server instead of your own workstation.

285
Chapter 8
FRx Report Designer 6.7 User’s Guide
Using Extensible Business ReportingLanguage (XBRL)
Microsoft® Business Solutions for Analytics–FRx® supports output to XML-based financial reports using Extensible Business Reporting Language (XBRL) version 2.0 specifications and taxonomies. You can include XBRL taxonomy links in your row format and create XBRL instance documents using FRx® Report Designer.This chapter includes an overview of XBRL and describes how to:
Include XBRL elements in the row format
Include XBRL Tag column types in the column layouts
Select XBRL Output Type in the Catalog of Reports
Common XBRL terms are defined at the end of the chapter.
Extensible Business Reporting Language (XBRL) Overview . . . . . . . . . . . . . . . . . 286
Including XBRL Elements in the Row Format289
Including XBRL Elements in the Column Layout . . . . . . . . . . . . . . . . . . . . . . . . . 293
Selecting XBRL Output Type in the Catalog of Reports . . . . . . . . . . . . . . . . . . . . . . 295
XBRL Definitions . . . . . . . . . . . . . . . . . 298

286FRx Report Designer 6.7 User’s Guide
Chapter 8: Using Extensible Business Reporting Language (XBRL) – Extensible Business Reporting
Extensible Business Reporting Language (XBRL) OverviewThe XBRL 2.0 specification and taxonomy for financial reporting of commercial and industrial companies under US GAAP was released by the XBRL Committee on November 15, 2002. XBRL is intended to provide an XML-based framework that the global business information community will use to create, exchange, and analyze financial reporting information, including regulatory filings such as annual and quarterly financial statements, general ledger information, and audit schedules. XBRL is freely licensed and facilitates the automatic exchange and reliable extraction of financial information among various software applications and technologies, including the Internet.With the 6.7 release of Report Designer, you can include XBRL element tags in the row format by linking to the version 2.0 XBRL taxonomy (us-gaap-ci-2003-07-07.xsd or a custom taxonomy that complies with the XBRL version 2.0 standard) and selecting the appropriate XBRL element tag for GL Link, CAL, and TOT type rows. Only rows that are tagged with an XBRL element tag will be passed into the XBRL instance document. If the row description is blank, FRx uses the XBRL element label from the taxonomy as the description. In the column layout, the XBRL_TAG column type allows the XBRL element tags found in the row format to be presented in a column of the FRx® DrillDown ViewerTM (Enhanced XML) .frd output file. See Figure 8-1 on page 297 for an example.There are no changes to the FRx reporting tree building block, however for reports that yield data based on reporting trees, selecting XBRL output type will create separate instance documents for each selected reporting unit in the tree. If you use the code @ANY in the Company column of the tree, Report Designer uses the Company Name specified in the Catalog of Reports as the Company entity in the XBRL report.The Catalog of Reports includes XBRL Instance Document as an output type selection. When XBRL is selected as the output type, you have the option to enable or disable the Missing Element Tag Warning feature when the report generates. When you select XBRL as the output type, Report Designer generates instance documents that include XBRL elements and syntax.

287FRx Report Designer 6.7 User’s Guide
Chapter 8: Using Extensible Business Reporting Language (XBRL) – Extensible Business Reporting
Here is an example of XBRL instance document output. <?xml version="1.0" encoding="utf-8"?>- <group xmlns="http://www.xbrl.org/2001/instance" xmlns:xbrli="http://www.xbrl.org"
xmlns:link="http://www.xbrl.org/2001/XLink/xbrllinkbase"xmlns:xbrll="http://www.xbrl.org/2001/XLink/xbrllinkbase" xmlns:xsi="http://www.xbrl.org"xmlns:XBRL1="C:\Program Files\FRx 6.7\IO_Data\Taxonomy Files\us-gaap-ci-2003-07-07.xsd\XBRL1"xsi:schemaLocation="C:\Program Files\FRx 6.7\IO_Data\Taxonomy Files\us-gaap-ci-2003-07-07.xsd\XBRL1 C:\Program Files\FRx 6.7\IO_Data\Taxonomy Files\us-gaap-ci-2003-07-07.xsd">
- <numericContext id="P1M/2003-02-28/2" precision="18" cwa="false"> - <entity> <identifier scheme="">Fabrikam Works, Inc.</identifier> </entity> - <period> <startDate>2003-02-01</startDate> <endDate>2003-02-28</endDate> </period> - <unit> <measure>USD</measure> </unit> <scenario>ACTUAL</scenario> </numericContext>
- <numericContext id="P1M/2003-02-28/3" precision="18"cwa="false"> - <entity> <identifier scheme="">Fabrikam Works, Inc.</identifier> </entity> - <period> <startDate>2003-02-01</startDate> <endDate>2003-02-28</endDate> </period> - <unit> <measure>USD</measure> </unit> <scenario>Budget_Best</scenario> </numericContext>
- <numericContext id="YTD/2003-02-28/4" precision="18" cwa="false"> - <entity> <identifier scheme="">Fabrikam Works, Inc.</identifier> </entity> - <period> <instant>2003-02-28</instant> </period> - <unit> <measure>USD</measure> </unit> <scenario>ACTUAL</scenario> </numericContext>
- <numericContext id="YTD/2003-02-28/5" precision="18" cwa="false"> - <entity> <identifier scheme="">Fabrikam Works, Inc.</identifier> </entity> - <period> <instant>2003-02-28</instant> </period> - <unit>

288FRx Report Designer 6.7 User’s Guide
Chapter 8: Using Extensible Business Reporting Language (XBRL) – Extensible Business Reporting
<measure>USD</measure> </unit> <scenario>Budget_Best</scenario> </numericContext>
<XBRL1:usfr-pt_SalesRevenueGross.usfr-pt_SalesRevenueGrossServices id="P1M/2003-02-28/2">556272</XBRL1:usfr-pt_SalesRevenueGross.usfr-
pt_SalesRevenueGrossServices> <XBRL1:usfr-pt_SalesRevenueGross.usfr-pt_SalesRevenueGrossServices id="P1M/2003-02-28/3">486935.55</XBRL1:usfr-pt_SalesRevenueGross.usfr-
pt_SalesRevenueGrossServices> <XBRL1:usfr-pt_SalesRevenueGross.usfr-pt_SalesRevenueGrossServices id="YTD/2003-02-28/4">1103330</XBRL1:usfr-pt_SalesRevenueGross.usfr-
pt_SalesRevenueGrossServices> <XBRL1:usfr-pt_SalesRevenueGross.usfr-pt_SalesRevenueGrossServices id="YTD/2003-02-28/5">956676.22</XBRL1:usfr-pt_SalesRevenueGross.usfr-
pt_SalesRevenueGrossServices></group>

289FRx Report Designer 6.7 User’s Guide
Chapter 8: Using Extensible Business Reporting Language (XBRL) – Including XBRL Elements in the Row
Including XBRL Elements in the Row Format In order to build a report for XBRL output, you need to include the XBRL elements in the row format. This includes the following tasks:
Create a Link to the XBRL taxonomy. The US GAAP CI taxonomy (us-gaap-ci-2003-07-07.xsd), a read-only taxonomy published by the XBRL Committee, is installed in the IO_Data\Taxonomy Files directory with FRx.
Add XBRL element tags to each GL Link, CAL, and TOT type row that you want to include in the XBRL instance document. Only rows with XBRL element tags will be included in the instance document.
Remember that XBRL output does not support the use of FRx row modifiers in the row format.
This section includes information and instructions on:
Creating a Link to the XBRL Taxonomy
Adding XBRL Element Tags to the Row Format
Updating Existing Row Formats for XBRL 2.0
Creating a Link to the XBRL TaxonomyTo create a link to the XBRL taxonomy
1 On the Row Format Link menu, click Open Link Window to display the Links dialog box.
2 In the Links record control box, click New.
3 Click the Link Type arrow and select XBRL as the link type.
4 In the Link Name box, type a name for the link.
5 Click the XBRL Taxonomy Files arrow and select the us-gaap-ci-2003-07-07.xsd taxonomy file to use the standard taxonomy.
Note Row formats created for XBRL version 1.0 must be updated to link to the XBRL version 2.0 taxonomy before they will run correctly. See “Updating Existing Row Formats for XBRL 2.0” on page 291.

290FRx Report Designer 6.7 User’s Guide
Chapter 8: Using Extensible Business Reporting Language (XBRL) – Including XBRL Elements in the Row
6 Click Open.
Note: XBRL taxonomy files have .xsd as the file extension, and the IO_Data\Taxonomy Files directory contains a set of related taxonomy files. Be certain you select the master taxonomy file (us-gaap-ci-2003-07-07.xsd) or an XBRL version 2.0 compliant custom taxonomy. Refer to the service pack release notes to determine the most current file name if the taxonomy file has been updated since this manual was created.
7 In the Links record control box, click Save.
8 Click Close to close the Links record control box and return to the Row Format window.The new Link column, showing the link name and taxonomy name, appears in the row format window.
9 Repeat steps 1 to 8 for each taxonomy you want to include in your row format. Each XBRL Link column corresponds to one taxonomy file.
Note: In addition to the standard us-gaap-ci taxonomy, you can include one or more custom taxonomies in a row format. You can only link to one taxonomy from a particular row.
10 When you have finished adding your XBRL links, click Close.
Adding XBRL Element Tags to the Row Format Once the necessary taxonomies are selected, you can add XBRL element tags to the rows. XBRL element tags can be applied to GL Link, CAL, and TOT type rows. Only the rows that are tagged with an XBRL element tag will be passed into the instance document, so it is important to tag all necessary rows.If the Description cell for the row is blank, the description will be filled in with the XBRL element tag label from the taxonomy; however, if the Description is already populated, it will remain as is.Double-clicking the Link to XBRL Taxonomy cell in the row opens the XBRL Element Tag zoom dialog box. The taxonomy displays in a tree that shows both the label for the XBRL element and the XBRL element tag. Click the expansion symbol (+) to expand nodes of the taxonomy tree, and drill down to the appropriate XBRL element tag. As you move from row to row within the XBRL Link column, the tree will re-zoom to the last node highlighted before the tree was closed, so you can select the next tag without having to re-drill in the taxonomy tree. The row format will allow only one XBRL element tag per GL Link, CAL, and TOT row. FRx will generate a message if you attempt to enter more than one tag in a row. You can select to overwrite the existing tag with the new tag or cancel the new tag entry.
Note Note: To use an XBRL element tag in a CAL or TOT row, select the CAL or TOT format code (Fmt Code) first, then add the XBRL element tag.

291FRx Report Designer 6.7 User’s Guide
Chapter 8: Using Extensible Business Reporting Language (XBRL) – Including XBRL Elements in the Row
To add XBRL element tags to the row format
1 In the Row Format window, double-click the cell in the Link to XBRL Taxonomy column to display the XBRL Element Tag zoom.
2 Click the expansion symbol (+) at the XBRL element label to expand the node of the tree.
3 Select the XBRL element tag for the row and click OK.
4 Repeat steps 1 to 3 for each row that requires an XBRL element tag.
Note: The row format allows only one XBRL element tag per row. If you attempt to add a second tag, the system displays the message: “This row already contains an XBRL tag. Would you like to overwrite this tag?” Click Yes to overwrite the old tag with a new tag. Click No or Cancel to leave the previous tag unchanged.
Updating Existing Row Formats for XBRL 2.0
Any row formats you created in FRx® Financial Reporter 6.5 with links to the XBRL version 1.0 taxonomy need to be updated to use the new taxonomy file, element tags, and data scheme for XBRL 2.0.
To update XBRL links in existing row formats
1 In the Row Format window, open an existing row format that contains XBRL links.
2 On the Row Format Link menu, click Open Link Window to display the Links dialog box.

292FRx Report Designer 6.7 User’s Guide
Chapter 8: Using Extensible Business Reporting Language (XBRL) – Including XBRL Elements in the Row
3 In the Links record control box, click Find, and locate the current XBRL link in the Find Link dialog box.
4 In the Link Name box, accept the name assigned by FRx or enter another name to identify the link.
5 Click the XBRL Taxonomy Files arrow and select the XBRL version 2.0 taxonomy file (us-gaap-ci-2003-07-07.xsd).
Note: XBRL taxonomy files have .xsd as the file extension, and the IO_Data\Taxonomy Files directory contains a set of related taxonomy files. Be certain you select the master taxonomy file (us-gaap-ci-2003-07-07.xsd). Refer to the service pack release notes to determine the most current file name if the taxonomy file has been updated since this manual was created.
6 In the Links record control box, click Save.
7 Repeat steps 1 to 6 for each taxonomy you want to include in your row format. Each XBRL Link column corresponds to one taxonomy file.
8 In the row format window, double-click the cell in the Link to XBRL Taxonomy column to display the XBRL Element Tag zoom.
9 Click the expansion symbol (+) at the XBRL element label to expand the node of the tree.
10 Select the XBRL element tag for the row and click OK.
11 Repeat steps 8 to 10 for each row that requires an XBRL element tag.
Note: The row format allows only one XBRL element tag per row. If you attempt to add a second tag, the system displays the message: “This row already contains an XBRL tag. Would you like to overwrite this tag?” Click Yes to overwrite the old tag with a new tag.

293FRx Report Designer 6.7 User’s Guide
Chapter 8: Using Extensible Business Reporting Language (XBRL) – Including XBRL Elements in the
Including XBRL Elements in the Column Layout For XBRL reports, you can build your column layouts as described in Chapter 5, “Creating Column Layouts” on page 137 with the following constraints:
Only GL and FRx Forecaster (Budget) columns are supported for financial data in the column layout for XBRL reports.
Caution: If you use Forecaster columns in an FRx report, these columns will not have valid dates in XBRL output.
Currency settings in the Currency Code and Currency Display detail rows override the functional currency for the company you select in the Catalog of Reports. If no currency is specified in the column layout, and functional currency is not defined for the selected company, the currency unit of measure will be blank in the XBRL instance document. For information on setting the functional currency for a company, see “Entering and Editing Company Information” in your FRx® Report Designer 6.7 Administrator’s Guide.
In the column layout, you can include a column type XBRL_TAG to display the XBRL element tag found in the row format for a report that you output as an .frd file (DrillDown Viewer Enhanced XML). The XBRL_TAG will not be passed from the column layout to the XBRL instance document.
To include XBRL_TAG column type in the column layout
1 In the Column Layout window, double-click the Type Column Detail row in the column where you want the XBRL_TAG column type, to display the Select the Type of Column zoom.
2 Select the XBRL_TAG column type from the list.
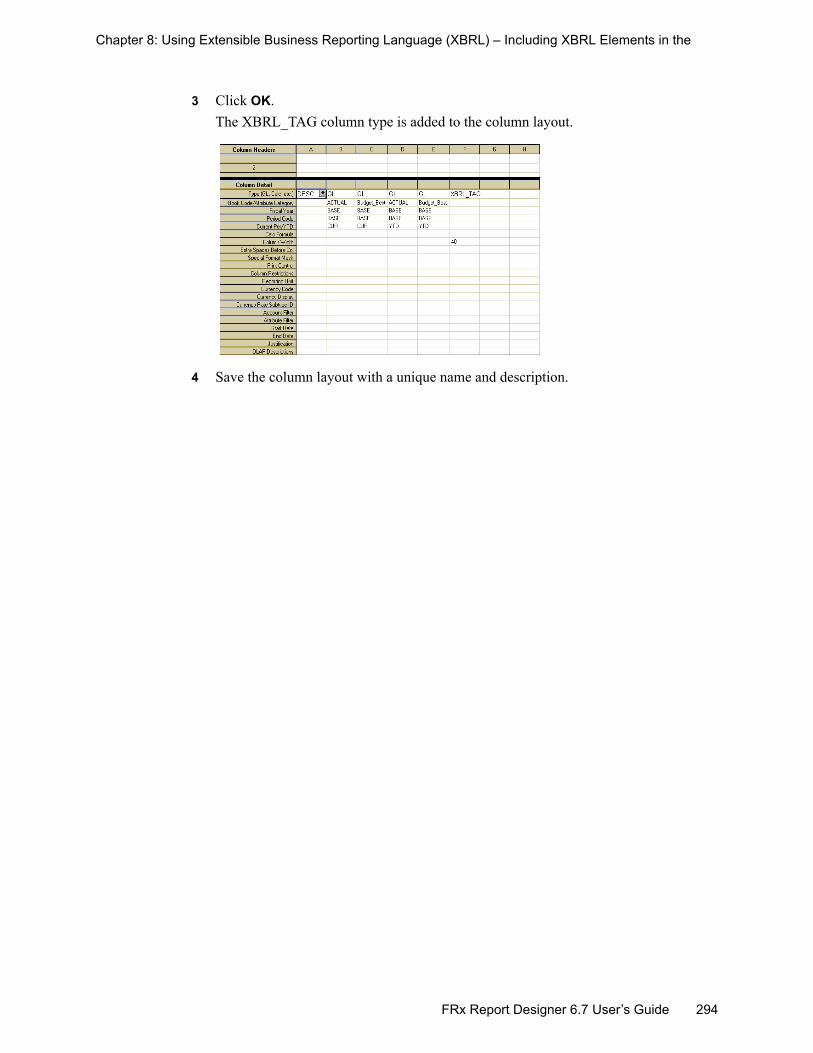
294FRx Report Designer 6.7 User’s Guide
Chapter 8: Using Extensible Business Reporting Language (XBRL) – Including XBRL Elements in the
3 Click OK.The XBRL_TAG column type is added to the column layout.
mrk
4 Save the column layout with a unique name and description.

295FRx Report Designer 6.7 User’s Guide
Chapter 8: Using Extensible Business Reporting Language (XBRL) – Selecting XBRL Output Type in the
Selecting XBRL Output Type in the Catalog of ReportsIn the Catalog of Reports, you can select XBRL as an output type. If the row format is properly populated with GL Link, CAL, or TOT rows and XBRL element tags, and the report yields data, FRx will generate an XBRL instance document with an .xml file extension. The XBRL Option in the Catalog of Reports allows you to select or deselect the Missing Element Tag Warning option. When this option is selected, FRx generates a warning message each time a GL Link, CAL, or TOT row is encountered that does not contain an XBRL element tag. You can discontinue further warnings from the warning message box.Also in the Catalog of Reports, verify that a company code and company name are displayed in the Company boxes. The default company, as set up in the Company Information dialog box, appears here unless another company is selected. If no company name is specified here, the company name (identifier entity) will be blank in the XBRL instance document. You must select No Rounding in the Catalog of Reports Report Options, Formatting tab.XBRL instance documents are generated differently for reports with and without trees, as described in the following scenarios:
If a report without a tree yields data, then one instance document is created using the filename found in the File Name field of the Catalog of Reports.
If a report with a tree yields data, then a separate instance document is created for each unit selected for reporting. The filenames for the instance documents will use the name in the File Name field of the Catalog of Reports, plus the unit title/description from the tree. If there is more than one unit with the same unit title/description in a tree, the name will be appended with a number and increased by one for every occurrence to create unique filenames. (For example, Denver-Sales, Denver-Sales1, Denver-Sales2, and so forth.)
If a report with a tree is generated and at least one selected unit in the tree yields data, then an instance document is created for every selected unit, whether the unit yields data or not. The instance documents for the units that yield no data are generated with zero amounts written to the item tags.
If a report with or without a tree is generated and yields no data, then no instance document will be created, and FRx displays the message, “This report yielded no data. No Instance Document will be created.”
If a report with or without a tree is generated and yields data, any rows that have XBRL element tags, but are missing the GL Link, CAL, or TOT row types, will show a zero amount in the instance document.
This section contains information and instructions on:
Selecting XBRL Output Type from the Catalog of Reports
Selecting FRD Output Type For XBRL Reports

296FRx Report Designer 6.7 User’s Guide
Chapter 8: Using Extensible Business Reporting Language (XBRL) – Selecting XBRL Output Type in the
Selecting XBRL Output Type from the Catalog of Reports
To select XBRL output type from the Catalog of Reports
1 In the Company box, select the company code for the reporting company.The company name for the selected company appears in the box to the right of the company code. This is the company name that appears in the XBRL instance document.
2 In the Catalog of Reports window, click the Output tab.
3 On the Output Options tab, click the Output arrow and select XBRL from the list of output options.
4 From the XBRL Options, select Missing Element Tag Warning to display a warning message each time a GL Link, CAL, or TOT row is encountered that does not contain an XBRL element tag.
Note: The Missing Element Tag Warning option is selected by default. Clear the check box to suppress missing element tag warnings from displaying when you run the XBRL report.
5 Click the Report Options tab.
6 On the Report Options tab, click the Formatting tab.
7 Under Rounding of Amounts, select No Rounding.
8 On the File menu, click Save.
Company Code Company Name that appears in the XBRL instance document

297FRx Report Designer 6.7 User’s Guide
Chapter 8: Using Extensible Business Reporting Language (XBRL) – Selecting XBRL Output Type in the
Selecting FRD Output Type For XBRL ReportsInstance documents cannot be displayed in the DrillDown Viewer, however you can display the XBRL element tags from the row format in a report that you output as an .frd file (DrillDown Viewer Enhanced XML). The row format and column layout must satisfy the following requirements to successfully display the XBRL element tags in the DrillDown Viewer.
The row format must contain GL Link, CAL, or TOT rows with XBRL element tags.
The column layout must contain the XBRL_TAG column type.When you select DrillDown Viewer (Enhanced XML) as the output type from the Catalog of Reports, FRx creates a file with an .frd extension that can be displayed in the DrillDown Viewer. Show me an ExampleThe following example (Figure 8-1:), based on the column layout on page 294, shows Descriptions, GL amounts, and XBRL element tags as they might appear in the .frd file displayed in the DrillDown Viewer. This .frd output corresponds to the XBRL instance document output example on page 287.
Figure 8-1: XBRL Element Tags Displayed in DrillDown Viewer

298FRx Report Designer 6.7 User’s Guide
Chapter 8: Using Extensible Business Reporting Language (XBRL) – XBRL Definitions
XBRL Definitions
XBRL Term Definition
XBRL Extensible Business Reporting Language (XBRL) is an open specification that uses XML-based data tags to describe financial statements for both public and private companies.
XBRL Taxonomy Document
An XBRL taxonomy document is an XML Schema file that describes a set of concepts used in preparing an XBRL instance document. A taxonomy document can be either an XBRL taxonomy, such as US GAAP CI, or a custom taxonomy created in conformance with XBRL specifications. Custom taxonomies are used to extend the XBRL taxonomies to address company and/or industry specific items not addressed in the XBRL taxonomies.
Taxonomy The XBRL taxonomy is a classification system for business and financial reporting data elements. XBRL taxonomies can be regarded as extensions of XML Schema.
Instance Documents Instance documents contain data. An XBRL instance document contains accounting, financial, or other business related data (for example, a financial statement issued by a company), expressed using XBRL syntax, and making use of the XBRL taxonomy. The financial statements of a company or any part thereof, expressed in XBRL, would be an instance document as would an HTML file that had various XBRL items embedded in it.
Element Element refers to an XML element, but also a “fact” or piece of information described by this taxonomy. For example, the element with the name “nonCurrentAssets.propertyPlantAndEquipmentNet” is an element.
Element Names Element names consist of two parts separated by a period using camel case conventions of 80 characters total or less. The logic for creating element names in this manner is discussed in the XBRL 2.0a Specification dated 2002-11-15. For example, “usfr-pt_balanceSheet.usfr-pt_assets” is an element name.
Table 8-1: XBRL Terms and Definitions

299
Chapter 9
FRx Report Designer 6.7 User’s Guide
Using FRx Currency Translation
FRx® Currency Translation is a separately licensed function of FRx® Report Designer.This chapter explains how to:
Set up the Report Designer to activate the Currency Translation functionality, including specifying the file location of the DAX currency rate database
Design Currency Translation reports
Adjust Currency Translation settings in the catalog of reports
For information about administering Currency Translation, refer to the FRx® Report Designer 6.7 Administrator’s Guide.
FRx Currency Translation: Overview . . 300
Setting Up the FRx System for Currency Translation . . . . . . . . . . . . . . . . . . . . . . 302
Designing Currency Translation Reports303

300FRx Report Designer 6.7 User’s Guide
Chapter 9: Using FRx Currency Translation – FRx Currency Translation: Overview
FRx Currency Translation: Overview While many host general ledgers provide for some type of currency conversion, very few provide the sophisticated currency translation needed by enterprises. Microsoft® Business Solutions for Analytics–FRx® provides a completely new method of performing currency translations automatically and dynamically across one or more entities, currencies, and general ledger systems. This new method is named DAX (Dynamic, Automatic Currency Translation System).DAX works with a variety of host systems, all with varying degrees of sophistication. While some accounting systems may store currency exchange rates that should be used by FRx, other systems make no conversion rates available, thus requiring rates to be stored within FRx tables. DAX can alternately pull information from the general ledger (via OFSI) or from tables maintained within FRx.
The primary purposes for currency conversion in FRx are:
Consolidation of Foreign Subsidiary – If a company has a subsidiary that maintains its financial records in a currency other than the primary currency of the parent, then the subsidiary’s financial data must be converted to the parent’s currency before the amounts can be consolidated. Therefore, if a parent unit in an FRx tree uses a different currency than one of its children, every amount in the child’s report must be converted to the parent's currency before the amounts are rolled up to the parent.
Restatement to a Different Currency – If a financial statement is required in a different currency than the primary currency of a reporting unit, the amounts must be converted to the alternate currency.
FRx ships a currency definition table that is fully populated with every currency defined by the ISO standard (4217:1995). This table contains the numeric precision for each currency. The default ISO code list is dated 9/10/2003. Check your FRx product release notes for information about current updates to this table.Users can maintain currency exchange rates in the FRx Rate Maintenance tables if the appropriate information is not contained in the accounting system for a company. The Rate Maintenance tables contain the exchange rates between an unlimited number of currencies and a single base/foundation currency. This base/foundation currency is the currency in which all other currencies are stated. For U.S. based companies, this will be the US Dollar, but European companies will probably use the EURO. Many companies may want to maintain two rate tables if they use the EURO as the basis for all European conversions and the US Dollar for non-European conversions. For information about maintaining currency exchange rates, see Chapter 3, “Administering Currency Translation,” in your FRx® Report Designer 6.7 Administrator’s Guide.You need to set up the FRx system before you can use the currency translation function to build reports.
Note FRx uses an OLE server to provide standard interfaces from FRx to financial system data. The FRx Open Financial Systems Interface (OFSI) provides a common interface to financial system data regardless of the underlying financial system.

301FRx Report Designer 6.7 User’s Guide
Chapter 9: Using FRx Currency Translation – FRx Currency Translation: Overview
Once you have prepared the system settings, you can activate DAX Currency Translation and then use the currency translation codes in your row formats and column layouts to build FRx reports. In the Catalog of Reports, you select these row formats and column layouts as building blocks for currency translation reports, select which DAX tables to use, and set the method for calculating currency rate averages. For more information on calculating exchange rate averages, see “Selecting the Method of Average Rate Calculation” in Chapter 3 of your FRx® Report Designer 6.7 Administrator’s Guide.

302FRx Report Designer 6.7 User’s Guide
Chapter 9: Using FRx Currency Translation – Setting Up the FRx System for Currency Translation
Setting Up the FRx System for Currency Translation Your FRx System Administrator will need to set up some system parameters for the currency translation function. Ensure that the following preparations are in place before you use Currency Translation to build FRx reports:
Set the Functional Currency in the Company Information dialog box.
Set the path to the DAX Currency Translation file in the Company Information dialog box.
Set the path to the DAX Currency Translation file in the System Preferences dialog box.
Enter currency exchange rates in the FRx Currency Translation Maintenance window.
For detailed instructions on setting up Report Designer for currency translation, see Chapter 3 of your FRx® Report Designer 6.7 Administrator’s Guide.
Note If your FRx license includes the currency translation function, both the Company Information dialog box and the System Preferences dialog box have additional fields for selecting the path to the DAX Currency Translation file.
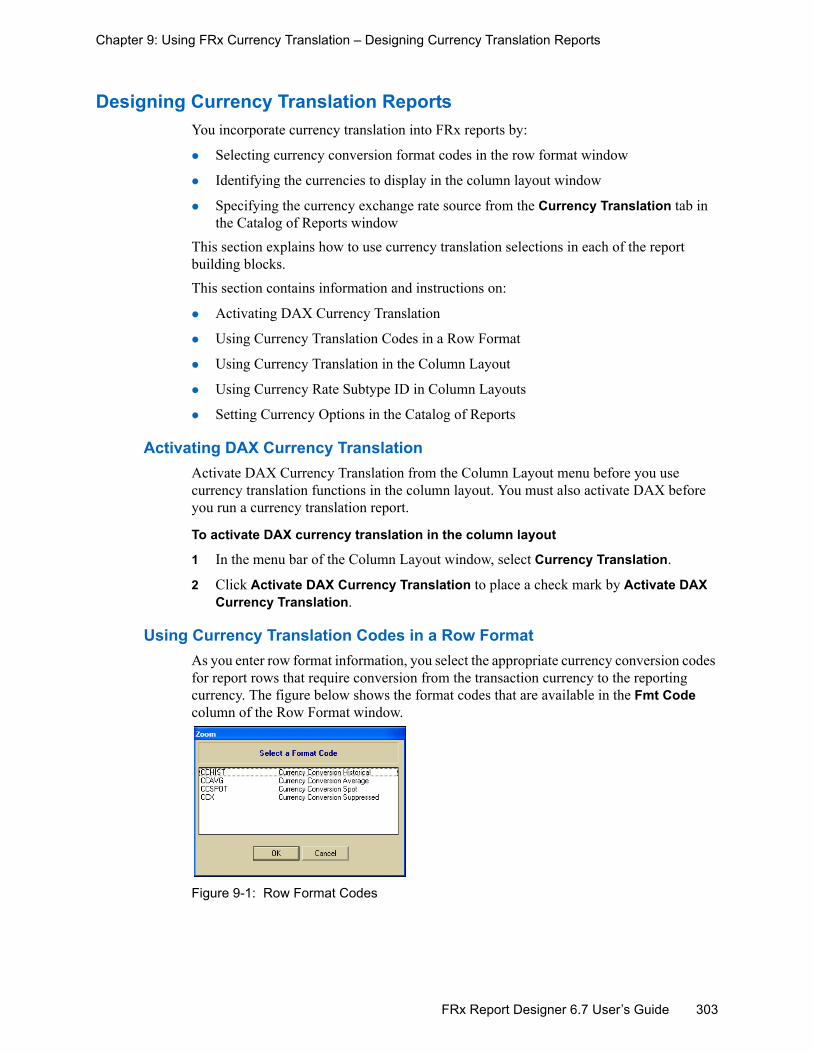
303FRx Report Designer 6.7 User’s Guide
Chapter 9: Using FRx Currency Translation – Designing Currency Translation Reports
Designing Currency Translation Reports You incorporate currency translation into FRx reports by:
Selecting currency conversion format codes in the row format window
Identifying the currencies to display in the column layout window
Specifying the currency exchange rate source from the Currency Translation tab in the Catalog of Reports window
This section explains how to use currency translation selections in each of the report building blocks.This section contains information and instructions on:
Activating DAX Currency Translation
Using Currency Translation Codes in a Row Format
Using Currency Translation in the Column Layout
Using Currency Rate Subtype ID in Column Layouts
Setting Currency Options in the Catalog of Reports
Activating DAX Currency Translation Activate DAX Currency Translation from the Column Layout menu before you use currency translation functions in the column layout. You must also activate DAX before you run a currency translation report.
To activate DAX currency translation in the column layout
1 In the menu bar of the Column Layout window, select Currency Translation.
2 Click Activate DAX Currency Translation to place a check mark by Activate DAX Currency Translation.
Using Currency Translation Codes in a Row Format As you enter row format information, you select the appropriate currency conversion codes for report rows that require conversion from the transaction currency to the reporting currency. The figure below shows the format codes that are available in the Fmt Code column of the Row Format window.
Figure 9-1: Row Format Codes

304FRx Report Designer 6.7 User’s Guide
Chapter 9: Using FRx Currency Translation – Designing Currency Translation Reports
Once you select a currency conversion format code, FRx uses this code for all subsequent rows, until a different format code is encountered. For example, if you have 10 asset accounts that are all going to be converted using the spot rate, you only need to select CCSPOT in the first row, and all subsequent rows will apply the CCSPOT format code.The following currency conversion row format codes are available if your FRx license includes the currency translation function:CCHIST - This code tells FRx to perform currency conversion using the historic rate from the currency translation table. The historic rate is commonly used for rows that show non-monetary assets, such as fixed assets, inventory, or capital stock. When you use the CCHIST format code, you must also specify the Historic Rate ID as the related rate in Column D of the row format. The name of the Historic Rate folder in the FRx Currency Translation Maintenance window is the Historic Rate ID. When you use historic exchange rates in the row format, FRx matches sums in the Historic Conversion tables to the corresponding general ledger data for the GL account, and displays an Out of Balance error if the amounts do not match.
CCAVG - This code tells FRx to perform currency conversion using the average rate for a range of dates from the currency translation table. The average rate is commonly used for income rows in the report. When you use the CCAVG row format code, you must also specify an average type (AVGDAILY, AVGWEEKLY, or AVGMONTHLY) as the related rate in Column D of the row format. Your FRx Administrator must select the method for calculating exchange rate averages in the FRxRates.DAX table. For more information about calculating exchange rate averages, see “Selecting the Method for Average Rate Calculation” in Chapter 3 of your FRx® Report Designer 6.7 Administrator’s Guide. CCSPOT - This code tells FRx to perform currency conversion using the spot (daily) exchange rate from the currency translation table. If there is no spot date that matches the report date, FRx uses the closest date prior to the report date. The spot rate is commonly used for cash accounts. CCX - This code suppresses any currency conversion for this row and remains in effect until a different currency code is encountered.
Note Because individual rows in the row format can support only one related historic rate source but could link to multiple GL accounts, FRx cannot determine which historic rate and amount belong to which account in the row format. Therefore, historic rates are applied only at the financial level, and amounts will not be displayed in the account or transaction detail levels.

305FRx Report Designer 6.7 User’s Guide
Chapter 9: Using FRx Currency Translation – Designing Currency Translation Reports
The following figure shows an example of currency conversion format codes in a row format. Notice that the historic rate code (CCHIST) requires an historic rate ID to identify the related rate in Column D.
Figure 9-2: Row Format Window Showing Spot and Historic Rate Codes
In the following figure, the average row format code (CCAVG) in row 1540 requires the average type selection in Column D.
Figure 9-3: Row Format Window Showing Average and Historic Rate Codes
Historic rate codes
Spot rate code
Average rate code

306FRx Report Designer 6.7 User’s Guide
Chapter 9: Using FRx Currency Translation – Designing Currency Translation Reports
Currency Translation AdjustmentsA currency translation adjustment is needed whenever some balances are converted at a spot rate and others are converted at an historic or average rate.In row 1720 of Figure 9-3, the formula in the currency translation adjustment row will correct out-of-balance conditions between assets, and liabilities and equity. The formula subtracts the total of Net Fixed Asset in row 910 (shown in Figure 9-2) from sum of Stockholders’ Equity in row 1660 and Total Liabilities in row 1420.
Using Currency Translation in the Column Layout You can include international currency amounts in FRx reports by specifying the currency code in your column layout. The GL amounts you display in the report could be shown in the original transaction currency or a converted currency, depending on how international currency transactions are recorded in your general ledger. When DAX Currency Translation is active, the Currency Display detail row in the Column Layout can be used in two ways:
In GL type columns, use Currency Display detail row to specify whether the originating amount or a converted amount displays on the report.
In TCURX type columns, use Currency Display detail row to show the exchange rate for a selected currency on the report.
The example in Figure 9-4 shows the code for euros (EUR) in the TCURX type Column C. The resulting report displays the exchange rate for euros in that column. The example uses the code for euros in the GL type Column D. The resulting report displays amounts in euros in that column.
Figure 9-4: Currency Codes in the Column Layout Window
Note The Currency Display detail row functions differently when DAX Currency Translation is not active. For normal FRx multicurrency reporting, see “Formatting Multicurrency Reports” on page 167.

307FRx Report Designer 6.7 User’s Guide
Chapter 9: Using FRx Currency Translation – Designing Currency Translation Reports
To select the display currency in the column layout
1 From the Report Designer Control Panel, click the Column Layouts icon.A list of available column layouts appears in the Open Column dialog box.
2 Double-click a column layout to display the selected column layout in the Column Layout window.
3 From the Column Layout Currency Translation menu, select Activate DAX Currency Translation.
Note: You must activate currency translation from the Column Layout window menu so that FRx will recognize currency codes in the column layout and row format.
4 To display GL amounts in the converted currency, double-click the cell in the Currency Display detail row of the GL type column and select the currency code from the displayed list.
5 To display currency exchange rates in the report, double-click the cell in the Currency Display detail row of the TCURX type column and select the currency code from the displayed list.
6 On the File menu, click Save to save changes to the current column layout, or click Save As to save the modified column layout with a new name.
Using Currency Rate Subtype ID in Column Layouts For those accounting systems that support more than one exchange rate per currency, FRx uses the Currency Rate Subtype ID row in the Column Layout window to read the appropriate currency rate information from the general ledger.The Currency Rate Subtype ID code can be used in conjunction with a currency display code in GL columns or in columns with transaction code TCURX.If your accounting system supports more than one exchange rate per currency, follow the steps below to include currency rate subtype data in your column layout.
To use a currency rate subtype ID in the column layout
1 From the Report Designer Control Panel, click the Column Layouts icon.A list of available column layouts appears in the Open Column dialog box.
Note Activate DAX Currency Translation from the Column Layout menu before you use currency translation functions in the column layout. You must also activate DAX before you run a report that includes the currency translation function.
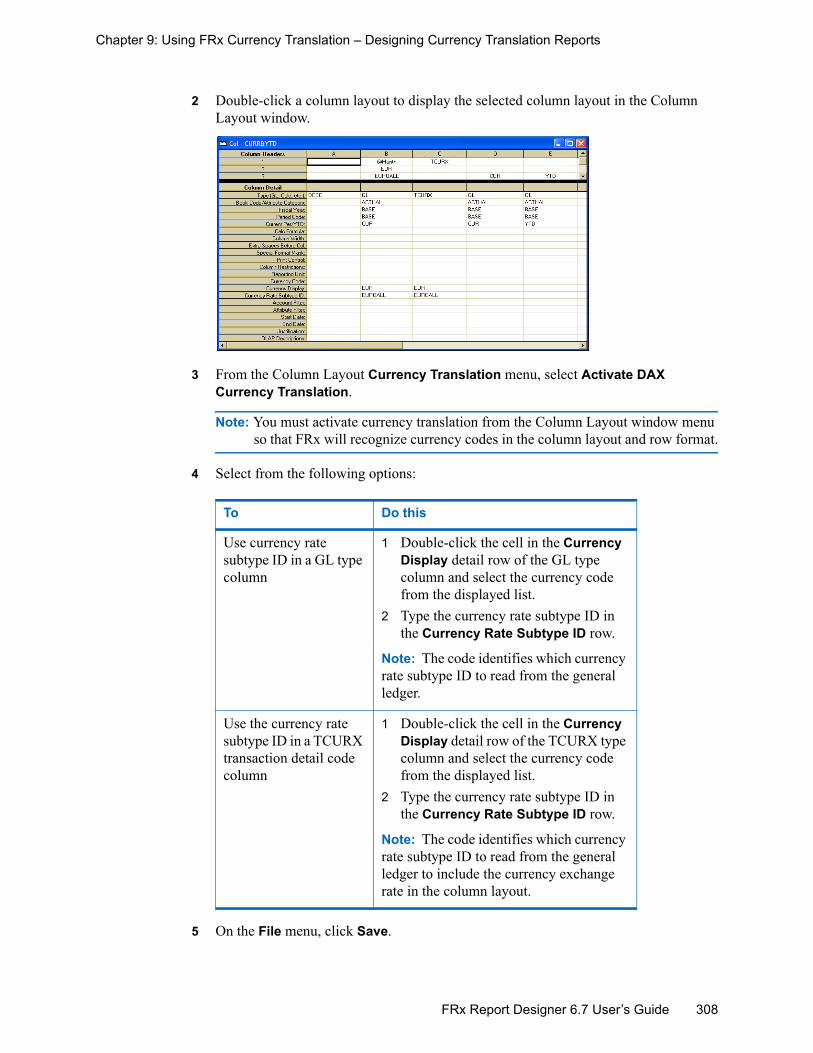
308FRx Report Designer 6.7 User’s Guide
Chapter 9: Using FRx Currency Translation – Designing Currency Translation Reports
2 Double-click a column layout to display the selected column layout in the Column Layout window.
3 From the Column Layout Currency Translation menu, select Activate DAX Currency Translation.
Note: You must activate currency translation from the Column Layout window menu so that FRx will recognize currency codes in the column layout and row format.
4 Select from the following options:
5 On the File menu, click Save.
To Do this
Use currency rate subtype ID in a GL type column
1 Double-click the cell in the Currency Display detail row of the GL type column and select the currency code from the displayed list.
2 Type the currency rate subtype ID in the Currency Rate Subtype ID row.
Note: The code identifies which currency rate subtype ID to read from the general ledger.
Use the currency rate subtype ID in a TCURX transaction detail code column
1 Double-click the cell in the Currency Display detail row of the TCURX type column and select the currency code from the displayed list.
2 Type the currency rate subtype ID in the Currency Rate Subtype ID row.
Note: The code identifies which currency rate subtype ID to read from the general ledger to include the currency exchange rate in the column layout.

309FRx Report Designer 6.7 User’s Guide
Chapter 9: Using FRx Currency Translation – Designing Currency Translation Reports
Setting Currency Options in the Catalog of Reports In the Catalog of Reports window, you select the building blocks for your reports that use the currency translation function. By using row formats and column layouts that include currency translation selections, you can build a report that displays amounts in an international currency, your base reporting currency, or both. Other selections you make from the Catalog of Reports tabs affect the precision of average currency rate calculations. For detailed instructions about working with the Catalog of Reports, see Chapter 7, “Understanding the Catalog of Reports,” in the FRx® Report Designer 6.7 User’s Guide. For a detailed explanation of methods for calculating average rates, see Chapter 3, “Administering Currency Translation,” in the FRx® Report Designer 6.7 Administrator’s Guide.
Show me an exampleFigure 9-5 shows the Currency Translation tab in the Catalog of Reports window.
Figure 9-5: Catalog of Reports Window: Currency Translation Tab
Selecting Rate SourcesIf your FRx license includes the currency translation function, the Report Options tab contains a sub-tab named Currency Translation. From the Currency Translation tab, you tell FRx which spot rate source and historic rate source to use for currency conversion. The source you select depends on your accounting system.There could be two Spot Rate Source options: FRx and OFSI.
If your general ledger stores conversion rates along with amounts, and the FRx interface to the general ledger can read the conversion rate data, select OFSI as the Spot Rate Source. FRx then reads the general ledger conversion rates to calculate currency conversions.
If the general ledger does not store conversion rates or FRx cannot extract conversion rate data, select FRx as the Spot Rate Source to draw the exchange rates from the FRx DAX rate table.
FRx is the only option available for the Historical Rate Source, because both historic conversion rates and base currency amounts are read from the FRx DAX rate table.
Selecting Average Rate Calculation If the row format for your report uses CCAVG row format code, specify one of the following methods for calculating the average rate:
310FRx Report Designer 6.7 User’s Guide
Chapter 9: Using FRx Currency Translation – Designing Currency Translation Reports
To use the number of rates as the denominator for calculating averages, select the Use (Sum of Rates / Number of Rates Entered * Balance) for monthly average calculations check box.
To use the number of days as the denominator for calculating averages, clear the Use (Sum of Rates / Number of Rates Entered * Balance) for monthly average calculations check box.
For a detailed explanation of methods for calculating average rates and the calculation results, see Chapter 3, “Administering Currency Translation,” in the FRx® Report Designer 6.7 Administrator’s Guide.
Suppressing Rounding Adjustments When amounts are rounded to whole dollars, thousands or millions, grand totals may be out of balance. However, currency exchange reports should not use rounding, because currency exchange rates are typically calculated to the fourth or fifth decimal place. Rounding would invalidate those calculations. To turn off the rounding feature, select the option, No Rounding, in the Rounding of Amounts box on the Report Options tab, Formatting sub-tab in the Catalog of Reports window.
To turn off rounding of amounts
1 From the FRx Control Panel, click Catalog of Reports.The Select Catalog for Display dialog box appears.
2 Select a catalog ID from the displayed list and click OK.The Catalog of Reports dialog box appears.
3 Select the Report Options tab.
4 On the Report Options tab, select the Formatting sub-tab.
Note You must activate DAX from the Column Layout menu to accurately convert international currencies to the base currency used in your general ledger. Be sure to activate DAX before you run a report that includes currency translation.

311FRx Report Designer 6.7 User’s Guide
Chapter 9: Using FRx Currency Translation – Designing Currency Translation Reports
5 Select No Rounding in the Rounding of Amounts box.

312FRx Report Designer 6.7 User’s Guide
Chapter 9: Using FRx Currency Translation – Designing Currency Translation Reports

313
Appendix A
FRx Report Designer 6.7 User’s Guide
Frequently Asked Questions (FAQs) . . 314
Error Messages . . . . . . . . . . . . . . . . . . 320
FRx System Information . . . . . . . . . . . 324
Answers to Common UserQuestions
This appendix provides answers and troubleshooting help to frequently asked questions (FAQs) and to system error messages.
We also provide you overall Microsoft® Business Solutions for Analytics–FRx® system information. This information includes advice about installation, permissions, and preventing file corruption.

314FRx Report Designer 6.7 User’s Guide
Appendix A: – Frequently Asked Questions (FAQs)
Frequently Asked Questions (FAQs)
Incomplete Report OutputQ: I created a row format with general ledger codes, but when I print a report using the row
format, no numbers appear on the report. I see only headers and some title rows. What did I do wrong?
A: There are several possible reasons for the absence of numbers on a report. The most likely cause is an incorrect general ledger code. The way that you check this depends on whether or not the report uses a reporting tree.
Report Uses Reporting Tree
If the report uses a reporting tree and you use the natural account code in the row format, clear the Use Reporting Tree box and regenerate the report.
Check the following row format numbering issues.
1 If amounts appear in your report, the problem is with the reporting tree. Does the account code length used in the row format match the number of hooks used in each reporting tree unit?If the account code mask and hooks cannot match with the account code structure, FRx® Report Designer can not return data.Does the tree include detail units, and do the detail units use a complete account mask with hooks (&)?Without detail units and hooks in the account mask, Report Designer cannot connect to the row format and the general ledger. Hooks are necessary for the segments that will be defined by the row format. The other segments can use either numbers or wild cards.
2 If amounts do not appear, check both the row format and the column layout.Are the correct general ledger codes used in the row format?Report Designer must have the correct codes to pull data from the general ledger.Are there hooks in the row format?Use hooks only in the reporting tree. There is no function for hooks in the row format or the column layout.Is there a GL column in the column layout?Report Designer must have a column to place the values from the general ledger.
Report Does Not Use a Reporting Tree
Check the following row format issues and causes.1 Do you have one Link to General Ledger column in the row format?
If you have multiple Link to General Ledger columns, does a year appear in every general ledger link except the current year link?If you do not have a Link to General Ledger column, Report Designer does not have a data connection. You must either use a reporting tree or add a GL column to the row format.
2 Are the correct general ledger codes used in the row format?Report Designer must have the correct codes to pull data from the general ledger.

315FRx Report Designer 6.7 User’s Guide
Appendix A: – Frequently Asked Questions (FAQs)
3 Is the Use Reporting Tree check box selected in the Catalog of Reports?Report Designer may be searching for a reporting tree when one is not needed.
4 Does your company use a different departmental coding structure for income statements than you do for balance sheets?Create different row formats for your balance sheets and income statements. In the balance sheet row format, use the full account code.
5 Is the row format or the column layout restricted to reporting units?Without a reporting tree, Report Designer suppresses the data for the missing reporting units.
6 Is there at least one general ledger column in the column layout?A GL column is required for displaying numbers from the general ledger.
Reports Using Reporting Tree with Overstated NumbersQ: When I generate a report using a reporting tree, certain numbers are dramatically overstated.
What is happening?
A: There are two possibilities.
If some rows use the full account code (as opposed to only the natural account code), the related data may pull into every reporting unit (with an account mask).
Or, if the summary units of the reporting tree use general ledger account masks, this can cause a duplication of data.
Some Rows Use the Full Account Code in the Row Format
If some rows use the full account code (as opposed to only the natural account code), the related data may pull into every reporting unit (with an account mask). You must restrict these rows to a particular reporting unit.
To restrict a row to a reporting unit
1 From the row format, double-click the Related Rates/Rows/Unit cell of the row that uses a full account code.
2 Select a reporting tree and click OK.
3 Select a reporting unit and click OK.
Report Designer restricts this row to the selected reporting unit.
Summary Units in the Reporting Tree have General Ledger Account Masks
If the summary units of the reporting tree use general ledger account masks, this can cause a duplication of data. Use account masks only in detail units. The higher units should not use a mask; these are used for summarization purposes only. However, using account masks in the summary units may be appropriate to represent corporate level expenses going directly into a summary unit.
Whenever you have problems with a report that includes a reporting tree, run the report again without the tree. If the numbers are correct, you know that the problem is in the tree design.

316FRx Report Designer 6.7 User’s Guide
Appendix A: – Frequently Asked Questions (FAQs)
External Worksheet Data Not DisplayingQ: When I link a row format to both the general ledger and an external worksheet, only the
general ledger information pulls into the report. Why doesn’t the data from the worksheet display?
A: The data path, defined in the reporting tree or row format, could be incorrect or the catalog ID may not be pulling the information from the correct resource. Report Designer must have the correct worksheet path to pull data from the external worksheet file. The correct worksheet path depends on whether you have one or two Link columns.
Two Link Columns: Link to Worksheet and Link to General Ledger
If you have two Link columns, Link to Worksheet and Link to General Ledger, you must define the worksheet cells in the row format and the worksheet path in the reporting tree.
To check the worksheet path in the reporting tree
1 In the row format, check each worksheet cell address in the Link to Worksheet column. Compare the address with the external worksheet cell.
2 In the reporting tree, open each reporting unit in the Reporting Units dialog box by selecting View Form from the Tree menu.
3 Check the following:The Wks File Name box must contain the complete path to the worksheet. For example, C:\123\CASHFLOW.XLS or workbook, C:\123\[CASHFLOW.XLS]DENVER, where Denver is the worksheet name. In the Wks Link box, select the worksheet column.You must enter a name in the Row Format Name box.The GL or Row Links box must be empty.
Note: If the same worksheet file (and link) is present in more than one reporting unit, the data imports multiple times, possibly overstating results.
4 In the catalog ID, the Use Row Format from the Reporting Tree box must be selected. This directs Report Designer to use the external worksheet path and row format as defined in the reporting tree for each reporting unit. If you do not select Use Row Format from Reporting Tree, Report Designer can not locate the external worksheet data.
One Link Column: Link to GL + Worksheet
If you have one Link column, Link to GL + Worksheet, you must define both the worksheet path and cells in the row format.
In the row format, compare each worksheet cell address in the Link to Worksheet column with the external worksheet.

317FRx Report Designer 6.7 User’s Guide
Appendix A: – Frequently Asked Questions (FAQs)
Changing Report DescriptionsQ: I want to change the description For the XXX Months Ending xxx in the Catalog of
Reports, but it doesn’t stay changed. How can I change it permanently?
A: The Company menu gives you access to these settings. Use the following steps to changes these settings:
1 On the Catalog of Reports window, select the Company menu and click Information to display the Company Information dialog box.
2 In the Period Description and Plural Description boxes, change the text.
Specific Headings for Specific Column LayoutsQ: I want a specific heading to print whenever I use a specific column layout (for example, a
Three Month Budget Report). How can I set the heading?
A: Use the following steps to create a specific report heading for a column layout:
1 On the Column Layout window, select the Edit menu and click Description to display the Column Layout dialog box.
2 In the Description box, type a new description for the column layout and click OK.
3 Click Save.
4 Open the Catalog ID window, and click the Page Options tab, and then the Headers / Footers tab.
5 Select the header position and select @COL from the Codes box.
6 Click Save.
This places the description from the column layout in the report header.
Balance Sheet: Totalling Rounded NumbersQ: When I select the Whole Dollars rounding option, my balance sheet doesn’t total correctly.
How can I fix this?
A: Any rounding technique will introduce rounding differences into your total making a true balance impossible. You can solve this problem by adding an automatic rounding adjustment to your report.
To automatically adjust rounding:
1 On the Row Format window, select the Edit menu and click Rounding Adjustments to display the Rounding Adjustments dialog box.
2 In the Total Assets row and Total Liabilities & Equity row boxes, type the row codes.
3 In the Rounding Adjustment row box, type the row code (it must contain a general ledger account) that you want to contain the adjustment.

318FRx Report Designer 6.7 User’s Guide
Appendix A: – Frequently Asked Questions (FAQs)
4 In the Adjustment Amount Limit box, type the maximum adjustment amount to allow.
Note: When a rounding adjustment is necessary, Report Designer adjusts the selected row and then totals the report again to reflect the new balances.
Restricting Income Statement Accounts in the Account Detail ReportQ: When I calculate my current earnings for balance sheet purposes, how can I keep all those
income statement accounts from the Year-to-Date Income row out of the account detail report?
A: Open the Row Format window. From the row format, in each row that you want to suppress, double-click the Print Control column, select XD and click OK. This suppresses detail for this row when printing an account detail report. Any rounding technique will introduce rounding differences into your total making a true balance impossible. You can solve this problem by adding an automatic rounding adjustment to your report.
Out of Balance Message when Drilling into Transaction DetailQ: When drilling into transaction detail within the FRx® DrillDown ViewerTM, I receive the
message:
“A balance on the transaction detail report may be incorrect. The column layout used with a transaction detail report must contain a CUR column and a YTD column. This error could also indicate a problem with the transaction details not matching the period balance reports in the general ledger.”
A: Report Designer does not support the use of more than one YTD column in a transaction detail report. Use of more than one YTD column may cause out of balance messages when drilling into the transaction detail of the report. Reports that cross fiscal years at the transaction level are also not supported. While this message may not appear on all reports, this configuration is not guaranteed to produce reliable transaction detail reports and should not be used.
Resolutions
To prevent the out of balance message, use any of the following solutions:
1 Change the column layout to include only one YTD column.
2 Generate the report for Financial and Account detail only.
3 Change the additional YTD columns to CUR columns with a period code of 1 TO 12.
This message may also appear in a report that uses rounding if you did not select the Transaction Rounding option.To resolve the error in this scenario:
1 Verify that none of the solutions mentioned above resolve the error message.
2 Open the catalog for the problematic report.
3 Click the Report Options tab, and then click the Acct/Tran Detail tab.
4 Select the Transaction Rounding check box.
5 Re-generate the report.

319FRx Report Designer 6.7 User’s Guide
Appendix A: – Frequently Asked Questions (FAQs)
Restore a Deleted or Overwritten Row, Column, or TreeTo restore a deleted or overwritten row, column, or tree
1 Have all users close the Report Designer and the FRx® Report Launcher.
2 On the Company menu, click Specification Sets to display the Specification Sets dialog box.
3 Note the location of the Specification Set where the building block is stored.
4 If you have done extensive report design (for example, modifying existing reports or creating new one) since your last backup and need to preserve this work, proceed to step 5. Otherwise, skip to Step 6.
Note: Deciding to restore the file from backup without completing step 5 eliminates any changes or new reports created since the backup. You could have to re-create some changes and reports that occurred after the backup.
5 Rename the file referenced in the path you noted in step 3.
6 Restore the .f32 file from your last backup.
7 Launch the Report Designer.
8 On the Company menu, click Specification Sets to display the Specification Sets dialog box.
9 Click Export to display the Export Selection dialog box.Tabs for Catalogs, Rows, Columns, and Trees are displayed.
10 Select the building blocks you need to restore.
11 Click Export.
12 Note the location of the export (.tdb) file.
13 Close the Report Designer.
14 Delete the restored .f32 file.
15 Return the file name changed in step 5 back to its original name.
16 Launch Report Designer.
17 On the Company menu, click Specification Sets to display the Specification Sets dialog box.
18 Click Import to import the deleted or overwritten building blocks.
19 If a system prompt asks if you would like to overwrite the building block with the same name, click Yes.
Note: Use caution when restoring building blocks from backup. Make sure to select the correct catalogs, rows, columns, and trees.

320FRx Report Designer 6.7 User’s Guide
Appendix A: – Error Messages
Error Messages
Building Block User ErrorQ: I’m receiving the error message “<Building block> is locked by <User>” or “<Building
block> is in use by <User>” when opening a row, column, or tree.
In the error the <Building block> is a row format, column layout, or reporting tree; the <User> is a user name.
A: The possible causes of these errors are:
The building block is currently open by the specified user on another computer.
The building block was open by the specified user when an application crashed, causing Report Designer to close prior to removing the user name from the record.
Resolution
1 Verify that the building block is not open on another computer. If it is, wait for the user to finish, or have the user close the building block.
2 If the building block is not open on any workstation, have all users close Report Designer.
3 On the File menu, click Close All.This action closes all open rows, columns, trees, and catalogs.
4 On the File menu, point to Compact FRx Database, and then click Current Spec Set Database.
5 Do one of the following:If the specification set compacts successfully, open the problematic building block again.If the spec set fails to compact, verify that all users are out of Report Designer, and then try to compact the specification set again.
Disk or Network ErrorQ: I received the error message “Runtime error 3043: Disk or Network Error” when launching
Report Designer, building an index, or generating a report. What caused this message?
A: You can receive this error when launching Report Designer, building an index, or generating a report. The possible causes of this error are:
Invalid work drive path, import/export path, or output path.
Insufficient permissions to a network directory or resource.
A network resource is unavailable.
To resolve this error use the following steps:
If you cannot open the Report Designer
1 Click Start, and then click Run.
2 Type frx.ini and then click OK.

321FRx Report Designer 6.7 User’s Guide
Appendix A: – Error Messages
3 Look for the LastCompany= line.
4 If this line contains a value after the equals sign, remove the text after the = (equals sign) on that line only.
5 Then, save the file and close it.
6 Launch the Report Designer.
7 If the company selection window is displayed before you receive an error, skip to “To locate the necessary paths within Report Designer” on page 321. Otherwise go to step 8.
8 Open the frx.ini file again.
9 Look for the WorkDrive= line, and then make note of the path listed after the = (equals sign).This is the work drive path.
10 Go to “Steps for Resolution” on page 322.
To locate the necessary paths within Report Designer
1 If you are prompted to select a company, click Cancel.
Locate the Work Drive Path
1 On the Admin menu, click Processing Options to display the Processing Options dialog box.
2 Make note of the path listed in the Optional Work Drive box.This is the work drive path.
3 Click Cancel to close the Processing Options window.
Locate the Import/Export Path
1 On the Company menu, click Information to display the Company Information dialog box.
2 Make note of the path listed in the Import/Export Path list box.This is the import/export path.
3 Click Close to close the Company Information dialog box.
Locate the Report Output Path
1 If an error occurs while generating a report, open the catalog for the problematic report.
2 Click the Output tab.
3 If a full path is listed in the File Name box, make note of it because this is the output path.
4 If only a file name is listed, the output path and import/export path are the same.
5 Close the catalog and go to “Steps for Resolution.”

322FRx Report Designer 6.7 User’s Guide
Appendix A: – Error Messages
Steps for Resolution
1 If one or more of the paths obtained in the above steps are located on a network sever, verify that the server is up and running without errors.
2 If one or more of the paths obtained in the above steps are located on a network server, verify that the server is accessible from the computer receiving the error.
3 Verify that the work drive path is valid and correct.
4 If the work drive path is incorrect, update the path.The path can be updated from the Processing Options dialog box or by modifying the frx.ini file. See “To locate the necessary paths within Report Designer” on page 321.
5 Verify that the import/export and output paths are valid and correct. If one or more of these paths are invalid or incorrect, locate and update them accordingly. See “To locate the necessary paths within Report Designer” on page 321.
Repeat the task that previously caused the error.
6 If the error no longer occurs, skip all remaining steps. Otherwise, continue to step 8.
7 Log in to the problematic computer with an account that has administrative rights on the domain.
8 Repeat the task that previously caused the error. If the error no longer occurs, go to step 10. Otherwise, go to step 12.
9 Log out of the machine, then log back in again as the user. If the error still occurs, the user has insufficient permissions for one or more of the noted paths.
10 Check the permissions for each directory, and grant permissions as needed.Users must have Read, Read and Execute, Write, and Modify permissions for the import/export and output paths. Once you have granted permissions, the user should no longer receive errors.
11 If the error persists, you could need to restart the server.
12 Restart the server to correct the problem.
Specification Set Database Security does not Match Current FRxSys32 Security Setting
Q: I received the error message “Spec set database security does not match current FRxSys32 security settings.” What caused this message?
A: This message occurs when setting a company as a default. The possible causes of this error are:
Changes in the security settings stored inside the FRxSys32.mdb file.
Incorrect regional settings.

323FRx Report Designer 6.7 User’s Guide
Appendix A: – Error Messages
Changes in the Security Settings Security settings, along with other FRx configuration settings, are stored in FRxSys32.mdb, a protected database file located in your FRx SysData folder. You cannot modify the FRxSys32.mdb file directly, but configuration and setup selections you make from within the Report Designer are stored in this file, and determine how FRx functions.
If the error message is caused by security settings inside the FRxSys32.mdb file, use the following steps to remove the error.
1 Ask all other users to close Report Designer and Report Launcher.
2 On the Report Designer Admin menu, click Organization to display the Organization Information dialog box.
3 Click the FRx Security button to display the FRx Security Information dialog box.
4 Do one of the following:
5 Click OK to close the Organization Information dialog box.
6 Repeat steps 2-5.The Use FRx Security check box should now be in its original state. You have effectively toggled the security between on/off or off/on.
7 Close Report Designer and launch it again.
8 Then, select the problematic company as the default.The error should now be resolved for you.
Incorrect Regional SettingsIf incorrect regional settings is causing the error message, change the Windows Regional Settings on the problematic workstation. Regional settings should match the settings used on functional workstations.
If Then
The Use FRx Security check box is selected
Clear it.
The Use FRx Security check box is not selected
1 Select it.2 Click OK.

324FRx Report Designer 6.7 User’s Guide
Appendix A: – FRx System Information
FRx System InformationThis section contains information and instructions on:
Client Installation Types
Moving FRx to a New Location or Server
Permissions Required for FRx Users
Maintaining FRx Data Files and Preventing Corruption
Client Installation TypesFRx allows two types of client installation, fat client, also called local client installation, and thin client compact installation, also called network client installation.
Fat Client (or Local Client) InstallationWhen you perform a fat or local client installation, the following occurs:
All FRx program files are installed on the computer’s local drive. Report Designer files are installed into C:\Program Files\FRx Software\FRx 6.7\ by default, but you can install them into any directory that you specify during installation.
System files are installed in the Windows System directory.
FRx data files are typically accessed from a shared network directory.
Reports can be generated to the local drive, or to a shared network drive.
Advantages
This type of installation allows users to operate locally with no network access provided they access a local SysData directory, and not a shared directory. Users find this type of installation is useful for performing demos or designing reports outside of the office.
We do not recommend this type of installation for live environments.
Disadvantages
The disadvantages to this type of installation include:
Increased IT maintenance and effort.
Easier to make mistakes during installation (for example, users can end up looking at different or incorrect SysData directories).
Manual installation of service packs on each computer. This installation effort can be time consuming if you have environments with many users.
Requires the most hard disk space.
Thin Client (or Compact Installation or Network Client) InstallationWhen you perform this type of installation, you get the following results:

325FRx Report Designer 6.7 User’s Guide
Appendix A: – FRx System Information
All Report Designer program files are installed in a shared network directory. Users launch most FRx applications from the shared server. During installation, shortcuts to executables on the network are created.
System files are installed in the Windows System directory.
FRx data files are accessed from a shared network directory.
Reports can be generated to the local drive, or to a shared network directory.
Advantages
The advantages to this type of installation are:
Easy maintenance. After the initial client install, you do not need to do anything else on client machines.
One-time installation of service packsThe service packs are applied against the FRx program files in the shared network directory.
Requires a small amount of hard disk space, enough for system files.
Easy installation
In FRx 6.7, users can install the client on their computer using a Client Deployment executable. The Client Deployment executable setup is created using options specified during the first installation. When users install, they install from a shared network directory and no CD is required. Users are not prompted for any install options, they simply click Finish at the end of the installation.
All users are accessing one file server to use FRx.
Troubleshooting and fixing FRx issues is usually a one-time operation, so you do not need to troubleshoot multiple computers.
Disadvantages
This type of installation makes it easier for one user to bring all users down. For example, if one user deletes a file, this action affects all users.
Moving FRx to a New Location or New ServerSometimes you need to move FRx to a new server or a different location on a network. When you perform this move, you must modify paths within Report Designer to allow use of the existing data files and to allow client workstations to continue to use FRx.
To set up a fat client
In a fat client environment, FRx does not need to be re-installed on client machines.
1 Have all users close all FRx applications.
2 Create the new SysData directory in its new location.
Warning: Be sure to leave the existing Sysdata directory intact!

326FRx Report Designer 6.7 User’s Guide
Appendix A: – FRx System Information
3 Copy all files from the existing SysData directory to the new SysData directory.
4 Launch Report Designer on one user computer or workstation.
5 From within Report Designer, on the Admin menu, select Organization.
6 Click the SYSDATA button to display the Change SYSDATA Directory dialog box.
7 In the New Directory box, enter the new Sysdata path.
8 Do one of the following:
9 Click OK.A message displays informing you that Report Designer will exit after the change is made.
10 Click OK again.
11 Launch the Report Designer.
12 If you do not need to change the Import/Export paths for companies, skip to step 17. Otherwise, on the Company menu, click Information to display the Company Information dialog box.
13 Select the first company.
14 Type or select the new Import/Export path, and then click Save.
15 Repeat step 14 for all remaining companies.
To Do
Change the SysData directory for each user to the new location.
As each user launchers the Report Designer, FRx detects this option and changes the SysData directory for the user to the new location. This option places a MOVETO entry in the Sytem.cfg file located in the existing SysData directory.
Click Automatically Update All Users.
Change the SysData directory for only the current user.
Select this option if you plan to change the directory for each user manually. You could do this if you want to remove the existing SysData directory immediately after completing these steps.
Click Update Current User Only.

327FRx Report Designer 6.7 User’s Guide
Appendix A: – FRx System Information
16 Click Close to close the Company Information dialog box.
17 On the Company menu, click Specification Sets to display the Specification Sets dialog box.
18 Select the first specification set.
19 In the Location box, enter the new location.
Warning: Leave the file name intact.
20 Click Save.
21 If a message displays saying that the spec set exists in the new location, and asking you if want to overwrite, click No.
22 Repeat steps 18-20 for each remaining spec set.
23 If you selected the Update Current User Only option in step 8, repeat steps 4-10 for all remaining computers or workstations.
To set up a thin client
1 Have all users close all FRx applications.
2 Install FRx to the new network location, and apply the latest service pack immediately after installation.
3 Using Microsoft Windows Explorer, browse to the new SysData directory.
4 Move all the files from the NEW SysData directory into a backup directory.
5 Copy all the files from the old SysData directory into the new SysData directory.
Warning: Leave the old FRx install and SysData directory intact!
6 From one user workstation, browse to the new FRx directory.
7 Double-click on the FRxReg.exe file to register all DLL files found in the FRx directory.
8 Launch the Report Designer on the user workstation.
9 If the Import/Export paths for companies do not need to be changed, skip to step 13. Otherwise, on the Company menu, select Information to display the Company Information dialog box.
10 Select the first company.
11 Type or select the new Import/Export path, and then click Save.
12 Repeat step 11 for all remaining companies.
13 Click Close to close the Company Information dialog box.
14 On the Company menu, click Specification Sets to display the Specification Sets dialog box.
15 Select the first specification set.

328FRx Report Designer 6.7 User’s Guide
Appendix A: – FRx System Information
16 In the Location box, enter the new location.
Warning: Leave the filename intact.
17 Click Save.
18 If a message displays saying that the spec set exists in the new location, and asking you if want to overwrite, click No.
19 Repeat steps 16-18 for each remaining spec set.
20 Repeat steps 6-8 for each remaining user workstation.
Permissions Required for FRx UsersCertain user permissions are required for each FRx module.
Report Designer UsersThe following user permissions are required:
All users require Read, Read & Execute, Write, and Modify permissions for the FRx program directory, IO_Data directory, and Sysdata directory.
If you use directories other the IO_Data directory for report output, users must also have Read, Read and Execute, Write, and Modify permissions for these additional directories. If users are restricted to specific companies, you can grant them permissions for only the company directories they use.
If you are using the FRx® Report Server, users must also have Read, Read & Execute, Write, and Modify permissions for the Queue directory. This is typically the same as the SysData directory.
If your company is using the FRx® WebPort, users publishing reports must have Read, Read & Execute, Write, and Modify permissions for the WebPort Data directory on the Web server.
Report Launcher UsersThe following user permissions are required:
All users require Read, Read & Execute, Write, and Modify permissions for the FRx program directory, IO_Data directory, and Sysdata directory.
If you use directories other than the IO_Data directory for report output, users must have Read, Read and Execute, Write, and Modify permissions for these additional directories. If users are restricted to specific companies, you can grant them permissions for only the company directories they use.
DrillDown Viewer UsersLocal DrillDown Viewer users require Read and Read & Execute permissions for the FRx program directory and IO_Data directory.

329FRx Report Designer 6.7 User’s Guide
Appendix A: – FRx System Information
If you use directories other than the IO_Data directory for report output, users must also have Read and Read & Execute permissions for these additional directories. If users are restricted to specific companies, you can grant them permissions only for the company directories they use.
To use the subtotaling functionality in the DrillDown Viewer, Read and Read & Execute permissions are also required for the SysData directory.
Remote DrillDown Viewer users (those that use the DrillDown Viewer only on their workstation) do not require any permissions for FRx directories on the network.
Report Server The Report Server must run under a logged-on profile on a server; it cannot run as a service. The user that launches the Report Server must have Read, Read & Execute, Write, and Modify permissions for the IO_Data and SysData directories.
If you use directories other than the IO_Data directory for report output, the logged-on user must have Read, Read & Execute, Write, and Modify permissions for these additional directories.
If you use a separate Queue directory (the Queue directory and the SysData directories are typically the same), the user must have Read, Read & Execute, Write, and Modify permissions for the Queue directory.
If the Report Server publishes reports to the WebPort, the user must have Read, Read & Execute, Write, and Modify permissions for the WebPort Data directory on the Web server.
WebPort UsersBecause the WebPort is a Web application, users do not require any permissions for any directory. However, the Internet Guest Account for Internet Information Services (usually IUSR_COMPUTERNAME) and the Launch IIS Process Account (usually IWAM_COMPUTERNAME) must have Read, Read & Execute, Write, and Modify permissions for the WebPort Data directory and all subdirectories.
Web Administrator UsersUsers require Read, Read & Execute, Write, and Modify permissions for the WebPort Data directory on the Web server, as well as Read and Read & Execute permissions for the SysData directory.
In most cases, users also require Read and Read & Execute permissions for the IO_Data directory to publish previously-generated reports.
If you use directories other than the IO_Data directory for report output, users must have Read and Read & Execute permissions for these additional directories. If users are restricted to specific companies, you can grant them permissions only for the company directories they use.
Maintaining FRx Data Files and Preventing CorruptionTo prevent corruption in FRx data files, we recommend:
Running and keeping regular backups.

330FRx Report Designer 6.7 User’s Guide
Appendix A: – FRx System Information
Frequently compacting the FRx System and Specification Set Databases.
Always saving the Report Catalog after making changes and before generation.
Excluding the FRx SysData directory from network virus scans.
Running and Keeping Regular BackupsThis is the most important procedure you can follow for software applications such as FRx that store data. You should run backups nightly if FRx is used daily. Otherwise, you should run backups at least once a week. We recommend frequent backups of the entire FRx SysData directory.
If you do not frequently perform data backups, you can lose reports and other valuable FRx data. Although our FRx Support group can attempt to repair a corrupted file, we cannot guarantee successful file repairs.
Compacting the FRx System and Specification Set DatabasesThe FRx system database contains companies, registration information, FRx security information, users, font styles, and other FRx operation information. Specification sets contain report components such as row formats, column layouts, reporting trees, and catalogs.
When you compact the system or specification set databases, Report Designer creates a new file with the same structure and removes user-deleted records and other unnecessary information. The remaining information is moved into a new file. When you compact these files on a regular basis, these files remain small in size. These compacted files help reduce errors and lost data.
Depending on how frequently you use FRx, you should compact these databases weekly or bi-weekly.
To compact the system or specification set databases
1 Ensure all users exit Report Designer.
Note: The user compacting the databases must have exclusive access to the FRx files.
2 On the Company menu, click Select Default to display the Select Default Company dialog box.
3 Select the appropriate company and click OK.
4 On the File menu, point to Compact FRx Database, and then click FRx System Database.
5 Click OK to compact the database.
Tip: If all other users have exited Report Designer, the database should successfully compact.
You are now ready to switch to a non-demo company.
6 Return to the Company menu, click Select Default to display the Select Default Company dialog box.
7 Select the company and click OK.

331FRx Report Designer 6.7 User’s Guide
Appendix A: – FRx System Information
8 On the File menu, point to Compact FRx Database, and then click Current Spec Set Database.
9 If you are using more than one specification set, repeat steps 6-8 for each company that uses a different specification set.
Warning: If all other users are out of Report Designer, and you receive errors when compacting, contact your FRx software support provider.
Saving the Report Catalog after Making Changes and Before Generation
When you make changes to a catalog, save the catalog before you generate a report. If you do not save your changes, Report Designer must create a new record to store these changes before passing the report to the FRx reporting engine. These records accumulate over time and result in larger data files. These files are more susceptible to corruption and damage.
Excluding the FRx SysData Directory from Network Virus Scans FRx stores reports and other information in Microsoft JET database files. Virus scan programs can corrupt these database files.

Appendix A:
332 FRx Report Designer 6.7 User’s Guide

333FRx Report Designer 6.7 User’s Guide
Glossary
account codeThe unique identifier for a record that holds the balance relating to any single asset, liability, owner's equity, revenue, or expense of the business.
account filterA general ledger account mask used in the column layout to restrict a column to specific general ledger accounts.
account maskSee mask.
account modifierAn operator used to offset the period or year for a specific row, and also referred to as a row modifier.
accounting periodA period of time, such as a month, quarter, or year, for which financial statements that measure flow, such as an income statement, are prepared. At the end of each accounting period, all GL accounts must balance. Accounting periods are defined in the general ledger.
account setsA group of accounts assigned a name (for example, the range of accounts from 5100 to 5600 entitled Travel and Entertainment). Account sets are created in row formats.
alphanumericA term for either alphabetic or numeric characters, usually used in reference to a code, such as a report name, row code or description.
applicationA computer software program designed for a specific purpose. FRx is considered an application.
apply dateThe date that determines to which GL accounting period a transaction posts. See also document date, entry date.
attribute filerAdditional pieces of information (financial and non-financial) that exist in the GL database. FRx supports two types of attributes: account based and transaction based.
average rateThe average of all currency exchange rates over the period of the financial statement.This is nearly always used for income statement accounts. The period between measurements to determine the average (daily, weekly, monthly, and quarterly) can vary by type of report. For example, internal management reports will typically use daily intervals, but some statutory reporting may require the average of the starting and ending rates during the period.
backgroundDescribes a window that is open but which is not the active window in which you are working.
base currencyThe foundation currency in which all other currencies are stated. For U.S. based companies, this will normally be the US dollar, but European companies will probably use the EURO.

334
Glossary
FRx Report Designer 6.7 User’s Guide
base periodA code used in column layouts to represent an accounting period that is relative to an actual period that is defined when a report is generated. For example, if the column layout specifies BASE in the Period Code box, then the actual period is defined in the Catalog of Reports at the time the report is generated.
batchA logical group of transactions assigned the same apply date and posted as a unit.
beginning balancesThe opening balances for a period or a year.
boxA control into which you type or select information.
catalog IDA unique code that identifies a report in the catalog of reports. The catalog ID can be up to 16 characters. The following characters are not allowed: - ‘ “ |
Catalog of ReportsThe FRx component in which row formats, column layouts and reporting trees are combined to create a financial report. Report elements such as headers, footers, presentation of amounts, output formats and so forth are defined in the Catalog of Reports.
CBRChange Base Row. The format code CBR tells FRx what row you want to use as the base row for any percent calculations. This base row remains in effect until another CBR format code is used within the same row format.
chain reportsA process that allows you to run several reports together. When you chain reports, they run one after another.
check boxA control that allows you to select an option. A check box that is selected indicates the option is active. A check box that is not selected indicates the option is not active. A group of check boxes is not mutually exclusive, meaning you can check more than one. See also radio button.
child unitA unit in an FRx reporting tree that is a subsidiary to a higher level unit called a parent. FRx can roll up data from child units to parent units to create summary reports.
codeA unique name or identifier that is defined by the user and attached to a record of information for use in database management. A code is often a record key.
column layoutOne of the three FRx building blocks. Column layouts contain headings for report columns as well as codes to define the type of information in a column: reporting periods, calculations, and so forth. See also row format, reporting tree.
company codeA unique identifier for a record that defines company information needed for processing financial reports.
controlA term for any user interface component that allows you to select choices or type information; for example, an entry box, a check box, or a radio button.
conversion currencyA currency whose value is to be converted into the base currency, using the monetary exchange rate for a given date.
CPOColumn Period Offset. A switch used in row formats when linking to external worksheets. If the worksheet to which you are linking has multiple columns or rows that represent different periods (such as a worksheet with a 12 month detailed

335
Glossary
FRx Report Designer 6.7 User’s Guide
forecast), the /CPO (Column Period Offset) switch tells FRx to match the accounting periods in the column layout with the appropriate columns in the worksheet. You can use this technique with either combined or separate worksheet links.
daily rateThe current (spot) currency exchange rate. For reporting purposes, a different current rate should be available for each balance sheet date.
databaseA collection of like sets of information, stored in tables. For example, sets of accounting ledgers. You might think of a database as similar to a filing cabinet that holds all the information for a company.
database management systemAn application program that supports the definition, manipulation, and control of a database.
date maskA format that standardizes how dates appear in the module. Date masks often vary from country to country.
defaultInformation that the system automatically enters in a box. For boxes that can be edited, the system enters the most common information. For boxes that cannot be edited, the system enters required information.
default companyThe company currently selected for processing. The company code displays in the status bar. You can change companies from the Company menu.
default printerThe printer chosen through the Printer Setup dialog box as the default. When no other printer is specified, the system sends print jobs to the default printer.
detail levelA selection in the Catalog of Reports that refers to the level of detail in a report. The choices are financial report (typically a high level summary based on the row format), account detail report (displays the account detail balances that make up the financial report), and transaction detail report (provides the most detail—down to the transaction level).
detail unitA reporting unit that draws information directly from the general ledger. See also child unit, reporting unit, summary unit.
dialog boxA type of window, fixed in size, that requests further information from you to continue processing. You must provide the information or respond to the query before the system continues processing.
direction keysThe Up Arrow (Up), Down Arrow (Down), Right Arrow (Right), and Left Arrow (Left) keys, used to move the insertion point or focus or choose from a list of options.
disabledDescribes a control or command that is unavailable for use. The controls and commands appear shaded, rather than solid, when disabled. The system disables commands and controls when they are illogical to use.
document control menuA menu that is standard on all document windows, including forms, dialog and message boxes, that lists commands you perform on the document windows, such as maximize, minimize, size, and move. Not all commands are available in all types of document windows.
document control menu boxThe leftmost symbol in the title bar of a document window (form, dialog or message box). When you click this box or press Alt+hyphen, the Document Control menu opens.

336
Glossary
FRx Report Designer 6.7 User’s Guide
document dateThe date you assign to a transaction document, such as an invoice. Often, the document date is assigned the date you enter the document. See also apply date, entry date.
DrillDown ViewerFRx® DrillDown ViewerTM allows you to view, print, export, save, and send reports created in FRx® Report Designer.
drop-down list boxA type of control where you can view a list of choices by dropping down a list box.
A downward pointing arrow on the right side of the box indicates a list box is available.
dynamic data exchange (DDE)A process that supports the linking of information between applications (for example, a direct link between a spreadsheet cell and a program box).
dynamic headingsHeadings in the column layout that are set up to change based on specific data you specify when a report is generated, such as period or fiscal year.
edit modeA state in which the system accepts typing, both for entering text and editing, in a box. A box is in edit mode when the insertion point is present.
effective datesThe date or period number at which a specific row format, column layout, or reporting tree is used. These dates and periods are set in the Catalog of Reports.
enabledDescribes a command or control that is available to use. The command or control appears in solid text (rather than shaded) when enabled.
Enhanced XMLA custom Extensible Markup Language (XML) file format that preserves the drill down capability for FRx reports stored in a Web repository. Enhanced XML format is readable only with the FRx DrillDown Viewer.
Enterprise ServerThe FRx Enterprise Server is an enhanced FRx Report Server with up to four CPUs and reporting engines to process up to four reports simultaneously.
entry dateThe date on which a record is entered. The entry date defaults to the system date and cannot be edited. See also apply date, document date.
extranetA type of intranet that is partially accessible to authorized outsiders. Whereas an intranet resides behind a firewall and is accessible only to people who are members of the same company or organization, an extranet provides various levels of accessibility to outsiders. You can access an extranet only if you have a valid user ID and password, and your identity determines which parts of the extranet you can view.
fieldA column of a database table or a cell of a spreadsheet in where data is entered or stored.
focusThe visual cue of a selected box or control. The focus takes many forms, such as a solid outline box around an entry box, or the dotted outline box around the label of a pushbutton, check box, or radio button.
formA secondary window displayed in the client area of the application window which emulates a written document or data entry form. You enter and review most information through module-specific forms.
format codeFormat codes control the appearance of a row. Every row is interpreted as a general ledger detail row unless a code is present in the Fmt Code column of the row format. Double-click the Fmt Code column to display the list of available codes.

337
Glossary
FRx Report Designer 6.7 User’s Guide
format maskA group of codes used in row formats, calculations, and so forth that defines how monetary amounts are shown on reports. The mask controls the symbols and placement of decimals and thousands separators, as well as the presence or absence of currency symbols and leading/trailing zeros. See also numeric mask characters.
full account codeAn account code defined in the general ledger. The fully qualified account includes the natural segment, combined with the sub-segments such as departments, locations and divisions.
functional currencyThe primary currency in which a company typically transacts business, also known as home currency or base currency. See base currency.
general ledgerA ledger of accounts that are reported in the financial statements.
Posting transactions updates the accounts in the general ledger.
general ledger index (G32)The general ledger index, or G32, is a file extension for index files created and maintained by FRx. There is one G32 file maintained per FRx company and it is located in the FRx SYSDATA directory. This file contains basic information about a company, such as the account mask, account segmentation, and calendar setup. It also may contain the chart of accounts and unposted transactions depending on the accounting system and company setup.
graphical user interface (GUI)A computer application screen interface that uses icons and pictures to represent objects or selection choices.
historic rateThe currency exchange rate that was current when the activity in an account (such as the purchase of an asset) actually took place. This is typically applied to non-monetary assets (for example, inventory, fixed assets, long-term liabilities, and equity).
hook character (&)The hook character (&) is used in the account mask box in the reporting tree to define the report’s connection to the row format. Hooks are usually used in the natural account segment, but they are not limited to that segment.
iconA pictorial representation of an object or a selection choice. Icons can represent minimized forms or application windows, or resident applications not currently active on the desktop.
insertion pointThe vertical blinking bar that notes where text is going to be inserted.
instance documentInstance documents contain data. An XBRL instance document contains accounting, financial, or other business related data (for example, a financial statement issued by a company), expressed using XBRL syntax, and making use of the XBRL taxonomy. The financial statements of a company or any part thereof, expressed in XBRL, would be an instance document as would an HTML file that had various XBRL items embedded in it.
interfaceThe common program boundary between two modules or applications that allows data entered in one to be used by the other. Interfaces eliminate the need for duplicate data entry among modules.
linkAn FRx feature that connects a row format to the general ledger, an external worksheet, another row format, or a specific fiscal year.
list boxA control that contains a list from which you can select available choices. Some list boxes are fixed in size on the form; others scroll to provide for variable length lists; still others drop down from a downward pointing arrow button appended to the right of a box.

338
Glossary
FRx Report Designer 6.7 User’s Guide
lookup boxA box from which you can open a zoom window to view and select possible values for the box.
maskA format that keeps codes or numbers uniform. The mask can require a certain type of character, such as a number or a letter, and it can require a certain number of characters or digits. Account masks are used in the general ledger to keep the format of all account numbers uniform. See also date mask and numeric mask characters.
menu barThe main menu of the application; also called the action bar in some graphical user interface environments.
menu commandA menu selection that immediately performs an action such as sending output to a printer, opening a form, or calling up a dialog box so that you can specify additional information. Menu commands that open dialog boxes have ellipses following the command name.
modifierSee account modifier.
moduleA subset of a software application, such as accounts receivable, general ledger, and inventory.
Multiple Document Interface (MDI)An interface style in which users can work in numerous windows at the same time, or numerous instances of the same window at the same time.
natural segmentA typical general ledger account code contains at least one account code segment that describes the type of account (for example, cash or sales). This segment of the general ledger code is referred to as the natural account code segment in the FRx system.
numeric mask charactersMask characters define the masks FRx uses for amounts.
0 A zero mask character inserts a zero (0) into the amount if the digit is not used. See the following example:
Mask 000.00Amount $010.53
# A pound sign mask character does not insert a zero (0) into the amount if the digit is not used. See the following example:
Mask ##0.00Amount $10.53
OLAPOn-Line Analytical Processing. A system for presenting summarized financial data in a business model format that facilitates online business analysis. Financial data is presented in a multidimensional structure called a cube.
OLAP cubeA three-dimensional data model composed of cells that represent the intersection of a report row, a report column, and a reporting unit. OLAP cubes derived from FRx reports are restricted to financial level information, and do not contain account or transactional details.
OLEObject Linking and Embedding. A Windows feature that allows FRx to link directly to a Microsoft Excel 2000 or later spreadsheet.
originating currencyThe currency of a transaction (such as an invoice) which may be different from the functional currency.
parent unitA unit in an FRx reporting tree that has subsidiary, or child, units. FRx can roll up data from child units to parent units to create summary reports.

339
Glossary
FRx Report Designer 6.7 User’s Guide
period modifierTypically, when an account is specified in a row format, FRx combines the account with the periods and account types specified in the column layout. However, you can use the account modifier codes in the row format to use different information (such as different fiscal periods) for specific rows. The modifiers apply to every account in the row.
postingThe act of transferring financial transactions entered in journals and subledgers to the general ledger in order to update account balances.
Posting updates accounts tracked in the general ledger module with financial data entered in other modules, such as inventory and accounts payable, as well as general ledger.
print controlAn option in the column layout that enables users to indicate special printing characteristics such as non-printing and reversed credit and debit signs when reports are generated.
provisional reportingThe provisional reporting options in the Catalog of Reports determine whether FRx includes posted, unposted, or both posted and unposted general ledger transactions in the report. Posted transactions include activity from every module (accounts receivable, accounts payable, etc.) in which a general ledger update has been run.
radio buttonA control that allows you to select one option among multiple options. A radio button that is selected indicates the option is active. A radio button that is not selected indicates the option is inactive. Unlike a group of check boxes, a group of radio buttons represents a mutually exclusive choice—selecting one of the buttons disables the others.
recordA database term for a collection of logically related fields; that is, one set of information. You might think of a record as a paper form that contains information about one subject, such as a customer or a purchase order.
report bookA comprehensive book containing FRx reports and other documents that can be published for viewing in DrillDown Viewer, WebPort, and a Windows directory, and in e-mail.
report building blocksFRx uses three basic building blocks for a report: a row format, a column layout, and a reporting tree.
Report DesignerReport Designer extracts information from your general ledger and optionally combines it with information from Lotus 1-2-3 or Microsoft® Excel spreadsheets. Then, it uses your customized report formats and your customized management reporting hierarchy to produce reports.
Report LauncherFRx® Report Launcher allows you to generate reports previously saved in the Report Designer Catalog of Reports.
Report ManagerFRx® Report Manager is an optional module that pulls together FRx reports and other files such as Microsoft Office documents for easy viewing, printing, and distribution.
Report ServerThe FRx® Report Server is a separate FRx product that runs on a server platform dedicated to report generation and report scheduling. With the Report Server installed and configured on the network, FRx users can continue working at their workstations while the reports generate on the Report Server.
reporting currencyA currency used for financial reporting purposes. This could be the functional currency or is typically the currency of the parent company.
reporting treeOne of the three FRx building blocks. Reporting trees are visual representations of an organization’s structure, showing levels in the corporate hierarchy such as companies, divisions, departments, projects and tasks. See also column layout, row format.
340
Glossary
FRx Report Designer 6.7 User’s Guide
reporting unitA level within an FRx reporting tree that represents either an individual department that draws data directly from the general ledger or a summary unit. A company can create multiple reporting trees to facilitate different financial reports without affecting the general ledger. See also detail unit, summary unit.
responsibility segmentThe segment or segments of the general ledger account code that refer to the overall structure of an organization. Examples are departments, divisions, projects, tasks, and so forth.
row codeA code, either a word or a number, which identifies a row in the first column of a row format.
row formatOne of the three FRx building blocks. Row formats contain links to the general ledger and/or external worksheets and other row formats. They also contain report row descriptions and calculations. See also column layout, reporting tree.
row modifierSee account modifier.
row period offsetA switch used in row formats when linking to external worksheets. Use the /RPO switch if the worksheet to which you are linking has multiple rows that represent different periods. When this code is used, FRx matches the accounting periods in the column layout with the appropriate rows in the worksheet. You can use this technique with either combined or separate worksheet links.
scroll barA window component that informs users that more of the window can be viewed. You manipulate the scroll bar to view more of the window contents.
segment codeA section of an account code that represents a type of entity for which you are accounting. For example, you may have segmented your account codes into natural accounts, divisions and departments. In this example, you would define a segment code for each natural account, division, and department.
selectTo choose an option or choice. Selecting is most often accomplished either by clicking on the option, or highlighting the option and pressing the spacebar.
shortcut keysA keystroke (for example, F3) or keystroke combination (Alt+H) that provides a quick method for issuing a command, without opening a menu.
specification setA database that stores row formats, column layouts, reporting trees, and catalog IDs. Each FRx company can have its own specification set or several FRx companies can share the same specification set.
spot rateThe current (daily) currency exchange rate. For reporting purposes, a different current rate should be available for each balance sheet date.
summary unitA reporting unit that summarizes data from lower-level units. The lower-level units can be either detail units or other summary units. See also reporting unit, detail unit.
suiteAny report or group of reports that are defined using a reporting tree. The suite can encompass from one to the total number of reporting units in the tree.
SYSDATAThe SYSDATA button on the Organization Information dialog box, accessed from the Admin menu, defines the path and directory where you store FRx system files.

341
Glossary
FRx Report Designer 6.7 User’s Guide
tableA database term for the structure that holds a collection of related records. Tables consist of columns and rows of information.
taxonomyThe XBRL taxonomy is a classification system for business and financial reporting data elements. XBRL taxonomies can be regarded as extensions of XML Schema.
toggleAn option that can be turned on or off. For example, the Status Bar command on the Options menu can be checked on or off.
transactionIn general, a business event which can be measured in currency and can be entered in the accounting records.
triangulation currencyA currency whose exchange rates are maintained in FRx for both the base currency and the conversion currency. If an exchange rate table is not maintained between two currencies, but a third, common currency is available with exchange rates for both currencies, the first currency can be converted into the common (triangulation) currency, and then the common currency can be converted into the second currency.
treeSee reporting tree.
WebPortThe FRx® WebPort product lets users publish FRx reports in Web repository environment that supports both FRx reports and non-FRx objects such as Word documents, Excel spreadsheets, or OLAP cube files. This product makes files viewable with your internet or intranet.
wildcard character (?) A special character that stands for any one or more possible characters; a placeholder. For example, the ? is a wildcard in account mask boxes.
XBRLExtensible Business Reporting Language (XBRL) is an open specification that uses XML-based data tags to describe financial statements for both public and private companies.
XBRL taxonomy documentAn XML Schema file that describes a set of concepts that are used in preparing an XBRL instance document. A taxonomy document can be either an XBRL taxonomy (e.g. US GAAP CI), or a custom taxonomy created in conformance with XBRL specifications. Custom taxonomies are used to extend the XBRL taxonomies to address company and/or industry specific items not addressed in the XBRL taxonomies.
XMLeXtensible Markup Language. XML provides a generalized markup scheme for representing the logical structure of documents in a system-independent and platform-independent manner. XML files can be published on the World Wide Web or a server-based Web repository and can be displayed in a Web browser.

342
Glossary
FRx Report Designer 6.7 User’s Guide

343FRx Report Designer 6.7 User’s Guide
Symbols% Allocation to Parent box 207& character
reporting trees 201using hooks 185
+ character in reporting trees 201,/A code 101/ functions
/CPO 127account modifiers 103
? characterreporting trees 201using wildcards 169
@ character@UNIT code 71@UNITT# code 72, 283using 87
Aaccount code
including in report 149mask
building a row format 95defining in tree 183
natural segmentdefining 94using in reporting tree 215
using full account 95using in FRx 9
account detail, suppressing 82account filters, using 169account mask
defining 183Account Mask box 68account modifiers
entering 104linking to worksheets 127, 128
Account Only option 50, 232Account Range End box 27, 69Account Range Start box 27, 69account range, entering in row format 97account sets
creating 101editing 103
Account Type option 100account types, using 100Accounting System box 23Acct Column type 149Acct/Trans Detail tab 236, 267Add Reporting Units from Chart of Accounts dialogbox 197, 198Add Reporting Units from Chart of Accts command192Add Rows From Chart of Accounts dialog box 68adding the OLAP description to the column layout173additional text
entering in reporting trees 216in report headers and footers 283in the row format 72
Additional Text code 283in row format 72
Address box 255Adjustment Amount Limit box 113Advanced tab 236, 270Allow Column Text Overflow box 262Allow Rollup 1% box 207, 270Amount & Date Format box 23Amount with Currency Symbol box 262ASCII, exporting reports 246asdfasdf 314asdfasdfas 314asdfasdfasdf 314asdfsadf 314asdfsdf 314
Index

Index
344 FRx Report Designer 6.7 User’s Guide
asfdasdf 314
Bbase period
concept 10entering column layout 152
Base Period boxabout 233, 235entering 276
base row, changing or using in calculations 156base year
entering column layout 151Base Year box 51
entering 276Before Each Reporting Unit option 270Book Code Description box 173Book Codes
restricting rows 106budget data, including in column layout 151Building Blocks tab 236
CCAL Format Code 74Calc Formula box 156Calculate Columns First option 272Calculate Rows First option 272calculations
applying to specific columns 87column layout
CALC 149IF/THEN/ELSE statements 157
multiplying and dividing 155row format
CAL 86IF/THEN/ELSE statements 90point and click functionality 92TOT and CAL 86
using operators 87Catalog ID
chaining 280cloning 282creating 49
Catalog ID box 49, 275Catalog of Reports
Catalog menu 226Edit menu 226File menu 225
Window menu 227Catalog of Reports icon 7CBR format code 74CCAVG currency code 304CCHIST currency code 304CCSPOT currency code 304CCX currency code 304Chain to Catalog ID box 251, 280chart of accounts, building row format 67Choose a Reporting Tree dialog box 241Choose a Row Format dialog box 134, 238Clear box
headers/footers 261Clear command 16, 191Clone button, record control box 18, 282Codes box 258Collapse Branch command 189column
defining placement 83defining width 64editing 143entering details 147entering headers 145headings
codes, mixing with text 146formatting 145
matching placement with worksheet (/CPO)127
restricting to specific dates 171using in calculations 155
Column Layout box 52Column Layout command 226column layouts
creating 43menus
File 140opening 138pulling data 151
Column Period Offset option 127Column Restriction code 176Column Width command 193Column Width dialog box 64Combine button 214Combine Posted and Unposted Amounts option 267comma method, column placement 126company
entering 22Company box 50, 208Company Information dialog box 22

Index
345FRx Report Designer 6.7 User’s Guide
Company Name box 23configuring FRx 11Copy command 15, 191credits
restricting column to credit 164using the normal balance 82
Currency Code cell 168currency codes, assigning in row format 111currency conversion
historical rate source 274spot rate souce 274
currency rate source 309Currency Rate Subtype ID in column layout 307Currency Symbol on 1st Row option 262Currency Translation tab 303, 309currency translation, purpose 300currency translation, reports 303currency, defining in the row format 111Current Per/YTD cell 174Current/YTD period 154Cut command 15, 191
Ddate
including in column header 144restricting a column 171
Date Period cell 239, 240, 242date, setting the report 276DAX (Dynamic Automatic Currency Translation)300debit amount
including the normal balance 82restricting a column 164
debit/credit reports, creating 175Default Base Period box 233, 234default base period codes 234Default Font Style box 258Delete button, record control box 18Delete Column command 141Delete command 140, 191Delete File After Printing/Viewing/Sending box251Delete Unit command 192deleting
column layout 140columns from column layout 141reporting tree 191reports
after printing, viewing, or sending 251row format 58
Demote Unit command 195, 212Description box 68descriptions
assigning in the row 74assigning multiple 88defining in column layout 149entering 71suppressing 74, 76
Detail Level box 50details
suppressing in column 164suppressing in row 82
direct column placement 126direct reference column placement 125Display Account Description from Chart option267Display Blanks for Zero Amounts option 262Display Commas in Amounts option 262Display GL Account Code option 267Display Report Processing Status option 273Display Reports With No Active Rows option 262Display Row Code option 267Display Rows With No Amounts option 262Display Underscore before Totals option 267DrillDown Viewer (Enhanced XML) option 244DrillDown Viewer (Enhanced XML) output forXBRL reports 297
EEdit menu commands
catalog of reports 226column layout 141reporting tree 191row format 59
editingcolumn layout 143reporting tree 203reporting unit 207row format 70
Element Names (XBRL) 298e-mail
reporting tree addresses 217sending 254
E-mail Options tab 236, 243, 254Enable E-mail box 254exception reports, generating 271

Index
346 FRx Report Designer 6.7 User’s Guide
Exclude Inactive Accounts (If Available) option273Expand All command 195, 196Expand Branch command 189, 195Extra Lines Between Rows option 262
FFile menu commands
catalog of reports 225column layout 140reporting tree 190row format 58
File Name box 250Financial & Account option 50, 232Financial & Transaction option 50, 232Financial Report option 50, 232Find button, record control box 18Find command 16, 192Find dialog box 61Find What box 17, 61fiscal year
assigning in the column layout 151column header codes 144linking year-to-year 121using the base 151
Fmt Code, selecting 73Font Style Name box 63, 260Font Styles command 226Font Styles dialog box 63font styles, creating and editing 260Format Name box 239, 240, 242formatting
amountsdisplay 82international 209negative values 157, 262row-by-row 90
combined worksheet link 129fonts and shading. See font styles, creating and
editing.reports 261row formats
Fmt Codes 73placing values in columns 83related rows 81
Formatting tab 236, 261FRD output type for XBRL reports 297Freeze at Description command 196
frequently 314frequently asked questions
incomplete report output 314From Account (range) -or- Individual Account orAccount Set cell 96, 97From Acct box 214FRx Company Code box 22FRx instant!OLAP-Microsoft Server Cube option247FRx Reporting Engine status window 273full account code
combining with natural 95entering in row format 95restricting row to reporting unit 81
Functional Currency box 23
Ggeneral ledger
connecting to the reporting tree 181displaying in the column layout 148entering codes in the row format 94links
creating GL/worksheet link 124using combined GL/worksheet 128
General Ledger Year box 123Generate Report dialog box 229Generate Report icon 53Generate... command 225GL Account Links dialog box 96GL Column option 148, 169
HHeader Label option 268Header Options dialog box 43, 145headers
creating dynamic columns 146entering column 145using multiple codes 145
Headers / Footers tab 236, 258headings
combining codes in column 143Help, opening 13historical rate source 274hooks (&)
using in a reporting tree 185using in a row format 68, 97using in an account mask 183

Index
347FRx Report Designer 6.7 User’s Guide
How toAdd XBRL Element tags to the row format 291Create a link to the XBRL taxonomy 289Include XBRL_TAG column type in the col-
umn layout 293Select a printer from the Catalog of Reports
output options 252Select a printer from the Print Immediately op-
tion 253Select XBRL output type from the Catalog of
Reports 296Use a currency rate subtype ID in the column
layout 307HTML (Via Excel 2000) option 244
IIF/THEN/ELSE statements
using in column layouts 157using in row formats 90
Import WKS Format command 58Import/Export Path box 23importing
external worksheetcreating a GL and WKS link 128creating a link 130
Include All Units check box 269, 281Include Amounts in Future Periods option 272Include Detail for Non-Printing Rows option 268Include Specific Number of Levels option 269Include Unposted Accounts Only option 233Include Unposted Activity Only option 50Increment Each Row By box 69Informal Desc box 208Insert Column command 142Insert command 16Insert Unit command 192inserting
columns 142reporting units 192rows 60
Installing Report Designer 5Instance documents (XBRL) 298Int’l Format box 209international formatting, applying to reporting units209
Kkjhkjhkljh 313
LLevels Down From Starting Unit option 270Link Menu commands 65Link Name box 122Link to General Ledger cell 96Link to General Ledger column, entering 94Link Type box 122, 129, 131linking
account types 100column placement methods 125combined GL and external worksheet 128to external worksheets 124to other row formats 116to separate worksheet 124
linksentering
separate worksheet 130formatting combined links 129identifying
worksheet cells 125worksheets in reporting tree 133
referencing external worksheets 125Lotus 1-2-3
exporting reports 246linking to 125
Mmain account code segment 66margins, changing 257Mark Unposted Accounts with * option 267mask, defining an account mask 183master row format, creating 67Maximum Digits Left of Decimal option 267menus
available commands 18Catalog 226column layout 140Edit
Catalog of Reports 226reporting tree 191row format 59, 61
FileCatalog of Reports 225reporting tree 190

Index
348 FRx Report Designer 6.7 User’s Guide
Formatreporting tree 193row format 63
Link 65reporting tree 190row format 58Tree 194Window 227
Message box 255Microsoft Excel
exporting reports 245linking to 125
Missing Element Tag Warning 295, 296Missing Unit Warning option 273modifiers, using account modifiers 103Multicurrency Formatting 167
Nnatural account code
combining with full account code 95entering in row format 94using in FRx 10, 66
New button, record control box 18No Page Breaks between Units option 270Norm Bal cell, entering 82
OOLAP Descriptions dialog box 173Open Column dialog box 43, 138Open Row dialog box 70Open Tree dialog box 46Optional Description box 123, 129, 131orientation, changing report 257Outline Style command 193Output box 244Output File Name dialog box 250Output Options tab 236, 243
PPage Break Before Unit box 209Page Options tab 236, 257Page Setup command 225Page Setup tab 236, 257parent reporting unit
defining account mask 183overview 181
Paste command 16, 191period
assigning a range 152using account modifiers 103
Period Code 152Period Code cell 174Period Dates option 271Period Description box 23Period Numbers option 271Period/Year Description box 173Periods and Dates dialog box 235, 276Pictures and Text command 194Plural Description box 24, 234Plus/Minus, Picture and Text command 193, 194point and click totaling 92Posted + Unposted Activity option 50, 233posted transactions, restricting column 164Print Catalog Information dialog box 279Print Control cell, column layout 159Print Ctrl cell, using 82Print Detail option 280Print Immediately box 251Printer option 244printing
blank rows with zero balances 82Catalog of Reports 225column layout 140reporting tree 191reports 244row format 58
Priority Level box 272Promote Unit command 195, 212Prompt for Output Type at Run Time box 251, 281Provisional box 50
Rrange of periods, entering 152README.TXT file 5Record Control box, using 18Related Rows/Unit cell
entering calculations 87entering conditional statements 90formatting 73restricting to a reporting unit 80using 80
Rename command 140, 191Renumber Rows dialog box 62Replace command 16, 192

Index
349FRx Report Designer 6.7 User’s Guide
Replace File Without Warning box 251Replace With box 17, 61report date, setting 276Report Duplicate Accts option 271Report Missing Accts option 271Report Options tab 236, 261Report Server Status command 228report specification sets 8Reporting Tree box 241Reporting Tree command 226reporting trees
&, +, ? characters, using 201adding e-mail addresses 217building
from chart of accounts 46manually 206
changingmoving units 204rolling up to parent unit 207
connecting with general ledger 183menus
Edit 191File 190Format 193Tree 194
opening 188planning structure 197
reporting unitschild
defining account mask 183parent relationship 203structure 181
definition 181editing 188, 207inserting 192promoting/demoting 204restricting
columns 165rows 80
Reporting Units dialog box 134reports
chaining 280cloning 282creating 274generating
exceptions 271multiple 280
scheduling 284responsibility account code
combining with full account code 95how FRx uses 10segment 66
Restart Numbering with Every Unit option 270Restart Page Numbering box 251restricting rows with book codes 106rolling up allocation percentage 207Rollup Rounded Values in the Tree option 264rounding
automatic for balance sheets 112CAL row format code 90combining options 265managing differences 263reporting units 264
Rounding Adjustment row box, row format 112Rounding Adjustments dialog box 112Rounding of Amounts options 113row codes
entering 71renumbering 71specifying in column layout 149
Row Format command 226Row Format Description box 238, 239, 241Row Format dialog box 62Row Format Name box 134row formats
additional text 72currency conversion codes 303editing account codes 68entering calculations 86entering totals 86linking
another row format 116combined GL and worksheet 124external worksheet 124general ledger 84, 94, 128year-to-year 121
making a master 67making flexible 66menus
Edit 59File 58Format 63Link 65
opening 70toolbar buttons 12
Row Period Offset option 128rows
deleting and inserting 60

Index
350 FRx Report Designer 6.7 User’s Guide
renumbering 62
SSave button, record control box 18saving
column layout 45, 48reporting tree 215, 220, 222reports 276
Schedule command 228Search Options section 61security
user 8Segment Hierarchy section 214Select a Company for this Record dialog box 275,282Select a Company to Work With dialog box 5Select Catalog for Display dialog box 49, 274, 280,281Select Column Heading dialog box 43Select Font Style dialog box 63, 260Select General Ledger Account dialog box 96, 97,101Select Import File dialog box 135Select Reporting Unit(s) to Print dialog box 53, 278Select Units at Run Time check box 281Select Units at Run Time option 269Selecting a local printer from the Catalog of Re-ports 251Send as Link to File option 250Shading options 260Sort GL Accounts by Natural Code option 268Source Row Format box 123Spaces Between Columns option 262special formatting options, column layout 157Split button (Cleaver) 214Split icon 200spot rate source 274Starting Date cell 239, 240, 242Starting Row Code box 69statistical data, including in column layout 151style, creating and editing font styles 63Subject box 255Subtotal By Period option 269Subtotal on Segment option 268summary reporting unit
overview 181Suppress CBR Calculation option 268suppressing
account/transaction detail 82details in columns 164row printing 82totals in columns 164
system requirements for installing FRx 5System Specific Information tab 24
Ttabular report, creating 177Taxonomy 298text, mixing with codes in column header 146Title/Desc box 208toolbar
Catalog of Reports 229main 12reporting tree 196row format 65
TOT row format code 74, 86Total Assets row box 112Total Liabilities & Equity row box 112totaling
point and click 92using in row formats 86
totals, suppressing in column 164transaction detail reports
available codes 150creating debit/credit 175customizing 173including multiple periods 174options 267year-to-date 175
Transaction Only option 50, 232Transaction Rounding option 269Tree Form button 134, 212Tree Lines and Text command 193Tree Lines, Picture and Text command 193, 194Tree Options tab 236, 269Tree Unit Security and E-mail dialog box 218
UUnit Code box 207Units for Tree dialog box 242unposted transactions, including in reports 164Use % Signs on Percentages option 262Use ( ) For Negative Numbers option 262Use Account Filter option 268Use Dates option 239, 240, 242

Index
351FRx Report Designer 6.7 User’s Guide
Use Period Numbers option 239, 240, 242Use Posted Balances Only option 50, 233Use Reporting Tree box 209Use Reporting Tree option 270Use Rounded Values for Calculations and Totalsoption 264, 266Use Row Format(s) and Worksheet Links from Re-porting Tree box 238
Vvalue placement method, column placement 126View Form command 195
WWeb Publishing tab 243, 255width, assigning column 157wildcards
entering in row format 97in reporting tree account mask 183using in column layout 169
Wks File Name (Ext File) box 210Wks File Name box 135Wks Link box 134Wks link, combined with GL link 124, 128WKS, column type 149worksheet
combining links 128
using a separate link 130Worksheet File Name box 123, 129
XXBRL Definitions 298XBRL Element names 298XBRL Element tags 290XBRL Elements
definition 298in the column layout 293in the row format 289, 290
XBRL instance documentsRules for reporting trees 295
XBRL Output type in the Catalog of Reports 295XBRL Taxonomy Document 298XBRL_TAG column type 293XML option 244
Yyear, including in column header 144YTD/Current cell 154
Zzero, suppressing rows 82Zoom command 15, 141, 192, 226ZXczxcZxcZxc 314