fscp dallas portfolio i, lpfscpfund.weebly.com/uploads/2/8/9/4/28943279/07... · fscp dallas...
TRANSCRIPT
FSCP Dallas Portfolio I, LP MONTHLY FINANCIAL REPORT July / 2014
PREPARED BY: Mike Crain, Director of Operations Dee Patterson, Assistant Property Manager
COLLIERS INTERNATIONAL | DALLAS/FORT WORTH
TABLE OF CONTENTS
Executive Summary 1
Property Management Narrative 2
Lease Update Summary 3
Lease Expiration Exposure by Year 4
Comparative Income Statement/Variance 5
Capital Expenses Report 6
Delinquency Status Report 7
Rent Rolls 8
Management Fees 9
11

EXECUTIVE SUMMARY


PROPERTY MANAGEMENT NARRATIVE

1
PROPERTY MANAGEMENT NARRATIVE July, 2014
COUNTERPOINT Property Issue: Sidewalk repairs needed. Action: Obtaining Bids. INTERNATIONAL CORPORATE PARK II (ICP II) Tenant Issue: Unified Building Sciences and Engineering TI plans finalized. GC contract executed. Building permit obtained. TI work started in July. Estimated 6-8 weeks for completion. INTERNATIONAL CORPORATE PARK III (ICP III) Property Issue: 900 Alpha – City of Richardson Fire Marshal requiring “back flow preventer” be installed per code on the fire sprinkler system. Action: Work completed in June. Final City inspections pending. Mission Food – Final TI plans and specifications approved. Application for a Building permit submitted to the City of Richardson. DALLAS TECHNOLOGY CENTER Tenant Issue: Coram Healthcare (Suite 102) – Carpet Installation required per lease renewal. Action: To be installed in August (Pending). STERLING TECHNOLOGY CENTER Tenant Issue: Paving repair needed at front entrance. Action: Bids being obtained.

2
PROPERTY MANAGEMENT NARRATIVE July, 2014
WESTWOOD III Property Issue: No issues for July to report. VALWOOD XII Property Issue: Additional foundation movement affecting the ASI conference/reception room demising wall, presentation room entrance doors and exterior glass panels. Repairs needed. Action: All repairs completed. Property Issue: Main sewer line stoppage. Action: Line cleared. Camera detected a break in the line. Repairs being made in August.

LEASE UPDATE SUMMARY
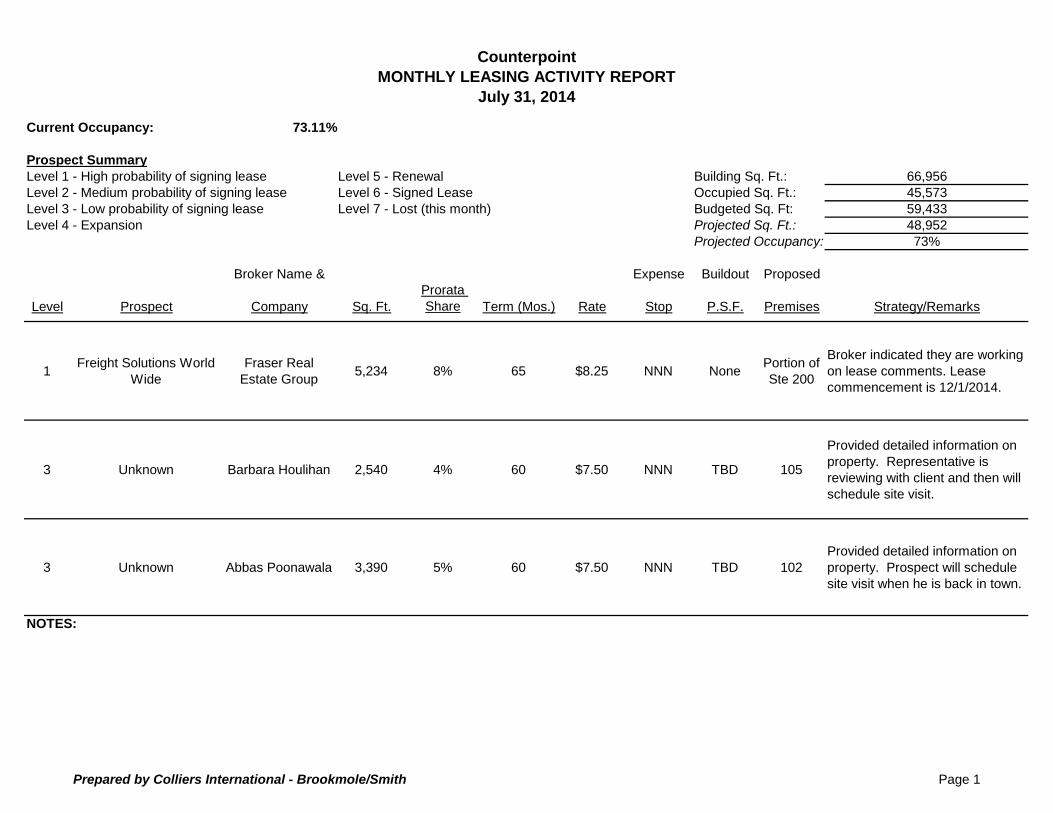
Counterpoint
MONTHLY LEASING ACTIVITY REPORT
July 31, 2014
Current Occupancy:
Prospect Summary
Level 1 - High probability of signing lease Level 5 - Renewal Building Sq. Ft.: 66,956
Level 2 - Medium probability of signing lease Level 6 - Signed Lease Occupied Sq. Ft.: 45,573
Level 3 - Low probability of signing lease Level 7 - Lost (this month) Budgeted Sq. Ft: 59,433
Level 4 - Expansion Projected Sq. Ft.: 48,952
Projected Occupancy: 73%
Broker Name & Expense Buildout Proposed
Level Prospect Company Sq. Ft.
Prorata
Share Term (Mos.) Rate Stop P.S.F. Premises Strategy/Remarks
1Freight Solutions World
Wide
Fraser Real
Estate Group5,234 8% 65 $8.25 NNN None
Portion of
Ste 200
Broker indicated they are working
on lease comments. Lease
commencement is 12/1/2014.
3 Unknown Barbara Houlihan 2,540 4% 60 $7.50 NNN TBD 105
Provided detailed information on
property. Representative is
reviewing with client and then will
schedule site visit.
3 Unknown Abbas Poonawala 3,390 5% 60 $7.50 NNN TBD 102
Provided detailed information on
property. Prospect will schedule
site visit when he is back in town.
NOTES:
73.11%
Prepared by Colliers International - Brookmole/Smith Page 1
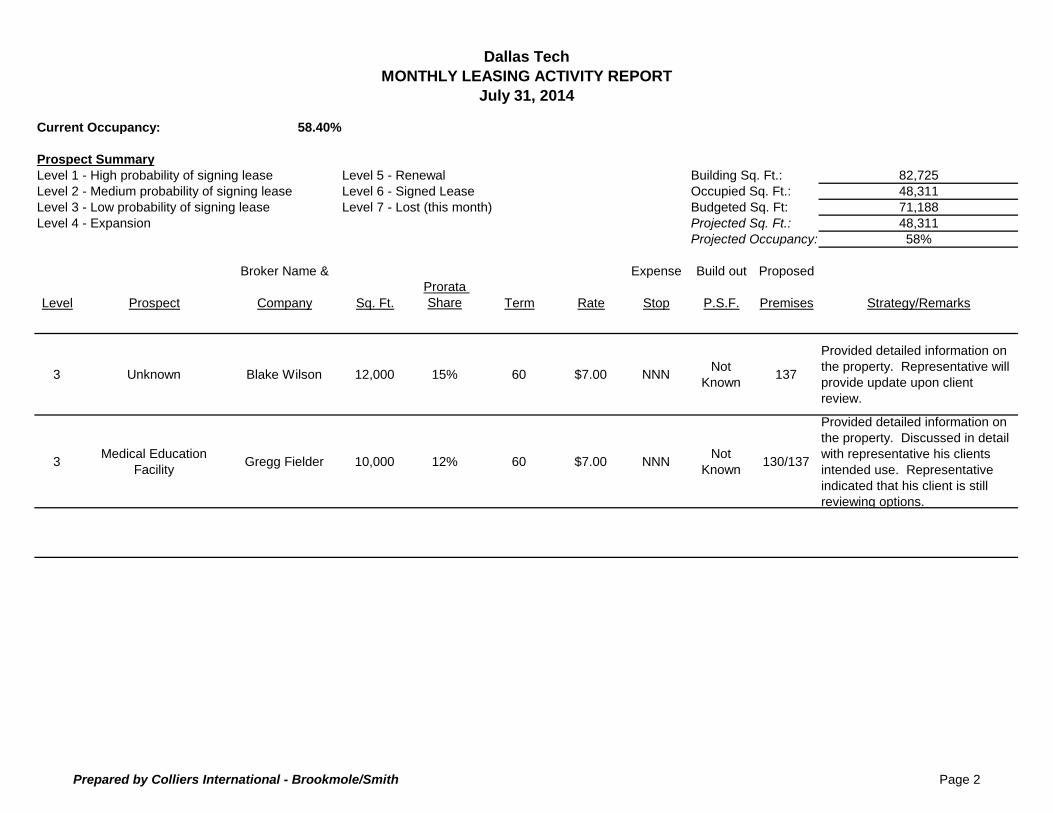
Dallas Tech
MONTHLY LEASING ACTIVITY REPORT
July 31, 2014
Current Occupancy:
Prospect Summary
Level 1 - High probability of signing lease Level 5 - Renewal Building Sq. Ft.: 82,725
Level 2 - Medium probability of signing lease Level 6 - Signed Lease Occupied Sq. Ft.: 48,311
Level 3 - Low probability of signing lease Level 7 - Lost (this month) Budgeted Sq. Ft: 71,188
Level 4 - Expansion Projected Sq. Ft.: 48,311
Projected Occupancy: 58%
Broker Name & Expense Build out Proposed
Level Prospect Company Sq. Ft.
Prorata
Share Term Rate Stop P.S.F. Premises Strategy/Remarks
3 Unknown Blake Wilson 12,000 15% 60 $7.00 NNNNot
Known137
Provided detailed information on
the property. Representative will
provide update upon client
review.
3Medical Education
FacilityGregg Fielder 10,000 12% 60 $7.00 NNN
Not
Known130/137
Provided detailed information on
the property. Discussed in detail
with representative his clients
intended use. Representative
indicated that his client is still
reviewing options.
58.40%
Prepared by Colliers International - Brookmole/Smith Page 2

ICP II
MONTHLY LEASING ACTIVITY REPORT
July 31, 2014
Current Occupancy:
Prospect Summary
Level 1 - High probability of signing lease Level 5 - Renewal Building Sq. Ft.: 84,530
Level 2 - Medium probability of signing lease Level 6 - Signed Lease Occupied Sq. Ft.: 59,577
Level 3 - Low probability of signing lease Level 7 - Lost (this month) Budgeted Sq. Ft: 74,734
Level 4 - Expansion Projected Sq. Ft.: 59,577
Projected Occupancy: 70%
Broker Name & Expense Buildout Proposed
Level Prospect Company Sq. Ft.
Prorata
Share Term (Mos.) Rate Stop P.S.F. Premises Strategy/Remarks
3 Logical Solutions Jeff Huddleson 1,934 2% 48 $6.40 NNN As Is 400
In discussions with Logical
Solutions in Suite 406 to expand
into Suite 400. They have a
ROFR for Suite 400.
7 Unknown Dave Peterson 12,000 14% 60 $8.50 MG TBD 504/505
Representative indicated client is
looking at other locations as the
suites would require more build
out than other options available.
7 Unknown Ken Boyd 6,000 7% 60 $8.50 MG TBD 504/505Representative has been non-
responsive.
3 Unknown Sandy Kee 3,990 5% 60 $8.50 MG TBD 504
Provided detailed information.
Representative is looking to
schedule site visit in the next
week.
70%
Prepared by Colliers International - Brookmole/Smith Page 3

ICP III
MONTHLY LEASING ACTIVITY REPORT
July 31, 2014
Current Occupancy:
Prospect Summary
Level 1 - High probability of signing lease Level 5 - Renewal Building Sq. Ft.: 111,500
Level 2 - Medium probability of signing lease Level 6 - Signed Lease Occupied Sq. Ft.: 111,500
Level 3 - Low probability of signing lease Level 7 - Lost (this month) Budgeted Sq. Ft: 111,500
Level 4 - Expansion Projected Sq. Ft.: 111,500
Projected Occupancy: 100%
Broker Name & Expense Buildout Proposed
Level Prospect Company Sq. Ft.
Prorata
Share Term (Mos.) Rate Stop P.S.F. Premises Strategy/Remarks
100.00%
Prepared by Colliers International - Brookmole/Smith Page 4

Sterling Tech
MONTHLY LEASING ACTIVITY REPORT
July 31, 2014
Current Occupancy:
Prospect Summary
Level 1 - High probability of signing lease Level 5 - Renewal Building Sq. Ft.: 77,608
Level 2 - Medium probability of signing lease Level 6 - Signed Lease Occupied Sq. Ft.: 65,546
Level 3 - Low probability of signing lease Level 7 - Lost (this month) Budgeted Sq. Ft: 77,608
Level 4 - Expansion Projected Sq. Ft.: 72,226
Projected Occupancy: 84%
Broker Name & Expense Buildout Proposed
Level Prospect Company Sq. Ft.
Prorata
Share Term Rate Stop P.S.F. Premises Strategy/Remarks
7 Bio skills learning facility Robert Zale 10,000 13% 60 $9.50 NNN Not Known 110/112
Performed Site visit on 7/17/14.
Represetative indicated client is
looking at other options beside
Flex office space.
3 Guest Logix Brad Devine 6,680 9% 60 $9.50 NNN Not Known 110
Performed Site visit on 7/17/14.
Waiting on additional feedback
from representative's client.
3 UnknownJames Rigelsky /
Brian Kelly6,000 8% 60 $9.50 NNN Not Known 110/112
Performed site visit on 7/25/14.
Their client is reviewing options.
7 Unknown Jeremy Halback 12,000 15% 60 $9.50 NNN Not Known 110/112
Representative indicated his
client is focused on other options
at this time.
3 Unknown Preston Lynn 5,382 7% 60 $9.50 NNN Not Known 112
Performed Site Visit on 7/24/14.
Representative indicated the
client will be bringing the CEO by
the property in the next couple of
weeks.
84.46%
Prepared by Colliers International - Brookmole/Smith Page 5

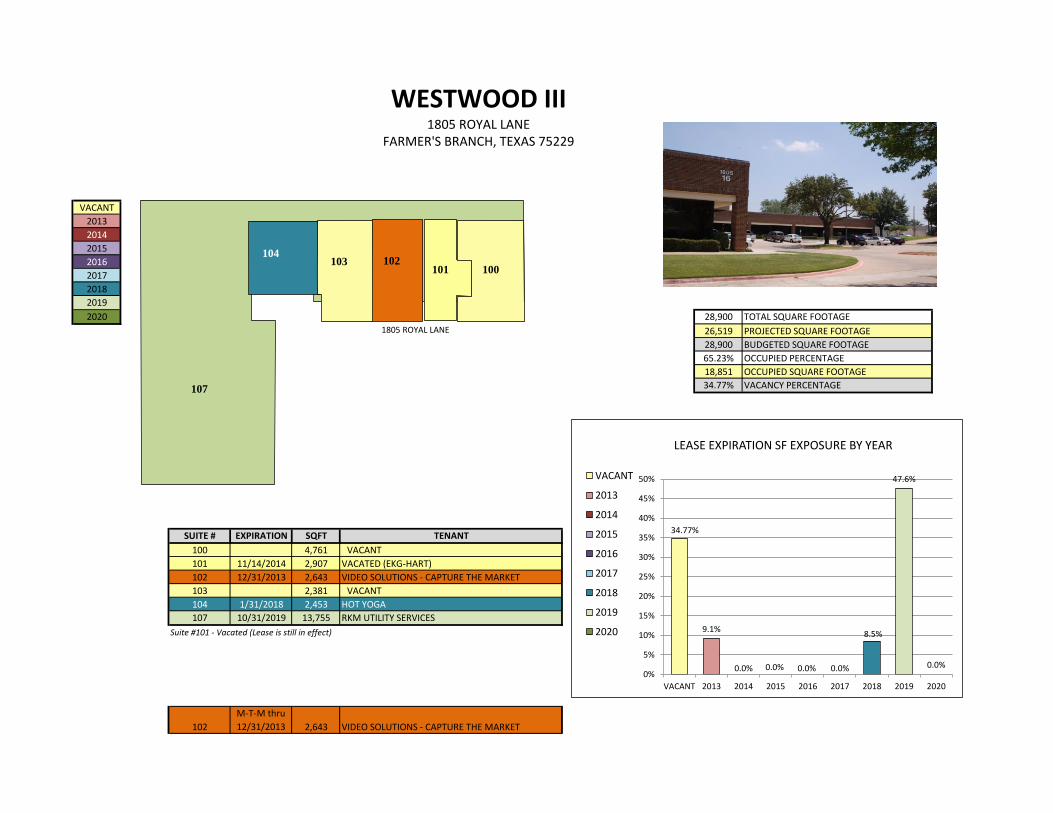
Westwood III
MONTHLY LEASING ACTIVITY REPORT
July 31, 2014
Current Occupancy:
Prospect Summary
Level 1 - High probability of signing lease Level 5 - Renewal Building Sq. Ft.: 28,900
Level 2 - Medium probability of signing lease Level 6 - Signed Lease Occupied Sq. Ft.: 18,851
Level 3 - Low probability of signing lease Level 7 - Lost (this month) Budgeted Sq. Ft: 28,900
Level 4 - Expansion Projected Sq. Ft.: 18,851
Projected Occupancy: 65%
Broker Name & Expense Build out Proposed
Level Prospect Company Sq. Ft.
Prorata
Share Term Rate Stop P.S.F. Premises Strategy/Remarks
3Custom Stationary &
Marketing MaterialsMatt Miller 2,381 8% 60 $7.50 NNN Not Known 103
Performed site visit on July 10th
and July 30th with representative
and his client. Client indicated
Suite 103 made her short list and
will be making a decision after
August 10th.
7 Unknown Kimberly Lay 2,381 8% 60 7,50 NNN Not Known 103
Performed site visit on 7/16/14.
Representative indicated her
client is focused on other options.
3 UnknownChristopher
Fleeger4,761 16% 60 $7.50 NNN Not Known 100
Performed site visit on 7/25/14.
Representative indicated his
client is reviewing options.
65.23%
Prepared by Colliers International - Brookmole/Smith Page 6

Valwood XII
MONTHLY LEASING ACTIVITY REPORT
July 31, 2014
Current Occupancy: 51.63%
Prospect Summary
Level 1 - High probability of signing lease Level 5 - Renewal Building Sq. Ft.:
Level 2 - Medium probability of signing leaseLevel 6 - Signed Lease Occupied Sq. Ft.:
Level 3 - Low probability of signing lease Level 7 - Lost (this month) Budgeted Sq. Ft:
Level 4 - Expansion Projected Sq. Ft.:
Projected Occupancy:
Broker Name & Expense Build out Proposed
Level Prospect Company Sq. Ft.
Prorata
Share Term Rate Stop P.S.F. Premises Strategy/Remarks
5 20,328 52% 36 $7.50 NNN None 100
NOTES:
ASI Business Solutions
Had conference call with tenant
on 7/11/14. Have requested an
update from Broker
Representative.
39,373
20,328
39,373
20,328
52%
Prepared by Colliers International - Brookmole/Smith Page 7

LEASE EXPIRATION EXPOSURE BY YEAR

491,592
73.25%
26.75%
TOTAL SQUARE FOOTAGE
OCCUPIED PERCENTAGE
VACANT PERCENTAGE
LEASE EXPIRATION - SF EXPOSURE BY YEAR
FSCP DALLAS PORTFOLIO I, LP
26.75%
3.88% 4.43%
16.79%
17.94%
6.37%
9.75%
14.09%
0.00%
5.00%
10.00%
15.00%
20.00%
25.00%
30.00%
VACANT 2013 2014 2015 2016 2017 2018 2019 2020
FSCP PORTFOLIO
VACANT
2013
2014
2015
2016
2017
2018
2019
2020

VACANT
2013
2014
2015
2016
2017
2018 66,956 TOTAL SQUARE FOOTAGE
2019 66,956 BUDGETED SQUARE FOOTAGE
2020 48,952 PROJECTED SQUARE FOOTAGE
73.11% OCCUPIED PERCENTAGE
45,573 OCCUPIED SQUARE FOOTAGE
26.89% VACANCY PERCENTAGE
SUITE # EXPIRATION SQFT
100A 11/1/2016 6,085
103 4,600
105 2,540
107 11/30/2015 5,214
108 11/30/2015 1,747
200 11/30/2014 10,067
201 9/30/2019 3,379
202 1/31/2018 3,704
203 1/1/2015 3,510
204 2/28/2015 3,043
205 4,983
206 7/31/2017 2,544
207 12/31/2017 3,216
210 5,881
214 6/30/2017 6,443
Suite #201 - Vacated/Terminated as of 2/26/14. New Tenant effective 5/1/14.
66,956
COUNTERPOINT
IRVING, TEXAS 750638101 - 8113 RIDGEPOINT DR
VACANT
HORIZON GROUP, USA
VACANT
NIKON METROLOGY, INC
TENANT
SITEMAX TELECOM, LLC
WALGREENS
SQUARE ONE BUSINESS MACHINES LLC
PACIFIC DENTAL CARE
AMERICAN CRAFTS
OLYMPUS
AFS LOGISTICS, LLC
AUTOMATED DYNAMICS
VACANT
DAVID NICKERSON FOUNDATION
VACANT
214
210
204 203 202 201
200
8101 RIDGEPOINT
8113 RIDGEPOINT
26.89%
0.00%
15.04%
20.18%
9.09%
18.23%
5.53% 5.05%
0.00% 0%
5%
10%
15%
20%
25%
30%
VACANT 2013 2014 2015 2016 2017 2018 2019 2020
LEASE EXPIRATION SF EXPOSURE BY YEAR
VACANT
2013
2014
2015
2016
2017
2018
2019
2020
206
205
108 107
100 100 A
103
207
105

VACANT
2013
2014
2015
2016
2017 82,725
2018 63,432
2019 82,725
2020 58.40%
48,311
41.60%
SUITE # EXPIRATION SQFT
A130 6/30/2015 15,121
A 151 10/31/2019 7,179
B 137 15,877
B 151 8/31/2019 6,590
C 147 7/30/2019 10,189
C195 11/30/2019 7,835
D 100 8/31/2016 6,754
D 101 3,416
D 102 4/30/2013 9,764
D 103 12/31/2019 BILLBOARD
Suite #130 - Vacated (Lease is still in effect)
DALLAS TECHNOLOGY CENTER10005 - 10105 TECHNOLOGY BLVD
DALLAS, TEXAS 75220
EXPRESION E. IMAGEN STUDIO
KNIGHT SECURITY SYSTEMS, LLC
TOTAL SQUARE FOOTAGE
PROJECTED SQUARE FOOTAGE
BUDGETED SQUARE FOOTAGE
OCCUPIED PERCENTAGE
OCCUPIED SQUARE FOOTAGE
VACANCY PERCENTAGE
VACANT
CORAM HEALTHCARE GROUP
CBS OUTDOOR
TENANT
VACATED (ATI CAREER TRAINING CENTER)
TRANSFORMING LIFE CHRISTIAN FELLOWSHIP
VACANT
EXPRESION E. IMAGEN STUDIO
EXPRESION E. IMAGEN STUDIO
130
151
151
137
101
100
102
BILLBOARD 41.60%
11.80%
0.00% 0.00%
8.16%
0.00% 0.00%
38.43%
0.00%
VACANT 2013 2014 2015 2016 2017 2018 2019
0%
5%
10%
15%
20%
25%
30%
35%
40%
45%
LEASE EXPIRATION SF EXPOSURE BY YEAR
VACANT
2013
2014
2015
2016
2017
2018
2019

VACANT
2013
2014
2015
2016
2017
2018
2019 84,530 TOTAL SQUARE FOOTAGE
2020 59,577 PROJECTED SQUARE FOOTAGE
84,530 BUDGETED SQUARE FOOTAGE
68.95% OCCUPIED PERCENTAGE
59, 577 OCCUPIED SQUARE FOOTAGE
31.05% VACANCY PERCENTAGE
SUITE # EXPIRATION SQFT
100 8/31/2017 5,628
104 6/30/2018 6,353
107 2,124
108 6/30/2017 2,365
203 9,796
209 1/31/2013 6,674
300 9/30/2019 12,350
400 1,934
406 5/31/2018 12,606
500 6/30/2015 7,050
503 7/31/2016 5,260
504 3,990
505 12/31/2014 8,400
Suite #505 -Vacated (Lease is still in effect) Suite 209 Expansion of 1,291 is not included
SUITE #500 (Rent Roll shows Suite 501) as in the Leasing Report (Not occupied).
VACATED (FSB INTERNATIONAL)
DALLAS GARLAND & NE RAILROAD
LEGAL ELEMENTS OF DALLAS, LLC
VACANT
UNIFIED BUILDING SCIENCES
BOWLIN DEVELOPMENT
VACANT
LOGICAL SOLUTIONS
VARIAN MEDICAL SYSTEMS, INC.
VACANT
VIYU NETWORK DBA ARW
VACANT
INTERNATIONAL CORPORATE PARK II401 - 409 INTERNATIONAL PARKWAY
RICHARDSON, TX 75081
TENANT
Terminex International
104 100
108
300
400
406
505
500
503 504
403 International
401 International
407 International
409 International
405 International
31.05%
7.90%
0.00%
8.34% 6.22%
9.46%
22.43%
14.61%
0.00% 0%
5%
10%
15%
20%
25%
30%
35%
VACANT 2013 2014 2015 2016 2017 2018 2019 2020
LEASE EXPIRATION SF EXPOSURE BY YEAR
VACANT
2013
2014
2015
2016
2017
2018
2019
2020
203
209
107

VACANT
2013
2014
2015
2016
2017
2018 111,500 TOTAL SQUARE FOOTAGE
2019 99,800 PROJECTED SQUARE FOOTAGE
2020 111,500 BUDGETED SQUARE FOOTAGE
89.51% OCCUPIED PERCENTAGE
99,800 OCCUPIED SQUARE FOOTAGE
10.49% VACANCY PERCENTAGE
SUITE # EXPIRATION SQFT TENANT
100 8/31/2018 22,800
102 6/30/2019 8,006
110 6/30/2015 30,600
400 11,700
410 12/31/2017 11,094
420 4/30/2014 11,700
430 3/31/2015 15,600
111,500
Apple Homecare
INTERNATIONAL CORPORATE PARK III900 ALPHA RD & 500 INDUSTRIAL BLVD
RICHARDSON, TEXAS 75081
KIT SPECIALTIES
EAST HILL INDUSTRIES
THERMO FISHER SCIENTIFIC, INC
ENTERPRISE PLUMBING
VACANT
DIRECTLINE DISTRIBUTING, LLC
400 410 420
430
900 ALPHA ROAD=
110 100
102
500 INDUSTRIAL BLVD
10.49%
0.00%
10.49%
41.43%
0.00%
9.95%
20.45%
7.18%
0.00%
0%
5%
10%
15%
20%
25%
30%
35%
40%
45%
VACANT 2013 2014 2015 2016 2017 2018 2019 2020
LEASE EXPIRATION SF EXPOSURE BY YEAR
VACANT
2013
2014
2015
2016
2017
2018
2019
2020

VACANT
2013
2014
2015
2016
2017 77,608 TOTAL SQUARE FOOTAGE
2018 77,608 PROJECTED SQUARE FOOTAGE
2019 77,608 BUDGETED SQUARE FOOTAGE
2020 84.46% OCCUPIED PERCENTAGE
65,546 OCCUPIED SQUARE FOOTAGE
15.54% VACANCY PERCENTAGE
SUITE # EXPIRATION SQFT
A 101 6/30/2016 10,296
A 105 11/30/2015 5,443
A 106 2/29/2016 5,698
A 108 11/30/2015 2,260
A 110 6,680
A 112 5,382
B 100 5/31/2016 14,069
C 100 11/1/2016 13,660
C 110 11/1/2016 6,032
C 120 10/31/2015 8,088
65,546
KLEINFELDER CENTRAL
HEXAGON METROLOGY
ONSITE HEALTH DIAGNOSTICS
GENTIVA WALLS WITHOUT REHAB
VACANT
VACANT
STAPLES
KLEINFELDER CENTRAL
GENTIVA HEALTH SERVICES
TENANT
TOUCHPAY HOLDINGS, LP
STERLING TECHNOLOGY CENTER7801 - 7805 MESQUITE BEND DRIVE
IRVING, TEXAS 75063
C 120
C 100
C 110
B 100
A 112
A 106
A 105
A 110
A 108
A 101
15.54%
0.00% 0.00%
20.35%
64.11%
0.00% 0.00% 0.00% 0.00% 0%
10%
20%
30%
40%
50%
60%
70%
VACANT 2013 2014 2015 2016 2017 2018 2019 2020
LEASE EXPIRATION SF EXPOSURE BY YEAR
VACANT
2013
2014
2015
2016
2017
2018
2019
2020

VACANT
2013
2014
2015 39,373 TOTAL SQUARE FOOTAGE
2016 20,328 PROJECTED SQUARE FOOTAGE
2017 39,373 BUDGETED SQUARE FOOTAGE
2018 51.63% OCCUPIED PERCENTAGE
2019 20,328 OCCUPIED SQUARE FOOTAGE
2020 48.37% VACANCY PERCENTAGE
SUITE # EXPIRATION SQFT
101 19,045
102 6/30/2016 20,328
VALWOOD XII13701 HUTTON DRIVE
FARMER'S BRANCH, TEXAS 75234
ASI BUSINESS SOLUTIONS
TENANT
VACANT
101
102
13701 HUTTON
48.37%
0.00% 0.00% 0.00%
51.63%
0.00% 0.00% 0.00% 0.00%
VACANT 2013 2014 2015 2016 2017 2018 2019 2020
0%
10%
20%
30%
40%
50%
60%
LEASE EXPIRATION SF EXPOSURE BY YEAR
VACANT
2013
2014
2015
2016
2017
2018
2019
2020
VACANT
2013
2014
2015
2016
2017
2018
2019
2020 28,900 TOTAL SQUARE FOOTAGE
26,519 PROJECTED SQUARE FOOTAGE
28,900 BUDGETED SQUARE FOOTAGE
65.23% OCCUPIED PERCENTAGE
18,851 OCCUPIED SQUARE FOOTAGE
34.77% VACANCY PERCENTAGE
SUITE # EXPIRATION SQFT
100 4,761 VACANT
101 11/14/2014 2,907 VACATED (EKG-HART)
102 12/31/2013 2,643
103 2,381 VACANT
104 1/31/2018 2,453
107 10/31/2019 13,755
Suite #101 - Vacated (Lease is still in effect)
102
M-T-M thru
12/31/2013 2,643 VIDEO SOLUTIONS - CAPTURE THE MARKET
WESTWOOD III1805 ROYAL LANE
FARMER'S BRANCH, TEXAS 75229
TENANT
RKM UTILITY SERVICES
HOT YOGA
VIDEO SOLUTIONS - CAPTURE THE MARKET
100 101 102 103
104
107
1805 ROYAL LANE
34.77%
9.1%
0.0% 0.0% 0.0% 0.0%
8.5%
47.6%
0.0% 0%
5%
10%
15%
20%
25%
30%
35%
40%
45%
50%
VACANT 2013 2014 2015 2016 2017 2018 2019 2020
LEASE EXPIRATION SF EXPOSURE BY YEAR
VACANT
2013
2014
2015
2016
2017
2018
2019
2020

COMPARATIVE INCOME STATEMENTS/VARIANCE

8/8/2014 2:40 PM
PTD Actual PTD Budget Variance % Var YTD Actual YTD Budget Variance % Var Annual
4000-0000 REVENUE
4299-9999 RENT REVENUE 33,395.75 32,842.00 553.75 1.69 221,705.49 228,206.00 -6,500.51 -2.85 396,413.00
4399-9999 REIMBURSEABLE EXP INCOME 10,240.02 10,411.00 -170.98 -1.64 69,923.08 69,958.00 -34.92 -0.05 125,801.00
4499-9999 REIMB EXP INCOME-PRIOR YEAR 0.00 0.00 0.00 N/A 29,308.40 -29,963.00 59,271.40 197.82 -29,963.00
4999-5999 OTHER REVENUE 0.20 0.00 0.20 N/A 2.49 0.00 2.49 N/A 0.00
4999-9999 TOTAL REVENUE 43,635.97 43,253.00 382.97 0.89 320,939.46 268,201.00 52,738.46 19.66 492,251.00
5000-0000 RECOVERABLE EXPENSES
`
5099-9999 REPAIRS & MAINTENANCE EXPENSE 2,242.96 2,096.00 -146.96 -7.01 14,109.60 17,500.00 3,390.40 19.37 24,306.00
5199-9999 LANDSCAPE EXPENSE 1,025.73 971.00 -54.73 -5.64 7,982.22 10,205.00 2,222.78 21.78 15,688.00
5299-9999 CLEANING EXPENSE 1,002.64 900.00 -102.64 -11.40 7,691.16 7,696.00 4.84 0.06 13,592.00
5399-9999 SECURITY/SAFETY EXPENSE 91.03 90.00 -1.03 -1.14 813.08 630.00 -183.08 -29.06 1,080.00
5499-9999 UTILITIES EXPENSE 784.44 1,145.00 360.56 31.49 5,525.03 7,374.00 1,848.97 25.07 13,704.00
5599-9999 PARKING & GARAGE EXPENSE 59.54 60.00 0.46 0.77 529.28 7,225.00 6,695.72 92.67 7,525.00
5600-9999 MANAGEMENT FEE EXPENSE 1,040.21 1,298.00 257.79 19.86 8,743.59 8,046.00 -697.59 -8.67 14,768.00
5699-9999 ADMINISTRATIVE EXPENSE 1,088.34 890.00 -198.34 -22.29 11,706.93 10,206.00 -1,500.93 -14.71 15,006.00
5899-9999 RETAIL EXPENSE 0.00 0.00 0.00 N/A -45.00 0.00 45.00 N/A 0.00
5949-9999 INSURANCE EXPENSE 788.72 963.00 174.28 18.10 5,744.49 6,096.00 351.51 5.77 10,911.00
5999-9000 PROPERTY TAX EXPENSE 12,082.50 7,469.00 -4,613.50 -61.77 59,484.03 55,007.00 -4,477.03 -8.14 93,249.00
5999-9500 TOTAL OPERATING EXPENSE 20,206.11 15,882.00 -4,324.11 -27.23 122,284.41 129,985.00 7,700.59 5.92 209,829.00
5999-9999 TOTAL OPERATING INCOME 23,429.86 27,371.00 -3,941.14 -14.40 198,655.05 138,216.00 60,439.05 43.73 282,422.00
6000-0100 REPAIRS & MAINTENANCE-NON RECOVERABLE
6099-9999 TOTAL REPAIRS & MAINTENANCE-NON RECOVERABLE 0.00 175.00 175.00 100.00 2,701.29 775.00 -1,926.29 -248.55 1,200.00
6400-0000 UTILITIES-NON RECOVERABLE
6499-9999 TOTAL UTILITIES EXPENSE-NON RECOVERABLE 0.00 2,757.00 2,757.00 100.00 2,566.56 8,108.00 5,541.44 68.35 12,667.00
6610-0000 ADMINISTRATIVE EXPENSE-NON RECOVERABLE
6699-9999 TOTAL ADMINISTRATIVE EXPENSE-NON RECOVERABLE 2,671.59 1,037.00 -1,634.59 -157.63 20,867.33 8,979.00 -11,888.33 -132.40 14,004.00
6700-0000 LEASING & MARKETING EXPENSE-NON RECOVERABLE
6799-9999 TOTAL LEASING & MARKETING EXPENSE-NON RECOVERABLE 0.00 0.00 0.00 N/A 0.00 0.00 0.00 N/A 700.00
Description
Period = Jul 2014
Book = Accrual ; Tree = ysi_cf_chi0
Counterpoint (8522-ds)
Budget Comparison Cash Flow
Straightline rent adjustments not Budgeted.
Roof leak repairs.
Property Tax Consulting Fees.
Legal Fees (Glenda Cooper)
Page 1 of 2

8/8/2014 2:40 PM
PTD Actual PTD Budget Variance % Var YTD Actual YTD Budget Variance % Var Annual Description
Period = Jul 2014
Book = Accrual ; Tree = ysi_cf_chi0
Counterpoint (8522-ds)
Budget Comparison Cash Flow
6999-9999 TOTAL NON RECOVERABLE EXPENSE 2,671.59 3,969.00 1,297.41 32.69 26,135.18 17,862.00 -8,273.18 -46.32 28,571.00
7000-0000 DEBT SERVICE & AFTER DEBT
7999-9999 TOTAL DEBT SERVICE & AFTER DEBT 18,960.57 19,409.00 448.43 2.31 129,577.70 130,842.00 1,264.30 0.97 228,022.00
8000-0000 OTHER INCOME/EXPENSE
8999-9999 TOTAL OTHER INCOME/EXPENSE 0.00 752.00 752.00 100.00 4,478.96 5,264.00 785.04 14.91 9,024.00
9000-0000 DEPRECIATION & AMORTIZATION
9699-9999 TOTAL DEPR & AMORT EXPENSE 20,640.31 0.00 -20,640.31 N/A 107,688.19 0.00 -107,688.19 N/A 0.00
9800-0000 NET INCOME/(LOSS) -18,842.61 3,241.00 -22,083.61 -681.38 -69,224.98 -15,752.00 -53,472.98 -339.47 16,805.00
ADJUSTMENTS
TOTAL ADJUSTMENTS 18,566.49 0.00 18,566.49 N/A 37,940.95 -112,884.00 150,824.95 133.61 -269,437.00
CASH FLOW -276.12 3,241.00 -3,517.12 -108.52 -31,284.03 -128,636.00 97,351.97 75.68 -252,632.00
Not Budgeted.
Page 2 of 2

8/8/2014 2:41 PM
PTD Actual PTD Budget Variance % Var YTD Actual YTD Budget Variance % Var Annual
4000-0000 REVENUE
4299-9999 RENT REVENUE 33,822.36 35,872.00 -2,049.64 -5.71 236,180.47 249,658.00 -13,477.53 -5.40 436,070.00
4399-9999 REIMBURSEABLE EXP INCOME 8,151.20 9,010.00 -858.80 -9.53 57,072.18 61,723.00 -4,650.82 -7.54 113,709.00
4499-9999 REIMB EXP INCOME-PRIOR YEAR 0.00 0.00 0.00 N/A 2,180.19 10,256.00 -8,075.81 -78.74 10,256.00
4999-5999 OTHER REVENUE 0.25 0.00 0.25 N/A 3.13 0.00 3.13 N/A 0.00
4999-9999 TOTAL REVENUE 41,973.81 44,882.00 -2,908.19 -6.48 295,435.97 321,637.00 -26,201.03 -8.15 560,035.00
5000-0000 RECOVERABLE EXPENSES
5099-9999 REPAIRS & MAINTENANCE EXPENSE 1,365.94 2,322.00 956.06 41.17 4,123.35 17,683.00 13,559.65 76.68 23,957.00
5199-9999 LANDSCAPE EXPENSE 1,312.37 1,373.00 60.63 4.42 9,238.63 9,440.00 201.37 2.13 14,505.00
5299-9999 CLEANING EXPENSE 956.83 1,359.00 402.17 29.59 7,382.43 14,635.00 7,252.57 49.56 23,552.00
5399-9999 SECURITY/SAFETY EXPENSE 0.00 90.00 90.00 100.00 112.50 630.00 517.50 82.14 1,080.00
5499-9999 UTILITIES EXPENSE 1,126.57 2,465.00 1,338.43 54.30 8,632.76 11,570.00 2,937.24 25.39 19,914.00
5599-9999 PARKING & GARAGE EXPENSE 137.48 137.00 -0.48 -0.35 962.36 3,959.00 2,996.64 75.69 4,644.00
5600-9999 MANAGEMENT FEE EXPENSE 1,215.47 1,346.00 130.53 9.70 9,751.69 9,647.00 -104.69 -1.09 16,795.00
5699-9999 ADMINISTRATIVE EXPENSE 1,356.87 1,119.00 -237.87 -21.26 9,563.94 8,255.00 -1,308.94 -15.86 14,372.00
5949-9999 INSURANCE EXPENSE 995.74 1,105.00 109.26 9.89 7,252.23 7,010.00 -242.23 -3.46 12,535.00
5999-9000 PROPERTY TAX EXPENSE 12,845.00 7,845.00 -5,000.00 -63.73 61,685.47 56,400.00 -5,285.47 -9.37 94,375.00
5999-9500 TOTAL OPERATING EXPENSE 21,312.27 19,161.00 -2,151.27 -11.23 118,705.36 139,229.00 20,523.64 14.74 225,729.00
5999-9999 TOTAL OPERATING INCOME 20,661.54 25,721.00 -5,059.46 -19.67 176,730.61 182,408.00 -5,677.39 -3.11 334,306.00
6000-0100 REPAIRS & MAINTENANCE-NON RECOVERABLE
6099-9999 TOTAL REPAIRS & MAINTENANCE-NON RECOVERABLE 0.00 0.00 0.00 N/A 1,989.61 300.00 -1,689.61 -563.20 900.00
6400-0000 UTILITIES-NON RECOVERABLE
6499-9999 TOTAL UTILITIES EXPENSE-NON RECOVERABLE 0.00 180.00 180.00 100.00 1,689.61 1,570.00 -119.61 -7.62 2,655.00
6610-0000 ADMINISTRATIVE EXPENSE-NON RECOVERABLE
6699-9999 TOTAL ADMINISTRATIVE EXPENSE-NON RECOVERABLE 1,013.90 1,872.00 858.10 45.84 10,580.38 9,044.00 -1,536.38 -16.99 14,344.00
6700-0000 LEASING & MARKETING EXPENSE-NON RECOVERABLE
6799-9999 TOTAL LEASING & MARKETING EXPENSE-NON RECOVERABLE 23.40 0.00 -23.40 N/A 70.20 0.00 -70.20 N/A 895.00
Description
International Corp Park II (8523-ds)
Budget Comparison Cash FlowPeriod = Jul 2014
Book = Accrual ; Tree = ysi_cf_chi0
Straightline rent adjustments not budgeted.
No roof repairs.
Property Tax Consulting Fee.
Page 1 of 2

8/8/2014 2:41 PM
PTD Actual PTD Budget Variance % Var YTD Actual YTD Budget Variance % Var Annual Description
International Corp Park II (8523-ds)
Budget Comparison Cash FlowPeriod = Jul 2014
Book = Accrual ; Tree = ysi_cf_chi0
6999-9999 TOTAL NON RECOVERABLE EXPENSE 1,037.30 2,052.00 1,014.70 49.45 14,329.80 10,914.00 -3,415.80 -31.30 18,794.00
7000-0000 DEBT SERVICE & AFTER DEBT
7999-9999 TOTAL DEBT SERVICE & AFTER DEBT 23,937.18 24,511.00 573.82 2.34 163,588.11 165,236.00 1,647.89 1.00 287,958.00
8000-0000 OTHER INCOME/EXPENSE
8999-9999 TOTAL OTHER INCOME/EXPENSE 0.00 978.00 978.00 100.00 6,085.03 6,846.00 760.97 11.12 11,736.00
9000-0000 DEPRECIATION & AMORTIZATION
9699-9999 TOTAL DEPR & AMORT EXPENSE 13,876.16 0.00 -13,876.16 N/A 99,739.13 0.00 -99,739.13 N/A 0.00
9800-0000 NET INCOME/(LOSS) -18,189.10 -1,820.00 -16,369.10 -899.40 -107,011.46 -588.00 -106,423.46 -18,099.23 15,818.00
ADJUSTMENTS
TOTAL ADJUSTMENTS 20,184.44 0.00 20,184.44 N/A 84,909.07 -50,272.00 135,181.07 268.90 -273,969.00
CASH FLOW 1,995.34 -1,820.00 3,815.34 209.63 -22,102.39 -50,860.00 28,757.61 56.54 -258,151.00
Not Budgeted.
Page 2 of 2

8/8/2014 2:41 PM
PTD Actual PTD Budget Variance % Var YTD Actual YTD Budget Variance % Var Annual
4000-0000 REVENUE
4299-9999 RENT REVENUE 34,752.21 35,943.00 -1,190.79 -3.31 231,220.03 246,641.00 -15,420.97 -6.25 435,863.00
4399-9999 REIMBURSEABLE EXP INCOME 15,880.24 17,736.00 -1,855.76 -10.46 111,161.68 116,704.00 -5,542.32 -4.75 205,384.00
4499-9999 REIMB EXP INCOME-PRIOR YEAR 0.00 0.00 0.00 N/A -11,260.53 19,616.00 -30,876.53 -157.40 19,616.00
4999-5999 OTHER REVENUE 0.34 0.00 0.34 N/A 4.16 0.00 4.16 N/A 0.00
4999-9999 TOTAL REVENUE 50,632.79 53,679.00 -3,046.21 -5.67 331,125.34 382,961.00 -51,835.66 -13.54 660,863.00
5000-0000 RECOVERABLE EXPENSES
5099-9999 REPAIRS & MAINTENANCE EXPENSE 464.71 2,823.00 2,358.29 83.54 18,149.73 12,041.00 -6,108.73 -50.73 17,979.00
5199-9999 LANDSCAPE EXPENSE 1,056.03 1,134.00 77.97 6.88 8,213.74 9,394.00 1,180.26 12.56 14,464.00
5299-9999 CLEANING EXPENSE 4,185.83 4,186.00 0.17 0.00 25,883.18 30,730.00 4,846.82 15.77 53,088.00
5399-9999 SECURITY/SAFETY EXPENSE 2,512.77 1,602.00 -910.77 -56.85 7,920.90 12,894.00 4,973.10 38.57 15,034.00
5499-9999 UTILITIES EXPENSE 2,108.56 2,070.00 -38.56 -1.86 12,485.61 10,970.00 -1,515.61 -13.82 18,580.00
5599-9999 PARKING & GARAGE EXPENSE 160.21 160.00 -0.21 -0.13 1,155.22 8,620.00 7,464.78 86.60 9,420.00
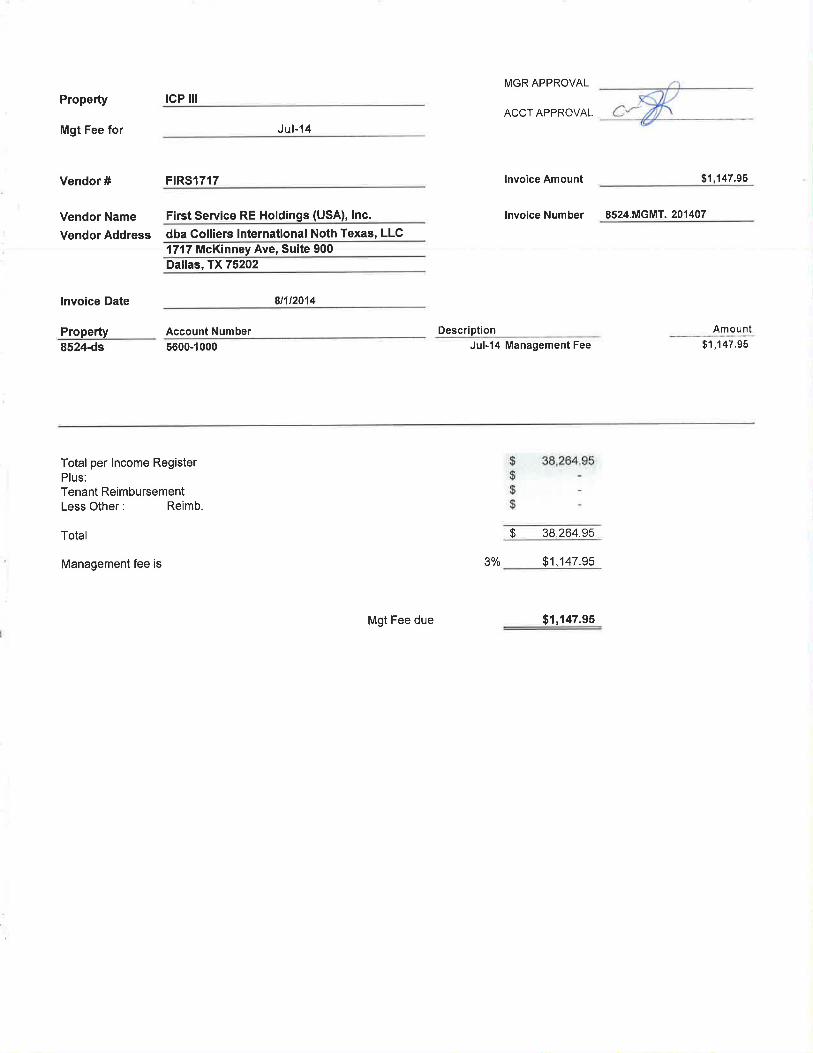
5600-9999 MANAGEMENT FEE EXPENSE 1,147.95 1,610.00 462.05 28.70 12,418.42 11,488.00 -930.42 -8.10 19,823.00
5699-9999 ADMINISTRATIVE EXPENSE 1,780.95 1,513.00 -267.95 -17.71 13,541.24 10,707.00 -2,834.24 -26.47 18,488.00
5949-9999 INSURANCE EXPENSE 1,313.44 1,602.00 288.56 18.01 9,566.13 10,144.00 577.87 5.70 18,154.00
5999-9000 PROPERTY TAX EXPENSE 12,045.42 7,983.00 -4,062.42 -50.89 64,259.87 59,819.00 -4,440.87 -7.42 99,984.00
5999-9500 TOTAL OPERATING EXPENSE 26,775.87 24,683.00 -2,092.87 -8.48 173,594.04 176,807.00 3,212.96 1.82 285,014.00
5999-9999 TOTAL OPERATING INCOME 23,856.92 28,996.00 -5,139.08 -17.72 157,531.30 206,154.00 -48,622.70 -23.59 375,849.00
6000-0100 REPAIRS & MAINTENANCE-NON RECOVERABLE
6099-9999 TOTAL REPAIRS & MAINTENANCE-NON RECOVERABLE 0.00 0.00 0.00 N/A 456.28 400.00 -56.28 -14.07 800.00
6400-0000 UTILITIES-NON RECOVERABLE
6499-9999 TOTAL UTILITIES EXPENSE-NON RECOVERABLE 79.98 325.00 245.02 75.39 1,238.98 1,750.00 511.02 29.20 3,200.00
6610-0000 ADMINISTRATIVE EXPENSE-NON RECOVERABLE
6699-9999 TOTAL ADMINISTRATIVE EXPENSE-NON RECOVERABLE 1,727.70 2,425.00 697.30 28.75 23,835.50 14,415.00 -9,420.50 -65.35 21,880.00
6700-0000 LEASING & MARKETING EXPENSE-NON RECOVERABLE
6799-9999 TOTAL LEASING & MARKETING EXPENSE-NON RECOVERABLE 0.00 0.00 0.00 N/A -25.46 0.00 25.46 N/A 1,207.00
Description
International Corp Park III (8524-ds)
Budget Comparison Cash FlowPeriod = Jul 2014
Book = Accrual ; Tree = ysi_cf_chi0
Straightline rent adjustments not budgeted.
No roof repairs.
Fire alarm system repairs.
Property Tax Consulting Fees.
Page 1 of 2

8/8/2014 2:41 PM
PTD Actual PTD Budget Variance % Var YTD Actual YTD Budget Variance % Var Annual Description
International Corp Park III (8524-ds)
Budget Comparison Cash FlowPeriod = Jul 2014
Book = Accrual ; Tree = ysi_cf_chi0
6999-9999 TOTAL NON RECOVERABLE EXPENSE 1,807.68 2,750.00 942.32 34.27 25,505.30 16,565.00 -8,940.30 -53.97 27,087.00
7000-0000 DEBT SERVICE & AFTER DEBT
7999-9999 TOTAL DEBT SERVICE & AFTER DEBT 31,574.53 32,320.00 745.47 2.31 215,782.24 217,879.00 2,096.76 0.96 379,701.00
8000-0000 OTHER INCOME/EXPENSE
8999-9999 TOTAL OTHER INCOME/EXPENSE 0.00 1,324.00 1,324.00 100.00 8,448.30 9,268.00 819.70 8.84 15,888.00
9000-0000 DEPRECIATION & AMORTIZATION
9699-9999 TOTAL DEPR & AMORT EXPENSE 13,585.88 0.00 -13,585.88 N/A 121,789.01 0.00 -121,789.01 N/A 0.00
9800-0000 NET INCOME/(LOSS) -23,111.17 -7,398.00 -15,713.17 -212.40 -213,993.55 -37,558.00 -176,435.55 -469.77 -46,827.00
ADJUSTMENTS
TOTAL ADJUSTMENTS -1,175.94 -7,020.00 5,844.06 83.25 152,108.58 -195,353.00 347,461.58 177.86 -195,353.00
CASH FLOW -24,287.11 -14,418.00 -9,869.11 -68.45 -61,884.97 -232,911.00 171,026.03 73.43 -242,180.00
Not Budgeted.
Page 2 of 2

8/8/2014 2:41 PM
PTD Actual PTD Budget Variance % Var YTD Actual YTD Budget Variance % Var Annual
4000-0000 REVENUE
4299-9999 RENT REVENUE 40,634.78 43,680.00 -3,045.22 -6.97 310,010.04 334,437.00 -24,426.96 -7.30 570,702.00
4399-9999 REIMBURSEABLE EXP INCOME 14,785.50 15,925.00 -1,139.50 -7.16 114,035.40 118,594.00 -4,558.60 -3.84 201,047.00
4499-9999 REIMB EXP INCOME-PRIOR YEAR 0.00 0.00 0.00 N/A 5,695.40 44,467.00 -38,771.60 -87.19 44,467.00
4999-5999 OTHER REVENUE 0.23 0.00 0.23 N/A 2.88 0.00 2.88 N/A 0.00
4999-9999 TOTAL REVENUE 55,420.51 59,605.00 -4,184.49 -7.02 429,743.72 497,498.00 -67,754.28 -13.62 816,216.00
5000-0000 RECOVERABLE EXPENSES
5099-9999 REPAIRS & MAINTENANCE EXPENSE 2,320.70 2,012.00 -308.70 -15.34 16,575.33 13,215.00 -3,360.33 -25.43 18,457.00
5199-9999 LANDSCAPE EXPENSE 1,303.66 1,075.00 -228.66 -21.27 13,164.90 13,088.00 -76.90 -0.59 18,026.00
5299-9999 CLEANING EXPENSE 2,267.41 1,846.00 -421.41 -22.83 15,124.38 14,286.00 -838.38 -5.87 24,880.00
5499-9999 UTILITIES EXPENSE 2,404.69 3,177.00 772.31 24.31 15,358.85 16,646.00 1,287.15 7.73 28,759.00
5599-9999 PARKING & GARAGE EXPENSE 108.25 108.00 -0.25 -0.23 982.75 26,488.00 25,505.25 96.29 27,028.00
5600-9999 MANAGEMENT FEE EXPENSE 1,528.71 1,788.00 259.29 14.50 14,945.11 14,884.00 -61.11 -0.41 24,445.00
5699-9999 ADMINISTRATIVE EXPENSE 1,283.06 1,023.00 -260.06 -25.42 14,643.06 13,374.00 -1,269.06 -9.49 18,974.00
5899-9999 RETAIL EXPENSE 0.00 0.00 0.00 N/A 45.00 0.00 -45.00 N/A 0.00
5949-9999 INSURANCE EXPENSE 913.31 1,114.00 200.69 18.02 6,651.82 7,053.00 401.18 5.69 12,623.00
5999-9000 PROPERTY TAX EXPENSE 10,614.33 10,364.00 -250.33 -2.42 75,800.02 75,286.00 -514.02 -0.68 127,356.00
5999-9500 TOTAL OPERATING EXPENSE 22,744.12 22,507.00 -237.12 -1.05 173,291.22 194,320.00 21,028.78 10.82 300,548.00
5999-9999 TOTAL OPERATING INCOME 32,676.39 37,098.00 -4,421.61 -11.92 256,452.50 303,178.00 -46,725.50 -15.41 515,668.00
6000-0100 REPAIRS & MAINTENANCE-NON RECOVERABLE
6099-9999 TOTAL REPAIRS & MAINTENANCE-NON RECOVERABLE 115.29 187.00 71.71 38.35 958.56 1,261.00 302.44 23.98 1,800.00
6400-0000 UTILITIES-NON RECOVERABLE
6499-9999 TOTAL UTILITIES EXPENSE-NON RECOVERABLE 0.00 425.00 425.00 100.00 0.00 3,075.00 3,075.00 100.00 5,425.00
6610-0000 ADMINISTRATIVE EXPENSE-NON RECOVERABLE
6699-9999 TOTAL ADMINISTRATIVE EXPENSE-NON RECOVERABLE 1,322.21 1,167.00 -155.21 -13.30 6,804.19 6,721.00 -83.19 -1.24 11,108.00
6700-0000 LEASING & MARKETING EXPENSE-NON RECOVERABLE
6799-9999 TOTAL LEASING & MARKETING EXPENSE-NON RECOVERABLE 0.00 0.00 0.00 N/A 0.00 0.00 0.00 N/A 840.00
6999-9999 TOTAL NON RECOVERABLE EXPENSE 1,437.50 1,779.00 341.50 19.20 7,762.75 11,057.00 3,294.25 29.79 19,173.00
Straightline rent adjustments not budgeted.
Roof Repairs.
Description
Sterling Tech Center (8525-ds)
Budget Comparison Cash Flow
Period = Jul 2014
Book = Accrual ; Tree = ysi_cf_chi0
Page 1 of 2

8/8/2014 2:41 PM
PTD Actual PTD Budget Variance % Var YTD Actual YTD Budget Variance % Var Annual Description
Sterling Tech Center (8525-ds)
Budget Comparison Cash Flow
Period = Jul 2014
Book = Accrual ; Tree = ysi_cf_chi0
7000-0000 DEBT SERVICE & AFTER DEBT
7999-9999 TOTAL DEBT SERVICE & AFTER DEBT 21,955.48 22,473.00 517.52 2.30 150,045.07 151,499.00 1,453.93 0.96 264,019.00
8000-0000 OTHER INCOME/EXPENSE
8999-9999 TOTAL OTHER INCOME/EXPENSE 0.00 921.00 921.00 100.00 5,879.58 6,447.00 567.42 8.80 11,052.00
9000-0000 DEPRECIATION & AMORTIZATION
9699-9999 TOTAL DEPR & AMORT EXPENSE 18,541.30 0.00 -18,541.30 N/A 143,564.86 0.00 -143,564.86 N/A 0.00
9800-0000 NET INCOME/(LOSS) -9,257.89 11,925.00 -21,182.89 -177.63 -50,799.76 134,175.00 -184,974.76 -137.86 221,424.00
ADJUSTMENTS
TOTAL ADJUSTMENTS 23,382.74 0.00 23,382.74 N/A 157,809.88 -194,863.00 352,672.88 180.98 -285,753.00
CASH FLOW 14,124.85 11,925.00 2,199.85 18.45 107,010.12 -60,688.00 167,698.12 276.33 -64,329.00
Not Budgeted.
Page 2 of 2

8/8/2014 2:42 PM
PTD Actual PTD Budget Variance % Var YTD Actual YTD Budget Variance % Var Annual
4000-0000 REVENUE
4299-9999 RENT REVENUE 28,820.23 28,915.00 -94.77 -0.33 166,828.44 180,015.00 -13,186.56 -7.33 311,548.00
4399-9999 REIMBURSEABLE EXP INCOME 12,011.92 15,955.00 -3,943.08 -24.71 84,083.44 91,970.00 -7,886.56 -8.58 175,221.00
4499-9999 REIMB EXP INCOME-PRIOR YEAR 0.00 0.00 0.00 N/A 18,047.31 -6,985.00 25,032.31 358.37 -6,985.00
4999-5999 OTHER REVENUE 925.25 925.00 0.25 0.03 6,478.08 6,475.00 3.08 0.05 11,100.00
4999-9999 TOTAL REVENUE 41,757.40 45,795.00 -4,037.60 -8.82 275,437.27 271,475.00 3,962.27 1.46 490,884.00
5000-0000 RECOVERABLE EXPENSES
5099-9999 REPAIRS & MAINTENANCE EXPENSE 525.47 1,880.00 1,354.53 72.05 17,903.70 14,152.00 -3,751.70 -26.51 23,579.00
5199-9999 LANDSCAPE EXPENSE 1,231.40 1,581.00 349.60 22.11 10,694.97 11,689.00 994.03 8.50 18,809.00
5299-9999 CLEANING EXPENSE 2,727.52 2,200.00 -527.52 -23.98 17,766.49 17,270.00 -496.49 -2.87 30,140.00
5399-9999 SECURITY/SAFETY EXPENSE 576.09 617.00 40.91 6.63 3,706.31 3,959.00 252.69 6.38 8,964.00
5499-9999 UTILITIES EXPENSE 2,343.50 2,360.00 16.50 0.70 14,866.60 13,084.00 -1,782.60 -13.62 20,184.00
5599-9999 PARKING & GARAGE EXPENSE 77.94 78.00 0.06 0.08 725.58 8,325.00 7,599.42 91.28 8,715.00
5600-9999 MANAGEMENT FEE EXPENSE 1,842.22 1,291.00 -551.22 -42.70 9,522.71 7,563.00 -1,959.71 -25.91 13,504.00
5699-9999 ADMINISTRATIVE EXPENSE 1,354.71 1,082.00 -272.71 -25.20 9,370.72 8,046.00 -1,324.72 -16.46 19,108.00
5949-9999 INSURANCE EXPENSE 1,231.22 1,426.00 194.78 13.66 8,794.59 9,187.00 392.41 4.27 16,317.00
5999-9000 PROPERTY TAX EXPENSE 9,237.00 8,987.00 -250.00 -2.78 66,359.63 66,080.00 -279.63 -0.42 111,015.00
5999-9500 TOTAL OPERATING EXPENSE 21,147.07 21,502.00 354.93 1.65 159,711.30 159,355.00 -356.30 -0.22 270,335.00
5999-9999 TOTAL OPERATING INCOME 20,610.33 24,293.00 -3,682.67 -15.16 115,725.97 112,120.00 3,605.97 3.22 220,549.00
6000-0100 REPAIRS & MAINTENANCE-NON RECOVERABLE
6099-9999 TOTAL REPAIRS & MAINTENANCE-NON RECOVERABLE 0.00 150.00 150.00 100.00 1,032.89 920.00 -112.89 -12.27 1,305.00
6400-0000 UTILITIES-NON RECOVERABLE
6499-9999 TOTAL UTILITIES EXPENSE-NON RECOVERABLE 414.78 687.00 272.22 39.62 12,629.58 6,042.00 -6,587.58 -109.03 10,495.00
6610-0000 ADMINISTRATIVE EXPENSE-NON RECOVERABLE
6699-9999 TOTAL ADMINISTRATIVE EXPENSE-NON RECOVERABLE 957.56 1,358.00 400.44 29.49 12,945.44 9,686.00 -3,259.44 -33.65 16,596.00
6700-0000 LEASING & MARKETING EXPENSE-NON RECOVERABLE
6799-9999 TOTAL LEASING & MARKETING EXPENSE-NON RECOVERABLE 0.00 0.00 0.00 N/A -40.00 0.00 40.00 N/A 895.00
Straightline rent adjustments not budgeted.
Description
Dallas Tech Center (8526-ds)
Budget Comparison Cash FlowPeriod = Jul 2014
Book = Accrual ; Tree = ysi_cf_chi0
Page 1 of 2

8/8/2014 2:42 PM
PTD Actual PTD Budget Variance % Var YTD Actual YTD Budget Variance % Var Annual Description
Dallas Tech Center (8526-ds)
Budget Comparison Cash FlowPeriod = Jul 2014
Book = Accrual ; Tree = ysi_cf_chi0
6999-9999 TOTAL NON RECOVERABLE EXPENSE 1,372.34 2,195.00 822.66 37.48 26,567.91 16,648.00 -9,919.91 -59.59 29,291.00
7000-0000 DEBT SERVICE & AFTER DEBT
7999-9999 TOTAL DEBT SERVICE & AFTER DEBT 23,426.04 23,983.00 556.96 2.32 160,094.95 161,680.00 1,585.05 0.98 281,763.00
8000-0000 OTHER INCOME/EXPENSE
8999-9999 TOTAL OTHER INCOME/EXPENSE 0.00 1,000.00 1,000.00 100.00 6,220.90 7,000.00 779.10 11.13 12,000.00
9000-0000 DEPRECIATION & AMORTIZATION
9699-9999 TOTAL DEPR & AMORT EXPENSE 17,322.11 0.00 -17,322.11 N/A 121,751.81 0.00 -121,751.81 N/A 0.00
9800-0000 NET INCOME/(LOSS) -21,510.16 -2,885.00 -18,625.16 -645.59 -198,909.60 -73,208.00 -125,701.60 -171.70 -102,505.00
ADJUSTMENTS
TOTAL ADJUSTMENTS 46,724.31 -9,526.00 56,250.31 590.49 97,922.78 -304,626.00 402,548.78 132.15 -489,785.00
CASH FLOW 25,214.15 -12,411.00 37,625.15 303.16 -100,986.82 -377,834.00 276,847.18 73.27 -592,290.00
Not Budgeted.
Page 2 of 2
8/8/2014 2:42 PM
PTD Actual PTD Budget Variance % Var YTD Actual YTD Budget Variance % Var Annual
4000-0000 REVENUE
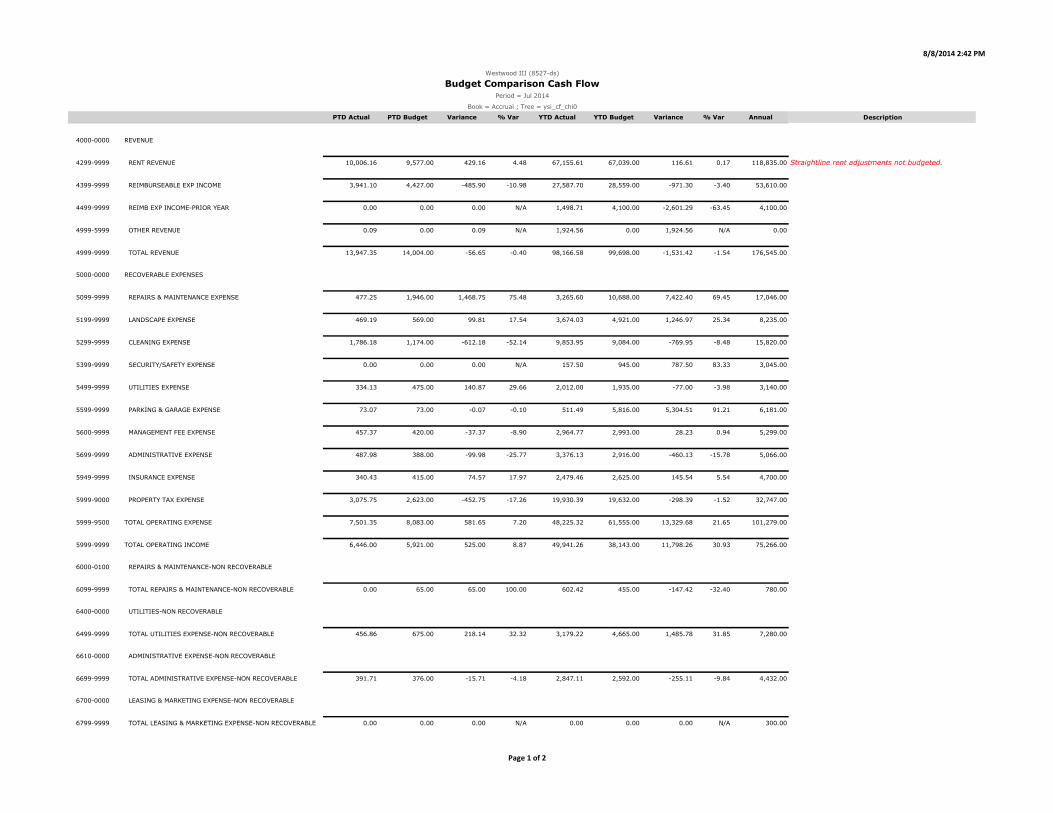
4299-9999 RENT REVENUE 10,006.16 9,577.00 429.16 4.48 67,155.61 67,039.00 116.61 0.17 118,835.00 Straightline rent adjustments not budgeted.
4399-9999 REIMBURSEABLE EXP INCOME 3,941.10 4,427.00 -485.90 -10.98 27,587.70 28,559.00 -971.30 -3.40 53,610.00
4499-9999 REIMB EXP INCOME-PRIOR YEAR 0.00 0.00 0.00 N/A 1,498.71 4,100.00 -2,601.29 -63.45 4,100.00
4999-5999 OTHER REVENUE 0.09 0.00 0.09 N/A 1,924.56 0.00 1,924.56 N/A 0.00
4999-9999 TOTAL REVENUE 13,947.35 14,004.00 -56.65 -0.40 98,166.58 99,698.00 -1,531.42 -1.54 176,545.00
5000-0000 RECOVERABLE EXPENSES
5099-9999 REPAIRS & MAINTENANCE EXPENSE 477.25 1,946.00 1,468.75 75.48 3,265.60 10,688.00 7,422.40 69.45 17,046.00
5199-9999 LANDSCAPE EXPENSE 469.19 569.00 99.81 17.54 3,674.03 4,921.00 1,246.97 25.34 8,235.00
5299-9999 CLEANING EXPENSE 1,786.18 1,174.00 -612.18 -52.14 9,853.95 9,084.00 -769.95 -8.48 15,820.00
5399-9999 SECURITY/SAFETY EXPENSE 0.00 0.00 0.00 N/A 157.50 945.00 787.50 83.33 3,045.00
5499-9999 UTILITIES EXPENSE 334.13 475.00 140.87 29.66 2,012.00 1,935.00 -77.00 -3.98 3,140.00
5599-9999 PARKING & GARAGE EXPENSE 73.07 73.00 -0.07 -0.10 511.49 5,816.00 5,304.51 91.21 6,181.00
5600-9999 MANAGEMENT FEE EXPENSE 457.37 420.00 -37.37 -8.90 2,964.77 2,993.00 28.23 0.94 5,299.00
5699-9999 ADMINISTRATIVE EXPENSE 487.98 388.00 -99.98 -25.77 3,376.13 2,916.00 -460.13 -15.78 5,066.00
5949-9999 INSURANCE EXPENSE 340.43 415.00 74.57 17.97 2,479.46 2,625.00 145.54 5.54 4,700.00
5999-9000 PROPERTY TAX EXPENSE 3,075.75 2,623.00 -452.75 -17.26 19,930.39 19,632.00 -298.39 -1.52 32,747.00
5999-9500 TOTAL OPERATING EXPENSE 7,501.35 8,083.00 581.65 7.20 48,225.32 61,555.00 13,329.68 21.65 101,279.00
5999-9999 TOTAL OPERATING INCOME 6,446.00 5,921.00 525.00 8.87 49,941.26 38,143.00 11,798.26 30.93 75,266.00
6000-0100 REPAIRS & MAINTENANCE-NON RECOVERABLE
6099-9999 TOTAL REPAIRS & MAINTENANCE-NON RECOVERABLE 0.00 65.00 65.00 100.00 602.42 455.00 -147.42 -32.40 780.00
6400-0000 UTILITIES-NON RECOVERABLE
6499-9999 TOTAL UTILITIES EXPENSE-NON RECOVERABLE 456.86 675.00 218.14 32.32 3,179.22 4,665.00 1,485.78 31.85 7,280.00
6610-0000 ADMINISTRATIVE EXPENSE-NON RECOVERABLE
6699-9999 TOTAL ADMINISTRATIVE EXPENSE-NON RECOVERABLE 391.71 376.00 -15.71 -4.18 2,847.11 2,592.00 -255.11 -9.84 4,432.00
6700-0000 LEASING & MARKETING EXPENSE-NON RECOVERABLE
6799-9999 TOTAL LEASING & MARKETING EXPENSE-NON RECOVERABLE 0.00 0.00 0.00 N/A 0.00 0.00 0.00 N/A 300.00
Description
Westwood III (8527-ds)
Budget Comparison Cash FlowPeriod = Jul 2014
Book = Accrual ; Tree = ysi_cf_chi0
Page 1 of 2
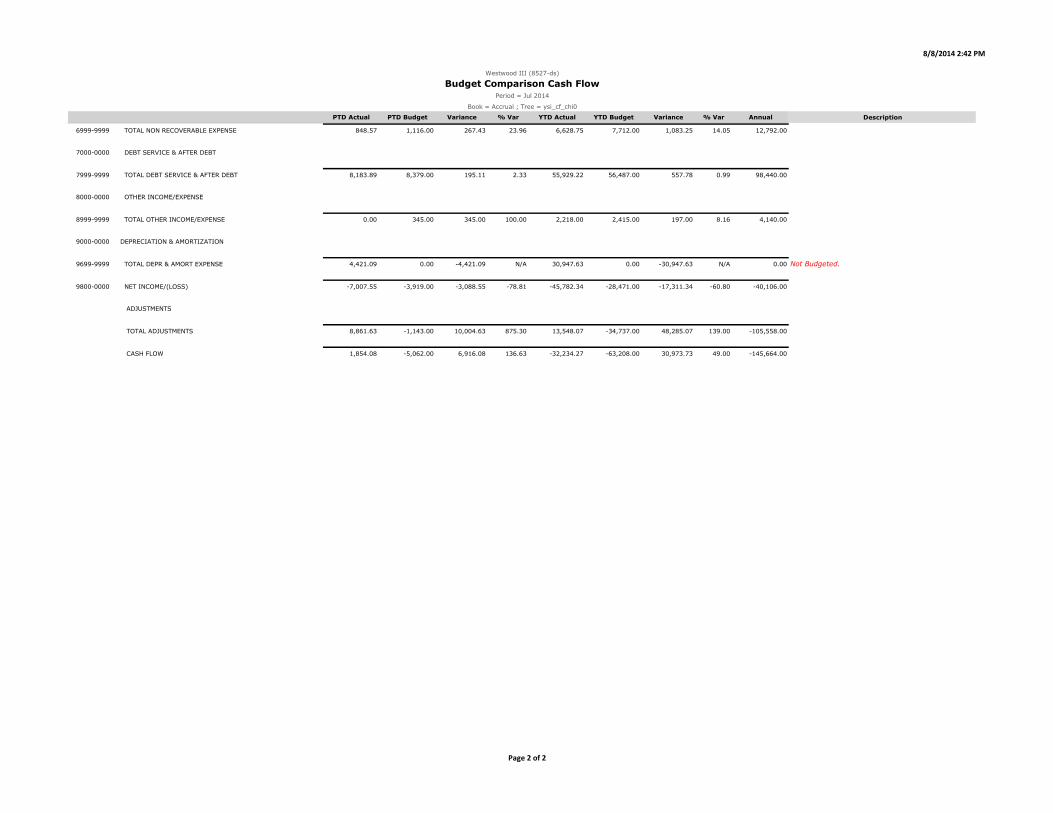
8/8/2014 2:42 PM
PTD Actual PTD Budget Variance % Var YTD Actual YTD Budget Variance % Var Annual Description
Westwood III (8527-ds)
Budget Comparison Cash FlowPeriod = Jul 2014
Book = Accrual ; Tree = ysi_cf_chi0
6999-9999 TOTAL NON RECOVERABLE EXPENSE 848.57 1,116.00 267.43 23.96 6,628.75 7,712.00 1,083.25 14.05 12,792.00
7000-0000 DEBT SERVICE & AFTER DEBT
7999-9999 TOTAL DEBT SERVICE & AFTER DEBT 8,183.89 8,379.00 195.11 2.33 55,929.22 56,487.00 557.78 0.99 98,440.00
8000-0000 OTHER INCOME/EXPENSE
8999-9999 TOTAL OTHER INCOME/EXPENSE 0.00 345.00 345.00 100.00 2,218.00 2,415.00 197.00 8.16 4,140.00
9000-0000 DEPRECIATION & AMORTIZATION
9699-9999 TOTAL DEPR & AMORT EXPENSE 4,421.09 0.00 -4,421.09 N/A 30,947.63 0.00 -30,947.63 N/A 0.00 Not Budgeted.
9800-0000 NET INCOME/(LOSS) -7,007.55 -3,919.00 -3,088.55 -78.81 -45,782.34 -28,471.00 -17,311.34 -60.80 -40,106.00
ADJUSTMENTS
TOTAL ADJUSTMENTS 8,861.63 -1,143.00 10,004.63 875.30 13,548.07 -34,737.00 48,285.07 139.00 -105,558.00
CASH FLOW 1,854.08 -5,062.00 6,916.08 136.63 -32,234.27 -63,208.00 30,973.73 49.00 -145,664.00
Page 2 of 2

8/8/2014 2:42 PM
PTD Actual PTD Budget Variance % Var YTD Actual YTD Budget Variance % Var Annual
4000-0000 REVENUE
4299-9999 RENT REVENUE 10,086.36 11,435.00 -1,348.64 -11.79 70,604.52 80,045.00 -9,440.48 -11.79 139,335.00 Straightline rent adjustments not budgeted.
4399-9999 REIMBURSEABLE EXP INCOME 4,180.64 4,181.00 -0.36 -0.01 29,264.48 29,267.00 -2.52 -0.01 65,852.00
4499-9999 REIMB EXP INCOME-PRIOR YEAR 0.00 0.00 0.00 N/A 3,109.98 -4,176.00 7,285.98 174.47 -4,176.00
4999-5999 OTHER REVENUE 0.12 0.00 0.12 N/A 1.46 0.00 1.46 N/A 0.00
4999-9999 TOTAL REVENUE 14,267.12 15,616.00 -1,348.88 -8.64 102,980.44 105,136.00 -2,155.56 -2.05 201,011.00
5000-0000 RECOVERABLE EXPENSES
5099-9999 REPAIRS & MAINTENANCE EXPENSE 1,297.44 714.00 -583.44 -81.71 8,071.18 5,686.00 -2,385.18 -41.95 9,715.00 Main sewer line repairs.
5199-9999 LANDSCAPE EXPENSE 1,482.35 598.00 -884.35 -147.88 4,966.76 6,707.00 1,740.24 25.95 10,282.00 Two months service plus color change.
5299-9999 CLEANING EXPENSE 433.00 0.00 -433.00 N/A 433.00 866.00 433.00 50.00 1,732.00
5399-9999 SECURITY/SAFETY EXPENSE 37.86 200.00 162.14 81.07 2,630.08 1,810.00 -820.08 -45.31 4,120.00
5499-9999 UTILITIES EXPENSE 721.11 945.00 223.89 23.69 3,464.16 3,940.00 475.84 12.08 6,173.00
5599-9999 PARKING & GARAGE EXPENSE 103.92 104.00 0.08 0.08 727.44 728.00 0.56 0.08 1,248.00
5600-9999 MANAGEMENT FEE EXPENSE 468.45 468.00 -0.45 -0.10 3,264.83 3,151.00 -113.83 -3.61 6,028.00
5699-9999 ADMINISTRATIVE EXPENSE 632.38 511.00 -121.38 -23.75 4,393.43 3,777.00 -616.43 -16.32 6,692.00
5949-9999 INSURANCE EXPENSE 512.80 609.00 96.20 15.80 3,715.85 3,883.00 167.15 4.30 6,928.00
5999-9000 PROPERTY TAX EXPENSE 6,148.00 3,529.00 -2,619.00 -74.21 28,845.34 27,803.00 -1,042.34 -3.75 45,448.00 Property Tax Consulting Fees.
5999-9500 TOTAL OPERATING EXPENSE 11,837.31 7,678.00 -4,159.31 -54.17 60,512.07 58,351.00 -2,161.07 -3.70 98,366.00
5999-9999 TOTAL OPERATING INCOME 2,429.81 7,938.00 -5,508.19 -69.39 42,468.37 46,785.00 -4,316.63 -9.23 102,645.00
6000-0100 REPAIRS & MAINTENANCE-NON RECOVERABLE
6099-9999 TOTAL REPAIRS & MAINTENANCE-NON RECOVERABLE 676.56 0.00 -676.56 N/A 3,762.78 1,850.00 -1,912.78 -103.39 1,850.00
6610-0000 ADMINISTRATIVE EXPENSE-NON RECOVERABLE
6699-9999 TOTAL ADMINISTRATIVE EXPENSE-NON RECOVERABLE 480.69 533.00 52.31 9.81 3,239.82 3,531.00 291.18 8.25 5,996.00
6700-0000 LEASING & MARKETING EXPENSE-NON RECOVERABLE
6799-9999 TOTAL LEASING & MARKETING EXPENSE-NON RECOVERABLE 0.00 0.00 0.00 N/A 140.78 500.00 359.22 71.84 500.00
6999-9999 TOTAL NON RECOVERABLE EXPENSE 1,157.25 533.00 -624.25 -117.12 7,143.38 5,881.00 -1,262.38 -21.47 8,346.00
7000-0000 DEBT SERVICE & AFTER DEBT
7999-9999 TOTAL DEBT SERVICE & AFTER DEBT 11,149.64 11,429.00 279.36 2.44 76,197.27 77,046.00 848.73 1.10 134,269.00
Description
Valwood XII (8528-ds)
Budget Comparison Cash Flow
Period = Jul 2014
Book = Accrual ; Tree = ysi_cf_chi0
Page 1 of 2

8/8/2014 2:42 PM
PTD Actual PTD Budget Variance % Var YTD Actual YTD Budget Variance % Var Annual Description
Valwood XII (8528-ds)
Budget Comparison Cash Flow
Period = Jul 2014
Book = Accrual ; Tree = ysi_cf_chi0
8000-0000 OTHER INCOME/EXPENSE
8999-9999 TOTAL OTHER INCOME/EXPENSE 0.00 456.00 456.00 100.00 2,894.10 3,192.00 297.90 9.33 5,472.00
9000-0000 DEPRECIATION & AMORTIZATION
9699-9999 TOTAL DEPR & AMORT EXPENSE 6,493.51 0.00 -6,493.51 N/A 47,879.99 0.00 -47,879.99 N/A 0.00 Not Budgeted.
9800-0000 NET INCOME/(LOSS) -16,370.59 -4,480.00 -11,890.59 -265.42 -91,646.37 -39,334.00 -52,312.37 -133.00 -45,442.00
ADJUSTMENTS
TOTAL ADJUSTMENTS 13,444.96 0.00 13,444.96 N/A 32,011.32 0.00 32,011.32 N/A -15,426.00
CASH FLOW -2,925.63 -4,480.00 1,554.37 34.70 -59,635.05 -39,334.00 -20,301.05 -51.61 -60,868.00
Page 2 of 2
8/8/2014 2:43 PM
PTD Actual PTD Budget Variance % Var YTD Actual YTD Budget Variance % Var Annual
4000-0000 REVENUE
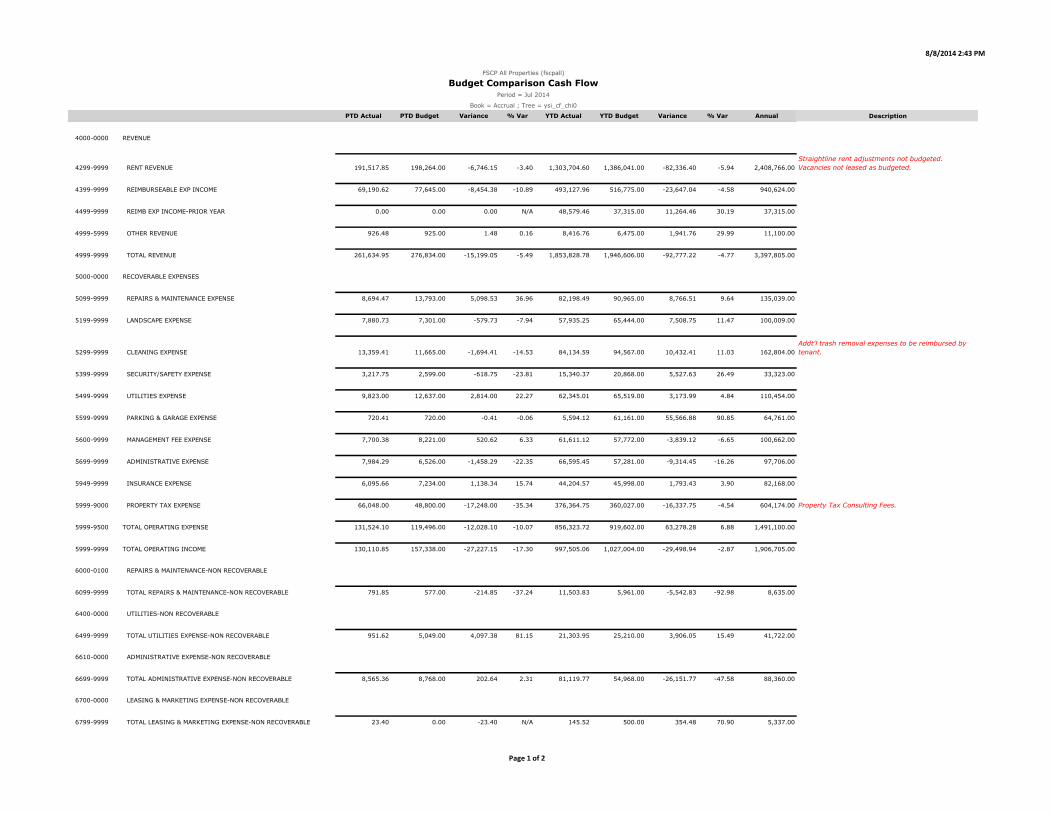
4299-9999 RENT REVENUE 191,517.85 198,264.00 -6,746.15 -3.40 1,303,704.60 1,386,041.00 -82,336.40 -5.94 2,408,766.00
4399-9999 REIMBURSEABLE EXP INCOME 69,190.62 77,645.00 -8,454.38 -10.89 493,127.96 516,775.00 -23,647.04 -4.58 940,624.00
4499-9999 REIMB EXP INCOME-PRIOR YEAR 0.00 0.00 0.00 N/A 48,579.46 37,315.00 11,264.46 30.19 37,315.00
4999-5999 OTHER REVENUE 926.48 925.00 1.48 0.16 8,416.76 6,475.00 1,941.76 29.99 11,100.00
4999-9999 TOTAL REVENUE 261,634.95 276,834.00 -15,199.05 -5.49 1,853,828.78 1,946,606.00 -92,777.22 -4.77 3,397,805.00
5000-0000 RECOVERABLE EXPENSES
5099-9999 REPAIRS & MAINTENANCE EXPENSE 8,694.47 13,793.00 5,098.53 36.96 82,198.49 90,965.00 8,766.51 9.64 135,039.00
5199-9999 LANDSCAPE EXPENSE 7,880.73 7,301.00 -579.73 -7.94 57,935.25 65,444.00 7,508.75 11.47 100,009.00
5299-9999 CLEANING EXPENSE 13,359.41 11,665.00 -1,694.41 -14.53 84,134.59 94,567.00 10,432.41 11.03 162,804.00
5399-9999 SECURITY/SAFETY EXPENSE 3,217.75 2,599.00 -618.75 -23.81 15,340.37 20,868.00 5,527.63 26.49 33,323.00
5499-9999 UTILITIES EXPENSE 9,823.00 12,637.00 2,814.00 22.27 62,345.01 65,519.00 3,173.99 4.84 110,454.00
5599-9999 PARKING & GARAGE EXPENSE 720.41 720.00 -0.41 -0.06 5,594.12 61,161.00 55,566.88 90.85 64,761.00
5600-9999 MANAGEMENT FEE EXPENSE 7,700.38 8,221.00 520.62 6.33 61,611.12 57,772.00 -3,839.12 -6.65 100,662.00
5699-9999 ADMINISTRATIVE EXPENSE 7,984.29 6,526.00 -1,458.29 -22.35 66,595.45 57,281.00 -9,314.45 -16.26 97,706.00
5949-9999 INSURANCE EXPENSE 6,095.66 7,234.00 1,138.34 15.74 44,204.57 45,998.00 1,793.43 3.90 82,168.00
5999-9000 PROPERTY TAX EXPENSE 66,048.00 48,800.00 -17,248.00 -35.34 376,364.75 360,027.00 -16,337.75 -4.54 604,174.00
5999-9500 TOTAL OPERATING EXPENSE 131,524.10 119,496.00 -12,028.10 -10.07 856,323.72 919,602.00 63,278.28 6.88 1,491,100.00
5999-9999 TOTAL OPERATING INCOME 130,110.85 157,338.00 -27,227.15 -17.30 997,505.06 1,027,004.00 -29,498.94 -2.87 1,906,705.00
6000-0100 REPAIRS & MAINTENANCE-NON RECOVERABLE
6099-9999 TOTAL REPAIRS & MAINTENANCE-NON RECOVERABLE 791.85 577.00 -214.85 -37.24 11,503.83 5,961.00 -5,542.83 -92.98 8,635.00
6400-0000 UTILITIES-NON RECOVERABLE
6499-9999 TOTAL UTILITIES EXPENSE-NON RECOVERABLE 951.62 5,049.00 4,097.38 81.15 21,303.95 25,210.00 3,906.05 15.49 41,722.00
6610-0000 ADMINISTRATIVE EXPENSE-NON RECOVERABLE
6699-9999 TOTAL ADMINISTRATIVE EXPENSE-NON RECOVERABLE 8,565.36 8,768.00 202.64 2.31 81,119.77 54,968.00 -26,151.77 -47.58 88,360.00
6700-0000 LEASING & MARKETING EXPENSE-NON RECOVERABLE
6799-9999 TOTAL LEASING & MARKETING EXPENSE-NON RECOVERABLE 23.40 0.00 -23.40 N/A 145.52 500.00 354.48 70.90 5,337.00
FSCP All Properties (fscpall)
Budget Comparison Cash Flow
Period = Jul 2014
Book = Accrual ; Tree = ysi_cf_chi0
Straightline rent adjustments not budgeted.
Vacancies not leased as budgeted.
Addt'l trash removal expenses to be reimbursed by
tenant.
Property Tax Consulting Fees.
Description
Page 1 of 2
8/8/2014 2:43 PM
PTD Actual PTD Budget Variance % Var YTD Actual YTD Budget Variance % Var Annual
FSCP All Properties (fscpall)
Budget Comparison Cash Flow
Period = Jul 2014
Book = Accrual ; Tree = ysi_cf_chi0
Description
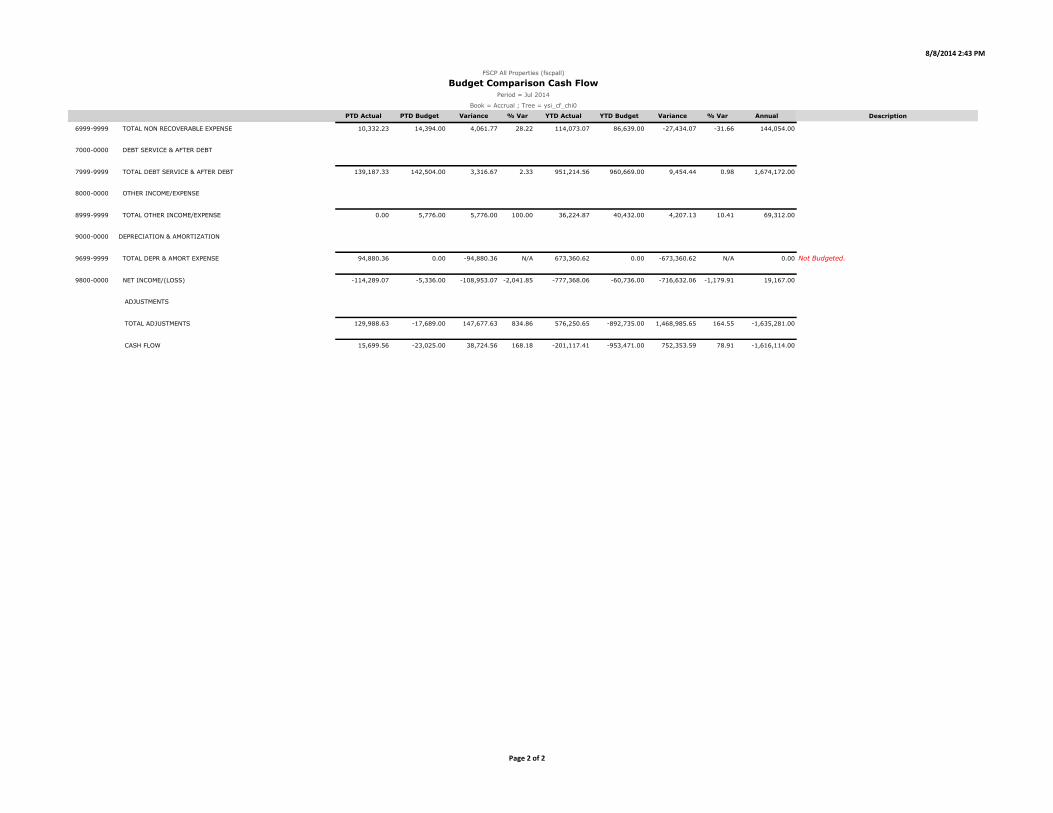
6999-9999 TOTAL NON RECOVERABLE EXPENSE 10,332.23 14,394.00 4,061.77 28.22 114,073.07 86,639.00 -27,434.07 -31.66 144,054.00
7000-0000 DEBT SERVICE & AFTER DEBT
7999-9999 TOTAL DEBT SERVICE & AFTER DEBT 139,187.33 142,504.00 3,316.67 2.33 951,214.56 960,669.00 9,454.44 0.98 1,674,172.00
8000-0000 OTHER INCOME/EXPENSE
8999-9999 TOTAL OTHER INCOME/EXPENSE 0.00 5,776.00 5,776.00 100.00 36,224.87 40,432.00 4,207.13 10.41 69,312.00
9000-0000 DEPRECIATION & AMORTIZATION
9699-9999 TOTAL DEPR & AMORT EXPENSE 94,880.36 0.00 -94,880.36 N/A 673,360.62 0.00 -673,360.62 N/A 0.00
9800-0000 NET INCOME/(LOSS) -114,289.07 -5,336.00 -108,953.07 -2,041.85 -777,368.06 -60,736.00 -716,632.06 -1,179.91 19,167.00
ADJUSTMENTS
TOTAL ADJUSTMENTS 129,988.63 -17,689.00 147,677.63 834.86 576,250.65 -892,735.00 1,468,985.65 164.55 -1,635,281.00
CASH FLOW 15,699.56 -23,025.00 38,724.56 168.18 -201,117.41 -953,471.00 752,353.59 78.91 -1,616,114.00
Not Budgeted.
Page 2 of 2

CAPITAL EXPENSES

PROPERTY
TENANT
IMPROVEMENTS STATUS COMMISSIONS TENANT/SUITE DESCRIPTION
DALLAS TECH $16,293.66 Modification Pending Coram Healthcare - Ste 102 DBM Services. Carpet installation being
rescheduled for August - Pending!
ICP II Renewal $1,830.00
(2nd Half)
UBSE - Stes 209/203 2nd Half expansion commission of $1,830.00 to
be paid upon TI completion and tenant move
into the space.
$86,000.00 Estimated UBSE - Stes 209/203 Pending! TI for renewal & expansion lease.
Work starting in July. Construction in progress!
ICP III $175,000.00 Estimated Mission Foods - Ste 400 Pending TI for new tenant. Application for
Building permit being reviewed by the City.
ICP III $18,743.40
(2nd Half Commission)
Mission Foods - Ste 400 1st half commission paid in July. 2nd half
commission to be paid upon TI completion and
tenant move-in.
CAPITAL EXPENSESJULY, 2014

DELINQUENCY STATUS REPORT

8/8/2014 12:38 PM
Charge Current 0-30 31-60 61-90 Over Pre- Total
Code Owed Owed Owed Owed 90 Owed payments Owed
8522-ds David H Nickerson Foundation Current C-1104079 oe 7/1/2014 Jul-14 12.80 12.80 0.00 0.00 0.00 0.00 12.80
David H Nickerson Foundation 12.80 12.80 0.00 0.00 0.00 0.00 12.80
8522-ds Glenda Cooper Past C-1040755 oe 11/1/2013 Dec-13 726.49 0.00 0.00 0.00 726.49 0.00 726.49
8522-ds Glenda Cooper Past C-1040756 irnt 11/1/2013 Dec-13 2,111.83 0.00 0.00 0.00 2,111.83 0.00 2,111.83
8522-ds Glenda Cooper Past C-1040757 oe 12/1/2013 Dec-13 726.49 0.00 0.00 0.00 726.49 0.00 726.49
8522-ds Glenda Cooper Past C-1040758 irnt 12/1/2013 Dec-13 2,111.83 0.00 0.00 0.00 2,111.83 0.00 2,111.83
8522-ds Glenda Cooper Past C-1041799 irnt 1/1/2014 Jan-14 2,111.83 0.00 0.00 0.00 2,111.83 0.00 2,111.83
8522-ds Glenda Cooper Past C-1041800 oe 1/1/2014 Jan-14 726.49 0.00 0.00 0.00 726.49 0.00 726.49
8522-ds Glenda Cooper Past C-1044069 irnt 2/1/2014 Feb-14 2,111.83 0.00 0.00 0.00 2,111.83 0.00 2,111.83
8522-ds Glenda Cooper Past C-1044070 oe 2/1/2014 Feb-14 726.49 0.00 0.00 0.00 726.49 0.00 726.49
Glenda Cooper 11,353.28 0.00 0.00 0.00 11,353.28 0.00 11,353.28
8522-ds Olympus America, Inc. Current C-1090222 pyoe 5/9/2014 May-14 -823.80 0.00 0.00 -823.80 0.00 0.00 -823.80
8522-ds Olympus America, Inc. Current R-551184 Prepay 6/2/2014 Jun-14 0.00 0.00 0.00 0.00 0.00 -802.22 -802.22
8522-ds Olympus America, Inc. Current C-1104064 irnt 7/1/2014 Jul-14 126.77 126.77 0.00 0.00 0.00 0.00 126.77
Olympus America, Inc. -697.03 126.77 0.00 -823.80 0.00 -802.22 -1,499.25
8522-ds Pacific Dental Services Current C-1090226 pyoe 5/9/2014 May-14 187.81 0.00 0.00 187.81 0.00 0.00 187.81
Pacific Dental Services 187.81 0.00 0.00 187.81 0.00 0.00 187.81
8522-ds Sitemax Telecom, LLC Current R-561207 Prepay 7/29/2014 Jul-14 0.00 0.00 0.00 0.00 0.00 -1,474.75 -1,474.75
Sitemax Telecom, LLC 0.00 0.00 0.00 0.00 0.00 -1,474.75 -1,474.75
8522-ds Square-One Business Machines LLC Current C-1088656 oe 5/1/2014 May-14 802.51 0.00 0.00 0.00 802.51 0.00 802.51
8522-ds Square-One Business Machines LLC Current C-1092589 oe 6/1/2014 Jun-14 802.51 0.00 802.51 0.00 0.00 0.00 802.51
8522-ds Square-One Business Machines LLC Current C-1104085 oe 7/1/2014 Jul-14 802.51 802.51 0.00 0.00 0.00 0.00 802.51
Square-One Business Machines LLC 2,407.53 802.51 802.51 0.00 802.51 0.00 2,407.53
8522-ds Walgreens #906-1 Current C-1041678 irnt 5/31/2011 Dec-13 -8,811.31 0.00 0.00 0.00 -8,811.31 0.00 -8,811.31
8522-ds Walgreens #906-1 Current C-1041679 pyoe 3/15/2012 Dec-13 -828.95 0.00 0.00 0.00 -828.95 0.00 -828.95
8522-ds Walgreens #906-1 Current C-1040743 oe 12/1/2012 Dec-13 113.05 0.00 0.00 0.00 113.05 0.00 113.05
8522-ds Walgreens #906-1 Current C-1040744 oe 1/1/2013 Dec-13 113.05 0.00 0.00 0.00 113.05 0.00 113.05
8522-ds Walgreens #906-1 Current C-1040745 oe 2/1/2013 Dec-13 113.05 0.00 0.00 0.00 113.05 0.00 113.05
8522-ds Walgreens #906-1 Current C-1040746 oe 3/1/2013 Dec-13 113.05 0.00 0.00 0.00 113.05 0.00 113.05
8522-ds Walgreens #906-1 Current C-1040747 oe 4/1/2013 Dec-13 113.05 0.00 0.00 0.00 113.05 0.00 113.05
Olympus America, Inc. (olym8522)
Aging DetailDB Caption: COLLIERS USA * * * LIVE * * * Property: fscpall Status: Current, Past, Future Age As Of: 07/31/2014 Post To: 07/2014
Property Customer Lease Status Tran# Date Month
Counterpoint (8522-ds)
David H Nickerson Foundation (dhnf8522)
Glenda Cooper (coop8522) Tenant has vacated. Legal action is in progress.
Pacific Dental Services (paci8522) PYOE's are still outstanding. Letter/email is being sent for a final date to submit payment for outstanding PYOE's to avoid additional fees.
Sitemax Telecom, LLC (site8522)
Square-One Business Machines LLC (squa8522) Per tenant contact, check went out on July 31st for outstanding operating expenses.
Walgreens #906-1 (walg8522) New contact for this account. Information sent to new contact to take credit.
Page 1 of 5

8/8/2014 12:38 PM
Charge Current 0-30 31-60 61-90 Over Pre- Total
Code Owed Owed Owed Owed 90 Owed payments Owed
Aging DetailDB Caption: COLLIERS USA * * * LIVE * * * Property: fscpall Status: Current, Past, Future Age As Of: 07/31/2014 Post To: 07/2014
Property Customer Lease Status Tran# Date Month
8522-ds Walgreens #906-1 Current C-1040748 oe 5/1/2013 Dec-13 113.05 0.00 0.00 0.00 113.05 0.00 113.05
8522-ds Walgreens #906-1 Current C-1040749 oe 6/1/2013 Dec-13 113.05 0.00 0.00 0.00 113.05 0.00 113.05
8522-ds Walgreens #906-1 Current C-1040750 pyoe 6/1/2013 Dec-13 5,094.62 0.00 0.00 0.00 5,094.62 0.00 5,094.62
8522-ds Walgreens #906-1 Current C-1040751 oe 7/1/2013 Dec-13 113.05 0.00 0.00 0.00 113.05 0.00 113.05
8522-ds Walgreens #906-1 Current C-1040752 oe 8/1/2013 Dec-13 113.05 0.00 0.00 0.00 113.05 0.00 113.05
8522-ds Walgreens #906-1 Current C-1040753 oe 9/1/2013 Dec-13 113.05 0.00 0.00 0.00 113.05 0.00 113.05
8522-ds Walgreens #906-1 Current C-1040754 oe 10/1/2013 Dec-13 113.05 0.00 0.00 0.00 113.05 0.00 113.05
8522-ds Walgreens #906-1 Current R-524546 Prepay 11/4/2013 Dec-13 0.00 0.00 0.00 0.00 0.00 -416.03 -416.03
8522-ds Walgreens #906-1 Current R-524547 Prepay 11/5/2013 Dec-13 0.00 0.00 0.00 0.00 0.00 -9,523.49 -9,523.49
8522-ds Walgreens #906-1 Current R-524549 Prepay 12/3/2013 Dec-13 0.00 0.00 0.00 0.00 0.00 -416.03 -416.03
8522-ds Walgreens #906-1 Current R-524550 Prepay 12/30/2013 Dec-13 0.00 0.00 0.00 0.00 0.00 -416.03 -416.03
8522-ds Walgreens #906-1 Current R-528443 Prepay 1/31/2014 Jan-14 0.00 0.00 0.00 0.00 0.00 -416.03 -416.03
8522-ds Walgreens #906-1 Current R-534369 Prepay 3/4/2014 Mar-14 0.00 0.00 0.00 0.00 0.00 -416.03 -416.03
8522-ds Walgreens #906-1 Current R-539630 Prepay 4/1/2014 Apr-14 0.00 0.00 0.00 0.00 0.00 -416.03 -416.03
8522-ds Walgreens #906-1 Current R-545129 Prepay 5/1/2014 May-14 0.00 0.00 0.00 0.00 0.00 -416.03 -416.03
8522-ds Walgreens #906-1 Current C-1090225 pyoe 5/9/2014 May-14 -1,088.94 0.00 0.00 -1,088.94 0.00 0.00 -1,088.94
8522-ds Walgreens #906-1 Current R-550383 Prepay 5/29/2014 May-14 0.00 0.00 0.00 0.00 0.00 -416.03 -416.03
8522-ds Walgreens #906-1 Current R-556204 Prepay 6/30/2014 Jun-14 0.00 0.00 0.00 0.00 0.00 -416.03 -416.03
8522-ds Walgreens #906-1 Current R-561835 Prepay 7/31/2014 Jul-14 0.00 0.00 0.00 0.00 0.00 -416.03 -416.03
8522-ds Walgreens #906-1 Current R-561835 Prepay 7/31/2014 Jul-14 0.00 0.00 0.00 0.00 0.00 -12,487.27 -12,487.27
Walgreens #906-1 -4,391.03 0.00 0.00 -1,088.94 -3,302.09 -26,171.06 -30,562.09
8522-ds 8,873.36 942.08 802.51 -1,724.93 8,853.70 -28,448.03 -19,574.67
8523-ds Dallas Garland & NE Railroad Current C-1090212 pyoe 5/9/2014 May-14 -1,560.88 0.00 0.00 -1,560.88 0.00 0.00 -1,560.88
8523-ds Dallas Garland & NE Railroad Current R-551798 Prepay 6/4/2014 Jun-14 0.00 0.00 0.00 0.00 0.00 -2,927.37 -2,927.37
8523-ds Dallas Garland & NE Railroad Current R-561208 Prepay 7/29/2014 Jul-14 0.00 0.00 0.00 0.00 0.00 -5,615.95 -5,615.95
Dallas Garland & NE Railroad -1,560.88 0.00 0.00 -1,560.88 0.00 -8,543.32 -10,104.20
8523-ds Logical Solutions, Inc. Current R-561371 Prepay 7/30/2014 Jul-14 0.00 0.00 0.00 0.00 0.00 -9,388.56 -9,388.56
Logical Solutions, Inc. 0.00 0.00 0.00 0.00 0.00 -9,388.56 -9,388.56
8523-ds Varian Medical Systems, Inc. Current R-561211 Prepay 7/29/2014 Jul-14 0.00 0.00 0.00 0.00 0.00 -3,616.25 -3,616.25
Varian Medical Systems, Inc. 0.00 0.00 0.00 0.00 0.00 -3,616.25 -3,616.25
8523-ds -1,560.88 0.00 0.00 -1,560.88 0.00 -21,548.13 -23,109.01
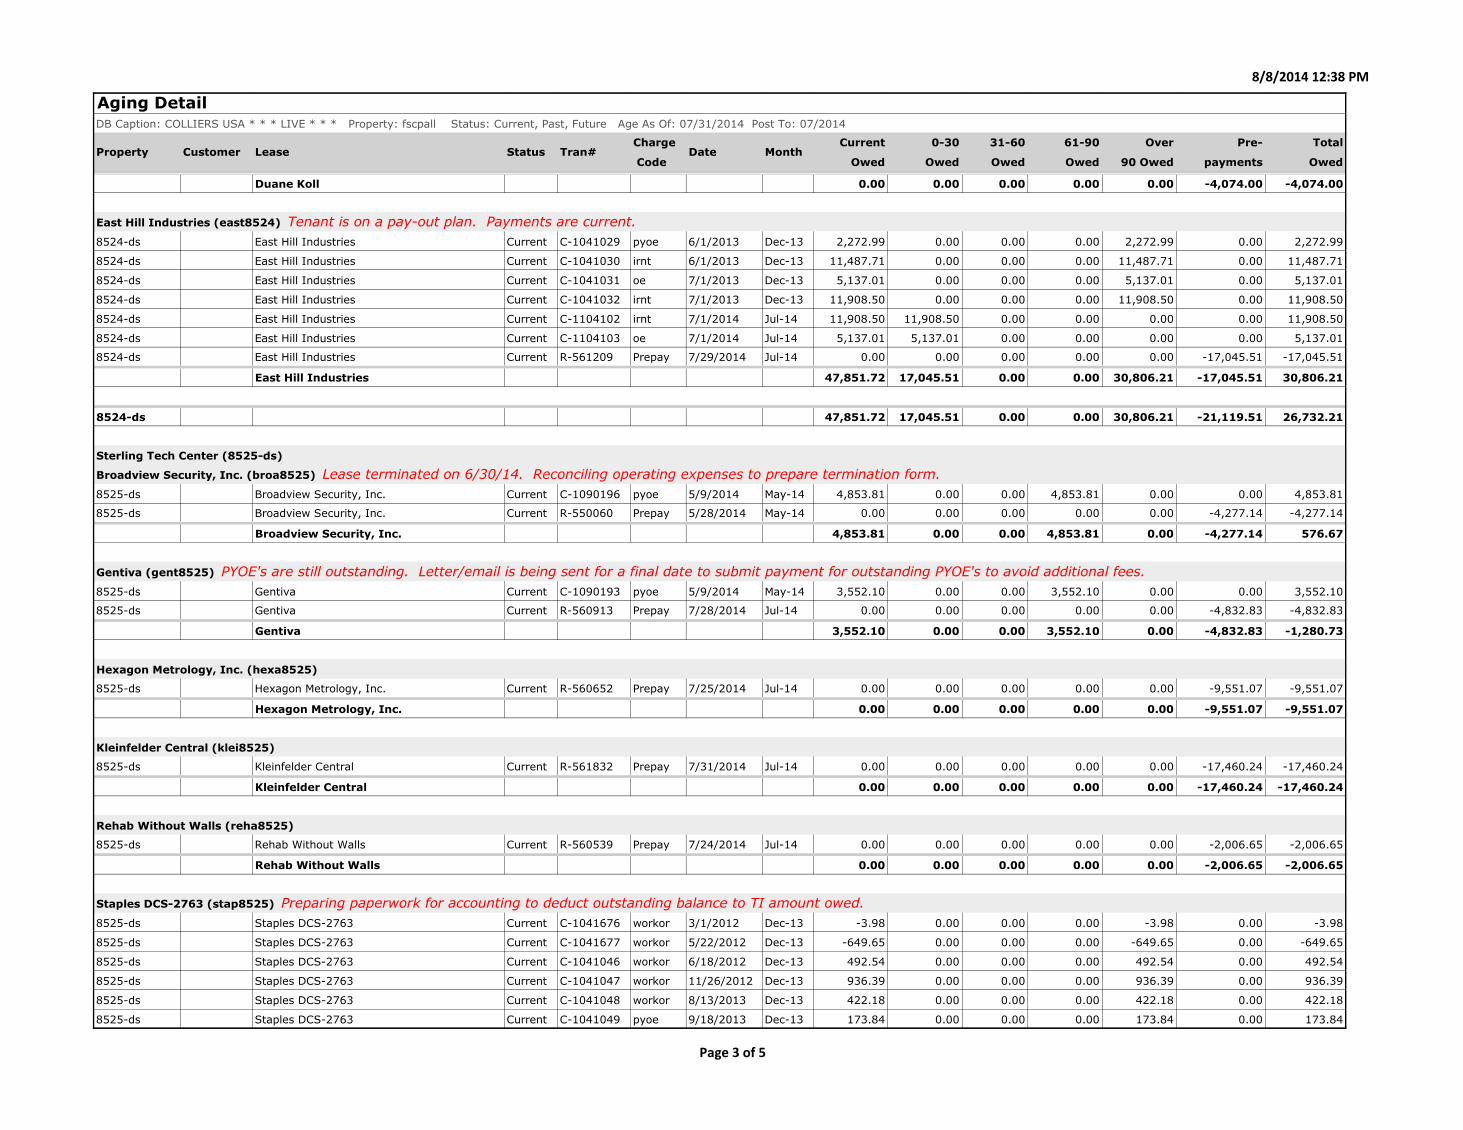
8524-ds Duane Koll Current R-561213 Prepay 7/29/2014 Jul-14 0.00 0.00 0.00 0.00 0.00 -4,074.00 -4,074.00
Dallas Garland & NE Railroad (dall8523) Tenant has been notified of credit.
International Corp Park II (8523-ds)
Logical Solutions, Inc. (logi8523)
Varian Medical Systems, Inc. (vari8523)
International Corp Park III (8524-ds)
Duane Koll (kits8524)
Page 2 of 5
8/8/2014 12:38 PM
Charge Current 0-30 31-60 61-90 Over Pre- Total
Code Owed Owed Owed Owed 90 Owed payments Owed
Aging DetailDB Caption: COLLIERS USA * * * LIVE * * * Property: fscpall Status: Current, Past, Future Age As Of: 07/31/2014 Post To: 07/2014
Property Customer Lease Status Tran# Date Month
Duane Koll 0.00 0.00 0.00 0.00 0.00 -4,074.00 -4,074.00
8524-ds East Hill Industries Current C-1041029 pyoe 6/1/2013 Dec-13 2,272.99 0.00 0.00 0.00 2,272.99 0.00 2,272.99
8524-ds East Hill Industries Current C-1041030 irnt 6/1/2013 Dec-13 11,487.71 0.00 0.00 0.00 11,487.71 0.00 11,487.71
8524-ds East Hill Industries Current C-1041031 oe 7/1/2013 Dec-13 5,137.01 0.00 0.00 0.00 5,137.01 0.00 5,137.01
8524-ds East Hill Industries Current C-1041032 irnt 7/1/2013 Dec-13 11,908.50 0.00 0.00 0.00 11,908.50 0.00 11,908.50
8524-ds East Hill Industries Current C-1104102 irnt 7/1/2014 Jul-14 11,908.50 11,908.50 0.00 0.00 0.00 0.00 11,908.50
8524-ds East Hill Industries Current C-1104103 oe 7/1/2014 Jul-14 5,137.01 5,137.01 0.00 0.00 0.00 0.00 5,137.01
8524-ds East Hill Industries Current R-561209 Prepay 7/29/2014 Jul-14 0.00 0.00 0.00 0.00 0.00 -17,045.51 -17,045.51
East Hill Industries 47,851.72 17,045.51 0.00 0.00 30,806.21 -17,045.51 30,806.21
8524-ds 47,851.72 17,045.51 0.00 0.00 30,806.21 -21,119.51 26,732.21
8525-ds Broadview Security, Inc. Current C-1090196 pyoe 5/9/2014 May-14 4,853.81 0.00 0.00 4,853.81 0.00 0.00 4,853.81
8525-ds Broadview Security, Inc. Current R-550060 Prepay 5/28/2014 May-14 0.00 0.00 0.00 0.00 0.00 -4,277.14 -4,277.14
Broadview Security, Inc. 4,853.81 0.00 0.00 4,853.81 0.00 -4,277.14 576.67
8525-ds Gentiva Current C-1090193 pyoe 5/9/2014 May-14 3,552.10 0.00 0.00 3,552.10 0.00 0.00 3,552.10
8525-ds Gentiva Current R-560913 Prepay 7/28/2014 Jul-14 0.00 0.00 0.00 0.00 0.00 -4,832.83 -4,832.83
Gentiva 3,552.10 0.00 0.00 3,552.10 0.00 -4,832.83 -1,280.73
8525-ds Hexagon Metrology, Inc. Current R-560652 Prepay 7/25/2014 Jul-14 0.00 0.00 0.00 0.00 0.00 -9,551.07 -9,551.07
Hexagon Metrology, Inc. 0.00 0.00 0.00 0.00 0.00 -9,551.07 -9,551.07
8525-ds Kleinfelder Central Current R-561832 Prepay 7/31/2014 Jul-14 0.00 0.00 0.00 0.00 0.00 -17,460.24 -17,460.24
Kleinfelder Central 0.00 0.00 0.00 0.00 0.00 -17,460.24 -17,460.24
8525-ds Rehab Without Walls Current R-560539 Prepay 7/24/2014 Jul-14 0.00 0.00 0.00 0.00 0.00 -2,006.65 -2,006.65
Rehab Without Walls 0.00 0.00 0.00 0.00 0.00 -2,006.65 -2,006.65
8525-ds Staples DCS-2763 Current C-1041676 workor 3/1/2012 Dec-13 -3.98 0.00 0.00 0.00 -3.98 0.00 -3.98
8525-ds Staples DCS-2763 Current C-1041677 workor 5/22/2012 Dec-13 -649.65 0.00 0.00 0.00 -649.65 0.00 -649.65
8525-ds Staples DCS-2763 Current C-1041046 workor 6/18/2012 Dec-13 492.54 0.00 0.00 0.00 492.54 0.00 492.54
8525-ds Staples DCS-2763 Current C-1041047 workor 11/26/2012 Dec-13 936.39 0.00 0.00 0.00 936.39 0.00 936.39
8525-ds Staples DCS-2763 Current C-1041048 workor 8/13/2013 Dec-13 422.18 0.00 0.00 0.00 422.18 0.00 422.18
8525-ds Staples DCS-2763 Current C-1041049 pyoe 9/18/2013 Dec-13 173.84 0.00 0.00 0.00 173.84 0.00 173.84
East Hill Industries (east8524) Tenant is on a pay-out plan. Payments are current.
Staples DCS-2763 (stap8525) Preparing paperwork for accounting to deduct outstanding balance to TI amount owed.
Sterling Tech Center (8525-ds)
Broadview Security, Inc. (broa8525) Lease terminated on 6/30/14. Reconciling operating expenses to prepare termination form.
Gentiva (gent8525) PYOE's are still outstanding. Letter/email is being sent for a final date to submit payment for outstanding PYOE's to avoid additional fees.
Hexagon Metrology, Inc. (hexa8525)
Kleinfelder Central (klei8525)
Rehab Without Walls (reha8525)
Page 3 of 5

8/8/2014 12:38 PM
Charge Current 0-30 31-60 61-90 Over Pre- Total
Code Owed Owed Owed Owed 90 Owed payments Owed
Aging DetailDB Caption: COLLIERS USA * * * LIVE * * * Property: fscpall Status: Current, Past, Future Age As Of: 07/31/2014 Post To: 07/2014
Property Customer Lease Status Tran# Date Month
8525-ds Staples DCS-2763 Current R-560920 Prepay 7/28/2014 Jul-14 0.00 0.00 0.00 0.00 0.00 -10,315.61 -10,315.61
Staples DCS-2763 1,371.32 0.00 0.00 0.00 1,371.32 -10,315.61 -8,944.29
8525-ds 9,777.23 0.00 0.00 8,405.91 1,371.32 -48,443.54 -38,666.31
8526-ds Coram Healthcare Corporation Current C-1106511 trash 6/18/2014 Jun-14 1,192.75 0.00 1,192.75 0.00 0.00 0.00 1,192.75
8526-ds Coram Healthcare Corporation Current C-1106512 trash 6/18/2014 Jun-14 582.37 0.00 582.37 0.00 0.00 0.00 582.37
8526-ds Coram Healthcare Corporation Current R-561210 Prepay 7/29/2014 Jul-14 0.00 0.00 0.00 0.00 0.00 -10,561.40 -10,561.40
Coram Healthcare Corporation 1,775.12 0.00 1,775.12 0.00 0.00 -10,561.40 -8,786.28
8526-ds Expresion E Imagen Studio Current R-560597 Prepay 7/25/2014 Jul-14 0.00 0.00 0.00 0.00 0.00 -17,915.58 -17,915.58
Expresion E Imagen Studio 0.00 0.00 0.00 0.00 0.00 -17,915.58 -17,915.58
8526-ds Knight Security Systems, LLC Current C-1079995 irnt 5/1/2014 May-14 253.28 0.00 0.00 0.00 253.28 0.00 253.28
8526-ds Knight Security Systems, LLC Current C-1092640 irnt 6/1/2014 Jun-14 253.28 0.00 253.28 0.00 0.00 0.00 253.28
8526-ds Knight Security Systems, LLC Current R-556154 Prepay 6/30/2014 Jun-14 0.00 0.00 0.00 0.00 0.00 -292.28 -292.28
8526-ds Knight Security Systems, LLC Current C-1104132 irnt 7/1/2014 Jul-14 253.28 253.28 0.00 0.00 0.00 0.00 253.28
Knight Security Systems, LLC 759.84 253.28 253.28 0.00 253.28 -292.28 467.56
8526-ds Option Care Enterprises, Inc. Future C-1041742 pyoe 6/1/2013 Dec-13 114.14 0.00 0.00 0.00 114.14 0.00 114.14
Option Care Enterprises, Inc. 114.14 0.00 0.00 0.00 114.14 0.00 114.14
8526-ds Transforming Life Christian Current C-1104124 irnt 7/1/2014 Jul-14 3,290.38 3,290.38 0.00 0.00 0.00 0.00 3,290.38
8526-ds Transforming Life Christian Current C-1104125 oe 7/1/2014 Jul-14 1,782.79 1,782.79 0.00 0.00 0.00 0.00 1,782.79
Transforming Life Christian 5,073.17 5,073.17 0.00 0.00 0.00 0.00 5,073.17
8526-ds 7,722.27 5,326.45 2,028.40 0.00 367.42 -28,769.26 -21,046.99
8527-ds RKM Utility Services, Inc. Current C-1090220 pyoe 5/9/2014 May-14 5,419.40 0.00 0.00 5,419.40 0.00 0.00 5,419.40
8527-ds RKM Utility Services, Inc. Current C-1104141 irnt 7/1/2014 Jul-14 6,533.63 6,533.63 0.00 0.00 0.00 0.00 6,533.63
8527-ds RKM Utility Services, Inc. Current C-1104142 oe 7/1/2014 Jul-14 2,808.31 2,808.31 0.00 0.00 0.00 0.00 2,808.31
RKM Utility Services, Inc. 14,761.34 9,341.94 0.00 5,419.40 0.00 0.00 14,761.34
8527-ds Video Solutions Worx, LTD Current R-560529 Prepay 7/24/2014 Jul-14 0.00 0.00 0.00 0.00 0.00 -2,449.03 -2,449.03
Transforming Life Christian (tran8526) Email sent to tenant for status of past due rent/operating expenses.
Dallas Tech Center (8526-ds)
Coram Healthcare Corporation (cora8526) Additional trash haul services to be reimbursed from tenant. There will be reoccurring charges monthly.
Expresion E Imagen Studio (expr8526)
Knight Security Systems, LLC (knig8526) Email sent to tenant for status of additional charges.
Option Care Enterprises, Inc. (opti8526)
Westwood III (8527-ds)
RKM Utility Services, Inc. (rkmu8527) Tenant is consistently 1 month behind in paying rent. Letter/email is being sent for a final date to submit payment for outstanding PYOE's to avoid
additional fees.
Video Solutions Worx, LTD (capt8527)
Page 4 of 5
8/8/2014 12:38 PM
Charge Current 0-30 31-60 61-90 Over Pre- Total
Code Owed Owed Owed Owed 90 Owed payments Owed
Aging DetailDB Caption: COLLIERS USA * * * LIVE * * * Property: fscpall Status: Current, Past, Future Age As Of: 07/31/2014 Post To: 07/2014
Property Customer Lease Status Tran# Date Month
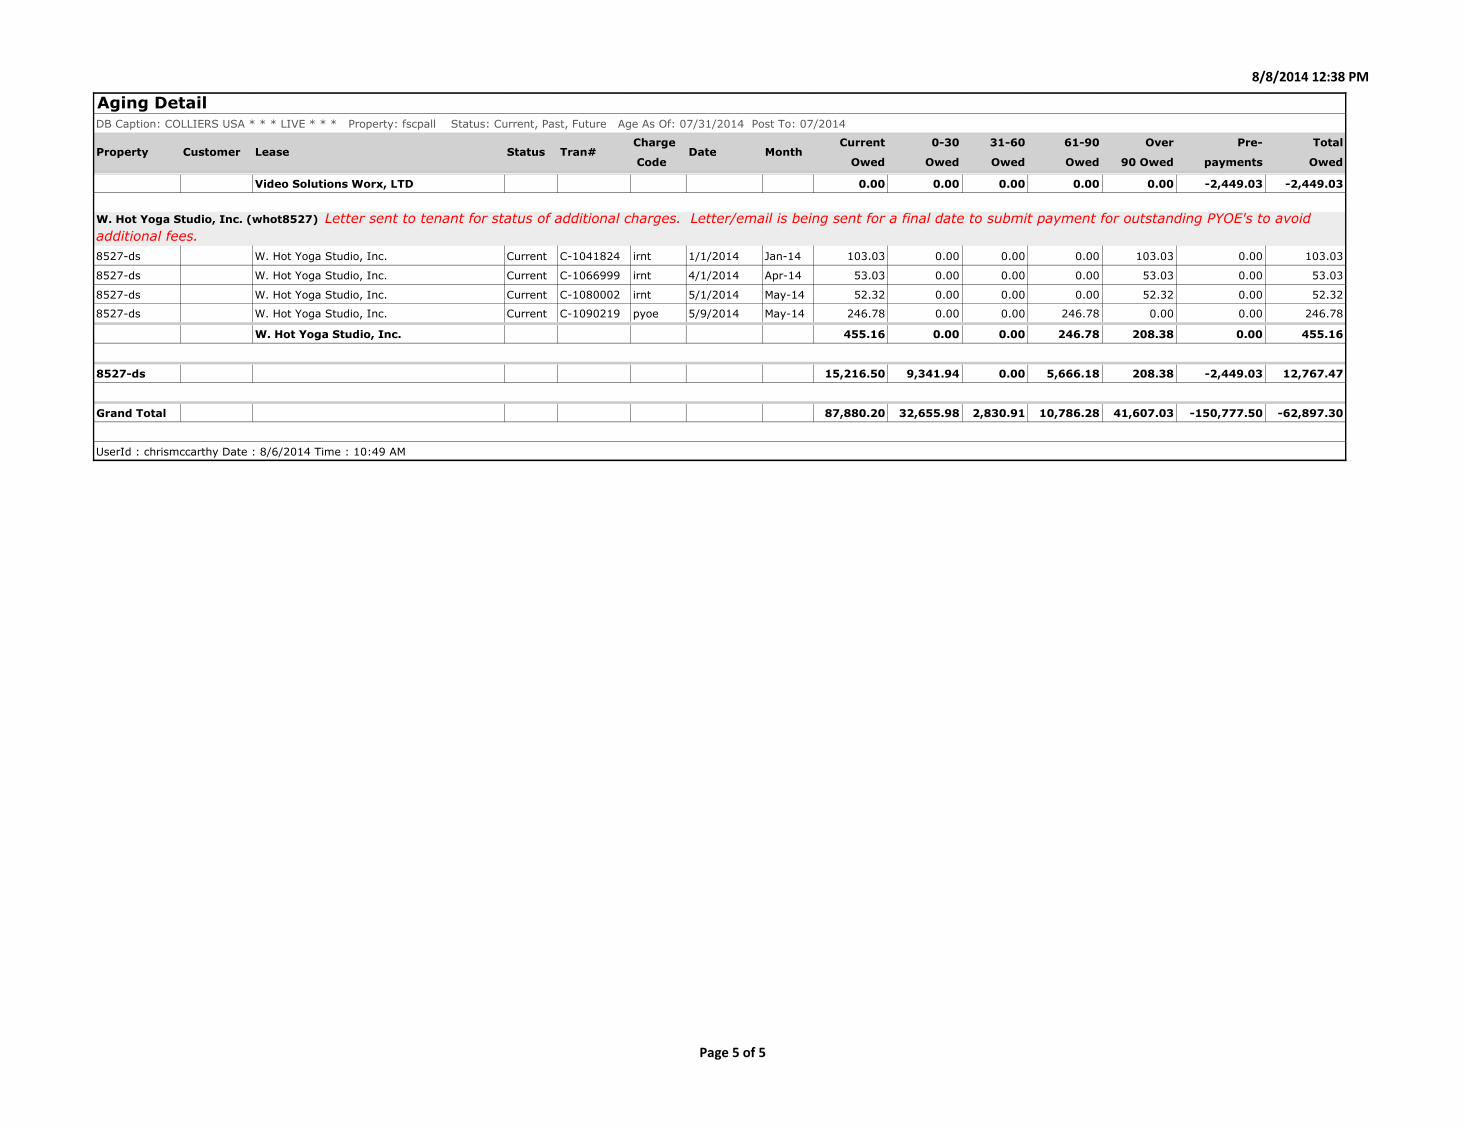
Video Solutions Worx, LTD 0.00 0.00 0.00 0.00 0.00 -2,449.03 -2,449.03
8527-ds W. Hot Yoga Studio, Inc. Current C-1041824 irnt 1/1/2014 Jan-14 103.03 0.00 0.00 0.00 103.03 0.00 103.03
8527-ds W. Hot Yoga Studio, Inc. Current C-1066999 irnt 4/1/2014 Apr-14 53.03 0.00 0.00 0.00 53.03 0.00 53.03
8527-ds W. Hot Yoga Studio, Inc. Current C-1080002 irnt 5/1/2014 May-14 52.32 0.00 0.00 0.00 52.32 0.00 52.32
8527-ds W. Hot Yoga Studio, Inc. Current C-1090219 pyoe 5/9/2014 May-14 246.78 0.00 0.00 246.78 0.00 0.00 246.78
W. Hot Yoga Studio, Inc. 455.16 0.00 0.00 246.78 208.38 0.00 455.16
8527-ds 15,216.50 9,341.94 0.00 5,666.18 208.38 -2,449.03 12,767.47
Grand Total 87,880.20 32,655.98 2,830.91 10,786.28 41,607.03 -150,777.50 -62,897.30
UserId : chrismccarthy Date : 8/6/2014 Time : 10:49 AM
W. Hot Yoga Studio, Inc. (whot8527) Letter sent to tenant for status of additional charges. Letter/email is being sent for a final date to submit payment for outstanding PYOE's to avoid
additional fees.
Page 5 of 5

RENT ROLL

Rent Roll
9:26 am
07/31/2014
1
Time:
Date:
Page:
July 2014Counterpoint (8522-ds)
Square
FeetTenant Name DateSuite No. Term
Base Rent Inc.
CPI or Step UpSecurity
Deposit Rate Comments
Current
Monthly Charges
Chg Code Amount Amount PSF
100 Olympus America, Inc. 6,085 12/15/12 to 5/31/18 $0.00Original Lease 12/15/12 to5/31/18
irnt 3,422.81 0.56
oe 1,460.40 0.24
6/1/14 $3,422.81
6/1/15 $3,549.58
6/1/16 $3,676.35
6/1/17 $3,803.13
107 AFS Logistics, LLC 5,214 9/2/08 to 11/30/15 $3,519.45Original Lease 9/2/08 to11/30/15
irnt 3,476.00 0.67
oe 1,251.33 0.24
1/1/14 $3,476.00
9/1/14 $3,693.25
108 Sitemax Telecom, LLC 1,747 10/1/10 to 11/30/15 $1,349.56Original Lease 10/1/10 to11/30/15
irnt 1,055.48 0.60
oe 419.27 0.24
1/1/14 $1,055.48
10/1/14 $1,091.88
200 Walgreens #906-1 10,067 12/1/04 to 11/30/14 $0.00Original Lease 12/1/04 to11/30/14
irnt 10,050.22 1.00
oe 2,437.05 0.24
1/1/14 $10,050.22
201 Square-One Business Machines
LLC
3,379 5/1/14 to 9/30/19 $3,759.14Original Lease 5/1/14 to9/30/19
irnt 2,393.46 0.71
oconc -2,393.46 -0.71
oe 802.51 0.24
5/1/14 $2,393.46
6/1/14 -$2,393.46
5/1/15 $2,534.25
5/1/16 $2,675.04
5/1/17 $2,815.83
5/1/18 $2,956.63
202 Pacific Dental Services 3,704 6/1/12 to 1/31/18 $0.00Original Lease 6/1/12 to1/31/18
irnt 2,376.73 0.64
oe 888.96 0.24
6/1/14 $2,376.73
6/1/15 $2,463.16
6/1/16 $2,552.67
6/1/17 $2,636.01
203 American Crafts, LLC 3,510 1/1/13 to 12/31/15 $2,617.88Original Lease 1/1/13 to12/31/15
irnt 1,731.60 0.49
oe 833.63 0.24
1/1/14 $1,731.60
1/1/15 $1,784.25
204 David H Nickerson Foundation 3,043 12/1/11 to 2/28/15 $2,682.92Original Lease 12/1/11 to2/28/15
irnt 2,028.67 0.67
oe 764.47 0.25
1/1/14 $2,028.67
206 Horizon Group USA, Inc. 2,544 7/13/12 to 10/31/17 $2,412.56Original Lease 7/13/12 to10/31/17
irnt 1,590.00 0.63
oe 610.56 0.24
7/1/14 $1,590.00
7/1/15 $1,696.00
7/1/16 $1,802.00
207 Automated Dynamics, Inc. 3,216 8/1/12 to 12/31/17 $3,183.84Original Lease 8/1/12 to12/31/17
irnt 2,010.00 0.63
oe 771.84 0.24
1/1/14 $2,010.00
9/1/14 $2,144.00
9/1/15 $2,278.00
9/1/16 $2,412.00

Rent Roll
9:26 am
07/31/2014
2
Time:
Date:
Page:
July 2014Counterpoint (8522-ds)
Square
FeetTenant Name DateSuite No. Term
Base Rent Inc.
CPI or Step UpSecurity
Deposit Rate Comments
Current
Monthly Charges
Chg Code Amount Amount PSF
214 Nikon Meterology, Inc. 6,443 12/1/11 to 6/30/17 $5,100.71Original Lease 12/1/11 to6/30/17
irnt 5,100.71 0.79 1/1/14 $5,100.71
12/1/14 $5,369.17
7/1/16 $5,637.63
103 VACANT 4,600 0.00
105 VACANT 2,540 0.00
205 VACANT 4,983 0.00
210 VACANT 5,881 0.00
Totals for Counterpoint: 66,956 $24,626.06
Vacant:
Occupied: 48,952 73.11%
26.89% 18,004
Current Monthly Charges
irnt 35,235.68
oconc -2,393.46
oe 10,240.02

Rent Roll
9:26 am
07/31/2014
3
Time:
Date:
Page:
July 2014International Corp Park II (8523-ds)
Square
FeetTenant Name DateSuite No. Term
Base Rent Inc.
CPI or Step UpSecurity
Deposit Rate Comments
Current
Monthly Charges
Chg Code Amount Amount PSF
100 VIYU Network Solutions 5,628 2/1/12 to 8/31/17 $3,752.00Original Lease 2/1/12 to8/31/17
irnt 4,221.00 0.75 3/1/14 $4,221.00
3/1/15 $4,455.50
3/1/16 $4,690.00
104 The Terminix International Co.,
LP
6,353 7/1/13 to 6/30/18 $0.00Original Lease 7/1/13 to6/30/18
irnt 2,647.08 0.42 7/1/13 $2,647.08
108 Legal Elements of Dallas, LLC 2,365 2/1/12 to 6/30/17 $1,970.83Original Lease 2/1/12 to6/30/17
irnt 1,773.75 0.75 2/1/14 $1,773.75
2/1/15 $1,872.29
2/1/16 $1,970.83
209 Unified Building Sciences Eng 6,674 11/1/00 to $5,756.32Original Lease 11/1/00 to
irnt 3,337.00 0.50
oe 1,411.10 0.21
1/1/14 $3,337.00
300 Bowlin Development Corp. 12,350 6/1/09 to 9/30/19 $10,548.96Original Lease 6/1/09 to9/30/19
irnt 8,233.33 0.67
oe 2,571.29 0.21
6/1/09 $8,233.33
11/1/14 $8,747.92
11/1/15 $9,262.50
11/1/16 $9,777.08
11/1/17 $10,291.67
2/1/19 $10,806.25
406 Logical Solutions, Inc. 12,606 5/15/01 to 5/31/18 $6,977.08Original Lease 5/15/01 to5/31/18
irnt 6,723.20 0.53
oe 2,665.36 0.21
5/15/01 $6,723.20
5/1/16 $7,038.35
501 Dallas Garland & NE Railroad 7,050 1/1/02 to 6/30/15 $6,627.00Original Lease 1/1/02 to6/30/15
irnt 4,112.50 0.58
oe 1,503.45 0.21
4/1/14 $4,112.50
503 Varian Medical Systems, Inc. 5,260 6/11/04 to 7/31/16 $4,104.80Original Lease 6/11/04 to7/31/16
irnt 3,616.25 0.69 1/1/14 $3,616.25
107 VACANT 2,124 0.00
203 VACANT 9,796 0.00
400 VACANT 1,934 0.00

Rent Roll
9:26 am
07/31/2014
4
Time:
Date:
Page:
July 2014International Corp Park II (8523-ds)
Square
FeetTenant Name DateSuite No. Term
Base Rent Inc.
CPI or Step UpSecurity
Deposit Rate Comments
Current
Monthly Charges
Chg Code Amount Amount PSF
504 VACANT 3,990 0.00
505 VACANT 8,400 0.00
Totals for International Corp Park II: 84,530 $39,736.99
Vacant:
Occupied: 58,286 68.95%
31.05% 26,244
Current Monthly Charges
irnt 34,664.11
oe 8,151.20

Rent Roll
9:26 am
07/31/2014
5
Time:
Date:
Page:
July 2014International Corp Park III (8524-ds)
Square
FeetTenant Name DateSuite No. Term
Base Rent Inc.
CPI or Step UpSecurity
Deposit Rate Comments
Current
Monthly Charges
Chg Code Amount Amount PSF
100 Apple Homecare Medical
Syupply
22,800 7/1/13 to 10/31/18 $10,336.00Original Lease 7/1/13 to10/31/18
irnt 5,491.00 0.24
oe 3,420.00 0.15
7/1/14 $5,491.00
7/1/15 $5,966.00
7/1/16 $6,441.00
7/1/17 $6,916.00
102 Duane Koll 8,006 1/1/08 to 6/30/19 $3,836.21Original Lease 1/1/08 to6/30/19
irnt 2,902.18 0.36
oe 1,171.83 0.15Kit Special Ties
4/1/14 $2,902.18
4/1/15 $3,035.61
4/1/16 $3,169.04
4/1/17 $3,302.48
4/1/18 $3,435.91
110 East Hill Industries 30,600 3/1/10 to 6/30/15 $26,338.29Original Lease 3/1/10 to6/30/15
irnt 11,908.50 0.39
oe 5,137.01 0.17
1/1/14 $11,908.50
410 Directline Distributing, LLC 11,094 7/12/12 to 12/31/17 $5,824.30Original Lease 7/12/12 to12/31/17
irnt 3,698.00 0.33
oe 1,664.10 0.15
7/1/14 $3,698.00
7/1/15 $3,929.13
7/1/16 $4,160.25
420 Thermo Fisher Scientific, Inc. 11,700 4/20/09 to 4/30/16 $0.00Original Lease 4/20/09 to4/30/14
Renewal 5/1/14 to4/30/16
irnt 5,362.50 0.46
oe 1,868.43 0.16
5/1/14 $5,362.50
5/1/15 $5,606.25
430 Enterprise Plumbing 15,600 4/1/06 to 3/31/15 $8,411.00Original Lease 4/1/06 to3/31/15
irnt 6,825.00 0.44
oe 2,618.87 0.17
2/1/14 $6,825.00
400 VACANT 11,700 0.00
Totals for International Corp Park III: 111,500 $54,745.80
Vacant:
Occupied: 99,800 89.51%
10.49% 11,700
Current Monthly Charges
irnt 36,187.18
oe 15,880.24

Rent Roll
9:26 am
07/31/2014
6
Time:
Date:
Page:
July 2014Sterling Tech Center (8525-ds)
Square
FeetTenant Name DateSuite No. Term
Base Rent Inc.
CPI or Step UpSecurity
Deposit Rate Comments
Current
Monthly Charges
Chg Code Amount Amount PSF
A101, A103 Touchpay Holdings, LP 10,296 7/1/10 to 6/30/16 $6,455.44Original Lease 7/1/10 to6/30/16
irnt 6,864.00 0.67
oe 2,677.02 0.26
7/1/14 $6,864.00
7/1/15 $7,078.50
A105 Gentiva 5,443 6/1/05 to 12/31/15 $5,598.29Original Lease 6/1/05 to12/31/15
irnt 3,401.88 0.63
oe 1,430.95 0.26
1/1/14 $3,401.88
A106 Onsite Health Diagnostics, LLC 5,698 10/1/10 to 2/29/16 $17,512.00Original Lease 10/1/10 to2/29/16
irnt 3,252.61 0.57
oe 1,505.57 0.26
3/1/14 $3,252.61
3/1/15 $3,300.09
A108 Rehab Without Walls 2,260 2/1/04 to 11/30/15 $0.00Original Lease 2/1/04 to11/30/15
irnt 1,412.50 0.63
oe 594.15 0.26
1/1/14 $1,412.50
B100 Staples DCS-2763 14,069 7/15/07 to 5/31/16 $0.00Original Lease 7/15/07 to5/31/16
irnt 9,027.61 0.64
oe 1,288.00 0.09
3/1/14 $9,027.61
3/1/15 $9,437.95
C100 Kleinfelder Central 19,692 3/21/10 to 11/30/17 $0.00Original Lease 3/21/10 to11/30/17
irnt 12,307.50 0.63
oe 5,152.74 0.26
1/1/14 $12,307.50
12/1/14 $13,128.00
12/1/16 $13,948.50
C120 Hexagon Metrology, Inc. 8,088 6/1/07 to 10/31/15 $0.00Original Lease 6/1/07 to10/31/15
irnt 7,414.00 0.92
oe 2,137.07 0.26
6/1/14 $7,414.00
A110 VACANT 6,680 0.00
A112 VACANT 5,382 0.00
Totals for Sterling Tech Center: 77,608 $29,565.73
Vacant:
Occupied: 65,546 84.46%
15.54% 12,062
Current Monthly Charges
irnt 43,680.10
oe 14,785.50

Rent Roll
9:26 am
07/31/2014
7
Time:
Date:
Page:
July 2014Dallas Tech Center (8526-ds)
Square
FeetTenant Name DateSuite No. Term
Base Rent Inc.
CPI or Step UpSecurity
Deposit Rate Comments
Current
Monthly Charges
Chg Code Amount Amount PSF
A151 Transforming Life Christian 7,179 10/28/13 to 1/31/21 $6,867.92Original Lease 10/28/13 to1/31/21
irnt 3,290.38 0.46
oe 1,782.79 0.25
10/28/13 $3,290.38
11/1/14 $3,589.50
11/1/15 $3,888.63
11/1/16 $4,187.75
11/1/17 $4,486.88
11/1/18 $4,786.00
11/1/19 $5,085.13
B151, C147,
C195
Expresion E Imagen Studio 24,614 6/1/12 to 12/31/20 $21,880.73Original Lease 6/1/12 to8/31/19
Expansion 2/1/13 to4/30/20
Expansion 10/1/13 to12/31/20
irnt 3,020.14 0.12
irnt 5,519.04 0.22
irnt 3,264.17 0.13
oe 1,945.44 0.08
oe 2,530.27 0.10
oe 1,636.52 0.07
10/1/13 $3,264.17
5/1/14 $5,519.04
6/1/14 $3,020.14
5/1/15 $5,943.58
6/1/15 $3,157.71
10/1/15 $3,427.38
5/1/16 $6,368.13
6/1/16 $3,295.00
10/1/16 $3,753.79
5/1/17 $6,792.67
6/1/17 $3,844.17
10/1/17 $3,917.00
5/1/18 $7,217.21
6/1/18 $3,981.46
10/1/18 $4,243.42
10/1/19 $4,569.83
D100 Knight Security Systems, LLC 6,754 2/1/08 to 8/31/16 $7,547.59Original Lease 2/1/08 to8/31/16
irnt 5,684.62 0.84
oe 1,692.17 0.25
3/1/14 $5,684.62
3/1/15 $5,966.03
D102 Coram Healthcare Corporation 9,764 8/1/07 to 6/30/18 $9,967.42Original Lease 8/1/07 to6/30/18
irnt 8,136.67 0.83
oe 2,424.73 0.25
7/1/14 $8,136.67
7/1/15 $8,543.50
7/1/16 $8,950.33
7/1/17 $9,357.17
D103 CBS Outdoor 0 1/1/89 to 12/31/19 $0.00Original Lease 1/1/89 to12/31/19
sig 925.00 0.00
A130 VACANT 15,121 0.00
B137 VACANT 15,877 0.00
D101 VACANT 3,416 0.00

Rent Roll
9:26 am
07/31/2014
8
Time:
Date:
Page:
July 2014Dallas Tech Center (8526-ds)
Totals for Dallas Tech Center: 82,725 $46,263.66
Vacant:
Occupied: 48,311 58.40%
41.60% 34,414
Current Monthly Charges
irnt 28,915.02
oe 12,011.92
sig 925.00

Rent Roll
9:26 am
07/31/2014
9
Time:
Date:
Page:
July 2014Westwood III (8527-ds)
Square
FeetTenant Name DateSuite No. Term
Base Rent Inc.
CPI or Step UpSecurity
Deposit Rate Comments
Current
Monthly Charges
Chg Code Amount Amount PSF
102 Video Solutions Worx, LTD 2,643 4/1/08 to $1,817.06Original Lease 4/1/08 to
irnt 1,817.06 0.69
oe 631.97 0.24Capture The Market
1/1/14 $1,817.06
104 W. Hot Yoga Studio, Inc. 2,453 1/1/13 to 3/31/18 $2,033.95Original Lease 1/1/13 to3/31/18
irnt 1,226.50 0.50
oe 500.82 0.20
1/1/14 $1,226.50
1/1/15 $1,328.71
1/1/16 $1,430.92
1/1/17 $1,533.13
107 RKM Utility Services, Inc. 13,755 8/1/12 to 12/31/16 $10,201.62Original Lease 8/1/12 to12/31/16
irnt 6,533.63 0.48
oe 2,808.31 0.20
1/1/14 $6,533.63
8/1/14 $6,820.19
8/1/15 $7,106.75
8/1/16 $7,393.31
100 VACANT 4,761 0.00
101 VACANT 2,907 0.00
103 VACANT 2,381 0.00
Totals for Westwood III: 28,900 $14,052.63
Vacant:
Occupied: 18,851 65.23%
34.77% 10,049
Current Monthly Charges
irnt 9,577.19
oe 3,941.10

Rent Roll
9:26 am
07/31/2014
10
Time:
Date:
Page:
July 2014Valwood XII (8528-ds)
Square
FeetTenant Name DateSuite No. Term
Base Rent Inc.
CPI or Step UpSecurity
Deposit Rate Comments
Current
Monthly Charges
Chg Code Amount Amount PSF
100 ASI Business Solutions, LTD 20,328 7/25/08 to 7/31/16 $0.00Original Lease 7/25/08 to7/31/16
irnt 11,434.50 0.56
oe 4,180.64 0.21
1/1/14 $11,434.50
8/1/14 $11,858.00
8/1/15 $12,281.50
101 VACANT 19,045 0.00
Totals for Valwood XII: 39,373 $0.00
Vacant:
Occupied: 20,328 51.63%
48.37% 19,045
Current Monthly Charges
irnt 11,434.50
oe 4,180.64

8/7/2014 4:45 PM
Monthly Monthly Annual Annual Annual Annual Security
Rent Rent Rent Rent Rec. Misc Deposit
Per Area Per Area Per Area Per Area
8522-ds - Counterpoint,Irving
Current Leases
8522-ds 100 Olympus America, Inc. Industrial 6,085.00 12/15/2012 5/31/2018 66 3,422.81 0.56 41,073.72 6.75 2.88 0.00 0.00 0.00
8522-ds 107 AFS Logistics, LLC Industrial 5,214.00 9/2/2008 11/30/2015 87 3,476.00 0.67 41,712.00 8.00 2.88 0.00 3,519.45 0.00
8522-ds 108 Sitemax Telecom, LLC Industrial 1,747.00 10/1/2010 11/30/2015 62 1,055.48 0.60 12,665.76 7.25 2.88 0.00 1,349.56 0.00
8522-ds 200 Walgreens #906-1 Industrial 10,067.00 12/1/2004 11/30/2014 120 10,050.22 1.00 120,602.64 11.98 2.90 0.00 0.00 0.00
8522-ds 201 Square-One Business Machines LLC Industrial 3,379.00 5/1/2014 9/30/2019 65 0.00 0.00 0.00 0.00 2.85 0.00 3,759.14 0.00
8522-ds 202 Pacific Dental Services Industrial 3,704.00 6/1/2012 1/31/2018 68 2,376.73 0.64 28,520.76 7.70 2.88 0.00 0.00 0.00
8522-ds 203 American Crafts, LLC Industrial 3,510.00 1/1/2013 12/31/2015 36 1,731.60 0.49 20,779.20 5.92 2.85 0.00 2,617.88 0.00
8522-ds 204 David H Nickerson Foundation Industrial 3,043.00 12/1/2011 2/28/2015 39 2,028.67 0.67 24,344.04 8.00 3.01 0.00 2,682.92 0.00
8522-ds 206 Horizon Group USA, Inc. Industrial 2,544.00 7/13/2012 10/31/2017 64 1,590.00 0.63 19,080.00 7.50 2.88 0.00 2,412.56 0.00
8522-ds 207 Automated Dynamics, Inc. Industrial 3,216.00 8/1/2012 12/31/2017 65 2,010.00 0.63 24,120.00 7.50 2.88 0.00 3,183.84 0.00
8522-ds 214 Nikon Meterology, Inc. Industrial 6,443.00 12/1/2011 6/30/2017 67 5,100.71 0.79 61,208.52 9.50 0.00 0.00 5,100.71 0.00
8522-ds 103 VACANT 4,600.00 0 0.00 0.00 0.00 0.00 0.00 0.00 0.00 0.00
8522-ds 105 VACANT 2,540.00 0 0.00 0.00 0.00 0.00 0.00 0.00 0.00 0.00
8522-ds 205 VACANT 4,983.00 0 0.00 0.00 0.00 0.00 0.00 0.00 0.00 0.00
8522-ds 210 VACANT 5,881.00 0 0.00 0.00 0.00 0.00 0.00 0.00 0.00 0.00
Total Current 66,956.00 32,842.22 0.49 394,106.64 5.89 1.84 0.00 24,626.06 0.00
Total Units Total Area Percentage Monthly Rent Annual Rent
Occupied 11.00 48,952.00 73.11 32,842.22 394,106.64
Vacant 4.00 18,004.00 26.89 0.00 0.00
Total 15.00 66,956.00 32,842.22 394,106.64
8523-ds - International Corp Park II,Richardson
Current Leases
8523-ds 100 VIYU Network Solutions Industrial 5,628.00 2/1/2012 8/31/2017 67 4,221.00 0.75 50,652.00 9.00 0.00 0.00 3,752.00 0.00
8523-ds 104 The Terminix International Co., LP Industrial 6,353.00 7/1/2013 6/30/2018 60 2,647.08 0.42 31,764.96 5.00 0.00 0.00 0.00 0.00
8523-ds 108 Legal Elements of Dallas, LLC Industrial 2,365.00 2/1/2012 6/30/2017 65 1,773.75 0.75 21,285.00 9.00 0.00 0.00 1,970.83 0.00
8523-ds 209 Unified Building Sciences Eng Industrial 6,674.00 11/1/2000 0 3,337.00 0.50 40,044.00 6.00 2.54 0.00 5,756.32 0.00
8523-ds 300 Bowlin Development Corp. Industrial 12,350.00 6/1/2009 9/30/2019 124 8,233.33 0.67 98,799.96 8.00 2.50 0.00 10,548.96 0.00
8523-ds 406 Logical Solutions, Inc. Industrial 12,606.00 5/15/2001 5/31/2018 205 6,723.20 0.53 80,678.40 6.40 2.54 0.00 6,977.08 0.00
8523-ds 501 Dallas Garland & NE Railroad Industrial 7,050.00 1/1/2002 6/30/2015 162 4,112.50 0.58 49,350.00 7.00 2.56 0.00 6,627.00 0.00
8523-ds 503 Varian Medical Systems, Inc. Industrial 5,260.00 6/11/2004 7/31/2016 146 3,616.25 0.69 43,395.00 8.25 0.00 0.00 4,104.80 0.00
8523-ds 107 VACANT 2,124.00 0 0.00 0.00 0.00 0.00 0.00 0.00 0.00 0.00
8523-ds 203 VACANT 9,796.00 0 0.00 0.00 0.00 0.00 0.00 0.00 0.00 0.00
8523-ds 400 VACANT 1,934.00 0 0.00 0.00 0.00 0.00 0.00 0.00 0.00 0.00
8523-ds 504 VACANT 3,990.00 0 0.00 0.00 0.00 0.00 0.00 0.00 0.00 0.00
8523-ds 505 VACANT 8,400.00 0 0.00 0.00 0.00 0.00 0.00 0.00 0.00 0.00
Total Current 84,530.00 34,664.11 0.41 415,969.32 4.92 1.16 0.00 39,736.99 0.00
Total Units Total Area Percentage Monthly Rent Annual Rent
Occupied 8.00 58,286.00 68.95 34,664.11 415,969.32
Vacant 5.00 26,244.00 31.05 0.00 0.00
Total 13.00 84,530.00 34,664.11 415,969.32
8524-ds - International Corp Park III,Richardson
Current Leases
8524-ds 100 Apple Homecare Medical Syupply Industrial 22,800.00 7/1/2013 10/31/2018 64 5,491.00 0.24 65,892.00 2.89 1.80 0.00 10,336.00 0.00
8524-ds 102 Duane Koll Industrial 8,006.00 1/1/2008 6/30/2019 138 2,902.18 0.36 34,826.16 4.35 1.76 0.00 3,836.21 0.00
8524-ds 110 East Hill Industries Industrial 30,600.00 3/1/2010 6/30/2015 64 11,908.50 0.39 142,902.00 4.67 2.01 0.00 26,338.29 0.00
8524-ds 410 Directline Distributing, LLC Industrial 11,094.00 7/12/2012 12/31/2017 66 3,698.00 0.33 44,376.00 4.00 1.80 0.00 5,824.30 0.00
8524-ds 420 Thermo Fisher Scientific, Inc. Industrial 11,700.00 4/20/2009 4/30/2016 85 5,362.50 0.46 64,350.00 5.50 1.92 0.00 0.00 0.00
8524-ds 430 Enterprise Plumbing Industrial 15,600.00 4/1/2006 3/31/2015 108 6,825.00 0.44 81,900.00 5.25 2.01 0.00 8,411.00 0.00
8524-ds 400 VACANT 11,700.00 0 0.00 0.00 0.00 0.00 0.00 0.00 0.00 0.00
Total Current 111,500.00 36,187.18 0.32 434,246.16 3.89 1.71 0.00 54,745.80 0.00
Total Units Total Area Percentage Monthly Rent Annual Rent
Occupied 6.00 99,800.00 89.51 36,187.18 434,246.16
Vacant 1.00 11,700.00 10.49 0.00 0.00
Total 7.00 111,500.00 36,187.18 434,246.16
8525-ds - Sterling Tech Center,Irving
Current Leases
8525-ds A101, A103 Touchpay Holdings, LP Industrial 10,296.00 7/1/2010 6/30/2016 72 6,864.00 0.67 82,368.00 8.00 3.12 0.00 6,455.44 0.00
8525-ds A105 Gentiva Industrial 5,443.00 6/1/2005 12/31/2015 127 3,401.88 0.63 40,822.56 7.50 3.15 0.00 5,598.29 0.00
8525-ds A106 Onsite Health Diagnostics, LLC Industrial 5,698.00 10/1/2010 2/29/2016 65 3,252.61 0.57 39,031.32 6.85 3.17 0.00 17,512.00 0.00
8525-ds A108 Rehab Without Walls Industrial 2,260.00 2/1/2004 11/30/2015 142 1,412.50 0.63 16,950.00 7.50 3.15 0.00 0.00 0.00
8525-ds B100 Staples DCS-2763 Industrial 14,069.00 7/15/2007 5/31/2016 107 9,027.61 0.64 108,331.32 7.70 1.10 0.00 0.00 0.00
8525-ds C100 Kleinfelder Central Industrial 19,692.00 3/21/2010 11/30/2017 93 12,307.50 0.63 147,690.00 7.50 3.14 0.00 0.00 0.00
8525-ds C120 Hexagon Metrology, Inc. Industrial 8,088.00 6/1/2007 10/31/2015 101 7,414.00 0.92 88,968.00 11.00 3.17 0.00 0.00 0.00
8525-ds A110 VACANT 6,680.00 0 0.00 0.00 0.00 0.00 0.00 0.00 0.00 0.00
8525-ds A112 VACANT 5,382.00 0 0.00 0.00 0.00 0.00 0.00 0.00 0.00 0.00
Total Current 77,608.00 43,680.10 0.56 524,161.20 6.75 2.29 0.00 29,565.73 0.00
Description
Unoccupied - Lease still in effect.
Letter of
Credit
Amount
Rent RollProperty: fscpall From Date: 07/31/2014 By Property
Property Unit(s) Lease Lease Type Area Lease From Lease To Term
Page 1 of 2

8/7/2014 4:45 PM
Monthly Monthly Annual Annual Annual Annual Security
Rent Rent Rent Rent Rec. Misc Deposit
Per Area Per Area Per Area Per Area Description
Letter of
Credit
Amount
Rent RollProperty: fscpall From Date: 07/31/2014 By Property
Property Unit(s) Lease Lease Type Area Lease From Lease To Term
Total Units Total Area Percentage Monthly Rent Annual Rent
Occupied 8.00 65,546.00 84.46 43,680.10 524,161.20
Vacant 2.00 12,062.00 15.54 0.00 0.00
Total 10.00 77,608.00 43,680.10 524,161.20
8526-ds - Dallas Tech Center,Dallas
Current Leases
8526-ds A151 Transforming Life Christian Industrial 7,179.00 10/28/2013 1/31/2021 88 3,290.38 0.46 39,484.56 5.50 2.98 0.00 6,867.92 0.00
8526-ds B151, C147, C195 Expresion E Imagen Studio Industrial 24,614.00 6/1/2012 12/31/2020 103 11,803.35 0.48 141,640.20 5.75 2.98 0.00 21,880.73 0.00
8526-ds D100 Knight Security Systems, LLC Industrial 6,754.00 2/1/2008 8/31/2016 103 5,684.62 0.84 68,215.44 10.10 3.01 0.00 7,547.59 0.00
8526-ds D102 Coram Healthcare Corporation Industrial 9,764.00 8/1/2007 6/30/2018 131 8,136.67 0.83 97,640.04 10.00 2.98 0.00 9,967.42 0.00
8526-ds D103 CBS Outdoor Industrial 0.00 1/1/1989 12/31/2019 372 0.00 0.00 0.00 0.00 0.00 0.00 0.00 0.00
8526-ds A130 VACANT 15,121.00 0 0.00 0.00 0.00 0.00 0.00 0.00 0.00 0.00
8526-ds B137 VACANT 15,877.00 0 0.00 0.00 0.00 0.00 0.00 0.00 0.00 0.00
8526-ds D101 VACANT 3,416.00 0 0.00 0.00 0.00 0.00 0.00 0.00 0.00 0.00
Total Current 82,725.00 28,915.02 0.35 346,980.24 4.19 1.74 0.13 46,263.66 0.00
Total Units Total Area Percentage Monthly Rent Annual Rent
Occupied 7.00 48,311.00 58.40 28,915.02 346,980.24
Vacant 3.00 34,414.00 41.60 0.00 0.00
Total 10.00 82,725.00 28,915.02 346,980.24
8527-ds - Westwood III,Farmers Branch
Current Leases
8527-ds 102 Video Solutions Worx, LTD Industrial 2,643.00 4/1/2008 0 1,817.06 0.69 21,804.72 8.25 2.87 0.00 1,817.06 0.00
8527-ds 104 W. Hot Yoga Studio, Inc. Industrial 2,453.00 1/1/2013 3/31/2018 63 1,226.50 0.50 14,718.00 6.00 2.45 0.00 2,033.95 0.00
8527-ds 107 RKM Utility Services, Inc. Industrial 13,755.00 8/1/2012 12/31/2016 53 6,533.63 0.48 78,403.56 5.70 2.45 0.00 10,201.62 0.00
8527-ds 100 VACANT 4,761.00 0 0.00 0.00 0.00 0.00 0.00 0.00 0.00 0.00
8527-ds 101 VACANT 2,907.00 0 0.00 0.00 0.00 0.00 0.00 0.00 0.00 0.00
8527-ds 103 VACANT 2,381.00 0 0.00 0.00 0.00 0.00 0.00 0.00 0.00 0.00
Total Current 28,900.00 9,577.19 0.33 114,926.28 3.98 1.64 0.00 14,052.63 0.00
Total Units Total Area Percentage Monthly Rent Annual Rent
Occupied 3.00 18,851.00 65.23 9,577.19 114,926.28
Vacant 3.00 10,049.00 34.77 0.00 0.00
Total 6.00 28,900.00 9,577.19 114,926.28
8528-ds - Valwood XII,Farmers Branch
Current Leases
8528-ds 100 ASI Business Solutions, LTD Industrial 20,328.00 7/25/2008 7/31/2016 97 11,434.50 0.56 137,214.00 6.75 2.47 0.00 0.00 0.00
8528-ds 101 VACANT 19,045.00 0 0.00 0.00 0.00 0.00 0.00 0.00 0.00 0.00
Total Current 39,373.00 11,434.50 0.29 137,214.00 3.48 1.27 0.00 0.00 0.00
Grand Total 491,592.00 197,300.32 0.40 2,367,603.84 4.82 1.69 0.02 208,990.87 0.00
Page 2 of 2

MANAGEMENT FEES