fssdffsd.pdf
DESCRIPTION
sfasdfasfsdTRANSCRIPT

ARAMIS D1C – APPENDIX 7 July 2004Frequencies data for the fault tree
- 1 -
APPENDIX 7
Frequencies and probabilities data
for the fault tree
Debray B., Piatyszek E., Cauffet F., Londiche H.
Armines, Ecole Nationale Supérieure de Mines de Saint Etienne (France)

ARAMIS D1C – APPENDIX 7 July 2004Frequencies data for the fault tree
- 2 -
TABLE OF CONTENTS
1. Introduction.......................................................................................................................... 4
2. Data sources available .......................................................................................................... 6
2.1 Reliability databases ...........................................................................................................6
2.2 Human reliability data .......................................................................................................16
2.3 Accident databases ..........................................................................................................21
2.4 Other relative distribution of causes...................................................................................28
2.5 Frequency of the critical events.........................................................................................31
2.6 Other absolute frequencies ...............................................................................................32
2.7 Synthesis of the data sources analysis................................................................................41
3. Some comments inspired by the Assurance Project ............................................................. 42
4. Proposal of a method for evaluating the frequency of the critical event.................................. 45
5. Conclusion......................................................................................................................... 47
6. References......................................................................................................................... 49
6.1 ARAMIS Documents.......................................................................................................49
6.2 Other documents..............................................................................................................49
7. Additional data................................................................................................................... 51
7.1 HSE reference failure frequencies ....................................................................................51
7.2 I-Risk..............................................................................................................................52

ARAMIS D1C – APPENDIX 7 July 2004Frequencies data for the fault tree
- 3 -
Summary
One of the main step of the ARAMIS methodology for the identification of reference accidentscenarios is the calculation of the frequency (per year) of the critical event. It is shown in themain report that the frequency (per year) of the critical event can be estimated in two ways: either byestimating the frequency (probability) of the initiating events in the fault tree, and combining thesefrequencies (probabilities) with the actions of safety barriers to calculate the critical event frequency,or by choosing a generic frequency for the critical event, issued from published database.
This appendix aims to give information to the reader in order to be able to put frequenciesin the fault tree part of the bow-tie. Other appendices give information on how to take barriersinto consideration in order to calculate the frequency of the critical event.
First of all, this document gives an overview of the different data sources available. Chapter 2gives information and figures about reliability databases, human reliability data, accidents databasesand other data. Paragraph 2.7 presents a synthesis of data collected for this report, clearly showingthat available data are sparse and scattered in the various levels of the fault tree.
Chapter 3 recalls the conclusion of the European project "Assurance", during which it has beenshown that the estimation of failure frequencies is a topic in which a great discrepancy exists amongexperts.
Having in mind these limitations, ARAMIS proposes to calculate the frequency of the criticalevent starting from the frequency (probability) of the initiating events, combining them in afault tree and taking into account the influence of safety barriers in the calculation.
In the previous steps of the analysis (see main report), the generic fault trees have been built for theequipment analysed.
Plant specific data should be preferred for the failure frequencies of these trees, ifavailable. If not, chapter 4 and tables in chapter 7 give indications about what kind offigures should be used in what circumstances.

ARAMIS D1C – APPENDIX 7 July 2004Frequencies data for the fault tree
- 4 -
1. Introduction
The aim of this step of the ARAMIS project is to provide the user with the maximum number ofelements to evaluate the frequency of the critical events resulting from the fault tree analysis of theplant. Once this frequency is evaluated, it should contribute to the selection of the referencescenarios, the definition of the requirements in terms of safety barriers and safety functions, theassessment of the safety barriers efficiency.
The elements that would be needed by the user of the ARAMIS methodology are a method forevaluating the frequency of the critical event and data to apply the method. This documentprovides an analysis of the available data and their possible use in the framework of theARAMIS methodology.
Along this document different possibilities will be discussed, as they correspond to different trends inthe probabilistic approach. For each of them, its applicability within the framework of ARAMIS withthe available data will be discussed. Three different approaches have been considered :
a. Evaluate specific frequencies from a fault tree and event tree analysis : this corresponds tothe most classical approach in the QRA. The frequency of the critical event attempts to takeinto account all the possible failure of the components and of their barriers. It is used as aninput for the downstream evaluation of the consequences and their probabilities (societalrisk).
b. Provide generic frequencies for the critical events. This approach is used in theNetherlands where the frequency of the critical event is not calculated on the basis of theactual plant configuration but is assumed on the basis of generic figures. In this country,frequencies have been assessed for standard configurations of plants and serve as referencesin the QRA (Quantitative Risk Assessment). These values implicitly take the presence ofsafety barriers into account.
c. Provide initial data which will serve as reference for the barrier approach. Thispossibility was discussed in Maastricht (ARAMIS meeting June 2003) as an alternative wayto evaluate frequencies (probabilities). It is compatible with the approach developed byINERIS and adapted in the framework of WP3 for the assessment of barrier efficiency. Theidea is to decrease an initially high reference frequency (probability) by factors whichcorrespond to the efficiency of the barriers. This initial frequency (probability) wouldcorrespond to the frequency of the critical event without any barrier.
A first feeling about accident data would be that there are plenty of them and that their use isobvious. Many reference books about risk analysis simply expose the basics of fault tree and eventtree analysis and leave aside the problem of finding or producing data to do the quantitativeassessment. Some of them however warn the reader with the difficulty of this task.

ARAMIS D1C – APPENDIX 7 July 2004Frequencies data for the fault tree
- 5 -
The first part of this report lists and analyses the different categories of data available, which are offour main types :
o Reliability databases
o Human reliability data
o Accident databases
o Event frequencies available in the literature
The difficulties with the use of these data in the framework of the ARAMIS methodology isdiscussed. It lays mainly in the fact that the fault trees build in the first ARAMIS work package arenot classical fault trees similar to those used for reliability analysis but generic fault trees with a limitednumber of levels and a large number of minimal cut sets.
After a short synthesis of the data source and their applicability, a brief comment is made about theresult of the European project ASSURANCE, which brings enlightenment about the relativity of theQRA. This project shows that even with a rather complete description of an industrial site andprocess, very large deviations can be observed. This is a fortiori true for a generic approach.
From these preliminary conclusions, a series of recommendations is given on how the frequencies(probabilities) should be calculated within the framework of the ARAMIS methodology in an actualindustrial site. An attempt is then made to provide indicative reference data which can be used asinitial references for the barrier approach.
To conclude this introduction it seems interesting to quote the following sentence from the HSE riskassessment guide.
“Base event failure rate data are essential components of risk assessments, but they must be relevantand applicable to site circumstances. Simply taking a number from the literature withoutconsideration of whether it applies to the site in question is unlikely to be acceptable. On the otherhand, use of a failure rate that is not consistent with historical or relevant generic industry data mustbe justified. The origin of all probabilities quoted in a safety report should be given so that, wherenecessary, Assessors can make a judgement on their appropriateness.” (HSE assessment criteria)

ARAMIS D1C – APPENDIX 7 July 2004Frequencies data for the fault tree
- 6 -
2. Data sources available
2.1 Reliability databases
Fault tree analysis is now a well known and used method to evaluate the reliability of equipment andsystems. FTA has been recommended as one of the main components of the QRA (QuantitativeRisk assessment) analysis. It is designed to provide an evaluation of the overall probability of anaccident scenario, knowing the failure rates of the individual components involved in the scenario.
In this purpose, reliability databases have been developed by groups of industrial companies. Severalof them have been inventoried by the RISO [Akhmetjanov]. The first part of this document makes anextensive use of this inventory. It first analyses the industrial field to which these data apply toeliminate those which are not adapted to the process industry concerned by the SEVESO IIdirective. The content of the databases is then be discussed to evaluate how it can be used in hecontext of ARAMIS.
The application fields of the databases identified by Risoe are the following :
- Nuclear industry
- Military industry
- Automotive industry
- Aeronautic industry
- Process industry
- Offshore industry
- Electronic components of technical systems
Among these, the only databases applicable to the process industry are the following :
- OREDA : Offshore reliability database. [OREDA]
- GIDEP (only available to companies having a contract with the US government)
- AIChe/CCPS reliability database
ARAMIS D1C – APPENDIX 7 July 2004Frequencies data for the fault tree
- 7 -
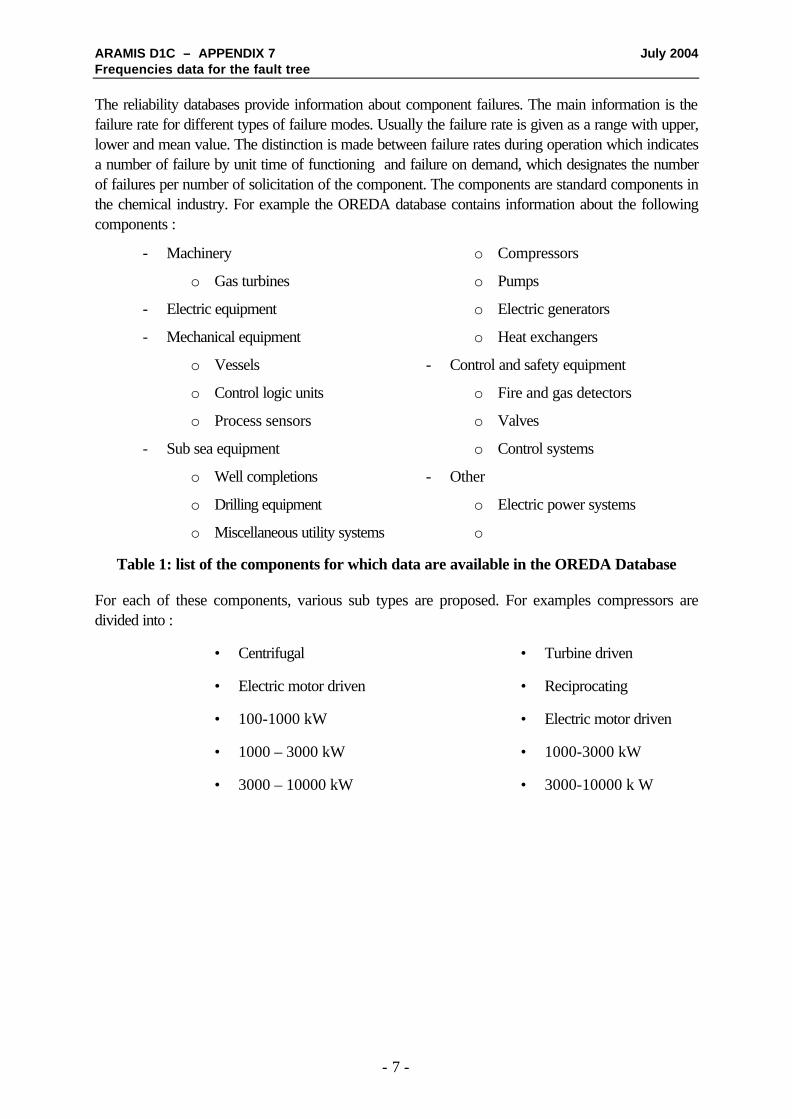
The reliability databases provide information about component failures. The main information is thefailure rate for different types of failure modes. Usually the failure rate is given as a range with upper,lower and mean value. The distinction is made between failure rates during operation which indicatesa number of failure by unit time of functioning and failure on demand, which designates the numberof failures per number of solicitation of the component. The components are standard components inthe chemical industry. For example the OREDA database contains information about the followingcomponents :
- Machinery o Compressors
o Gas turbines o Pumps
- Electric equipment o Electric generators
- Mechanical equipment o Heat exchangers
o Vessels - Control and safety equipment
o Control logic units o Fire and gas detectors
o Process sensors o Valves
- Sub sea equipment o Control systems
o Well completions - Other
o Drilling equipment o Electric power systems
o Miscellaneous utility systems o
Table 1: list of the components for which data are available in the OREDA Database
For each of these components, various sub types are proposed. For examples compressors aredivided into :
• Centrifugal • Turbine driven
• Electric motor driven • Reciprocating
• 100-1000 kW • Electric motor driven
• 1000 – 3000 kW • 1000-3000 kW
• 3000 – 10000 kW • 3000-10000 k W

ARAMIS D1C – APPENDIX 7 July 2004Frequencies data for the fault tree
- 8 -
For each component, various failure modes are proposed with very different failure rates for each.For example, the failure modes envisaged for compressors are given in Table 2.
• Critical • External leakage
• Failed to start • Fail while running
• High gas flow • Overheated
• Other • Overhaul
• Unknown • Vibration
• Degraded • External leakage
• Fail while running • High gas flow
• Low gas flow • Overheated
• Other • Overhaul
• Unknown • Vibration
• Incipient •
Table 2: failure modes for compressors in the OREDA database
Detailed are also given in OREDA handbook of the repartition of the failures among the differentcomponents constituting the equipment. The following table is an example of an OREDA table.

ARAMIS D1C – APPENDIX 7 July 2004Frequencies data for the fault tree
- 9 -
Figure 1: example of OREDA data

ARAMIS D1C – APPENDIX 7 July 2004Frequencies data for the fault tree
- 10 -
Figure 2: Example of CCPS reliability data
Other databases are build by industrial groups. For example the French UIC (union of the chemicalindustries) has been developing a database for 20 years by collecting incident data from chemicalplants of the Rhône-Alpes region.

ARAMIS D1C – APPENDIX 7 July 2004Frequencies data for the fault tree
- 11 -
The following tables are examples of the data that can be obtained from this database.
First step of databasedevelopment
Second step of databasedevelopment
EQUIPMENTSYear of
introduction inthe database
Number ofequipment
Year ofintroduction in
the database
Number ofequipment
Stirrers 1988 2 550 1999 1 863
Analysers 1988 8
Sensors 1988 14 107 2002 24 944
Regulators 1988 7 470
Compressors 1988 78
Heat exchangers 1988 640
Spinning Dryer 1988 129 2002 86
Electric motors 1988 5 572
Pumps 1988 1 720 1996 5 276
Regulation valves 1988 13 374
Transformers 1988 76
Inverters 1988 8 2002 209
Reducer multiplier 1988 1 247
Safety valves 1988 460 2003 4 691
Automated systems 2002 333
Table 3: components inventoried in the UIC Database
ARAMIS D1C – APPENDIX 7 July 2004Frequencies data for the fault tree
- 12 -
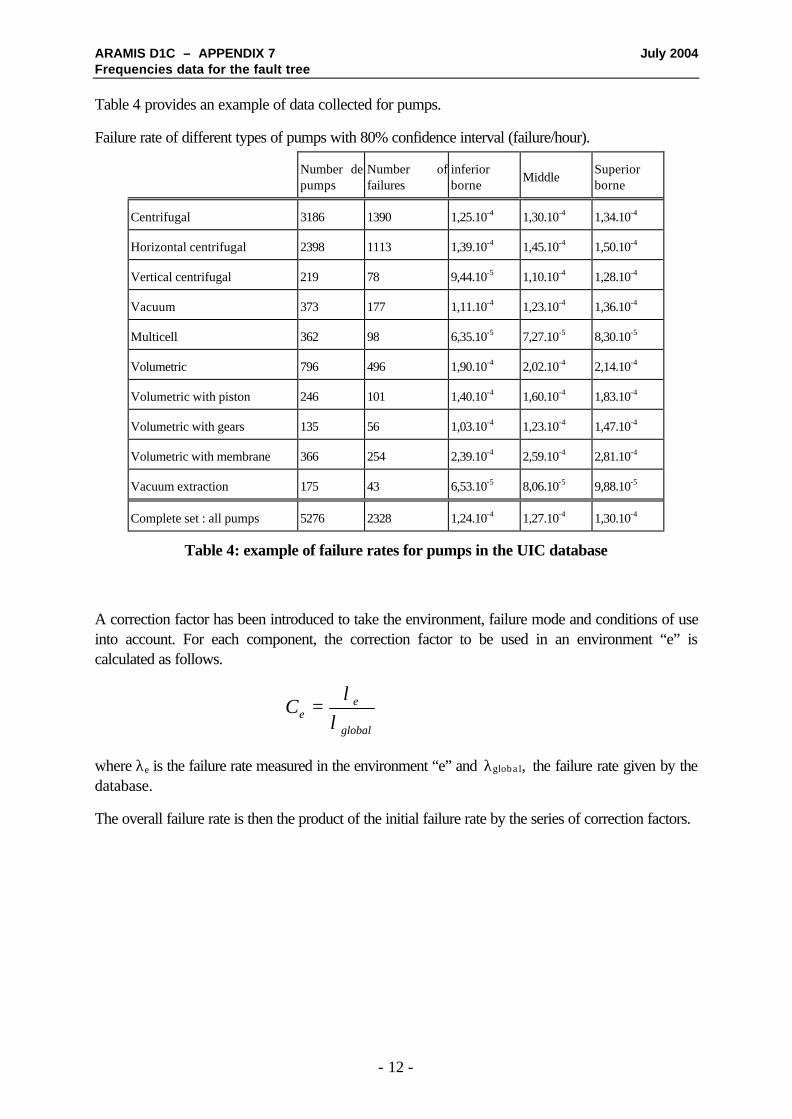
Table 4 provides an example of data collected for pumps.
Failure rate of different types of pumps with 80% confidence interval (failure/hour).
Number depumps
Number offailures
inferiorborne
MiddleSuperiorborne
Centrifugal 3186 1390 1,25.10-4 1,30.10-4 1,34.10-4
Horizontal centrifugal 2398 1113 1,39.10-4 1,45.10-4 1,50.10-4
Vertical centrifugal 219 78 9,44.10-5 1,10.10-4 1,28.10-4
Vacuum 373 177 1,11.10-4 1,23.10-4 1,36.10-4
Multicell 362 98 6,35.10-5 7,27.10-5 8,30.10-5
Volumetric 796 496 1,90.10-4 2,02.10-4 2,14.10-4
Volumetric with piston 246 101 1,40.10-4 1,60.10-4 1,83.10-4
Volumetric with gears 135 56 1,03.10-4 1,23.10-4 1,47.10-4
Volumetric with membrane 366 254 2,39.10-4 2,59.10-4 2,81.10-4
Vacuum extraction 175 43 6,53.10-5 8,06.10-5 9,88.10-5
Complete set : all pumps 5276 2328 1,24.10-4 1,27.10-4 1,30.10-4
Table 4: example of failure rates for pumps in the UIC database
A correction factor has been introduced to take the environment, failure mode and conditions of useinto account. For each component, the correction factor to be used in an environment “e” iscalculated as follows.
global
eeC
λλ
=
where λe is the failure rate measured in the environment “e” and λglobal, the failure rate given by thedatabase.
The overall failure rate is then the product of the initial failure rate by the series of correction factors.

ARAMIS D1C – APPENDIX 7 July 2004Frequencies data for the fault tree
- 13 -
The following expression is an example of the calculation of the failure rate for a pump :
λk = 1,445.10-4 × 1,283 × 0,962 × 1,146 × 0,713 × 1,551 × 1,249 × 0,337
λk = 0,951.10-4 failure / hour
Correction factors function of the environment of the pump with 68% confidence interval.
Number ofpumps
Number offailures
Inferiorborne
Middle Superior borne
Water 398 135 0,75 1,06 1,36
Chemical 2613 823 0,84 1,28 1,73
Corrosive 1785 441 0,51 0,89 1,26
Loaded 580 195 0,69 1,27 1,84
Hot 382 154 0,84 1,14 1,45
Product
Viscous 127 39 0,40 1,21 2,02
from 0 to 1100 rev/min 261 182 1,77 2,96 4,16
from 1100 to 1800rev/min
1682 664 0,63 0,85 1,06
from 1800 to 3500rev/min
2189 982 0,68 0,96 1,25
Rotation speed
> 3500 rev/min 7 21 1,88 11,27 20,66
Braids 1084 406 1,01 1,05 1,09
G.M.S. 2150 732 0,72 0,74 0,75
G.M.D. 495 217 1,07 1,15 1,22
Immerged pump 163 50 0,48 0,57 0,67
Water tightness
Magnetic stirring 40 20 1,18 1,42 1,66
Chemical
Rotationspeed
EtancheityMaterial
FunctioningStart up
Failure rate in thedatabase
Failuremode

ARAMIS D1C – APPENDIX 7 July 2004Frequencies data for the fault tree
- 14 -
Cast iron 993 553 0,61 1,58 2,55
Stainless steel 1942 716 0,45 0,71 0,98
Teflon 57 24 0,49 1,49 2,48
PVDF 109 47 1,09 2,43 3,77
Ceramic 10 24 7,85 17,07 26,30
Material
Graphite 80 57 0,32 2,02 3,73
Continuous > 5000 h/y 2215 1324 0,53 0,74 0,95
500 < Discontinuous
< 5000 h/y2006 662 0,95 1,55 2,15
Type of functioning
Occasional < 500 h/an 173 89 4,84 12,23 19,61
< 1 / week 1863 1161 0,38 0,70 1,01Frequency ofstarting > 1 / week 2151 742 0,83 1,25 1,67
Table 5: examples of correction factors in the UIC database
95 % lower bound Average 95 % upper bound
Tightness 0,146 0,338 0,529
Mechanical part 0,099 0,281 0,463
Coupling part 0,001 0,086 0,170
Table 6: examples of correction factors according to the failure mode
This example shows that failure rates are highly dependent on the environment, on the conditions ofuse and on the failure mode.

ARAMIS D1C – APPENDIX 7 July 2004Frequencies data for the fault tree
- 15 -
The same approach is presented in the CCPS guidelines [CCPS], inspired by the methodsrecommended by du Pont in their Process Safety Management Reference Manual.
Adjustment factors
Equipment failure rate influences Instruments Valves
Process medium factors
Corrosion 1.07 1.14
Erosion 1.14 1.28
Fouling, plugging 1.07 1.14
Pulsating flow 1.14 1.07
Temperature extremes 1.07 1.07
External environmental factors
Vibration 1.42 1.21
Corrosive atmosphere 1.21 1.21
Dirty atmosphere 1.07 1.07
High temperature and/or humidity 1.07 1.07
Location factors
Exposed mechanical damage 1.07 1.07
Inaccessible for inspection 1.07 1.07
Table 7: Generic failure rate data adjustment factors in the Du Pont’s Process SafetyManagement Reference Manual
Using data from reliability databases to assess the frequency of critical events:
The use of reliability databases will now be discussed with respect to the objectives defined in theintroduction.
a. Evaluate specific frequencies from a fault tree and event tree analysis.
Even if reliability databases are often used for maintenance purposes, their use for evaluating thespecific frequency of critical events is widespread. It would therefore seem obvious that they can beused to assess the frequencies of critical events during an ARAMIS analysis. It is unfortunately notso simple. The fault trees build during WP1A of ARAMIS are generic fault trees. As such theypresent several characteristics which make them difficult to use with reliability databases :
• They are limited in depth to five levels (even four, as the first one is the critical event),which has the consequence that the failure of plant components often does notexplicitly appear in the tree.

ARAMIS D1C – APPENDIX 7 July 2004Frequencies data for the fault tree
- 16 -
• When it does, the precise type of component involved is not given, which makesimpossible the selection of a failure rate in the database.
• In the same way, the failure mode is not given, which again has an enormousimportance on the definition of the failure rate. Especially, the distinction is not madebetween failure in use and failure on demand.
• The number of components involved is not provided. Depending on the type ofcomponents and the failure mode, the number of components can have diverseinfluence on the overall failure rate. The duplication of one component can beconsidered as a way to reduce the failure rate by introducing a redundancy if onlyone component is necessary (and provided that the configuration of the equipmentreally permits the second component to relieve the first one in case of failure) or itcan be considered as an increase of the probability of failure if two components arenecessary. The failure rate would be doubled in such a configuration. This isparticularly true for pipes, for which the probability of failure is directly linked to thelength of the pipe.
For all these reasons it is not possible to use directly the reliability databases with the generic faulttrees to calculate the frequency of the critical event. Yet, this would be possible if the fault trees wereused as a base for the definition of scenarios and the elaboration of specific and detailed fault trees.In such a case, it would be possible to make the specific components appear with their dread failuremode and environmental information.
b. Provide generic frequency for the critical events.
The reliability databases do not contain critical events frequencies but rather frequencies ofcomponent failure. To calculate a generic frequency for the critical event using reliability database itwould be necessary to use the generic fault trees with the reliability data. This has been discussedabove, and is not possible.
c. Provide initial data which will serve as reference for the barrier approach.
Here again, the configuration of the generic fault trees makes difficult using the reliability data tocalculate an initial value corresponding to the frequency of the critical event without safety barriers.Yet, assumptions could be made to obtain a rough estimate of the upper bound of the critical eventfrequencies as will be proposed in the last section of this document.
2.2 Human reliability data
“Data tells us that human failures contribute up to 80% of industrial accidents. Even in oil refineries,which are highly capitalised and automated, the figure is 50%.” (HSE safety report assessmentguidelines)
Human error is a root cause for all the direct causes identified at the origin of the critical events.Therefore, an evaluation of the critical event frequency should use an evaluation of human errorfrequency (probability). The following paragraphs examine the possibility of using human reliabilityanalysis to assess the overall frequency of the critical events.
ARAMIS D1C – APPENDIX 7 July 2004Frequencies data for the fault tree
- 17 -
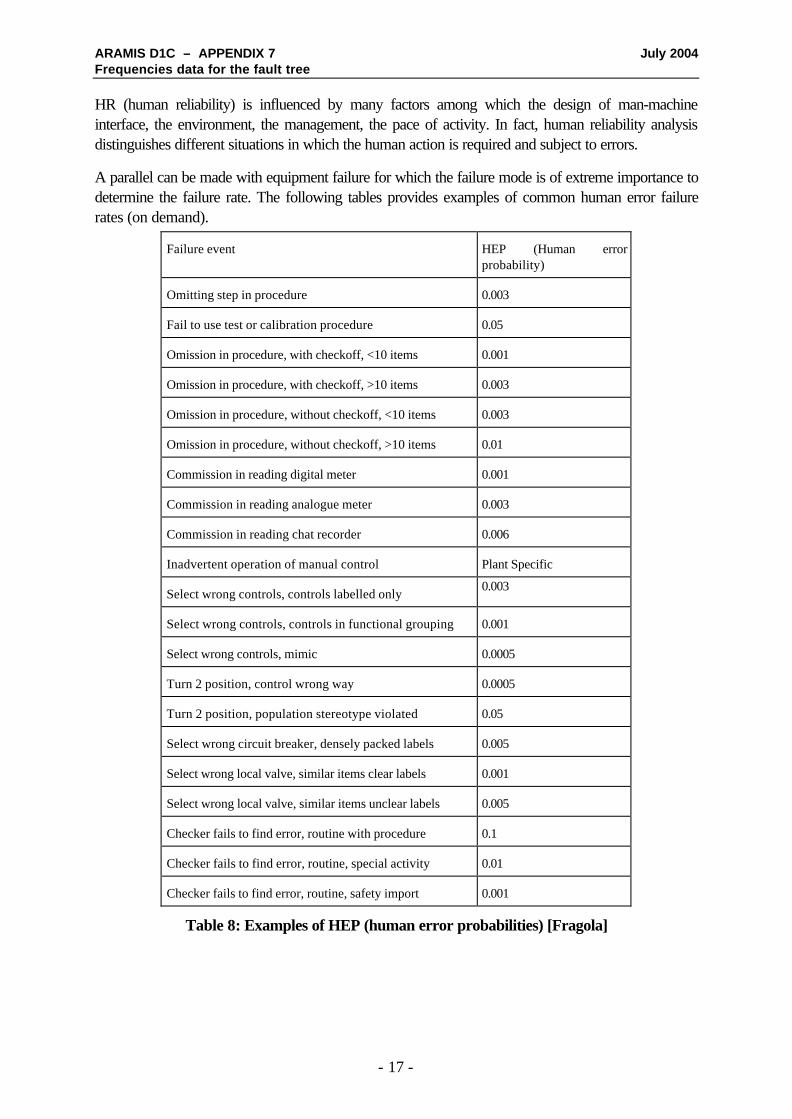
HR (human reliability) is influenced by many factors among which the design of man-machineinterface, the environment, the management, the pace of activity. In fact, human reliability analysisdistinguishes different situations in which the human action is required and subject to errors.
A parallel can be made with equipment failure for which the failure mode is of extreme importance todetermine the failure rate. The following tables provides examples of common human error failurerates (on demand).
Failure event HEP (Human errorprobability)
Omitting step in procedure 0.003
Fail to use test or calibration procedure 0.05
Omission in procedure, with checkoff, <10 items 0.001
Omission in procedure, with checkoff, >10 items 0.003
Omission in procedure, without checkoff, <10 items 0.003
Omission in procedure, without checkoff, >10 items 0.01
Commission in reading digital meter 0.001
Commission in reading analogue meter 0.003
Commission in reading chat recorder 0.006
Inadvertent operation of manual control Plant Specific
Select wrong controls, controls labelled only0.003
Select wrong controls, controls in functional grouping 0.001
Select wrong controls, mimic 0.0005
Turn 2 position, control wrong way 0.0005
Turn 2 position, population stereotype violated 0.05
Select wrong circuit breaker, densely packed labels 0.005
Select wrong local valve, similar items clear labels 0.001
Select wrong local valve, similar items unclear labels 0.005
Checker fails to find error, routine with procedure 0.1
Checker fails to find error, routine, special activity 0.01
Checker fails to find error, routine, safety import 0.001
Table 8: Examples of HEP (human error probabilities) [Fragola]

ARAMIS D1C – APPENDIX 7 July 2004Frequencies data for the fault tree
- 18 -
Other authors provide data for human error probabilities which are more generic and, therefore,more easy to use in the framework of ARAMIS. However, some though has to be made about themeaning of these data and their use.
Type of Activity Probability of Error per Task
Critical Routine Task (tank isolation) 0.001
Non-Critical Routine Task (misreading temperature data) 0.003
Non Routine Operations (start up, maintenance) 0.01
Check List Inspection 0.1
Walk Around Inspection 0.5
High Stress Operations; Responding after major accident
- first five minutes 1
- after five minutes 0.9
- after thirty minutes 0.1
- after several hours 0.01
Table 9: Human Error Rates (Source: US Atomic Energy Commission Reactor Safety Study,1975)

ARAMIS D1C – APPENDIX 7 July 2004Frequencies data for the fault tree
- 19 -
Type of Activity Probability of Error per Task
Simplest Possible Task
Overfill Bath 0.00001
Fail to isolate supply (electrical work) 0.0001
Fail to notice major cross roads 0.0005
Routine Simple Task
Read checklist or digital display wrongly 0.001
Set switch (multiposition) wrongly 0.001
Routine Task with Care Needed
Fail to reset valve after some related task 0.01
Dial 10 digits wrongly 0.06
Complicated Non-routine Task
Fail to recognise incorrect status in roving inspection 0.1
Fail to notice wrong position on valves 0.5
Table 10: Human Error Rates (Source: Smith DJ 1993)
Practically, the failure rate depends a lot on the type of activity performed by the operator and on thetime available to do it. The following figures illustrates this dependency. The more time is available tothe operator to perform a given task the lower is the probability of error.

ARAMIS D1C – APPENDIX 7 July 2004Frequencies data for the fault tree
- 20 -
Figure 3: TRCs (time reliability curves) based on Human response Time Regime(Dougherty and Fragola cited in [Fragola])
Figure 4: Human error probability of diagnosis of one abnormal event by control roompersonnel (after Swain and Guttmann, 1983) reproduced in [Lees]

ARAMIS D1C – APPENDIX 7 July 2004Frequencies data for the fault tree
- 21 -
Here again, it seems obvious that the generic nature of the fault trees prevents from using directly thehuman reliability data to evaluate the frequency of the critical event. Most of the time, the humanfailure modes are not specified, the number of tasks is not known. The latest is a problem becausethe human failure rates concern mostly failures on demand. The global failure rate to be applied istherefore the product of the failure rate by the number of tasks.
Any way, if human reliability data cannot be used directly in the generic fault trees to evaluate thefrequencies of critical events, they can be used as references to produce basic frequencies which willbe reduced by the application of prevention barriers.
2.3 Accident databases
The accident databases provide general and detailed information about past accidents in varioustypes of industries and transport activities. These databases are build from the accident declarationsby plant operators. The database structure varies from one database to another. Some databaseshave very detailed fields (MARS), others only provide textual descriptions of accidents (ARIA). Thenumber of accidents accessible also varies a lot as well as the scope and reference territory.
For all these reasons, the results obtained by analysing the databases have to be taken cautiously.
An extensive analysis of MARS, HADES and MHIDAS has been made by FPMs, JRC and UPC[Delvosalle MOOA]. The aim of the present document is not to reproduce the results obtained bythis analysis but rather to discuss their applicability in the objective of producing probability figureswhich could be used to evaluate the risk in a process plant.
The analysis of accident databases provides information about the relative distribution of causes.
2 7 . 6 62 6 . 9 5
1 4 . 1 8
8 . 5 17 . 0 9
4 . 9 64 . 2 6
2 . 8 42 . 1 3
0 . 7 1 0 . 7 1 0 . 0 0 0 . 0 00 . 0 0 0 . 0 00
5
1 0
1 5
2 0
2 5
3 0
Freq
uenc
y (%
)
Equip
ment fa
ilure
Manag
emen
t
Operato
r erro
rUn
known
Insuffic
ient co
ntainm
ent sp
ecifica
tion Overpr
essu
re
Corros
ion
High T
emper
ature
Contain
ment sp
ecifica
tion no
t met
Low Te
mperatu
re Impa
ct
Erosio
n
Underp
ressur
e
Extern
al loa
ding
Wrong e
quipm
ent/loc
ation
Figure 5: Causes distribution in MARS (141 accidents) [Delvosalle MOOA]

ARAMIS D1C – APPENDIX 7 July 2004Frequencies data for the fault tree
- 22 -
31,23
20,4616,59
11,95
3,67 2,95 2,911,610,005,00
10,0015,0020,0025,0030,0035,00
Freq
uenc
y
Mecha
nical f
ailure
Human
facto
r
Exter
nal ev
ents
Violen
t reac
tion
Impa
ct fail
ure
Upset
proce
ss co
nditio
ns
Instru
ment fa
ilure
Service
failur
e
Figure 6: distribution of causes in MHIDAS [Delvosalle MOOA]
23,68
19,08 18,42
11,849,87
8,55
4,61 3,95
0,00
5,00
10,00
15,00
20,00
25,00
Freq
uenc
y
Equipm
ent fa
ilure
Operat
or err
or
Undefin
ed
Domino
effec
ts
Overpr
essu
re
Manag
emen
t
Corros
ion
Exter
nal ag
gressi
on
Figure 7 : Repartition of causes in HADES [Delvosalle MOOA]
A first analysis of these data shows that, even if they bring some information about the mostobserved accidents, they remain difficult to exploit to derive failure probabilities.
Differences can be observed between the databases in terms of cause classification, and values ofthe relative distribution. The types of cause are different from one base to another and are different

ARAMIS D1C – APPENDIX 7 July 2004Frequencies data for the fault tree
- 23 -
from the causes retained in the ARAMIS fault trees. The category “equipment failure” containsevents which could be attributed to other categories of causes if a deeper analysis was made. Table11 provides a rough analysis of the IChemE Accident database [IchmE]. Among the causesidentified in this database, many can be found in the ARAMIS fault trees. Others were not identified.This shows that ARAMIS fault trees should not be considered as exhaustive but rather as a base foran initial risk analysis, which should be completed according to the local context.
number ofaccidents
%
chemical causesadditional chemical present
accidental mixing 39 0,73
contamination
cleaning inadequate 38 0,71solids deposition 18 0,33
oxygen enrichment 4 0,07residue 2 0,04
channelling in catalyst bed 0 0,00chemical missing
lack of stabiliser/inhibitor 3 0,06low level of catalyst 3 0,06
chemicals added incorrectly 24 0,45incorrect chemical present
incorrect chemical concentration 4 0,07incorrect material of construction 36 0,67unwanted chemical reaction
auto ignition 57 1,06decomposition
auto decomposition 10 0,19polymerisation 38 0,71runaway reaction 75 1,39spontaneous combustion 37 0,69thermic reaction 8 0,15uncontrolled reaction 10 0,19
equipment causescontrol failure
computer failure 9 0,17electrical equipment failure
arcing 32 0,59flashover 8 0,15generator failure 1 0,02lack of earthling 33 0,61Short circuit 50 0,93Spark 232 4,31
Equipment missing 5 0,09incorrect equipment installed 37 0,69instrumentation failure 99 1,84material of construction failure
brittle fracture 22 0,41

ARAMIS D1C – APPENDIX 7 July 2004Frequencies data for the fault tree
- 24 -
number ofaccidents
%
corrosion 295 5,48crack 100 1,86creep 12 0,22embrittlement 10 0,19erosion 8 0,15fracture 61 1,13hydrogen embrittlement 2 0,04metal fatigue 19 0,35rusting 9 0,17Stress 27 0,50stress corrosion cracking 9 0,17weld failure 86 1,60
mechanical equipment failureagitation failure 5 0,09bearing failure 38 0,71blower failure 1 0,02bolt failure
bolts incorrectly tightened 9 0,17connector failure 5 0,09cooling tower collapse 1 0,02dam failure 1 0,02elbow failure 0 0,00equipment misalignment 4 0,07expansion joint failure 3 0,06flange failure 18 0,33flexible coupling failure 5 0,09floating roof failure 9 0,17gasket failure 43 0,80gauge glass failure 9 0,17hose failure 45 0,84joint failure 29 0,54lining failure 4 0,07pipeline failure 75 1,39pump failure 47 0,87refractory failure 3 0,06seal failure 62 1,15shaft failure 1 0,02tank failure 28 0,52tube failure 63 1,17valve failure 156 2,90vessel failure 9 0,17
safety equipment failurealarm failure 14 0,26bursting disk failure
bursting disk fails prematurely 1 0,02safety relief valve failure 9 0,17

ARAMIS D1C – APPENDIX 7 July 2004Frequencies data for the fault tree
- 25 -
number ofaccidents
%
external causesdeliberate acts
arson 8 0,15bomb 3 0,06civil war 1 0,02missile 1 0,02sabotage 76 1,41terrorism 31 0,58vandalism 16 0,30
excessive vibration 55 1,02fire/explosion
lagging fire 22 0,41friction heat 11 0,20hot surface 155 2,88mechanical spark 15 0,28natural disaster
avalanche 1 0,02earth movement
earth tremor 2 0,04earthquake 20 0,37excavation damage 52 0,97landslide 3 0,06settlement 2 0,04subsidence 6 0,11
weather effectscold weather 54 1,00flood 17 0,32fog 25 0,46lightning 140 2,60rain 16 0,30storm damage
strong windshurricane 46 0,86typhoon 0
sunlight 4 0,07thermal expansion
hot weather 6 0,11
human causesAdditional incorrect operation 3 0,06Cigarette 31 0,58Contractor error 44 0,82design fault 14 0,26design or procedure error
cleaning procedure incorrect 11 0,20design inadequate 202 3,76faulty instructions 12 0,22

ARAMIS D1C – APPENDIX 7 July 2004Frequencies data for the fault tree
- 26 -
number ofaccidents
%
inadequate guarding 13 0,24maintenance procedure error 28 0,52safety procedure inadequate 286 5,32standards inadequate 5 0,09
Document errors 5 0,09drug misuse 1 0,02operation inadequate
competency lacking 16 0,30draining of line insufficient 7 0,13identification inadequate 10 0,19inspection inadequate 68 1,26installation inadequate 35 0,65isolation inadequate 51 0,95labelling incorrect 34 0,63maintenance inadequate 59 1,10pipe laying inadequate 1 0,02testing inadequate 33 0,61
operation omittedatmosphere not tested 8 0,15
operator error 256 4,76operator/crew fatigue 1 0,02shift change 5 0,09
management system inadequateManning levels inadequate 1 0,02modification procedures inadequate 22 0,41permit to work system inadequate 29 0,54training inadequate 27 0,50
Process causesBackflow 24 0,45exothermic reaction
thermal instability 5 0,09flameout 10 0,19Friction spark 0 0,00frothing 1 0,02incorrect flow rate
flow rate too highhigh loading rate 2 0,04Inadequate venting 4 0,07
flow rate too lowflow restriction
vent blocked 9 0,17no flow 12 0,22
incorrect pressurehigh pressure
hydraulic pressure 6 0,11internal explosion 3 0,06

ARAMIS D1C – APPENDIX 7 July 2004Frequencies data for the fault tree
- 27 -
number ofaccidents
%
overpressurisation 192 3,57pressure surge 16 0,30pump dead heated 3 0,06water hammer 12 0,22
low pressureimplosion 7 0,13vacuum 23 0,43
incorrect Temperaturehigh temperature
overheating 188 3,50thermal degradation 5 0,09
low temperaturecold brittleness 1 0,02freezing 11 0,20inadequate insulation 2 0,04
leakair leaking into system 2 0,04flange leak 47 0,87gasket leak 1 0,02joint leak 6 0,11
Offloading 20 0,37Overflowtank overflow 2 0,04Overspeed 5 0,09reverse flow 20 0,37rollover 1 0,02static 192 3,57under filling of vessel 1 0,02water slug 2 0,04unidentified cause 77 1,43utility failure
air system failure 10 0,19fuel supply failure 1 0,02hydraulic failure 1 0,02inert gas failure 2 0,04lubrication failure 6 0,11power supply failure 70 1,30steam failure 3 0,06
Table 11: relative distribution of causes in the IchemE accident database (all types ofactivities excluding transportation). This relative frequency is only aimed at illustrating the
diversity of causes.

ARAMIS D1C – APPENDIX 7 July 2004Frequencies data for the fault tree
- 28 -
2.4 Other relative distribution of causes
Apart from accident databases, different bibliographical sources provide tables with relativerepartition of causes. The most interesting are those which cross the immediate cause, such aserosion or corrosion, with the root cause, human error, poor management,… In the framework ofARAMIS, the immediate causes could correspond to the direct causes and the root causescorrespond to the undesirable events.
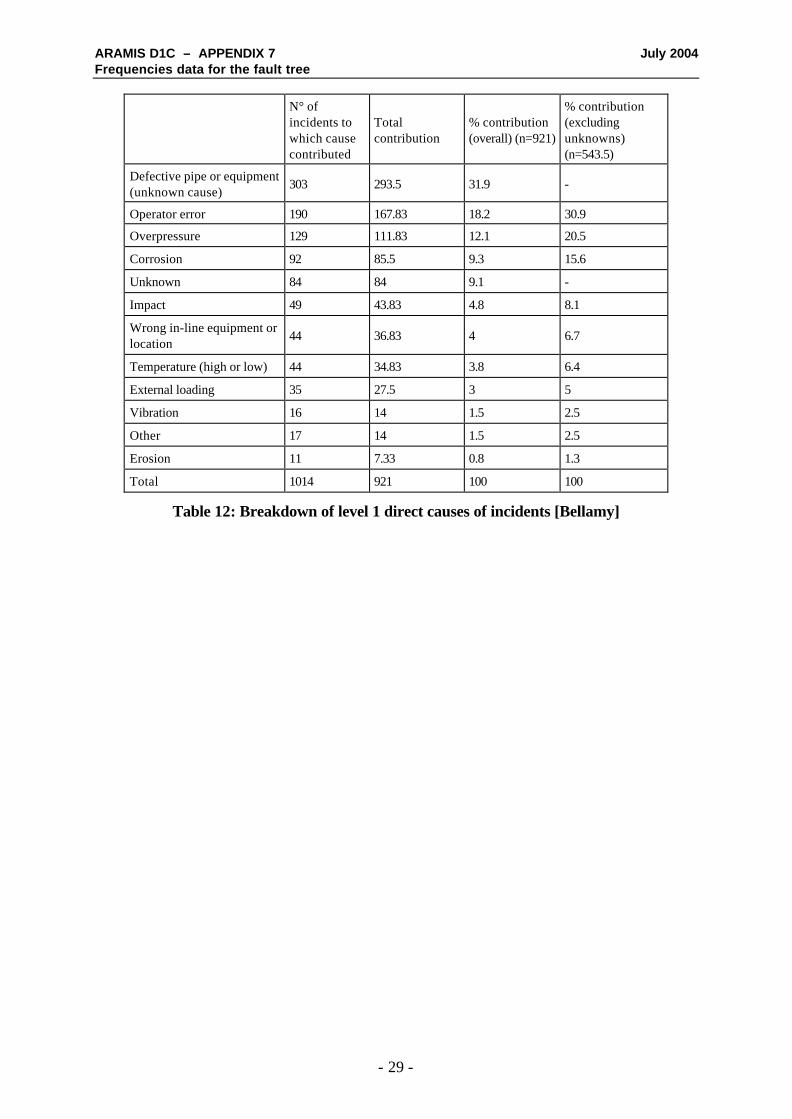
An interesting complement to this classification was brought by a contract research report by theHSE executive [Bellamy], which proposes a three entry classification of accident causes : directcause, origin of failure and recovery failure. The following figure exposes the principle of such aclassification applied to pipework failures. What is interesting in this approach is that it implicitlystates that the recovery failure is part of the global failure scenario. This should be compared with thebarrier approach introduced in ARAMIS.
Figure 8: Structure of classification scheme showing direct cause, origin of failure andrecovery failure. Bellamy et al, 1989
ARAMIS D1C – APPENDIX 7 July 2004Frequencies data for the fault tree
- 29 -
N° ofincidents towhich causecontributed
Totalcontribution
% contribution(overall) (n=921)
% contribution(excludingunknowns)(n=543.5)
Defective pipe or equipment(unknown cause)
303 293.5 31.9 -
Operator error 190 167.83 18.2 30.9
Overpressure 129 111.83 12.1 20.5
Corrosion 92 85.5 9.3 15.6
Unknown 84 84 9.1 -
Impact 49 43.83 4.8 8.1
Wrong in-line equipment orlocation
44 36.83 4 6.7
Temperature (high or low) 44 34.83 3.8 6.4
External loading 35 27.5 3 5
Vibration 16 14 1.5 2.5
Other 17 14 1.5 2.5
Erosion 11 7.33 0.8 1.3
Total 1014 921 100 100
Table 12: Breakdown of level 1 direct causes of incidents [Bellamy]

ARAMIS D1C – APPENDIX 7 July 2004Frequencies data for the fault tree
- 30 -
%
A. Incident modes
Unknown exothermic decomposition 15.1
Incorrect charging 17.2
Inadequate cooling 13.1
Excessive heating 9.6
Incorrect agitation 10.1
Inadequate batch control 9.1
Undesired catalyst 2.5
Exothermic from impurity 10.6
B. Incorrect charging
Excess of reactant 29.4
Deficiency of reactant 26.5
Too fast addition of reactant 23.5
Modification of reactant 11.8
Incorrect order of reactant addition 5.9
C. Inadequate cooling
Coolant source/power failure 0
Coolant pump set failure 3.8
Coolant turned off 11.5
Automatic control failure 11.5
Condenser fault 11.5
D. Excessive heating
Initial overheating 15.8
Heating / cooling changeover fault 15.8
Undesired heating 10.5
Automatic control failure 10.5
Manual control failure 10.5
E. Incorrect batch control
Initial temperature too low 11.1
Initial temperature too high 0
Too fast addition of reactant relative to the temperature 22.2
Incorrect cycle 16.6
Excessive holding 22.2
Table 13: analysis of reactor overpressure [Lees] (Table 11.11)

ARAMIS D1C – APPENDIX 7 July 2004Frequencies data for the fault tree
- 31 -
Causes of service failureby corrosion
% Causes of service failureby mechanical failure
Cavitation
Cold wall
Cracking, corrosion fatigue
Cracking, stress corrosion
Crevice
Demetallification
End grain
Erosion-Corrosion
Fretting
Galvanic
General
Graphitization
High temperature
Hot wall
Hydrogen blistering
Hydrogen embrittlement
Hydrogen grooving
Intergranular
Pitting
Weld corrosion
0.3
0.4
1.5
13.1
0.9
0.6
0.4
3.8
0.3
0.4
15.2
0.1
1.3
0.1
0.1
0.4
0.3
5.6
7.9
2.5
Abrasion, erosion or wear
Blisters, plating
Brinelling
Brittle fracture
Cracking, heat treatment
Cracking, liquid metal pen
Cracking, plating
Cracking, thermal
Cracking, weld
Creep or stress rupture
Defective material
Embrittlement, sigma
Embrittlement, strain age
Fatigue
Galling
Impact
Leaking through defects
Overheating
Overload
Poor welds
Warpage
5.4
0.1
0.1
1.2
1.9
0.1
0.6
3.1
0.6
1.9
1.6
0.3
0.4
14.8
0.1
0.1
0.4
1.9
5.4
4.4
0.4
Sub-total 55.2 Sub-Total 44,8
Table 14: Causes of service failure in metal equipment and piping in chemical plants(Collins and Monack, 1973) [Lees] (Table 12.26)
These relative distribution tables bring useful information about the most frequent causes, but, again,cannot be used directly to evaluate absolute frequencies. Yet, if the absolute frequency of one eventis known, they can be used to derive the order of magnitude of other causes in the same family. Thiswill be used in the last section of the present document to produce the initial data to be used for thebarrier approach.
2.5 Frequency of the critical events
Diverse bibliographical sources provide generic frequencies for the critical events. Most of these areissued from countries where QRA serves as a decision support for land use planning. An analysis ofthese data sources is more deeply presented in appendix 10.

ARAMIS D1C – APPENDIX 7 July 2004Frequencies data for the fault tree
- 32 -
2.6 Other absolute frequencies
Lees and other authors propose a series of data from a large literature review. However, many ofthese data are relatively old. Most of them are from the seventies. A large proportion is issued fromthe nuclear industry and can therefore not be applied to the process industry. Many of these data arereliability data concerning different types of equipment used in the process industry. Others arefrequencies of events such as pipe leaks or causes such as overfilling. Such data always apply to aparticular industrial activity and are the result of a limited data collection process, or, often an expertjudgement, which makes difficult their extrapolation to other activities. When secondary failures areconsidered, the data always apply to plants where the safety standards of the time were applied,which makes difficult their use as reference data in a “no barrier” context as required by the MIMAHmethodology.
The following four tables (Table 15 to Table 18) provide useful reliability data, some ofwhich can be used directly in the generic fault trees. Critical event frequencies are shownto allow the reader to compare his own calculations and some published data.
Failure rate(failure/106 h)
Electric motor 10
Transformer (<15kV) 0.6
(132-400 kV) 7
Circuit breakers (general <33kV) 2
(400kV) 10
Pressure vessels (general) 3
(high standard) 0.3
Pipes 0.2
Pipe joints 0.5
Ducts 1
Gaskets 0.5
Bellows 5
Diaphragm (metal) 5
(rubber) 8
Unions and junctions 0.4
Hoses (heavily stressed) 40
(Lightly stressed) 4
Ball bearings (heavy duty) 20
(Light duty) 10
Roller bearings 5
Sleeve bearings 5
Shafts (heavily stressed) 0.2
(lightly stressed) 0.02

ARAMIS D1C – APPENDIX 7 July 2004Frequencies data for the fault tree
- 33 -
Failure rate(failure/106 h)
Relief valves : leakage 2
Blockage 0.5
Hand-operated valves 15
Control valves 30
Ball valves 0.5
Solenoid valves 30
Rotating seals 7
Sliding seals 3
‘o’ring seals 0.2
Couplings 5
Belt drives 40
Spur gears 10
Helical gears 1
Friction clutches 3
Magnetic clutches 6
Fixed orifice 1
Variable orifices 5
Nozzle and flapper assemblies : blockage 6
Breakage 0.2
Filters : blockage 1
Leakage 1
Rack-and-pinion assemblies 2
Knife-edge fulcrum : wear 10
Springs (heavily stressed) 1
(lightly stressed) 0.2
Hair springs 1
Calibration springs : creep 2
Breakage 0.2
Vibration mounts 9
Mechanical joints 0.2
Grub screws 0.5
Pins 15
Pivots 1
Nuts 0.02
Bolts 0.02
Boilers (all types) 1.1
Boiler feed pump 1012.5
Cranes 7.8

ARAMIS D1C – APPENDIX 7 July 2004Frequencies data for the fault tree
- 34 -
Table 15: Some data on equipment failure rates published by the UKAEA 1972 fromnuclear and non nuclear industry [LEES] (Table A14.2)
EquipmentFailure rate
(failures/106h)
Compressor
Centrifugal turbine driven 150
Reciprocating, turbine driven 500
Electric motor driven 100 300
Diesel generator 125 4000
Electricity supply 110
Gaskets 0.02 1
Heat exchanger 1 40
Pipe joint 0.5
Pumps
• Centrifugal 10 30 80
• Boiler 100 500
• Fire 100
• Fuel 6 50
• Oil lubrication 10 30 100
• Vacuum 20
Turbine, steam 30 80
Valves
• Ball 1 3.5
Butterfly 1 20 30
• Gate 1.5 15
• Relief 4 9
• Non return 2 5
• Slam shut 10 30
• Solenoid 1.5 10 30
Valve actuator
• Fail open 0.1 4
• Spurious close 5 40
Table 16: [Lees] Table A14.4 D.J.Smith 1985
InstrumentFailure
(fault/year)
Control valve 0.6
Power cylinder 0.78
Valve positioner 0.44
Solenoid valve 0.42

ARAMIS D1C – APPENDIX 7 July 2004Frequencies data for the fault tree
- 35 -
InstrumentFailure
(fault/year)
Current/pressure transducer 0.49
Pressure measurement 1.41
Flow measurement(fluids) 1.14
Differential pressure transducer 1.73
Transmitting variable area flowmeter 1.01
Indicating variable area flowmeter 0.34
Magnetic flowmeter 2.18
Flow measurement (solids)
Load cell 3.75
Belt speed measurement and control 15.3
Level measurement (liquids) 1.70
Differential pressure transducer 1.71
Float type level transducer 1.64
Capacitance type level transducer 0.22
Electrical conductivity probes 2.36
Level measurement (solids) 6.86
Temperature measurement (excluding pyrometers) 0.35
Thermocouple 0.52
Resistance thermometer 0.41
Mercury-in-steel thermometer 0.027
Vapour pressure bulb 0.37
Temperature transducer 0.88
Radiation pyrometer 2.17
Optical pyrometer 9.70
Controller 0.29
Pressure switch 0.34
Flow switch 1.12
Speed switch
Monitor switch
Flame failure detector 1.69
Millivolt-current transducer 1.67
Analyser 8.49
PH meter 5.88
Gas-liquid chromatograph 30.6
O2 analyser 5.65
CO2 analyser 10.5
H2 analyser 0.99
H2O analyser (in gases) 8

ARAMIS D1C – APPENDIX 7 July 2004Frequencies data for the fault tree
- 36 -
InstrumentFailure
(fault/year)
Infrared liquid analyser 1.4
Electrical conductivity meter (for liquids) 16.7
Electrical conductivity meter (for water in solid) 14.2
Water hardness meter 10.9
Impulse lines 0.77
Controller settings 0.14
Table 17: Example of instrument failure rates from three chemical works (1971) [Lees]p13/20 table 13.6 (extract)
InstrumentFailure rate(faults/year)
Instrument in contact with process fluid 1.15
Pressure measurement 0.97
Level measurement 1.55
Flow measurement 1.09
Flame failure device 1.37
Instrument not in contact with process fluids 0.31
Valve positioner 0.41
Solenoid valve 0.30
Current-pressure transducer 0.54
controller 0.26
Pressure switch 0.30
Control valve 0.57
Temperature measurement 0.29
Table 18: effect of environment on instrument reliability: instrument in contact with or notin contact with process fluids. [Lees] table 13.7
The following two tables (Table 19 and Table 20) are interesting as they illustrate the importance ofthe working conditions of the equipment. They concern process pressure vessel failure rates fordifferent types of industries.
As can be seen, the frequencies can vary greatly with the type of vessel, the type of process and thetype of chemical environment. It is interesting to compare these values with those given for the criticalevents (appendix 10). Frequencies in Table 19 and Table 20 are several (two or three) orders ofmagnitude higher, which shows the difficulty of choosing the appropriate data for risk assessment.

ARAMIS D1C – APPENDIX 7 July 2004Frequencies data for the fault tree
- 37 -
Vessel Sample sizeNumber of
failuresFailure rate
(failures/year)
Vessels Vessel-years
Process pressure vessel 415 5535 15 2.7 x10⁻³
Pressure storage vessel 129 2220 4 1.8x10⁻³
Heat exchanger 446 5950 10 1.7 x 10⁻³
Fired heaters 36 447 181 405 x 10-3
High temperature vessel,except fired heater
58 809 6 7.4x10⁻³
Low temperature vessel 147 1941 3 1.5x10⁻³
Table 19: Arulanantham and Lees 1981 (olefins plants, data gathered between 1960 and1981) [Lees] p. 12/97
VesselSample
sizeNumber of
failuresFailure rate
(failure/year)
Vessels Vessel-years
Process pressure vessel 131 1572 15 26x10-3
High temperature vessels,except fired heater
16 192 7 36x10-3
Vessel in corrosive duty 45 540 21 39x10-3
Vessel subject to stresscorrosion
49 588 12 20x10-3
Table 20: same study: toxic plants [Lees] p.12/97
The following series of data concerns pipeworks failure. They perfectly well illustrate this sentence byLees: [Lees] p.12/98: “There is a considerable amount of data available on pipework failures, but therange of values quoted tends to be confusing.” They also illustrate the necessity of knowing theprecise configuration of the plant, as most of these data are given in number of failures per meter andvary a lot with the diameter of the pipes.
Frequency of guillotine rupture = 3x10⁻⁷failure/m.year
Frequency of lesser failure = 3 x10⁻⁶failure/m.year
Frequency of gasket failure
Gasket 0.6 mm thick =3x10⁻⁶ failure/year
Gaskets 3 mm thick = 5x10⁻⁶ failure/year
These data include valve leaks.
Table 21: Pape and Nussey for chlorine plant [Lees] p.12/105

ARAMIS D1C – APPENDIX 7 July 2004Frequencies data for the fault tree
- 38 -
Purple book data on pipes [CPR]
Type of pipe failure frequency
Diameter <=50mm 1x10⁻¹⁰m-1h-1=8.8x10⁻⁷m-1y-1
50<diameter<150mm 3x10-11m-1h-1=2.6x10⁻⁷m-1y-1
Diameter>150mm 1x10-11m-1h-1 =8.8x10⁻⁸
Table 22: COVO Study catastrophic rupture [CPR]
[Hu92] pipe rupture frequency
Log(failure rate per meter per year)=-(0.0064x(pipe diameter in mm)+5.56)
Diameter <=50mm failure frequency leak=10 x rupture failure frequency
50<diameter<150mm failure frequency leak=20 x rupture failure frequency
Diameter>150mm failure frequency leak=30 x rupture failure frequency
Table 23: COVO study for significant leaks
[Hu92] leak failure frequency
Log(failure rate per meter per year)=-(0.026x(pipe diameter in mm)+5.32)
Pumps
Catastrophic failure of pumps : the purple book proposes the following values :
Installation (part) Catastrophic failure Leak
Pumps without additional provisions 1x10⁻⁴y-1 5x10⁻⁴y1
Pumps with a wrought steel containment 5x10⁻⁵y-1 2.5x10⁻⁴y-1
Canned pumps 1x10⁻⁵y-1 5x10⁻⁵y-1
Table 24: Catastrophic failure of pumps
These figures should not be mistaken with the other pumps failure rates corresponding to other failuremodes.
A : Pressure storage sphere (Drysdale and David) Frequency/probability(per year)
Crack in pipe 10-4/y
Gasket failure 5x10⁻⁵/y
Flange failure 4x10⁻⁵/y
Valve seating failure 3x10⁻²/y
Draining/sampling valve not properly shut 10-4/y
Pipe rupture due to

ARAMIS D1C – APPENDIX 7 July 2004Frequencies data for the fault tree
- 39 -
Vehicle impact 10-5/y
Vibration 10-2/y
Corrosion 10-4/y
Repair whilst operating 10-4/y
Excess pressure (blockage) 10-7/y
Fatigue 10-4/y
Creep 10-5/y
Sabotage 2x10⁻³/y
During Filling operation
Operator fails to stop filling when correct level is reached 0.1
Operator fails to pump quickly enough when release occurs 10-2
Fixed water spray inoperative because :
Water shut off 10-2
Activation fails 2x10⁻²
Water frozen 5x10⁻⁴
Pipes completely blocked 10-4
Low main pressure 3x10⁻⁴
Sprinkler system damaged 10-5
Fixed water spray system ineffective because :
Pipe partially blocked 3x10⁻⁴
Low mains pressure 2x10⁻³
Some heads blocked 8x10⁻⁴
B : Pressure storage
(Considine, Grint and Holden)Catastrophic failure of vessel :
Complete failure 3x10⁻⁶/vessel-year
Failure equivalent to 6 in nozzle 7x10⁻⁶/vessel-year
Fracture of a 6 in. liquid line
Pipework 3x10⁻⁷/m-year
Equivalent failure of fittings 5x10⁻⁶/item-year
Release due to overfilling 10-4/vessel-year
Fracture of 2 in. vapour line 3x10⁻⁶/m.year
Serious leak from equipment or pipeworks (1 kg/s)
6 in. pipework 6x10⁻⁶/m.year
2 in. pipework 6x10⁻⁵/m.year
Flange 3x10⁻⁴/flange.year
Pump seal 5x10⁻³/seal.year
Release in course of draining or sampling (1.5 kg/s)
Release per operation 10-4
Draining operations 50/year

ARAMIS D1C – APPENDIX 7 July 2004Frequencies data for the fault tree
- 40 -
Sampling operations 100/year
Failure to recover during draining 10-1
Failure to recover during sampling 10-2
C : Refrigerated atmospheric storage
(Considine, Grint and Holden)
Catastrophic failure of tank 5x10⁻⁶/tank-year
Rollover 10-5/tank-year
Overfilling 10-4/tank-year
Overfilling with tank failure 10-5/tank-year
Overfilling without tank failure 9x10⁻⁵/year
Fracture of a 6 in. liquid line As section B
Leak from pipework As section B
Table 25: Event Frequency/probability estimates given in two LPG hazard assessments(after Drysdale and David 1979/80; Considine, Grint and Holden, 1982) [Lees] (table
22.16)
Table 25 illustrates the necessity of knowing the plant configuration to be able to calculate thefrequency of a critical event. In this table several frequencies are given in number of occurrence peryear and per equipment (flange.year or seal.year). Depending on the number of equipment, theoverall probability can change considerably.
A. Estimates usedCoolant source/power failure
Frequency of coolant source/power failure 0.1 failure/year
Probability that failure is sufficiently serious to givetotal loss of power
0.1
Probability that reactor is in critical condition 0.2
Frequency of excursion due to this cause 0.1 x 0.1 x 0.2=2.10-3/year
Coolant pump set failure
Frequency of pump failure (complete failure to pump) 0.1 failure/year
Assume one pump operating and one on standby
Length of batch cycle 16h=0.00183 year
Probability of successful pump changeover 0.95
Probability of failure during batch 1-exp(-0.1 x 0.00183)(1+0.95x0.1x0.00183)=9x10⁻⁶
Probability that the reactor is in critical condition 0.2
Number of cycles 250/year
Frequency of excursion due to pump set failure 250 x 0.2x9x10-6=2.5 x10⁻⁴/year
Coolant turned off
Frequency of manual isolation valve wrongly directedclosed
0.05/year
Probability that operator fails to detect lack of cooling 0.01

ARAMIS D1C – APPENDIX 7 July 2004Frequencies data for the fault tree
- 41 -
Probability that reactor is in critical condition 0.5
Frequency of excursion due to coolant turned off 0.05x0.01x0.5=2.5x10⁻⁴/year
Automatic control failure
Frequency of failure of control loop in fail to dangermode
0.25 failure/year
Probability that operator fails to detect loss of control 0.01
Probability that reactor is in critical condition 0.2
Frequency of excursion due to automatic control failure 0.25x0.01x0.2=5x10⁻⁴/year
Inadequate agitation
Frequency of agitator failure 0.5 failure/year
Frequency of operator failure to start agitator 0.5 failure/year
Probability that agitator failure is critical 0.01
Frequency of excursion due to inadequate agitation (0.5+0.5)x0.01=10-2/year
Table 26: Analysis of reactor overpressure : frequency of inadequate cooling (Marrs andLees, 1989) [Lees] (Table 11.13)
Table 26 illustrates how different frequencies and probability combine to lead to the final probabilityof an event (here, a reactor overpressure). These last data show the difficulty of working with thelimited generic fault trees, as it clearly appears that the number of combined causes which must betaken into account to assess the probability of the events can be high.
SystemOperatin
g timeNo of
failuresDowntime Availability
Failure (h)Planned
(h)%
Single computer system with analogue standby 66528 13 65 300 99.9
Twin computer system with analogue standby 35040 8 30.5 38 99.91
Twin computer system with shared critical loops - 1 78 888 21 172 48 99.78
Twin computer system with shares critical loops -2 78 888 37 388 73 99.5
Twin computer system with analogue standby 13 848 6 54 17 99.61
Table 27: Failure data for some process computer systems in the chemical industry [Lees](Table A14.18)
2.7 Synthesis of the data sources analysis
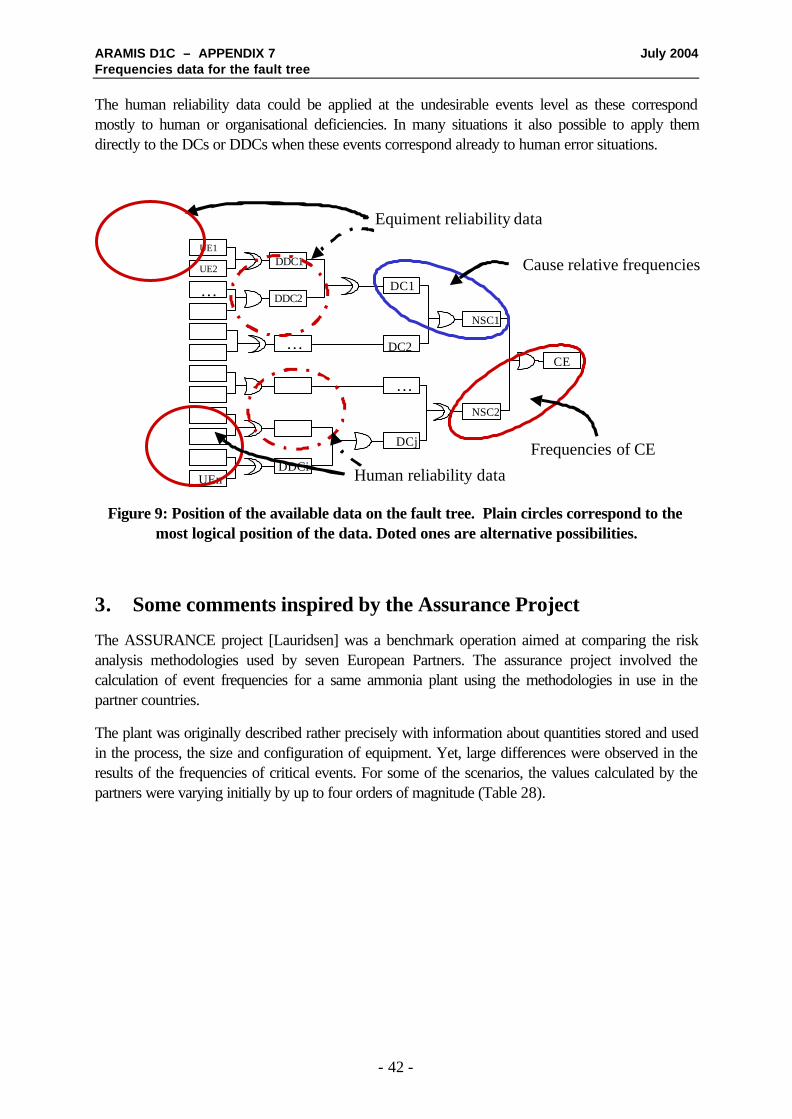
Figure 9 illustrates the position of the available data on the fault tree. The red circles represent theposition of absolute frequencies in the fault trees. Equipment reliability data mostly apply to specificfault trees that would be further developed from the initial generic fault trees. However, some datacan be applied in the generic trees (doted circle) at the DDC (detailed direct causes) or DC level,when an equipment is explicitly involved (pumps or compressors in the overpressure scenarios).
ARAMIS D1C – APPENDIX 7 July 2004Frequencies data for the fault tree
- 42 -
The human reliability data could be applied at the undesirable events level as these correspondmostly to human or organisational deficiencies. In many situations it also possible to apply themdirectly to the DCs or DDCs when these events correspond already to human error situations.
… DDC2DC1
CE
UE1
UE2DDC1
… DC2
…
NSC1
NSC2
UEnDDCi
DCj
Equiment reliability data
Cause relative frequencies
Frequencies of CE
Human reliability data
Figure 9: Position of the available data on the fault tree. Plain circles correspond to themost logical position of the data. Doted ones are alternative possibilities.
3. Some comments inspired by the Assurance Project
The ASSURANCE project [Lauridsen] was a benchmark operation aimed at comparing the riskanalysis methodologies used by seven European Partners. The assurance project involved thecalculation of event frequencies for a same ammonia plant using the methodologies in use in thepartner countries.
The plant was originally described rather precisely with information about quantities stored and usedin the process, the size and configuration of equipment. Yet, large differences were observed in theresults of the frequencies of critical events. For some of the scenarios, the values calculated by thepartners were varying initially by up to four orders of magnitude (Table 28).

ARAMIS D1C – APPENDIX 7 July 2004Frequencies data for the fault tree
- 43 -
Table 28: Frequencies of the top events of the common scenarios used by the partners(events per year) in the ASSURANCE project
An analysis was made of the causes of deviation. For this purpose, the scenarios were grouped intothree sets: scenarios related to (1) pipelines, (2) loading arms, and (3) tanks.
The following possible causes of uncertainty have been considered:
(1) scenarios related to pipelines
1. Length of a pipeline to be analysed
2. Utilisation factor (fraction of time when a pipeline is in use)
3. Including piping-related components (flanges, valves and pumps)
4. Failure causes considered:
1. Mechanical
2. Overpressure
3. External impact
(2) scenarios related to loading arms
1. Number of transhipments
2. Failure causes considered:
1. Mechanical
2. Overpressure
3. Other (e.g. "excessive movement of the arm, leading to its rupture")

ARAMIS D1C – APPENDIX 7 July 2004Frequencies data for the fault tree
- 44 -
(3) scenarios related to tanks
1. Failure causes considered:
1. Mechanical
2. Overpressure
3. Other (e.g. fires and explosions)
After this analysis, characteristics common for all the partners were defined such as the length of thepipes to be analysed, the utilisation factor or the number of transhipments.
Once these precision were incorporated to the initial data, the calculation were performed again. Theresults were closer, even if the deviation could still reach three orders of magnitude for various topevents (Table 29).
Table 29: recalculated frequencies according to the assumptions common to all researchteams in the ASSURANCE project
This project shows the difficulty of getting significant and reliable values when evaluating frequencies.It also shows the importance of the precise description of the plant, of its components and of itsfunctioning. It is clear that using short generic fault trees with generic data is a major difficulty and thatthe results which could be obtained this way would probably not have much meaning. Yet, thefollowing section attempts to propose some solution for the calculation of probabilities.

ARAMIS D1C – APPENDIX 7 July 2004Frequencies data for the fault tree
- 45 -
4. Proposal of a method for evaluating the frequency of the criticalevent
The method retained by the ARAMIS project is based on the barrier approach. In other words, thescenarios are quantified by applying the barrier failure rates to an initial failure probability. Thisapproach should reduce the stress on the frequency evaluation. Yet, it is necessary to provide sometype of initial evaluation of the frequency (probability) to be able to calculate the final critical eventfrequency. As the preceding considerations have shown it is not easy to derive frequency(probability) values from the data source available. Yet, some type of quantification is desired. Thefollowing solutions can be proposed.
As was already discussed, the main difficulty resides in the generic character of the fault trees and theappropriateness and validity of the failure data.
• Generic fault trees do not make a sufficient description of the failure modes and do not allowto take explicitly the number of components, the time of use, the number of demands intoaccount.
• The failure data do not correspond to the events described in the event tree. They werederived from ancient studies and may not reflect the present state of the art.
To overcome these difficulties the following recommendations can be made.
• Detailed specific fault trees should always be preferred to generic fault trees as they allow amore precise description of the equipment and the failure modes. These detailed specific faulttrees should be build, when possible, by developing the generic fault trees provided byMIMAH. In many plants, reliability analysis have been made and could be used as a reliablesource to implement the probability analysis.
• When possible, plant specific data should be preferred to generic frequencies as the laterreflect average behaviour of components which can be fairly different from those observed inthe plant concerned by the study. The next section provides some useful data. When thesecannot be used, the very coarse generic data given bellow can be adopted for an initialstudy.
Plant specific data Generic data
Detailed fault trees Use plant specific data anddetailed fault trees
Use generic data with detailedfault trees
Generic fault trees Use plant specific data withgeneric fault trees
Use generic data with genericfault trees
Table 30: preferred data sources and methods for risk analysis
Chapter 7 of the present document proposes some failure rates for different types of componentswhich could be used for the calculation of the failure probabilities provided that the fault trees bedeveloped further sufficiently to make these components appear.

ARAMIS D1C – APPENDIX 7 July 2004Frequencies data for the fault tree
- 46 -
Table 31 and Figure 10 provide even more generic data. Whatever the data used, it is alsonecessary to apply them to the number of components susceptible to fail.
Item Failure Rates (on demand)
People 10-2 per operation
Mechanical systems 10-3 per operation
Electrical systems 10-4 per operation
Table 31: Generic Failure Rates
Figure 10: Typical ranges of failure rates for parts, equipment and systems (CCPSguidelines)
An attempt was made to introduce data into the generic fault trees (see tables at the end ofchapter 7). The data correspond as much as possible to a “no barrier” situation, even if thiscriterion is not always easy to warrant.
In fact different situations were distinguished :
o Component failure : In such a situation, the component failure rate should be applied, if itcan be found in the reliability databases. Of course, this failure rate can be increased by localconditions (corrosive environment,…). Distinction has to be made between failure in timeand failure on demand. In this second situation, the number of component solicitation must beknown. In any case, the number of components susceptible to fail and their configuration(series or parallel) should be known and taken into account to calculate the resultingfrequency. As it is not possible to reproduce entire databases such as the OREDA

ARAMIS D1C – APPENDIX 7 July 2004Frequencies data for the fault tree
- 47 -
handbook, the CCPS guideline ranges given by Figure 10 were used in the faulttrees.
o Hazardous operation : these are operations which should always result into a hazardousphenomenon, such as manipulating hazardous chemicals. In such situations, the frequency ofhazardous event is that of the operations reduced by the provisions taken to reduce the risk.In other words, the frequency without barriers is that of the operations. No data wasintroduced in the fault trees in this case. The value to be used is the plant specificfrequency of operation.
o Human error : the general comments about human reliability given above show that it is notrecommendable to use single generic data to estimate the human error failure rate. Humanreliability depends a lot on the context and the type of operations performed by theoperators. But, in a first approximation, conservative values can be used such as 10-
1/operation (it should be reminded that this value is taken before taking into accountthe safety barriers, this means that no training or work procedures are considered).The frequency of the dread event (resulting from the error) is given by the product of theprobability of human error by the frequency of the considered human operation (opening of avalve, for example).
o External hazard : such as earthquake, domino effects or weather conditions. In this case,the local data should be obtained from the competent authorities and used directly.Earthquake and lightening data issued from the HSE safety report assessment guide wereintroduced in the tree but they should be used very carefully as they correspond to thesituation in England.
o Continuous degradation leading to failure : these include corrosion, erosion, and othermechanical failure. Whereas many absolute failure data are available for equipment failure,much less are available for these direct causes which appear in accident databases with highrelative frequencies. In this case, the very few available data (8x10⁻⁷ to 10-4/h for corrosion inthe I-Risk project database) were used as reference data and the other figures were derivedfrom this initial data by applying relative distribution figures. However, the meaning of these isnot clear, as it seems obvious that the probability of failure by corrosion or erosion must besomehow related with the length or surface of the concerned equipment. No figures could befound linking the different failure modes (corrosion, erosion, fatigue…) and the length ofpipes, for example.
5. Conclusion
The objectives of this ARAMIS step was to produce a method and data to calculate the criticalevent frequencies which would be compatible with the elements of the method already developed,the generic fault trees, and those being developed by other partners, the safety barrier requirementsapproach.
For this purpose, a typology of data sources was made. These can mostly be divided into
o Reliability databases concerning mostly equipment failures

ARAMIS D1C – APPENDIX 7 July 2004Frequencies data for the fault tree
- 48 -
o Human reliability data
o Accident databases (relative distributions of causes)
o Scattered absolute and relative frequencies which can be found in very diverse literaturereferences. These include frequencies of the critical events and some more scarcefrequencies of intermediate events (NSC, DC or DDC in the fault trees).
The limits of each data type were underlined with respect to the ARAMIS methodology. These limitsconcern both the data themselves and their applicability to the structure of the generic fault trees.
As far as the data are concerned, and excluding, maybe, the reliability databases which are updatedregularly, but are not easily accessible, it is difficult to know how accurate and reliable they are. Theconditions and time of the initial collection are seldom known, which makes their use as generic datadelicate.
But it is also the generic nature of the fault trees which makes the assessment of the critical eventsfrequencies difficult. For many events it is necessary to have more information on the plantconfiguration and operating conditions to calculate their frequency (probability). This is particularlytrue when on demand failure rates are involved.
Yet, it was necessary to provide some guidelines for the assessment of the frequencies(probabilities). This was done by making some recommendations which include the development ofspecific fault trees on the basis of the generic fault trees provided in the ARAMIS methodology andthe use of plant specific data when available. When such data are not available, generic ones must beused. Orders of magnitude of such data were introduced in the fault trees. Most of them are basedon a combined use of absolute frequencies, when available and relative distribution of causes.
Even if some results were obtained, this part of ARAMIS shows that the lack of reliabledata and coupling between the data and the generic fault trees is a major difficulty. Thisshould suggest to the project partners to propose an European data collection programwhich would result into a truly ARAMIS compatible database.

ARAMIS D1C – APPENDIX 7 July 2004Frequencies data for the fault tree
- 49 -
6. References
6.1 ARAMIS Documents
[Delvosalle MOOA] C. Delvosalle, C. Fiévez, A. Pipart, C. Kirchsteiger, F. Mushtaq, J. CasalFabrega, Dr. E. Planas, PART 2 OF DELIVERABLE D.1.A. MOOA - MOST OFTENOBSERVED ACCIDENTS WP 1/A
[Delvosalle WP1D] C. Delvosalle, C. Fiévez, A. Pipart, Methodology for the Identification ofReference Accident Scenarios, WP1D
[Delvosalle WP1C] C. Delvosalle, C. Fiévez, A. Pipart, Frequencies and probabilities on the eventtree, Characteristics of critical events, WP 1C
[Fiévez WP1C] C. Fievez, A.Pipart, Intermediate report on the WP1C, ARAMIS
6.2 Other documents
[Akhmetjanov] Farit M. Akhmetjanov, Reliability databases : state of the art and perspectives :Risoe report Risoe –R- 1235 EN
[Bellamy] L.J. Bellamy, T.A.W. Geyer and J.A. Astley, Evaluation of the human contribution topipework and in-line equipment failure frequencies, HSE contract research report n°15/1989
[Barton] J. Barton, R. Rogers, Chemical reaction hazards, Ichem E, Rugby, 1993,184 p.
[CCPS] Guidelines for Chemical Process Quantitative Risk Analysis, Second Edition, Center forChemical Process Safety, American institute of chemical engineers, New-York, 2000
[CPR] Guidelines for quantitative risk assessment, purple book, CPR 18E, Committee for theprevention of disasters, Sdu Uitgevers, Den Haag, 1999
[Fragola] J.R. Fragola Human reliability analysis procedure, ESREL 2001, Safety and reliability,proceedings of the european conference on safety and reliability, ESREL 2001, tutorial notes, ed:Politecnico di Torino, 2001, pp.107-142
[Giovannini] Création d’un pôle de compétences sur l’évaluation de la sécurité des procédéschimiques (DRA-005) RAPPORT INTERMEDIAIRE D’OPERATION, Guide méthodologiqued’évaluation des dangers liés à la mise en oeuvre de réactions chimiques B. GIOVANNINI Juin2001, available at www.ineris.fr
[HOURTOLOU] D. HOURTOLOU, Analyse des risques et prévention des accidents majeurs (DRA-007), Rapportfinal – Opération ASSURANCE, ASSessment of the Uncertainties in Risk Analysis of Chemical Establishments,Projet U.E. ENV4-CT97-0627 available on (www.ineris.fr)

ARAMIS D1C – APPENDIX 7 July 2004Frequencies data for the fault tree
- 50 -
[HSE] HID - SAFETY REPORT ASSESSMENT GUIDES :
http://www.hse.gov.uk/comah/index.htm, links to
− Safety Report Assessment Guide : Chlorine
− Safety Report Assessment Guide : Chemical Warehouses
− Safety Report Assessment Guide : LPG
− Safety Report Assessment Guide : HFL
− Safety Report Assessment Guide : Methane Gas Bullets
− Safety Report Assessment Guide : Methane Gas Holders
− Safety Report Assessment Guide : Whiskey Maturation Warehouse
[IchmE] The Accident Database Version 4.1, Institution of Chemical Engineers, Rugby, UK
[I-RISK] I-RISK Project : ANNEX IV.1, QUANTIFICATION: DATABASE MAY 1999
[Lauridsen] Assessing the uncertainties in the process of risk analysis of chemical establishments: partI, Kurt Lauridsen, Michalis Christou, Aniello Amendola, Frank Markert, Igor Kozine, MonicaFiori available at : http://mahbsrv.jrc.it/antwerp/docs%5CLauridsen.pdf
[Lees] Franck P. Lees, Loss prevention in the process industry, London: Butterworths, 1986
[OREDA] Offshore Reliability Data Handbook, 1997, Det Norske Veritas
[Piccini] Human Factors In The Design Process Of Advanced Supervisory And Control Systems,Piccini M. and Carpignano A., Politecnico di Torino – Dipartimento di Energetica, C.so Duca degliAbruzzi 24, 10129 Torino, Italy,
[R2A] http://www.r2a.com.au/publications/4th_Edition/4th_edition.html
[RIVM 1] RIVM Report 610066015 Benchmark risk analysis models
[RIVM 2] Report 610066014 A method to judge the internal risk of establishments with dangeroussubstances
[Tucci] Human reliability analysis to high-risk industries: the case of process chemical industry for thepolyethylene production. Prof. Mario Tucci, Ing. Lorenzo Giagnoni, Ing. Irene Cappelli
[Villemeur] Alain Villemeur, “Sureté de fonctionnement des systèmes industriels, fiabilité, facteurshumains, informatisation », Eyrolles, PARIS, 1988, 798 p.

ARAMIS D1C – APPENDIX 7 July 2004Frequencies data for the fault tree
- 51 -
7. Additional data
7.1 HSE reference failure frequencies
Event Probability/Frequency
High pressurise gas transmission line rupture 5 x 10⁻⁴/km.yr
Lightning strike 1 x 10⁻⁷/yr
Severe earthquake capable of rupturing pipework 1 x 10⁻⁶/yr - 1 x 10⁻⁷/yr
Seal Fire approx. 2 x 10⁻⁴/holder.yr
Failure of a ROSOV on demand 3 x 10⁻²/yr
Failure of an excess flow control valve on demand 1.3 x 10⁻²/yr
Failure of an automatic shutoff valve to close 1 x 10⁻²/demand
Failure of a level sensor (sticking) 50 per 10-6 hrs
Split Crown (without ignition) Approx. 3 x 10⁻⁴/holder.yr
Split crown explosions < 3 x 10⁻⁵/holder.yr
Rupture of pipe on a pressurised storage system 1 x 10⁻⁵/yr
Sudden catastrophic failure of vessels 3 x 10⁻⁶/yr
Failure of a flow sensor 40 per 10-6 hrs
Export/Import line failure 5 x 10⁻⁴/km.yr
High pressurise gas transmission line rupture 5 x 10⁻⁴/km.yr
Failure rate of small bore gas pipework 6 x 10⁻⁵/m
Frequency of sparking of zone 1 equipment 1 x 10⁻⁴/item
Seal Fire approx. 2 x 10⁻⁴/holder.yr
Split Crown (without ignition) Approx. 3 x 10⁻⁴/holder.yr
Split crown explosions < 3 x 10⁻⁵/holder.yr
Table 32: General summary of HSE data from HID - safety report assessment guides : [HSE]

ARAMIS D1C – APPENDIX 7 July 2004Frequencies data for the fault tree
- 52 -
7.2 I-Risk
The failure rates are expressed as number of failures per hour or per demand [I-Risk]
Table 33: database developed in the framework of the I-Risk project
EQUIPMENT PARAMETERGood
Management
GenericPlant
PoorManagem
entComments
Use for I-RiskTechnical
Model?
1Safety valves,remote controlvalves
Time for repair(Tr) (hr)
1 1,5 8
OREDAdata.Does notinclude: isolationtime, waitingtime, detectiontime
NO
2Safety valves,remote controlvalves
Time for repair(Tr) and Time formaintenance(Tm) (hrs)
24 168 1176DEMOKRITOSjudgement.
YES
3Safety valves,remote controlvalves
T (inspectioninterval)
Plant datax 0.9
Plant dataPlant datax 5
DEMOKRITOSjudgement.
YES
4Safety valves,remote controlvalves
Lambda (failurerate)
1,71E-06 1,25E-05 3,15E-05OREDA, page492
YES
5Safety valves,remote controlvalves
Qm1 (error inmaintenance)
1,00E-03 0,01 0,1
Expert judgementbased on genericdata accordingto SAVE'ssuggestions
YES
6Safety valves,remote controlvalves
Qm2 (errorrecovery failureby independentcheck)
0,05 1,00E-01 1SAVE/RIVMjudgement basedon generic data
YES
7Safety valvesfail in openposition
Lambda (failurerate)
8,50E-07 1,17E-05 3,40E-05 OREDA, p. 492
8 Manual valvesLambda (failurerate)
2,736E-07 1,9952E-06 5,0416E-06
OREDA page493
All caused byseals (x 0.16 ofsafety valvefailure values)
YES
9 Manual valves Qm1 1,00E-03 1,00E-02 0,1DEMOKRITOSjudgement.
YES
10 Manual valves
Other parameters= Tr, Tm, T, Qm2(not failure rateor Qm1)
Same asfor safetyvalves
Same asfor safetyvalves
Same asfor safetyvalves
Same as forsafety valves
YES
11Flowinstruments
Lambda(failurerate)
8,30E-07 2,76E-06 5,59E-06OREDA page325
YES

ARAMIS D1C – APPENDIX 7 July 2004Frequencies data for the fault tree
- 53 -
EQUIPMENT PARAMETERGood
Management
GenericPlant
PoorManagem
entComments
Use for I-RiskTechnical
Model?
12Flowinstruments
Time for repair(Tr) (hr)
0,2 0,6 2
OREDA datapage 325
Does notinclude: isolationtime, waitingtime, detectiontime
NO
13Flowinstruments
Time for repair(Tr) and Time formaintenance(Tm) (hrs)
24 168 336
SAVE/RIVMexpert judgementto account forwhat OREDAleaves out andusing Test CaseB as benchmarkfor good.
YES
14
Instrumentswhere have totake equipmentapart for repair
Time for repair(Tr) and Time formaintenance(Tm) (hrs)
24 168 720DEMOKRITOSjudgement.
YES
15 Level instrument l (failure rate) 2,50E-06 6,09E-06 1,10E-05OREDA page329
YES
16Pressureinstrument
l (failure rate) 2,50E-07 1,27E-06 2,94E-06OREDA page332
YES
17Temperatureinstrument
l (failure rate) 3,00E-08 7,73E-06 2,97E-05OREDA page338
YES
18Instrumentseasymaintenance
Qm1 5,00E-04 5,00E-03 5,00E-02DEMOKRITOSjudgement.
YES
19Process pump(666 lb)
l (failure rate) 4,50E-05 1,21E-04 2,28E-04OREDA page115
YES
20 Process pumpTr Time for repair(hrs)
2 24 168
OREDA data,page 115
Does notinclude: isolationtime, waitingtime, detectiontime
NO
21 Process pump
Time for repair(Tr) and Time formaintenance(Tm) (hrs)
24 168 720DEMOKRITOSjudgement.
YES
22 Human Error Qo1 1,00E-03 1,00E-02 1,00E-01DEMOKRITOSjudgement.
YES
23 Human Error Qo2 5,00E-02 1,00E-01 1,00E+00DEMOKRITOSjudgement.
YES
22Compressor failswhile running(reciprocating)
l (failure rate) 6,40E-05 6,10E-04 1,63E-03 OREDA p.65 YES

ARAMIS D1C – APPENDIX 7 July 2004Frequencies data for the fault tree
- 54 -
EQUIPMENT PARAMETERGood
Management
GenericPlant
PoorManagem
entComments
Use for I-RiskTechnical
Model?
23Compressor fails(critical,reciprocating)
l (failure rate) 1,56E-04 1,44E-03 3,82E-03 OREDA p.65 YES
24
Compressor failsowing tovibration(reciprocating)
l (failure rate) 9,00E-08 2,30E-05 8,70E-05 OREDA p.65 YES
25
Compressorfails, low gasflow(reciprocating)
l (failure rate) 2,00E-06 1,01E-04 3,60E-04 OREDA p.65 YES
26
Compressorfails, low gasflow(reciprocating)
Tr Time for repair 4 32 98 OREDA p.65 YES
27Compressor fails(centifugal)
l (failure rate) 6,70E-05 3,93E-04 9,41E-04 OREDA, p.52 YES
28Compressor(reciprocating)
Tr Time for repair 1 70 5462 OREDA p.65 YES
29Compressor fails(centrifugal)
Tr Time for repair 0,5 47 1749 OREDA, p.52 YES
30Ammonia pump(critical)
l (failure rate) 1,21E-05 1,06E-04 2,77E-04 OREDA, p.107 YES
31Ammonia pump(vibration)
l (failure rate) 4,60E-07 6,00E-06 1,60E-05 OREDA, p.107 YES
32 Ammonia pump Tr Time for repair 0,5 41 537 OREDA, p.107 YES
33Ammonia pump,other modes
l (failure rate) 3,00E-08 6,00E-06 2,40E-05 OREDA, p.107 YES
34Oil pump(critical)
l (failure rate) 2,10E-05 1,27E-04 3,07E-04 OREDA, p.125 YES
35Oil pump (failwhile running)
l (failure rate) 8,00E-06 8,20E-05 2,24E-04 OREDA, p.125 YES
36Leak of Oilpump
l (failure rate) 3,00E-06 1,00E-05 2,10E-05 OREDA, p.125 YES
37 Oil pump Tr Time for repair 0,5 39 502 OREDA, p.125 YES
38Spuriousoperation ofcontrol valve
l (failure rate) 4,00E-08 1,52E-06 5,26E-06 OREDA, p.345 YES
39Spuriousoperation ofcontrol valve
Tr Time for repair 0,2 1,9 8 OREDA, p.345 YES
40Control valvefails to open
l (failure rate) 1,10E-07 1,96E-06 4,79E-06 OREDA, p.345 YES
41Control valvefails to open
Tr Time for repair 2 14 58 OREDA, p.345 YES

ARAMIS D1C – APPENDIX 7 July 2004Frequencies data for the fault tree
- 55 -
EQUIPMENT PARAMETERGood
Management
GenericPlant
PoorManagem
entComments
Use for I-RiskTechnical
Model?
42Control valvefails to close
l (failure rate) 4,00E-07 2,90E-06 7,40E-06 OREDA, p.345 YES
43Control valvefails to close
Tr Time for repair 2 18 96 OREDA, p.345 YES
44Other processsensors
l (failure rate) 8,70E-07 2,43E-06 4,62E-06 OREDA, p.322 YES
45Other processsensors
Tr Time for repair 2 7 36 OREDA, p.322 YES
46 Controller l (failure rate) 4,10E-05 1,29E-04 2,55E-04 OREDA, p.266 YES
47 Controller Tr Time for repair 0,2 3,4 42 OREDA, p.266 YES
48Electricgenerators
l (failure rate) 1,20E-05 1,44E-04 4,07E-04OREDA, p.155 YES
49Electricgenerators
Tr Time for repair 0,5 15 1404OREDA, p.155 YES
50Fire fightingsystem
l (failure rate) 1,20E-05 2,10E-05 3,10E-05OREDA 92, p.441 YES
51Fire fightingsystem
Tr Time for repair 8,5OREDA 92, p.441 YES
52BATTERYCHARGERFAILS
l (failure rate) 3,00E-07 6,00E-07 4,00E-06IAEA (BCAFB) YES
53RECTIFIERMECH.FAILURE
l (failure rate) 3,20E-07 1,30E-06 3,60E-06IAEA (EREFE) YES
54FUSE FAILSOPEN
l (failure rate) 6,00E-08 3,00E-06 2,00E-05IAEA (KTAKB) YES
55SWITCH FAILSOPEN
l (failure rate) 2,00E-10 1,80E-07 4,20E-07IAEA (KDCDO) YES
56SHORTCIRCUIT INBUS
l (failure rate) 1,00E-09 1,00E-08 1,00E-07DEMOKRITOSjudgement
YES
57TRANSFORMER FAILS OPEN
l (failure rate) 3,00E-07 6,00E-07 4,00E-06IAEA (TAAAB) YES
58STRAINER INCOMPRESSORBLOCKS
l (failure rate) 6,00E-07 3,00E-05 3,00E-05IAEA (YSFQB) YES
59LOSS OFOFFSITEPOWER
Fi 1,00E-07 1,40E-06 1,00E-05DEMOKRITOSjudgement
YES
60EXTERNALFIRE
fi 6,00E-07 6,3E-06 1,00E-05DEMOKRITOSjudgement
YES
61LOSS OFOFFSITEWATER
fi 1,00E-08 1,0E-07 1,00E-06judgement YES

ARAMIS D1C – APPENDIX 7 July 2004Frequencies data for the fault tree
- 56 -
EQUIPMENT PARAMETERGood
Management
GenericPlant
PoorManagem
entComments
Use for I-RiskTechnical
Model?
62 LEVEL RISE fi 1,00E-05 3,7E-04 1,00E-04DEMOKRITOSjudgement
YES
63TEMPERATURE RISE,LOADING
fi 1,00E-06 6,3E-06 1,00E-05DEMOKRITOSjudgement
YES
64TEMPERATURE RISE,UNLOADING
fi 1,00E-06 1,0E-05 1,00E-04DEMOKRITOSjudgement
YES
65LOW LEVEL INTANK
fi 1,00E-06 1,0E-05 1,00E-04DEMOKRITOSjudgement
YES
66
HOTAMMONIAENTERS THETANK
fi 1,00E-06 1,9E-05 1,00E-04
DEMOKRITOSjudgement
YES
67CORROSION INPIPING
fi 1,00E-06 1,9E-05 1,00E-04DEMOKRITOSjudgement
YES
68BATTERYUNAVAILABLE
l (failure rate) 8,00E-07 2,00E-06 1,00E-05IAEA (BTWFB) YES
69BATTERYUNAVAILABLE
Tr Time for repair 4 7IAEA (BTABN) YES
70 NO SYCHRG l (failure rate) 8,00E-07 2,00E-06 1,00E-05DEMOKRITOSjudgement
YES
71 NO SYCHRG Tr Time for repair 4 5 7DEMOKRITOSjudgement
YES
72Water firefighting pump
l (failure rate) 2,00E-04 3,17E-04 4,70E-04OREDA, p.119 YES
73Water firefighting pump
Tr Time for repair 1 18 60OREDA, p.119 NO
74Water firefighting pump
Tr Time for repair 24 168 8760DEMOKRITOSjudgement
YES
75Electric ignitionfailure
l (failure rate) 3,00E-07 1,00E-06 3,00E-06IAEA (KTAKW) YES
76IGNITIONFAILURE OFFLARE
Tr Time for repair 24 168 8760DEMOKRITOSjudgement
YES
77FLAREUNAVAILABLE
Tr Time for repair 24 168 8760DEMOKRITOSjudgement
YES
78Flare fails tostart
l (failure rate) 2,00E-07 1,00E-06 5,00E-05IAEA (QDAFB) YES
79 All comps fm 1,16E-03ACTUAL DATAFROMINDUSTRY
YES
80 All comps Tm 8ACTUAL DATAFROMINDUSTRY
YES