fuel cell technologies - clean cities · 1 | fuel cell technologies office source: us doe 4/4/2013...
TRANSCRIPT

1 | Fuel Cell Technologies Office Source: US DOE 4/4/2013 eere.energy.gov
Fuel Cell Technologies
Overview Pete Devlin, Greg Moreland, John Christensen U.S. Department of Energy Fuel Cell Technologies Office Market Transformation
April 2, 2013

2 | Fuel Cell Technologies Office Source: US DOE 4/4/2013 eere.energy.gov
Well-to-Wheels Greenhouse Gases Emissions
Grams CO2-equivalent per mile
H2 from Natural Gas
Even FCEVs fueled by H2 from distributed NG can result in a >50% reduction in GHG emissions from today’s vehicles.
Use of H2 from NG decouples carbon from energy use—i.e., it allows carbon to be managed at point of production vs at the tailpipe. Even greater emissions reductions are possible as hydrogen from renewables enter the market.
Benefits: Well-to-Wheels CO2 Analysis
Projected technologies analysis & assumptions at: http://hydrogen.energy.gov/pdfs/10001_well_to_wheels_gge_petroleum_use.pdf Assumptions on efficiency, fuel economy, etc. updated as R&D progresses. Next update in 2013.
Analysis by Argonne National Lab, DOE Vehicle Technologies Office, and DOE Fuel Cell Technologies Office shows benefits from a portfolio of options

3 | Fuel Cell Technologies Office Source: US DOE 4/4/2013 eere.energy.gov
Overview Fuel Cells – An Emerging Global Industry
Clean Energy Patent Growth Index[1] shows that fuel cell patents lead in the clean energy field with over 1,000 fuel cell patents issued in 2012.
[1] http://cepgi.typepad.com/heslin_rothenberg_farley_/2013/03/clean-energy-patent-growth-index-2011-year-in-review.html
United States 44%
Other 3%
Great Britain
1% Canada
2% Taiwan
2% France
2%
Germany 6%
Korea 7%
Japan 33%
Fuel Cell Patents Geographic Distribution 2002-2012
Top 10 companies: GM, Honda, Samsung, Toyota, UTC Power, Nissan, Ballard, Plug Power, Panasonic, Delphi Technologies
Source: Clean Energy Patent Growth Index
4 | Fuel Cell Technologies Office Source: US DOE 4/4/2013 eere.energy.gov
Worldwide Investment & Interest Are Strong and Growing
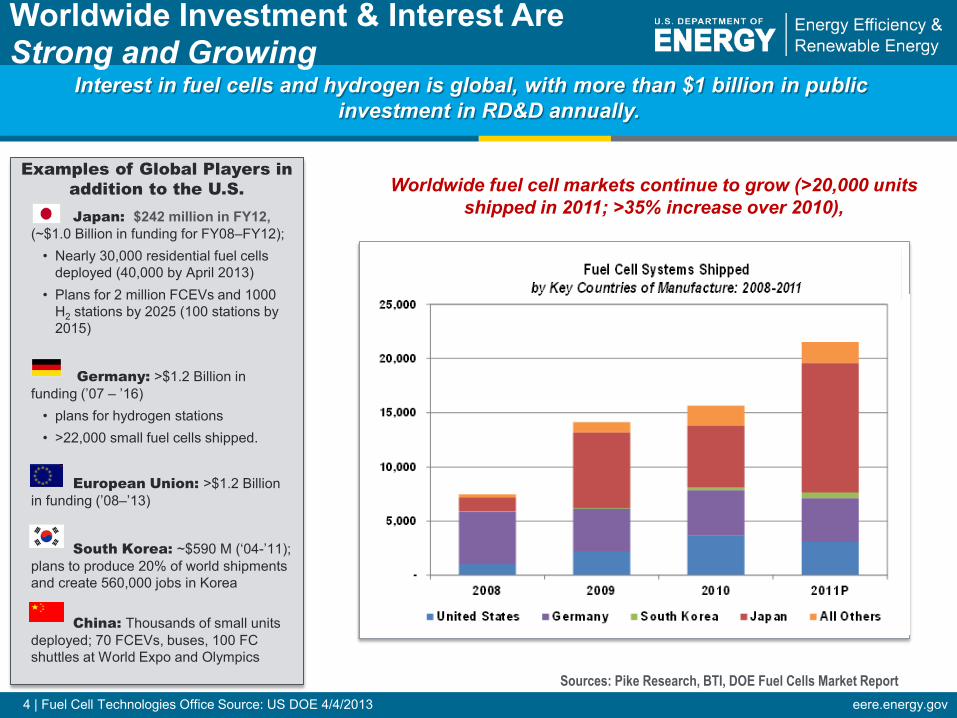
Interest in fuel cells and hydrogen is global, with more than $1 billion in public investment in RD&D annually.
Japan: $242 million in FY12, (~$1.0 Billion in funding for FY08–FY12); • Nearly 30,000 residential fuel cells
deployed (40,000 by April 2013) • Plans for 2 million FCEVs and 1000
H2 stations by 2025 (100 stations by 2015)
Germany: >$1.2 Billion in funding (’07 – ’16) • plans for hydrogen stations • >22,000 small fuel cells shipped.
European Union: >$1.2 Billion in funding (’08–’13)
South Korea: ~$590 M (‘04-’11); plans to produce 20% of world shipments and create 560,000 jobs in Korea
China: Thousands of small units deployed; 70 FCEVs, buses, 100 FC shuttles at World Expo and Olympics
Examples of Global Players in addition to the U.S. Worldwide fuel cell markets continue to grow (>20,000 units
shipped in 2011; >35% increase over 2010),
Sources: Pike Research, BTI, DOE Fuel Cells Market Report
5 | Fuel Cell Technologies Office Source: US DOE 4/4/2013 eere.energy.gov
Plans for FCEVs and H2 Infrastructure
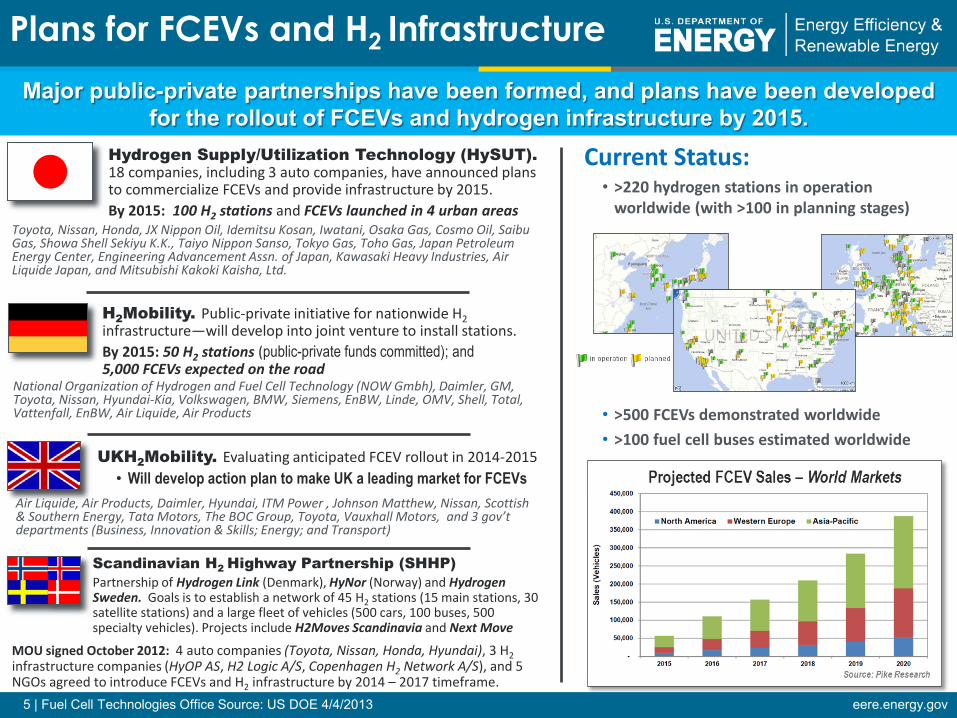
Current Status: • >220 hydrogen stations in operation
worldwide (with >100 in planning stages)
• >500 FCEVs demonstrated worldwide • >100 fuel cell buses estimated worldwide
Major public-private partnerships have been formed, and plans have been developed for the rollout of FCEVs and hydrogen infrastructure by 2015.
Hydrogen Supply/Utilization Technology (HySUT). 18 companies, including 3 auto companies, have announced plans to commercialize FCEVs and provide infrastructure by 2015. By 2015: 100 H2 stations and FCEVs launched in 4 urban areas
Toyota, Nissan, Honda, JX Nippon Oil, Idemitsu Kosan, Iwatani, Osaka Gas, Cosmo Oil, Saibu Gas, Showa Shell Sekiyu K.K., Taiyo Nippon Sanso, Tokyo Gas, Toho Gas, Japan Petroleum Energy Center, Engineering Advancement Assn. of Japan, Kawasaki Heavy Industries, Air Liquide Japan, and Mitsubishi Kakoki Kaisha, Ltd.
H2Mobility. Public-private initiative for nationwide H2 infrastructure—will develop into joint venture to install stations. By 2015: 50 H2 stations (public-private funds committed); and 5,000 FCEVs expected on the road
National Organization of Hydrogen and Fuel Cell Technology (NOW Gmbh), Daimler, GM, Toyota, Nissan, Hyundai-Kia, Volkswagen, BMW, Siemens, EnBW, Linde, OMV, Shell, Total, Vattenfall, EnBW, Air Liquide, Air Products
UKH2Mobility. Evaluating anticipated FCEV rollout in 2014-2015 • Will develop action plan to make UK a leading market for FCEVs
Air Liquide, Air Products, Daimler, Hyundai, ITM Power , Johnson Matthew, Nissan, Scottish & Southern Energy, Tata Motors, The BOC Group, Toyota, Vauxhall Motors, and 3 gov’t departments (Business, Innovation & Skills; Energy; and Transport)
Scandinavian H2 Highway Partnership (SHHP) Partnership of Hydrogen Link (Denmark), HyNor (Norway) and Hydrogen Sweden. Goals is to establish a network of 45 H2 stations (15 main stations, 30 satellite stations) and a large fleet of vehicles (500 cars, 100 buses, 500 specialty vehicles). Projects include H2Moves Scandinavia and Next Move
MOU signed October 2012: 4 auto companies (Toyota, Nissan, Honda, Hyundai), 3 H2 infrastructure companies (HyOP AS, H2 Logic A/S, Copenhagen H2 Network A/S), and 5 NGOs agreed to introduce FCEVs and H2 infrastructure by 2014 – 2017 timeframe.

6 | Fuel Cell Technologies Office Source: US DOE 4/4/2013 eere.energy.gov
Projected high-volume cost of fuel cells has been reduced to $47/kW (2012)*
•More than 35% reduction since 2008
•More than 80% reduction since 2002
*Based on projection to high-volume manufacturing (500,000 units/year). The projected cost status is based on an analysis of state-of-the-art components that have been developed and demonstrated through the DOE Program at the laboratory scale. Additional efforts would be needed for integration of components into a complete automotive system that meets durability requirements in real-world conditions.
Progress Example– Fuel Cells
$0
$50
$100
$150
$200
$250
$300
2002 2006 2007 2008 2009 2010 2011 2012 2017
Projected Transportation Fuel Cell System Cost -projected to high-volume (500,000 units per year)-
Balance of Plant ($/kW, includes assembly & testing) Stack ($/kW)
Current status: $47/kW vs
target of $30/kW Initial Estimate
Target $30/kW
$51/kW $61/kW
$73/kW $94/kW
$108/kW
$49/kW
$275/kW
$47/kW
$281
$143 $118 $110 $94
$218
$84 $71 $59 $55 $47
$0
$50
$100
$150
$200
$250
$300
0 125,000 250,000 375,000 500,000
Syst
em C
ost (
$/kW
net)
Annual Production Rate (systems/year)
Projected Costs at Different Manufacturing Rates 2007 Cost
2012 Status
1,000

7 | Fuel Cell Technologies Office Source: US DOE 4/4/2013 eere.energy.gov
Hydrogen: Sources & Applications
Hydrogen from renewables and low carbon sources is key for a number of applications

8 | Fuel Cell Technologies Office Source: US DOE 4/4/2013 eere.energy.gov
Two Main Options for Low-cost Early Infrastructure
• H2 delivered from central site • Low-volume stations (~200-300 kg/day)
would cost <$1M and provide hydrogen for $7/gge (e.g., high-pressure tube trailers, with pathway to $5/gge at 400–500 kg/day)
• Distributed production (e.g. natural gas, electrolysis)
Other options • Co-produce H2, heat and power (tri-
gen) with natural gas or biogas • Hydrogen from waste (industrial,
wastewater, landfills)
Existing Hydrogen Production Facilities
Options for Early Hydrogen Infrastructure
Natural Gas Pipeline Network, 2009
Current Status •Over 9MMT of H2 produced per year •Over 1,200 miles of H2 pipelines in use (CA, TX, LA, IL, and IN) •Over 50 fueling stations in the U.S.

9 | Fuel Cell Technologies Office Source: US DOE 4/4/2013 eere.energy.gov
Tri-Generation Tri-Generation co-produces power, heat and hydrogen. World’s First Fuel Cell and
Hydrogen Energy Station demonstrated in Orange County (DOE/FCT project)
Fountain Valley demonstration • ~250 kW of electricity • ~100 kg/day hydrogen
capacity (350 and 700 bar), enough to fuel 25 to 50 vehicles.
Demonstrated world’s first Tri-generation
station • Demonstrated co-production
of electricity and hydrogen with 54% efficiency
• Uses biogas from wastewater treatment plant
Gas or Biogas H2 is produced at anode
Co-funded by DOE/FCT and multiple partners FuelCell Energy Air Products

10 | Fuel Cell Technologies Office Source: US DOE 4/4/2013 eere.energy.gov
Safety, Codes and Standards
www.eere.energy.gov/hydrogenandfuelcells/codes/
• Trained > 23,000 first-responders and code officials on hydrogen safety and permitting through on-line and in-classroom courses
• 206 Lessons Learned Events in "H2Incidents.org"
• Approximately 750 entries in the Hydrogen Safety Bibliographic Database
H2 Safety Snapshot bulletin Introduction to Hydrogen Safety for First Responders Hydrogen Incident Reporting Database
Hydrogen Safety Bibliographic Database Permitting Hydrogen Facilities Introduction to Hydrogen for Code Officials Hydrogen Safety Best Practices Manual

11 | Fuel Cell Technologies Office Source: US DOE 4/4/2013 eere.energy.gov
DOE FCT funding has enabled: • > 80% cost reduction in PEM fuel
cells since 2002, > 35% since 2008 • Reduction in Pt by a factor of 5
since 2005 • > Double the durability since 2006 • > 80% cost reduction in
electrolyzer stacks in the last decade
Summary: Program Impact DOE FCT funding has led to 363 patents, 35 commercial technologies and 65 emerging technologies.
Example of Impact: ~$70M in funding for specific projects was tracked – and found to have led to nearly $200M in industry investment and revenues.
0
1000
2000
3000
4000
5000
6000
Backup Power Lift Trucks
~1,400 DOE cost-shared deployments
>5,000 purchases without DOE
funding
Recovery Act and Market Transformation – Government as “catalyst” for market success of emerging technologies.
Leveraging DOE funds: Early market deployments of ~1,400 have led to >5,000 additional purchases by industry with no DOE funding.
DOE cost-shared deployments led to >3X additional purchases.
0
100
200
300
400
TotalPatents
Licensed Seeking toLicense
FCT Patent Breakdown Fuel Cells Production & Delivery Storage

12 | Fuel Cell Technologies Office Source: US DOE 4/4/2013 eere.energy.gov
Program R&D - Portfolio Program efforts are planned to transition to industry as technologies reach
commercial-readiness

13 | Fuel Cell Technologies Office Source: US DOE 4/4/2013 eere.energy.gov
Portfolio Examples
H2 and fuel cells can play a key role — by enabling longer driving ranges and heavier duty cycles for certain vehicle types (including buses, light-duty cars & trucks, delivery vans, and short-haul trucks)
Transportation: A diverse portfolio to meet the full range of driving cycles and duty cycles in the nation’s vehicle fleet.
Electric Power System Mass vs. Vehicle Range
SOURCE: General Motors, Inc.
Advantages of Batteries and Fuel Cells: • For shorter distances, batteries are more
effective in terms of system mass
• Fuel cells can provide the driving ranges of today’s vehicles without the weight penalty
• But there are challenges: H2 production, infrastructure, fuel cell cost & durability

14 | Fuel Cell Technologies Office Source: US DOE 4/4/2013 eere.energy.gov
DOE
RD&D
Data Collection & Validation
DOT Deployment
DOE – DOT Collaborations
Accomplishments Demonstrated: • Doubled fuel economies (8 mpg, >2X compared to
diesel buses) • 41% increase in average miles between roadcall with
new fuel cell system (~8,500 MBRC) • Demonstrated more than 7,000 hr fuel cell durability 0
1
2
3
4
5
6
7
8
9
10
Mile
s pe
r Di
esel
Gal
lon
Equi
vale
nt
ACT Diesel ACT FCBSunLine CNG SunLine FCBCTT Diesel CTT FCB
Fuel Cell buses: 39% to 141% better fuel economy than conventional buses
Developed low Pt approach Reduced cost by >30% since 2008, 80% since 2002 NREL
National Bus Program ($49 million for 4 years)
DOE and DOT support the development and deployment of fuel cell technology

15 | Fuel Cell Technologies Office Source: US DOE 4/4/2013 eere.energy.gov 15
Background/Status:
Fuel Cell Airport GSE Demonstrations
• Awarded January 31, 2013 • Fuel Cell Powered Airport Ground
Support Equipment (GSE) Deployment • 3 years, $2.5M DOE share, 50% cost
share, two phases: • Product development and testing • Demonstrations under “rear
world” operating environments • Partners: Plug Power, Charlatte,
Federal Express, Nuvera, Ballard • 15 Baggage Tow Tractors (BTTs) with
~20kW fuel cell systems • 10 units at FedEx in Memphis, TN • 5 units at FedEx in Oakland, CA • H2 to be provided by 20kg/day Nuvera
PowerTap systems
Nuvera PowerTap SMR Air Canada with retrofit fuel cell baggage tug Charlatte CTGE Cargo Tractor

16 | Fuel Cell Technologies Office Source: US DOE 4/4/2013 eere.energy.gov
Ports: Opportunities for Air Quality Improvements/Oil Reduction Projects
Ports are some of America’s most polluted areas with significant impacts on the environment and public health. Nationally, each year, ports: • Emit over 3.8M tons of CO2 eq. • Emit 47K tons of criteria pollutants • Consume 1.8B gallons of
petroleum
A coordinated deployment integrating advanced technologies (fuel cells, EVs, wind or solar) can help address this problem!

17 | Fuel Cell Technologies Office Source: US DOE 4/4/2013 eere.energy.gov
0%
10%
20%
30%
40%
50%
60%
70%
80%
90%
100%
GHGEmissions
CriteriaPollutants
DieselFuel
0%
10%
20%
30%
40%
50%
60%
70%
80%
90%
100%
GHGEmissions
CriteriaPollutants
DieselFuel
Clean Energy Technology for Ports
Shipboard APUs 8
Offshore Wind 7
Cargo handling equipment 2 EV/FC trucks 3
Resilient Stationary Power 1
Using an array of clean energy technologies in a major U.S. seaport could result in a reduction of 725K tons of CO2 emissions, ~80M gallons of petroleum, and 9,000 tons of criteria pollutants.
Solar 5
Ocean-going vessels Cargo handling equipment
Heavy duty vehicles
Energy Storage 6
Biofuels 4
60% reduction in GHG emissions
nearly 100% reduction in criteria pollutants
>20% reduction in diesel fuel

18 | Fuel Cell Technologies Office Source: US DOE 4/4/2013 eere.energy.gov
HD and MD eTruck Demonstrations Electric Transportation Technologies (ETT) FOA Issued March 5, 2012 - Closed May 4th,
Three Awards Made on August 8, 2012
Vehicle Technologies Program FY2012 Appropriations: Zero emission cargo transport in areas of severe nonattainment and severe traffic congestion.
• SCAQMD (CA) $4.12 M and Houston Area Council (TX) $3.4 M (Kick Off November 20, 2012) • on-board fuel cell rechargers for ~23 C8
drayage trucks • Houston Area Council (TX) $2.4 M
• 30 all battery C6 delivery trucks • 50/50 cost share • Kick Off Mid-April 2013
C6 Delivery Truck
C8 Drayage Truck

19 | Fuel Cell Technologies Office Source: US DOE 4/4/2013 eere.energy.gov
OEM FCEV Announcements
Hyundai Motor America • First ix35 Fuel Cell vehicle rolled off the assembly line
at the Hyundai’s Plant No. 5 in Ulsan, South Korea on February 26, 2103
Toyota Motor Corporation • 2015 global FCV introduction planned • Proposed NEC Market Regions: New York, Boston
Providence, Hartford • 100 demonstration vehicles on the road- used by
academia, government, & fueling developers
Honda Motor Company • Working on cluster concept of communities and
refueling stations in California • First Fuel Cell Vehicle Dealership Network (Honda FCX
Clarity) • Three Official Clarity/FCX dealerships:
Santa Monica, Torrance, and Costa Mesa • Leasing in Southern California –
current infra (Torrance, Irvine and Santa Monica)

20 | Fuel Cell Technologies Office Source: US DOE 4/4/2013 eere.energy.gov
OEM FCEV Collaborations
BMW- Toyota
“It's game-on for a jointly developed fuel-cell system from BMW and Toyota.” (January 24, 2013) Ford, Nissan, Daimler
“Daimler the third-biggest maker of luxury vehicles, and Ford Motor added Nissan Motor Co. as a partner in developing fuel cells for electric cars, which the manufacturers plan to start selling in 2017.” (January 28, 2013)
VW- Ballard
“Ballard Signed Long-Term Engineering Services Contract To Advance Volkswagen Fuel Cell Research” (March 7, 2013)

21 | Fuel Cell Technologies Office Source: US DOE 4/4/2013 eere.energy.gov
FCEVs and Fuel Cell Buses • > 560 vehicles in operation
since 1999 — ~230 currently operating
• ~ 5 million miles driven • > 1 million passengers on
fuel cell buses
H2 Station Investment • 20 stations — including
planned/funded • ~$34M invested (CARB
and CEC) • $5.5M invested by
SCAQMD • ~$29M available (CEC
solicitation currently closed) • $20M proposed for
2013/14 (CEC)
Hydrogen and Fuel Cell Initiatives at the State Level
Several states have major hydrogen and fuel cell programs underway.
California Agreement signed by 12 stakeholders—including GM, utilities, hydrogen providers, DOD, DOE—to establish hydrogen as a major part of the solution to Hawaii’s energy challenges. •15 GM FCEVs currently in demonstrations with military
Hawaii
• Renewable hydrogen (from geothermal and wind energy) will be used for buses
• Goals include a nascent refueling infrastructure on Oahu by 2015 to support initial deployments of government and industry FCEV fleets
Hydrogen Stations in Planning / Development Stage - OAHU

22 | Fuel Cell Technologies Office Source: US DOE 4/4/2013 eere.energy.gov
H2 Infrastructure Roadmapping: CA

23 | Fuel Cell Technologies Office Source: US DOE 4/4/2013 eere.energy.gov
H2 Infrastructure Roadmapping: CA
Hyundai Motor America • Preliminary Fleet Program running
for 2013 to end of 2014 (FC Tucson)
• Working with California to establish more fueling stations
Honda Motor Company • Working on cluster concept of communities
and refueling stations in California
• First Fuel Cell Vehicle Dealership Network (Honda FCX Clarity)
• Three Official Clarity/FCX dealerships: Santa Monica, Torrance, and Costa Mesa
• Leasing in Southern California – current infra (Torrance, Irvine and Santa Monica)
Berkley 150
City of LA 1368
Fremont 17
Long Beach 215
Oakland 197
Orange County 967
Riverside 39
Sacramento 875
San Bernardino 36
San Francisco 677
San Jose 98
Ventura 33
Total 4672
GSA Light Duty Fleet City Breakdown of California

24 | Fuel Cell Technologies Office Source: US DOE 4/4/2013 eere.energy.gov
Northeast Roadmapping: CT
Metro Hartford Vehicle Fleet (320 GSA Fleet Units)
Metro New York City
Vehicle Fleet (1,577 GSA Units)

25 | Fuel Cell Technologies Office Source: US DOE 4/4/2013 eere.energy.gov
Northeast Roadmapping: MA
Metro Boston Vehicle Fleet (980 GSA Fleet Units)

26 | Fuel Cell Technologies Office Source: US DOE 4/4/2013 eere.energy.gov
Northeast Roadmapping: NY
Metro New York City Vehicle Fleet (1,577 GSA Fleet
Units)

27 | Fuel Cell Technologies Office Source: US DOE 4/4/2013 eere.energy.gov
Work With Clean Cities to:
• Inform stakeholders and general public about fuel cell vehicle progress and events – Distribute fact sheets, coordinate events and expo
displays; • Develop and distribute lessons learned case studies on fuel
station permitting, codes and standards applications, and public acceptance pamphlets;
• Plan and execute outreach activities such as information webinars, public acceptance actions (e.g. questionnaires, data collections, et. al.);
• Support fuel cell vehicle fleet deployments by: – Coordinating planning meetings with stakeholders,
assisting in safety training and awareness, etc.
Future Plans

28 | Fuel Cell Technologies Office Source: US DOE 4/4/2013 eere.energy.gov
Thank You
hydrogenandfuelcells.energy.gov