full-scale tensile and shear wall performance testing … tensile and shear wall performance testing...
TRANSCRIPT

Full-Scale Tensile and Shear Wall Performance Testing of Light-Frame Wall Assemblies Sheathed with
Windstorm OSB Panels
Test Report
Prepared for Doug McNeill NORBORD
(416) 360-2261 [email protected]
Prepared by NAHB Research Center, Inc.
400 Prince George’s Boulevard Upper Marlboro, MD 20774
July 8, 2005
4105-008

Windstorm System Performance Testing
NAHB Research Center, Inc. P05-474070805
P05-474070805 Copyright 2005 NAHB Research Center, Inc. All rights reserved. Disclaimer Neither the NAHB Research Center, Inc., nor any person acting in its behalf, makes any warranty, express or implied, with respect to the use of any information, apparatus, method, or process disclosed in this publication or that such use may not infringe privately owned rights, or assumes any liabilities with respect to the use of, or for damages resulting from the use of, any information, apparatus, method, or process disclosed in this publication, or is responsible for statements made or opinions expressed by individual authors


Windstorm System Performance Testing
NAHB Research Center, Inc. P05-474070805 i
TABLE OF CONTENTS Introduction ...................................................................................................................................1 Methods And Materials .................................................................................................................1
General......................................................................................................................................1
Tensile Testing ..........................................................................................................................1
Shear Wall Testing ....................................................................................................................5
Results ..........................................................................................................................................7 Tensile Tests .............................................................................................................................7
Shear Wall Tests .....................................................................................................................11
Engineering Analysis Of Results.................................................................................................13 Tensile Tests ...........................................................................................................................13
Shear Wall Tests .....................................................................................................................15
Summary.....................................................................................................................................16 Uncertainty Estimates .................................................................................................................17
Tensile Tests ...........................................................................................................................17
Shear Wall Tests .....................................................................................................................17
Declarations And Disclaimers .....................................................................................................17


Windstorm System Performance Testing
NAHB Research Center, Inc. P05-474070805 1
FULL-SCALE TENSILE AND SHEAR WALL PERFORMANCE TESTING OF LIGHT-FRAME WALL ASSEMBLIES SHEATHED
WITH WINDSTORM OSB PANELS
INTRODUCTION The purpose of this testing program is to measure the tensile and shear capacities of full-scale light-frame wood wall systems sheathed with Norbord Windstorm OSB panels. The key feature of the tested Windstorm OSB panels is associated with oversized length (97-1/8” as compared to 96” standard OSB panel length).
METHODS AND MATERIALS
General Specimens were fabricated and tested at the NAHB Research Center Laboratory Facility located in Upper Marlboro, MD. Testing was conducted in May 2005. Lumber, fasteners, and hardware were purchased from local suppliers. Windstorm OSB panels were supplied by Norbord (Client). The panels were trademarked by an independent third-party agency (TECO) for compliance with PS 2 standard1 as indicated by the stamp on every panel.
Spruce-Pine-Fir (SPF) Stud Grade kiln-dried framing lumber was used for all specimens. Moisture content of lumber during fabrication and testing ranged from 8 to 12%. Moisture content was measured using an electric moisture meter in accordance with Method A (Conductance Meters) of ASTM Standard D 4444-92 (2003)2. The standard stud height of 92-5/8” was used. Because Windstorm panels are 97-1/8” long, the top and bottom panel edges were flush with the framing edges (92-5/8”+(3)1-1/2”=97-1/8”). All sheathing and framing nails were installed using a pneumatic nail gun.
Tensile Testing Tensile testing was conducted in accordance with the general provisions of ASTM E72–043. A total of four wall configurations were tested (Table 1). A sample size of three was used for each configuration. A total of twelve specimens were tested. Testing was conducted using a Universal Testing Machine (UTM) controlled via a computer-based system. Instrument readings were recorded using a computer-based data acquisition system.
1 Performance Standard for Wood-based Structural-use Panels, 1992, PS 2—92, United States Department of Commerce, Gaithersburg, MD. 2 ASTM D 4444, "Standard Test Methods for Use and Calibration of Hand-Held Moisture Meters," ASTM International. For referenced ASTM standards, visit the ASTM website, www.astm.org, or contact ASTM Customer Service at [email protected]. For Annual Book of ASTM Standards volume information, refer to the standard's Document Summary page on the ASTM website. 3 ASTM E72, “Standard Test Methods of Conducting Strength Tests of Panels for Building Construction,” ASTM International.

Windstorm System Performance Testing
P05-474070805 NAHB Research Center, Inc. 2
Table 1 - Tensile Test Matrix
Test Config.
Sample Size
Specimen Height,
inch
Specimen Width, inch
Nail Size
Bottom Plate Bolt Washers
On-center Perimeter Nail Spacing, inch
Bottom and Top Plate Edge Distance, inch
T1 3 97-1/8 48 8d com.
1-3/4” D round cut washer
Upper Top Plate 5 1/2 Lower Top Plate 6 1/2 Bottom Plate 3 1/4 Sides 5 1/2
Field 12
3/4
T2 3 97-1/8 48 10d com.
1-3/4” D round cut washer
Upper Top Plate 6 1/2 Lower Top Plate 7 1/2
Bottom Plate 4 Panel Sides 6 1/2
Field 12
3/4
T3 3 97-1/8 48 8d com.
1-3/4” D round cut washer
Upper Top Plate 4 Lower Top Plate 4 1/2 Bottom Plate 2 1/2
Panel Sides 4 Field 12
3/4
T4 3 97-1/8 48 8d com.
3”x3”x0.25” plate
washer
Upper Top Plate 4 Lower Top Plate 4 1/2 Bottom Plate 2 1/2
Panel Sides 4 Field 12
3/4
Figure 1 depicts tension test specimen configuration and test setup. Single studs were used at the specimen corners. Studs were spaced 16” on center. Sheathing panels were attached using pneumatically installed 8d (D=0.131”, L=2.5”) or 10d (D=0.148”, L=3.0”) common nails in accordance with Table 1. The sheathing nailing schedules were specified by the Client. Sheathing nail edge distance of 3/4" was used along the top and bottom plates. Top and bottom plates were end nailed to studs with 2-16d pneumatic nails (D=0.131”, L=3-1/4”) per connection. Double top plates were nailed together with 16d pneumatic nails spaced at 24” on center.

Windstorm System Performance Testing
NAHB Research Center, Inc. P05-474070805 3
Specimen Configuration and Attachment to UTM Specimen in UTM
Figure 1 - Tension Specimen Configuration and Setup
Load was applied to the specimen using 4”x4” steel tubes bolted to the top and bottom plates with three 5/8” diameter bolts per each steel tube. Round cut washers (D=1-3/4”) were used with all bolts except the bottom plate attachment for Configuration T4 specimens where square 3”x3”x0.25” steel plate washers were used to minimize the potential for cross grain bending failure of the bottom plates (Figure 2).

Windstorm System Performance Testing
P05-474070805 NAHB Research Center, Inc. 4
Round Washers (T1, T2, T3) Plate Washers (T4)
Figure 2 - Bottom Plate Connections Using Bolts with Round and Plate Washers The steel tube attached to the bottom plate of the specimen was rigidly bolted to the lower crosshead of the UTM to simulate connection to the foundation. The steel tube attached to the double top plate was not rigidly connected to the upper UTM crosshead to allow rotation of the top of the specimen to more closely simulate the roof attachment. A ramp loading function was used with a constant displacement rate of 0.1 inch/min in accordance with ASTM D1761-884. Specimens were tested to failure defined as a drop in load to less than 80% of the peak load. Load was measured with a built-in UTM load cell. Tensile deformation of the specimen was measured using a built-in UTM string potentiometer and using two deflectometers attached to specimen framing—one near each side of the specimen (Figure 1). Deflectometers measured relative deformation of the top and bottom plates of the specimen via aluminum angles attached to the top plate. The tip of the deflectometer rested at the center of the bottom plate (Figure 2). Deformations were not measured on the opposite face of the specimen because access to the framing members was obstructed by the sheathing. Due to an eccentric configuration of the specimens with the sheathing installed on one face only, the specimen experienced out-of-plane rotation with the pivot point near the top plate. This rotation was captured by deflectometers and introduced an additional translational component to the measurement. Moreover, splitting and cupping of the bottom plates affected deflectometer readings in an inconsistent manner. Therefore, deflection measured by the built-in UTM string potentiometer is reported in the Results section.
4 ASTM D1761-88(2000)e1, “Standard Test Methods for Mechanical Fasteners in Wood,” ASTM International.

Windstorm System Performance Testing
NAHB Research Center, Inc. P05-474070805 5
Shear Wall Testing Shear wall testing was conducted in accordance with the general provisions of ASTM E 564-005. A total of two configurations were tested in accordance with Table 2. A sample size of three was used with each wall configuration. A total of six shear wall specimens were tested. Figure 3 shows a schematic of a shear wall test setup including instrumentation. Figure 4 shows a photograph of the test setup. Tables 3 and 4 summarize materials and fastening schedules. The sheathing nailing schedules were specified by the Client.
Table 2 - Shear Wall Test Matrix
Test Config.
Sample Size
Specimen Height,
inch
Specimen Width, inch
Nail Size
On-center Sheathing Nail Spacing, inch
Bottom and Top Plate
Edge Distance,
inch
S1 3 97-1/8 96 8d common
Upper Top Plate 5 1/2 Lower Top Plate 6 1/2 Bottom Plate 3 1/4 Panel Sides 5 1/2
Field 12
3/4
S2 3 97-1/8 96 8d common
Upper Top Plate 4 Lower Top Plate 4 1/2 Bottom Plate 2 1/2
Panel Sides 4 Field 12
3/4
Testing was conducted using a racking testing apparatus controlled via a computer-based system. Instrument readings were recorded using a computer-based data acquisition system.
Figure 3 - Shear wall configuration and setup
5 ASTM E564-00e1, “Standard Practice for Static Load Test for Shear Resistance of Framed Walls for Buildings,” ASTM International.

Windstorm System Performance Testing
P05-474070805 NAHB Research Center, Inc. 6
Figure 4 - Photograph of Shear Wall Test Setup
Table 3 - Methods And Materials Wall height = 97-1/8” Wall width = 8’ Openings: None 2x4 studs spaced 16” o.c. Lumber – SPF Stud Grade Stud height: 92-5/8” 2x4 bottom plates 2-2x4 top plates 2-2x4 corner studs 48”x97-1/8”, 7/16” OSB sheathing installed with a 1/8” gap between panels Holddown: Simpson HTT22 installed per manufacturer’s specifications and raised off the bottom plate by 1 inch Anchor bolts: 5/8” diameter bolts with round cut 1-3/4” diameter washers spaced a maximum of 48” on center and located at 12” from the wall corners Sheathing nails: 8d common nail (D=0.131”, L=2.5”) Framing Nails: 16d pneumatic nail (D=0.131”, L=3.25”) Sheathing nail edge distance: 3/4" along specimen perimeter and 3/8 at adjacent panel edges Interior sheathing: none
Windstorm System Performance Testing
NAHB Research Center, Inc. P05-474070805 7
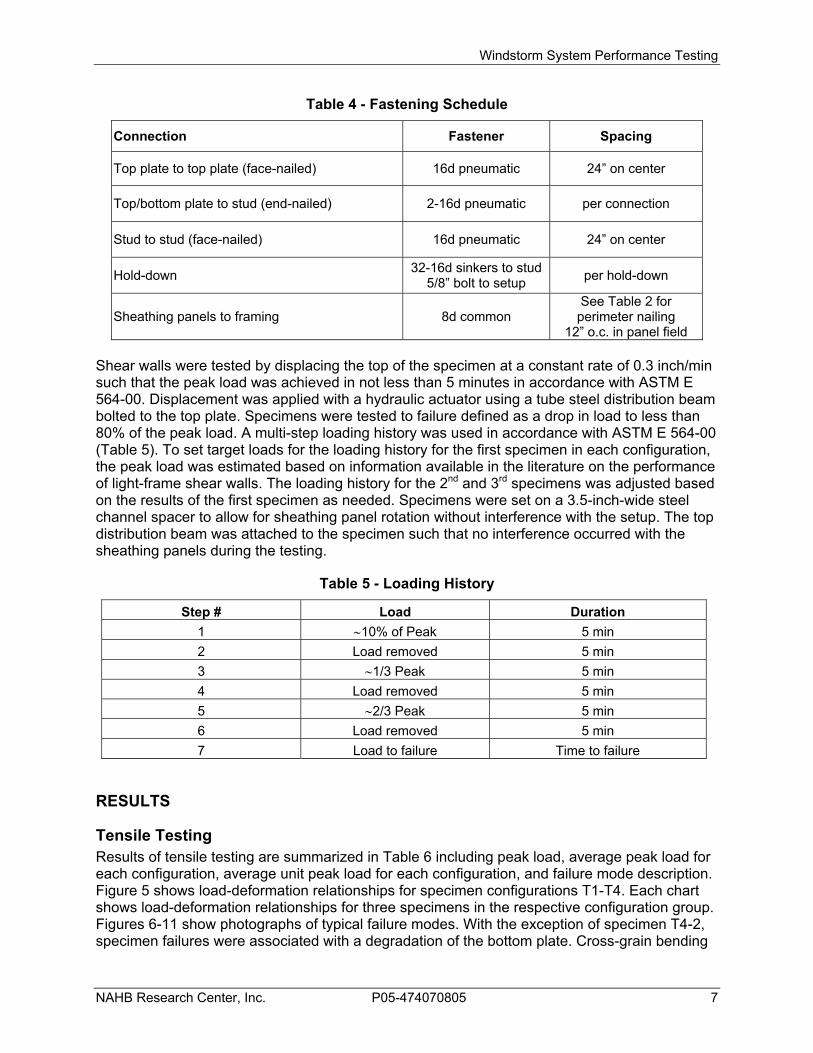
Table 4 - Fastening Schedule
Connection Fastener Spacing
Top plate to top plate (face-nailed) 16d pneumatic 24” on center
Top/bottom plate to stud (end-nailed) 2-16d pneumatic per connection
Stud to stud (face-nailed) 16d pneumatic 24” on center
Hold-down 32-16d sinkers to stud 5/8” bolt to setup per hold-down
Sheathing panels to framing 8d common See Table 2 for perimeter nailing
12” o.c. in panel field Shear walls were tested by displacing the top of the specimen at a constant rate of 0.3 inch/min such that the peak load was achieved in not less than 5 minutes in accordance with ASTM E 564-00. Displacement was applied with a hydraulic actuator using a tube steel distribution beam bolted to the top plate. Specimens were tested to failure defined as a drop in load to less than 80% of the peak load. A multi-step loading history was used in accordance with ASTM E 564-00 (Table 5). To set target loads for the loading history for the first specimen in each configuration, the peak load was estimated based on information available in the literature on the performance of light-frame shear walls. The loading history for the 2nd and 3rd specimens was adjusted based on the results of the first specimen as needed. Specimens were set on a 3.5-inch-wide steel channel spacer to allow for sheathing panel rotation without interference with the setup. The top distribution beam was attached to the specimen such that no interference occurred with the sheathing panels during the testing.
Table 5 - Loading History
Step # Load Duration 1 ∼10% of Peak 5 min 2 Load removed 5 min 3 ∼1/3 Peak 5 min 4 Load removed 5 min 5 ∼2/3 Peak 5 min 6 Load removed 5 min 7 Load to failure Time to failure
RESULTS
Tensile Testing Results of tensile testing are summarized in Table 6 including peak load, average peak load for each configuration, average unit peak load for each configuration, and failure mode description. Figure 5 shows load-deformation relationships for specimen configurations T1-T4. Each chart shows load-deformation relationships for three specimens in the respective configuration group. Figures 6-11 show photographs of typical failure modes. With the exception of specimen T4-2, specimen failures were associated with a degradation of the bottom plate. Cross-grain bending

Windstorm System Performance Testing
P05-474070805 NAHB Research Center, Inc. 8
of the bottom plate was the predominant failure mode for configurations T1-T3. Because the limiting factor was the strength of the bottom plate member, the range of tested nailing schedules (T1-T3) had limited effect on the peak load.
Square plate washers performed the function of suppressing the bottom plate cross-grain failure mode. As a result, T4 specimens showed an increased peak load relative to the specimens without plate washers (T1-T3). The failure of T4 specimens was associated with a degradation of sheathing connections at the bottom plate including local cross grain tension failure of wood (T4-1 and T4-3) or failure of sheathing connections at the top plate (T4-2). These failure modes indicate that the use of plate washers provides a structural system with balanced capacities of the sheathing nail connections at the top and bottom plates and the wood of the bottom plate.
Table 6 - Tensile Test Results
Test Config.
Nail Size
Bottom Plate Bolt washers
On-center Perimeter Nail Spacing, inch
Speci- men
Peak Load,
lb
Average Peak
Load, lb
Unit Peak Load, lb/ft
Failure Mode
1 3,970
2 3,645 T1 8d com.
1-3/4” D round cut washer
Upper Top Plate 5 1/2 Lower Top Plate 6 1/2 Bottom Plate 3 1/4 Sides 5 1/2
Field 12 3 4,220
3,940 985 Bottom plate cross grain
bending
1 4,590
2 3,765
Bottom plate cross grain
tension T2 10d
com.
1-3/4” D round cut washer
Upper Top Plate 6 1/2 Lower Top Plate 7 1/2
Bottom Plate 4 Panel Sides 6 1/2
Field 12 3 4,800
4,380 1,095
Bottom plate cross grain
bending
1 3,707
2 3,671 T3 8d com.
1-3/4” D round cut washer
Upper Top Plate 4 Lower Top Plate 4 1/2 Bottom Plate 2 1/2 Panel Sides 4
Field 12 3 3,748
3,710 928 Bottom plate cross grain
bending
1 5,200 Bottom plate
sheathing connections
2 6,260 Sheathing nails along top plate
T4 8d com.
3”x3”x0.25” plate
washer
Upper Top Plate 4 Lower Top Plate 4 1/2 Bottom Plate 2 1/2 Panel Sides 4 Field 12
3 5,970
5,810 1,452
Bottom plate sheathing connections

Windstorm System Performance Testing
NAHB Research Center, Inc. P05-474070805 9
0
1,000
2,000
3,000
4,000
5,000
6,000
7,000
0 0.2 0.4 0.6 0.8 1 1.2 1.4
Displacement, inch
Load
, lb
0
1,000
2,000
3,000
4,000
5,000
6,000
7,000
0 0.2 0.4 0.6 0.8 1 1.2 1.4
Displacement, inch
Load
, lb
Configuration T1 Configuration T2
0
1,000
2,000
3,000
4,000
5,000
6,000
7,000
0 0.2 0.4 0.6 0.8 1 1.2 1.4
Displacement, inch
Load
, lb
0
1,000
2,000
3,000
4,000
5,000
6,000
7,000
0 0.2 0.4 0.6 0.8 1 1.2 1.4
Displacement, inch
Load
, lb
Configuration T3 Configuration T4
Figure 5 - Load-deflection relationships for tensile tests

Windstorm System Performance Testing
P05-474070805 NAHB Research Center, Inc. 10
Figure 6 - Cross grain bending failure (T1) Figure 7 - Cross grain tension failure (T2)
Figure 8 - Cross grain bending failure (T3) Figure 9 - Sheathing nails along top plate failure (T4)

Windstorm System Performance Testing
NAHB Research Center, Inc. P05-474070805 11
Figure 10 - Cross grain tension failure (T4) Figure 11 - Cross grain tension failure (T4)
Shear Wall Testing Table 7 summarizes result of shear wall testing. Figure 12 shows load-deformation relationships for wall configurations S1 and S2. Slip of the bottom plate was subtracted from the global wall deformation. Specimen failures were primarily associated with a failure of perimeter sheathing connections (Figure 13).
Table 7 - Shear Wall Test Results
Test Config.
Nail Size
On-center Sheathing Nail Spacing, inch Specimen Peak
Load, lb Average
Peak Load, lb
Average Unit
Shear, lb/ft
1 6,660
2 6,690 S1 8d common
Upper Top Plate 5 1/2 Lower Top Plate 6 1/2 Bottom Plate 3 1/4 Panel Sides 5 1/2
Field 12 3 7,040
6,790 850
1 9,000
2 9,000 S2 8d common
Upper Top Plate 4 Lower Top Plate 4 1/2 Bottom Plate 2 1/2
Panel Sides 4 Field 12 3 8,790
8,930 1,115

Windstorm System Performance Testing
P05-474070805 NAHB Research Center, Inc. 12
0
1,000
2,000
3,000
4,000
5,000
6,000
7,000
8,000
9,000
10,000
0.0 1.0 2.0 3.0 4.0 5.0
Displacement, inch
Load
, lb
0
1,000
2,000
3,000
4,000
5,000
6,000
7,000
8,000
9,000
10,000
0 1 2 3 4 5
Displacement, inch
Load
, lb
Configuration S1 Configuration S2
Figure 12 - Load-deformation relationships
Rotation of sheathing panels
Separation of sheathing panel from framing after failure
Figure 13 - Typical response shear wall specimens—failure of sheathing connections

Windstorm System Performance Testing
NAHB Research Center, Inc. P05-474070805 13
ENGINEERING ANALYSIS OF RESULTS
Tensile Tests The purpose of the tensile testing was to demonstrate that the performance of full-scale wall systems is consistent with the engineering models in terms of the (1) response mode and (2) load capacity.
Two primary failure modes were observed during testing: (1) cross grain bending of the bottom plate (configurations T1-T3), and (2) failure of the sheathing nail connections including local failure of wood in cross grain tension (configuration T4).
National Design Specification for Wood Construction6 does not provide design values for wood in cross grain bending or tension. However, the performance of the T1-T3 specimens can be analyzed using engineering methods and reference material properties as demonstrated below.
Analysis: Cross Grain Bending
The bottom plate is modeled as a cantilever beam fixed in the middle of its cross section. The specimen capacity is estimated as follows:
lbLSP 114,4085,3
75.1)18()400300(
÷=÷
==σ
where: σ ≈ 300-400 psi = stress at capacity based on reference valued for cross-grain
tension for select wood species included in the SPF species group7;
S = (48)(1.5)^2/6=18 inch3 = section modulus; and, L = 3.5 inch / 2 =1.75 inch = cantilever span.
The estimated range of capacities overlaps with the range measured during the testing (3,710÷4,380 lb). Given the uncertainty associated with the cross grain bending behavior, the agreement between the test data and the engineering analysis is satisfactory. In addition, the reference values used in the analysis represent cross-grain tension in lieu of cross grain bending. The cross grain bending stress is expected to be slightly higher, but test values for this property are not readily available in the literature. Therefore, the behavior of T1-T3 specimens observed during testing agrees reasonably well with the engineering methods of analysis for the observed response mechanism.
The preferred response mechanism for the tensile specimens is a failure of the nail connections of the sheathing panels to the framing. This response mechanism is assumed for the design of sheathing connections in Section 305.6 Wood Structural Panel Sheathing or Siding Used for Uplift Resistance of SSTD 10-998. In this testing program, the failure mode associated with the sheathing connections was achieved by using plate washers (T4) with the bottom plate anchors. The use of plate washers is consistent with the requirements of Section 303.2.3 Sill Plate to Foundation Anchorage of SSTD 10-99. 6 National Design Specification (NDS) for Wood Construction, 2005, American Forest and Paper Association, Washington, DC. 7 Wood Handbook, 1999, Forest Products Society, Madison, WI. 8 Standard for Hurricane Resistant Residential Construction, 1999, SSTD 10-99, Southern Building Code Congress International, Birmingham, AL.

Windstorm System Performance Testing
P05-474070805 NAHB Research Center, Inc. 14
The lateral design procedures of the NDS for dowel-type connections such as sheathing to bottom plate nail connections assumes that the nail yields (i.e., bends) and the wood in both side and main members is crushed due to bearing on the nail. The observed failure modes for T4 specimens also involved local cross-grain tension failure of wood around the nail (T4-1 and T4-3). Bottom plate nails from these specimens were examined for onset of deformation to evaluate whether yielding occurred (Figure 14). The nails were removed from the wood in such manner that the original deformed shape was preserved. Top plate nails from specimen T4-2 were also examined (Figure 14). In both cases, nail deformation is evident indicating significant nail yielding.
Nails from the bottom plates of
specimens T4-1 and T4-3 Nails in the double top plate of the specimen T4-2
(sheathing is pulled away to expose the nails) Figure 14 - Nail deformation in T4 specimens
The performance of T4 specimens is further compared to the NDS allowable stress design (ASD) values and to the results of a testing program conducted at Virginia Tech9. All results are presented on a “per nail” basis (Table 8). The average tested value exceeds the NDS ASD reference design value by a factor of 4.3. It should be noted that the NDS ASD reference design value is permitted to be adjusted by the load duration factor for wind design (CD=1.6).
Furthermore, the results of this testing program are nearly identical to the results from a study conducted at Virginia Tech on the performance of individual nail connections. It should be noted that SPF lumber and 7/16 OSB sheathing attached with 8d common nails with an edge distance of 3/4 inches were also used in the Virginia Tech study. This allows for direct comparison between the two studies and indicates that when plate washers are installed, the response of the full-scale wall assembles in tension is governed by the behavior of individual nail connections.
9 The Racking Performance of Light-Frame Shear Walls, 2000, Virginia Tech, Salenikovich A. J., Ph.D. dissertation, Blacksburg, VA.

Windstorm System Performance Testing
NAHB Research Center, Inc. P05-474070805 15
Table 8 - Individual Nail Resistance Values (Per Nail Basis, 8d Common Nail)
NDS reference design value (ASD)
Average nail capacity based on this test program (Configuration T4)
Average nail capacity based on Virginia Tech tests of individual nail
connections 67 lb1 290 lb 289 lb
1. For wind design, the ASD reference design value is permitted to be adjusted by the load duration factor (CD=1.6).
The ratio of peak load to the NDS reference design value of 4.3 also meets or exceeds the requirements of the ICC-ES acceptance criteria AC1310 used to establish design values for wood connectors such as metal straps for connecting plates to studs. In accordance with AC13, when only three specimens are tested and the capacity of each specimen does not vary by more than 20% from the average, the allowable resistance for a normal load duration shall be calculated as the lowest ultimate load divided by a factor of 3.0. Using T4-1—the specimen with the lowest resistance—the allowable resistance for an individual nail is:
lbF 86)20)(0.3(
)200,5(==
In addition, AC13 does not permit the allowable values calculated based on testing to exceed the NDS design values for fasteners, i.e., F cannot exceed 67 lb. It should also be noted that AC13 requires that the relative deformation of the connected members at the allowable load does not exceed 0.125 inches. However, this deformation criteria is not a controlling factor for nailed sheathing connections. For example, based on the testing conducted at Virginia Tech, the load at 0.125 inches exceeds 200 lb. In conclusion, this analysis indicates that the NDS provisions for lateral design of dowel-type connections should be used for design of uplift load path in systems similar to T4 configuration. The capacity of Windstorm OSB panels exceeds the capacity of the panel connections to the framing. Therefore, Windstorm OSB panels do not represent a limiting factor in the system performance.
Shear Wall Tests The shear wall configurations included increased nailing schedules at the top and bottom plates. The purpose of the additional nails is to resist the uplift component of the wind load. The objective of the testing was to investigate the effect of the increased nailing schedules on the response of light-frame shear walls.
The failure of all specimens was associated primarily with the failure of the sheathing-to-framing connections due to nail bending and degradation of the wood and the panel material around the nail. This failure mode is typical for light-frame wood shear walls. Therefore, the additional nails in the top and bottom plate did not alter the system behavior.
The test unit shear values exceed the published nominal unit shear values11 calculated based on the nail spacing at the panel sides by 14% (Table 9). This increase is associated with the 10 Acceptance Criteria for Joist Hangers and Similar Devices (AC13), 2003, ICC Evaluation Service, Whittier, CA. 11 Supplement: Special Design Provisions for Wind and Seismic, ASD/LRDF, Manual for Engineered Wood Construction, 2001, American Forest and Paper Association, Washington, DC.

Windstorm System Performance Testing
P05-474070805 NAHB Research Center, Inc. 16
additional nails installed in the top and bottom plates. An analytical model developed by McCutcheon12 and expanded by Salenikovich9 is applied to evaluate the observed increase. Based on the predictions of the model, the additional nails at the plates are expected to increase the shear wall capacity by about 17% for both S1 and S2 specimen configurations relative to a uniform nailing schedules. Therefore, the test data is within three percent of the nominal unit shear values modified for the increased nailing schedule along the top and bottom plates. Given the approximate nature of the model and the variability associated with material testing, the observed degree of agreement between test results and published values is excellent. Therefore, the increased nailing schedule at the plates does not have an adverse effect on the shear performance of light-frame systems sheathed with Windstorm OSB panels.
Table 9 – Unit Shear Values
Test Conf.
On-center Sheathing Nail Spacing, inch
Average Tested Unit Shear, lb/ft
Published Nominal Unit Shear Based on Side
Nail Spacing1, lb/ft Ratio of Tested to Published Nominal
S1
Upper Top Plate 5 ½ Lower Top Plate 6 ½ Bottom Plate 3 ¼ Panel Sides 5 ½ Field 12
850 749 1.14
S2
Upper Top Plate 4 Lower Top Plate 4 ½ Bottom Plate 2 ½ Panel Sides 4 Field 12
1,115 980 1.14
1. Nominal units shear values are adjusted for specific gravity of SPF lumber.
SUMMARY This testing program was conducted to measure the performance of full-scale, light-frame wood wall systems sheathed with oversized Norbord Windstorm OSB panels.
Test results showed excellent agreement with engineering analyses, other studies, and design specifications, where applicable.
Tensile tests demonstrated that cross-grain bending failure of the bottom plate must be suppressed to achieve the preferred failure of the sheathing connections. Plate washers installed with anchor bolts provide an effective mechanism for achieving this goal. The uplift analysis of such systems can be performed using the provisions of the NDS for Wood Construction for lateral design of dowel-type fasteners.
Shear wall testing also showed excellent agreement with published design values.
12 Racking deformations in wood shear walls, 1985, McCutcheon, W.J., Journal of Structural Engineering, ASCE Vol. 111(2), pp. 257-269.

Windstorm System Performance Testing
NAHB Research Center, Inc. P05-474070805 17
UNCERTAINTY ESTIMATES
Tensile tests The uncertainty of the peak load measurements has been estimated at 0.03%. The uncertainty of the displacement measurements has been estimated at 0.2%. These estimates were made using Type B analysis at a 95% confidence level with a coverage factor of k=2.
Shear Wall Tests The uncertainty of the peak load measurements has been estimated at 0.6%. The uncertainty of the displacement measurements has been estimated at 1.2%. These estimates were made using Type B analysis at a 95% confidence level with a coverage factor of k=2.
DECLARATIONS AND DISCLAIMERS This is a factual report of the results obtained from laboratory tests of the samples tested. The NAHB Research is accredited as a test lab by the International Accreditation Service (TL-205). The report may be reproduced and distributed at the Client’s discretion provided it is reproduced in its entirety. Any partial reproduction must receive prior written permission of the NAHB Research Center. This test report does not constitute a product endorsement by the NAHB Research Center or any of its accrediting agencies. Vladimir G. Kochkin Research Engineer, Engineering Services
July 8, 2005
Signature Date