microscopic characterization of tensile and shear
TRANSCRIPT
Microscopic Characterization of Tensile and ShearFracturing in Progressive Failure in MarbleYi Cheng1,2 and Louis Ngai Yuen Wong1,2,3
1Faculty of Engineering, China University of Geosciences, Wuhan, China, 2Formerly at School of Civil and EnvironmentalEngineering, Nanyang Technological University, Singapore, 3Department of Earth Sciences, University of Hong Kong, HongKong
Abstract Compression-induced tensile and shear fractures were reported to be the two fundamentalfracture types in rock fracturing tests. This study investigates such tensile and shear fracturing process inmarble specimens containing two different flaw configurations. Observations first reveal that thedevelopment of a tensile fracture is distinct from shear fracture with respect to their nucleation, propagation,and eventual formation in macroscale. Second, transgranular cracks and grain-scale spallings becomeincreasingly abundant in shear fractures as loading increases, which is almost not observed in tensilefractures. Third, one or some dominant extensional microcracks are commonly observed in the center oftensile fractures, while such development of microcracks is almost absent in shear fractures. Microcracks aregenerally of a length comparable to grain size and distribute uniformly within the damage zone of the shearfracture. Fourth, the width of densely damaged zone in the shear fracture is nearly 10 times of that in thetensile fracture. Quantitative measurement on microcrack density suggests that (1) microcrack density intensile and shear fractures display distinct characteristics with increasing loading, (2) transgranular crackdensity in the shear fracture decreases logarithmically with the distance away from the shear fracture center,and (3) whatever the fracture type, the anisotropy can only be observed for transgranular cracks with alarge density, which partially explains why microcrack anisotropy usually tends to be unobvious untilapproaching peak stress in specimens undergoing brittle failure. Microcracking characteristics observed inthis work likely shed light to some phenomena and conclusions generalized in seismological studies.
1. Introduction
The presence of fractures controls both cracking and mechanical behaviors of rock masses under loading.Early experimental studies have shown that the Griffith theory satisfactorily explains the initiation of tensilecracks from preexisting flaws (Bieniawski, 1967; Brace & Bombolakis, 1963; Olsson, 1974). Subsequent studiesrevealed that besides the tensile cracks, shear cracks (zones) can also be induced by a far-field compressiveloading on specimens containing preexisting flaws. This result was reported on materials of plaster of Paris(Lajtai, 1971), Indiana limestone and granodiorite (Ingraffea & Heuze, 1980), polymethyl methacrylate andsandstone (Petit & Barquins, 1988), marble (Chen et al., 1995; Huang et al., 1990; Wong & Einstein, 2009a;Yang et al., 2008; Yang et al., 2009), and other natural rocks (Wong et al., 2006, 2007). All these studiessuggested that two major crack types could initiate from a single preexisting flaw, namely, tensile crack(primary crack) and shear crack (secondary crack). Although various rock types containing differentnumber of flaws have been tested extensively (Bobet & Einstein, 1998; Brace & Bombolakis, 1963; Horii& Nemat-Nasser, 1985; Ingraffea & Heuze, 1980; Petit & Barquins, 1988; Shen et al., 1995; Wong & Chau,1998; Wong & Einstein, 2009b; Wong, Leung, & Wang, 2001; Yang et al., 2009), the observed crack typesare similar to those initiating from a single flaw. As a summary, tensile and shear cracks have beenregarded as two fundamental crack types in rock mechanics, though other terms of similar meanings havebeen used by some researchers interchangeably. Each of these cracks can be further divided into somesubtypes, such as tensile wing crack and antiwing crack for tensile crack, and subcoplanar shear crackand oblique shear crack for shear crack. A systematic evaluation of these observed cracks was conductedby Wong and Einstein (2009a).
As established by previous studies, these two crack types are different in three main aspects. First, tensilecracks are produced by a tensile stress concentration even under a far-field compression loadingcondition (Bieniawski, 1967; Brace & Bombolakis, 1963; Griffith, 1924; Hoek, 1968), while shear cracks areproduced by a compressive stress concentration (Chen et al., 1995; Lajtai, 1971; Petit & Barquins, 1988;
CHENG AND WONG 204
PUBLICATIONSJournal of Geophysical Research: Solid Earth
RESEARCH ARTICLE10.1002/2017JB014581
Key Points:• Tensile and shear fractures areproduced under uniaxial compression
• Tensile and shear fracturing showdistinct microscopic characteristics
• The density and anisotropy ofmicrocracks are analyzedquantitatively
Correspondence to:L. N. Y. Wong,[email protected]
Citation:Cheng, Y., & Wong, L. N. Y. (2018).Microscopic characterization of tensileand shear fracturing in progressive fail-ure in marble. Journal of GeophysicalResearch: Solid Earth, 123, 204–225.https://doi.org/10.1002/2017JB014581
Received 19 JUN 2017Accepted 21 DEC 2017Accepted article online 28 DEC 2017Published online 17 JAN 2018
©2017. American Geophysical Union.All Rights Reserved.

Wong et al., 2006; Wong et al., 2007). Second, tensile cracks may show various crack initiation direction withrespect to the preexisting flaw, which are controlled by the stress field around the flaw. They usuallypropagate nearly parallel with the far-field compression direction and follow well-defined paths, which arecharacterized by observable openings. On the contrary, shear cracks usually have two possible orientations:subcoplanar or oblique with respect to the artificial flaw (normal to the compression direction has also beenreported by Lajtai, 1971). Shear cracks often appear as damage belts or narrow zones consisting of manysmall scale cracks (Huang et al., 1990; Petit & Barquins, 1988; Sagong & Bobet, 2003; Wong & Chau, 1998;Wong & Einstein, 2009a). The trajectory of a shear crack is not well defined until final failure. Third, tensilecrack surface is usually clean and smooth (Bieniawski, 1967; Horii & Nemat-Nasser, 1985; Huang et al.,1990; Lajtai, 1971; Petit & Barquins, 1988; Shen et al., 1995). However, shear cracks are usually characterizedby a rough and stepped crack surface (Bobet & Einstein, 1998; Huang et al., 1990; Lajtai, 1971; Petit & Barquins,1988; Shen et al., 1995; Wong & Einstein, 2009b).
While significant work has been conducted in the macroscopic observation and differentiation of tensile andshear cracks, only few studies focused on investigating these two crack types in themicroscopic scale. Opticalobservation on the microcracking behavior of tensile cracks and the “subconjugate shear belt” confirmedthat a tensile crack is featured by many grain boundary cracks while a shear belt is associated with manytransgranualr cracks (Huang et al., 1990). Sagong and Bobet (2003) have drawn insightful conclusions bymicroscopically examining tensile and shear cracks in molded gypsum specimens under SEM (scanning elec-tron microscope). Shear cracks often propagate along the crystal boundaries leading to a damage zone 5 to10 times wider than tensile cracks, which mainly propagate along and across crystal boundaries. By applyinga semiquantitative method, Wong and Einstein (2009c) reported that the microcracking zone of the wingcrack extends and broadens as the loading progressively increases. Multiple microcracking zones orientednearly parallel with the loading direction were also observed in the region between the preexisting flaw tipswhere a macroscale shear crack forms finally. However, the microscopic progressive development of a shearcrack has rarely been observed and reported. As such, the development of grain boundary cracks and trans-granular cracks involved in the tensile and shear cracks have been seldomly compared quantitatively.Although some quantitative microscopic studies have been conducted, they are mostly interested in thefaulting mechanism or microcrack nucleation mechanism instead of comparing the tensile and shear cracksin detail (DiGiovanni et al., 2007; Menéndez et al., 1996; Moore & Lockner, 1995; Tapponnier & Brace, 1976;Wong, 1982, Yang, Tian, et al., 2017). Additionally, many seismic studies have explored the correlationbetween stress regimes (tensile or strike slip) and the non-double-couple components of the seismic events(Julian et al., 1998; Kwiatek et al., 2014; Stierle et al., 2014; Vavryčuk, 2002). These studies revealed possiblecorrelations between AE (acoustic emission) events and modes of damage (compaction, shear, andcataclastic deformation) or loading conditions (Fortin et al., 2009; Stanchits et al., 2006). A few studies havealso discussed the connections between fault structures (off-fault damage) and near-fault distributions ofacoustic emissions (Goebel et al., 2014; Julian et al., 1998). All these studies definitely raise the awarenessto characterize the tensional and shear fractures in microscale.
This study investigates the development of tensile and shear fractures (cracks) in marble specimens contain-ing en echelon flaws of 30° and 90° inclination angle, respectively. After being loaded to different stress levels,the microcracking characteristics of these two configurations are examined in stages under an opticalmicroscope. Specifically, the objectives of this study are to investigate: 1) the macroscopic and microscopicdevelopment processes of tensile and shear fractures, and 2) the density and anisotropy ofmicrocracks, quantitatively.
The term “crack’, which is only used in the introduction part to be in line with those macroscopic studies inthis field, is replaced by “fracture’ in the following sections to refer to a macro scale crack. This substitutionaims to avoid possible confusion between the terms of crack and microcrack.
2. Material and Testing Procedures2.1. Material Property
The natural rock, Carrara marble is chosen for this study because it is formed of 99% calcite crystals withonly a few impurities. Marble was also used in previous studies for observation of microscopic deformation(Alber & Hauptfleisch, 1999; Fredrich et al., 1989; Li et al., 2005; Nolen-Hoeksema & Gordon, 1987; Olsson &
Journal of Geophysical Research: Solid Earth 10.1002/2017JB014581
CHENG AND WONG 205

Peng, 1976; Wong & Einstein, 2009c; Yang, Ranjith, et al., 2017). The over-all porosity of Carrara marble is very low at a value between 0.3% (Alber& Hauptfleisch, 1999) and 1.1% (Edmond & Paterson, 1972). In this study,microscopic observations have been conducted on small cylinders cutfrom an intact marble slab to reveal the inherent grain structures andbackground microcracks of Carrara marble without experiencing anyexperimental loading (Figure 1). This rock is characterized by a mutuallyinterfering growth pattern and a well-fused interlocking granoblasticpolygonal texture (Figure 1). The grain size varies from 50 to 300 μm.Careful inspections also reveal that only a few microcracks and voidsin grain boundary are present. No grains in Figure 1 show any observa-ble transgranular microcracks. Prominent sets of twin lamellae areobserved on more than half of the grains. Some twin lamellae do notcross the whole grain, while some appear segmented (Figure 1). Thepresent observations suggest that they tend to be the preferential sitesfor the nucleation of microcracks under loading.
Uniaxial compression strength and Brazilian tensile strength of this rockdried at room temperature, are obtained in this study and are measuredto be about 88.5 MPa (average value from four specimens) and 5.1 MPa
(average value from seven specimens), respectively. The Young’s modulus (49 GPa) and some other mechan-ical parameters can be found in another study conducted by Alber and Hauptfleisch (1999).
2.2. Specimen Geometry
Cuboid blocks are cut frommarble slabs in dimensions of 152mmheight, 76mmwidth, and 31–32mm thick-ness. Multiple through-specimen (in thickness) en echelon flaws are then cut by the OMAX 2626 Waterjet. Inaccordance with previous studies (Eoin, 1988; Gehle & Kutter, 2003; Nicholson & Pollard, 1985; Pollard et al.,1982), the en echelon flaw configuration is defined by three parameters: array angle (θ), flaw inclination angle(β) and ligament length (L). The array angle (θ) is the acute angle between the minimum stress axis and thearray trend; flaw inclination angle (β) is the angle between the minimum stress axis and flaw plane; ligamentlength (L) is the distance from the bottom tip of a flaw to the top tip of the neighboring flaw (Figure 2a). Toproduce localized damage zones of tensile and shear origins respectively, two flaw configurations areadopted in this study. These two configurations share the same array angle (θ = 60°) and ligament length(L = a = 6.25 mm, where 2a is the flaw length), but different flaw inclination angles (β = 30° in Figure 2b
Figure 1. Photomicrograph of Carrara marble that has not been subjected toany experimental loading (plane polarized light). The labeled features are(1) tips of twin lamellae, which do not cross the whole grain; (2) void in grainboundaries; (3) microcrack-free boundary; (4) grain boundary crack; and(5) polishing mark crossing several grains.
(b) (c) (a)
Figure 2. (a) Geometric parameters of flaw configuration: array angle (θ), flaw inclination angle (β), and ligament length (L). (b and c) Flaw configurations of β = 30°and β = 90°, respectively. In both images, the parallel thick lines indicate en echelon flaws; the shaded zones represent damage zones (microcracking zones)produced by uniaxial compression tests. Two or three cylinders (in dashed line) are cut from each prefailure specimen in both configurations, while four prisms (indashed line) are sampled in the failed specimen of configuration (Figure 2b). These small samples containing some damage zones will be used for subsequentmicroscopic observation. Loading direction is vertical.
Journal of Geophysical Research: Solid Earth 10.1002/2017JB014581
CHENG AND WONG 206

and β = 90° in Figure 2c). Previous studies have shown that en echelon flaws of β = 30° would enhance theconcentration of tensile stress and thus promote the development of tensile fractures, while en echelon flawsof β = 90° have little interaction andmay produce a throughgoing fault (Cheng et al., 2015; Hoek, 1968; Horii &Nemat-Nasser, 1985; Huang et al., 1990; Wong & Einstein, 2009b; Zhang et al., 2012). The important roleplayed by the en echelon flaws of β = 90° once was examined by some other researchers (Myers & Aydin,2004, Peng & Johnson, 1972, Weiss & Schulson, 2009).
2.3. Testing Procedures
Six steps have been followed sequentially to obtain the microscopic results for specimens containing enechelon flaws. They are (1) uniaxial loading test, (2) first epoxy coating, (3) sampling, (4) second epoxycoating, (5) polishing, and finally (6) observation under microscope (Figure 3). Following sections willintroduce them in turn.
All naturally dried cuboid specimens are loaded uniaxially at a rate of 0.05 mm/min. The uniaxial compressivestrength tests are performed in the Rock Mechanics Laboratory at the Nanyang Technological Universityusing a servo-controlled hydraulic rock compression system (Model STS-1000). The compression systemhas a maximum axial force of 4.45 MN and a frame stiffness of 5.25 × 10⁹ N/m (Wong & Maruvanchery,2016). The vertical displacement is measured by the linear voltage differential transducer and automaticallylogged by the operating system. The front face of the specimen is recorded by a Sony Camcorder (SonyHDR-XR150) and sometimes also a Phantom V310 high-speed video system (VRI-V310-16G-M). The lattercan be triggered anytime to capture the abrupt fracturing events, such as the formation of ashear rupture.
Two sets of samples are uniaxially compressed. The first set is composed of three specimens of β = 30° andfive specimens of β = 90°. The second set is composed of several additional specimens possessing the sametwo configurations. In the first set, specimens are loaded to failure to observe themacroscale fracturing beha-viors and to obtain the average peak stresses. All tested specimens of these two configurations show a goodrecurrence of damage zones, which are represented by the shaded bands in Figures 2b and 2c, respectively.In the second set, specimens are loaded to different ratios of the corresponding predetermined peak stress.Because the ratio of fracture initiation stress to peak stress in specimens of β = 30° is much lower than that in
Figure 3. Experimental work flow to obtain microscopic observation results. These steps sequentially are uniaxial compression test, first coating (only specimens ofβ = 30° shown here), sampling with the OMAX 2626 Waterjet, second coating (to obtain cylinders of a diameter close to 30.0 mm), polishing and microscopicobservation.
Journal of Geophysical Research: Solid Earth 10.1002/2017JB014581
CHENG AND WONG 207
specimens of β = 90°, different loading schemes are applied to these two configurations to capture the micro-cracking process efficiently. For β = 30°, four specimens are loaded up to 20%, 50%, 75%, and 90% of itsaverage peak stress respectively, while four specimens of β = 90° are loaded up to 84.2%, 89.4%, 92.7%,and 100% (reaching failure) of its average peak stress, respectively. Samples were unloaded once these targetstresses were reached.
Before sampling from the loaded specimens either by the OMAX 2626 Waterjet or a circular diamond saw, anepoxy-dye mixture is used to fill up the flaws and newly developed microcracks, as well as to coat the speci-men surface (Figure 3). The epoxy can strengthen the loaded specimens against the cutting force due towaterjet or saw. By adding a Solvent Yellow fluorescent dye into the epoxy, microcracks filled with the epoxywill appear light violet or violet gray (depending on the magnification) under normal light and give a shiningillumination under ultraviolet light. The coating process is performed inside a vacuum desiccator to promotethe sucking of the epoxy mixture into the microcracks and pores of the specimen. After the solidification ofepoxy, two cylinders of about 25.5 mm diameter, containing one to two bridges, are cut from each prefailurespecimen and four prisms are cut from the failed specimen of β = 90°. The initial sampling locations for eachconfiguration are shown in Figures 2b and 2c. If the polishing quality of some cylinders is not suitable formicroscopic observation, supplementary specimens will be sampled again from the correspondingcuboid specimens.
If the size or shape of specimens does not fit into the holder of the polishing machine, they can be furthercoated (the second coating in Figure 3) after cutting to have a perfect geometry for polishing. Five polishingstages ranging from grinding, coarse polishing to fine polishing are then performed before microscopicexamination. The abrasive diameters change progressively from 18 to 3 μm accordingly. The sixth stage,which cleans the specimen surface by using water as lubricant, aims to erase all possible scratches. At theend, the covering epoxy and a thin layer of rock will have been removed to produce a flat and smooth surfacesuitable for the subsequent microscopic observation.
The microobservation in the present study is conducted on the Nikon Eclipse LV100N polarizing microscope,which enables observations under both normal light and ultraviolet light (Figure 3). A digital camera (Nikon165 Digital Sight DS-U3) is mounted to the microscope port to capture images of the observed scene on alight-sensitive sensor, which are then transferred to the computer. The installed software NIS-Elements 4.1acquires the live stream of image from the camera for a live visualization of microscopic observations onthe computermonitor. The software also allows a direct measurement of length and area on specified objects.
The optical microscope is used in the present study for two reasons. First, all grains and microcracks usuallyappear dark gray and black, respectively, under the SEM observation; thus, a SEM photograph tends to beinferior to an optical photomicrograph in terms of brightness and contrast. Most of all, identification of grainboundaries becomes difficult in rocks of a well-fused interlocking texture, such as marble (Cheng, Wong, &Maruvanchery, 2016; DiGiovanni et al., 2007; Nolen-Hoeksema & Gordon, 1987; Stanchits et al., 2009;Vajdova et al., 2012; Wong & Einstein, 2009c). On the contrary, because different calcite grains will show adifferent degree of grayish color, the optical detection is favored for identifying grain boundaries and thus dis-tinguishing between grain boundary cracks and transgranular cracks. Second, as mentioned previously,Carrara marble has a grain size approximately between 50–300 μm, which is within the range of identificationof the optical microscope. Therefore, to distinguish between grain boundary cracks and transgranular cracksin marble, a better contrast can be obtained by using the optical microscope than using SEM, as similarlysuggested by some other researchers (Fredrich et al., 1989; Nolen-Hoeksema & Gordon, 1987).
3. Experimental Results3.1. Failure Tests
The experimental results show that the average peak stresses (uniaxial compressive strength) are 22.1 MPaand 79.6 MPa for configurations of β = 30° and β = 90°, respectively. The failure modes of the wholespecimens are sketched in Figures 2b and 2c, while close-up views of the linking fractures are shown inFigures 4a and 4b.
According to results introduced in a number of previous studies (Bieniawski, 1967, Horii & Nemat-Nasser,1985, Huang et al., 1990, Lajtai, 1971, Petit & Barquins, 1988, Sagong & Bobet, 2003, Shen et al., 1995), the
Journal of Geophysical Research: Solid Earth 10.1002/2017JB014581
CHENG AND WONG 208

linking fractures developed in specimens of β = 30° can be identified as tensile fractures based on thefollowing facts. First, these fractures develop in bridges where both flaws are subjected to local tensile stressconcentration. Second, these fractures show an extensional deformation, which is associated with prominentopenings (Figure 4a). Third, the interfaces of these fractures are very clean and light reflective, showing theoriginal color of the fresh marble (Figure 4c).
Similarly, linking fractures developed in specimens of β = 90° can be identified as shear fractures based on thefollowing facts. First, these fractures develop in bridges dominated by local compressive stress (Cheng et al.,2015, Hoek, 1968). Second, these fractures show minute sliding but no openings upon approaching failure,and surface spallings are common (Figure 4b). Third, interfaces of these fractures are covered by a thin sheetof pulverized white powder, without the shining luster of the original calcite crystal (Figure 4d). These threecharacteristics agree with the studies on shear fractures conducted by previous researchers (Bobet & Einstein,1998; Huang et al., 1990; Lajtai, 1971; Petit & Barquins, 1988; Sagong & Bobet, 2003; Shen et al., 1995; Wong &Einstein, 2009b).
3.2. Macroscopic Fracturing Process
The macroscopic fracturing in marble is preceded by the development of white patches (Chen et al., 1995; Liet al., 2005; Wong & Einstein, 2009b), which were proved to be microcracking zones under SEM observationconducted by Wong and Einstein (2009c). It implies that microdamage in marble usually changes its opticalproperties. In this study, the macroscopic fracturing processes in those two configurations have also beenpreceded by the development of white patches. Recordings from the camcorder and the high-speed camerasuggest that the white patch development is different in these two flaw configurations. Specifically, bridgesof extensional property (β = 30°) are characterized by the development of linear white patches, while bridgesof contractional property are characterized by the development of diffuse white patches of a wider arealextent (β = 90°). Features of these two typical white patches and their progressive evolution to visiblefractures will be described in detail below.3.2.1. Stress-Strain CurveAlthough the strain corresponding to the peak stress varies a lot among the test specimens, it can be general-ized that the stress-strain curves of β = 90° exhibit two features different from the curves of β = 30° (Figure 5).First, compared with the initial loading stage (possibly a combination of emplacement and compaction
(c) (d)
(a)
TT
(b)
S
Figure 4. (a and b) Front view shows the path of linking fractures in specimens of β = 30° and β = 90° respectively (flaw length: 12.5 mm). “T” and “S” refer to fracturesof tensile and shear origins, respectively. The plus and minus signs indicate the locations of compressive and tensile stress concentration respectively (verticalloading). (c and d) Fractures (pointed by arrows) in specimens of β = 30° and β = 90° are photographed to expose their surface topography. Photos were taken fromthe side of broken specimens so that the fractures were viewed face-on. The width of these photos equals the specimen thickness of about 31.5 mm.
Journal of Geophysical Research: Solid Earth 10.1002/2017JB014581
CHENG AND WONG 209

stages), specimens of β = 90° show a significant increase in tangential modulus after this stage, whilespecimens of β = 30° only show a moderate increase. Second, after the initial loading stage, specimens ofβ = 90° usually deform linear-elastically under loading until the peak stress, while specimens of β = 30°demonstrate inelastic behavior even at an early loading stage, which is suggested by the nonlinear stress-strain curve.
In specimens of β = 30°, considerable fracturing events were often accompanied by a sudden increase ofstrain or transition of modulus in stress-strain curves. For example, the stress-strain curves show nonlinearbehavior at an early loading stage (less than 5 MPa), which corresponds to the initiation and initial propaga-tion of white patches (Figure 6b). After that, further loading probably results in the extension and widening ofthose white patches, which renders the increase of modulus difficult. It is probably why in specimens ofβ = 30° the modulus approaching peak stress is only moderately larger than that of the initial loading stage.On the contrary, the linear elastic behavior of β = 90° after the initial suggests that the specimens of β = 90°behave similar to an intact specimen loaded uniaxially. Their deformation stages should include perfectelastic deformation, stable microcrack proliferation and linkage, and unstable fracture propagation besidesthe initial compaction stage. It is why localized microcracking zone (white patch) cannot be observed until70–80% loading of the peak stress (Figure 7b), and the modulus of linear-elastic stage is significantly largerthan that of the initial loading stage.3.2.2. Tensile Fracture (β = 30°)Developed in extensional bridges, the linear white patch is a narrow whitening zone usually of a width nomore than 0.5 mm. This zone is characterized by an observable contrast in color with the surrounding area(Figure 6). Therefore, the time of the initiation of linear white patches can be determined from camcorderrecordings reliably. Camcorder recordings suggest that linear white patches appear when the applied stressranges from 18% to 25% of the corresponding peak stress (Figure 6b). With the increase of loading up toabout 30% of the peak stress, linear white patches extend quickly from the flaw periphery and connect withthe neighboring flaw tips. After that, the white color is intensified as loading increases, but its width remainsalmost unchanged. Only about after 90% of the peak stress, fine fractures emerge from these white patchesat the flaw periphery (Figure 6d). These fine fractures widen in aperture and extend to the neighboring flaw
Figure 5. Stress-strain curves of specimens reach failure. Left: β = 30°, right: β = 90°.
(a) before loading (b) 20% peak loading (c) 50% peak loading (d) at peak loading
Figure 6. Images and sketches of the development of linear white patches with the increase of loading (β = 30°). Linear white patches and fine fractures are indicatedby arrows (flaw length: 12.5 mm).
Journal of Geophysical Research: Solid Earth 10.1002/2017JB014581
CHENG AND WONG 210
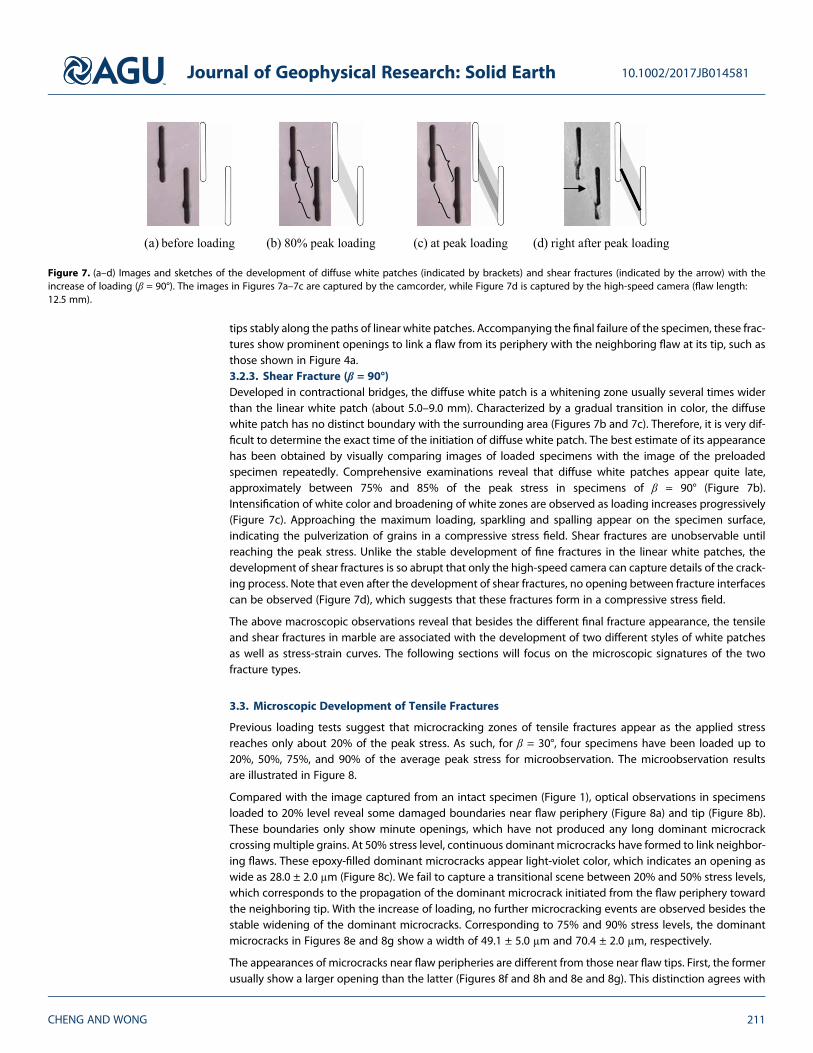
tips stably along the paths of linear white patches. Accompanying the final failure of the specimen, these frac-tures show prominent openings to link a flaw from its periphery with the neighboring flaw at its tip, such asthose shown in Figure 4a.3.2.3. Shear Fracture (β = 90°)Developed in contractional bridges, the diffuse white patch is a whitening zone usually several times widerthan the linear white patch (about 5.0–9.0 mm). Characterized by a gradual transition in color, the diffusewhite patch has no distinct boundary with the surrounding area (Figures 7b and 7c). Therefore, it is very dif-ficult to determine the exact time of the initiation of diffuse white patch. The best estimate of its appearancehas been obtained by visually comparing images of loaded specimens with the image of the preloadedspecimen repeatedly. Comprehensive examinations reveal that diffuse white patches appear quite late,approximately between 75% and 85% of the peak stress in specimens of β = 90° (Figure 7b).Intensification of white color and broadening of white zones are observed as loading increases progressively(Figure 7c). Approaching the maximum loading, sparkling and spalling appear on the specimen surface,indicating the pulverization of grains in a compressive stress field. Shear fractures are unobservable untilreaching the peak stress. Unlike the stable development of fine fractures in the linear white patches, thedevelopment of shear fractures is so abrupt that only the high-speed camera can capture details of the crack-ing process. Note that even after the development of shear fractures, no opening between fracture interfacescan be observed (Figure 7d), which suggests that these fractures form in a compressive stress field.
The above macroscopic observations reveal that besides the different final fracture appearance, the tensileand shear fractures in marble are associated with the development of two different styles of white patchesas well as stress-strain curves. The following sections will focus on the microscopic signatures of the twofracture types.
3.3. Microscopic Development of Tensile Fractures
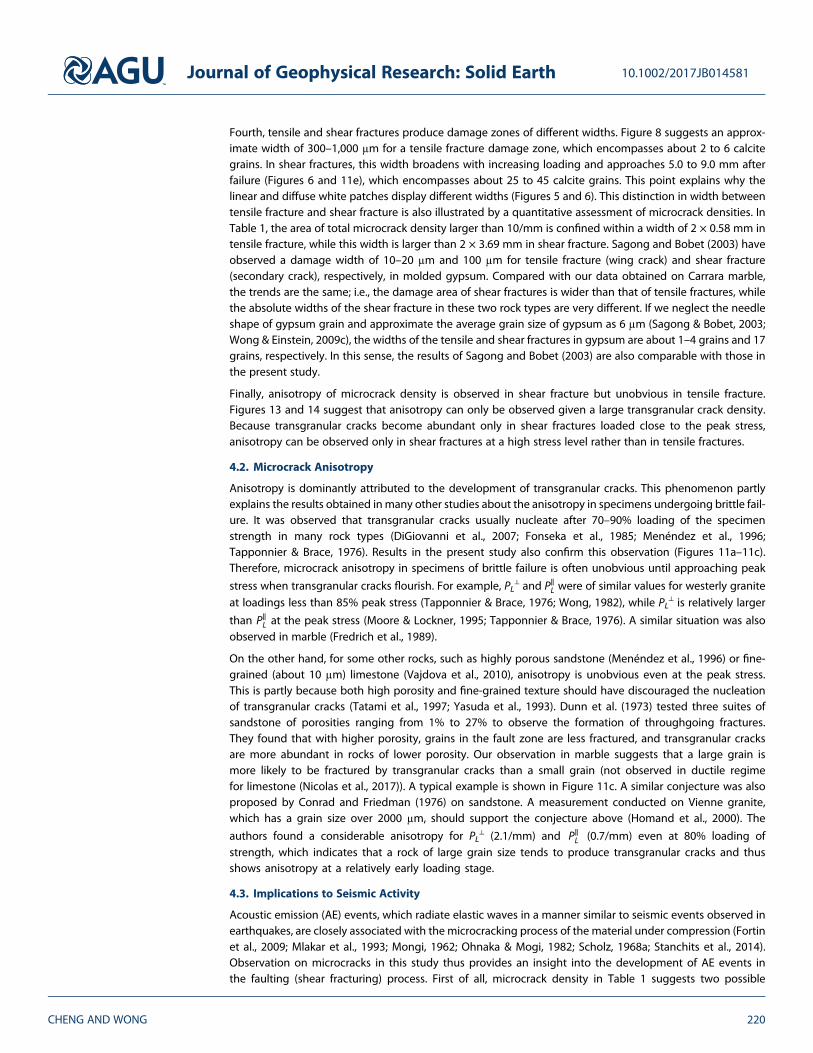
Previous loading tests suggest that microcracking zones of tensile fractures appear as the applied stressreaches only about 20% of the peak stress. As such, for β = 30°, four specimens have been loaded up to20%, 50%, 75%, and 90% of the average peak stress for microobservation. The microobservation resultsare illustrated in Figure 8.
Compared with the image captured from an intact specimen (Figure 1), optical observations in specimensloaded to 20% level reveal some damaged boundaries near flaw periphery (Figure 8a) and tip (Figure 8b).These boundaries only show minute openings, which have not produced any long dominant microcrackcrossing multiple grains. At 50% stress level, continuous dominant microcracks have formed to link neighbor-ing flaws. These epoxy-filled dominant microcracks appear light-violet color, which indicates an opening aswide as 28.0 ± 2.0 μm (Figure 8c). We fail to capture a transitional scene between 20% and 50% stress levels,which corresponds to the propagation of the dominant microcrack initiated from the flaw periphery towardthe neighboring tip. With the increase of loading, no further microcracking events are observed besides thestable widening of the dominant microcracks. Corresponding to 75% and 90% stress levels, the dominantmicrocracks in Figures 8e and 8g show a width of 49.1 ± 5.0 μm and 70.4 ± 2.0 μm, respectively.
The appearances of microcracks near flaw peripheries are different from those near flaw tips. First, the formerusually show a larger opening than the latter (Figures 8f and 8h and 8e and 8g). This distinction agrees with
(a) before loading (b) 80% peak loading (c) at peak loading (d) right after peak loading
Figure 7. (a–d) Images and sketches of the development of diffuse white patches (indicated by brackets) and shear fractures (indicated by the arrow) with theincrease of loading (β = 90°). The images in Figures 7a–7c are captured by the camcorder, while Figure 7d is captured by the high-speed camera (flaw length:12.5 mm).
Journal of Geophysical Research: Solid Earth 10.1002/2017JB014581
CHENG AND WONG 211

the macroobservation that tensile fractures first appear at the flaw peripheries and then propagate towardthe neighboring flaw tips. Second, some observations reveal distributed damage zones around flaw tipswhere grain boundaries have cracked evenly and without preferred orientation (Figure 8d), while one or a
Figure 8. Development of microcracks in white patches of tensile fractures (β = 30°). The small black square in each white disk indicates the approximate location ofeach image, which suggests that all images in left column are captured at flaw peripheries while the right column are captured at flaw tips. (a–d) The loading directionis vertical, while (e–h) it is indicated by a pair of black arrows in top-right corner. Observable transgranular cracks in all images are labeled by “T’, 20% stress level(Figures 8a and 8b): Some grain boundaries show a light degree of damage, 50% stress level (Figures 8c and 8d): Continuous dominant microcracks have beenobserved, while besides the dominantmicrocrack in Figure 8d, evenly distributed grain boundary cracks are found near the flaw tip, 75% stress level (Figures 8e and 8f):Some parallel branches developed from the main microcrack prefer a nearly horizontal orientation in Figure 8e, while a narrow dominant microcrack propagatesinto flaw tip in Figure 8f, 90% stress level (Figures 8g and 8h): The dominant microcrack near flaw periphery shows an opening much wider than that near flaw tip.
Journal of Geophysical Research: Solid Earth 10.1002/2017JB014581
CHENG AND WONG 212

few parallel dominant microcracks develop along certain preferred orientations near flaw peripheries(Figures 8c, 8e, and 8g).
Figure 8 reveals that within the damage zone of a tensile fracture, usually one or a few dominant microcracksof an opening about tens of microns will have developed. These dominant microcracks mainly consist ofgrain boundary cracks with a preferred orientation. They are flanked by other grain boundary cracks of min-ute openings (usually around 1 μm) distributed within 1 to 3 grains away from them. Microobservations oftensile fractures suggest that the damage zones are approximately 300 to 1,000 μm wide. Outside this zone,almost all grain boundaries seem to be tightly interlocked. Transgranular cracks have been found occasion-ally in all loading stages and labeled with “T” in Figure 8. Nonetheless, no evidence indicates that their occur-rence increases as the increase of loading.
3.4. Microscopic Development of Shear Fractures
Loading tests show that microcracking zones of shear fractures appear as the applied stress is approximatelyover 75% of the peak stress. As such, for β = 90°, four specimens have been loaded up to 84.2%, 89.4%, 92.7%,and 100% (reaching failure) of the average peak stress for microobservation.
The primary microscopic feature of shear fractures is that the number of spalling grains and the opening ofmicrocracks increase with the increase of loading. In Figure 9, the spalling grains and microcracks of largeopening (of a width exceeding about 5 μm) are identified as epoxy patches, which are highlighted by greencolor manually. Most microcracks of small openings are thus ignored here. At stages of 82.4% and 89.4%stress levels, green patches still distribute evenly in bridges. After being subjected to 92.7% stress level, loca-lized green patches form an inclined belt crossing the whole bridge. This belt is about 1.5 mm–3.0 mm wideand oriented about 25° with the vertical loading direction (Figure 9d). At this time, besides many spallinggrains, the openings of some vertical microcracks are large enough to be highlighted by green color, whichproduces a corresponding ratio as large as 5.7%. On the other hand, Figure 9 shows that even at 92.7% stresslevel, the epoxy patches are mostly scattered without forming a continuous long microcrack, whichcommonly characterizes the damage zone of a tensile fracture in Figure 8.
Figure 9. Development of areas of epoxy (in green color) in bridges of shear fractures (β = 90°, vertical loading). (a) In intact specimens, the green area occupiesbetween 0.1% and 0.5% of the whole area. (b) The distributed green area occupies about 1.6% of the whole area after 82.4% loading. Note that most of thegreen area develops along grain boundaries. (c) At 89.4% loading, the green area occupies 2.8% of the whole area. Besides grain boundaries, some grains also showgreen color due to grain detachment (spalling). (d) Subjected to 92.7% loading, more broken grains and vertical microcracks have been filled with epoxy. The greenarea forms an inclined belt about 25° with the loading direction, which occupies 5.7% of the whole area. A zoom-in view of the rectangular area in Figure 9d isshown in Figure 10. The rectangles in three sketches indicate the locations of images in Figures 9b–9d, respectively.
Journal of Geophysical Research: Solid Earth 10.1002/2017JB014581
CHENG AND WONG 213

Second, the damage zone of a shear fracture consists of numerousevenly distributed grain boundary cracks and transgranular cracks.Before failure, no dominant continuous microcrack has beenobserved. An overall view of the central damage zone at 92.7% stresslevel is shown in Figure 10. Nearly all grain boundaries in this imagehave cracked, and these grain boundary cracks have a similar openingapproximately between 1 μm and 3 μm. Over half of the grains in thecentral part of damage zone (between the dashed lines in Figure 10)have been fragmented by transgranular cracks, which now haveopenings comparable to those of grain boundary cracks. Unlike ran-domly oriented grain boundary cracks, the observed transgranularcracks tend to orient subparallel with the loading direction, and theyare concentrated in the central part of damage zone. These twofeatures, i.e., anisotropy and abrupt change of the microcrack densityof transgranular cracks, will be quantitatively analyzed in the nextsection. However, regardless of the kind of microcracks, all of themseem to have developed discretely in the observed plane; almostnone of them have been connected to form a long continuous micro-crack of a large opening which is typical in the damage zone of atensile fracture (Figure 8). Resulting from opening of microcracksand grain detachment, epoxy patches are also evenly distributed inthe damage zone (Figure 10).
The third feature of the development of shear fractures is that trans-granular cracks become increasingly populated as loading increases. After 82.4% loading, nearly all grainboundaries in the damage zone have been cracked, while short transgranular cracks have been observedoccasionally (Figure 11a). Observations on specimens loaded to 89.4% level show little change in the openingof microcracks, while the number of transgranular cracks has increased in a modest manner (Figure 11b).After being subjected to 92.7% loading, all grain boundaries in the damage zone have cracked, and thenumber of transgranular cracks has increased significantly. The opening of microcracks, which has experi-enced an observable increase, is about 1–2 μm now (Figures 11c and 11d). Epoxy patches, which have filledthe opening of microcracks and fragmentation of grains, thus become popular at this time. However, obser-vations on the edge of a shear fracture reveal that epoxy patches have been found much fewer after failure(Figure 11e). It is probably because epoxy patches (spalling grains) are usually located in the central part ofdamage zone where the shear fracture finally develops. After failure, spalling grains and densely fragmentedgrains within the shear fracture will have detached from the specimen, which is suggested by a pile of whitepowder left by the failed specimens on the loading machine. If this inference holds, the final width of theshear fracture should be about 1.0–1.5 mm, which is the approximate width of the central damage zone(Figure 10). Taking the width of Figure 11e into consideration, the total width of damage area associated withshear fracture should exceed 5.0 mm after failure, which is comparable with the width of diffuse white patchobtained from macroscopic observation (Figure 6). Compared with Figures 11c and 11d, the most significantchange revealed in Figure 11e is the considerable increase in openings of both grain boundary cracks andtransgranular cracks, which usually range from 3 μm to 7 μm after failure, while some grain boundary cracksshow an opening as wide as 15 μm. This should be attributed to the release of compression due to thepresence of shear fracture.
Images in Figure 11 show the development of the cataclastic process zone. They indicate that a shear fractureappears only after many grains are fractured by microscopic extensional fractures. This phenomenon hasbeen reported in sandstone and other porous rock types (Dunn et al., 1973; Menéndez et al., 1996; Petit &Barquins, 1988; Sagong & Bobet, 2003; Zhu et al., 2011) and suggested by AE characteristics in some crystal-line rocks (Lei et al., 2000; Stanchits et al., 2006).
3.5. Microcrack Density
The length of microcrack was once used as a key parameter to characterize the microcrack density. Followingstudies suggested that such a length determination is to a certain extent subjective, since whether a long
Figure 10. An overall view of the microstructures in the damage zone of a shearfracture: grain boundary crack (G), transgranular crack (T), and epoxy patch (E)(92.7% stress level, vertical loading). Only one of each microstructure is indicatedas an example. A close-up view of the outlined rectangular area is shown inFigure 11d. The zone bounded by the two dashed lines is defined as the centralpart of damage zone. The black rectangle in the bottom-right disk indicates theapproximate location of this image. The abundance of epoxy patches may bepartly attributed to the fact that the observation was conducted on the freesurface.
Journal of Geophysical Research: Solid Earth 10.1002/2017JB014581
CHENG AND WONG 214

zig-zag microcrack should be identified as a single microcrack or an assembly of short microcracks issubjected to the researcher’s judgment (Bristow, 1960; Hadley, 1976; Homand et al., 2000; Moore &Lockner, 1995). This method also fails to reveal the anisotropy of induced microcracks. The stereologicalapproach has later been adopted as an alternative for microcrack density characterization (DiGiovanniet al., 2007; Fredrich et al., 1989; Kranz, 1979; Menéndez et al., 1996; Tapponnier & Brace, 1976; Wong,
Figure 11. Development of transgranular cracks with the increase of vertical loading (β = 90°). (a) Only a few transgranular cracks are observed at 82.4% stress level.About half of the grain boundaries have totally cracked, and some others are partially cracked. All of them have minute openings of less than 1 μm. (b) At 89.4%level, some more transgranular cracks have appeared, while the opening of microcracks show little change. (c and d) Being subjected to 92.7% stress level, almost allgrain boundaries in these two images have cracked. Some grains have been fragmented by multiple vertical microcracks, such as those outlined grains.Microcracks have shown an observable increase in opening. (e) After failure, the trace of a shear fracture has been identified by the epoxy infilling. Grain boundarycracks and transgranular cracks are not only abundant but also of large openings which are about 3–15 μm. The total width of this image is 2133 μm. Epoxypatches have become much fewer. Note that the scale in Figure 11e is different from other images.
Journal of Geophysical Research: Solid Earth 10.1002/2017JB014581
CHENG AND WONG 215

1982; Wu et al., 2000). In this method, microcrack density PL is expressed as the mean number of microcrackintersections for test lines of unit length:
PL ¼ Ntot=Ltot (1)
where Ntot is the total number of intersections and Ltot is the total length of test lines. By aligning the test linesin parallel and perpendicular to the σ1 (principal compressive stress) direction, microcrack densities in twoorthogonal directions can be measured as P‖L and PL
⊥accordingly to examine the anisotropy.
Additionally, for axisymmetrically deformed specimens, the total microcrack surface area per unit volume, SV,
can also be determined by P‖L and PL⊥ (Underwood, 1970; Wong, 1985):
SV ¼ π=2�PL⊥ þ 2� π=2ð Þ�P∥L (2)
Two series of measurement have been implemented in the present study by adopting the stereologicalapproach. The first series examines the microcrack density variation with respect to different stress levelsfor both linear and diffuse white patches. For each stress level, measurements are performed on three imagesin different locations to obtain an average value (Figures 12a and 12c). Thus, nine images are chosen from thelinear white patches (50%, 75%, and 90% loading) and also nine images from the diffuse white patches(84.2%, 89.4%, and 92.7% loading). Each image is 871.4 μm in width and 652.6 μm in height. According toprevious studies (Fredrich et al., 1989; Menéndez et al., 1996; Moore & Lockner, 1995; Tapponnier & Brace,1976; Vajdova et al., 2010), especially for a localized damage zone, the measuring area is acceptable forobtaining reliable microcrack densities. The second series examines the variation of microcrack density withthe distance away from the core of damage zones. Thus, the microcrack densities are measured in imagesperpendicular to the long axis of the white patch (Figures 12b and 12d). Each image in the second series isslightly smaller, which is 578.7 μm in width and 829.6–870.2 μm in height. Measurements in the second seriesare conducted on three sets of specimens: specimen containing linear white patches loaded up to 90% stresslevel, specimen containing diffuse white patches loaded up to 92.7% stress level, and specimen alreadyexperienced shear failure. Additionally, the microcrack density in Figure 1 has been measured as the back-ground value. All the measurements are conducted along test lines at a spacing of 25 μm in two orthogonaldirections across the whole image. The intersections of grain boundary crack and transgranular crack arerecorded separately.
The stereological microcrack density data are listed in Table 1. Intact sample possesses a neglectable micro-crack density, which is in accordance with the observation of Figure 1. Some of the other data are plotted inFigures 13 and 14 for a more intuitive visualization. In the damage zones of tensile fractures, the microcrackdensity seems not to increase with the increase of loading, and the degree of anisotropy is insignificant in the
two directions: parallel (P‖L) and perpendicular (PL⊥) to the σ1 direction (Table 1 and Figure 13a). These two
generalizations are applicable to both grain boundary crack and transgranular crack. However, the total
Figure 12. Approximate locations of the images (black rectangles) chosen for microcrack density measurement. (a and c) Three images located in the center and twoends of the corresponding white patch are measured (the first series). (b and d) Images aligned perpendicular to the corresponding white patch are measured(the second series). According to some published results (Figures 4 and 5 in Moore & Lockner, 1995, and Figure 7 in Vermilye & Scholz, 1998) and observations in thisstudy, the damage zones are assumed to be approximately symmetrical. The second series is hereby conducted only at one side of the white patches. In thesecond series, besides these continuous images, one more image at a distance of about 12.0 mm from the core of damage zone is measured. See Table 1 for thenumber and locations of images measured.
Journal of Geophysical Research: Solid Earth 10.1002/2017JB014581
CHENG AND WONG 216

densities of grain boundary crack are about 9.0/mm, which is much higher than the total density oftransgranular crack. This result agrees well with those observations illustrated in section 3.3. Additionally, itis worthwhile to note that measurements have only been conducted on specimens subjected to stresslevels no less than 50% when continuous dominant microcracks have formed already (Figures 8c and 8d).There should be a transitional stage before 50% stress level that the microcrack density increases with theloading.
In the damage zones of shear fractures, the densities of grain boundary crack show neither increasing trendnor anisotropy trend with the increase of loading (Table 1 and Figure 13b). The total densities of grain bound-ary crack are about 11.0/mm, which are comparable to that in the damage zones of tensile fracture. On thecontrary, the densities of transgranular crack show both increasing and anisotropy trends with the increase ofloading (Figure 13b). The total microcrack density of transgranular crack jumps from 1.0/mm up to 10.5/mmwhen loading increases from 82.4% to 92.7% at which level transgranular crack density measured perpendi-
cular to the σ1 direction (PL⊥) is over two times of that measured parallel to the σ1 direction (P‖L) (Table 1). This
microcracking behavior is different from that of tensile fractures significantly.
Continuous measurements perpendicular to the damage zones support the conclusion that anisotropy isunobvious for grain boundary cracks throughout the damage zones (Figure 14a). However, the grain bound-ary crack density of tensile fracture at 90% stress level falls down sharply with the increase of distance fromthe damage zone center, while this value decreases slightly in shear fracture of 92.7% stress level and remainsnearly constant in shear fracture after failure. It indicates that grain boundaries in the damage zone of a shear
Table 1Stereological Microcrack Density Dataa
Specimen type Db(mm)
PL⊥ (/mm) P‖L (/mm)
SV (mm2/mm3)
Total (/mm)
BCc TCc Total BCc TCc Total BCc TCc
Intact / / / / / / / / 0.4 0.0Tensile fractured 50% 0.00 5.0 0.9 5.9 3.9 1.0 4.9 12.1 8.9 1.9
75% 0.00 3.4 0.2 3.6 3.3 0.3 3.6 7.7 6.7 0.590% 0.00 5.6 0.3 5.9 5.7 0.3 6.0 12.7 11.3 0.6
Shear fracture 82.4% 0.00 5.1 0.6 5.7 5.6 0.4 6.0 12.4 10.7 1.089.4% 0.00 4.7 1.7 6.4 4.4 0.6 5.0 12.9 9.1 2.392.7% 0.00 6.4 7.2 13.6 6.4 3.3 9.7 26.9 12.8 10.5
Tensile fracture (90% of failure load) 0.00 5.9 0.1 6.0 5.0 0.1 5.1 12.3 10.9 0.20.58 3.4 0.1 3.5 3.2 0.1 3.3 7.4 6.6 0.21.16 3.2 0.0 3.2 2.7 0.0 2.7 6.6 5.9 0.01.74 1.0 0.0 1.0 1.7 0.0 1.7 2.5 2.7 0.0
15.00 0.7 0.0 0.7 0.5 0.0 0.5 1.4 1.2 0.0Shear fracture (92.7% of the failure load) 0.00 6.0 7.5 13.5 7.9 4.2 12.1 28.1 13.9 11.7
0.58 5.0 1.1 6.1 4.3 0.9 5.2 12.5 9.3 2.01.16 4.9 0.9 5.8 3.6 0.7 4.3 11.6 8.5 1.61.74 4.4 0.7 5.1 3.4 0.7 4.1 10.4 7.8 1.42.32 5.0 0.3 5.3 3.4 0.4 3.8 10.5 8.4 0.7
12.00 1.1 0.1 1.2 1.9 0.0 1.9 3.0 3.0 0.1Shear fracture (after failure) 0.74e 7.3 6.7 14.0 7.2 2.7 9.9 27.6 14.5 9.4
1.37e 6.8 4.9 11.7 7.5 1.8 9.3 23.7 14.3 6.71.95e 5.6 4.2 9.8 6.9 2.3 9.2 20.6 12.5 6.52.53e 6.6 1.4 8.0 6.9 0.9 7.8 17.0 13.5 2.33.11e 4.7 1.0 5.7 5.7 0.9 6.6 12.7 10.4 1.93.69e 6.4 0.6 7.0 6.0 0.5 6.5 14.7 12.4 1.1
13.50e 1.1 0.1 1.2 1.2 0.1 1.3 2.6 2.3 0.2
Note. The first row “Intact” indicates the background microcrack density. The subsequent two rows of “Tensile fracture” and “Shear fracture” determine the micro-crack density in the central damage zone (D = 0mm) with respect to different stress levels. The bottom three rows summarize the microcrack density with respectto the distance away from the core of damage zones (D as the variable).aThe microcrack density is measured on the polished free surface of specimen. The possible variation of density with thickness has not been considered. bD isthe distance between the center of the measured image and the center of damage zone. cBC = grain boundary crack; TC = transgranular crack. dMeasurementis not performed on specimens subjected to 20% stress level since the damage zone is unobvious. eAccording to the analysis in section 3.4, the shear fracture isapproximately 1.0 mm wide. The first image captured at the edge of the shear fracture is 578.7 μm wide; thus, the center of the image is about (0.24 + 0.5) mmfrom the center of the shear fracture. Calculations for the other data of distance are the same.
Journal of Geophysical Research: Solid Earth 10.1002/2017JB014581
CHENG AND WONG 217

fracture are damaged over a wider area with a more severe degree than those in the damage zones of atensile fracture.
The data of transgranular cracks shows a different situation. With the increase of distance from the damagezone center, the transgranular crack density of tensile fracture of 90% stress level remains at a very low value;however, this value falls down sharply in shear fracture of 92.7% stress level and decreases progressively inshear fracture after failure (Figure 14b). In shear fracture of 92.7% stress level, the area of a high transgranularcrack density is confined within a range about half of a millimeter from the damage zone center, while thisrange expands to over 3.0 mm in specimen after failure (Figure 14b). This condition suggests that after92.7% loading, transgranular cracks continue to proliferate to produce a wider andmore severe damage zonewhere a shear fracture finally forms in the central part. Furthermore, Figure 14b also indicates that anisotropyis only obvious in areas of a high transgranular crack density. When transgranular crack becomes rare, aniso-tropy becomes unobvious.
Additionally, in the damage zone of a shear fracture, the transgranular crack density decreases logarithmi-cally with the distance away from the shear fracture center (Figure 15). This result agrees well with manyfield investigations of the relationships between the density of microfractures near faults and the distancefrom faults surface (Anders & Wiltschko, 1994; Mizoguchi & Ueta, 2013; Vermilye & Scholz, 1998). Also,Figure 15 shows that when comparing with the failed sample, the 92.7% loaded sample has a narrowerdamage zone and a steeper decrease in transgranular crack density with distance away from the shearfracture center. This situation is qualitatively consistent with the field and laboratory examinations ongranitic rocks in which a narrower damage zone and a steeper decrease in microcrack density were
Figure 13. Microcrack densities (P‖L and PL⊥) at different stress levels (percentage of failure load) of (a) tensile fracture and (b) shear fracture. In both plots, grain
boundary crack (BC) and transgranular crack (TC) are represented by square and triangle symbols respectively.
Figure 14. Microcrack densities (P‖L and PL⊥) with respect to distance from the core of damage zones of tensile fracture of 90% stress level (triangle, solid line), shear
fracture of 92.7% stress level (circle, dashed line), and shear fracture after failure (square, dashed line). (a) Grain boundary crack density. (b) Transgranular crackdensity.
Journal of Geophysical Research: Solid Earth 10.1002/2017JB014581
CHENG AND WONG 218

reported with decreasing fault displacement (Mitchell & Faulkner, 2012).In these investigations, the microcrack density was of the same defini-tion as in the present study, i.e., the total number of intersections perunit length of testing line. However, few other experimental observa-tions provide similar results. A supporting observation was reported byMoore and Lockner (1995) in granite by defining the microcrack densityas the total microcrack length in unit area. Nonetheless, they did notemphasize the different trend of decay of grain boundary cracks andtransgranular cracks with distance. In the present study, by countingdensities of grain boundary crack and transgranular crack separately, itseems that it is transgranular crack rather than grain boundary crackdecreasing logarithmically with the distance away from the shear frac-ture center (Figures 14 and 15).
4. Discussion4.1. Distinctions of Microscopic Characteristics of Tensile andShear Fractures
Microscopic observations in the last section suggest that tensile and shearfractures have distinctly different microscopic characteristics. First, they have different development pro-cesses. The tensile fracture initiates as extensional microcracks at locations of tensile stress concentration,which then extend and widen as long dominant microcracks with wedge tip(s). Finally, these dominantmicrocracks develop into a tensile fracture. Although this process has not been captured continuously inthe present microscopic observation, it can be inferred from the continuous camcorder recordings(Figure 5) and microscopic observation in later stages of loading (Figure 8). This inference is also supportedby some other microscopic studies on tensile fractures (Wong & Einstein, 2009c; Zhao et al., 1995). On thecontrary, the shear fracture initially appears as a damage zone containing abundant microcracks(Figures 6b and 11a). Then transgranular cracks nucleate to fragment mineral grains into small pieceswith increasing loading, which is a critical stage for the development of a shear fracture in marble(Figures 11b–11d). Finally, a shear fracture, consisting of fragmented grains, transgranular cracks as well asgrain boundary cracks, can be observed at an orientation of about 25° to those transgranular cracks whichare subparallel with the loading direction (Figures 6d and 10). According to previous studies, a range of10–30° is reported for the angle between the shear fracture and principal compression direction (Conrad &Friedman, 1976, Friedman et al., 1970, Menéndez et al., 1996, Moore & Lockner, 1995, Zhu et al., 2011), whichagrees with the result obtained in this study.
Second, different microcrack types are involved in tensile and shear fractures. Tensile fracture is mainlycomposed of grain boundary cracks. Though a few transgranular cracks can be observed in the tensile frac-ture occasionally, their appearance shows little correlation with stress level (Figure 8). Different from tensilefractures, grain boundary cracks and transgranular cracks play the same important roles in the developmentof shear fractures (Figure 11). Specifically, transgranular cracks become increasingly popular as loadingincreases. Upon approaching the peak stress, the transgranular crack density is comparable with the grainboundary crack density (Figures 11c–11e). The above generalizations can also be drawn from Table 1 andFigure 13. Additionally, grain-scale surface spalling is also commonly observed in shear fractures. It showsa trend similar to that of transgranular cracks, i.e., the area of surface spalling increases as the loadingincreases (Figure 9).
Third, microcracks in tensile and shear fractures have different appearances. In tensile fractures, one or multi-ple long dominant microcracks of certain orientation often show a large extensional deformation of tens ofmicrons. These dominant microcracks are usually flanked by microcracks of much smaller openings(Figure 8). It is why the linear white patch has an identifiable boundary with surrounding area (Figure 5). Inshear fractures, however, long dominant microcracks are not observed before failure. Microcracks distributeuniformly within the damage zone, and they are generally of a length comparable to grain size. They arecharacterized by small openings of around only 1 μm before failure (Figures 10 and 11). It is why the diffusewhite patch has an unclear boundary with surrounding area (Figure 6).
Figure 15. Transgranular crack densities with respect to distance from thecenter of damage zones of tensile fracture of 90% stress level (square),shear fracture of 92.7% stress level (disk), and shear fracture after failure(triangle).
Journal of Geophysical Research: Solid Earth 10.1002/2017JB014581
CHENG AND WONG 219
Fourth, tensile and shear fractures produce damage zones of different widths. Figure 8 suggests an approx-imate width of 300–1,000 μm for a tensile fracture damage zone, which encompasses about 2 to 6 calcitegrains. In shear fractures, this width broadens with increasing loading and approaches 5.0 to 9.0 mm afterfailure (Figures 6 and 11e), which encompasses about 25 to 45 calcite grains. This point explains why thelinear and diffuse white patches display different widths (Figures 5 and 6). This distinction in width betweentensile fracture and shear fracture is also illustrated by a quantitative assessment of microcrack densities. InTable 1, the area of total microcrack density larger than 10/mm is confined within a width of 2 × 0.58 mm intensile fracture, while this width is larger than 2 × 3.69 mm in shear fracture. Sagong and Bobet (2003) haveobserved a damage width of 10–20 μm and 100 μm for tensile fracture (wing crack) and shear fracture(secondary crack), respectively, in molded gypsum. Compared with our data obtained on Carrara marble,the trends are the same; i.e., the damage area of shear fractures is wider than that of tensile fractures, whilethe absolute widths of the shear fracture in these two rock types are very different. If we neglect the needleshape of gypsum grain and approximate the average grain size of gypsum as 6 μm (Sagong & Bobet, 2003;Wong & Einstein, 2009c), the widths of the tensile and shear fractures in gypsum are about 1–4 grains and 17grains, respectively. In this sense, the results of Sagong and Bobet (2003) are also comparable with those inthe present study.
Finally, anisotropy of microcrack density is observed in shear fracture but unobvious in tensile fracture.Figures 13 and 14 suggest that anisotropy can only be observed given a large transgranular crack density.Because transgranular cracks become abundant only in shear fractures loaded close to the peak stress,anisotropy can be observed only in shear fractures at a high stress level rather than in tensile fractures.
4.2. Microcrack Anisotropy
Anisotropy is dominantly attributed to the development of transgranular cracks. This phenomenon partlyexplains the results obtained inmany other studies about the anisotropy in specimens undergoing brittle fail-ure. It was observed that transgranular cracks usually nucleate after 70–90% loading of the specimenstrength in many rock types (DiGiovanni et al., 2007; Fonseka et al., 1985; Menéndez et al., 1996;Tapponnier & Brace, 1976). Results in the present study also confirm this observation (Figures 11a–11c).Therefore, microcrack anisotropy in specimens of brittle failure is often unobvious until approaching peak
stress when transgranular cracks flourish. For example, PL⊥ and P‖L were of similar values for westerly granite
at loadings less than 85% peak stress (Tapponnier & Brace, 1976; Wong, 1982), while PL⊥ is relatively larger
than P‖L at the peak stress (Moore & Lockner, 1995; Tapponnier & Brace, 1976). A similar situation was alsoobserved in marble (Fredrich et al., 1989).
On the other hand, for some other rocks, such as highly porous sandstone (Menéndez et al., 1996) or fine-grained (about 10 μm) limestone (Vajdova et al., 2010), anisotropy is unobvious even at the peak stress.This is partly because both high porosity and fine-grained texture should have discouraged the nucleationof transgranular cracks (Tatami et al., 1997; Yasuda et al., 1993). Dunn et al. (1973) tested three suites ofsandstone of porosities ranging from 1% to 27% to observe the formation of throughgoing fractures.They found that with higher porosity, grains in the fault zone are less fractured, and transgranular cracksare more abundant in rocks of lower porosity. Our observation in marble suggests that a large grain ismore likely to be fractured by transgranular cracks than a small grain (not observed in ductile regimefor limestone (Nicolas et al., 2017)). A typical example is shown in Figure 11c. A similar conjecture was alsoproposed by Conrad and Friedman (1976) on sandstone. A measurement conducted on Vienne granite,which has a grain size over 2000 μm, should support the conjecture above (Homand et al., 2000). The
authors found a considerable anisotropy for PL⊥ (2.1/mm) and P‖L (0.7/mm) even at 80% loading of
strength, which indicates that a rock of large grain size tends to produce transgranular cracks and thusshows anisotropy at a relatively early loading stage.
4.3. Implications to Seismic Activity
Acoustic emission (AE) events, which radiate elastic waves in a manner similar to seismic events observed inearthquakes, are closely associated with the microcracking process of the material under compression (Fortinet al., 2009; Mlakar et al., 1993; Mongi, 1962; Ohnaka & Mogi, 1982; Scholz, 1968a; Stanchits et al., 2014).Observation on microcracks in this study thus provides an insight into the development of AE events inthe faulting (shear fracturing) process. First of all, microcrack density in Table 1 suggests two possible
Journal of Geophysical Research: Solid Earth 10.1002/2017JB014581
CHENG AND WONG 220

distinctions of AE events in shear fracturing compared to tensile fracturing. A shear fracturing first exhibits alarger total microcrack density and a wider damage zone than a tensile fracturing. Logically, the former willbe accompanied by more seismic events. Meanwhile, as compared with tensile fracturing, a shear fracturinginvolves much more transgranular cracks. As a result, more energy should be released in the former since theenergy release rate of transgranular crack is usually several times of that of grain boundary crack (Abdollahi &Arias, 2012; Alber & Hauptfleisch, 1999; Tatami et al., 1997; Yasuda et al., 1993). Under comparable conditions(rupture length, fluid pressure, temperature, etc.), a faulting rupture would produce events of larger magni-tudes than a tensional rupture. These conditions may not be comparable for only a pair of tensile and shearfractures, but they could be statistically comparable for a large number of events either from an earthquakesequence or a laboratory faulting process. It is probably why some nearly pure shear aftershocks (with insig-nificant non-double-couple components) exhibit a larger magnitude than some other tensional aftershocks(with substantial positive non-double-couple components) in the 1999 Izmit earthquake (Stierle et al., 2014).Analyses on some other seismic events have shown similar relation between components and magnitude ofevents (Ito et al., 2004; Kumar et al., 2015). Some laboratory studies also have reported larger magnitudes forAE events of shear source as compared with those events of tensile source (Graham et al., 2010; Kwiatek et al.,2014). Therefore, because of the distinctions about the number and magnitude of events discussed above, itis likely that tensile events cannot be detected using standard seismic networks and what we observe istypically dominated by shear motions in the instant of faulting or sliding (Stanchits et al., 2011).
Furthermore, the microcrack density analysis as summarized in Table 1 reveals that during the preliminaryfaulting stage (about 70%–90% of the failure load), the number of microcracking events is moderate, whichcontribute to a moderate number of AE events. Also, microcracks at this period are mainly grain boundarycracks (Figures 13a and 13b) of a small energy release rate, the corresponding AE events thus tend to exhibitsmall magnitudes. When approaching the formation of a throughgoing fault (above 90% of the failure load),transgranular cracks of a large energy release rate flourish, which should raise the average magnitude of thenew bloomed AE events significantly. Together with the flourish of transgranular cracks, the broadeninggouge (densely microcracked zone) due to increasing loading (Figure 14) brings a conspicuous increase onthe total microcracking events. This phenomenon should result in an abrupt increase of AE events. Despitethe difference in setup for different research focuses, the above inference agrees with experimental observa-tions on the development of AE event with respect to its number (Fonseka et al., 1985; Fortin et al., 2009;Kwiatek et al., 2014) andmagnitude (Kwiatek et al., 2014; Ohnaka &Mogi, 1982). Similar tendency of AE devel-opment was also observed in stick-slip experiments, whereas the specific appearance is influenced by thefriction of slip surface (Goebel et al., 2013; Kwiatek et al., 2014; Passelégue et al., 2017) as well as slip rate(Passelègue et al., 2016).
Such an increase of the components of large magnitudes with loading has been expressed as the noticeabledecrease of b values with stress in the Gutenberg and Richter relation (Goebel et al., 2013; Lockner et al., 1991;Scholz, 1968b). Some studies have attributed this phenomenon to the possible appearance of large cracks. Itseems more accurate to associate this phenomenon with the rapid development of transgranular cracksaccording to observations on Carrara marble in this study. A logical assumption is that the rapid developmentof transgranular cracks will promote the appearance of large cracks by connecting with formerly developedgrain boundary cracks; the resultant large cracks thus tend to have a sawtoothed shape instead of smoothappearance breaking through many grains in straight. This assumption is supported by a continuous obser-vation on a small fault in Tennesseemarble (Olsson & Peng, 1976) and the appearance of large cracks in someother studies (Cheng et al., 2016; Dunn et al., 1973). Additionally, many cases that parallel transgranular cracksnucleated within a grain due to sliding on twin lamellae or possibly along the cleavage have been recentlyreported (Cheng et al., 2016). If these transgranular cracks nucleate simultaneously, comparable to typeTTS event in hornblende schist suggested by Lei et al. (2000), the corresponding AE event can have a mag-nitude even larger than that event triggered by a single transgranular crack. This may be another source ofthe events of large magnitudes.
Although shear microcrack has not been mentioned in this study, many transgranular cracks have beennucleated due to shear movement along grain boundaries or twin lamellae according to the specific analysison microcrack nucleation in marble (Cheng et al., 2016; Fredrich et al., 1989; Olsson & Peng, 1976). Similarly,transgranular cracks were reported to be attributed to sliding along fractures in sandstone (Conrad &
Journal of Geophysical Research: Solid Earth 10.1002/2017JB014581
CHENG AND WONG 221

Friedman, 1976). The number of transgranular cracks is representative of the population of sliding events(shear events) alongmicroscopic weak planes to some degree. Therefore, upon approaching shear fracturing,the considerable increase of transgranular cracks in this study should indicate an increase of shear events.This inference agrees with some AE recordings on specimens, which showed an increase of shear-type eventsas approaching shear fracturing (Lei et al., 2000; Stanchits et al., 2006; Stanchits et al., 2011). On the otherhand, those weak planes usually are not identified as shear microcracks because (1) the shear movementin grain scale is difficult to identify due to the absence of clear indicator and negligible magnitude and (2)such weak planes usually show a minute opening after unloading which render their origin unclear. This factpartially explains why shear microcracks are seldom seen in faulting specimens in which nearly half ofrecorded AE events are of shear source (Fortin et al., 2009).
Additionally, in direction normal to a fault, our observation suggests that only the spatial decay of transgra-nular cracks (Figure 14b) rather than grain boundary cracks, follow a power law relation (Figure 14a).Considering the correspondence between microcrack type and its energy release rate, events of largemagnitudes thus should decay more conspicuously than events of small magnitudes. Nonetheless, by count-ing all events together, an investigation on off-fault distribution of AE events displayed a power law decay ofseismic activity with increasing distance from the fault core (Goebel et al., 2014). We believe that if all thecounted AE events are divided into two groups by a threshold magnitude, the group above the thresholdmagnitude should decay more conspicuously than another group. If this proposal stands the future seismo-logical investigations, the correlation between AE event amplitude and the source mechanism of microcrack-ing could be clearer.
5. Conclusions
To examine the microcracking characteristics of tensile and shear fracturing in Carrara marble comprehen-sively, two series of specimens containing different artificial en echelon flaw configurations (β = 30° andβ = 90°) are uniaxially loaded to different stress levels. As such, typical tensile and shear fractures are success-fully obtained. Microscopic observations are then conducted on small specimens cut from the specimens ofdifferent degrees of damage. Observations in the present study clearly show that the tensile fracturing isdistinct from the shear fracturing in many different aspects.
1. White patches, as process zones preceding the development of fractures, exhibit different developmentprocesses for different fracture types. A tensile fracture is characterized by the linear white patch while ashear fracture is characterized by the diffuse white patch. Their development has been described in detailin sections 3.2 and 4.1.
2. In the damage zone of a tensile fracture, microcracking behavior is mainly related to the development ofgrain boundary cracks. In contrast, besides grain boundary cracks, transgranular cracks and grain spallingsare also abundant in the damage zone of a shear fracture.
3. The damage zone of a tensile fracture contains one or multiple long dominant microcracks of large exten-sional deformation, which are flanked by a few microcracks confined within a width about 300–1,000 μm(2–6 calcite grains). In the damage zone of a shear fracture, however, long dominant microcracks are notobserved before failure. Microcracks distribute uniformly within the damage zone, and they are generallyof a length comparable to grain size. They are characterized by small openings of around only 1 μmbeforefailure. Shear fracture usually forms a severe damage zone of a width about 5.0–9.0 mm (25–45 calcitegrains) after failure.
4. Transgranular crack density is always remarkably lower than grain boundary crack density in tensile frac-tures at all stress levels, while it becomes comparable with grain boundary crack density in shear fracturesas the loading approaches the peak stress.
5. In the direction perpendicular to a shear fracture, the transgranular crack density decreases logarithmi-cally with the distance away from the shear fracture center, while the grain boundary crack densitydecreases gradually.
6. Anisotropy (PL⊥ > P‖L ) is dominantly attributed to the development of transgranular cracks, which
nucleate later than grain boundary cracks at a high stress level. This phenomenon partly explainswhy in specimens undergoing brittle failure, microcrack anisotropy usually tends to be unobvious untilapproaching peak stress.
Journal of Geophysical Research: Solid Earth 10.1002/2017JB014581
CHENG AND WONG 222
7. The observedmicrocracking characteristics provide some probable explanations to some results obtainedfrom seismological studies.
ReferencesAbdollahi, A., & Arias, I. (2012). Numerical simulation of intergranular and transgranular crack propagation in ferroelectric polycrystals.
International Journal of Fracture, 174(1), 3–15. https://doi.org/10.1007/s10704-011-9664-0Alber, M., & Hauptfleisch, U. (1999). Generation and visualization of microfractures in Carrara marble for estimating fracture toughness,
fracture shear and fracture normal stiffness. International Journal of Rock Mechanics and Mining Sciences, 36(8), 1065–1071. https://doi.org/10.1016/S1365-1609(99)00069-6
Anders, M. H., & Wiltschko, D. V. (1994). Microfracturing, paleostress and the growth of faults. Journal of Structural Geology, 16(6), 795–815.https://doi.org/10.1016/0191-8141(94)90146-5
Bieniawski, Z. T. (1967). Mechanism of brittle fracture of rock : part ii—experimental studies. International Journal of Rock Mechanics & MiningSciences & Geomechanics Abstracts, 4(4), 407–423.
Bobet, A., & Einstein, H. H. (1998). Fracture coalescence in rock-type materials under uniaxial and biaxial compression. International Journal ofRock Mechanics and Mining Sciences, 35(7), 863–888. https://doi.org/10.1016/S0148-9062(98)00005-9
Brace, W. F., & Bombolakis, E. G. (1963). A note on brittle crack growth in compression. Journal of Geophysical Research, 68, 3709–3713. https://doi.org/10.1029/JZ068i012p03709
Bristow, J. (1960). Microcracks, and the static and dynamic elastic constants of annealed and heavily cold-worked metals. British Journal ofApplied Physics, 11(2), 81–85. https://doi.org/10.1088/0508-3443/11/2/309
Chen, G., Kemeny, J., & Harpalani, S. (1995). Fracture propagation and coalescence in marble plates with pre-cut notches under compression.Cheng, Y., Wong, L. N. Y., & Maruvanchery, V. (2016). Transgranular crack nucleation in Carrara marble of brittle failure. Rock Mechanics and
Rock Engineering, 49(8), 3069–3082. https://doi.org/10.1007/s00603-016-0976-2Cheng, Y., Wong, L. N. Y., & Zou, C. J. (2015). Experimental study on the formation of faults from en-echelon fractures in Carrara marble.
Engineering Geology, 195, 312–326. https://doi.org/10.1016/j.enggeo.2015.06.004Conrad, R. E. II, & Friedman, M. (1976). Microscopic feather fractures in the faulting process. Tectonophysics, 33(1-2), 187–198. https://doi.org/
10.1016/0040-1951(76)90056-1DiGiovanni, A., Fredrich, J., Holcomb, D., & Olsson, W. (2007). Microscale damage evolution in compacting sandstone. Geological Society,
London, Special Publications, 289(1), 89–103. https://doi.org/10.1144/SP289.6Dunn, D. E., LaFountain, L. J., & Jackson, R. E. (1973). Porosity dependence and mechanism of brittle fracture in sandstones. Journal of
Geophysical Research, 78, 2403–2417. https://doi.org/10.1029/JB078i014p02403Edmond, J., & Paterson, M. (1972). Volume changes during the deformation of rocks at high pressures. International Journal of Rock
Mechanics and Mining Science and Geomechanics Abstracts, 9(2), 161–182. https://doi.org/10.1016/0148-9062(72)90019-8Eoin, R. (1988). En échelon vein array development in extension and shear. Journal of Structural Geology, 10(1), 63–71.Fonseka, G. M., Murrell, S. A. F., & Barnes, P. (1985). Scanning electron microscope and acoustic emission studies of crack development in
rocks. International Journal of Rock Mechanics and Mining Science and Geomechanics Abstracts, 22(5), 273–289. https://doi.org/10.1016/0148-9062(85)92060-1
Fortin, J., Stanchits, S., Dresen, G., & Gueguen, Y. (2009). Acoustic emissions monitoring during inelastic deformation of porous sandstone:Comparison of three modes of deformation. Pure and Applied Geophysics, 166(5-7), 823–841. https://doi.org/10.1007/s00024-009-0479-0
Fredrich, J. T., Evans, B., & Wong, T. F. (1989). Micromechanics of the brittle to plastic transition in Carrara marble. Journal of GeophysicalResearch, 94, 4129–4145. https://doi.org/10.1029/JB094iB04p04129
Friedman, M., Perkins, R. D., & Green, S. J. (1970). Observation of brittle-deformation features at the maximum stress of westerly granite andsolenhofen limestone. International Journal of Rock Mechanics and Mining Science and Geomechanics Abstracts, 7(3), 297–302. https://doi.org/10.1016/0148-9062(70)90043-4
Gehle, C., & Kutter, H. K. (2003). Breakage and shear behaviour of intermittent rock joints. International Journal of Rock Mechanics and MiningSciences, 40(5), 687–700. https://doi.org/10.1016/S1365-1609(03)00060-1
Goebel, T. H. W., Becker, T. W., Sammis, C. G., Dresen, G., & Schorlemmer, D. (2014). Off-fault damage and acoustic emission distributionsduring the evolution of structurally complex faults over series of stick-slip events. Geophysical Journal International, 197(3), 1705–1718.https://doi.org/10.1093/gji/ggu074
Goebel, T. H. W., Schorlemmer, D., Becker, T. W., Dresen, G., & Sammis, C. G. (2013). Acoustic emissions document stress changes over manyseismic cycles in stick-slip experiments. Geophysical Research Letters, 40, 2049–2054. https://doi.org/10.1002/grl.50507
Graham, C. C., Stanchits, S., Main, I. G., & Dresen, G. (2010). Comparison of polarity and moment tensor inversion methods for source analysisof acoustic emission data. International Journal of Rock Mechanics and Mining Sciences, 47(1), 161–169. https://doi.org/10.1016/j.ijrmms.2009.05.002
Griffith, A. A. (1924). The Theory of Rupture. In Proceedings of the first International Congress for Applied Mechanics, Delft (pp. 55–63).Hadley, K. (1976). Comparison of calculated and observed crack densities and seismic velocities in westerly granite. Journal of Geophysical
Research, 81, 3484–3494. https://doi.org/10.1029/JB081i020p03484Hoek, E. (1968). Brittle fracture of rock. In K. G. Stagg & O. C. Zienkiewicz (Eds.), Chapter 4 in Rock Mechanics in Engineering Practice (pp. 99–124).
London: John Wiley.Homand, F., Hoxha, D., Belem, T., Pons, M.-N., & Hoteit, N. (2000). Geometric analysis of damaged microcracking in granites. Mechanics of
Materials, 32(6), 361–376. https://doi.org/10.1016/S0167-6636(00)00005-3Horii, H., & Nemat-Nasser, S. (1985). Compression-induced microcrack growth in brittle solids: Axial splitting and shear failure. Journal of
Geophysical Research, 90(B4), 3105–3125. https://doi.org/10.1029/JB090iB04p03105Huang, J., Chen, G., Zhao, Y., & Wang, R. (1990). An experimental study of the strain field development prior to failure of a marble plate under
compression. Tectonophysics, 175, 269–284.Ingraffea, A. R., & Heuze, F. E. (1980). Finite element models for rock fracture mechanics. International Journal for Numerical and Analytical
Methods in Geomechanics, 4(1), 25–43. https://doi.org/10.1002/nag.1610040103Ito, Y., Matsubayashi, H., Kimura, H., Matsumoto, T., Asano, Y., & Sekiguchi, S. (2004). Spatial distribution for moment tensor solutions of the
2003 Tokachi-oki earthquake (M JMA = 8.0) and aftershocks. Earth, Planets and Space, 56(3), 301–306. https://doi.org/10.1186/BF03353055Julian, B. R., Miller, A. D., & Foulger, G. (1998). Non-double-couple earthquakes 1. Theory. Reviews of Geophysics, 36, 525–549. https://doi.org/
10.1029/98RG00716
Journal of Geophysical Research: Solid Earth 10.1002/2017JB014581
CHENG AND WONG 223
AcknowledgmentsThe data used are listed in Table 1 andshown in figures. The research wassupported by the Singapore AcademicResearch Fund Tier 1 grant under pro-ject RG112/14 and the NanyangTechnological University start up grant(M4080115.030). The first authoracknowledges the support from theFundamental Research Funds for theCentral Universities, China University ofGeosciences (Wuhan) (162301132729)and the China National Natural ScienceFoundation (41702314). The secondauthor also acknowledges the supportfrom the University of Hong Kong start-up fund, the Seed Funding Program forBasic Research for New Staff at theUniversity of Hong Kong, the ResearchGrant Council General Research Fund2017/18 (grant 17303917), and the sup-port of the “China University ofGeosciences Scholar” Program(2017046). The authors appreciate theassistance from Varun Maruvanchery inperforming the microscopic observa-tion. Also, great thanks are given to theanonymous reviewers and Qi-QuanXiong, the PhD student at NTU for theirsuggestions to discuss the results in abroader scope.

Kranz, R. L. (1979). Crack growth and development during creep of Barre granite. International Journal of Rock Mechanics and Mining Scienceand Geomechanics Abstracts, 16(1), 23–35. https://doi.org/10.1016/0148-9062(79)90772-1
Kumar, R., Gupta, S. C., & Kumar, A. (2015). Non-double-couple mechanism of moderate earthquakes occurred in Lower Siang region ofArunachal Himalaya: Evidence of factors affecting non-DC. Journal of Asian Earth Sciences, 98, 105–115. https://doi.org/10.1016/j.jseaes.2014.10.025
Kwiatek, G., Goebel, T. H. W., & Dresen, G. (2014). Seismic moment tensor and b value variations over successive seismic cycles in laboratorystick-slip experiments. Geophysical Research Letters, 41, 5838–5846. https://doi.org/10.1002/2014GL060159
Lajtai, E. (1971). A theoretical and experimental evaluation of the Griffith theory of brittle fracture. Tectonophysics, 11(2), 129–156. https://doi.org/10.1016/0040-1951(71)90060-6
Lei, X., Kusunose, K., Rao, M. V. M. S., Nishizawa, O., & Satoh, T. (2000). Quasi-static fault growth and cracking in homogeneous brittle rockunder triaxial compression using acoustic emission monitoring. Journal of Geophysical Research, 105, 6127–6139. https://doi.org/10.1029/1999JB900385
Li, Y.-P., Chen, L.-Z., &Wang, Y.-H. (2005). Experimental research on pre-crackedmarble under compression. International Journal of Solids andStructures, 42(9-10), 2505–2516. https://doi.org/10.1016/j.ijsolstr.2004.09.033
Lockner, D. A., Byerlee, J. D., Kuksenko, V., Ponomarev, A., & Sidorin, A. (1991). Quasi-static fault growth and shear fracture energy in granite.Nature, 350(6313), 39–42. https://doi.org/10.1038/350039a0
Menéndez, B., Zhu, W., & Wong, T.-F. (1996). Micromechanics of brittle faulting and cataclastic flow in Berea sandstone. Journal of StructuralGeology, 18(1), 1–16. https://doi.org/10.1016/0191-8141(95)00076-P
Mitchell, T. M., & Faulkner, D. R. (2012). Towards quantifying the matrix permeability of fault damage zones in low porosity rocks. Earth andPlanetary Science Letters, 339(Supplement C), 24–31.
Mizoguchi, K., & Ueta, K. (2013). Microfractures within the fault damage zone record the history of fault activity. Geophysical Research Letters,40, 2023–2027. https://doi.org/10.1002/grl.50469
Mlakar, V., Hassani, F. P., & Momayez, M. (1993). Crack development and acoustic emission in potash rock. International Journal of RockMechanics and Mining Science and Geomechanics Abstracts, 30(3), 305–319. https://doi.org/10.1016/0148-9062(93)92732-6
Mongi, K. (1962). Study of the elastic shocks caused by the fracture of heterogeneous materials and its relation to earthquakes phenomena.Bulletin of the Earthquake Research Institute, 40, 125–173.
Moore, D. E., & Lockner, D. A. (1995). The role of microcracking in shear-fracture propagation in granite. Journal of Strucrural Geology, 17(1),95–114. https://doi.org/10.1016/0191-8141(94)E0018-T
Myers, R., & Aydin, A. (2004). The evolution of faults formed by shearing across joint zones in sandstone. Journal of Structural Geology, 26(5),947–966. https://doi.org/10.1016/j.jsg.2003.07.008
Nicholson, R., & Pollard, D. D. (1985). Dilation and linkage of echelon cracks. Journal of Structural Geology, 7(5), 583–590. https://doi.org/10.1016/0191-8141(85)90030-6
Nicolas, A., Fortin, J., Regnet, J., Verberne, B., Plümper, O., Dimanov, A., … Guéguen, Y. (2017). Brittle and semi-Brittle Creep of TavelLimestone Deformed at Room Temperature. Journal of Geophysical Research: Solid Earth, 122, 4436–4459. https://doi.org/10.1002/2016JB013557
Nolen-Hoeksema, R. C., & Gordon, R. B. (1987). Optical detection of crack patterns in the opening-mode fracture of marble. InternationalJournal of Rock Mechanics and Mining Science and Geomechanics Abstracts, 24(2), 135–144. https://doi.org/10.1016/0148-9062(87)91933-4
Ohnaka, M., & Mogi, K. (1982). Frequency characteristics of acoustic emission in rocks under uniaxial compression and its relation to thefracturing process to failure. Journal of Geophysical Research, 87, 3873–3884. https://doi.org/10.1029/JB087iB05p03873
Olsson, W. A. (1974). Microfracturing and faulting in a limestone. Tectonophysics, 24(3), 277–285. https://doi.org/10.1016/0040-1951(74)90012-2
Olsson, W. A., & Peng, S. S. (1976). Microcrack nucleation in marble. International Journal of Rock Mechanics and Mining Science andGeomechanics Abstracts, 13(2), 53–59. https://doi.org/10.1016/0148-9062(76)90704-X
Passelègue, F., Spagnuolo, E., Violay, M., Nielsen, S., Di Toro, G., & Schubnel, A. (2016). Frictional evolution, acoustic emissions activity, and off-fault damage in simulated faults sheared at seismic slip rates. Journal of Geophysical Research: Solid Earth, 121, 7490–7513. https://doi.org/10.1002/2016JB012988
Passelégue, F. X., Latour, S., Schubnel, A., Nielsen, S., Bhat, H. S., & Madariaga, R. (2017). Influence of Fault Strength on Precursory ProcessesDuring Laboratory Earthquakes. In M. Y. Thomas, T. M. Mitchell, & H. S. Bhat (Eds.), Fault Zone Dynamic Processes: Evolution of FaultProperties During Seismic Rupture. Hoboken, NJ: John Wiley, Inc. https://doi.org/10.1002/9781119156895.ch12
Peng, S., & Johnson, A. M. (1972). Crack growth and faulting in cylindrical specimens of chelmsford granite. International Journal of RockMechanics and Mining Science and Geomechanics Abstracts, 9(1), 37–86. https://doi.org/10.1016/0148-9062(72)90050-2
Petit, J.-P., & Barquins, M. (1988). Can natural faults propagate under mode II conditions? Tectonics, 7(6), 1243–1256. https://doi.org/10.1029/TC007i006p01243
Pollard, D. D., Segall, P., & Delaney, P. T. (1982). Formation and interpretation of dilatant echelon cracks. Geological Socity of America Bulletin,93(12), 1291–1303. https://doi.org/10.1130/0016-7606(1982)93%3C1291:FAIODE%3E2.0.CO;2
Sagong, M., & Bobet, A. (2003). Micro-fractographic characterization of tensile and shear cracks.Scholz, C. H. (1968a). Microfracturing and inelastic deformation of rock in compression. Journal of Geophysical Research, 374, 1417–1432.
https://doi.org/10.1098/rsta.2015.0422Scholz, C. H. (1968b). The frequency-magnitude relation of microfracturing in rock and its relation to earthquakes. Nihon Naika Gakkai Zasshi
the Journal of the Japanese Society of Internal Medicine, 96(9), 1909–1911.Shen, B., Stephansson, O., Einstein, H. H., & Ghahreman, B. (1995). Coalescence of fractures under shear stresses in experiments. Journal of
Geophysical Research, 100, 5975–5990. https://doi.org/10.1029/95JB00040Stanchits, S., Fortin, J., Gueguen, Y., & Dresen, G. (2009). Initiation and propagation of compaction bands in dry and wet Bentheim sandstone.
Pure & Applied Geophysics, 166(5–7), 843–868.Stanchits, S., Mayr, S., Shapiro, S., & Dresen, G. (2011). Fracturing of porous rock induced by fluid injection. Tectonophysics, 503(1-2), 129–145.
https://doi.org/10.1016/j.tecto.2010.09.022Stanchits, S., Surdi, A., Gathogo, P., Edelman, E., & Suarez-Rivera, R. (2014). Onset of hydraulic fracture initiation monitored by acoustic
emission and volumetric deformation measurements. Rock Mechanics and Rock Engineering, 47(5), 1521–1532. https://doi.org/10.1007/s00603-014-0584-y
Stanchits, S., Vinciguerra, S., & Dresen, G. (2006). Ultrasonic velocities, acoustic emission characteristics and crack damage of basalt andgranite. Pure and Applied Geophysics, 163(5-6), 975–994. https://doi.org/10.1007/s00024-006-0059-5
Journal of Geophysical Research: Solid Earth 10.1002/2017JB014581
CHENG AND WONG 224

Stierle, E., Bohnhoff, M., & Vavryčuk, V. (2014). Resolution of non-double-couple components in the seismic moment tensor using regionalnetworks—II: Application to aftershocks of the 1999 Mw 7.4 Izmit earthquake. Geophysical Journal International, 196(3), 1878–1888.https://doi.org/10.1093/gji/ggt503
Tapponnier, P., & Brace, W. (1976). Development of stress-induced microcracks in westerly granite. International Journal of Rock Mechanicsand Mining Science and Geomechanics Abstracts, 13(4), 103–112. https://doi.org/10.1016/0148-9062(76)91937-9
Tatami, J., Yasuda, K., Matsuo, Y., & Kimura, S. (1997). Stochastic analysis on crack path of polycrystalline ceramics based on the differencebetween the released energies in crack propagation. Journal of Materials Science, 32(9), 2341–2346. https://doi.org/10.1023/A:1018588620081
Underwood, E. E. (1970). Quantitative stereology. Reading, MA: Addison-Wesley.Vajdova, V., Baud, P., Wu, L., & Wong, T.-F. (2012). Micromechanics of inelastic compaction in two allochemical limestones. Journal of
Structural Geology, 43, 100–117. https://doi.org/10.1016/j.jsg.2012.07.006Vajdova, V., Zhu, W., Natalie Chen, T.-M., & Wong, T.-F. (2010). Micromechanics of brittle faulting and cataclastic flow in Tavel limestone.
Journal of Structural Geology, 32(8), 1158–1169. https://doi.org/10.1016/j.jsg.2010.07.007Vavryčuk, V. (2002). Non-double-couple earthquakes of 1997 January in West Bohemia, Czech Republic: Evidence of tensile faulting.
Geophysical Journal International, 149(2), 364–373. https://doi.org/10.1046/j.1365-246X.2002.01654.xVermilye, J. M., & Scholz, C. H. (1998). The process zone: A microstructural view of fault growth. Journal of Geophysical Research, 103,
12,223–12,237. https://doi.org/10.1029/98JB00957Weiss, J., & Schulson, E. M. (2009). Coulombic faulting from the grain scale to the geophysical scale: Lessons from ice. Journal of Physics D:
Applied Physics, 42(21), 18.Wong, L. N. Y., & Einstein, H. H. (2009a). Systematic evaluation of cracking behavior in specimens containing single flaws under uniaxial
compression. International Journal of Rock Mechanics and Mining Sciences, 46(2), 239–249. https://doi.org/10.1016/j.ijrmms.2008.03.006Wong, L. N. Y., & Einstein, H. H. (2009b). Crack coalescence in molded gypsum and Carrara marble: Part 1. Macroscopic observations and
interpretation. Rock Mechanics and Rock Engineering, 42(3), 475–511. https://doi.org/10.1007/s00603-008-0002-4Wong, L. N. Y., & Einstein, H. H. (2009c). Crack coalescence in molded gypsum and Carrara marble: Part 2. Microscopic observations and
interpretation. Rock Mechanics and Rock Engineering, 42(3), 513–545. https://doi.org/10.1007/s00603-008-0003-3Wong, L. N. Y., & Maruvanchery, V. (2016). Different lithological varieties of Bukit Timah granite in Singapore: A preliminary comparison study
on engineering properties. Rock Mechanics and Rock Engineering, 49(7), 2923–2935. https://doi.org/10.1007/s00603-015-0825-8Wong, R., Li, T., Chau, K., Li, S., & Zhu, W. (2007). Crack growth study of a 3-D surface fracture under compressions using strain and acoustic
emission measurements. Symposium.Wong, R. H., Guo, Y., Li, L., Chau, K., Zhu, W., & Li, S. (2006). Anti-wing crack growth from surface flaw in real rock under uniaxial compression.
In Fracture of Nano and Engineering Materials and Structures (pp. 825–826). Dordrecht: Springer. https://doi.org/10.1007/1-4020-4972-2_408Wong, R. H. C., & Chau, K. (1998). Crack coalescence in a rock-like material containing two cracks. International Journal of Rock Mechanics and
Mining Sciences, 35(2), 147–164. https://doi.org/10.1016/S0148-9062(97)00303-3Wong, R. H. C., Leung, W. L., & Wang, S. W. (2001). Shear strength study on rock-like models containing arrayed open joints. Dc Rocks E U.S.
Symposium on Rock Mechanics.Wong, T.-F. (1982). Micromechanics of faulting in westerly granite. International Journal of Rock Mechanics and Mining Science and
Geomechanics Abstracts, 19(2), 49–64. https://doi.org/10.1016/0148-9062(82)91631-XWong, T.-F. (1985). Geometric probability approach to the characterization and analysis of microcracking in rocks. Mechanics of Materials,
4(3-4), 261–276. https://doi.org/10.1016/0167-6636(85)90023-7Wu, X. Y., Baud, P., & Wong, T.-f. (2000). Micromechanics of compressive failure and spatial evolution of anisotropic damage in Darley Dale
sandstone. International Journal of Rock Mechanics and Mining Sciences, 37(1-2), 143–160. https://doi.org/10.1016/S1365-1609(99)00093-3Yang, S. Q., Dai, Y. H., Han, L. J., & Jin, Z. Q. (2009). Experimental study on mechanical behavior of brittle marble samples containing different
flaws under uniaxial compression. Engineering Fracture Mechanics, 76(12), 1833–1845. https://doi.org/10.1016/j.engfracmech.2009.04.005Yang, S. Q., Jiang, Y. Z., Xu, W. Y., & Chen, X. Q. (2008). Experimental investigation on strength and failure behavior of pre-cracked marble
under conventional triaxial compression. International Journal of Solids and Structures, 45(17), 4796–4819. https://doi.org/10.1016/j.ijsolstr.2008.04.023
Yang, S. Q., Ranjith, P. G., Jing, H. W., Tian, W. L., & Ju, Y. (2017). An experimental investigation on thermal damage and failure mechanicalbehavior of granite after exposure to different high temperature treatments. Geothermics, 65, 180–197. https://doi.org/10.1016/j.geothermics.2016.09.008
Yang, S. Q., Tian, W. L., & Ranjith, P. G. (2017). Experimental investigation on deformation failure characteristics of crystalline marble undertriaxial cyclic loading. Rock Mechanics and Rock Engineering, 50(11), 2871–2889. https://doi.org/10.1007/s00603-017-1262-7
Yasuda, K., Tatami, J., Asada, K., Matsuo, Y., & Kimura, S. (1993). Influence of crack propagation path on the fracture toughness of polycrys-talline Al2O3. Journal of the Ceramic Society of Japan, 101(1180), 1384–1389. https://doi.org/10.2109/jcersj.101.1384
Zhang, Z. N., Wang, D. Y., Zheng, H., & Ge, X. R. (2012). Interactions of 3D embedded parallel vertically inclined cracks subjected to uniaxialcompression. Theoretical and Applied Fracture Mechanics, 61, 1–11. https://doi.org/10.1016/j.tafmec.2012.08.001
Zhao, Y., Liang, H., Huang, J., Geng, J., & Wang, R. (1995). Development of subcracks between en echelon, fractures in rock plates. Pure &Applied Geophysics, 145(3–4), 759–773.
Zhu, W., Baud, P., Vinciguerra, S., & Wong, T.-F. (2011). Micromechanics of brittle faulting and cataclastic flow in Alban Hills tuff. Journal ofGeophysical Research, 116, B06209. https://doi.org/10.1029/2010JB008046
Journal of Geophysical Research: Solid Earth 10.1002/2017JB014581
CHENG AND WONG 225