full year 2015 results presentation - ugl cms … 24 august 2015 full year 2015 results presentation...
TRANSCRIPT

Monday, 24 August 2015
Full Year 2015 Results Presentation
2
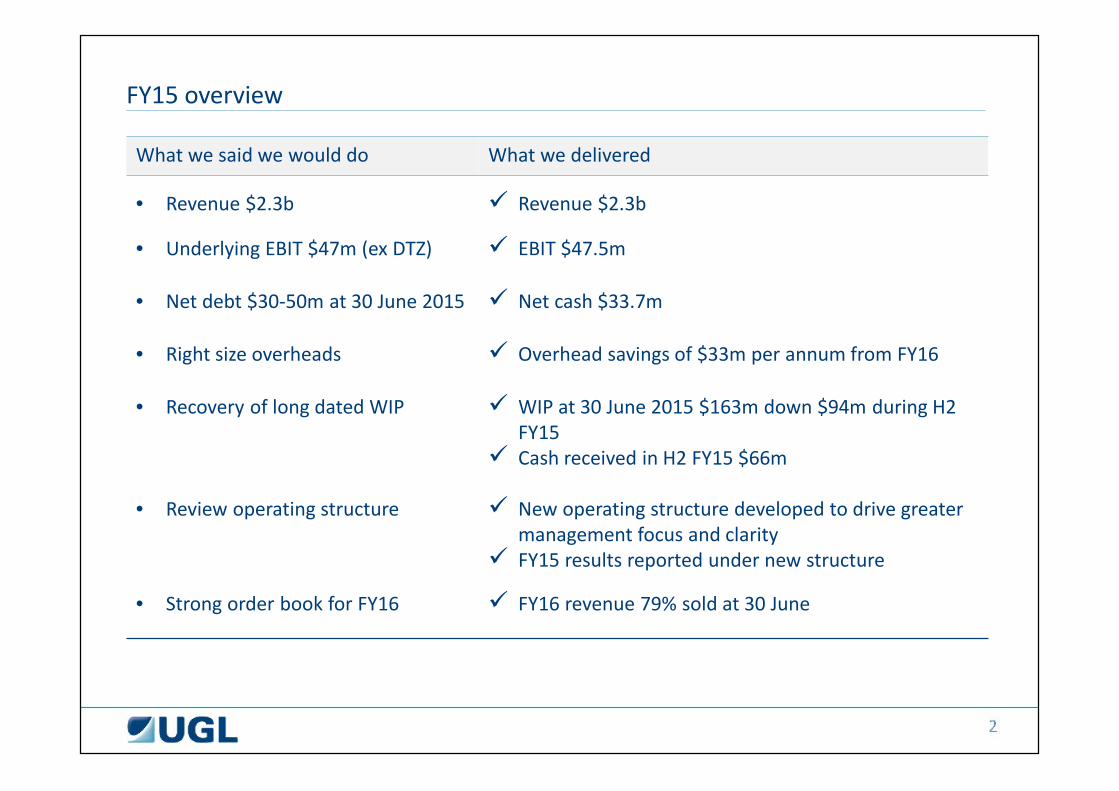
FY15 overview
What we said we would do What we delivered
• Revenue $2.3b Revenue $2.3b
• Underlying EBIT $47m (ex DTZ) EBIT $47.5m
• Net debt $30-50m at 30 June 2015 Net cash $33.7m
• Right size overheads Overhead savings of $33m per annum from FY16
• Recovery of long dated WIP WIP at 30 June 2015 $163m down $94m during H2FY15
Cash received in H2 FY15 $66m
• Review operating structure New operating structure developed to drive greatermanagement focus and clarity
FY15 results reported under new structure
• Strong order book for FY16 FY16 revenue 79% sold at 30 June

.
3
Safety – 12 month rolling

Update on Ichthys CCPP and SMP ProjectsRoss Taylor
5
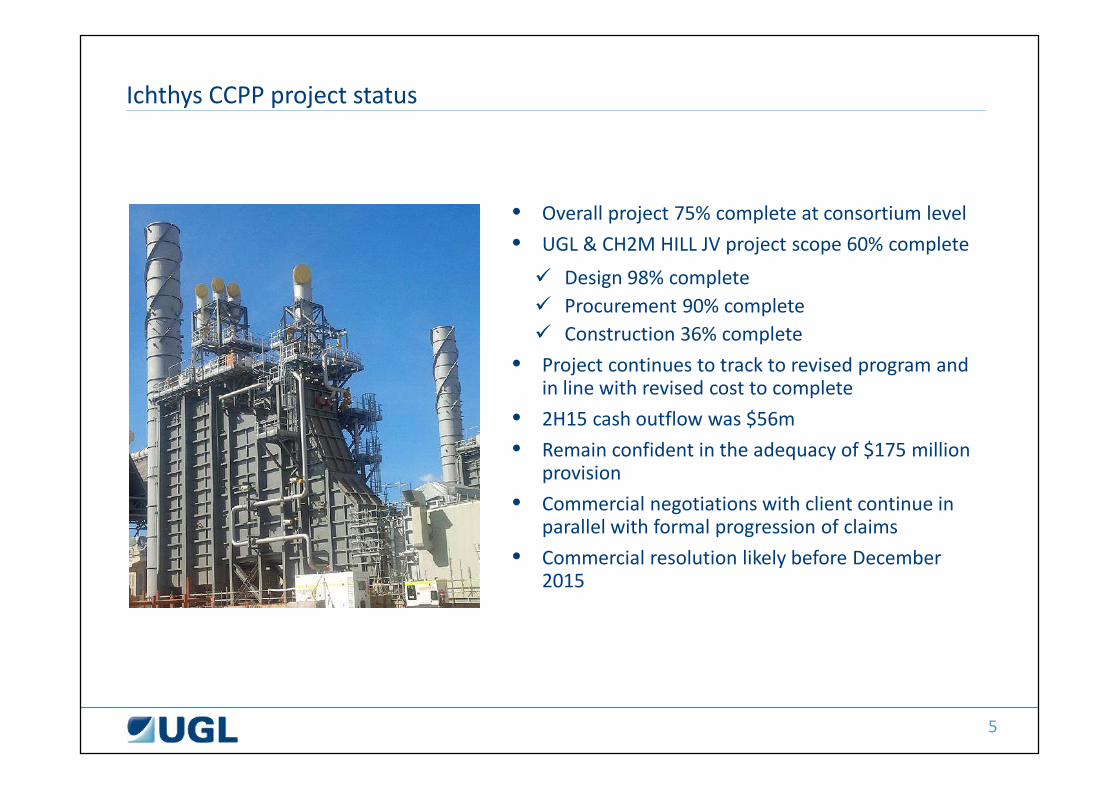
Ichthys CCPP project status
• Overall project 75% complete at consortium level• UGL & CH2M HILL JV project scope 60% complete Design 98% complete Procurement 90% complete Construction 36% complete
• Project continues to track to revised program andin line with revised cost to complete
• 2H15 cash outflow was $56m• Remain confident in the adequacy of $175 million
provision• Commercial negotiations with client continue in
parallel with formal progression of claims• Commercial resolution likely before December
2015

6
Ichthys SMP project status
• Construction 18% complete• No margin will be recognised until project is 30%
complete in accordance with JV revenuerecognition policy – expected to occur aroundDecember 2015
• Site productivity tracking in line with targets• Slippage in early milestones due to delays in site
access and client procurement• EOT claim submitted with indication by client they
will pursue a process to resolve the EOT andmitigate current schedule slippage
• Continue to submit claims and variations inaccordance with contract terms
• Commercial resolution likely before December2015

FY2015 ResultsRoss Taylor

8
Underlying ResultsResults overview
$m FY15 FY14 ChangeOperating revenue 3,048.6 4,511.5 (32%)EBIT 75.3 185.8 (59%)EBIT margin 2.5% 4.1%Interest (25.5) (37.4) 32%Tax (15.5) (30.2) 49%Minority interest (4.0) (6.4) 37%NPAT 30.3 111.7 (73%)NPAT margin 1.0% 2.5%EPS 18.2 67.1 (73%)
9
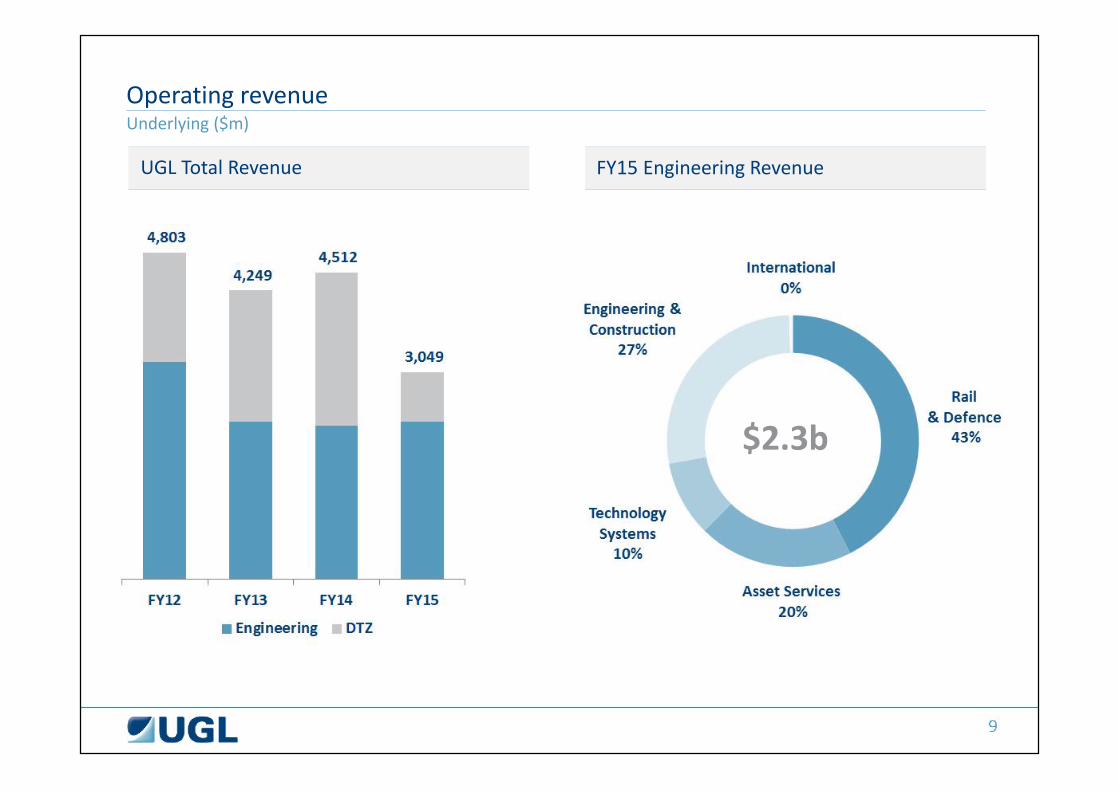
Underlying ($m)Operating revenue
UGL Total Revenue FY15 Engineering Revenue
$2.3b

10
Results excluding DTZNew UGL (Underlying)
Using the previous corporate cost overhead model
($m) FY15 FY14 ChangeRevenue 2,320.5 2,261.7 3%Engineering Operating Profit 69.5 84.1 (17%)Corporate Costs (22.0) (22.2) 0%EBIT 47.5 61.9 (23%)EBIT % 2.0% 2.7% (25%)

11
Normalising overhead historically to align with future reporting
DivisionalOverhead
GroupOverhead
DivisionalOverhead
Historical New
GroupOverhead
EngineeringGroup
Overhead
Varies bydivision
~$40m or1.7% of revenue
~$33m perannum saving

12
Results excluding DTZNew UGL (Underlying)
Engineering earnings based on new overhead model• Corporate costs 1.7% of revenue• Reflects combined group and engineering overheads with increased cost
accountability at the divisional level
($m) FY15 FY14 ChangeRevenue 2,320.5 2,261.7 3%Engineering Operating Profit 87.4 100.8 (13%)Corporate Costs (at 1.7%) (39.9) (38.9) 3%EBIT 47.5 61.9 (23%)EBIT % 2.0% 2.7% (25%)

13
Reporting under our new operating structure
Engineering& Construction
Div
isio
nsAsset Services Technology
Systems International
• Power, water andresources sector:- Engineering- Procurement- Construction- Commissioning
• Maintenanceservices
• Shutdowns andturnarounds
• Sectors:- LNG- Minerals
processing- Petroleum- Power- Water
• Passenger buildand maintenance
• Freight build andmaintenance
• GE parts sales &distribution
• Supply chainservices
• Componentmanufacture
• Naval shipmaintenance
• Road tunnelsignaling andcommunicationssystems
• Train signalingand controlsystems
• Wirelesscommunications
• Engineeringdesign,procurement,construction andcommissioning ofwater treatmentplants
• O&G pipeline EPCcapability
Mark ChilcoteShane KimptonAlan Beacham David MacKenzie Alan Beacham
Rail & DefenceO
pera
tions
EGM

14
Rail & Defence
FY15 Overview• EBIT impacted by reduced coal freight
locomotive sales and associated under-utilisation of rail facilities
• Strong performance across MTM and UGLUnipart contracts
• Solid order book with 95% recurring• Key opportunities secured : Sydney Metro Northwest Tangara technology upgrade (not in FY15
order book)
Outlook• FY16 revenue in line with FY15• Freight locomotive market remains subdued
offset by continuing strength in maintenanceand upgrade markets
• Profitability expected to improve in FY16following rationalisation of under-utilised railfacilities
Revenue $m EBIT $m
FY15 FY14 Change
Revenue - $m 986.3 971.1 2%
EBIT - $m 32.4 45.8 (29%)
EBIT margin 3.3% 4.7%
Order book - $b 2.4 2.6 (6%)

15
Asset Services
FY15 Overview• Revenue increase driven by Stanwell and
Chevron contracts secured in FY14• EBIT impacted by margin pressure in coal
maintenance and low work volumes in WAdesign business
• WA design business closed in June 2015• Strong order book predominantly recurring• Key opportunities secured: APLNG and GLNG BP fuel terminal network
Outlook• Revenue expected to grow in FY16 driven by
contracts secured in FY15 and ramp up ofChevron maintenance
• Shutdown revenue expected to increasesignificantly in FY17 as LNG plants enter firstshut down cycle
• FY16 profitability expected to improve withclose of WA design business and coal sectornow reset to new base
Revenue $m EBIT $m
FY15 FY14 Change
Revenue - $m 463.2 455.8 2%
EBIT - $m 8.5 11.4 (25%)
EBIT margin 1.8% 2.5%
Order book - $b 1.0 1.0 1%

16
Technology Systems
FY15 Overview• Revenue contraction driven by completion of
Regional Rail Link and Solomon Spur duringFY15 and reduced revenue from DTRS asproject moves to later stages of the contract
• EBIT impacted by the ongoing dispute on DTRSoffset in part by a strong contribution fromRegional Rail Link
• Secured Sydney Metro Northwest
Outlook• FY16 revenue expected to be flat with Sydney
Metro Northwest replacing completed projectsin FY15
• Medium term outlook supported by largesecured contracts delivering substantialrevenue growth in FY17 as projects move fromdesign to delivery phase
• Expect to close NorthConnex in coming weeks
Revenue $m EBIT $m
FY15 FY14 Change
Revenue - $m 231.3 301.3 (23%)
EBIT - $m 10.3 21.1 (51%)
EBIT margin 4.4% 7.0%
Order book - $b 0.6 0.3 102%
17
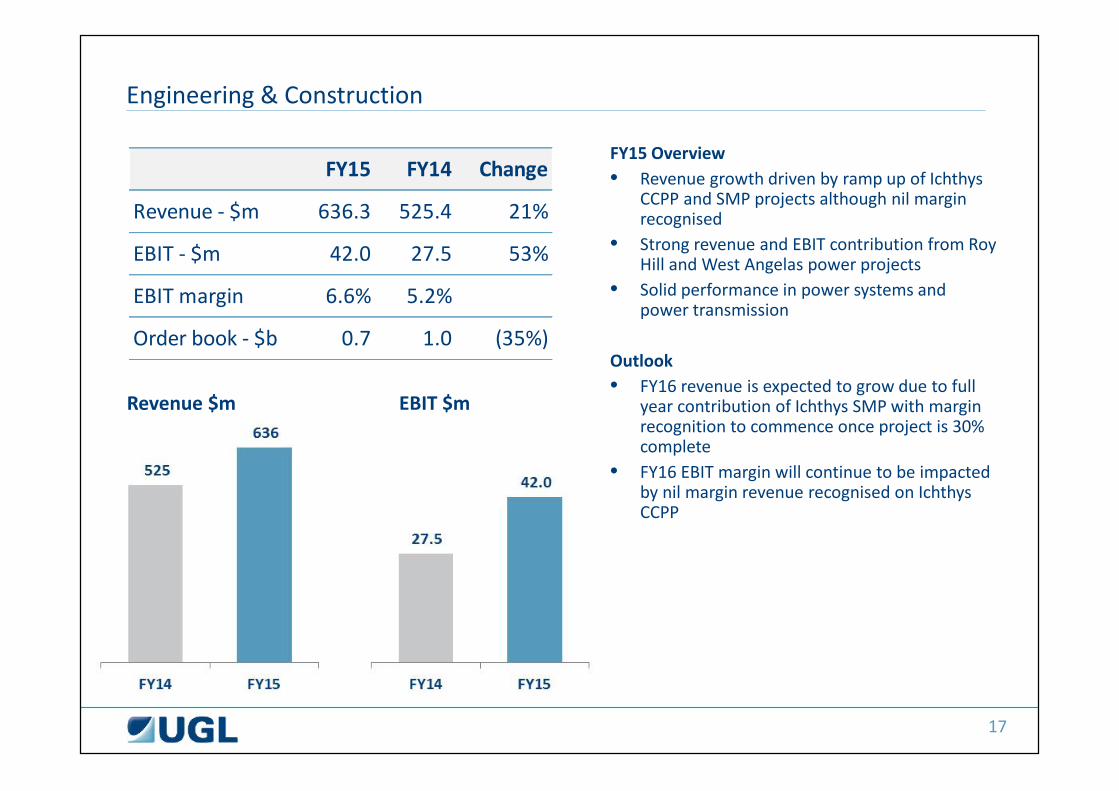
Engineering & Construction
FY15 Overview• Revenue growth driven by ramp up of Ichthys
CCPP and SMP projects although nil marginrecognised
• Strong revenue and EBIT contribution from RoyHill and West Angelas power projects
• Solid performance in power systems andpower transmission
Outlook• FY16 revenue is expected to grow due to full
year contribution of Ichthys SMP with marginrecognition to commence once project is 30%complete
• FY16 EBIT margin will continue to be impactedby nil margin revenue recognised on IchthysCCPP
Revenue $m EBIT $m
FY15 FY14 Change
Revenue - $m 636.3 525.4 21%
EBIT - $m 42.0 27.5 53%
EBIT margin 6.6% 5.2%
Order book - $b 0.7 1.0 (35%)

18
International
FY15 Overview• Revenue decline driven by reduced levels of
secured infrastructure projects in South EastAsia
• Overhead costs not recovered due to lowactivity
• Cost base right-sized to support scale ofoperations in FY16
• EBIT also impacted by reduced throughputvolumes in Indian locomotive fabricationfacility
• Texmaco JV currently being exited (previouslyprovisioned)
Outlook• Strong near to medium term prospects in
tunneling, water and oil & gas pipelines inSouth East Asia
• Continued investment in the region contingenton securing identified key opportunities inFY16
Revenue $m EBIT $m
FY15 FY14 Change
Revenue - $m 11.3 22.8 (50%)
EBIT - $m (5.9) (5.1) 16%
EBIT margin (52.1)% (22.4)%
Order book - $b 0.04 0.01 161%

Financial AnalysisRay Church

20
Underlying ResultsResults overview
$m FY15 FY14 ChangeOperating revenue 3,048.6 4,511.5 (32%)EBIT (DTZ FY15 $28m FY14 $124m ) 75.3 185.8 (59%)EBIT margin 2.5% 4.1%Interest (25.5) (37.4) 32%Tax (15.5) (30.2) 49%Non controlling interest (4.0) (6.4) 37%Net profit after tax 30.3 111.7 (73%)NPAT margin 1.0% 2.5%EPS 18.2 67.1Effective tax rate 31.0% 20.4%ROFE 14.0% 11.4%Engineering CAPEX 16.8 23.2

21
DTZ overview
$m Trading Profit on sale FY15
Operating revenue 729.1 - 729.1EBIT 27.8 - 27.8
Sales Costs - (17.3) (17.3)Accounting Profit on Sale - 83.4 83.4Reported EBIT 27.8 66.1 93.9Interest (6.3) - (6.3)Tax (4.1) (17.2) (21.3)Non-Controlling Interest 0.1 - 0.1Profit from Discontinued Operations 17.5 48.9 66.4

22
Business resetOne-Off items impacting FY2015
* Excluding Ichthys CCPP
23
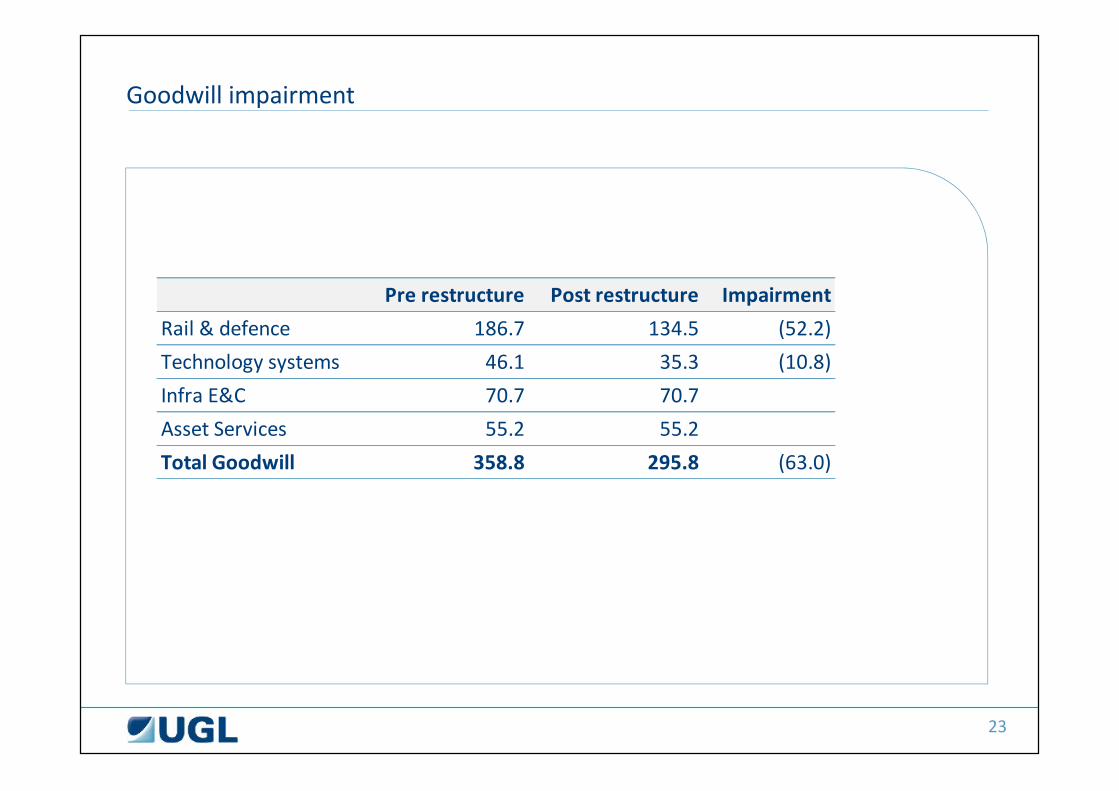
Goodwill impairment
Pre restructure Post restructure ImpairmentRail & defence 186.7 134.5 (52.2)Technology systems 46.1 35.3 (10.8)Infra E&C 70.7 70.7Asset Services 55.2 55.2Total Goodwill 358.8 295.8 (63.0)

24
Reconciliation to statutory
* Includes $11m DTZ Revenue for details refer to note 3 and Note 26 of the financial statements
$m UnderlyingJV's
(Equitymethod)*
Provision forcontract loss
Claimsresolution &settlement
Resourcesslowdown
Goodwillimpairment
Tender costswritten off
Restructurecosts
Discontinuedoperations
Continuingoperations
Revenue 3,048.6 (319.9) (717.5) 2,011.1
EBIT 75.3 (6.9) (175.0) (39.8) (84.9) (63.0) (18.9) (38.1) (27.8) (379.1)
Net interest (25.5) 6.2 (19.3)
Tax (15.4) 6.9 52.5 11.9 22.6 0.0 5.7 11.4 4.1 99.6
Non-controlling interests (4.0) 0.1 (3.9)
NPAT 30.3 (122.5) (27.8) (62.4) (63.0) (13.2) (26.7) (17.4) (302.7)
Profit attributable to discontinued operations 66.3
Statutory Loss (236.4)

25
Operating Cash Flow ($m)

26
Balance Sheet - WIP reduction
Progress on WIP WIP Movement
• Good level of cash conversion in June
• Gross WIP reduced from $257m at31 December to $163m at 30 June
• WIP days at 30 June: 30 days

27
Balance Sheet - Change in accounting for unincorporated joint ventures (UJVs)
Background• UJV’s proportionally consolidated 2015• First year of material UJV impacts – previously equity accounted• Aligns with AASB 11 and industry peers
Impact on Balance Sheet• Increase of cash $91m• Decrease in net working capital balance of ($113m)
Balance Sheet 30 June 2015 ($m)Excl
UJV impactIncl UJVs
- StatutoryImpact
Cash and cash equivalents 74 165 91Trade and other receivables 214 233 19Inventories 227 245 18Investments (5) 17 22Property, plant and equipment 48 52 3Trade and other payables (265) (416) (151)Provisions (61) (63) (2)Other 202 202 -Net assets 435 435 -

28
Balance Sheet - Material items impacting net debt in H2 2015
Cash impact of material one-off items $m
Net (Debt) 31 Dec 2014 (63.0)DTZ Sale Costs (25.3)DTZ Final Proceeds 60.7DTZ Exit Costs (12.4)Claims Resolved 66.0Working Capital Movement (8.4)Ichthys CCPP (56.0)Restructure Costs (12.3)CAPEX (6.1)UJV cash 90.5Net Movement 96.7Net Cash 30 June 2015 33.7

29
Debt structure post refinancing
Maturity profile by years - $m
* Includes UJVs cash
Credit* metrics FY15 FY14
(Net cash)/Net debt ($m) (34) 567Net debt / (net debt + equity) - 32.4%Net debt / EBITDA - 2.4xInterest Cover 4.0 5.2x
Debt* and bonding facilities $m
Total facilities 381Drawn 131Cash 165(Net cash) (34)Available Facilities 250Total Liquidity 415
Bonding facilities $m
Total facilities 543Drawn 336Available facilities 207

30
Progress against FY16 priorities
Priorities Progress
Maintain lean overhead costbase
Leaner and more focused Corporate centre established withincreased functional responsibilities in Divisions
On track to realise $33m in annual overhead savings
Embed consistentstandardised commercialand project managementdisciplines
Enhanced risk and governance framework Commenced implementation of the UGL Way
• Modules rolled out over next 18 months• Priority on project management focused work streams
Execute well to maintaingross margin
Consolidated execution of higher risk projects within a singledivision under experienced leadership
Standardised project management reporting Financial delegations aligned to skills and capability Focus on strengthening project management capabilities Alignment of project team incentives to performance
Disciplined portfoliomanagement of businessesdriving capital allocationdecisions
Balance sheet distributed to Divisions Responsibility for cash flow management now with the
Divisions and down to the projects FY16 KPIs to measure return on capital as well as sales and
earnings performance
1
2
3
4

31
Order Book & PipelineRoss Taylor

32
Order Book
Order Book Over Time ($m) Order Book By Year ($m)

33
Order Book – recurring/project mix
All Years FY16
34
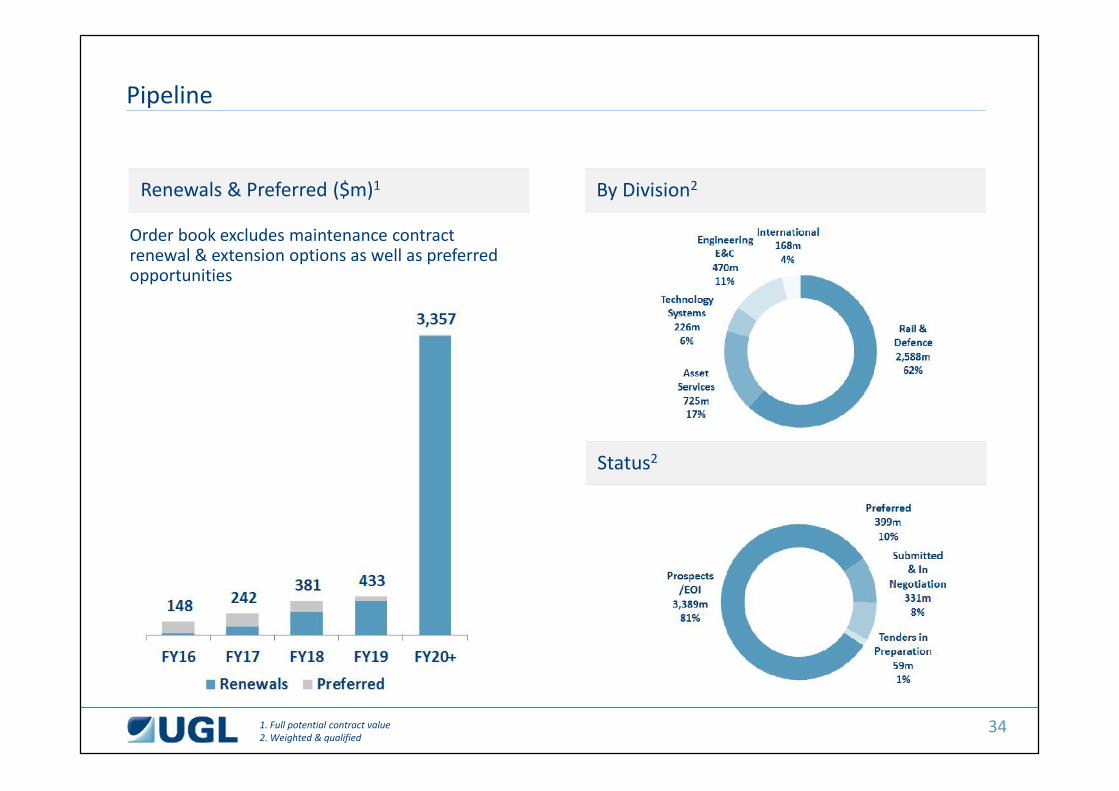
Pipeline
Renewals & Preferred ($m)1 By Division2
Order book excludes maintenance contractrenewal & extension options as well as preferredopportunities
Status2
1. Full potential contract value2. Weighted & qualified

OutlookRoss Taylor

36
Market outlook
• Diversity in revenue continues to provide balance against contraction in resources sector
• Overall markets remain competitive driven by excess capacity of service providers
• Subdued resources infrastructure and operations investment expected to continue in the medium term asresources clients retain strong focus on cost reduction and improved efficiencies
• Strong transport infrastructure opportunities supported by Government investment
Leading player in passenger rail maintenance
Proven O&M capability for privatised/franchised networks
Market leader in transport technology systems
Strong international OEM partners
• Growth in LNG maintenance as capex projects reach operational phase
Tier 1 maintenance services provider
Core base of LNG maintenance and shutdown work flow
Sufficient scale to maintain a permanent shut down crew providing competitive advantage
• Opportunities in adjacent markets such as distribution and renewables
Market leader in power systems with solid win rate
• Steady growth in waste water sector driven by conservation initiatives
Strong design capabilities and project delivery track record

37
Description• Complete project reviews and implement new initiatives
• Complete restructure of divisional and corporate overheads to right size thebusiness
• Focus on and reduce WIP balance
• Improve project gross margin delivery
• Convert identified pipeline opportunities
• Realise full run-rate of cost reduction initiatives implemented in FY15• Revenue $2.3 billion and EBIT margin increase to 3%
• Deliver average cash flow conversion of 100% of NPAT excluding Ichthys CCPP
• Revenue step change by at least $300m driven by exposure to transportinfrastructure and LNG maintenance
• Commencement of major contracts within Technology Systems and Asset Servicesdivisions
• Improvement in margin due to replacement of nil margin revenue with newprofitable contracts
• Profitable top line growth combined with lean overhead structure will see afurther EBIT margin improvement towards 4%
• Sustainable enterprise and industry leader
• Continue to seek opportunities for growth and value enhancement
Repositioned for improved performance from FY16
FY16Step 2:
Turnaround
FY17Step 3:
Step change
FY18 + beyondStep 4:Growth
FY15Step 1:Reset
Completed
On Track


Appendices

40
The new UGL Vision and strategic priorities
UGL VISION An industry disruptor that dominates the Australian market through theapplication of world leading technology and execution capabilities taking
the smartest solutions to our clients and sectors globally
UGL VISION
An industry disruptor that dominates the Australian market through the application ofworld leading technology and execution capabilities taking the smartest solutions to our
clients and sectors globally
UGL VISION
An industry disruptor that dominates theAustralian market through the applicationof world leading technology and executioncapabilities taking the smartest solutions
to our clients and sectors globally
STRATEGIC PRIORITIES
LEAD IN SAFETY AND SUSTAINABILITY
CONSISTENTLY DELIVER
BUILD A WORLD CLASSTALENT BASE
BUILD OUR PORTFOLIO STRENGTHSTHROUGH INNOVATION
DELIVER STRONG ECONOMICRETURNS FOR SHAREHOLDERS
BE THE PARTNEROF CHOICE

41
Major Contracts
Name Description DivisionOriginalValue ($m) Duration Contract type
UGL Unipart In JV with Unipart Rail, heavy maintenance andlogistics management services on 1,050 passengercars in Sydney’s passenger car fleet for Sydney Trains& Transport for NSW
Rail 1,400+$900mextensionoption
2012-2019+ 5 yearextensionoption
Schedule ofrates
Metro TrainsMelbourne
Operations and maintenance of Melbourne’spassenger train franchise
Rail 1,300excludingcapital works
2009-2017+ 7 yearextensionoption
Schedule ofrates
North WestRail Link
Design, build, finance and operate the new rapidtransit service as a member of the NRT consortium
Totalconsortiumcontract$3.7bn
• Design and deliver the tunnel systems, rolling stock,rail signalling and overall control systems in JV withMTR Corporation
TechnologySolutions
2015-2019 Lump sum
• Operations and maintenance of the service in JVwith MTR & John Holland
Rail 2019-2034 Schedule ofrates
Freightliner Maintenance of locomotives and wagons operatedby Freightliner Australia in the Hunter Valley
Rail 115 2010-2020 Schedule ofrates
Remaining contract value > $100 million

42
Major Contracts
Name Description DivisionOriginalValue ($m) Duration
Contracttype
Pacific National Upgrade and maintenance for a portion of the PacificNational Rail locomotive fleet
Rail 540 Maintenance:2013-2020Upgrade:2012-2016
Schedule ofratesLump sum
Ichthys SMP In JV with Kentz Corporation structural, mechanicaland piping construction package for the Ichthys LNGProject
E&C 370 2014-2017 Lump sum
Stanwell Facilities maintenance and management, overhaulsand project works across Stanwell’s coal, gas andhydro energy assets in Queensland
AssetServices
280 2014-2018+ potential forextension to 5years
Cost plus
Ichthys CCPPPower Station
Design, supply of the balance of plant and theconstruction of a combined cycle power plant for theIchthys LNG project
E&C 275 2012-2016 Lump sum
BP Operation and maintenance of BP’s 17 fuel terminalsacross Australia through a JV between UGL and BP
AssetServices
190 2015-2018+ 3 yearextension option
Schedule ofrates
ChevronMaintenance
Maintenance services for the operational phase ofChevron’s Western Australian assets
AssetServices
NA 2014-2019+ extensionoptions
Schedule ofrates
Remaining contract value > $100 million

43
Major Contracts
Name Description DivisionOriginalValue ($m) Duration
Contracttype
APLNG Downstream maintenance, shutdown andmodification project services for the operationalphase of the Curtis Island LNG Facility
AssetServices
NA 2015-2019 Schedule ofrates
GLNG Maintenance, shutdown, engineering and projectservices for Santos GLNG’s Curtis Island LNG facility
AssetServices
120 2015-2018+ extensionoptions up to 4years
Schedule ofrates
TangaraTechnologyUpgrade
In joint venture with Unipart Rail, technologyupgrade of fleet of 446 Tangara passenger railcars
Rail 131 2015-2018 Schedule ofrates
Remaining contract value > $100 million

44
New Contract Wins and Extensions
$2.1 billion in contract wins and renewals:
• Sydney Metro Northwest: $3.7bn operationscontract to be delivered by UGL as part of theNorthwest Rapid Transit Consortium [check nameof consortium?]
• APLNG: Multi-million dollar 4 year downstreammaintenance services contract
• GLNG: $120m 3 year downstream maintenanceservices contract
• BP: 3 year $190m operations and maintenancecontract across 17 BP fuel terminals
Post 30 June 2015 win:
• Tangara Technology Upgrade: $131m contractundertaken by UGL Unipart Rail for technologyupgrade of Tangara passenger rail fleet in Sydney

45
Order Book & Pipeline By Division
Order Book ($m) Pipeline ($m)

46
Order Book
By delivery structure ($m) By contract type ($m)