fullview - wind.nrel.gov · introduction tower 12131 western wind and solar integration study for...
TRANSCRIPT

FullViewW I N D A S S E S S M E N T Site Validation
Analysis
PROJECT DATE
Western Wind and Solar Integration Study January 20, 2009Tower 12131
FOR CONTACT
National Renewable Energy Laboratory
Copyright c!2009 3TIER, Inc.All rights reserved.

Introduction Tower 12131Western Wind and Solar Integration StudyFor National Renewable Energy Laboratory
. . . . . . . . . . . . . . . . . . . . . . . . . . . . . . . . . . . . . . . . . . . . . . . . . . . . . . . . . . . . . . . . . . . . . . . . . . . . . . . . . . . . . . . . . . . . . . . . . . . . . . . . . . . . . . . . . .
1 INTRODUCTION. . . . . . . . . . . . . . . . . . . . . . . . . . . . . . . . . . . . . . . . . . . . . . . . . . . . . . . . . . . . . . . . . . . . . . . . . . . . . . . . . . . . . . . . . . . . . . . . . . . . . . . . . . . . . . . . . . . . . . . . . . . . . . . . . . . . . . . .
3TIER has been retained by National Renewable Energy Laboratory (NREL) to assess the wind resource over the westernregion of the United States utilizing a numerical weather prediction (NWP) model. This report examines the quality ofthe NWP simulations used for that assessment at a single point within the study area. For this report, the observationswere taken at Tower 12131 in Idaho (latitude 42.06213, longitude !116.0782).
The average observed wind speed (for all valid observational times) at 20 meters during the 23 months of the period ofrecord (January, 2004 to November, 2005) is 5.90 m/s with an hourly standard deviation of 3.08 m/s at Tower 12131.This compares to a modeled 20m wind speed of 5.01 m/s with a 2.09 m/s standard deviation for these same times.
This report presents a comparison of the simulated winds with the observations at the reference tower. The focus of theverification is on the model’s ability to reproduce the observed variability of the wind resource at daily and monthly timescales, while preserving the distribution of hourly wind speeds and the diurnal characteristics of the wind.
c! 2009 3TIER, Inc.1

Contents Western Wind and Solar Integration StudyFor National Renewable Energy Laboratory
. . . . . . . . . . . . . . . . . . . . . . . . . . . . . . . . . . . . . . . . . . . . . . . . . . . . . . . . . . . . . . . . . . . . . . . . . . . . . . . . . . . . . . . . . . . . . . . . . . . . . . . . . . . . . . . . . .
Contents
1 Introduction 1
2 Model simulations by 3TIER 3
3 Validation of Model Results at Tower 12131 53.1 Observational Data . . . . . . . . . . . . . . . . . . . . . . . . . . . . . . . . . . . . . . . . . . . . . . . 53.2 Model validation statistics . . . . . . . . . . . . . . . . . . . . . . . . . . . . . . . . . . . . . . . . . . . . 53.3 Monthly-mean wind speed . . . . . . . . . . . . . . . . . . . . . . . . . . . . . . . . . . . . . . . . . . . 63.4 Wind speed distribution . . . . . . . . . . . . . . . . . . . . . . . . . . . . . . . . . . . . . . . . . . . . . 73.5 Wind direction distribution . . . . . . . . . . . . . . . . . . . . . . . . . . . . . . . . . . . . . . . . . . . 83.6 Diurnal variability of wind speed . . . . . . . . . . . . . . . . . . . . . . . . . . . . . . . . . . . . . . . . 113.7 Tabular data . . . . . . . . . . . . . . . . . . . . . . . . . . . . . . . . . . . . . . . . . . . . . . . . . . . 13
c! 2009 3TIER, Inc.2

Model Simulations Western Wind and Solar Integration StudyFor National Renewable Energy Laboratory
. . . . . . . . . . . . . . . . . . . . . . . . . . . . . . . . . . . . . . . . . . . . . . . . . . . . . . . . . . . . . . . . . . . . . . . . . . . . . . . . . . . . . . . . . . . . . . . . . . . . . . . . . . . . . . . . . .
2 MODEL SIMULATIONS BY 3TIER. . . . . . . . . . . . . . . . . . . . . . . . . . . . . . . . . . . . . . . . . . . . . . . . . . . . . . . . . . . . . . . . . . . . . . . . . . . . . . . . . . . . . . . . . . . . . . . . . . . . . . . . . . . . . . . . . . . . . . . . . . . . . . . . . . . . . . . .
The assessment of the wind resource across Western U.S. presented in this report is based on 23 months of simulated data(January, 2004 through November, 2005) using a regional nonhydrostatic primitive equation model of the atmosphere.
3TIER configured the NWP model using nested grids to simulate the wind resource over the Western U.S. region. Somedetails of the NWP configuration are shown below in Table 1. The extent of the coarsest grid was selected to capturethe e!ect of synoptic weather events on the wind resource at the site, as well as to allow the model to develop regional,thermally-driven circulations. The increasingly fine 54km, 18km, 6km and 2km grids were selected to model the e!ectof local terrain and local scale atmospheric circulations. A map of the meteorological towers used to validate the modelsimulations is shown in Figure 1.
A detailed discussion of the model’s ability to recreate the observed winds at Tower 12131 is contained in Section 3.
Parameter ValueMesoscale numerical weather prediction model WRFHorizontal resolution of valid study area 2kmNumber of vertical levels 37Elevation data base 3 second SRTMVegetation data base 30 second USGSSoil classification 30 second USGSSurface parameterization Monin-Obukhov similarity modelBoundary layer parameterization YSU model (MRF with entrainment)Land surface scheme 5-layer soil di!usivity model
Table 1: Numerical weather prediction model configuration
c! 2009 3TIER, Inc.3

!

Validation Tower 12131Western Wind and Solar Integration StudyFor National Renewable Energy Laboratory
. . . . . . . . . . . . . . . . . . . . . . . . . . . . . . . . . . . . . . . . . . . . . . . . . . . . . . . . . . . . . . . . . . . . . . . . . . . . . . . . . . . . . . . . . . . . . . . . . . . . . . . . . . . . . . . . . .
3 VALIDATION OF MODEL RESULTS AT TOWER 12131. . . . . . . . . . . . . . . . . . . . . . . . . . . . . . . . . . . . . . . . . . . . . . . . . . . . . . . . . . . . . . . . . . . . . . . . . . . . . . . . . . . . . . . . . . . . . . . . . . . . . . . . . . . . . . . . . . . . . . . . . . . . . . . . . . . . . . . .
3.1 Observational Data
Approximately 23 months of data (January, 2004 to November, 2005) from a 20m meteorological tower (Tower 12131) atWestern U.S. were used in this analysis. This tower will be referred to as the reference tower throughout this report. Thedata at 20m were used to assess the quality of the model simulations at 20m.
The observed and modeled wind speeds shown in this section represent the mean of all times during the month for which avalid wind speed observation was available. Therefore they should not be interpreted as estimates of the true wind speedsat the site, but rather a verification of the model’s ability to reproduce the available observed wind speeds. Any month orhour missing greater than 50% of the available observations is omitted from the following figures, tables, and statistics.
It should be noted that meteorological observations provided to 3TIER are not allowed to influence the raw model simu-lations.
3.2 Model validation statistics
Table 2 presents some basic statistical measures of the model performance relative to the measured winds at the referencetower during the observational period. For reference, the correlation (r) of the reference tower data to itself is perfect andhence the explained variance (r2) value is 1.0.
Comparison ValueCorrelation of monthly-mean simulated wind speed to observed 0.72RMS error of monthly-mean simulated wind speed 0.94 m/sCorrelation of daily-mean simulated wind speed to observed 0.68RMS error of daily-mean simulated wind speed 1.83 m/s
Table 2: Correlation (r) and root mean square (RMS) error statistics of modeled wind speeds.
c! 2009 3TIER, Inc.5
Validation Tower 12131Western Wind and Solar Integration StudyFor National Renewable Energy Laboratory
. . . . . . . . . . . . . . . . . . . . . . . . . . . . . . . . . . . . . . . . . . . . . . . . . . . . . . . . . . . . . . . . . . . . . . . . . . . . . . . . . . . . . . . . . . . . . . . . . . . . . . . . . . . . . . . . . .
3.3 Monthly-mean wind speed
1 3 5 7 9 11 1 3 5 7 9 11
Month2004 2005
3
4
5
6
7
8
9
Win
d Sp
eed
(m/s
)
ObservedSimulated, r2 = 0.51
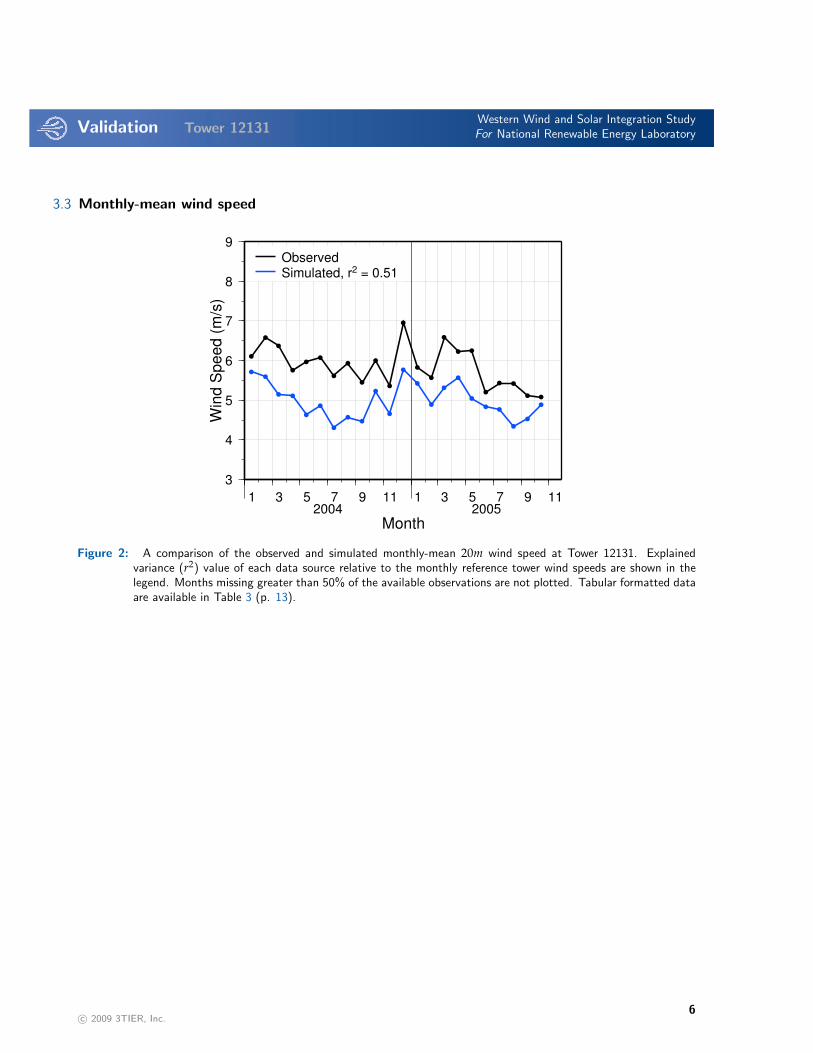
Figure 2: A comparison of the observed and simulated monthly-mean 20m wind speed at Tower 12131. Explainedvariance (r2) value of each data source relative to the monthly reference tower wind speeds are shown in thelegend. Months missing greater than 50% of the available observations are not plotted. Tabular formatted dataare available in Table 3 (p. 13).
c! 2009 3TIER, Inc.6
Validation Tower 12131Western Wind and Solar Integration StudyFor National Renewable Energy Laboratory
. . . . . . . . . . . . . . . . . . . . . . . . . . . . . . . . . . . . . . . . . . . . . . . . . . . . . . . . . . . . . . . . . . . . . . . . . . . . . . . . . . . . . . . . . . . . . . . . . . . . . . . . . . . . . . . . . .
3.4 Wind speed distribution
0 2 4 6 8 10 12 14 16 18 2002468
10121416182022
Freq
uenc
y (%
)
Observed: A=6.66, k=1.99
0 2 4 6 8 10 12 14 16 18 2002468
10121416182022
Freq
uenc
y (%
)
Simulated: A=5.64, k=2.55
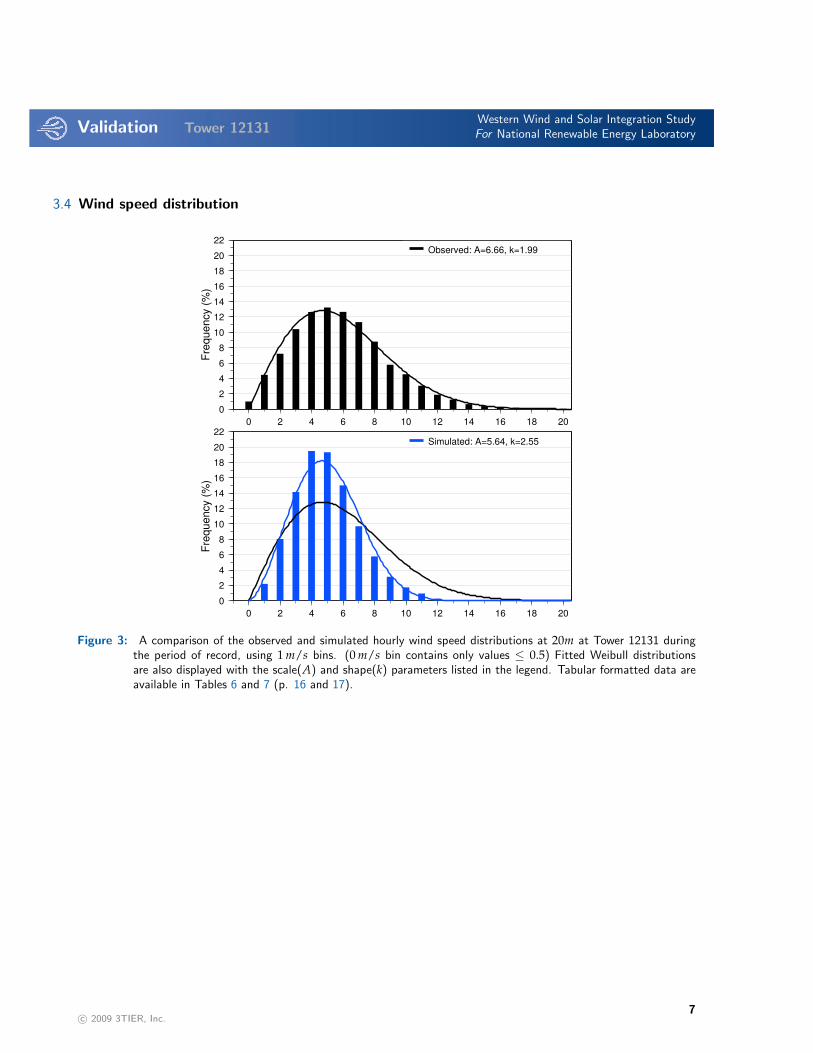
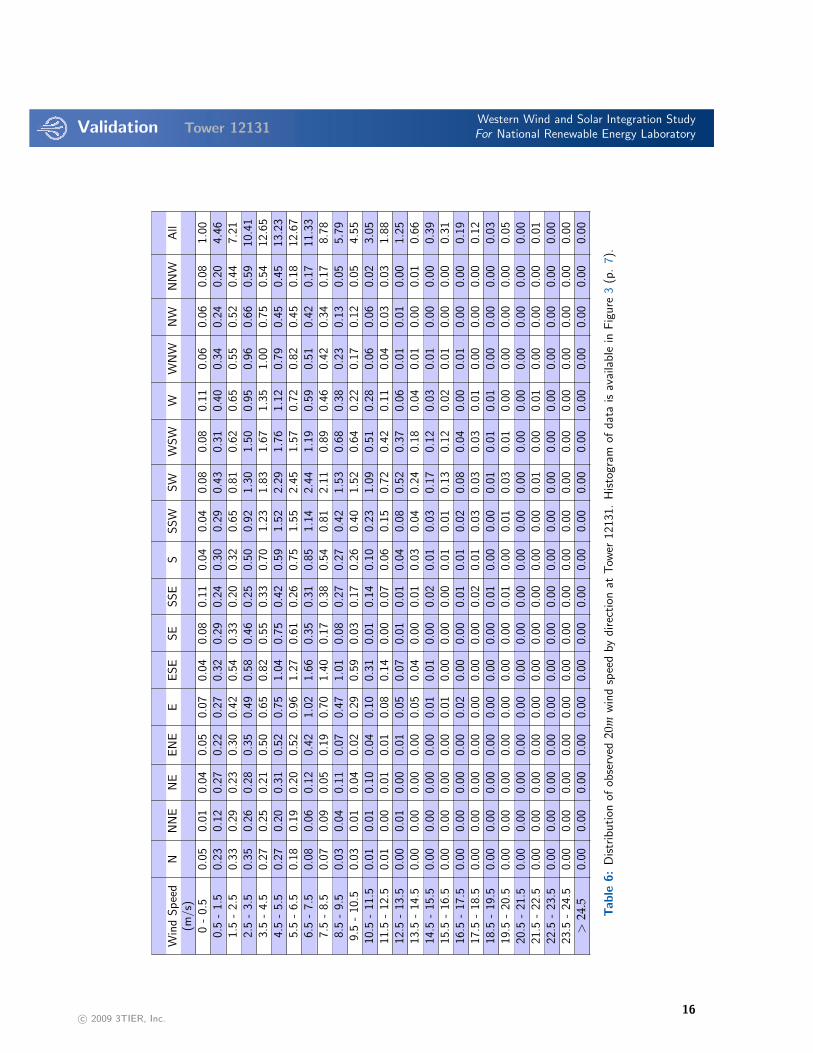
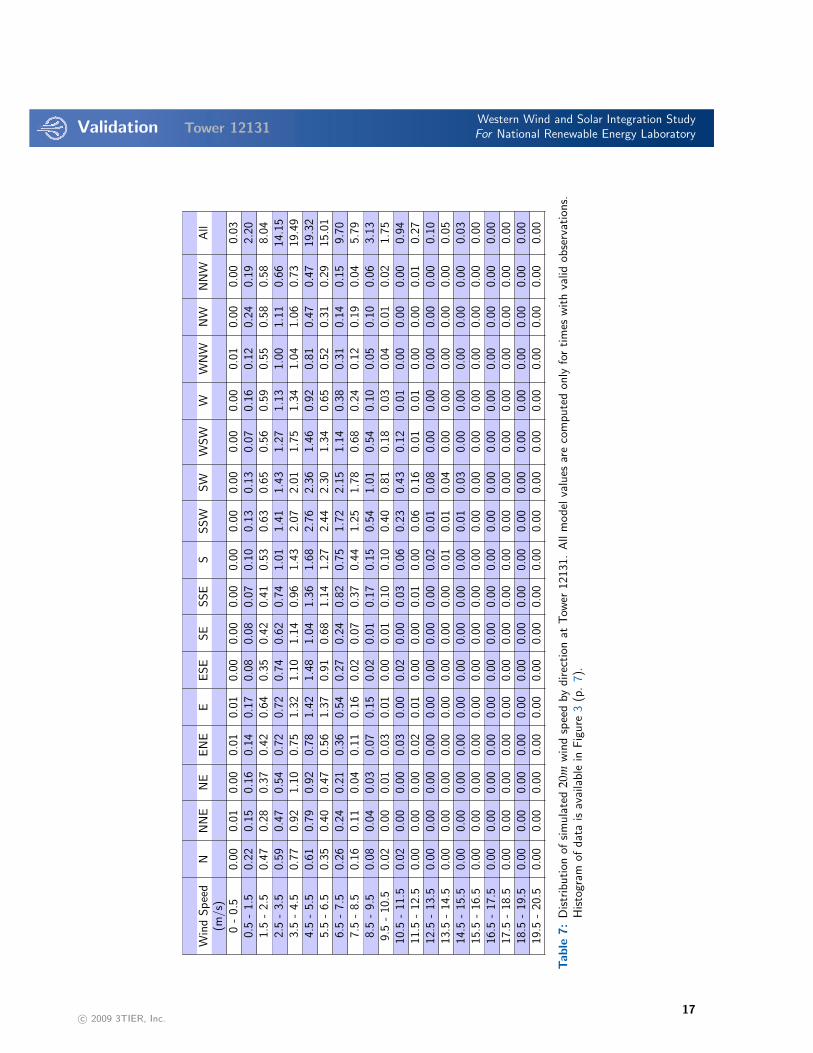
Figure 3: A comparison of the observed and simulated hourly wind speed distributions at 20m at Tower 12131 duringthe period of record, using 1 m/s bins. (0 m/s bin contains only values ! 0.5) Fitted Weibull distributionsare also displayed with the scale(A) and shape(k) parameters listed in the legend. Tabular formatted data areavailable in Tables 6 and 7 (p. 16 and 17).
c! 2009 3TIER, Inc.7
Validation Tower 12131Western Wind and Solar Integration StudyFor National Renewable Energy Laboratory
. . . . . . . . . . . . . . . . . . . . . . . . . . . . . . . . . . . . . . . . . . . . . . . . . . . . . . . . . . . . . . . . . . . . . . . . . . . . . . . . . . . . . . . . . . . . . . . . . . . . . . . . . . . . . . . . . .
3.5 Wind direction distribution
Observed
S 10 %
EW
N
S 10 %
EW
N
SW
NW
SE
NE
Simulated
S 10 %
EW
N
S 10 %
EW
N
SW
NW
SE
NE
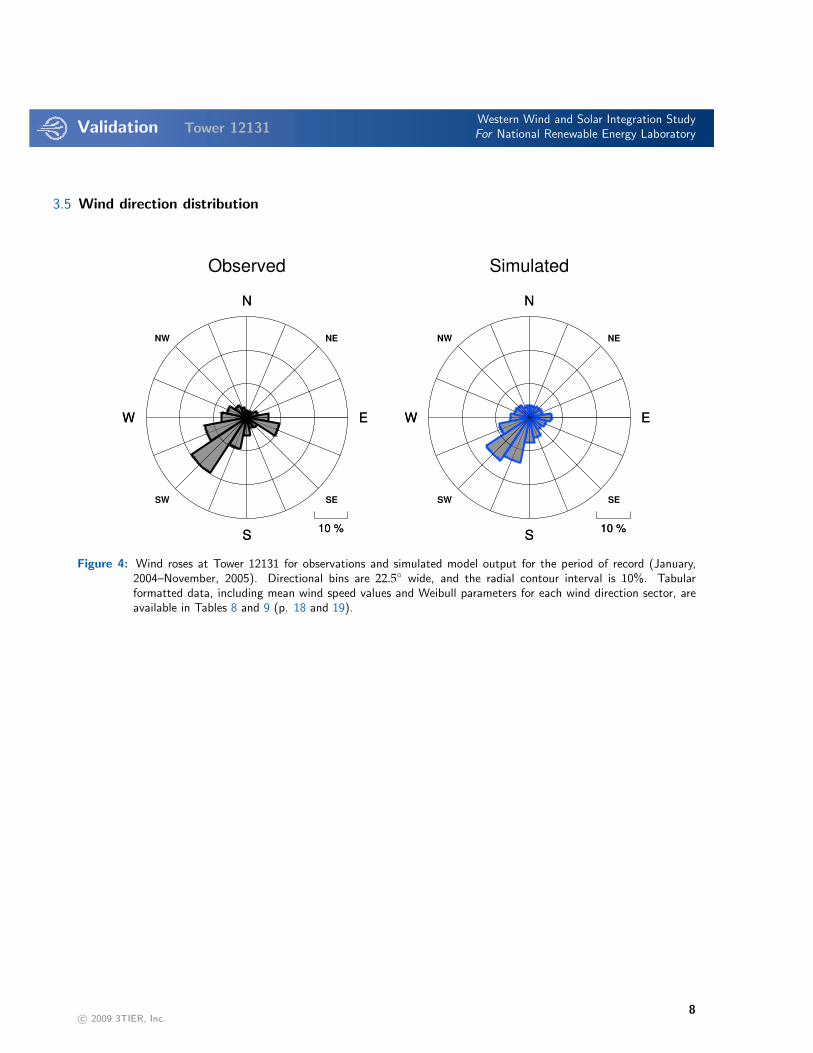
Figure 4: Wind roses at Tower 12131 for observations and simulated model output for the period of record (January,2004–November, 2005). Directional bins are 22.5! wide, and the radial contour interval is 10%. Tabularformatted data, including mean wind speed values and Weibull parameters for each wind direction sector, areavailable in Tables 8 and 9 (p. 18 and 19).
c! 2009 3TIER, Inc.8

Validation Tower 12131Western Wind and Solar Integration StudyFor National Renewable Energy Laboratory
. . . . . . . . . . . . . . . . . . . . . . . . . . . . . . . . . . . . . . . . . . . . . . . . . . . . . . . . . . . . . . . . . . . . . . . . . . . . . . . . . . . . . . . . . . . . . . . . . . . . . . . . . . . . . . . . . .
S 10 %
EW
NOctober
S 10 %
EW
N
S 10 %
EW
NNovember
S 10 %
EW
N
S 10 %
EW
NDecember
S 10 %
EW
NS 10 %
EW
NJuly
S 10 %
EW
N
S 10 %
EW
NAugust
S 10 %
EW
N
S 10 %
EW
NSeptember
S 10 %
EW
NS 10 %
EW
NApril
S 10 %
EW
N
S 10 %
EW
NMay
S 10 %
EW
N
S 10 %
EW
NJune
S 10 %
EW
NS 10 %
EW
NJanuary
S 10 %
EW
N
S 10 %
EW
NFebruary
S 10 %
EW
N
S 10 %
EW
NMarch
S 10 %
EW
N
Figure 5: Wind rose of observed wind direction at Tower 12131 for each month. Directional bins are 22.5! wide, and theradial contour interval is 0.1, i.e. 10%.
c! 2009 3TIER, Inc.9

Validation Tower 12131Western Wind and Solar Integration StudyFor National Renewable Energy Laboratory
. . . . . . . . . . . . . . . . . . . . . . . . . . . . . . . . . . . . . . . . . . . . . . . . . . . . . . . . . . . . . . . . . . . . . . . . . . . . . . . . . . . . . . . . . . . . . . . . . . . . . . . . . . . . . . . . . .
S 10 %
EW
NOctober
S 10 %
EW
N
S 10 %
EW
NNovember
S 10 %
EW
N
S 10 %
EW
NDecember
S 10 %
EW
NS 10 %
EW
NJuly
S 10 %
EW
N
S 10 %
EW
NAugust
S 10 %
EW
N
S 10 %
EW
NSeptember
S 10 %
EW
NS 10 %
EW
NApril
S 10 %
EW
N
S 10 %
EW
NMay
S 10 %
EW
N
S 10 %
EW
NJune
S 10 %
EW
NS 10 %
EW
NJanuary
S 10 %
EW
N
S 10 %
EW
NFebruary
S 10 %
EW
N
S 10 %
EW
NMarch
S 10 %
EW
N
Figure 6: Wind rose of simulated wind direction at Tower 12131 for each month. Directional bins are 22.5! wide, andthe radial contour interval is 0.1, i.e. 10%.
c! 2009 3TIER, Inc.10

Validation Tower 12131Western Wind and Solar Integration StudyFor National Renewable Energy Laboratory
. . . . . . . . . . . . . . . . . . . . . . . . . . . . . . . . . . . . . . . . . . . . . . . . . . . . . . . . . . . . . . . . . . . . . . . . . . . . . . . . . . . . . . . . . . . . . . . . . . . . . . . . . . . . . . . . . .
3.6 Diurnal variability of wind speed
0 4 8 12 16 20 24Hour of Day (UTC)
3
4
5
6
7
8
Win
d Sp
eed
(m/s
)
ObservedSimulated
Figure 7: A comparison of the diurnal cycle of observed and simulated 20m wind speed at Tower 12131. Data areaveraged over the period of record (January, 2004–November, 2005). Hours missing greater than 50% of theavailable observations are not plotted. Tabular formatted data are available in Tables 4 and 5 (p. 14 and 15).
Time Zone UTC O!set 24-hour TimeHawaii !10:00 14:00 Sun 20:00 Sun 02:00 Mon 08:00 Mon 13:00 Mon
US Pacific !08:00 16:00 Sun 22:00 Sun 04:00 Mon 10:00 Mon 15:00 MonUS Eastern !05:00 19:00 Sun 01:00 Mon 07:00 Mon 13:00 Mon 18:00 Mon
Brazil Eastern !03:00 21:00 Sun 03:00 Mon 09:00 Mon 15:00 Mon 20:00 MonUTC/GMT ±00:00 00:00 Mon 06:00 Mon 12:00 Mon 18:00 Mon 23:00 Mon
Central European +01:00 01:00 Mon 07:00 Mon 13:00 Mon 19:00 Mon 00:00 TuesIndia +05:30 05:30 Mon 11:30 Mon 17:30 Mon 23:30 Mon 04:30 TuesChina +08:00 08:00 Mon 14:00 Mon 20:00 Mon 02:00 Tues 07:00 Tues
Australia Eastern +10:00 10:00 Mon 16:00 Mon 22:00 Mon 04:00 Tues 09:00 Tues
All times in this report are in Coordinated Universal Standard Time (UTC), also known as Greenwich Mean Time (GMT).This table can be used to convert from UTC to Local Standard Time for the time zones listed above. To change toDaylight Savings Time, add +1 hour. For example, at 00:00 UTC on Monday, the local standard time in the US Easterntime zone is 19:00 on Sunday.
c! 2009 3TIER, Inc.11

Validation Tower 12131Western Wind and Solar Integration StudyFor National Renewable Energy Laboratory
. . . . . . . . . . . . . . . . . . . . . . . . . . . . . . . . . . . . . . . . . . . . . . . . . . . . . . . . . . . . . . . . . . . . . . . . . . . . . . . . . . . . . . . . . . . . . . . . . . . . . . . . . . . . . . . . . .
January
0 4 8 12 16 20 24345678
Win
d Sp
eed
(m/s
)
February
0 4 8 12 16 20 24345678
March
0 4 8 12 16 20 24345678
April
0 4 8 12 16 20 24345678
Win
d Sp
eed
(m/s
)
May
0 4 8 12 16 20 24345678
June
0 4 8 12 16 20 24345678
July
0 4 8 12 16 20 24345678
Win
d Sp
eed
(m/s
)
August
0 4 8 12 16 20 24345678
September
0 4 8 12 16 20 24345678
October
0 4 8 12 16 20 24Hour of Day (UTC)
345678
Win
d Sp
eed
(m/s
)
November
0 4 8 12 16 20 24Hour of Day (UTC)
345678
Observed Simulated
December
0 4 8 12 16 20 24Hour of Day (UTC)
345678
Figure 8: A comparison of the diurnal cycle of observed and simulated 20m wind speed for each month at Tower 12131.Hours missing greater than 50% of the available observations are not plotted. Tabular formatted data areavailable in Tables 4 and 5 (p. 14 and 15).
c! 2009 3TIER, Inc.12

Validation Tower 12131Western Wind and Solar Integration StudyFor National Renewable Energy Laboratory
. . . . . . . . . . . . . . . . . . . . . . . . . . . . . . . . . . . . . . . . . . . . . . . . . . . . . . . . . . . . . . . . . . . . . . . . . . . . . . . . . . . . . . . . . . . . . . . . . . . . . . . . . . . . . . . . . .
3.7 Tabular data
Month Observed Simulated Bias Availability(%)
01/2004 6.11 5.71 -0.39 90.102/2004 6.58 5.59 -0.99 92.403/2004 6.37 5.15 -1.22 95.704/2004 5.76 5.11 -0.65 96.805/2004 5.97 4.63 -1.34 96.506/2004 6.07 4.86 -1.21 99.407/2004 5.61 4.30 -1.31 99.608/2004 5.93 4.57 -1.36 98.909/2004 5.45 4.47 -0.98 98.610/2004 6.00 5.23 -0.77 97.211/2004 5.36 4.66 -0.70 92.512/2004 6.95 5.77 -1.19 98.501/2005 5.83 5.42 -0.40 83.102/2005 5.57 4.89 -0.68 89.603/2005 6.59 5.31 -1.27 96.004/2005 6.23 5.57 -0.66 93.805/2005 6.25 5.04 -1.21 99.606/2005 5.20 4.83 -0.37 99.307/2005 5.43 4.77 -0.67 99.508/2005 5.42 4.34 -1.08 98.909/2005 5.11 4.53 -0.59 98.210/2005 5.08 4.89 -0.19 94.911/2005 8.88 7.47 -1.41 30.8
All 5.90 5.01 -0.89 93.0
Table 3: Monthly-mean 20m wind speeds (m/s) at Tower 12131. Time series graph of data is available in Figure 2 (p.6).
Observed = mean of all available wind speed observationsSimulated = mean of simulated model output for times with observationsBias = Simulated ! Observed
c! 2009 3TIER, Inc.13

Validation Tower 12131Western Wind and Solar Integration StudyFor National Renewable Energy Laboratory
. . . . . . . . . . . . . . . . . . . . . . . . . . . . . . . . . . . . . . . . . . . . . . . . . . . . . . . . . . . . . . . . . . . . . . . . . . . . . . . . . . . . . . . . . . . . . . . . . . . . . . . . . . . . . . . . . .
Observations
Hour
of D
ay (U
TC)
0123456789
1011121314151617181920212223
AvgJan
Jan
Feb
Feb
Mar
Mar
Apr
Apr
May
May
Jun
Jun
Jly
Jly
Aug
Aug
Sep
Sep
Oct
Oct
Nov
Nov
Dec
Dec
Avg
Avg6.175.875.855.525.745.775.895.896.346.496.416.216.326.135.925.525.485.625.675.916.146.236.166.185.97
6.336.356.446.516.005.996.196.005.865.535.705.935.555.405.465.825.746.055.966.566.766.616.726.886.09
6.866.716.976.536.266.006.015.686.005.906.036.426.356.326.536.596.256.296.446.697.117.037.237.216.48
6.936.926.105.985.175.415.476.076.035.835.675.645.305.905.535.545.555.516.125.936.176.467.117.145.99
6.796.776.326.355.795.805.965.935.665.445.865.635.595.715.565.345.725.845.946.486.686.977.177.356.11
5.826.316.306.105.615.726.066.116.225.935.474.995.195.135.214.985.274.964.965.105.435.696.276.435.64
6.256.406.236.166.326.886.997.016.486.045.645.495.355.275.234.493.953.944.094.354.274.515.066.095.52
5.215.595.656.115.946.566.666.896.496.135.855.875.755.665.235.025.004.984.944.885.025.245.545.935.68
6.406.646.375.875.575.125.254.824.824.924.654.715.124.744.764.864.554.354.805.155.265.536.066.305.28
5.765.775.875.445.565.595.305.344.835.365.415.495.575.435.215.375.295.225.525.645.855.976.106.125.55
7.236.676.386.246.336.306.295.915.685.565.815.535.545.385.656.085.745.836.206.536.887.537.087.406.24
7.077.026.787.037.337.176.856.806.936.906.716.726.907.247.117.117.226.686.756.576.727.087.007.146.95
6.346.386.256.115.905.976.046.025.905.795.725.685.665.635.555.475.395.355.535.735.956.146.416.635.90
3 4 5 6 7 8Wind Speed
m/s
Table 4: Hourly-mean values of observed 20m wind speed at Tower 12131. Hours missing greater than 50% of theavailable observations are not plotted. Time series graphs are available in Figures 7 and 8 (p. 11 and 12).
c! 2009 3TIER, Inc.14
Validation Tower 12131Western Wind and Solar Integration StudyFor National Renewable Energy Laboratory
. . . . . . . . . . . . . . . . . . . . . . . . . . . . . . . . . . . . . . . . . . . . . . . . . . . . . . . . . . . . . . . . . . . . . . . . . . . . . . . . . . . . . . . . . . . . . . . . . . . . . . . . . . . . . . . . . .
Simulated
Hour
of D
ay (U
TC)
0123456789
1011121314151617181920212223
AvgJan
Jan
Feb
Feb
Mar
Mar
Apr
Apr
May
May
Jun
Jun
Jly
Jly
Aug
Aug
Sep
Sep
Oct
Oct
Nov
Nov
Dec
Dec
Avg
Avg5.295.595.775.905.915.955.855.815.715.755.615.645.655.655.465.405.465.295.235.495.565.435.195.175.57
5.495.345.355.295.215.245.305.325.315.315.255.095.175.165.155.094.955.045.155.325.385.395.315.545.25
5.775.405.115.065.095.015.055.115.105.024.914.824.764.834.804.894.865.195.555.585.765.895.925.925.23
6.265.745.204.964.614.774.854.994.854.784.814.754.834.874.905.065.285.585.805.946.086.276.276.265.33
5.815.725.184.634.624.444.304.284.404.254.294.244.224.204.104.284.554.835.135.405.705.765.885.934.84
5.785.624.944.554.574.524.464.474.384.304.434.334.414.264.064.144.424.795.105.425.695.865.815.914.85
5.415.164.804.704.524.584.514.454.164.284.264.234.154.133.763.593.614.044.384.755.065.305.355.634.53
5.094.924.494.444.624.564.474.294.204.294.374.324.244.183.973.743.813.974.214.544.854.995.075.184.45
5.144.814.314.334.334.094.114.204.274.224.224.154.214.294.214.164.134.344.674.935.135.155.155.264.50
5.335.265.185.145.185.245.265.235.145.255.065.004.984.904.754.844.534.734.965.055.225.084.985.115.06
5.675.675.825.975.785.795.845.815.745.485.165.065.044.874.814.844.844.915.085.175.285.235.155.465.36
5.525.785.825.885.825.946.006.096.035.975.665.685.675.815.775.885.955.715.605.635.655.595.505.485.77
5.555.395.104.994.954.934.914.914.844.824.774.714.714.704.574.584.634.815.035.255.445.505.485.585.01
3 4 5 6 7Wind Speed
m/s
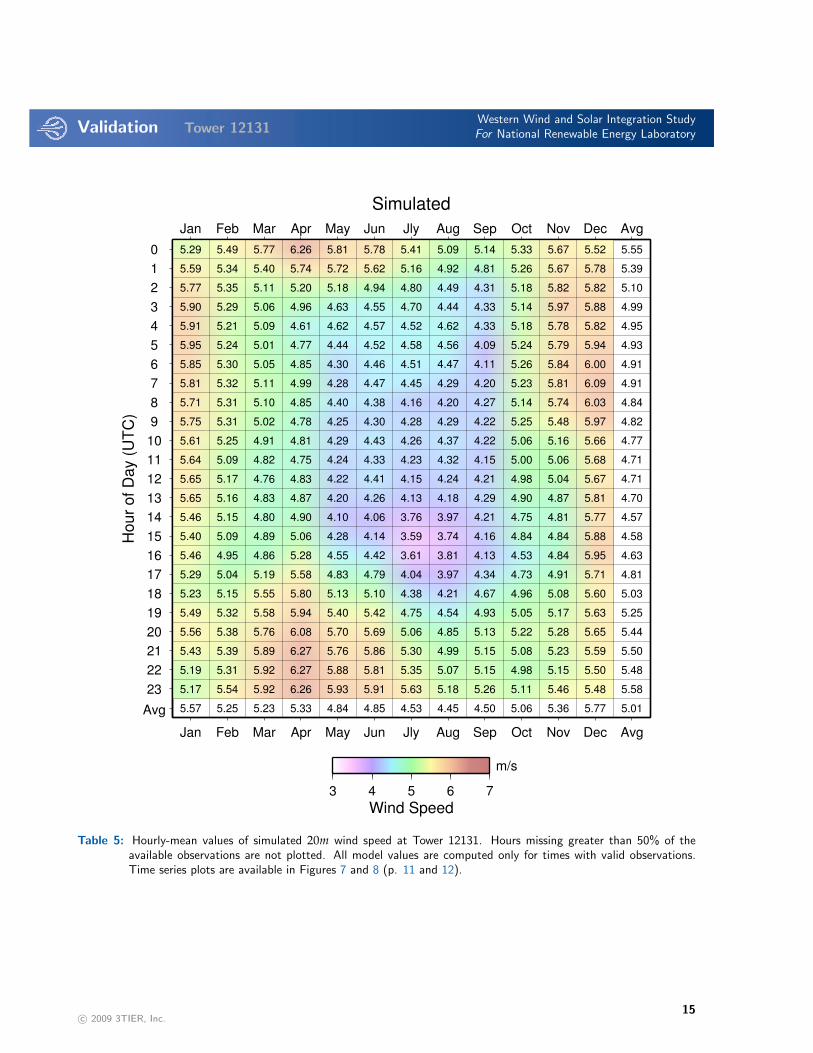
Table 5: Hourly-mean values of simulated 20m wind speed at Tower 12131. Hours missing greater than 50% of theavailable observations are not plotted. All model values are computed only for times with valid observations.Time series plots are available in Figures 7 and 8 (p. 11 and 12).
c! 2009 3TIER, Inc.15
Validation Tower 12131Western Wind and Solar Integration StudyFor National Renewable Energy Laboratory
. . . . . . . . . . . . . . . . . . . . . . . . . . . . . . . . . . . . . . . . . . . . . . . . . . . . . . . . . . . . . . . . . . . . . . . . . . . . . . . . . . . . . . . . . . . . . . . . . . . . . . . . . . . . . . . . . .
Win
dSpee
dN
NN
EN
EEN
EE
ESE
SE
SSE
SSSW
SW
WSW
WW
NW
NW
NN
WA
ll(m
/s)
0-
0.5
0.05
0.01
0.04
0.05
0.07
0.04
0.08
0.11
0.04
0.04
0.08
0.08
0.11
0.06
0.06
0.08
1.00
0.5
-1.
50.
230.
120.
270.
220.
270.
320.
290.
240.
300.
290.
430.
310.
400.
340.
240.
204.
461.
5-
2.5
0.33
0.29
0.23
0.30
0.42
0.54
0.33
0.20
0.32
0.65
0.81
0.62
0.65
0.55
0.52
0.44
7.21
2.5
-3.
50.
350.
260.
280.
350.
490.
580.
460.
250.
500.
921.
301.
500.
950.
960.
660.
5910
.41
3.5
-4.
50.
270.
250.
210.
500.
650.
820.
550.
330.
701.
231.
831.
671.
351.
000.
750.
5412
.65
4.5
-5.
50.
270.
200.
310.
520.
751.
040.
750.
420.
591.
522.
291.
761.
120.
790.
450.
4513
.23
5.5
-6.
50.
180.
190.
200.
520.
961.
270.
610.
260.
751.
552.
451.
570.
720.
820.
450.
1812
.67
6.5
-7.
50.
080.
060.
120.
421.
021.
660.
350.
310.
851.
142.
441.
190.
590.
510.
420.
1711
.33
7.5
-8.
50.
070.
090.
050.
190.
701.
400.
170.
380.
540.
812.
110.
890.
460.
420.
340.
178.
788.
5-
9.5
0.03
0.04
0.11
0.07
0.47
1.01
0.08
0.27
0.27
0.42
1.53
0.68
0.38
0.23
0.13
0.05
5.79
9.5
-10
.50.
030.
010.
040.
020.
290.
590.
030.
170.
260.
401.
520.
640.
220.
170.
120.
054.
5510
.5-
11.5
0.01
0.01
0.10
0.04
0.10
0.31
0.01
0.14
0.10
0.23
1.09
0.51
0.28
0.06
0.06
0.02
3.05
11.5
-12
.50.
010.
000.
010.
010.
080.
140.
000.
070.
060.
150.
720.
420.
110.
040.
030.
031.
8812
.5-
13.5
0.00
0.01
0.00
0.01
0.05
0.07
0.01
0.01
0.04
0.08
0.52
0.37
0.06
0.01
0.01
0.00
1.25
13.5
-14
.50.
000.
000.
000.
000.
050.
040.
000.
010.
030.
040.
240.
180.
040.
010.
000.
010.
6614
.5-
15.5
0.00
0.00
0.00
0.00
0.01
0.01
0.00
0.02
0.01
0.03
0.17
0.12
0.03
0.01
0.00
0.00
0.39
15.5
-16
.50.
000.
000.
000.
000.
010.
000.
000.
000.
010.
010.
130.
120.
020.
010.
000.
000.
3116
.5-
17.5
0.00
0.00
0.00
0.00
0.02
0.00
0.00
0.01
0.01
0.02
0.08
0.04
0.00
0.01
0.00
0.00
0.19
17.5
-18
.50.
000.
000.
000.
000.
000.
000.
000.
020.
010.
030.
030.
030.
010.
000.
000.
000.
1218
.5-
19.5
0.00
0.00
0.00
0.00
0.00
0.00
0.00
0.01
0.00
0.00
0.01
0.01
0.01
0.00
0.00
0.00
0.03
19.5
-20
.50.
000.
000.
000.
000.
000.
000.
000.
010.
000.
010.
030.
010.
000.
000.
000.
000.
0520
.5-
21.5
0.00
0.00
0.00
0.00
0.00
0.00
0.00
0.00
0.00
0.00
0.00
0.00
0.00
0.00
0.00
0.00
0.00
21.5
-22
.50.
000.
000.
000.
000.
000.
000.
000.
000.
000.
000.
010.
000.
010.
000.
000.
000.
0122
.5-
23.5
0.00
0.00
0.00
0.00
0.00
0.00
0.00
0.00
0.00
0.00
0.00
0.00
0.00
0.00
0.00
0.00
0.00
23.5
-24
.50.
000.
000.
000.
000.
000.
000.
000.
000.
000.
000.
000.
000.
000.
000.
000.
000.
00>
24.5
0.00
0.00
0.00
0.00
0.00
0.00
0.00
0.00
0.00
0.00
0.00
0.00
0.00
0.00
0.00
0.00
0.00
Tab
le6:
Distr
ibut
ion
ofob
serv
ed20
mw
ind
spee
dby
dire
ctio
nat
Tow
er12
131.
Histo
gram
ofda
tais
avai
labl
ein
Fig
ure
3(p
.7)
.
c! 2009 3TIER, Inc.16
Validation Tower 12131Western Wind and Solar Integration StudyFor National Renewable Energy Laboratory
. . . . . . . . . . . . . . . . . . . . . . . . . . . . . . . . . . . . . . . . . . . . . . . . . . . . . . . . . . . . . . . . . . . . . . . . . . . . . . . . . . . . . . . . . . . . . . . . . . . . . . . . . . . . . . . . . .
Win
dSpee
dN
NN
EN
EEN
EE
ESE
SE
SSE
SSSW
SW
WSW
WW
NW
NW
NN
WA
ll(m
/s)
0-
0.5
0.00
0.01
0.00
0.01
0.01
0.00
0.00
0.00
0.00
0.00
0.00
0.00
0.00
0.01
0.00
0.00
0.03
0.5
-1.
50.
220.
150.
160.
140.
170.
080.
080.
070.
100.
130.
130.
070.
160.
120.
240.
192.
201.
5-
2.5
0.47
0.28
0.37
0.42
0.64
0.35
0.42
0.41
0.53
0.63
0.65
0.56
0.59
0.55
0.58
0.58
8.04
2.5
-3.
50.
590.
470.
540.
720.
720.
740.
620.
741.
011.
411.
431.
271.
131.
001.
110.
6614
.15
3.5
-4.
50.
770.
921.
100.
751.
321.
101.
140.
961.
432.
072.
011.
751.
341.
041.
060.
7319
.49
4.5
-5.
50.
610.
790.
920.
781.
421.
481.
041.
361.
682.
762.
361.
460.
920.
810.
470.
4719
.32
5.5
-6.
50.
350.
400.
470.
561.
370.
910.
681.
141.
272.
442.
301.
340.
650.
520.
310.
2915
.01
6.5
-7.
50.
260.
240.
210.
360.
540.
270.
240.
820.
751.
722.
151.
140.
380.
310.
140.
159.
707.
5-
8.5
0.16
0.11
0.04
0.11
0.16
0.02
0.07
0.37
0.44
1.25
1.78
0.68
0.24
0.12
0.19
0.04
5.79
8.5
-9.
50.
080.
040.
030.
070.
150.
020.
010.
170.
150.
541.
010.
540.
100.
050.
100.
063.
139.
5-
10.5
0.02
0.00
0.01
0.03
0.01
0.00
0.01
0.10
0.10
0.40
0.81
0.18
0.03
0.04
0.01
0.02
1.75
10.5
-11
.50.
020.
000.
000.
030.
000.
020.
000.
030.
060.
230.
430.
120.
010.
000.
000.
000.
9411
.5-
12.5
0.00
0.00
0.00
0.02
0.01
0.00
0.00
0.01
0.00
0.06
0.16
0.01
0.01
0.00
0.00
0.01
0.27
12.5
-13
.50.
000.
000.
000.
000.
000.
000.
000.
000.
020.
010.
080.
000.
000.
000.
000.
000.
1013
.5-
14.5
0.00
0.00
0.00
0.00
0.00
0.00
0.00
0.00
0.01
0.01
0.04
0.00
0.00
0.00
0.00
0.00
0.05
14.5
-15
.50.
000.
000.
000.
000.
000.
000.
000.
000.
000.
010.
030.
000.
000.
000.
000.
000.
0315
.5-
16.5
0.00
0.00
0.00
0.00
0.00
0.00
0.00
0.00
0.00
0.00
0.00
0.00
0.00
0.00
0.00
0.00
0.00
16.5
-17
.50.
000.
000.
000.
000.
000.
000.
000.
000.
000.
000.
000.
000.
000.
000.
000.
000.
0017
.5-
18.5
0.00
0.00
0.00
0.00
0.00
0.00
0.00
0.00
0.00
0.00
0.00
0.00
0.00
0.00
0.00
0.00
0.00
18.5
-19
.50.
000.
000.
000.
000.
000.
000.
000.
000.
000.
000.
000.
000.
000.
000.
000.
000.
0019
.5-
20.5
0.00
0.00
0.00
0.00
0.00
0.00
0.00
0.00
0.00
0.00
0.00
0.00
0.00
0.00
0.00
0.00
0.00
Tab
le7:
Distr
ibut
ion
ofsim
ulat
ed20
mw
ind
spee
dby
dire
ctio
nat
Tow
er12
131.
All
mod
elva
lues
are
com
pute
don
lyfo
rtim
esw
ith
valid
obse
rvat
ions
.H
isto
gram
ofda
tais
avai
labl
ein
Fig
ure
3(p
.7)
.
c! 2009 3TIER, Inc.17

Validation Tower 12131Western Wind and Solar Integration StudyFor National Renewable Energy Laboratory
. . . . . . . . . . . . . . . . . . . . . . . . . . . . . . . . . . . . . . . . . . . . . . . . . . . . . . . . . . . . . . . . . . . . . . . . . . . . . . . . . . . . . . . . . . . . . . . . . . . . . . . . . . . . . . . . . .
Sector Mean Speed(m/s) Weibull Scale(A) Weibull Shape(k) Frequency(%)
N 3.88 4.35 1.77 1.92NNE 4.16 4.69 1.94 1.52NE 4.58 5.11 1.62 1.97ENE 4.81 5.43 2.18 3.22E 6.02 6.80 2.23 6.39
ESE 6.48 7.29 2.63 9.81SE 4.57 5.16 2.16 3.71SSE 6.04 6.77 1.69 3.24S 5.79 6.54 2.10 5.40
SSW 5.88 6.64 2.16 9.57SW 7.09 8.00 2.27 19.81
WSW 6.47 7.30 1.98 12.72W 5.36 6.04 1.82 7.51
WNW 4.96 5.60 1.99 5.99NW 4.80 5.42 2.00 4.23
NNW 4.21 4.74 1.84 2.99ALL 5.90 6.66 1.99 100.0
Table 8: Observed 20m mean wind speed, Weibull parameters, and frequency at Tower 12131. Blank values correspondto times with less than 10 data points. Wind rose of data is available in Figure 4 (p. 8).
c! 2009 3TIER, Inc.18

Validation Tower 12131Western Wind and Solar Integration StudyFor National Renewable Energy Laboratory
. . . . . . . . . . . . . . . . . . . . . . . . . . . . . . . . . . . . . . . . . . . . . . . . . . . . . . . . . . . . . . . . . . . . . . . . . . . . . . . . . . . . . . . . . . . . . . . . . . . . . . . . . . . . . . . . . .
Sector Mean Speed(m/s) Weibull Scale(A) Weibull Shape(k) Frequency(%)
N 4.31 4.87 2.31 3.55NNE 4.40 4.94 2.85 3.40NE 4.27 4.78 2.97 3.85ENE 4.56 5.14 2.45 4.00E 4.73 5.30 2.98 6.51
ESE 4.55 5.07 3.43 4.98SE 4.41 4.92 3.27 4.32SSE 5.20 5.83 2.94 6.18S 5.03 5.65 2.77 7.54
SSW 5.63 6.31 2.86 13.64SW 6.14 6.90 2.72 15.36
WSW 5.36 6.02 2.75 9.11W 4.42 4.97 2.58 5.57
WNW 4.29 4.83 2.63 4.56NW 3.98 4.49 2.28 4.22
NNW 3.93 4.44 2.27 3.21ALL 5.01 5.64 2.55 100.0
Table 9: Simulated 20m mean wind speed, Weibull parameters, and frequency at Tower 12131. All model values arecomputed only for times with valid observations; blank values correspond to times with less than 10 data points.Wind rose of data is available in Figure 4 (p. 8).
c! 2009 3TIER, Inc.19