function for an expert piloting system (eps) for piloted ...1)_0.pdffor piloted and autonomous air...
TRANSCRIPT
NASA Aeronautics Research Institute
Development of a “where-to-land” decision function for an expert piloting system (EPS)
for piloted and autonomous air vehicles (Phase I Results)
NASA Aeronautics Research Mission Directorate (ARMD)
FY12 Seedling Phase I Technical Seminar
July 9-11, 2013

NASA Aeronautics Research Institute
Team Members
• Loyd Hook (PI) – NASA DFRC
• Matt Redifer – NASA DFRC
• Prof. Claire Tomlin – University of California Berkeley
• Jerry Ding – University of California Berkeley
July 9-11, 2013 NASA Aeronautics Research Mission Directorate FY12 Seedling Phase I Technical Seminar 2
NASA Aeronautics Research Institute
Outline
•Background
•Innovations
•Technical approach
•Phase I results
•Development process and next steps
July 9-11, 2013 NASA Aeronautics Research Mission Directorate FY12 Seedling Phase I Technical Seminar 3
NASA Aeronautics Research Institute
Background - EPS
July 9-11, 2013 NASA Aeronautics Research Mission Directorate FY12 Seedling Phase I Technical Seminar 4
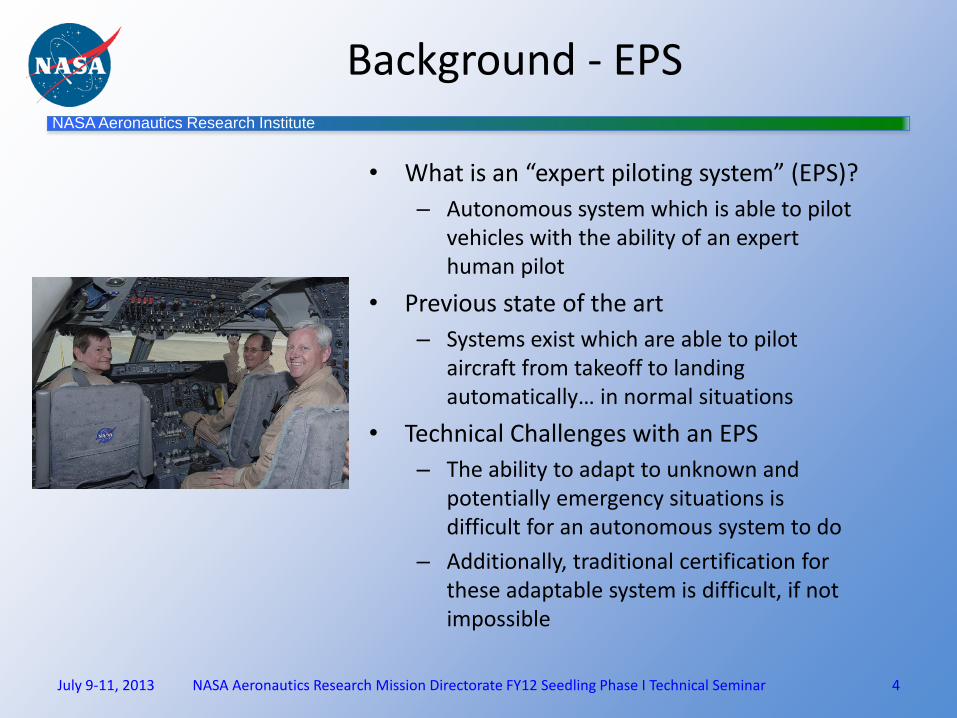
• What is an “expert piloting system” (EPS)?
– Autonomous system which is able to pilot vehicles with the ability of an expert human pilot
• Previous state of the art
– Systems exist which are able to pilot aircraft from takeoff to landing automatically… in normal situations
• Technical Challenges with an EPS
– The ability to adapt to unknown and potentially emergency situations is difficult for an autonomous system to do
– Additionally, traditional certification for these adaptable system is difficult, if not impossible
NASA Aeronautics Research Institute
Background – An EPS function
July 9–11, 2013 NASA Aeronautics Research Mission Directorate FY12 Seedling Phase I Technical Seminar 5
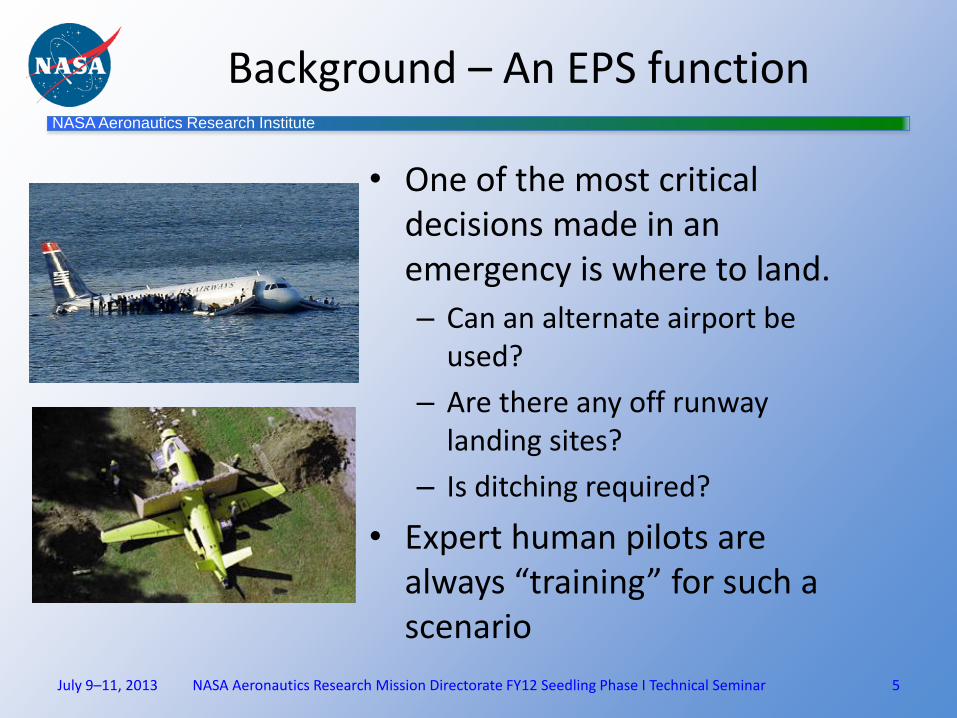
• One of the most critical decisions made in an emergency is where to land.
– Can an alternate airport be used?
– Are there any off runway landing sites?
– Is ditching required?
• Expert human pilots are always “training” for such a scenario
NASA Aeronautics Research Institute
Innovations – Automate WTL function
July 9–11, 2013 NASA Aeronautics Research Mission Directorate FY12 Seedling Phase I Technical Seminar 6
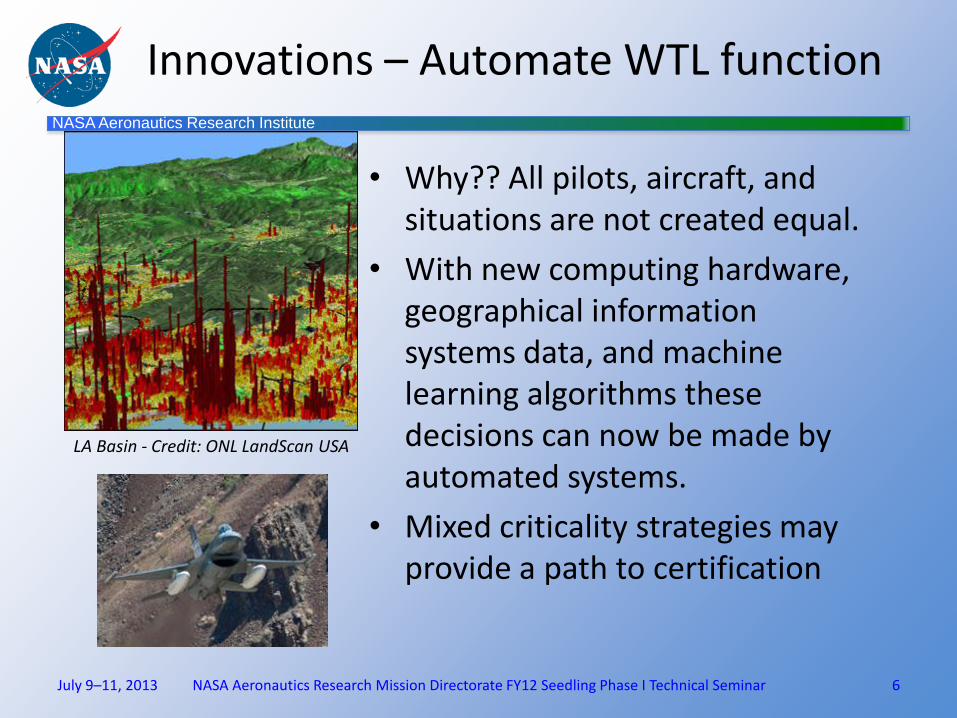
• Why?? All pilots, aircraft, and situations are not created equal.
• With new computing hardware, geographical information systems data, and machine learning algorithms these decisions can now be made by automated systems.
• Mixed criticality strategies may provide a path to certification
LA Basin - Credit: ONL LandScan USA

NASA Aeronautics Research Institute
Innovations – WTL function
July 9–11, 2013 NASA Aeronautics Research Mission Directorate FY12 Seedling Phase I Technical Seminar 7
• Sense Need– Determine need for emergency landing and what type of landing (Health monitoring, vehicle state)
• Decide – Minimize the potential loss for the chosen landing selection (Where to land decision function algorithms)
• Actuate – Perform landing in location selected (Auto landing system, route planning, adaptive control)
Actuate
Autonomous decision process
Decide Sense Need
NASA Aeronautics Research Institute
Technical Approach
July 9–11, 2013 NASA Aeronautics Research Mission Directorate FY12 Seedling Phase I Technical Seminar 8

NASA Aeronautics Research Institute
Target scenarios
July 9–11, 2013 NASA Aeronautics Research Mission Directorate FY12 Seedling Phase I Technical Seminar 9
• Nearest airfield algorithms currently exist.
• WTL decision function development targets emergencies scenarios which require:
– land as soon as possible
– land immediately
– and crash smartly categories.
• Landing category determination comes from health monitoring function (what type of fault, aircraft state, etc)
Landing Category Description Notes
Land as soon as practical Land at nearest airfield Currently available determination of nearest airfield available in current GPS systems
Land as soon as possible Land when/where probability of zero loss is greater than 80% (for instance)
Category may change into land immediately if conditions for acceptable landing site are not found. Preplanning activities should limit this possibility.
Land immediately Minimize combined expected loss in the immediate area
Preplanning activities should limit expected loss to a predefined limit.
Crash smartly (UAV only) Minimize loss on the ground only Failure conditions on inexpensive UAVs may always call for this landing category

NASA Aeronautics Research Institute
Decision function objective
July 9–11, 2013 NASA Aeronautics Research Mission Directorate FY12 Seedling Phase I Technical Seminar 10
• The WTL decision function will select an emergency landing site which minimizes predicted on and off vehicle losses given: – the emergency landing category
– aircraft state
– aircraft capabilities
– geographical and population data
NASA Aeronautics Research Institute
Decision function components
July 9–11, 2013 NASA Aeronautics Research Mission Directorate FY12 Seedling Phase I Technical Seminar 11
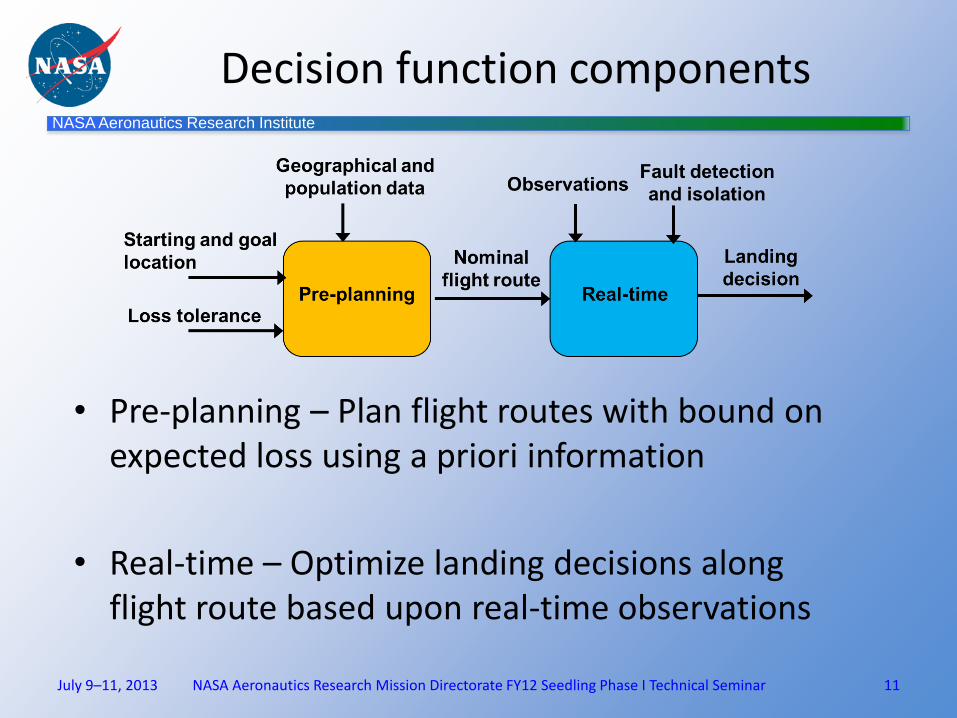
• Pre-planning – Plan flight routes with bound on expected loss using a priori information
• Real-time – Optimize landing decisions along flight route based upon real-time observations
NASA Aeronautics Research Institute
Emergency landing model
July 9–11, 2013 NASA Aeronautics Research Mission Directorate FY12 Seedling Phase I Technical Seminar 12
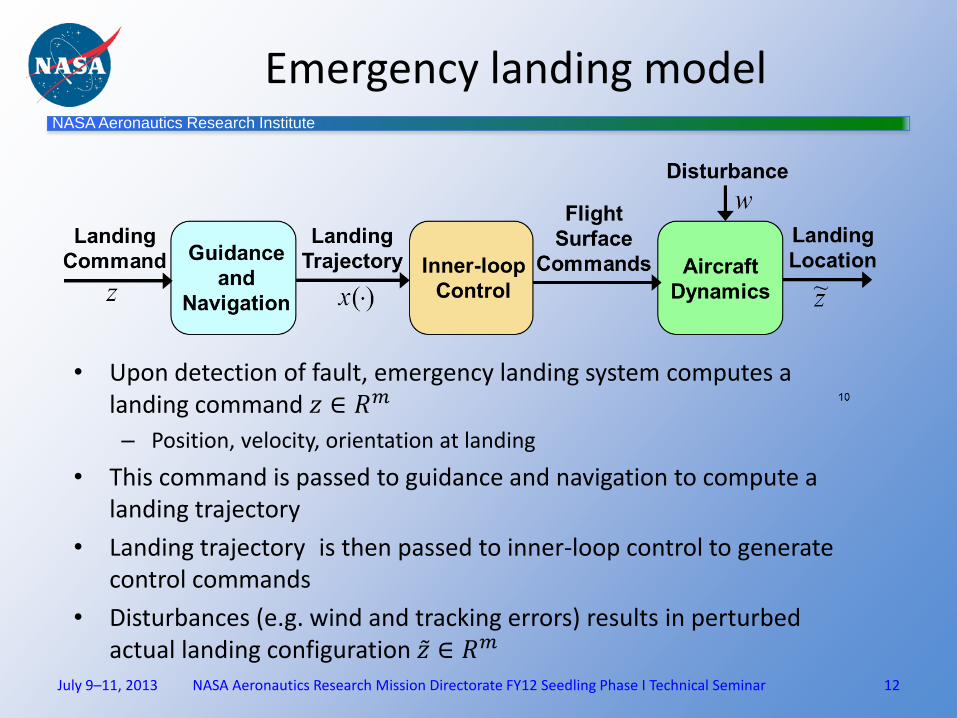
• Upon detection of fault, emergency landing system computes a landing command 𝑧 ∈ 𝑅𝑚
– Position, velocity, orientation at landing
• This command is passed to guidance and navigation to compute a landing trajectory
• Landing trajectory is then passed to inner-loop control to generate control commands
• Disturbances (e.g. wind and tracking errors) results in perturbed actual landing configuration 𝑧 ∈ 𝑅𝑚
NASA Aeronautics Research Institute
Loss model
July 9–11, 2013 NASA Aeronautics Research Mission Directorate FY12 Seedling Phase I Technical Seminar 13
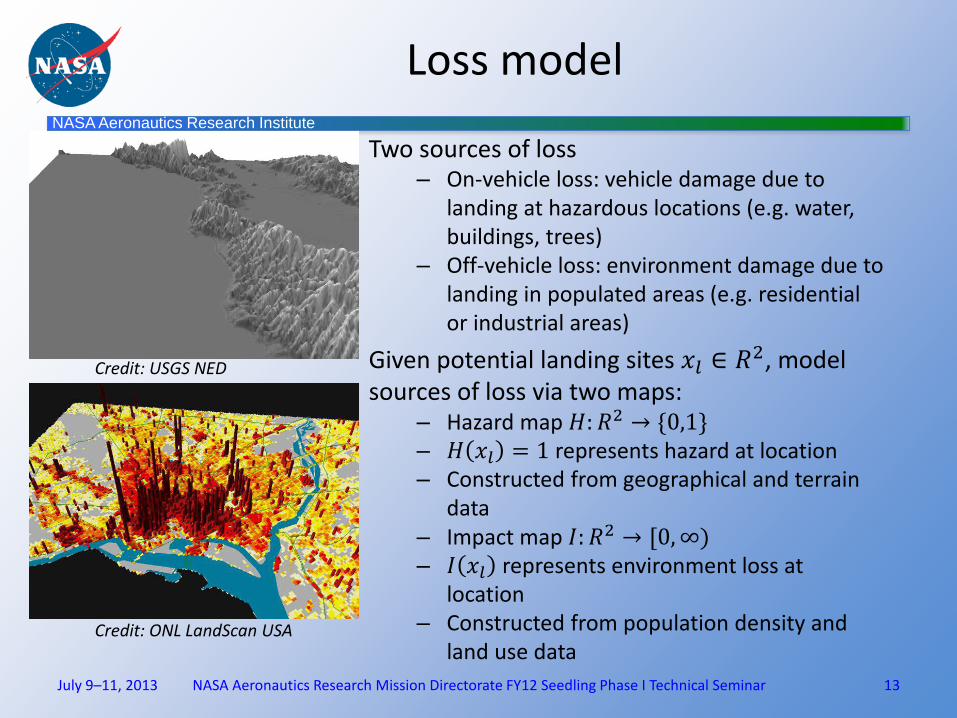
Two sources of loss – On-vehicle loss: vehicle damage due to
landing at hazardous locations (e.g. water, buildings, trees)
– Off-vehicle loss: environment damage due to landing in populated areas (e.g. residential or industrial areas)
Given potential landing sites 𝑥𝑙 ∈ 𝑅2, model sources of loss via two maps:
– Hazard map 𝐻:𝑅2 → *0,1+ – 𝐻 𝑥𝑙 = 1 represents hazard at location – Constructed from geographical and terrain
data – Impact map 𝐼: 𝑅2 → ,0,∞) – 𝐼 𝑥𝑙 represents environment loss at
location – Constructed from population density and
land use data
Credit: ONL LandScan USA
Credit: USGS NED
NASA Aeronautics Research Institute
Computing expected loss
• Aggregate loss is sum of on and off vehicle loss over emergency landing area (given a specific fault)
– Vehicle loss incurs cost C if landing area contains a hazard, as defined by the hazard map 𝐻.
– Environment loss modeled by integration of impact map
• This function is then minimized to provide the optimal landing command
• The optimal landing command is then used to provide an expected loss for each fault and compared to pre-defined maximum allowable loss to produce acceptable pre-planned flight routes.
July 9–11, 2013 NASA Aeronautics Research Mission Directorate FY12 Seedling Phase I Technical Seminar 14

NASA Aeronautics Research Institute
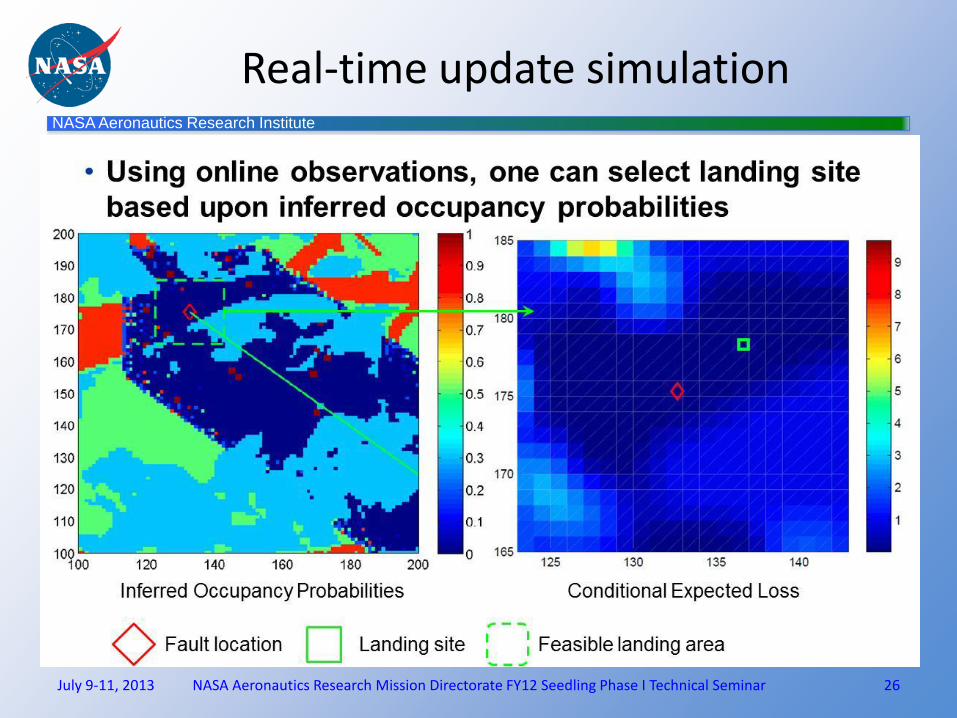
Real-time updates of impact and hazard map
July 9-11, 2013 NASA Aeronautics Research Mission Directorate FY12 Seedling Phase I Technical Seminar 15
• Impact and hazard maps will be based on information which may be old and/or at too coarse a resolution to provide optimal landing locations
• Real-time updates using sensors such as cameras, radar, laser, etc provides a method to update these maps on the fly
• Real-time updates allow the system to truly act as an expert pilot would

NASA Aeronautics Research Institute
Simulation Results
July 9–11, 2013 NASA Aeronautics Research Mission Directorate FY12 Seedling Phase I Technical Seminar 16

NASA Aeronautics Research Institute
Simulation scenario
July 9–11, 2013 NASA Aeronautics Research Mission Directorate FY12 Seedling Phase I Technical Seminar 17
• Consider planning domain as section of UC Berkeley campus
• Assume vehicle to be quad-rotor helicopter, flying at height of 25m above ground
• Model failure mode as 10% loss of vertical thrust
Courtesy of Google Maps - ©2013 Google

NASA Aeronautics Research Institute
Construction of impact map
July 9–11, 2013 NASA Aeronautics Research Mission Directorate FY12 Seedling Phase I Technical Seminar 18
• Impact map 𝐼 𝑥 : 𝑅2 → ,0,5-
– Buildings: 5 unit cost per 1m2 area
– Roads and parking lots: 3 unit cost per 1m2 area
– Grass: 0.5 unit cost per 1m2 area
– Trees: 0 unit cost per 1m2 area

NASA Aeronautics Research Institute
Construction of hazard map
July 9–11, 2013 NASA Aeronautics Research Mission Directorate FY12 Seedling Phase I Technical Seminar 19
• Hazard map 𝐻 𝑥 : 𝑅2 → *0,1+
– Vehicle loss assigned unit cost
NASA Aeronautics Research Institute
Aggregate losses map
July 9–11, 2013 NASA Aeronautics Research Mission Directorate FY12 Seedling Phase I Technical Seminar 20
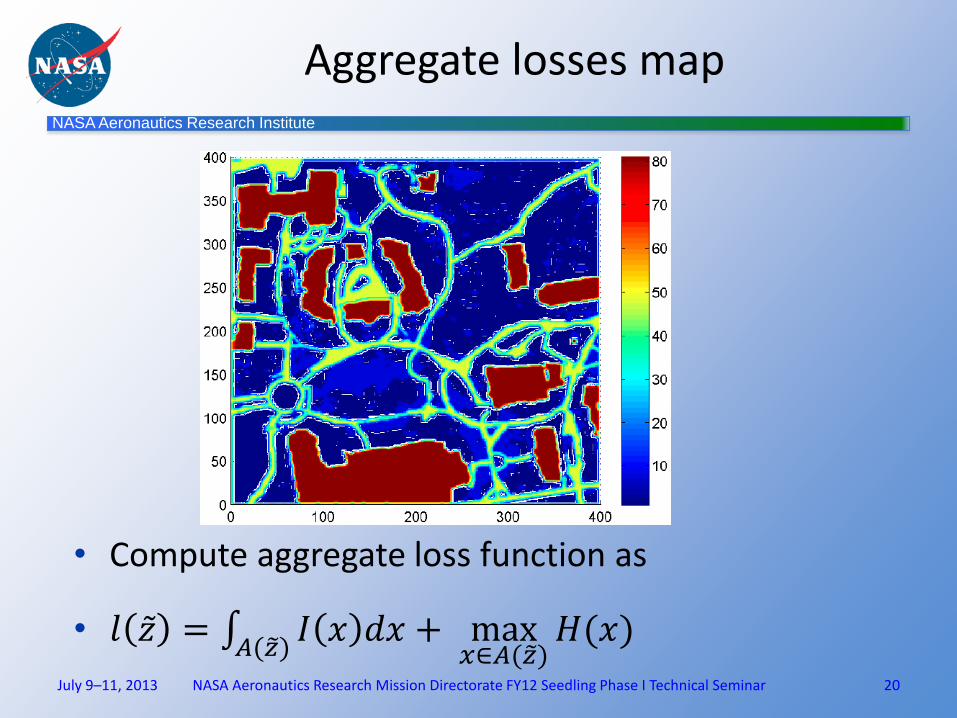
• Compute aggregate loss function as
• 𝑙 𝑧 = 𝐼 𝑥 𝑑𝑥𝐴(𝑧 )
+ max𝑥∈𝐴(𝑧 )
𝐻(𝑥)

NASA Aeronautics Research Institute
Minimal expected loss
July 9–11, 2013 NASA Aeronautics Research Mission Directorate FY12 Seedling Phase I Technical Seminar 21
• For a fault causing a 10% loss of thrust
• At flying height of 25m
NASA Aeronautics Research Institute
Pre-planning safe flying spaces
July 9–11, 2013 NASA Aeronautics Research Mission Directorate FY12 Seedling Phase I Technical Seminar 22
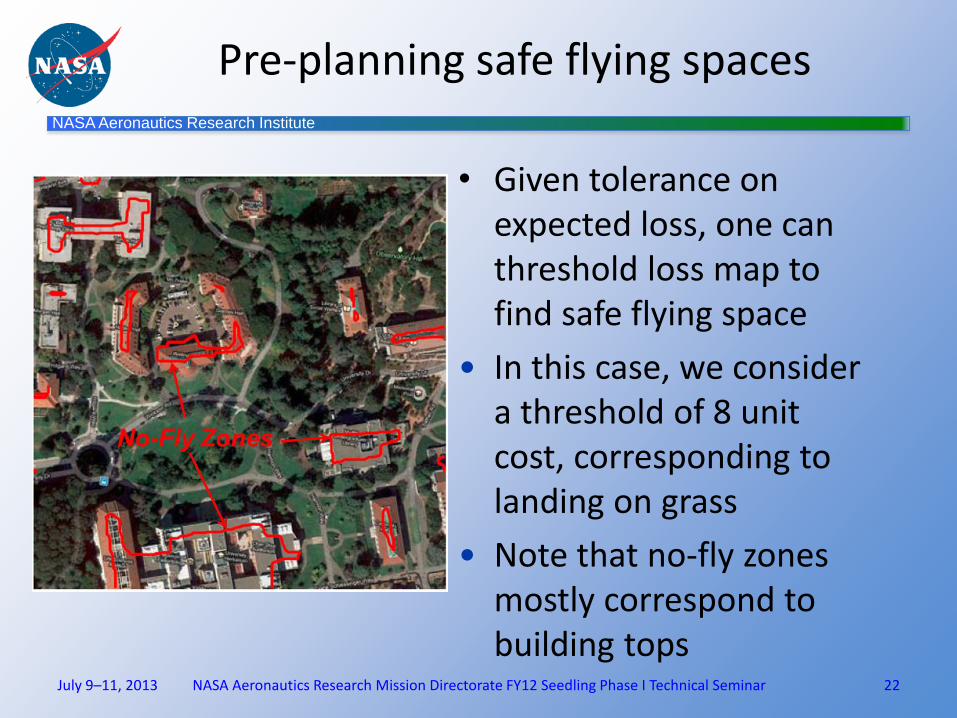
• Given tolerance on expected loss, one can threshold loss map to find safe flying space
• In this case, we consider a threshold of 8 unit cost, corresponding to landing on grass
• Note that no-fly zones mostly correspond to building tops

NASA Aeronautics Research Institute
Flight route planning
July 9–11, 2013 NASA Aeronautics Research Mission Directorate FY12 Seedling Phase I Technical Seminar 23
23
Contour Plot of Time to Reach Function
Initial location
Goal location
Flight path

NASA Aeronautics Research Institute
Emergency landing simulation
July 9–11, 2013 NASA Aeronautics Research Mission Directorate FY12 Seedling Phase I Technical Seminar 24

NASA Aeronautics Research Institute
Emergency landing
July 9-11, 2013 NASA Aeronautics Research Mission Directorate FY12 Seedling Phase I Technical Seminar 25
NASA Aeronautics Research Institute
Real-time update simulation
July 9-11, 2013 NASA Aeronautics Research Mission Directorate FY12 Seedling Phase I Technical Seminar 26

NASA Aeronautics Research Institute
Flight test results
Scheduled 7/15 – 7/31
July 9-11, 2013 NASA Aeronautics Research Mission Directorate FY12 Seedling Phase I Technical Seminar 27

NASA Aeronautics Research Institute
Development process and next steps
July 9-11, 2013 NASA Aeronautics Research Mission Directorate FY12 Seedling Phase I Technical Seminar 28

NASA Aeronautics Research Institute
Fully automatic emergency landing system
Automatically initiated advisory, manually piloted system
Real-time updated advisory functions integrated onto glass cockpit, FMS
Pre-planning and pre-computed advisory functions integrated onto GPS, electric flight bags
Development process and outputs
July 9-11, 2013 NASA Aeronautics Research Mission Directorate FY12 Seedling Phase I Technical Seminar 29
IV III II I
Phase Phase Phase Phase
Algorithm Development Actual: • Geo maps Simulated: • Real-time
Sensors • Health
monitoring • Faults
Real-time sensor development Actual: • Geo maps • Real-time
Sensors Simulated: • Health
monitoring • Faults
Faults and monitoring development Actual: • Geo maps • Sensors • Health
monitoring • Faults
Full autopilot integration (adaptable controls??)
OUTPUTS

NASA Aeronautics Research Institute
Immediate next steps
July 9–11, 2013 NASA Aeronautics Research Mission Directorate FY12 Seedling Phase I Technical Seminar 30
• Automatic map generation process using multiple data types – Processing of geographical, population, and building type
information to automatically construct impact and hazard maps
• Real-time sensor development – Cameras, lasers
– Computing hardware
• Online update and optimization – Incorporation of object detection algorithms
– Accounting for moving objects and people
• Real-world experimentation with real-time updates – Selection of experiment location and hardware
– Performing flight tests on subscale vehicles

NASA Aeronautics Research Institute
Conclusion
• Background and project innovations
• System architecture
– Pre-planning: Performance assurance through expected loss computation
– Real-time update: Adaptation of landing decisions to onboard sensing
• Models and algorithms
– Vehicle landing models
– Generation of expected loss maps
– Planning safe flight routes
– Real-time optimization of landing decisions
• Simulation studies using area of UC Berkeley campus
• Development process and next steps
– Multi-phased approach to autonomous WTL operation
July 9–11, 2013 NASA Aeronautics Research Mission Directorate FY12 Seedling Phase I Technical Seminar 31

NASA Aeronautics Research Institute
Thanks… Questions
July 9–11, 2013 NASA Aeronautics Research Mission Directorate FY12 Seedling Phase I Technical Seminar 32