fundamentals of oil analysis
TRANSCRIPT

Fundamentals of Oil Analysis Tim Vann / WearCheck USA
Cary, North Carolina
IIRRCC RREESSEEAARRCCHH AANNDD TTEECCHHNNOOLLOOGGYY FFOORRUUMM
Wednesday May 6, 2015
Thursday May 7, 2015
University of Wisconsin-Madison Pyle Center
702 Langdon St. Madison, WI 53706 University of Wisconsin-Madison

WearCheck USA
501 Madison Ave
Cary, North Carolina 27513
WearCheck International Group
• Worldwide Leaders
• WearCheck is the world-wide leader in oil analysis. Since
1966 WearCheck has been providing condition-monitoring
services to all sectors of industry. With operations in 10
countries, the company employs about 1,000 people and
processes over 1 million samples per year.

© 2015 WearCheck International. All rights reserved. Terms of use.
Fundamentals of Oil Analysis

© 2015 WearCheck International. All rights reserved. Terms of use.
Maintenance Strategies
Reactive Maintenance ”replace components when they fail”
Fix and repair components upon failure.
Preventive Maintenance “replace components before we expect them to fail”
Fix and repair components before their anticipated failure date.
Predictive Maintenance “perform corrective maintenance when condition
monitoring detects problems”
Condition-Monitoring for detecting potential failures to control
maintenance actions.
Proactive Maintenance “prevent maintenance problems by identifying and
correcting root causes”
Prevent the situations that cause premature component failure.
Reduce overall maintenance costs.

© 2015 WearCheck International. All rights reserved. Terms of use.
Predictive Maintenance Monitor for abnormal wear modes
Determination of proper oil change interval
Detect environmental and process contamination
Proactive Maintenance Evaluate filtration upgrades
Evaluate lubricant type and brand changes
Evaluate effectiveness of maintenance improvements
Confirmation of maintenance activities
Root cause failure analysis
The Role of Oil Analysis

© 2015 WearCheck International. All rights reserved. Terms of use.
Equipment Failure
Cycle
Ingress of contaminants and other oil
contamination increases rate of fluid
degradation. Contamination and poor
fluid quality cause increased wear.
Eventual equipment failure is
inevitable.
Oil analysis detects contamination
and fluid degradation before these
conditions cause equipment
failure.

© 2015 WearCheck International. All rights reserved. Terms of use.
An Effectively Managed Oil Analysis Program
Will
Managing an Oil Analysis Program
Provide effective maintenance scheduling
Minimize unscheduled downtime
Extend equipment life
Reduce maintenance costs
Minimize installation errors
Verify warranty and service claims
Determine optimum oil drain intervals (ODI)
Improve equipment reliability

Lubricant and Fluid Analysis

Lubricant and Fluid Analysis

Lubricant and Fluid Analysis

Material Services


< Ticket Stub to be kept for customer
records. Each sample has a unique identifier
for tracking purposes and is called a SIF
number, or Sample Information Form
number. E.g.. For this example form, the
tracking number, or SIF number is
WCI2 12345678.
Complete contact information for
first time customer or Customer
Code assigned at time of initial
sampling should always be present
for each sample.
On initial sampling for a unit, unique
unit identifier and unit information
should be as completely filled out as
possible, especially component and oil
types. On repeat samples for units
previously tested, only unit ID and
component type need to be indicated.
Sample date, current time on
unit, oil and filter should always
be indicated, as well as whether
oil and/or filter were changed at
time of sampling.
12345678
12345678
Comment section is to be used for any
concerns about unit or special attention
customer wants to be given to a particular
test.
Sample information
form instructions

Material Services
Tubing
Vacuum pumps
Gauge plugs
Sampling Hose


Oil Analysis Tests

LMA-18
Most industrial clients
utilize the IND II oil
sample kit.
ICP Analysis
ASTM D5185
Determines the parts per million (ppm) of all
wear metals (Fe, Cr, Ni, Pb, Cu…),
contaminants (Si, Na, K….), and additives
(Ca, P, Zn, Mg, Mo…).
Viscosity @ 40°C
ASTM D445
Determine the viscosity of the oil at 40°C to
determine if oil is still within specification.
High viscosity can indicate oxidation, low
viscosity can indicate contamination,
improper make-up oil.
TAN ASTM D974 Determines overall acidity (TAN) or
remaining alkalinity Single best test to
determine change-out interval.
Visual Screen
In-house method
A inspection of both the oil color/clarity and
the bottom of the sample bottle are taken,
and any level of contamination, visual oil
problems or visible wear debris of the oil is
recorded.
Particle Count
ISO 4406:1999
Determine cleanliness levels of oil. High
particle count levels can indicate gross
contaminant ingress, wear, filter by-pass or
all of these issues.
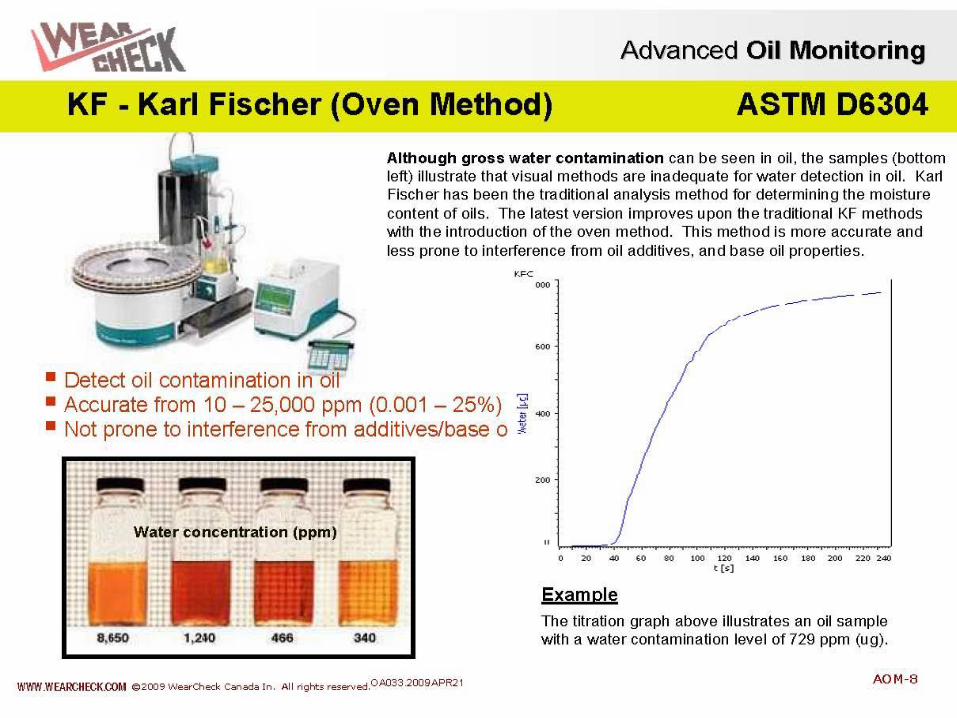
KF ASTM D6304 Determines level of moisture or water contamination in the oil.
WEARCHECK Advanced
WC IND 2+PC
Sample Kits
Testing Includes

Detecting
Spectrometric Analysis (ICP)


Detecting
Kinematic Viscosity (KV)
Acid Number (TAN)

© 2015 WearCheck International. All rights reserved. Terms of use.
Viscosity refers to the oil's flow characteristic. Under
normal operating conditions, oil viscosity (thickness)
increases gradually because lighter base oil fractions
evaporate while the contaminant and degradation product
levels build-up. Viscosity measurement will determine the
extent to which the oil has become contaminated and/or
degraded.
KV - Kinematic Viscosity @ 40°C ASTM D445
Detect incorrect oil make-up/contamination
Detect severe oil oxidation
Example We see the correlation between the marked increase in TAN (indicating severe oxidation) and the
subsequent increase in viscosity (in this case from 105 to 174 cSt.
(sample is from a compressor using Mobil Delvac 1. The compressor shows high copper and
aluminum wear.)
Viscosity is deemed abnormal when it has decreased by 10% or increased by 20% of the
baseline value.


Detecting
Particles
Process Contamination
Improper Oil Make-up
Dirt
Water
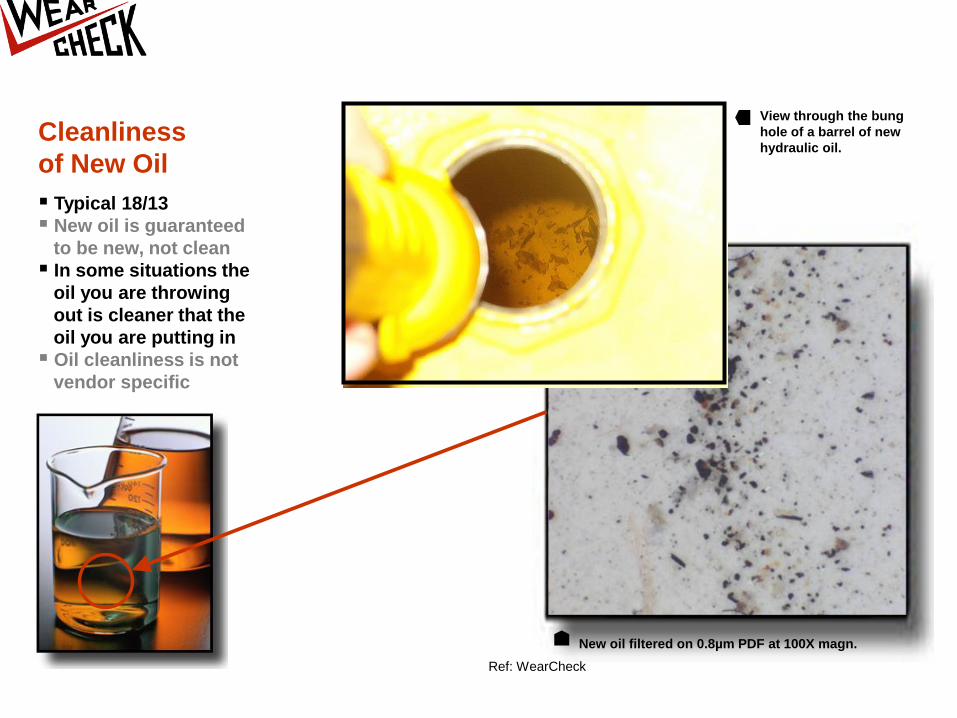
Cleanliness
of New Oil Typical 18/13
New oil is guaranteed
to be new, not clean
In some situations the
oil you are throwing
out is cleaner that the
oil you are putting in
Oil cleanliness is not
vendor specific
New oil filtered on 0.8µm PDF at 100X magn.
Ref: WearCheck
View through the bung
hole of a barrel of new
hydraulic oil.


How is
Oil Cleanliness
Measured?
Particle count
(1 ml of fluid)
Particle Size
Classification
(2, 5, 15, 25, 50, 100µm)
(4, 6, 14, 21, 38, 71µm)
Cleanliness Code
(ISO 4406:1999 )
Ref: WearCheck

Component life is dependent on the cleanliness of the lubricating fluid. The cleanliness of any lubricant is dependent on oil handling practices, top up procedures and the quality of both air breather and oil filtration. Cleaner Oil = Longer Component Life
Effect of Cleanliness on Component Life
Ref: Pall

Material Services
Fast sampler
Tubing
Vacuum pumps
Gauge plugs
Sample Kits
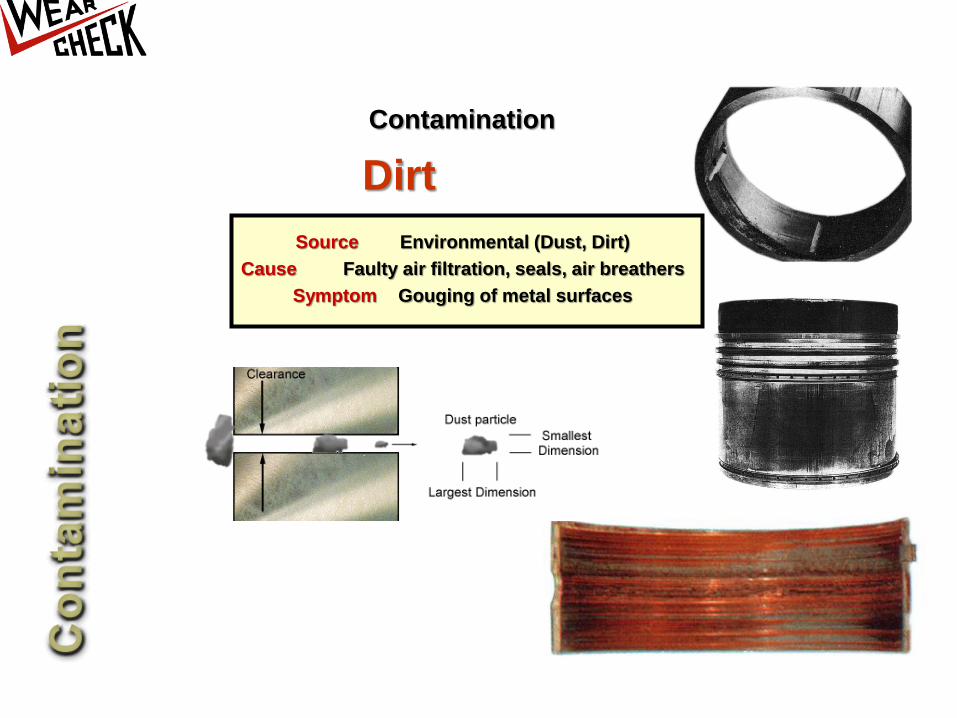
Contamination
Dirt
Source Environmental (Dust, Dirt)
Cause Faulty air filtration, seals, air breathers
Symptom Gouging of metal surfaces

Dirt Entrainment ICP Spectrometric Analysis
Silicon (or Silica, Dirt) next to oxygen is one of nature's most prolific
elements and the single greatest cause of oil contamination, component
wear damage and potential failure. Believe it or not, most of the dirt in
engines enters via poorly maintained air intake systems and faulty air
cleaners.
In other components, dirt can enter (and does) almost anywhere there is a
loose clamp, damaged gasket and seals, breather tubes, ill fitting dust
covers, loose or missing bolts, filler caps and inspection plates, damaged
housings...the list is almost endless.
Silica contamination can "dust" and engine all by itself, but when combined
with other contaminants such as fuel, glycol, and water, equally disastrous
results can be expected.
Damaged Air Filter and/or Air Cleaner
Poorly Maintained Air Intake System
Example
In Figure ICP-1 the severe
silica (Si) level indicates dirt
ingress. The resulting
severe iron (Fe) and
Aluminum (Al) levels are as
a direct result of abrasive
wear from the dirt particles
to the cylinder assembly.
Figure ICP-1

Contamination
Water
Source Condensation, Environmental, Combustion
Cause Leaking seals, air breathers with no dessicator
Symptom Rusting and corrosive etching
Sludge, oil line plugging
Scale deposits

Component life is dependent on the dryness of the lubricating fluid. Dryer Oil = Longer Component Life
Effect of Moisture on Component Life
Ref: SKF, OSU
Rolling Element Bearings
Journal Bearings

Keep it Clean and Dry
Desiccating Air Breathers Portable Filter Cart

Software
Accomplished via
coordination with
WearCheck Canada
www.oilanalysis.net

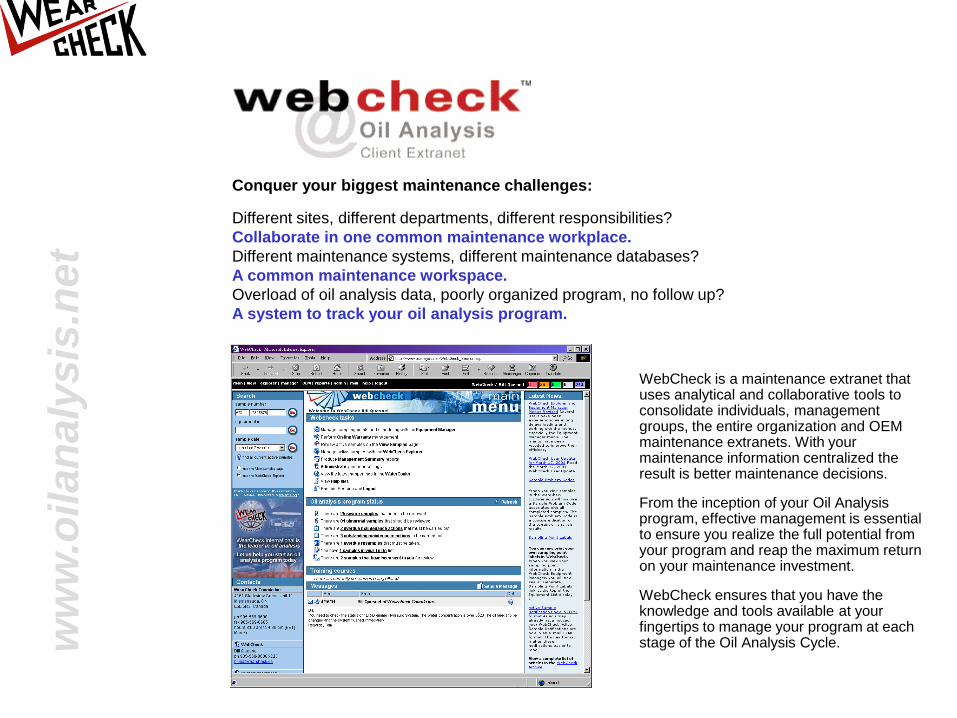
Conquer your biggest maintenance challenges:
Different sites, different departments, different responsibilities?
Collaborate in one common maintenance workplace.
Different maintenance systems, different maintenance databases?
A common maintenance workspace.
Overload of oil analysis data, poorly organized program, no follow up?
A system to track your oil analysis program.
ww
w.o
ila
naly
sis
.ne
t
WebCheck is a maintenance extranet that uses analytical and collaborative tools to consolidate individuals, management groups, the entire organization and OEM maintenance extranets. With your maintenance information centralized the result is better maintenance decisions.
From the inception of your Oil Analysis program, effective management is essential to ensure you realize the full potential from your program and reap the maximum return on your maintenance investment.
WebCheck ensures that you have the knowledge and tools available at your fingertips to manage your program at each stage of the Oil Analysis Cycle.

Review Reports
Once several samples from
a batch of samples
submitted to the laboratory
have been completed the
Client is notified by e-mail.
The E-mail informs the
Client of which samples
have been completed, what
the status of those samples
are as well as which
samples are still awaiting
completion.
Clients can modify settings
for which samples they
receive e-mail notification
on.
Receive
Notification of
Completed
Samples
Notification
Completed
OA results

Sample Reports
© 2015 WearCheck International. All rights reserved. Terms of use.
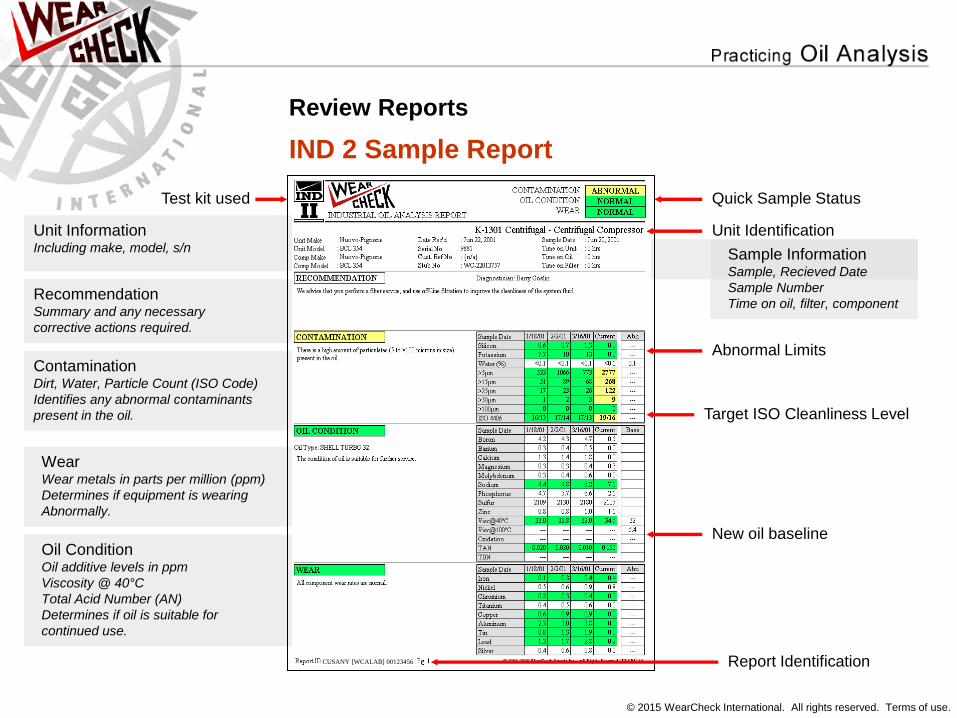
Review Reports
IND 2 Sample Report
Test kit used
Recommendation Summary and any necessary
corrective actions required.
Contamination Dirt, Water, Particle Count (ISO Code)
Identifies any abnormal contaminants
present in the oil.
Wear Wear metals in parts per million (ppm)
Determines if equipment is wearing
Abnormally.
Oil Condition Oil additive levels in ppm
Viscosity @ 40°C
Total Acid Number (AN)
Determines if oil is suitable for
continued use.
Target ISO Cleanliness Level
Quick Sample Status
Abnormal Limits
New oil baseline
Sample Information Sample, Recieved Date
Sample Number
Time on oil, filter, component
Unit Information Including make, model, s/n
Unit Identification
Report Identification CUSANY [WCALAB] 00123456

© 2015 WearCheck International. All rights reserved. Terms of use.
Review Reports
IND 2 Sample Report (back)
Viscosity Graph Trend of the viscosity in cSt showing
both upper and lower limits.
Babbitt Wear Metal Graph All non-ferrous wear metals charted on
a log graph showing up to 25
samples chronologically. Allows
for the visual identification of wear
of alloyed components.
Ferrous Wear Metal Graph All ferrous wear metals charted on
a log graph showing up to 25
samples chronologically. Allows
for the visual identification of wear
of alloyed components.
Particle Count Graph A chart of the current particle
levels in an easy to read format
showing the current particle levels
against the ISO level. The chart
also shows the target level.
TAN Graph Trend of the TAN level of the oil
showing both the base and typical
levels of the base oil.
Customer contact info
CUSANY [WCALAB] 00123456 – Pg. 2
ATTN: JOHN DOE
ABC MANUFACTURING LTD.
123 INDUSTRIAL DRIVE
STEELTOWN, NY 10023
(212)555-1234
FAX (212)555-2345


Questions and Answers
Thank You
IRC Research and Technology
Forum