oil fundamentals vi feb 2007 - vibration 2007/oil fundamentals vi feb... · 1 oil fundamentals...
TRANSCRIPT

1
Oil FundamentalsOil FundamentalsMong-Ching Lin
2
The Functions of a LubricantThe Functions of a LubricantThe Functions of a LubricantReduce friction and wearRemove heatPrevent the formation of oxidation productAct as anti-rust and anti-corrosion agentAct as a sealTransport contaminants to the filter for removalPower transmission
2
3
Benefit of Oil AnalysisBenefit of Oil AnalysisBenefit of Oil AnalysisIncrease maintenance staffs’ general awareness of lubrication related issue.Predictive maintenance– Up to six month earlier indication of wear related
problems– Confirm certain problems detected through
vibration– Most informative for engines, compressors, crushers,
pulverizers, presses, and gearboxes.
4
Benefit of Oil AnalysisBenefit of Oil AnalysisBenefit of Oil AnalysisMinimize unscheduled downtime:– Indication of component failure– Identify type of damage (chemical, abrasion, fatigue,
or other), and– Locations of the damage– Fix the problems before it breaks.

3
5
Oil Analysis Provides:Oil Analysis Provides:Oil Analysis Provides:Means to access the levels and types of contamination and wear in the oil.Lubricant chemical condition - “Is it still fit for use?”Failure prediction from data trending.Preventive maintenance optimization by effectively define:– Sampling schedule– Oil/filter change schedule
6
Potential Cost Savings from Oil AnalysisPotential Cost Savings from Oil Potential Cost Savings from Oil AnalysisAnalysis
Lubricant consolidationExtended oil change intervalsExtended machine lifePower consumptionLabor

4
Starting an Oil Starting an Oil Analysis ProgramAnalysis Program
8
“Technology Champion”““Technology ChampionTechnology Champion””Develops goals and objectivesDesigns written procedures for:– storage and dispensing– sampling
Drives the corrective activitiesMaintains ultimate responsibility for the program
5
9
Goals and ObjectivesGoals and ObjectivesGoals and ObjectivesSome of the goals and objectives include:– Reducing unplanned downtime and lubricant related failures– Reducing lubricant procurement costs– Consolidating lubricant supply– Reducing oil disposal costs– Extended machine and lubricant life
10
Storage and DispensingStorage and DispensingStorage and DispensingProtect the lubricants in storage from contaminationEnsure lubricants being added to machines are free from harmful contaminantsEnsure the correct lubricants are added to machinesEmploy good housekeeping practices

6
11
Identify MachinesIdentify MachinesIdentify MachinesStart with a small group of “critical” machines– Critical to production– Critical to safety
Add machines as program progresses– Knowledge and experience developed– Better understanding of sampling intervals and
analysis techniques– Experience with establishing Alarms
12
Identify Analysis TechniquesIdentify Analysis TechniquesIdentify Analysis TechniquesFree oil analysisCommercial oil laboratory analysisOn-site instrument oil analysis

7
13
Routes and SchedulesRoutes and SchedulesRoutes and SchedulesBegin by sampling “critical” machines monthly to develop trends (3-6 months)Design logical “routes” for simplifying sample collectionAdjust sampling interval based on trend
14
Sampling PointsSampling PointsSampling PointsInstall sampling ports for consistency– circulating portion of a reservoir– middle of the fluid level– prior to the filter– in the return line after the last lubricated component
(turbulent flow is desirable)
Sample pump/tubing

8
15
Sampling ProceduresSampling ProceduresSampling ProceduresFlush valves/ports prior to collectingUse new bottles/tubing for each sampleCollect while the machine is running or no longer than 15 minutes after shutdownDon’t collect samples from drain locations -debris and water tend to settle
16
Performance MetricsPerformance MetricsPerformance MetricsFailure avoidance (unscheduled downtime)Reduced procurement (lube consolidation / extended oil change)Reduced oil disposal (extended oil change)Energy savingsLabor (reduced overtime / call ins)

9
17
TrainingTrainingTrainingStorage and dispensingSamplingContamination controlAnalysis techniquesOn site analysis
Laboratory Analysis Laboratory Analysis TechniquesTechniques

10
19
Lubricant Analysis TechniquesLubricant Analysis TechniquesLubricant Analysis TechniquesElemental AnalysisFT-IRViscosityTAN / TBNWater - Karl Fischer, Crackle TestParticle CountingFerrography - Ferrous Density, Visual WDARBOT
20
Elemental SpectrometryElemental SpectrometryElemental SpectrometryQuantifies the amount of inorganic elements in the oil.Methods used include:
• Rotrode Spectroscopy, ICP (AES)• Atomic Absorption (AA)
Results are reported in parts per million (ppm)Elements are categorized as wear, additives, and contaminantsSome particle size limitations - less than 8 microns (depending on the instrument used, the limitation may be much less.)

11
21
Rotrode SpectroscopyRotrode SpectroscopyRotrode Spectroscopy
Submerged in a 1 ml oil bath, the carbon wheel begins to rotate, carrying the oil to the space between the carbon electrode and wheel where an arc is produced, igniting the oil.
Each element emits precise spectral color when ignited. The spectrometer measures the intensity of the various wavelengths and quantifies the elements present. Oil bath
(1 ml)
Oil Film
Carbon electrode
Carbon wheel
Optical detector
22
Inductively Coupled Plasma (ICP)Inductively Coupled Plasma (ICP)Inductively Coupled Plasma (ICP)
This method introduces a sample (or dilution) into an argon plasma.
This method works well for automated analysis.
Reference : www.scimedia.com

12
23
Rotrode Filter SpectroscopyRotrode Filter SpectroscopyRotrode Filter Spectroscopy
Oil bath (1 ml)
Oil Film
Carbon electrode
Carbon wheel
Optical detector
Used to measure wear metal levels in the larger particle sizes.
Measures particles larger than 15 microns.
Oil is filtered through the disk, which holds the particles. The oil is then washed away using solvents.
24
FT-IRFTFT--IRIRFourier Transform Infrared Spectroscopy
– Used for chemical or molecular analysis as opposed to elemental analysis from SOA
– Measures oxidation, nitration, sulfation, soot,water, glycol, fuel, and EP additives.

13
25
FT-IRFTFT--IRIRUses infrared light transmitted through a thin lubricant sample. The molecules in the sample absorb some of the infrared light. The wavelengths that are able to pass through are processed into a spectrum which identifies which wavelengths were absorbed. The amount of absorption is directly related to the concentration of that particular molecule.
26
ViscosityViscosityViscosityViscosity is often referred to as “the single most important property of a lubricant”For all lubricants, it is important to measure the 40C, 100C and Viscosity IndexA change in the 40C viscosity of 15% from “new”oil indicates a problem

14
27
ViscosityViscosityViscosityViscosity is measured using two capillary viscometers -one is maintained at 40C, one is maintained at 100C. A measured amount of oil is deposited into a capillary tube. The tubes are designed to allow the oil to reach “bath”temperature prior to the measurement. As the oil passes the first sensor, a timer starts. When the oil reaches the second sensor, the timer stops and the viscosity is calculated.
28
TAN / TBNTAN / TBNTAN / TBNSometimes referred to as Neutralization NumbersTAN - Total Acid Number
• Quantity of base required to neutralize all acidic constituents present in 1 gram sample
• Measured as mg KOH/g (potassium hydroxide) • Indicates build up of acidic constituents in the lubricant• Applicable to industrial (non-engine) applications
TBN - Total Base Number• Measure of the reserve alkalinity of engine oils• Reported as mg KOH/g (potassium hydroxide)

15
29
Water TestsWater TestsWater TestsCrackle Test
– Used to screen samples for water contamination– A hotplate is heated to ~ 300 F, a small amount of oil
is placed on the heated surface. If the oil “crackles”water is present.
– Lower detection ~ 200 ppm (results depend on additive package of the oil)
30
Water TestsWater TestsWater TestsKarl Fischer Titration
– Titration method using reagents which react with the water.
– Quantifies the amount of total water, reported in ppm or %
– Lower detection to 30 ppm (depending on procedure)

16
Particle CountingParticle CountingTypically used to monitor the cleanliness of “clean”systems and incoming lubricantsUsed routinely on most systems to monitor:
• Wear debris• Contaminants• Filter efficiencies
Very important test for determining the need for Wear Debris Analysis. Can be expanded to include :
• gearboxes• pumps• compressors
Particle CountingParticle CountingAbility to specify Target Cleanliness Levels for systems, machines, and incoming lubesAbility to implement Contamination ControlUsed to determine filtration specifications and efficienciesTrending allows early indication of abnormal wear and increases in contaminant levels due to outside influences

17
33
Wear Debris AnalysisWear Debris AnalysisWear Debris AnalysisFerrous Density determination is used to measure the amount of ferrous material present in a sampleVisual wear debris analysis is used to identify :
– Particle size, shape, color, texture– Particle concentration – Optical properties of the particle(s)– Also referred to as Analytical Ferrography
34
RBOTRBOTRBOTRotating Bomb Oxidation Test
Used to determine the oil’s oxidation stability and/or remaining useful life.
Normally compared to a “reference” oil (i.e., new oil of the same brand and type)

18
35
RBOTRBOTRBOTA given amount of sample oil, water, and a copper catalyst coil are placed in an oxygen-pressurized bomb (vessel). The bomb is charged with oxygen to a pressure of 90 psi and placed in a constant temperature oil bath at 150C. The bomb is then rotated axially at 100 rpm at a 30 degree angle. The time, in minutes, required to reach a specific drop in gauge pressure as compared to a reference oil determines the oils oxidation stability.
Lubricant Analysis Lubricant Analysis OptionsOptions

19
PerceptionPerceptionPerception
Lubricant analysis has not lived up to its potential as a predictive
maintenance tool.
38
Lubricant Analysis OptionsLubricant Analysis OptionsLubricant Analysis OptionsLubricant Analysis Resources: 3 Options– Free oil analysis– Commercial oil laboratory analysis– On-site instrument oil analysis

20
39
Lubricant Analysis Options Free Oil Analysis:Lubricant Analysis Options Lubricant Analysis Options Free Oil AnalysisFree Oil Analysis::
Viscosity at 40 oCElemental analysis using Spectro, AA or ICPWater content, and sometimes
Total Acid Number (TAN)
40
Lubricant Analysis Options Free Oil Analysis:Lubricant Analysis Options Lubricant Analysis Options Free Oil AnalysisFree Oil Analysis::
Advantages:– Free– Good info for lube chemistry
Disadvantages– Incomplete info for wear and contamination– Slow turn-around time, up to 2 weeks– Need to transfer electronic data, if at all possible– Quality assurance issues of the testing facilities

21
41
Lubricant Analysis Options Commercial Lab Analysis:Lubricant Analysis Options Lubricant Analysis Options Commercial Lab Analysis:Commercial Lab Analysis:
Viscosity at 40 and 100 oC and viscosity indexElemental analysis using Spectro, AA or ICPWater contentTotal acid number (TAN) or total base number (TBN)Fourier transform infrared spectroscopy (FTIR)Particle countingWear debris analysis (WDA)Other specialty tests
42
Lubricant Analysis Options Commercial Lab Analysis:Lubricant Analysis Options Lubricant Analysis Options Commercial Lab Analysis:Commercial Lab Analysis:
Advantages:– Most complete & informative results if the testing
package is selected correctly– Quality data from state of the art instruments– Capability of performing specialty tests
Disadvantages:– Expensive: from $12 to $200+ per sample– Turn-around time: 2 to 5+ days without premium– Need to transfer electronic data, if at all possible

22
43
Lubricant Analysis Options On-site Instrument Analysis:Lubricant Analysis Options Lubricant Analysis Options OnOn--site Instrument Analysis:site Instrument Analysis:
ViscosityParticle countingFerrous densityDielectric measurementCrackle test for waterTAN/TBN kit
44
Lubricant Analysis Options On-site Instrument Analysis:Lubricant Analysis Options Lubricant Analysis Options OnOn--site Instrument Analysis:site Instrument Analysis:Advantages:– Ownership and control– Immediate results and re-test when needed– Tests performed by people who know the machine– Electronic data with no transfer– Test more points more often– Test incoming lubricant– Find, fix, and verify the problem is fixed

23
45
Lubricant Analysis Options On-site Instrument Analysis:Lubricant Analysis Options Lubricant Analysis Options OnOn--site Instrument Analysis:site Instrument Analysis:
Disadvantages:– Cost: Got to have the budget to buy the tools– Labor: Got to have the personal to do the tests– Education: Got to train the personal– Still need to send the questionable samples to a
commercial lab for in-depth analysis
46
What do you get from oil analysis?What do you get from oil analysis?What do you get from oil analysis?ChemistryContaminationWear
Need all three information!!

24
Laser Turn TableA recent case history involves
a laser turntable that operates a robotic welder.
Minilab oil analysis showed alarming results...
Trivector Report
Database: C ab S hop.rbm M eas. P oint: P 1 - Main R eservoirArea: A6 - B-ZON E : Laser Station S ample N o: 1273
Equipment: C LAS R04 - FL Pan Laser Cut Tbl S-45 Sample D ate: 10/20/99 12:08 :0 0 P M
W ear
Contaminat ion C hemistry
E xtreme
A larm
A lert
H igh N ormal
N ormal
Trivecto r
Observations5100 in dicates Ferrous W ear5100 in dicates Free W ater5100 in dicates Large Non-Ferrous Partic les51FW indicates Ferrou s W ear
Ac tionsSend sample f or Lab testin gSend sample f or W DAC heck for W ear related D efec tsR emov e W aterC heck for Source of W aterBleed W ater f rom oi l C ompartmentF ilter or F lus h LubricantC heck for Dus t/D irt EntryC heck for Looseness /M isalign mentC heck for Corrosiv e W ear
CS I O ilV iew 1/15/00 Page 1
5100 Dielectric Plot
Database: Cab Shop.rbm Meas. Point: P1 - Main ReservoirArea: A6 - B-ZONE: Laser Station Sample No: 1355
Equipment: CLASR04 - FL Pan Laser Cut Tbl S-45 Sample Date: 11/5/99 6:38:18 AM
2.400
2.600
2.800
3.000
3.200
3.400
3.600
3.800
4.000
0 50 100 150 200 250
Die
lect
ric
Time (seconds)
Ref: 5/11/99 - Meropa 320
CSI OilView 1/15/00 Page 1
Notice the extreme wear condition and the alarming contamination condition on
the Trivector!

25
The Shop Microscope ShowedIron Spheres in Laser Turntable Oil Reservoir
Laser Turntable samples were also collected and sent off to
two different labs who provide “Free Oil Analysis.”
The first lab reported,
“Analysis indicates component & lubricant
conditions are acceptable.”

26
The second lab reported,
“No corrective action required.”
LINDEN WORK ORDER11-16-199909:17Equipment Number:35A96CLASR04
UTILIZE UAW-GM LOCKOUT PROCEDURES WHEN NECESSARY
Work Order Number: 0000023264Master WO Number:Description: Oil Lab Indicates Extreme Wear And Contamination Ref (976)Frequency:Target Start Date: 09/30/1999Target Completion Date:Status Code: CLOSE
Location: LASERLocation Description: LASER STATIONEquipment: FLOOR PAN LASER CUTTING MOTION TURNTABLEEquipment Number:35A96CLASR04Column Location: S45Key Process Equipment: Y
Work Order EquipmentTrade Work Type Priority Priority Supv./Tech. Skill TradesOIL CM 3 5 BUONTEMPO AMMIRATO
Work Plan Operations:
10 DRAIN FLUSH AND REPLACE WITH MEROPA 320 & CHECK W/ FIBER OPT. CAMERA
___ Check off items when completed. ___ Work Order complete and Work area is clean.
________________ ________________ ________________Date Completed Completed By Supervisor
At this point the supervisor asked:
“Why did you write a work order to change the oil in the Laser Turntable when two labs say
nothing is wrong?”
Ed said, “Who knows, there may be a mistake”and suggested testing another sample. Ed and
the supervisor did this together.

27
Storage and Storage and Handling Handling PracticesPractices
54
Storage of LubricantsStorage of LubricantsStorage of LubricantsDrums should be stored:– Indoors in a ventilated room– On racks off the floor– On their sides, not upright
Outdoors storage (even temporarily)– On their sides undercover with openings
positioned at 3 and 9 o’clock– For maximum protection, the drums should be
stood on end with the openings down on a well-drained surface

28
55
Storage of LubricantsStorage of LubricantsStorage of LubricantsSeparate areas should be provided for:– Unopened containers and bulk tanks– Opened containers– Empty containers– Lubrication accessories
Containers and/or hoses need to be clearly marked to prevent misapplication
56
Storage of LubricantsStorage of LubricantsStorage of LubricantsUse filters or breathers for drum “vents” to control ingress of solid contaminants.Use desiccant breathers for drum “vents” to control moisture ingress in wet locations

29
57
Handling of ContainersHandling of ContainersHandling of ContainersDrums should not be bounced off trucks or racksDrums should be rolled rather than draggedMake sure all transfers take place under clean conditions to avoid contaminationContainers are kept tightly closed when not in use
58
Dispensing of LubricantsDispensing of LubricantsDispensing of LubricantsUse the oldest lubricant firstTest the lubricant before use, if in doubtUse drum spigots rather than drum pump to avoid cross contamination. Spigots allow the drums to be stored on their sides.Different lubes should never be mixed in dispensing containers or transfer equipment.

30
59
Dispensing EquipmentDispensing EquipmentDispensing EquipmentContainers should be clearly markedAlways check if the dispensing equipment is cleanKeep the dispensing containers tightly closed when not in useAvoid open-topped containers, like pitchers
60
Safety ConcernsSafety ConcernsSafety ConcernsClean up spilled and leaking lubricantsOily rags should be disposed of in tightly closed safety containersNo smoking around lubricant and solventsWhen necessary, shut off machine before lubricating

31
61
Storage and Handling Practice: SummaryStorage and Handling Practice: Storage and Handling Practice: SummarySummary
Contamination control begins with good storage, handling and dispensing practicesUse common sense
Sampling Sampling PracticesPractices

32
63
Sampling TipsSampling TipsSampling TipsThe oil samples must represent the entire system to have relevanceMaintain consistency in sample collection– Same location– Same method– Same machine conditions (speed, load, etc.)
Develop written procedures for collecting samples to maintain consistency
64
Sample Point LocationsSample Point LocationsSample Point LocationsKnow the lube system / path and understand the location and scope of what has to be sampled.Analysis data should provide information about the oil and machine condition

33
65
Circulating SystemsCirculating SystemsCirculating SystemsLocate filters (if applicable)Sample prior to filter - sampling after the filter will typically provide a “cleaner” sampleSample while running (if possible) or no longer than 15 minutes after shutdown
66
Circulating SystemsCirculating SystemsCirculating SystemsSample from the return line after the last lubricated component …. orIn circulating portion of reservoir, at entry end, near the middle of the fluid levelUse sampling valves or “fixed” sampling points if possible and locate sample port in a turbulent location (elbow, etc.)

34
Oil SamplingOil SamplingOil SamplingSample an “active zone”
– Agitated - mixed– Flowing– Hot– After machinery– Before filter– Before dilution– Away from walls– Before settling– Clean procedures
OilCompartment
Machine
Ideal Placeto Sample
68
Non-circulating SystemsNonNon--circulating Systemscirculating SystemsSample ports will provide the most consistencyAvoid sampling from drain plugs if possible, contaminants tend to settle out.Sample while the machine is running or no longer than 15 minutes after shutdownSample from the middle of the fluid level, not too close to the top or bottom.Sample where the oil is turbulent or flowing

35
69
Sampling PreparationSampling PreparationSampling PreparationChecklist of necessary items for sampling:Shop towel for cleaning bottles and one’s handsCleaning solvent for cleaning sample siteFlashlight and necessary hand toolsContainer to catch “flushed” fluid from valvesBoxes for carrying samplesBottles and labelsSampling pump and tubing
Do not reuse the tubing !!!
70
Sampling “Best Practices”Sampling Sampling ““Best PracticesBest Practices””Develop written procedures for samplingIdentify sample point locations on machinesLabel sample bottles prior to samplingClean sample area prior to samplingDrain stagnant oil from valve or portUse “new” clean sample bottles and tubingShip or analyze samples immediately

36
71
Sampling FrequenciesSampling FrequenciesSampling FrequenciesBegin by sampling on a monthly basis to quickly establish trends and identify immediate problemsDifferent machines, different intervalsContinue monthly sampling for the first 3 to 6 monthsModify sampling intervals based on the historical data collected and/or the criticality of the machine
72
ConclusionConclusionConclusionConsistency in sample collection method and techniques will provide the best data. Oil analysis depends on trendable results. Care must be exercised when collecting oil samples from machines so as not to contaminate the sample or the lubricant in the machineSampling frequencies should be based on the actual historical data for best results.

37
Wear Debris Wear Debris AnalysisAnalysis
74
M.I.T. StudyM.I.T. StudyLoss of Usefulness
Obsolescence (15%) Accidents (15%)
Surface Degradation (70%)
Corrosion (20%) Wear (50%)
Abrasion Fatigue AdhesionASLE Bearing WorkshopRabinowicz, 1981

38
75
Definition of Wear Debris AnalysisDefinition of Wear Debris AnalysisDefinition of Wear Debris Analysis
Wear debris analysis (WDA) is an attempt to determine the condition of machinery through the examination of the particles generated by wear process.
76
Purpose of Wear Debris AnalysisPurpose of Wear Debris AnalysisPurpose of Wear Debris Analysis
To detect potential failures before they occurTo determine the root cause of failures after they occurTo detect abnormal machine or lubricant conditions

39
77
Sampling Wear ParticlesSampling Wear ParticlesSampling Wear Particles
Particles are:– extracted from oil samples– removed from filters– removed from magnetic plugs
78
Wear Particle ExaminationWear Particle ExaminationWear Particle ExaminationWhite light microscope– The most popular technique used in the oil testing
industries – The particles are observed and the morphology of the
particles are recorded– The origin and cause of wear debris and/or
contaminant are speculated.– Resolutions - about two tenths of a micron – Magnification - up to 1000X maximum– Material identification is difficult and at best qualitative

40
79
Wear Particle ExaminationWear Particle ExaminationWear Particle ExaminationScanning electron microscope (SEM) with energy dispersive X-ray spectroscopy (EDS)– magnification up to 100,000X with a resolution
down to 50 Angstroms– EDS - determine the chemical composition on
the particles of interest
80
Abrasive WearAbrasive WearAbrasive Wear

41
81
Abrasive Wear, 200XAbrasive Wear, 200XAbrasive Wear, 200X
82
Abrasive WearAbrasive WearAbrasive Wear

42
83
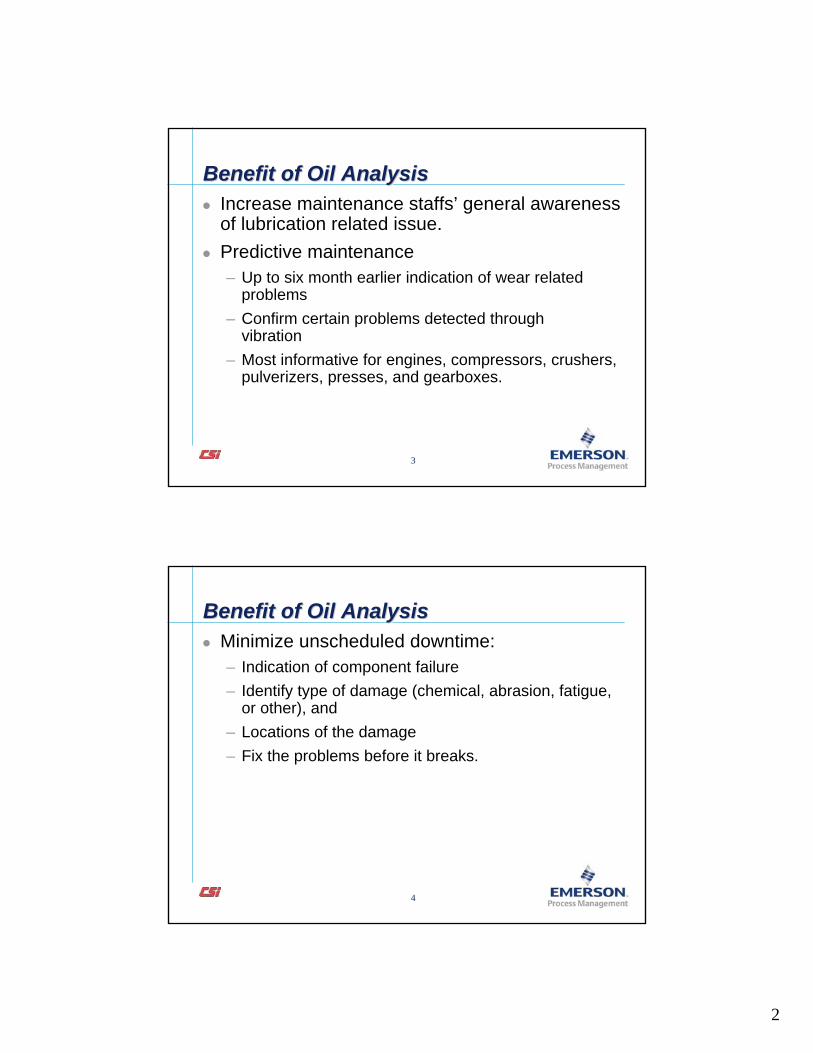
Fatigue WearFatigue WearFatigue WearRepeated deformation in excess of the materials ability to return to its original state causes subsurface cracking
84
Fatigue WearFatigue WearFatigue Wear

43
85
Fatigue WearFatigue WearFatigue Wear
86
Fatigue Wear, 100XFatigue Wear, 100XFatigue Wear, 100X
44
87
Fatigue WearFatigue WearFatigue Wear
88
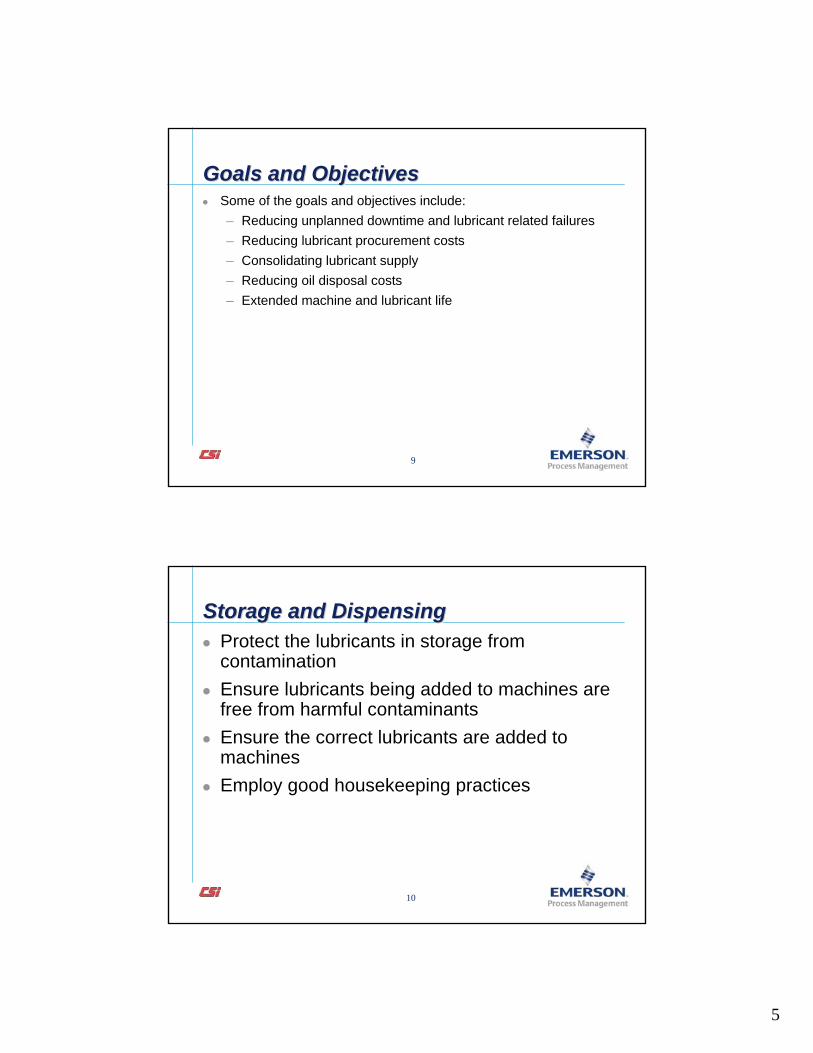
Boundary Lube WearBoundary Lube WearBoundary Lube WearIncludes:– Micro-delamination– Asperity deformation– Adhesion
Particles formed:– Platelets– Large particles with striations– Black oxides– Tempered particles– Partially melted/fused particles– Spheres

45
89
Micro-delaminationMicroMicro--delaminationdelamination
90
Micro-delaminationMicroMicro--delaminationdelamination

46
91
Asperity deformationAsperity deformationAsperity deformation
92
AdhesionAdhesionAdhesion

47
93
Boundary Lube WearBoundary Lube WearBoundary Lube WearResults from:– Start up - rotational speed = 0– Coast down - rotational speed approaching 0– Wrong lube - viscosity too low– No lube– High temperature - viscosity decreases with
increasing temperature
94
Normal Rubbing Wear, 500XNormal Rubbing Wear, 500XNormal Rubbing Wear, 500X

48
95
Boundary Lube Wear, 100XBoundary Lube Wear, 100XBoundary Lube Wear, 100X
96
Boundary Lube Wear, 200XBoundary Lube Wear, 200XBoundary Lube Wear, 200X

49
97
Boundary Lube Wear, 500XBoundary Lube Wear, 500XBoundary Lube Wear, 500X
98
CorrosionCorrosionCorrosionCorrosion is caused by:– Corrosive contamination (including water)– Additive depletion
Results in:– Very fine (< 1 micron) black powder– Red oxide (rust) resulting from water

50
99
Corrosion, 1000XCorrosion, 1000XCorrosion, 1000X
100
Corrosion - RustCorrosion Corrosion -- RustRust

51
101
Fretting WearFretting WearFretting WearCaused by:– Small cyclic motions
• between the bearing race and housing• between the bearing race and shaft• between the contacting surfaces of gear teeth
Results in:– Very small platelets (< 2 microns)– Appear as coarse black powdery substance
102
Fretting Wear, 500XFretting Wear, 500XFretting Wear, 500X
52
103
ContaminationContaminationContamination
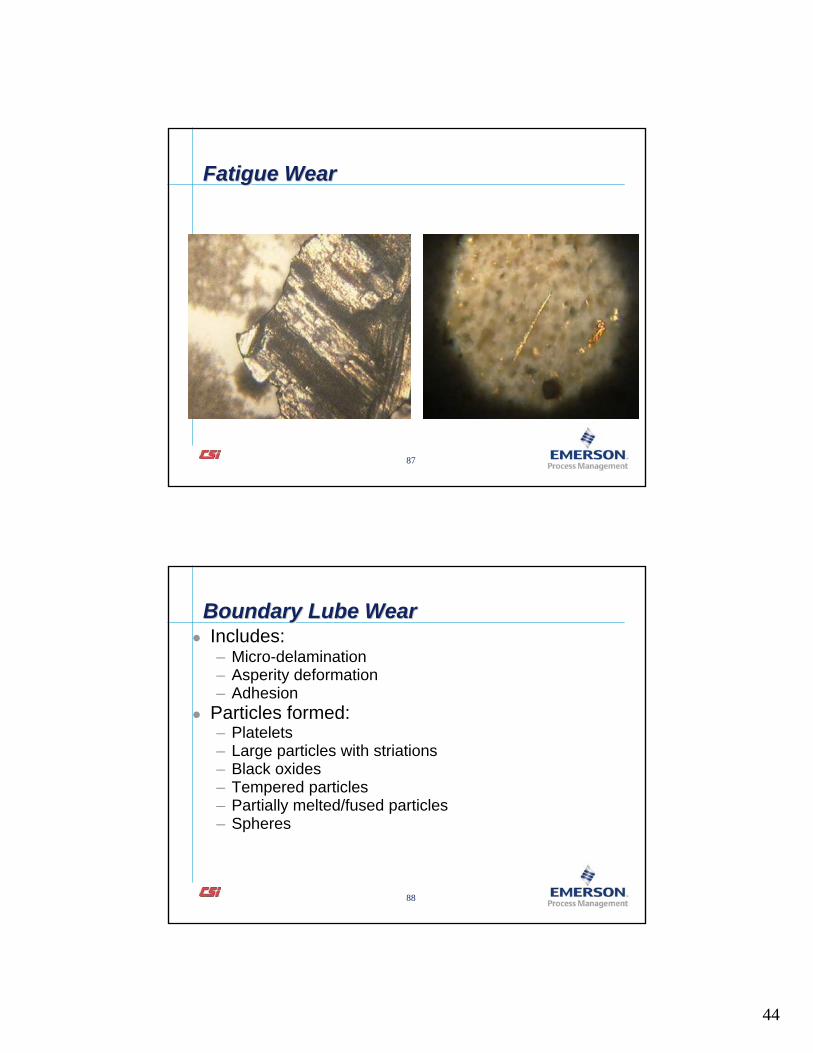
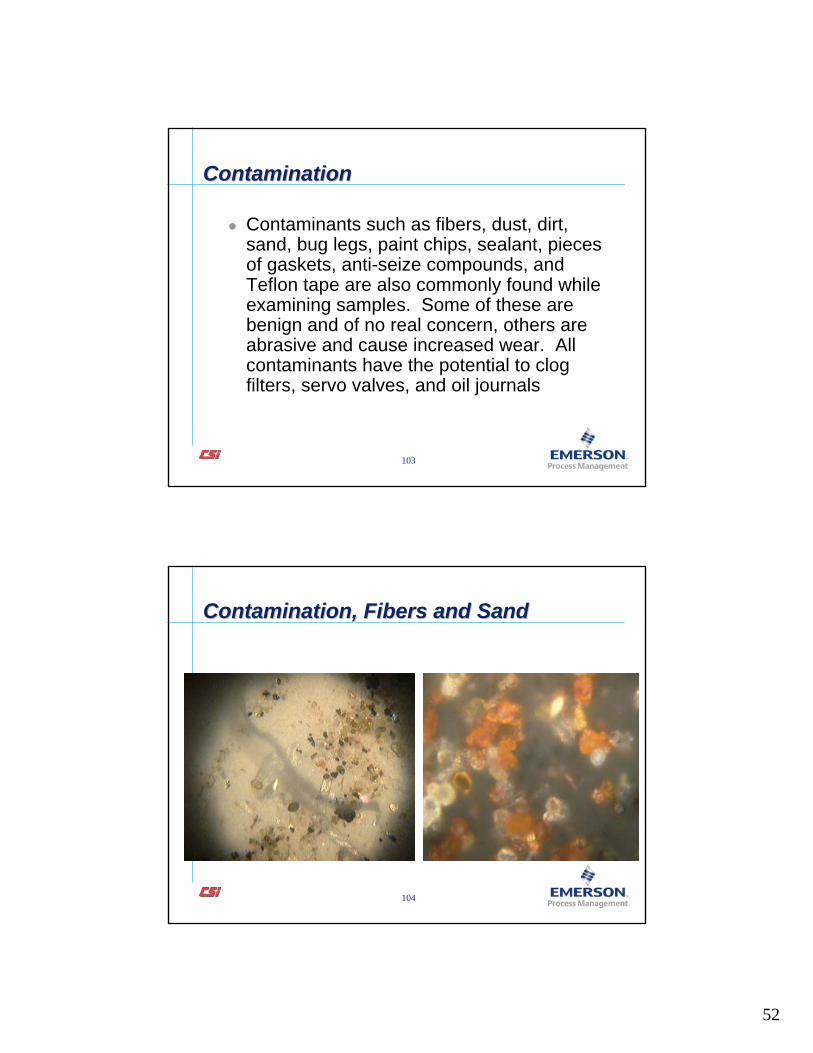
Contaminants such as fibers, dust, dirt, sand, bug legs, paint chips, sealant, pieces of gaskets, anti-seize compounds, and Teflon tape are also commonly found while examining samples. Some of these are benign and of no real concern, others are abrasive and cause increased wear. All contaminants have the potential to clog filters, servo valves, and oil journals
104
Contamination, Fibers and SandContamination, Fibers and SandContamination, Fibers and Sand

53
105
Contamination, Salt from Sea WaterContamination, Salt from Sea WaterContamination, Salt from Sea Water
106
Contamination, BugsContamination, BugsContamination, Bugs

54
107
SEM-EDS, a Powerful Tool for Wear Debris AnalysisSEMSEM--EDS, a Powerful Tool for Wear EDS, a Powerful Tool for Wear Debris AnalysisDebris Analysis
Scanning Electron Microscope (SEM) with Energy Dispersive X-Ray Spectroscopy (EDS):Higher magnification, better resolution Elemental analysis on the particlesPin pointing the origin of particles
108
SEM-EDS Analysis, A Carbon Steel SphereSEMSEM--EDS Analysis, A Carbon Steel EDS Analysis, A Carbon Steel SphereSphere

55
109
SEM-EDS Analysis, Glass FiberSEMSEM--EDS Analysis, Glass FiberEDS Analysis, Glass Fiber
110
SEM-EDS Analysis, Stainless Steel ChunkSEMSEM--EDS Analysis, Stainless Steel EDS Analysis, Stainless Steel ChunkChunk

56
111
Electron Micrograph of Cutting Wear Ribbon. X-Ray spectrum shows the ribbon is almost pure IronElectron Micrograph of Cutting Wear Ribbon. XElectron Micrograph of Cutting Wear Ribbon. X--Ray spectrum Ray spectrum shows the ribbon is almost pure Ironshows the ribbon is almost pure Iron
112
Partially melted aluminum particlePartially melted aluminum particlePartially melted aluminum particle